Custom SSIS Components consists of Design-time methods and Run-time methods. Debugging a Design-time method is different from a Run-time method. This post explains the techniques to debug Design-time and Run-time methods using the Custom Data Flow Component, Credit Card Number Validator as an example.
Debugging Design-Time Methods of Custom SSIS Component
1. Ensure that your Custom SSIS Component is deployed and available to BIDS. Steps to Deploy Custom SSIS Component.
2. From Visual Studio, open your Component’s class library project and set up break points in Design-time Methods like ProvideComponentProperties(), Validate(), ReinitializeMetaData(), InsertOutputColumnAt().

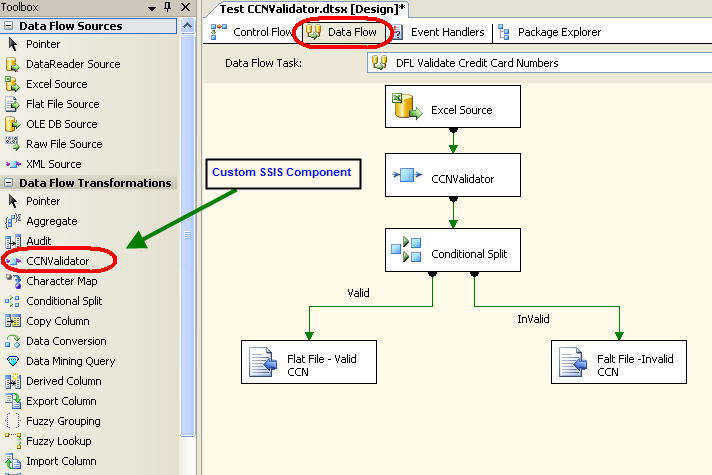
3. Open BIDS and create package to test the component. If your component was deployed successfully and depending on the type of your component, you should be able to see your component in the Toolbar as Control Flow Item or Data Flow Item. In the case of Credit Card Number Validator, it is a Data Flow Transformation Component, so the component will be visible in the toolbar only after at least one Data Flow Control is added to the package (Figure 2).

4. Switch to the Component’s source code in Visual Studio, and attach the debugger to devenv.exe instance of the BIDS that has test package open as shown in Figure 3a.


5. Now switch back to the BIDS that has the test package open. Drag and Drop the custom component to Data Flow. Immediately you should see the control hitting the break point set at ProvideComponentProperties () of the class library code. In fact, ProvideComponentProperties () is called only once when the component is placed on the Data Flow for the first time. Now you should be able to step-through the code using the standard Visual Studio debugging techniques.
6. Validate () method is the most frequently called Design-time method. Adding a new input/output path from/to any other component in data flow, adding/removing inputs or outputs, adding/removing input or output columns etc will trigger the break point in the class library code.
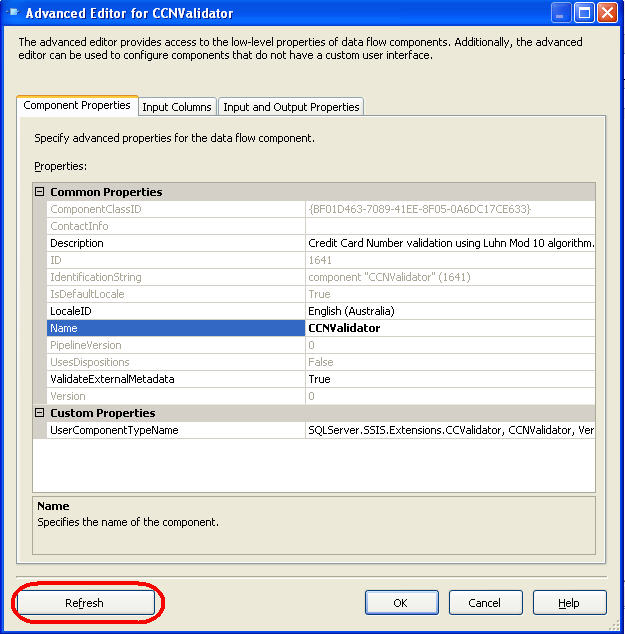
7. The break point at ReInitializeMetaData () will be triggered, if the Validate () determines that a Meta data refresh is required and when you click Refresh from the Advanced Editor of the Component (Figure 4).

8. The break point at InsertOutputColumnAt() will be triggered, if from the Advanced Editor→Input and Output Properties→Output→Output Columns→Add Column is clicked (Figure 5).

Debugging Run-time Methods of Custom SSIS Component
1. To debug Run-time methods of your Custom SSIS Component, first create a simple test package that uses your custom component as shown in Figure 2.

2. Set up break point in your test package preferably in the OnPreExecute event of the test package. Since Credit Card Number Validator is a Data Flow Component, my break point would be on the OnPreExecute event of the Data Flow.
3. Now open the source code for the Component’s class library and set break point in the Run-Time methods like PreExecute() and ProcessInput().

4. Switch back to your test package and execute the package. When the break point in the test package is reached, switch back to the Component’s source code and attach the debugger to instance of DtsDebugHost.exe listed as Managed, x86
IMPORTANT: You will see two instances of DtsDebugHost.exe listed. Attach the debugger only to the one showing Managed, x86 in the Type column, not to the instance listed as x86 only as shown in Figure 7.

5. The break points at PreExecute () will be hit first followed by ProcessInput (). Sometimes it may be necessary to force a break point within the Data Flow. This can be done by adding a script component and writing code to display a message box.

Thanks it was great and really helped me 🙂
Great article! One thing to mention in design-time debugging is that when debugging you must attach to devenv with the correct “Attach to:” field. From your screenshot it says “Automatic: T-SQL Code, Managed Code”, but mine only said “Automatic: Script Code, T-SQL Code” and my breakpoints weren’t getting hit. Had to change to “Managed (v 2.0…)” to get it to hit breakpoints 🙂
Great article. Thanks!
SQL Server 2008 version of Credit Card Number Validator is now available for download from CodePlex. http://ccnv08.codeplex.com
Source Code and Assembly for Credit Card Number Validator can be downloaded from CodePlex http://ccnv05.codeplex.com/