If you are the admin of a cisco (and sonicwall now in the newer firmware) network, NetFlow is a good and easy way of gathering insight into what exactly is passing through your cisco. Apart from seeing link usage, netflow also allows the admin to see which protocols, ports and hosts are being used. This is much more granular and informative than the simple interface utilization that SNMP offers. this allows for easier troubleshooting such as helping to identify worms, or P2P usage, and so on.
There are several Netflow collectors out there, but my favourite is by far Ntop (http://www.ntop.org/news.php). It’s free, open source and easy to setup. Ntop usually works by listening on an interface, and parsing packet capture files to display the results in a nice graph format. In this particular case, I will disable Ntop listening on an interface and will not feed Ntop any pcap files. I am only interested in setting up Ntop as a netflow receiver and graphing those results.
I installed this on an ubuntu server. The following commands were run as root. First, the obligatory apt-get command to install the program:
# apt-get install ntop
Next, start Ntop in “interfactive” mode. Simply enter ntop at the command line:
# ntop
This is a necessary first step since you will be prompted to enter the admin password. Enter your password of choice, and wait until the output stops scrolling across the screen. There should be no errors. Then, close the ntop program by pressing ctrl+C. This should kill off the process. Next, we run ntop as root, not listening on any of the server’s interfaces, and running a web server on port 8080. Run the command:
# ntop –u root –i none –d –w 8080
A breakdown of the switches:
– u : user
-i : interface to listen on (in our case, “none”, else ntop will listen on eth0 by default)
-w : http webserver listen port
You should now be able to open a browser and browse to http://[your_server_ip]:8080. Once there, on the top menu, select Plugins > Netflow and select “activate”. Next, add a netflow “device”. You will be shown the netflow configuration. The important points here were:
– Local UDP port. I set this to the default 2055. Remember to press the “Set Port” button after!
– Virtual Netflow Interface Network Address. I set this to 10.0.0.0/255.0.0.0, since the cisco sits in front of a 10.x.x.x network. Remember to press the “set interface address” button.
– Dump File Path. You will probably need to change this to someplace with a lot of storage. Remember to press the button.
Hit the link to return to plugin or from the Plugins menu, select “all”. You should see a blue “yes” under the “active” column for NetFlow
Last step : from the “Admin” menu select “switch NIC” and choose the netflow device you created earlier
That’s it from the Ntop side of things. Now, on the cisco, as copied from the Ntop FAQs:
To enable netFlow Data Export (NDE) from a Cisco device to an ntop netFlow receiver on port 2055 (default) at address 10.1.1.1:
     ip flow-export destination 10.1.1.1 2055
     ip flow-export version 5
You may want to designate the source interface, e.g.:
ip flow-export source Ethernet0Enable netFlow on each interface to be monitored. netFlow normally only captures data from each incoming packet, so to see traffic in both directions netFlow must be enabled on both the incoming and outgoing interfaces. As an example, for an Internet access router this would mean enabling netFlow on both the internal (e.g. Ethernet) and the external (e.g. ISDN / Frame Relay etc) interfaces:
     interface Ethernet0
     ip route-cache flow
interface Dialer1 ip route-cache flowBy default netFlow will only export flow statistics shortly after the flow Terminates or when 30 minutes have elapsed. In many environments, you want ntop to be a bit more up to date. To change the timeout to five minutes:
ip flow-cache timeout active 5The following ‘show’ commands are useful for examining netFlow statistics directly on the Cisco box and may assist when setting up ntop:
     show ip flow export
     show ip cache flow
     show ip cache verbose flow
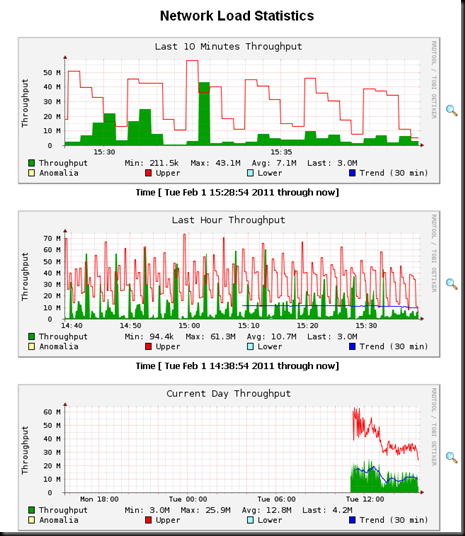
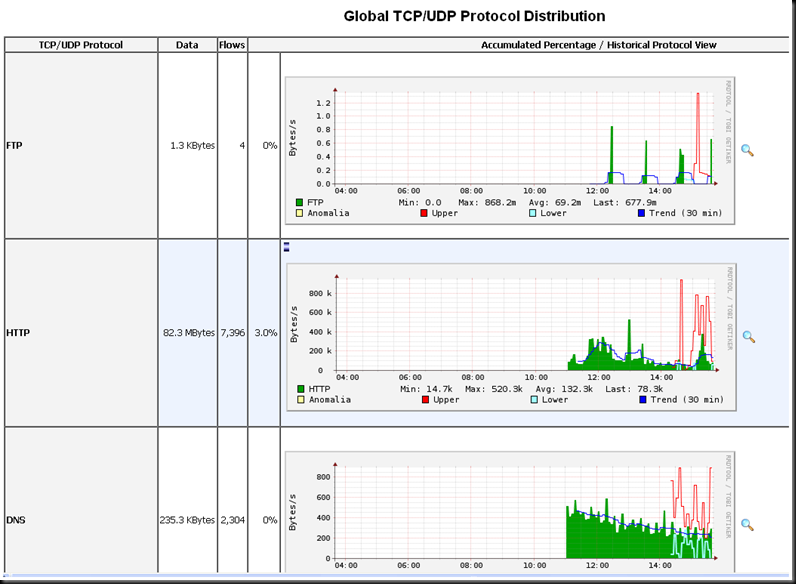
That’s all! A couple of screenshots will follow. Just in case you wonder what the colours mean:
Lower : An algorithm for predicting the values of a time series one time step
into the future
Upper : A measure of deviation between the predicted values and the observed
values.
Anomalia : A mechanism to decide if and when an observed value or sequence of
observed values is ‘too deviant’ from the predicted value(s).
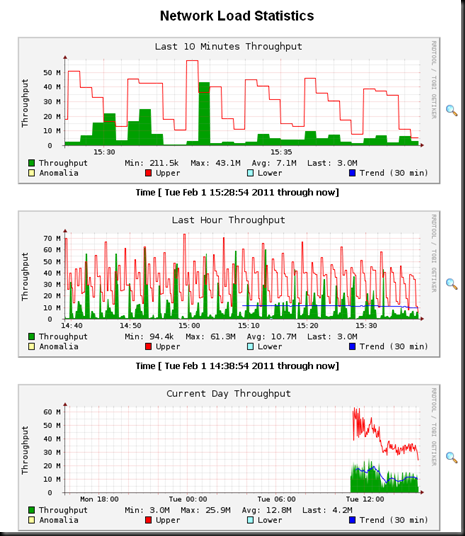
1. Traffic throughput / network load
2. Breakdown by protocol:


Exactly what I was looking for. Thanks!
nice! thanks from france 🙂
Great explanation! Thanks.
Thanks alot. worked well for me.