


How to feed the world in times of pandemic?
By Danyel Giacomini Piccin, CEO Piccin Agricultural Technology
07.04.2020 | 20:59 (UTC -3)
The target spot (Corynespora cassiicola) is a disease that has gained importance over the last few years in cotton crops. Its management requires the integration of several control methods such as genetic, cultural, physical, chemical and biological.
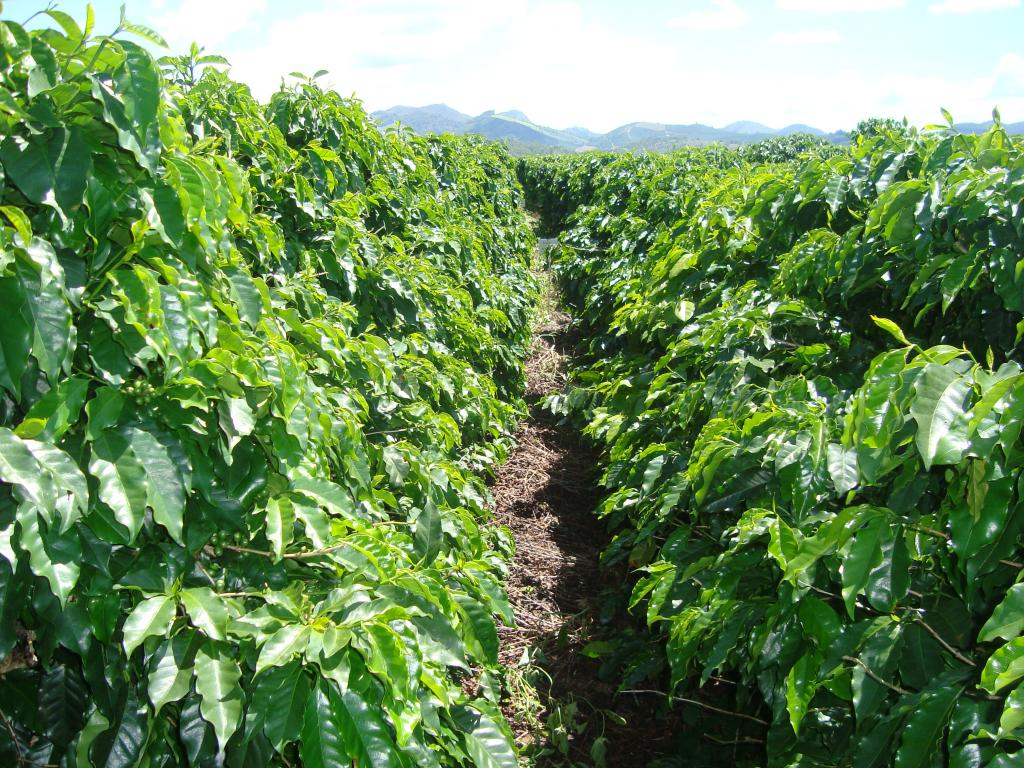
The area allocated to cotton cultivation has not increased in recent years. However, the culture can be found in different regions of Brazil and the world, due to its usefulness and wide diversity of applications. The cotton plant presents a yield to the producer as long as it is cultivated with good cultural techniques. However, there is an evolution and worsening of diseases in the crop.
There are several diseases that affect cotton plants and can cause considerable damage to production. Their importance depends on each location, and some of these, considered not very significant in certain regions, can significantly reduce productivity in others.
Among the diseases that occur in cotton, target spot is gaining importance. There are reports of its occurrence in 2005, in the city of Campo Verde, Mato Grosso. On that occasion, the fungus caused aggressive defoliation in the crop (MEHTA et al. 2005), which was announced during the Phytopathology Congress held in the same year. From then on, it was considered a secondary disease, due to its reported incidence in commercial crops. However, there are no reports of economic impact in this state.
In the state of Mato Grosso do Sul, the first report occurred during the 2011/2012 harvest. The first symptoms of target spot were detected in the municipality of Costa Rica, Mato Grosso do Sul, by agronomist André Luiz Silva, from the Schlatter Group. Since then, the disease has been monitored and studied in the region. In the 2012/2013 harvest, the same event occurred, but the symptoms in the cotton crop began in April, and in a greater number of areas with Target Spot symptoms (Corynespora cassiicola).
In the 2013/2014 harvest, the fact was repeated, similar to the first year of identification. However, taking place in the month of March. In a continuous partnership with the Federal University of Mato Grosso do Sul (UFMS), Campus Chapadão do Sul, the presence of the pathogen was confirmed in more areas, also reaching the southwest region of Goiás (Chapadão do Céu, Goiás).
The fact was communicated to the federal inspector of the Department of the Ministry of Agriculture, Livestock and Supply (Mapa) of Campo Grande, Mato Grosso do Sul, Ricardo Hilman, who in turn sent samples to an accredited laboratory, in Rio Grande do Sul, which officially confirmed that it is the fungus Corynespora cassiicola.
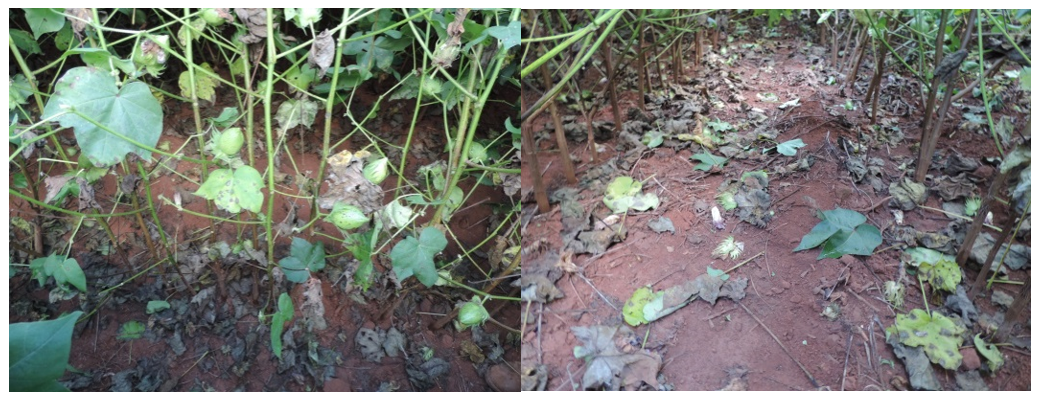
In the same year, in the monitored cultivation areas and in the experimental area of Fundação Chapadão located in the Baús district, the occurrence and aggressiveness of the disease in cotton crops was more clearly noted. It has been proven that the symptoms are initially observed in the leaves of the lower third of the cotton plant and that this leads to yellowing of the leaf, causing early defoliation. This effect could cause damage to crop productivity.
During the 2014/2015 harvest, Fundação Chapadão monitored areas with a history of the disease and at the beginning of March it was already possible to observe some fields with symptoms of Target Spot (Corynespora cassiicola), however with a smaller number of areas. Currently, the main Brazilian states that grow cotton report the incidence of the pathogen.
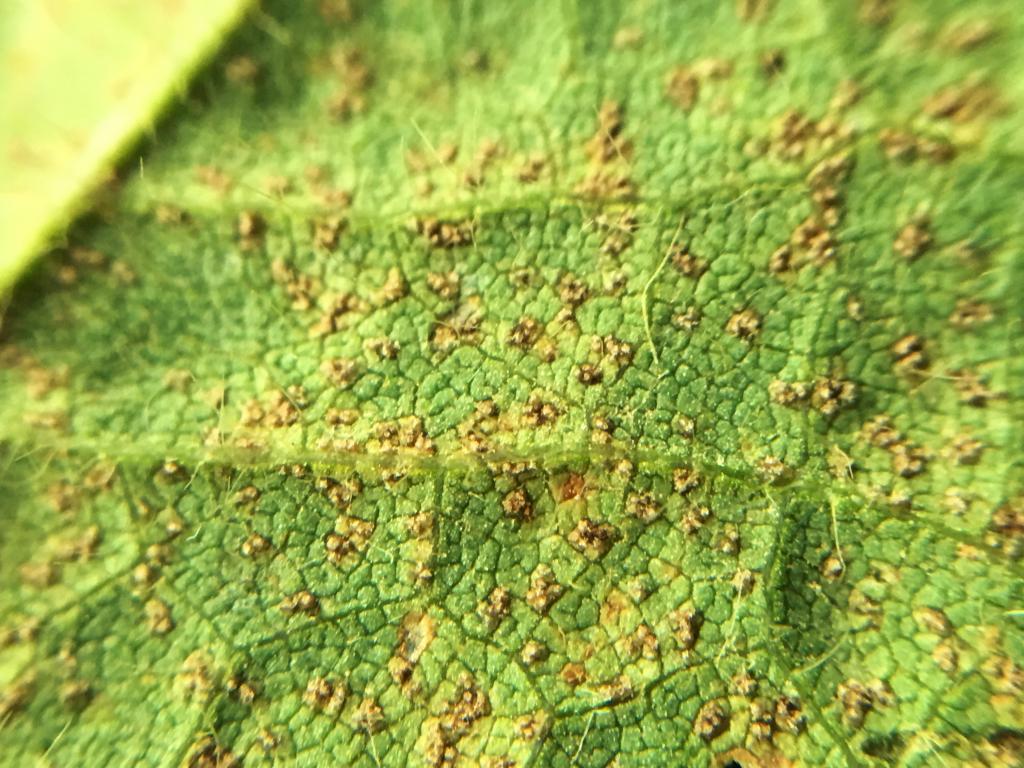
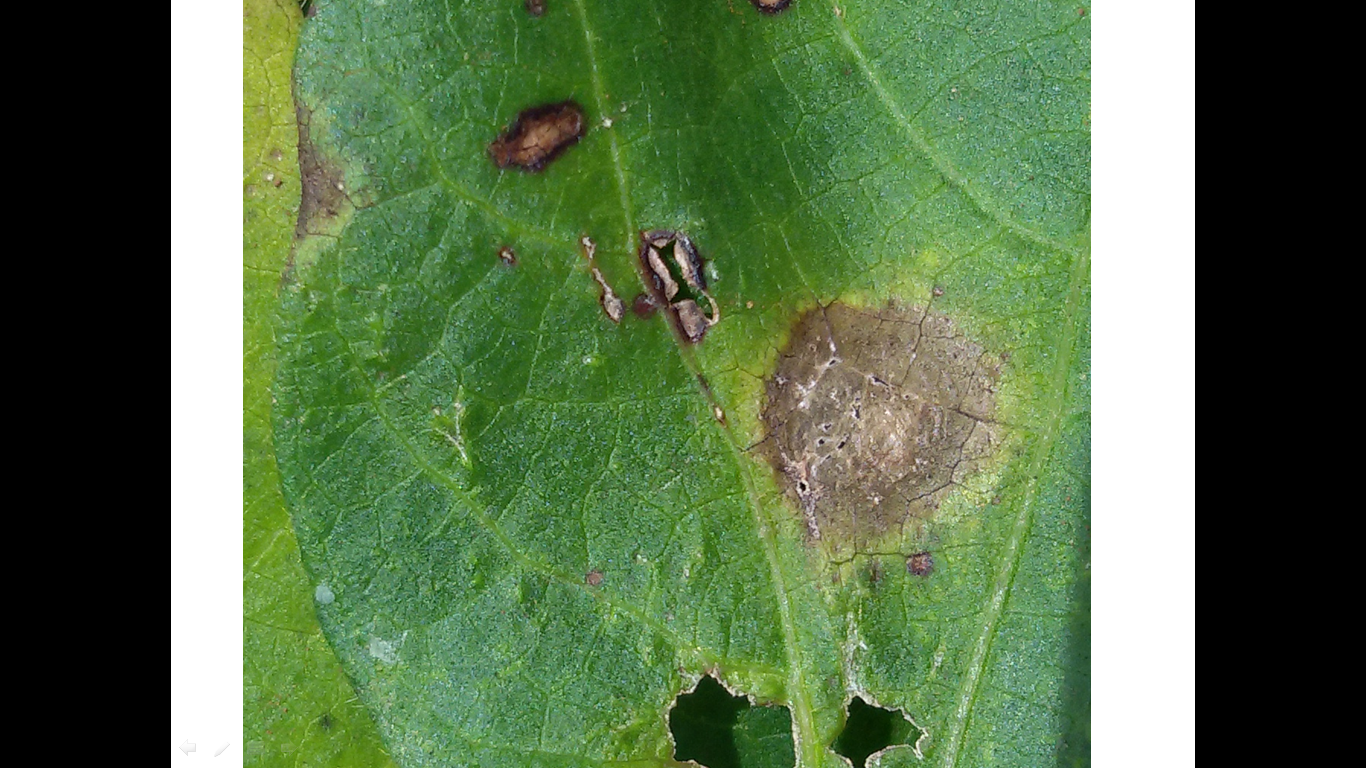
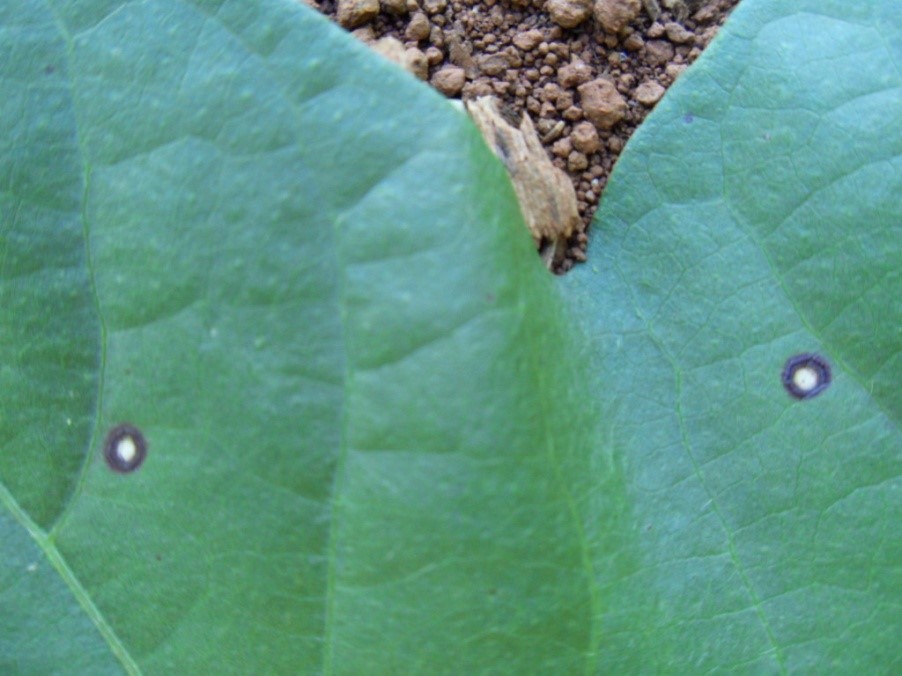
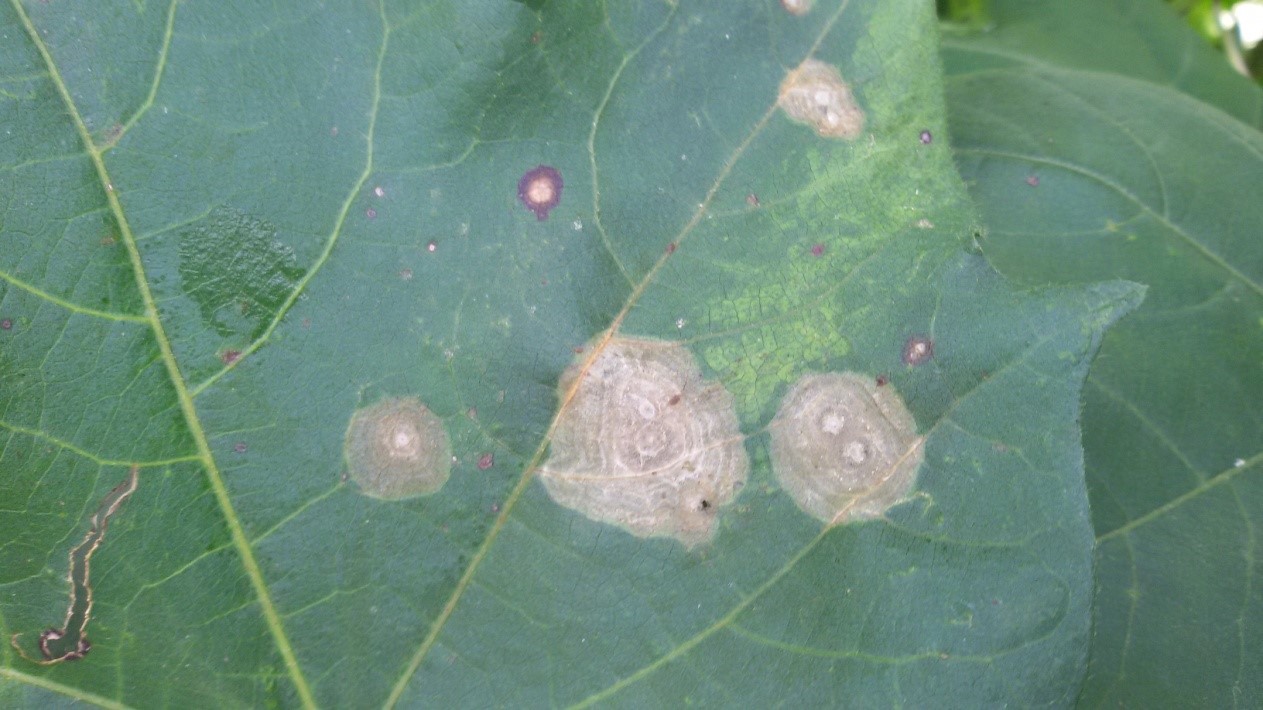
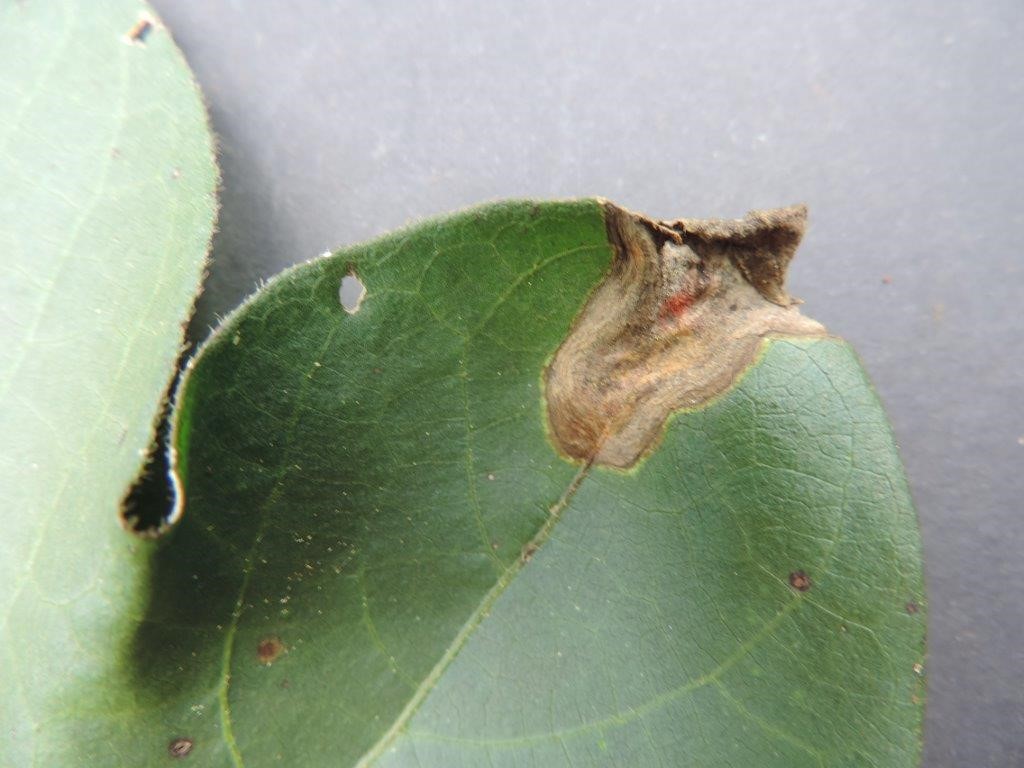
Target spot disease is characterized by symptoms of brown punctual lesions and a yellow halo. As the lesion progresses, large circular spots, brown in color, form concentric rings of darker color, with a punctuation in the center of the lesion. Initially, the symptoms are observed on the leaves of the lower half of the cotton plant, and may also occur on the bracts. Low severity can lead to yellowing of the leaves, causing early defoliation and when favorable weather conditions occur, the crop can suffer severe defoliation, which can cause infected leaves to fall within 10 to 15 days.
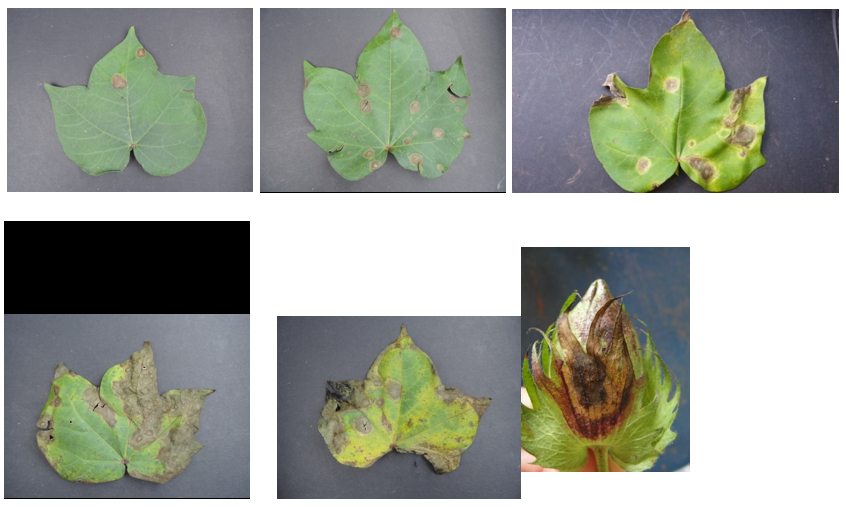
The initial symptoms are observed in crops shortly after the beginning of inter-row closure, mainly in areas where the greatest plant growth occurs, whether due to excess nutrients, inadequate use of the growth regulator or even due to reduced inter-row spacing. These conditions associated with a rainy period and mild temperatures form an extremely favorable microclimate for the development of the pathogen, causing the first infections, which can trigger an epidemic.
Such characteristics can cause confusion, due to the similarity of the initial symptoms of other pathogens, such as Myrothecium Spot where nThe leaves initially have isolated spots with concentric rings, surrounded by a violet halo, which, when coalescing, causes defoliation. However, lesions caused by the pathogen Myrothecium roridum They have sporodochia, which are irregularly shaped and black structures surrounded by white hyphae. Sporodochia can be found next to the lesions, both on the lower and upper surfaces of the leaves.
Alternaria spot, caused by the pathogen that survives in crop residues Alternaria SP, can also generate confusion with the Target Spot at the time of diagnosis. On the leaves, the symptoms look like small circular spots with blackish concentric rings and a brown to gray center. Old lesions have a dry and brittle center. As the number of spots increases, leaves fall.
Phytotoxicity symptoms caused by fertilizer fertilization may also be similar to symptoms caused by different pathogens. Therefore, it is necessary to pay close attention to small details when monitoring crops. The symptoms they may contain an irregular shape, isolated spots with concentric rings, with a runny appearance, varying color according to the source of the nutrient. The location where the symptoms prevail, whether in the lower or upper half of the plant, helps with identification, as symptoms caused by fertilizers are normally observed in the upper third. In this location there will hardly be a microclimate favorable to the development of pathogens to which these symptoms may be similar.
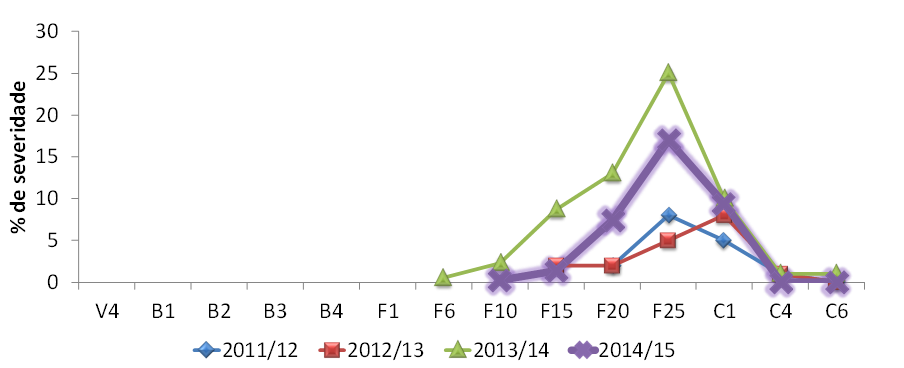
Since the 2012 harvest, several works have been carried out in the field by Fundação Chapadão and UFMS in the search for alternatives for integrated control of this pathogen in cotton. But little is known about the control of this disease in cotton. Initially, it is important that monitoring is carried out to identify which plots and properties present the incidence of the target spot (Corynespora cassiicola) in the cotton plant and at the same time identify its evolution behavior (Graph 01).
When analyzing the graph of the evolution of target spot symptoms in the experimental area of Fundação Chapadão (Graph 01), it is noted that the incidence occurs simultaneously with the closure between the crop rows. It is at this moment that a microclimate favorable to the development of the pathogen is formed, allowing the symptoms to progress further. When leaf severity reaches levels between 25% and 30%, it begins to defoliation of the plant due to severe infections, resulting apparently reducing symptoms. This defoliation provides unfavorable conditions for the development of C. cassiicola, as there will be a greater incidence of light, greater ventilation and a shorter period of humidity, reducing its progress and providing the monitor or evaluator with false control of the target stain.
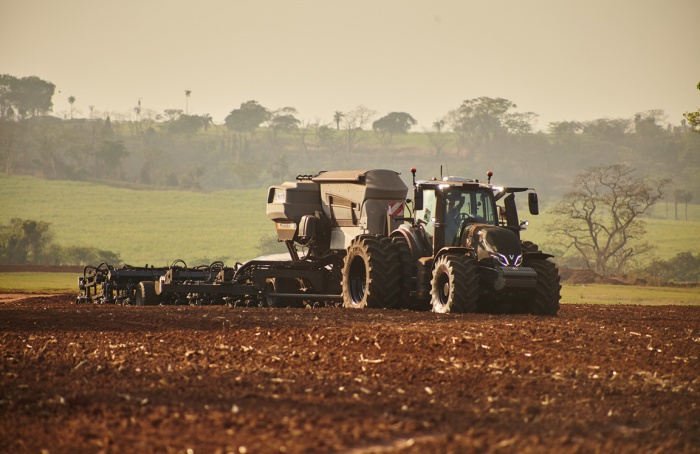
Cultural control practices are necessary to manipulate the conditions in which the crop is cultivated, before, during and after its initiation, in order to discourage the development of pathogens and provide full plant growth.
The cotton plant, as it is characterized by an indeterminate and continuous growth habit, allows plants to grow and reach large sizes. This factor allows the plant to produce a large quantity of leaves, and thus prevents sunlight from penetrating the interior of the plant's canopy, creating an environment favorable to the development of the pathogen.
The ideal conditions for the development of the target spot (Corynespora cassiicola) are temperatures around 22°C and high relative humidity. These conditions can be achieved when plant height and density management are carried out inappropriately. Therefore, it is important to manage height correctly, using growth regulators in order to obtain medium-sized plants with good aeration inside the canopy. For plant density management, it is important to follow the appropriate plant population recommendation. Carrying out this management with smaller plants and using the ideal amount of seed per area makes the environment less prone to the development of the disease.
Another control practice that has shown interesting results is crop rotation. This practice consists of alternating planting of different species over the years. In the main producing regions, depending on economic conditions, the production system is characterized by the cultivation of soybeans in the first harvest followed by cotton in the second harvest. This type of management can result in a continuation of the fungus cycle, increasing the source of inoculum and increasing its damage potential in the cultivation area. One of the alternatives to face this type of problem would be the use of species such as millet and corn, among others, as these species are not susceptible to the pathogen of the target spot, which could consequently help to reduce the amount of inoculum in the area in question.
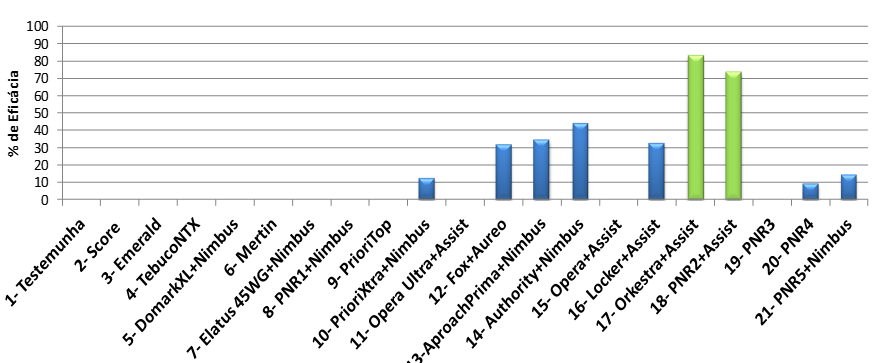
Currently, the main disease of cotton crops is Ramularia spot (Ramularia areola), which has required chemical control measures for many years in the Chapadões Region. It is necessary to carry out at least seven applications of specific fungicides for this fungus. Through the work carried out in the 2014/2015 harvest with the objective of chemical control of Ramularia Spot, there was an incidence of Corynespora cassiicola. The results show a worrying condition, where those fungicides commonly used in cotton crops showed low effectiveness in reducing the progress of Target Spot, that is, it is possible to highlight that the fungicides that provide better effectiveness in controlling Ramularia Spot do not have the same performance for the target Spot (Graph 02 and 03).
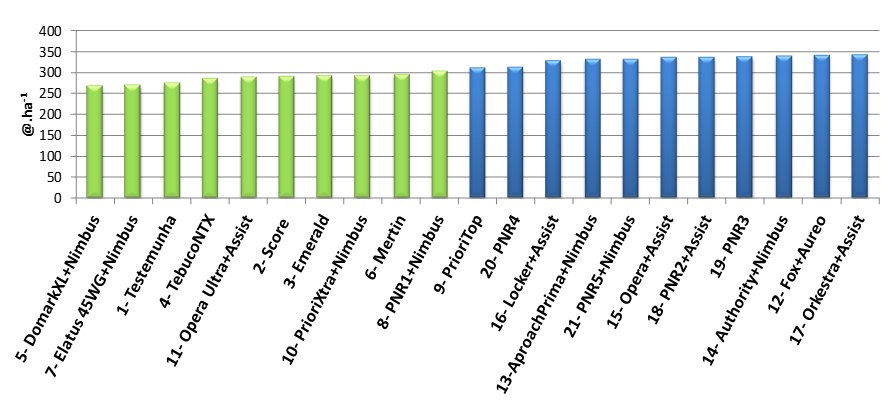
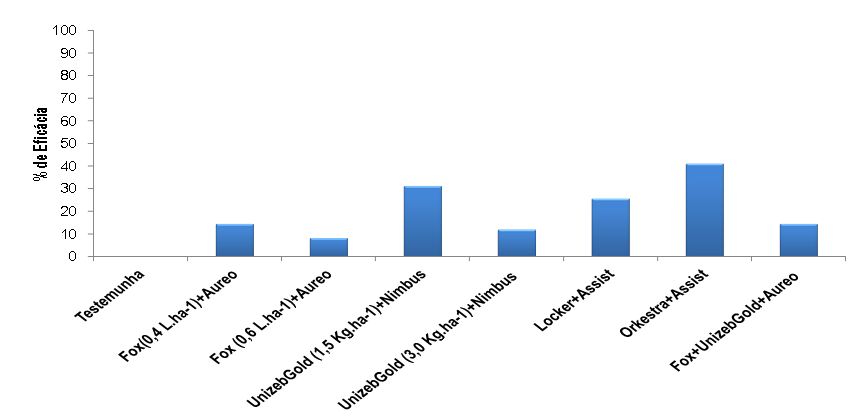
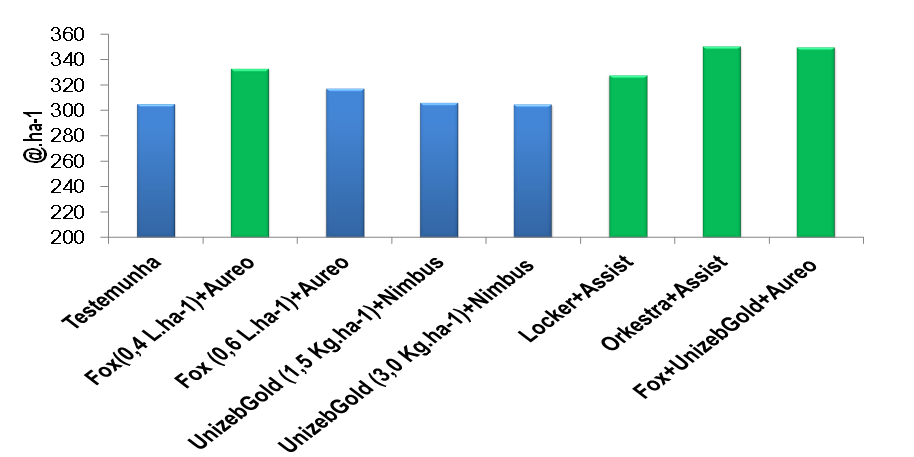
One of the works carried out by Fundação Chapadão aimed to evaluate the effect of different fungicides applied at the onset of target spot symptoms in cotton crops grown in the second harvest in a dense system (0,45 m spacing between rows) under field conditions. In this case, the fungicides showed low effectiveness in controlling target spot on cotton, due to the application starting at the first symptoms on the leaves, compromising their performance (Graph 04). However, there was a significant increase in productivity due to chemical control of C. cassiicola (Graph 05).
Given these conditions, the target spot is present in cotton grown in the Chapadões region, requiring the integration of various disease control methods such as genetic, cultural, physical, chemical and biological in order to maintain greater crop health, which will lead to productivity gains in the face of this new phytosanitary problem.
Alfredo Riciere Dias, Chapadão Foundation; Hugo Manoel de Souza, UFMS; Gustavo de Faria Theodoro, UFMS, Engo. Agro. Dr.
Article published in issue 202 of Cultivar Grandes Culturas.


Receive the latest agriculture news by email