
Table of contents
What is the Cause and Effect Analysis?
A Cause and Effect Analysis, also known as Fishbone Diagram, a C&E Diagram, or Ishikawa Diagram, is a visual tool used for problem-solving and root cause analysis. It was developed by Japanese quality control expert Kaoru Ishikawa in the 1960s and is widely used in various industries to identify and understand the causes of a specific problem or issue.
The main purpose of a Cause and Effect Analysis is to:
- Identify the root causes of a problem: By breaking down a problem into its underlying causes, you can identify the fundamental issues that need to be addressed rather than just addressing the symptoms.
- Facilitate brainstorming and collaboration: The diagram provides a structured way for teams to brainstorm and explore various potential causes of a problem.
- Visualize the relationships between causes: It helps illustrate how different factors or causes are interconnected and contribute to the problem.
How to Develop a Cause and Effect Diagram
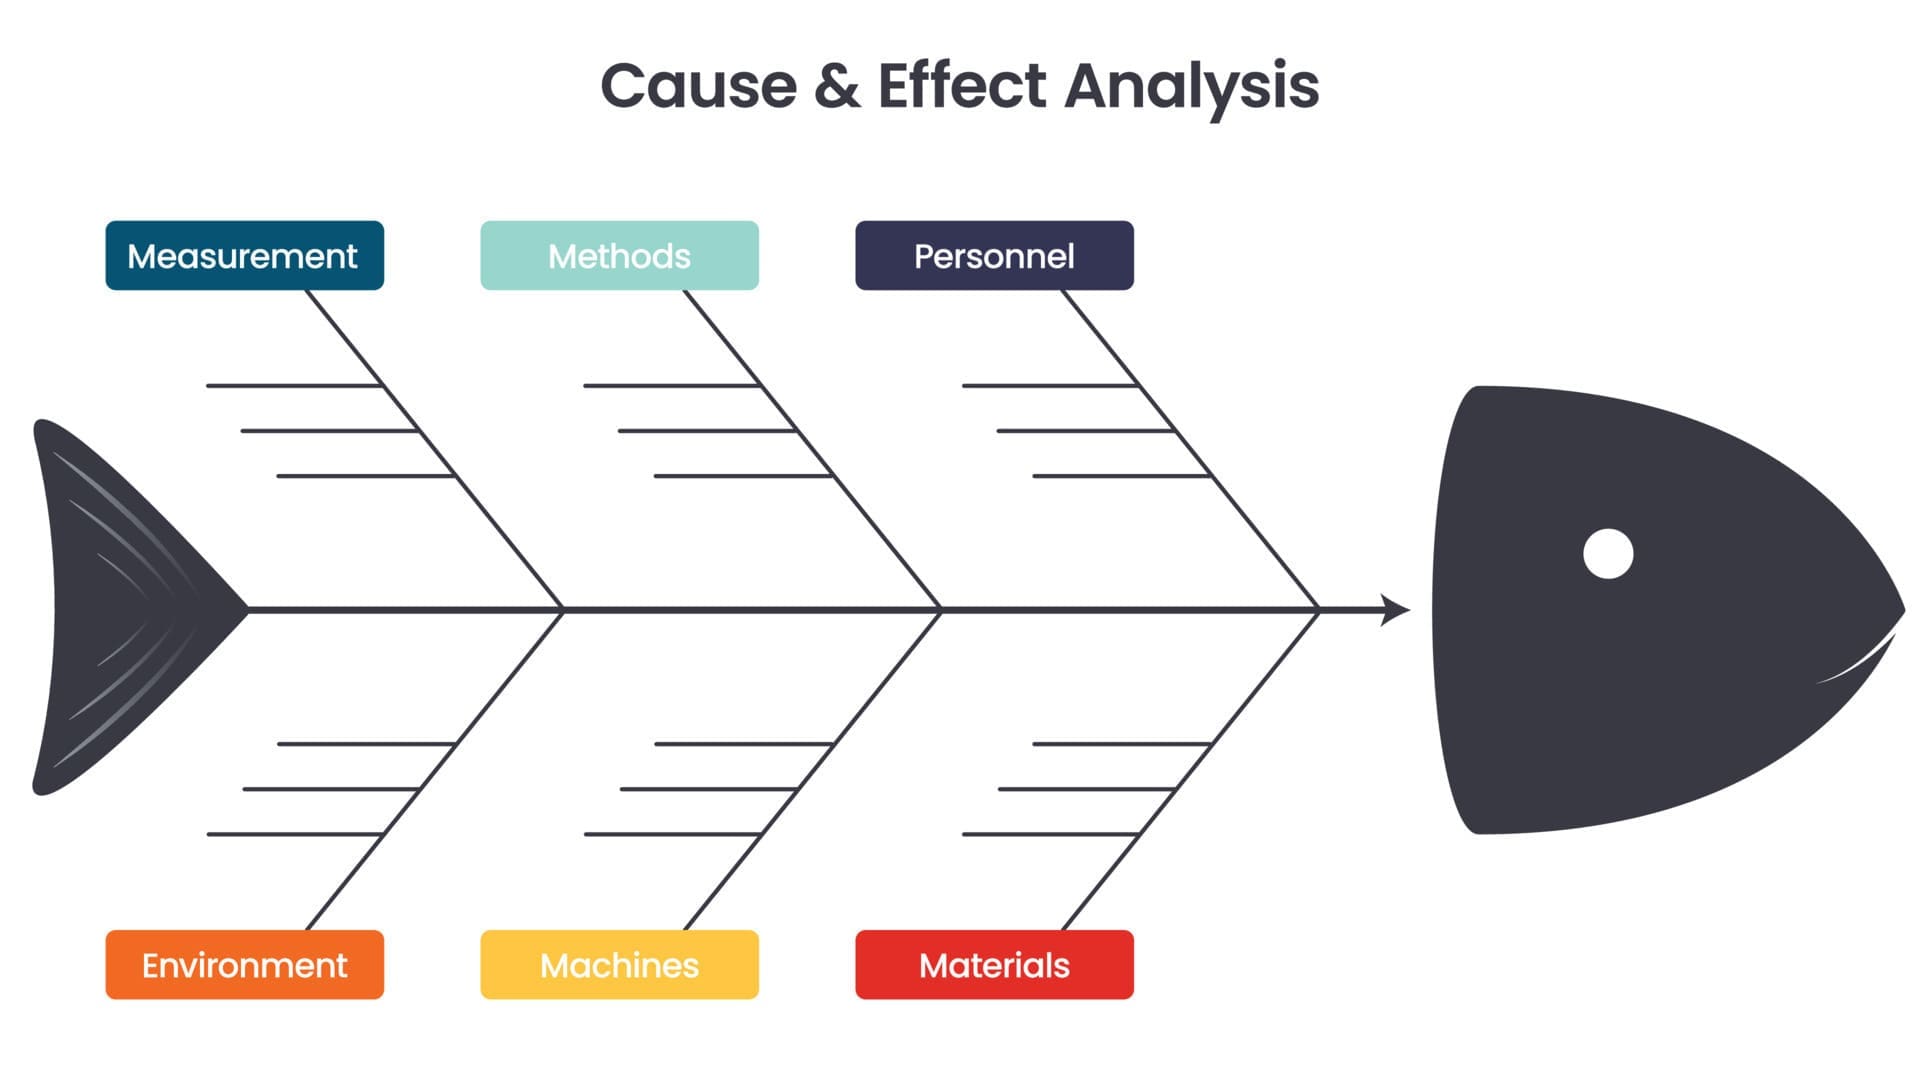
The Cause and Effect diagram, often referred to as the “Ishikawa diagram” or fishbone diagram due to its resemblance to a fish’s skeletal structure, is a valuable visual tool used in problem-solving. The diagram is constructed from left to right, with each primary bone of the fish extending into smaller bones to provide more detailed information. Positioned at the forefront of the diagram is the “Effect” that the team is investigating, serving as the focal point.
The team’s primary objective is to engage in brainstorming sessions to identify potential causes that can be linked to the effect under investigation. As the brainstorming progresses, the fishbone structure gradually fills up with various potential causes, resembling the headers found in the columnar structure of the affinity diagram.
This tool is commonly employed during the initial stages of a root cause analysis, offering an excellent opportunity for collaborative brainstorming and idea generation. It helps teams dissect complex issues, fostering a better understanding of the interconnected causes and facilitating the identification of root causes more effectively.
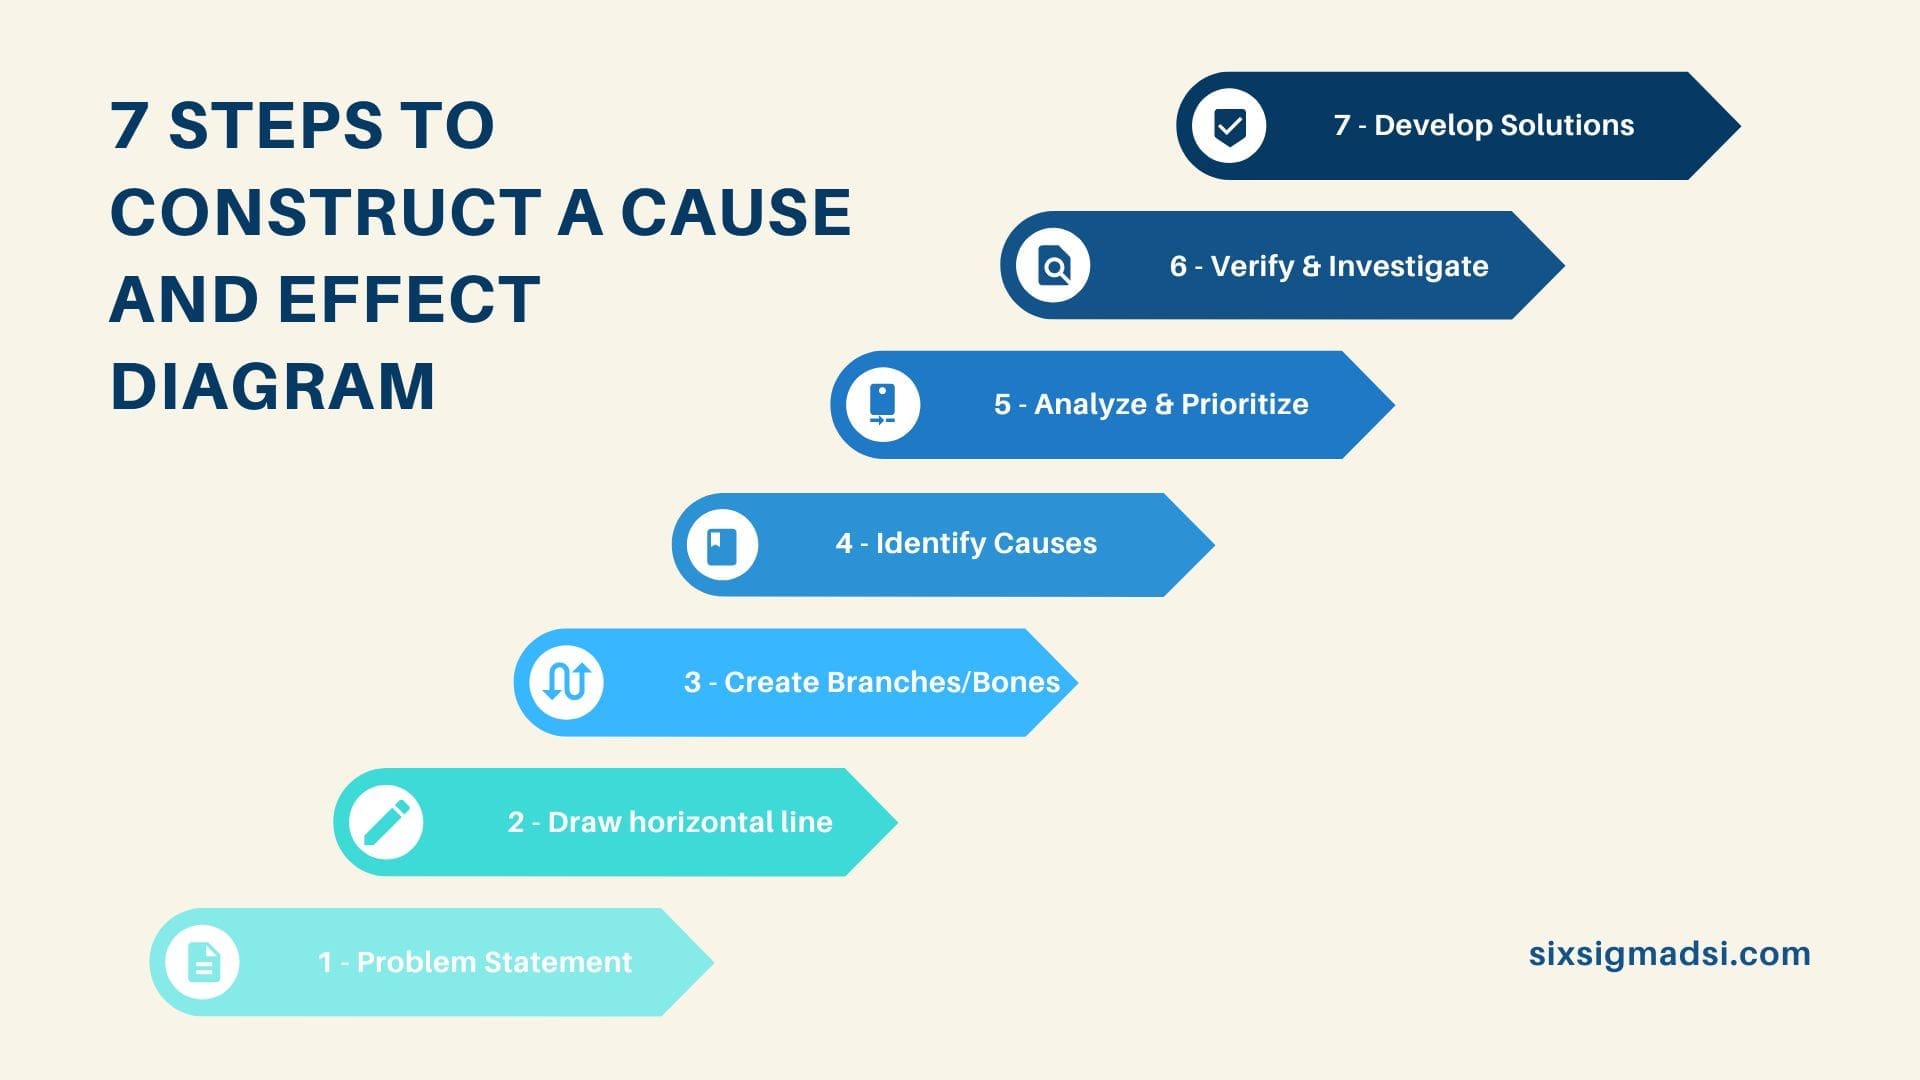
Here’s how a Cause and Effect Analysis is typically constructed:
- Start with a clear problem statement: Write down the problem or issue you want to analyze in the form of a question or statement at the head of the diagram.
- Draw a horizontal line: Draw a horizontal arrow pointing to the problem statement.
- Create “bones” or branches: Draw several diagonal lines, like the bones of a fish, extending from the horizontal line. These represent different categories or factors that may contribute to the problem. Common categories include people, processes, equipment, materials, environment, and management.
- Identify causes within each category: Have a brainstorming session with your team to identify potential causes within each category. Write these causes as sub-branches off the corresponding category line.
- Analyze and prioritize causes: Once you have identified potential causes, you can analyze and prioritize them based on their importance and impact on the problem.
- Verify and investigate: After identifying the potential root causes, it’s important to verify them through data and investigation to ensure their accuracy.
- Develop and implement solutions: Once you’ve pinpointed the root causes, you can develop and implement solutions to address them, with the goal of solving the problem.
Cause and Effect Analysis is a valuable tool for structured problem-solving and can be applied in various contexts, from manufacturing and quality control to project management, healthcare, and more. It helps teams gain a deeper understanding of complex problems and make informed decisions to improve processes and outcomes.
Some Helpful Tips
It is essential to ensure that your team reaches a consensus regarding the issue statement. Providing comprehensive details regarding the “what,” “where,” “when,” and “how much” of the problem can enhance clarity. Whenever possible, employ data to precisely define the problem.
The goal should be to construct the diagram collaboratively, involving individuals directly affected by the issue. This fosters a sense of ownership and collective responsibility.
Consider using the cause-and-effect diagram as a dynamic working document. Regularly update it as new data becomes available or when experimenting with various solutions. Utilizing a paper surface for the diagram allows for easy transport and sharing among team members.
Strive to assign causes to only one category, although there might be instances where certain causes overlap. This ensures a more organized and clear representation of the problem’s root causes.
When should you use a Cause and Effect diagram?
- When identifying possible causes for a problem
- When a team’s thinking tends to fall into ruts
- When you want to identify and sort interactions among the factors on an effect
- When you want to initiate appropriate corrective action for existing problems.
Cause and Effect Analysis Example
Let’s consider a simple example of a Cause and Effect Analysis related to a manufacturing problem: “Defective Products in a Manufacturing Process.”
Problem Statement: Defective Products in Manufacturing
Categories (Bones):
- People
- Processes
- Equipment
- Materials
Potential Causes within Each Category:
- People:
- Lack of training for operators
- Inadequate supervision
- Operator error
- Processes:
- Inefficient quality control measures
- Unclear production instructions
- Poorly defined production standards
- Equipment:
- Old or malfunctioning machinery
- Lack of maintenance
- Inaccurate measuring instruments
- Materials:
- Low-quality raw materials
- Inadequate inventory control
- Supplier issues
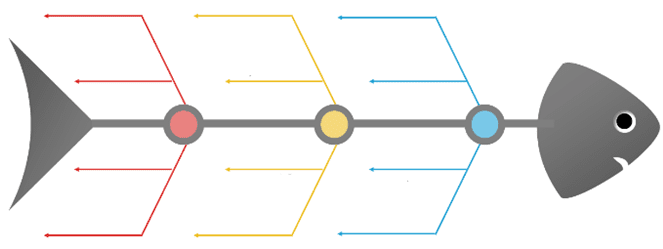
Now, you have a visual representation of the potential causes related to defective products in the manufacturing process. Each of these potential causes can be further investigated and analyzed to determine their contribution to the problem.
For instance, after conducting further analysis, you might find that the root causes of the defect issue are inadequate operator training, old and malfunctioning machinery, and low-quality raw materials. Armed with this information, you can then develop and implement specific solutions for each of these root causes to improve product quality and reduce defects in the manufacturing process.
This simple example illustrates how a Cause and Effect Analysis can help break down a complex problem into its constituent parts, making it easier to identify and address the underlying causes.
Benefits of The Cause and Effect Diagram
One of the primary merits of this tool lies in its ability to channel the collective focus of individuals involved in addressing a specific problem. It accomplishes this task in a methodical and structured manner, fostering an environment that promotes innovative thinking while ensuring that the team remains on a well-defined course. Additionally, the tool facilitates the application of the “5 Whys” technique to explore and pinpoint potential root causes within the brainstormed theories.
Furthermore, due to its visual nature and ability to capture complex situations comprehensively, the cause-effect diagram excels as a means of effectively communicating information to others. It simplifies the process of conveying intricate problem-solving processes and their associated elements to stakeholders and team members alike.
Have you used the Cause & Effect Diagram in your problem-solving efforts?
What challenges have you faced, and what successes have you achieved? Share your insights, questions, or real-life examples in the comments below. Let’s keep the conversation going and learn from each other’s experiences.