


Introduction
Cotton (Gossypium hirsutum L.) is an economically important crop. Cotton is the main source of natural textile fibre, and one of the most important oil crops (Zhang et al., Reference Zhang, Ren, Sun, Tang, Ning and Qian2017). Cotton contains 49 species distributed throughout the most tropical and subtropical regions of the world. The world's cotton industry represents a multibillion-dollar enterprise, from the production of raw fibre to finished textile products (Smith and Cothren, Reference Smith and Cothren1999). Between 2016 and 2017, 32.4 million hectares were planted in more than 80 countries (Carvalho et al., Reference Carvalho, Ruiz, FAO and Gobierno de Brasil2018).
Diseases and insect pests, in cotton, generate large economic losses. If they are not controlled in time, that is, at an early stage, they can cause an infestation, and decrease production yield and quality of the harvested product (El-Wakeil and Abdallah, Reference El-Wakeil and Abdallah2014). As an example, in Brazil, annual losses, in agricultural production, due to insect pests, can reach an average of 7.7%, equivalent to approximately US$ 17.7 billion (Oliveira et al., Reference Oliveira, Auad, Mendes and Frizzas2014). Entomological and pathogenic problems are one of the causes of low yields and economic losses in cotton (Anees and Shad, Reference Anees and Shad2020; Chohan et al., Reference Chohan, Perveen, Abid, Nouman and Sajid2020).
One of the ways to control diseases and insect pests is through agrochemicals, but this (i) increases production costs and (ii) generates a negative impact on the environment. This is why integrated pest management (IPM) seeks to minimize the environmental impact of pesticide application, and reduce risks to human and animal health (Simberloff and Rejmanek, Reference Simberloff and Rejmanek2011; FAO, 2017). IPM is based on two important aspects – prevention and monitoring of diseases and insect pests – which today are being assisted by sensing and artificial-intelligence (AI) techniques. Research on object-recognition and computer vision has led to advances in factory automation, assembly-line industrial inspection systems and medical imaging (Andreopoulos and Tsotsos, Reference Andreopoulos and Tsotsos2013). In the detection of diseases and insect pests, computer vision has led to advances in the development of precision agriculture (Solis-Sánchez et al., Reference Solis-Sánchez, García-Escalante, Castañeda-Miranda, Torres-Pacheco and Guevara-González2009; Patrício and Rieder, Reference Patrício and Rieder2018; Habib et al., Reference Habib, Majumder, Jakaria, Akter, Uddin and Ahmed2020). In addition to computer vision, sensors (e.g. temperature sensors, soil and moisture sensors) allow data acquisition for analysis and predictions (Pratheepa et al., Reference Pratheepa, Verghese and Bheemanna2016).
For the analysis of diseases and insect pests, expert systems have also helped to make better decisions and to assist farmers to prevent or control diseases and insect pests (Boissard et al., Reference Boissard, Martin and Moisan2008; Abu-Nasser and Abu-Naser, Reference Abu-Nasser and Abu-Naser2018; Alzamily, Reference Alzamily2018). Expert systems contributed to improve the productivity and quality of the cultivated products, which is related to the objectives of smart agriculture (SA): (i) to increase productivity, (ii) to improve food security, (iii) to improve adaptation and resilience to climate change and variability and (iv) to reduce greenhouse gas emissions (FAO, 2013).
SA uses the interrelationship of (i) sensor-network, (ii) grid-computing and (iii) context-aware computing to manage the agriculture process. SA allows decisions to be made based on the acquisition of data from the agricultural context (Aqeel-Ur-Rehman and Shaikh, Reference Aqeel-Ur-Rehman and Shaikh2009; García et al., Reference García, Aguilar, Toro, Pinto and Rodríguez2020). Some of the technologies used in SA are robotic automation, data analytics and remote sensing (Grady et al., Reference Grady, Langton, Hare, O'Grady, Langton and O'Hare2019). AI techniques are employed in SA for the following tasks (Bannerjee et al., Reference Bannerjee, Sarkar, Das and Ghosh2018): (i) general crop management, (ii) pest management, (iii) disease management, (iv) agricultural product monitoring and storage control, (v) soil and irrigation management, (vi) weed management and (vii) yield prediction. In this systematic literature review (SLR), we focus on pest management.
Some SLRs have been made in relation to pest management, but none – specifically – to cotton. Patrício and Rieder (Reference Patrício and Rieder2018) conducted an SLR of computer vision and AI, in precision agriculture, for grain crops (maize, rice, wheat, soybean and barley), and aspects related to disease detection, grain quality and phenotyping. Zhang et al. (Reference Zhang, Huang, Pu, Gonzalez-Moreno, Yuan, Wu and Huang2019) conducted an SLR on monitoring plant diseases and pests through remote-sensing technology, not including in-situ sensors: the main topics were sensing technologies and feature extraction. The previous study included four papers related to cotton between 2004 and 2011. Boissard et al. (Reference Boissard, Martin and Moisan2013) conducted a brief review of the application of image processing to identify agricultural pests on various crops not including cotton. Bannerjee et al. (Reference Bannerjee, Sarkar, Das and Ghosh2018) conducted a literature survey on AI, in agriculture, in general. For cotton cultivation, they included three papers, in the category of crop management, before 1989; and one paper, on yield prediction, in 2008. Finally, Iqbal et al. (Reference Iqbal, Khan, Sharif, Shah, ur Rehman and Javed2018) made an SLR of automated detection and classification of citrus-plant diseases using image-processing techniques. Table 1 shows the summary of these reviews. According to the above, an SLR for cotton is needed (i) to analyse articles that used AI techniques to manage diseases and insect pests, in cotton; (ii) to know the most recent state-of-the-art, given the continuous advances in the area and (iii) to identify future work directions.
Table 1. Summary of reviews related to this SLR

The objective of this SLR is to establish the state-of-the-art research on the management (detection, prediction, diagnosis and prescription), of diseases and insect pests, in cotton. The main contributions of this article are the following. Firstly, a description of the cotton diseases and insect pests was investigated through the use of AI and sensing techniques, from 2014 to 2021. Secondly, an analysis of the selected papers. Finally, a definition and discussion of the current challenges on AI techniques, for pest and disease management, in cotton.
Background
In what follows, a background of cotton diseases and insect pests is presented.
Cotton insect pests
Insects are classified as pests when the damage they cause decreases the yield of the farmer's products (Dent and Binks, Reference Dent and R2020). The insect pests described as follows were selected due to the severity of their damage and greater presence (Presley, Reference Presley1954; Carpenter, Reference Carpenter1983; Ñañez, Reference Ñañez2012), or because they have been much studied.
Boll weevil (Anthonomus grandis)
Boll weevil is the main pest in cotton around the world, directly affecting cotton production (Coelho et al., Reference Coelho, de Souza Júnior, Firmino, de Macedo, Fonseca, Terra, Engler, de Almeida Engler, da Silva and Grossi-de-Sa2016; Grigolli et al., Reference Grigolli, Souza, Fernandes and Busoli2017; Ben Guerrero et al., Reference Ben Guerrero, Salvador and Talia2020). Adults feed on fruiting forms, leaf petioles and terminal growth (Ellis and Horton, Reference Ellis and Horton1997).
Whitefly (Bemisia tabaci)
Whitefly infests cotton and many other plants, for example, tomato, soybean, paprika and rose (Martin et al., Reference Martin, Moisan, Paris and Nicholas2008; Xia, Reference Xia2012; Barbedo, Reference Barbedo2014; El-Wakeil and Abdallah, Reference El-Wakeil and Abdallah2014; Xia et al., Reference Xia, Chon, Ren and Lee2014). The whitefly reduces the performance, or even kills the plant, by feeding on the sap. In addition, the whitefly can also transport viruses (El-Wakeil and Abdallah, Reference El-Wakeil and Abdallah2014). The whitefly is one of the most prominent insect pests and it is present in two stages of cotton: growing and fruiting.
Thrips (Thrips tobacco)
Thrips can occur in plants such as cotton, tomato, avocado, broccoli and lettuce (Solis-Sánchez et al., Reference Solis-Sánchez, Castañeda-Miranda, Garcia-Escalante, Torres-Pacheco, Guevara-Gonzalez, Castañeda-Miranda and Alaniz-Lumbreras2011; Xia et al., Reference Xia, Chon, Ren and Lee2014; Shahzadi et al., Reference Shahzadi, Ferzund, Tausif and Asif2016). Thrips’ damage can stunt growth which impacts crop performance (El-Wakeil and Abdallah, Reference El-Wakeil and Abdallah2014). The thrips infest in the seedling stage.
Bollworms
There are two types: (i) American bollworm (Helicoverpa armigera) and (ii) pink bollworm (Pectinophora gossypiella). Bollworms can infest cotton, tomato and okra. In a severe infestation, bollworms may cause high damage to the plant. The larvae feed on cotton boll in the fruiting stage (El-Wakeil and Abdallah, Reference El-Wakeil and Abdallah2014).
Cotton diseases
Diseases may be caused by fungus (mainly), bacteria or nematodes (Presley, Reference Presley1954; Carpenter, Reference Carpenter1983; Ñañez, Reference Ñañez2012). The most important diseases based on the damage they do to cotton are described below.
Cotton diseases with the most damage
Bacterial blight (Xanthomonas campestris pv. Malvacearum)
The damage of bacterial blight disease is that the leaf veins blacken causing a ‘blighting’ appearance, causing defoliation and rotting. It can infect all growth stages of cotton, and can quickly spread to other areas of the field through wind-driven rain or irrigation (Cox et al., Reference Cox, Babilonia, Wheeler, He and Shan2019).
Fusarium wilt (Fusarium oxysporum f. sp. Vasinfectum)
Damage caused by fusarium wilt disease includes brown discolouration of the vascular system, plant stunting, plant wilt, necrosis and death. The pathogen that causes this disease is difficult to control. It spreads through the soil, in which it can survive for a long time, and through plant debris and seeds (Cox et al., Reference Cox, Babilonia, Wheeler, He and Shan2019).
Cotton diseases most studied
The most studied diseases in the literature are described below.
Root rot (Phymatotrichum omnivorum)
The fungus attacks the plant root, blocks the vascular elements, inhibiting the movement of water. The leaves turn yellow or brown and then wilt rapidly, causing death in a few days (Pammel, Reference Pammel1888; Uppalapati et al., Reference Uppalapati, Young, Marek and Mysore2010). The symptoms usually begin during extensive vegetative growth, are more visible during flowering and fruit development and continue through the growing season (Smith et al., Reference Smith, Elliott and Bird1962).
Grey mildew (Ramularia areola)
The disease is produced by a fungus. Initial symptoms appear, firstly, on lower leaves after the first boll set. They are light green to yellow-green translucent spots bounded by veinlets (called areolate) on the upper surface of the leaves. The severe infection leads to defoliation and premature boll opening (Chohan et al., Reference Chohan, Perveen, Abid, Nouman and Sajid2020). R. areola is the most important foliar cotton disease; its infection can cause boll abortion, malformation of bolls and lower fibre quality (Xavier et al., Reference Xavier, Souto, Statella, Galbieri, Santos, Suli and Zeilhofer2019).
Pest management and AI
AI supports decision-making activities of pest management, such as monitoring and control. Some examples of the application of AI in pest management are (i) pest identification (Deng et al., Reference Deng, Wang, Han and Yu2018; Roldan-Serrato et al., Reference Roldan-Serrato, Escalante-Estrada and Rodriguez-Gonzalez2018), (ii) pest counting (Xia et al., Reference Xia, Chon, Ren and Lee2014; Yao et al., Reference Yao, Xian, Liu, Yang, Diao and Tang2014) and (iii) pest-spread prediction (Hudgins et al., Reference Hudgins, Liebhold and Leung2017; Chen et al., Reference Chen, Xiao, Zhang, Xie and Wang2020; Ji et al., Reference Ji, Han, Lu and Wei2020). In disease management, AI has been used for (i) disease recognition (Habib et al., Reference Habib, Majumder, Jakaria, Akter, Uddin and Ahmed2020; Velasquez et al., Reference Velasquez, Sanchez, Sarmiento, Toro, Maiza and Sierra2020) and for (ii) early plant-disease forecast (Khattab et al., Reference Khattab, Habib, Ismail, Zayan, Fahmy and Khairy2019). AI has also been used for soil and irrigation management (Navinkumar et al., Reference Navinkumar, Ranjith Kumar and Gokila2020; Talaviya et al., Reference Talaviya, Shah, Patel, Yagnik and Shah2020) and weed management (Partel et al., Reference Partel, Charan Kakarla and Ampatzidis2019; Sudars et al., Reference Sudars, Jasko, Namatevs, Ozola and Badaukis2020; Monteiro et al., Reference Monteiro, de Freitas Souza, Lins, Teófilo, Barros Júnior, Silva and Mendonça2021). In this paper, we only focus on disease and insect pest management.
Materials and methods
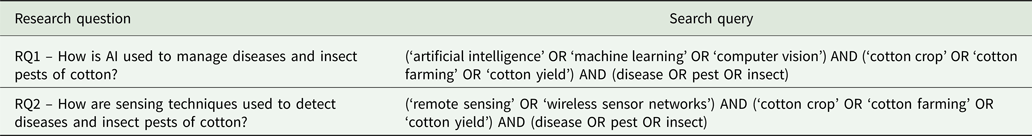
The methodology for reviewing the papers was based on Kitchenham et al. (Reference Kitchenham, Pretorius, Budgen, Brereton, Turner, Niazi and Linkman2010). The bibliographic analysis, in the domain under study, involved two steps: (a) collection of related work and (b) detailed review and analysis of these collected works. In the first step, a keyword-based search for scientific papers, between 2014 and 2021, was performed to know the most recent state-of-the-art. Although there are earlier works (Willers et al., Reference Willers, Seal and Luttrell1999, Reference Willers, Jenkins, Ladner, Gerard, Boykin, Hood, Mckibben, Samson and Bethel2005, Reference Willers, Jenkins, McKinion, Gerard, Hood, Bassie and Cauthen2009; Boissard et al., Reference Boissard, Martin and Moisan2008; Martin et al., Reference Martin, Moisan, Paris and Nicholas2008), they were not included because they did not comply with the range of dates. Sources were the scientific databases: Scopus, ScienceDirect, Taylor and Francis, Springer and Google Scholar. The results of each database were merged, and later, the duplicates were deleted. Table 2 lists the research questions and their search queries.
Table 2. Research question and search queries of this SLR
The following inclusion criteria were used. IC-1: include publications in journals and conferences whose titles are related to the management and diagnosis of insect pests or diseases. IC-2: include publications in journals and conferences that contain keywords that match those defined in the search string. IC-3: include publications whose summary and/or introduction and/or conclusions are related to the selected topic. Finally, IC-4: include studies in English. The following exclusion criteria were applied. EC-1: exclude publications that do not match the previous inclusion criteria. EC-2: exclude all duplicates. EC-3: exclude books. EC4: exclude documents in the form of editorial, abstract, keynote, poster. EC5: exclude opinion pieces or position papers.
The list of the final papers, by research questions, is presented in Table 3. Papers that answer RQ2 also answer RQ1. Google Scholar included results of Scopus, as well Scopus included results of Science Direct, Springer and Taylor and Francis.
Table 3. Data sources and results of the search queries of this SLR

In general, the search strings were applied to search in the article title, abstract and keywords. In the scientific databases, 2057 papers were found. With these papers, the selection filters were applied and, finally, 30 were selected. Of the 30 papers, 30 respond to RQ1 and 20 respond to RQ2. Figure 1 shows the flowchart of the selection process.

Fig. 1. Flowchart of the selection process for this SLR.
In the second step, the 30 selected papers from the first step were analysed one by one, considering the research questions.
Results
This section explains the SLR results, particularly, it analyses the selected papers.
General characteristics of the selected studies
Thirty papers met the eligibility criteria and were included in this review – according to the inclusion/exclusion process. In total, 66.7% were about diseases and 33.3% about insect pests. The distribution of the studies, by country, is shown in Fig. 2. These studies were conducted in five countries: India (66.7%), the United States (13.3%), Brazil (10%), China (6.7%) and Pakistan (3.3%). Not surprisingly, India represents the highest percentage, as it is the major producer of cotton, ranked number one in the world. The production of cotton in these five countries is among the top ten in the world. India produces about ~6000 metric tonnes, China ~5000, the United States ~4000 and Pakistan and Brazil ~2000 (Azam et al., Reference Azam, Wahid, Ahmad, Tayab, Ahmed, Ahmad and Hasanuzzaman2020).

Fig. 2. World map of reviewed research articles in this SLR.
AI techniques used for the management of diseases and insect pests
This section describes the techniques used for the management (detection, diagnosis, etc.), of diseases and insect pests, in cotton agriculture.
Insect pests
To identify whitefly, Sangari and Saraswady (Reference Sangari and Saraswady2016) presented a pest-image segmentation using Marker-Controlled Watershed Transformation (MWT), which was compared with a fuzzy c-means (FCM) clustering. The results showed that MWT performs better than FCM, with a better convergence rate. Sangari and Saraswady (Reference Sangari and Saraswady2016) used nonlinear assessments for the measurement of image distortion: the parameters evaluated were structural content (SC), peak signal-to-noise ratio (PSNR), normalized correlation coefficient (NK), normalized absolute error (NAE) and average difference (AD).
Shahzadi et al. (Reference Shahzadi, Ferzund, Tausif and Asif2016) proposed a rule-based system to diagnose whitefly and other insect pests. The rule-based system used moisture sensors, temperature sensors, humidity sensors and leaf-wetness sensors. For knowledge acquisition of the expert system, they used three inputs: (i) domain experts, (ii) research and (iii) field observations.
Kandalkar et al. (Reference Kandalkar, Deorankar and Chatur2014) used the following techniques to identify H. armigera: (i) for image segmentation, a saliency map; (ii) for feature extraction, the energy of an image as a feature vector with the discrete wavelet transform (DWT) – instead of colour, shape and texture features and (iii) for pest classification, a back-propagation neural-network (BPNN).
Pratheepa et al. (Reference Pratheepa, Verghese and Bheemanna2016) used Shannon's information theory (SIT) to find significant factors that affect H. armigera incidence. The results showed that correlation analysis revealed that crop stage is negatively correlated with pest population, which is true because the H. armigera population started to increase when the crop was in an earlier stage of fruiting and boll formation, and started to decline when the crop was in boll-bursting stage. The crop stage, followed by the number of rainy days in a week and relative humidity, were crucial in the pest population fluctuation, which also had seasonal effects. In addition, they found that SIT is more suitable to find significant factors, in pest surveillance data, rather than regression analysis.
To evaluate the severity of mealybug, Singh et al. (Reference Singh, Dutta and Dharaiya2016) developed a model to map mealybug damage using remote-sensing indices. They used multiple linear regression for data analysis and evaluated the relationship between spectral vegetation indices (SVIs) and severity index. These two indices had a huge correlation between healthy and mealybug-infested cotton.
Ranjitha et al. (Reference Ranjitha, Srinivasan and Rajesh2014) used Pearson correlation to predict thrips damage. They determined the correlation between canopy reflectance and SVIs. Recently, Alves et al. (Reference Alves, Souza and Borges2020) used convolutional neural networks (CNNs) to classify 13 insect pests (e.g. H. armigera, Aphis gossypii, A. grandis, etc.). They used a modified deep residual learning (RestNet34*). RestNet34* improved the accuracy of other algorithms: local binary patterns with support vector machine (LBP-SVM), AlexNet, ResNet34 and ResNet50.
The distribution of the reviewed papers according to whether they used the classification algorithms, image segmentation or a combination of both is shown in Table 4. Seven papers focused on insect-pest classification (the majority). For image classification, the AI techniques used were based on artificial neural networks (ANNs), regression and rules. Finally, two papers studied image segmentation.
Table 4. Use of AI for insect-pest management in cotton according to the problem of classification or segmentation

ANN, artificial neural networks.
Diseases
To detect Phyllosticta gossypina, Zhang et al. (Reference Zhang, Kong, Wu, Han and Zhai2018) proposed an active-contour model (ACM) – based on a global gradient and local information – to detect the disease from images. ACM was more accurate in segmentation – and with lower running time – than geodesic active contour, chan-vese and local binary fitting. In a complex background, ACM can segment the leaves of cotton with uneven illumination, shadow and fuzzy edges. The results showed that ACM is the most suitable for the segmentation of diseased leaves under natural conditions.
Rothe and Rothe (Reference Rothe and Rothe2019) used another technique in image segmentation to detect bacterial leaf blight, Myrothecium and Alternaria. They used Otsu's segmentation to capture the image of a diseased leaf in such a way that its background is kept intact. This allowed the separation of the spot from the underlying organic background of the leaf. In the stage of classification, they used a BPNN. The accuracy of the classification was 97.14% for Alternaria, 93.3% for bacterial blight and 96% for Myrothecium.
Patil and Zambre (Reference Patil and Zambre2014) also used Otsu's segmentation, but their research focused on cotton-leaf spot classification. They also used other techniques in the process: (i) for image segmentation, global threshold, variable threshold and Otsu’ segmentation for an automatic threshold; (ii) for feature extraction, features of diseased leaf spot; (iii) for shape feature extraction, general descriptors such as the number of the object, area of the shape object, width and length of the object and area of the image. They used the SVM as the classification algorithm. For the classification, they determined that the morphology and the colour of leaf spots were very important because it provided critical information on the visual representation of the disease.
To detect bacterial blight, Alternaria, and root rot, Prashar et al. (Reference Prashar, Talwar and Kant2017) created an automatic cotton-crop disease-recognition method using the different invariant feature descriptors and SVM. In the pre-processing of the images, all the images were standardized by resizing them to the same size. After, the images were converted into two-dimensional images, using a grey-scale conversion, and a Gaussian filter was used for noise removal of the grey-scale images. As a feature descriptor, the histogram of oriented gradients (HOG) was used. Finally, for classification, they used SVM with 85% accuracy.
Another study, by Sarangdhar and Pawar (Reference Sarangdhar and Pawar2017), included SVM to classify five cotton leaf diseases (bacterial blight, Alternaria, grey mildew, Cercospora and fusarium wilt). The main steps for detection were: (i) image acquisition; (ii) pre-processing (the images were resized, and the noise was removed); (iii) segmentation (colour transformation and threshold were used to extract from the region of interest of the lesion region); (iv) feature extraction (colour and texture features were extracted using partial least-square regression (PLSR)) and (v) classification (SVM regression with Gaussian kernel). The overall classification accuracy was 83.26%.
For the detection of ramularia leaf blight, Xavier et al. (Reference Xavier, Souto, Statella, Galbieri, Santos, Suli and Zeilhofer2019) used multispectral classifications, with four classifiers, in Waikato environment for knowledge analysis software: (i) multinomial logistic regression (MLR), (ii) multinomial logistic regression with boosting (MLRb), (iii) SVM and (iv) random forest (RF). Xavier et al. (Reference Xavier, Souto, Statella, Galbieri, Santos, Suli and Zeilhofer2019) focused on the application of different algorithms to minimize the possibility that the obtained performance of infection level may be caused by the specifications of a single classifier. The MLR used a linear-predictor function and required small training data to estimate the parameters for classification. SVM was adjusted to nonlinear class predictors and performed well in the multi-spectral remote-sensing classification. In addition, the results showed that the other two approaches – MLRb and RFT – were affected more by overfitting of training data or higher amounts of training data demanded: MLRb because of its underlying boosting and RF because it was an ensemble approach based on bootstrap aggregating (bagging).
To map cotton root rot, Yang et al. (Reference Yang, Odvody, Fernandez, Landivar, Minzenmayer and Nichols2014) evaluated (i) iterative self-organizing data analysis (ISODATA) unsupervised classification applied to multi-spectral images, (ii) unsupervised classification applied to normalized difference vegetation index (NDVI) and (iii) two supervised-classification techniques, BPNN and SVM. Images were taken from airborne multi-spectral imagery. All methods appeared to be equally effective and accurate, for the detection of cotton root rot, for site-specific management of this disease. Especially, the NDVI-based classification can be easily implemented without the need for complex image processing capabilities. Results demonstrated that ISODATA applied to multi-spectral imagery (94%), NDVI combined with unsupervised classification (94.5%) and the supervised classifiers (BPNN (95.5%) and SVM (95%)) are all effective to detect root rot.
Yang et al. (Reference Yang, Odvody, Thomasson, Isakeit and Nichols2016) used multispectral imaging to detect consistency and changes, in cotton root rot disease, for 10 years. They used ISODATA for root rot classification. The result showed that NDVI-based ISODATA classification appears to be a simple and effective method to generate root rot infection maps.
Similarly, Song et al. (Reference Song, Yang, Wu, Zhao, Yang, Hoffmann and Huang2017) classified the root rot with ISODATA, with the minimum spectral distance to group each pixel into a class, based on the four spectral bands (e.g. red-green-blue (RGB) and near-infrared (NIR)) and the NDVI combination.
For automatic detection of alternaria leaf spot, grey mildew and rust foliar, Usha Kumari et al. (Reference Usha Kumari, Arun Vignesh, Panigrahy, Ramya and Padma2019) created an automatic disease detection for the three diseases. Usha Kumari et al. used the k-means clustering algorithm for disease image segmentation of the cotton leaf. The diseased cluster was segmented into three clusters. From each cluster, the features mean, contrast, energy, correlation, standard deviation, variance, entropy and kurtosis were extracted. The extracted features were given to a BPNN and an SVM for classification. The performance of these classifiers was compared, and the following results were obtained: The alternaria leaf spot disease was classified 77.4% for BPNN and 84.3% for SVM; grey mildew disease was 87.8% for BPNN and 98.7% for SVM; rust foliar fungal disease was 90.1% for BPNN and 93.2% for SVM. The overall average accuracy of the BPNN classifier was 85.1% and for SVM was 92.06%. SVM classifiers gave more accurate disease detection than BPNN.
To identify bacterial blight, two articles were based on k-means clustering: Dumare and Mungona (Reference Dumare and Mungona2017) used k-means for image segmentation and SVM for classification; and Pagariya and Bartere (Reference Pagariya and Bartere2014) used k-means to identify the disease. To identify different diseases, Rastogi and Solanki (Reference Rastogi and Solanki2015) developed an expert system with a fuzzy inference to identify the diseases at an early stage. The classification serves at two levels: (i) classification and grouping of disease, having the same causing agents – such as viruses, bacteria and fungi – based on a feature vector extraction and (ii) reclassification based on SVM.
To diagnose 21 cotton diseases, Toseef and Khan (Reference Toseef and Khan2018) proposed a fuzzy inference system for the diagnosis of crop diseases. The system diagnosed the main diseases of cotton and wheat. Twenty-one diseases (e.g. bacterial blight, leaf curl, root rot, verticillium wilt and anthracnose) were diagnosed with 99% of accuracy. Toseef and Khan (Reference Toseef and Khan2018) had three main reasons to apply fuzzy logic for decision-making: (i) rules are derived from expert knowledge and described in natural language; (ii) fuzzy logic is a powerful knowledge representation mechanism for linguistic knowledge and (iii) fuzzy logic handles the vagueness and uncertainty inherent in the problem domain, which is not handled by classical set theory. Seventy-three inference rules were built for decision-making.
To detect bacterial blight, fusarium wilt, leaf blight, root rot, micro-nutrient and verticillium wilt diseases, Revathi and Hemalatha (Reference Revathi and Hemalatha2014) proposed a new feature extraction method using enhanced particle swarm optimization (EPSO) with skew-divergence. The obtained features were classified using SVM, BPNN and fuzzy classifiers. The accuracy was of 91, 93 and 94% for SVM, BPNN and fuzzy, respectively. The results showed higher accuracy when EPSO is combined with fuzzy classifiers.
To predict anthracnose and grey mildew diseases, Chopda et al. (Reference Chopda, Raveshiya, Nakum and Nakrani2018) used temperature sensors and soil-moisture sensors. They used a decision-tree (DT) classifier because it is a simple classification technique that implies a set of questions about the attributes of the test data set. The results showed that the system can predict the disease with parameters such as temperature and soil moisture, based on the previous year data.
Recently, Caldeira et al. (Reference Caldeira, Santiago and Teruel2021) used CNN (GoogleNet and Resnet50 with 86.6 and 89.2% of accuracy, respectively) for cotton disease classification. The results were better for the processing of images compared with traditional approaches such as SVM, KNN, ANN and neuro-fuzzy. Liang (Reference Liang2021) also used CNNs (Vgg, DesenNet, ResNet and S-DesneNet). These CNNs were optimized with the spatial structure optimizer (SSO). The result showed more accuracy in classification in small samples.
To detect the diseases, the authors of the reviewed papers focused on classification, image segmentation or feature extraction (see Table 5). Ten papers focused on disease classification. Six papers combined image segmentation and classification. One paper combined classification and feature extraction. Among the AI techniques used, those based on SVMs and ANNs were the most used. Regarding image segmentation, all the works used k-means.
Table 5. Type of problem to solve v. AI techniques (ANNs, rule-based, regression, clustering, SVM, DT or gradient-based) to detect cotton diseases

Summary
Many AI techniques were used to detect cotton diseases and insect pests. Such AI techniques allowed an automatic detection by crop symptoms, environmental conditions or physical characteristics of the pest or disease. Particularly, it was found that the articles focused on classification algorithms, image segmentation and feature extraction. The classification algorithms that stood out most for their results were CNNs, ISODATA, BPNN, fuzzy inference and SVMs, the latter more frequently (see Fig. 3). For segmentation, algorithms such as ACM, MWT and Otsu's segmentation were used (Fig. 3). And, finally, for feature extraction, DWT, EPSO, HOG, and PLSR were used in equal proportion (Fig. 4).

Fig. 3. AI techniques used for the classification and image segmentation of cotton diseases and insect pests. AC, active contour model based on global gradient and local information; MCWT, marker-controlled watershed transformation; ISODATA, iterative self-organizing data analysis; SVM, support vector machine; BPNN, back-propagation neural-network; CNN, convolutional neural networks.

Fig. 4. Image feature-extraction algorithms of cotton diseases and insect pests. HOG, histogram of oriented gradients; PLSR, partial least square regression; DWT, discrete wavelet transform; EPSO, enhanced particle swarm optimization.
Some reviewed papers made comparisons of different algorithms. Revathi and Hemalatha (Reference Revathi and Hemalatha2014) found that EPSO for feature extraction, and SVM or BPNN for classification, work best. Yang et al. (Reference Yang, Odvody, Fernandez, Landivar, Minzenmayer and Nichols2014) compared four classification algorithms (ISODATA applied to multispectral imagery, NDVI combined with unsupervised classification and two supervised classifiers (BPNN, SVM)) with very close results. Usha Kumari et al. (Reference Usha Kumari, Arun Vignesh, Panigrahy, Ramya and Padma2019) found that k-means for image segmentation and SVMs for classification gave better results than k-means for image segmentation and BPNN for classification. Xavier et al. (Reference Xavier, Souto, Statella, Galbieri, Santos, Suli and Zeilhofer2019) evaluated the classification algorithms MLR, MLRb, SVMs and RFT, obtaining similar results. The most used technique was SVM (26%), outperforming BPNN (11%) (see Fig. 3). Nonetheless, in 2021, CNNs got the best performance (Caldeira et al., Reference Caldeira, Santiago and Teruel2021; Liang, Reference Liang2021).
Sensing techniques used for the detection of pests and diseases
This section describes sensing techniques, used to detect diseases and insect pests, on cotton.
Cameras
Cameras were used alone or through platforms such as satellites, aircraft or unmanned airborne vehicles (UAVs). The details are presented below.
Without platform
To detect P. gossypina, Zhang et al. (Reference Zhang, Kong, Wu, Han and Zhai2018) proposed an automatic segmentation of a diseased leaf, to improve the image-segmentation performance of cotton leaves in a natural environment. They used a digital single-lens reflex (DSLR) camera with a Canon electro-optical system.
Satellite
To evaluate mealybug severity, Singh et al. (Reference Singh, Dutta and Dharaiya2016) evaluated the relationship between mealybug severity and remote-sensing indices. The authors used Landsat TM5 satellite images with spectral bands RGB, NIR, shortwave infrared and thermal. The mealybug-infested cotton crop had a significantly lower reflectance (33%) in the NIR region, and higher (14%) in the visible range of the spectrum, when compared with the non-infested cotton crop, having NIR of 48% and visible-region reflectance of 9%. These results indicate that remote sensing has the potential to distinguish damage by mealybug and quantify its abundance in cotton.
Unmanned airborne vehicle
To detect ramularia leaf blight, Xavier et al. (Reference Xavier, Souto, Statella, Galbieri, Santos, Suli and Zeilhofer2019) used multispectral imagery from an UAV. The camera captured wavelengths of 520–600 nm (green band), 630–690 nm (red band) and 760–900 nm (NIR band). The camera was on an UAV with flight heights of 100, 300, 500 and 700 m. This type of imaging helped to detect the disease; however, the images were not sufficient to differentiate finer-scaled disease severity levels. The results show that a camera with a higher resolution is needed to improve the disease classification.
Aircraft
Yang et al. (Reference Yang, Odvody, Thomasson, Isakeit and Nichols2016) used multispectral imaging to detect consistency and changes, in the root rot disease, over 10 years (2002–2012). Firstly, the authors used cameras in three bands: green (555–565 nm), red (625–635 nm) and NIR (845–857 nm). Later, they used cameras in four spectral bands: blue (430–470 nm), green (530–570 nm), red (630–670 nm) and NIR (810–850 nm). Finally, the authors used an RGB camera and NIR (720 nm). All images were acquired from an aircraft at an altitude of 3050 m. Results demonstrated that root rot tends to occur in the same general areas within fields in recurring years, even though variations in infection patterns exist over the years.
To identify root rot, Song et al. (Reference Song, Yang, Wu, Zhao, Yang, Hoffmann and Huang2017) used two methods for image acquisition – airborne multispectral imagery and satellite imagery – to identify infested areas. In the first case, they used two Nikon D810 digital complementary metal–oxide–semiconductor cameras. One camera was used to capture RGB images, and the other camera captured NIR images. Airborne images were taken at an altitude of 3050 m. Both cameras simultaneously and independently captured images. For the satellite imagery, they used the Sentinel-2A in the bands RGB and NIR. The authors assessed the potential of 10-m Sentinel-2A satellite imagery for root rot detection and compared it with airborne multispectral imagery. Accuracy assessment showed that the classification maps from the Sentinel-2A imagery were better than the airborne-image classification. However, they found some small root-rot areas were undetectable, and some non-infested areas within large root-rot areas were incorrectly classified as infested due to the images' coarse spatial resolution. These results demonstrate that freely-available Sentinel-2 imagery can be used as an alternative data source for identifying root rot and creating prescription maps for site-specific management.
Sensors
Three types of sensors were used: field sensors, spectroradiometer and microscope. In what follows, we explain each type.
Field sensors
To detect bacterial blight, Alternaria, grey mildew, Cercospora and fusarium wilt, Sarangdhar and Pawar (Reference Sarangdhar and Pawar2017) used image acquisition, environment temperature sensors, humidity sensors, soil-moisture sensors and water sensors to detect and control diseases in cotton. A Nikon camera (non-specified model) captured RGB images. Environmental temperature sensors, humidity sensors and moisture sensors were used to monitor the soil. A water sensor was used to monitor the water level of a pesticide tank. The results showed that, with timely detection and permanent monitoring, cotton production can be improved.
To predict anthracnose and grey mildew, Chopda et al. (Reference Chopda, Raveshiya, Nakum and Nakrani2018) used environment temperature sensors and soil-moisture sensors. The results showed that the system can predict cotton-crop diseases with temperature, soil moisture, based on the previous year data. In the same way, Shahzadi et al. (Reference Shahzadi, Ferzund, Tausif and Asif2016) used sensors to determine the conditions that favour the appearance of whitefly, thrips, jassid and pink bollworm. Soil sensors collected data on soil conditions, soil moisture, soil content and leaf-wetness sensors. In addition, weather sensors collected data about humidity and temperature.
Finally, Pratheepa et al. (Reference Pratheepa, Verghese and Bheemanna2016) used data mining to find the significant factors that affect the incidence of the pest H. armigera. The authors considered for the analysis, as incidence factors, the crop stage of the cotton, season and abiotic factors such as maximum temperature, minimum temperature, morning relative humidity, evening relative humidity, rainfall and number of rainy days in a week. The results showed that among all the factors, crop stage played a major role, followed by the number of rainy days in a week, and relative humidity, for the insect pest incidence.
Spectroradiometer
To detect and estimate the damage caused by T. tobacco (Lind), Ranjitha et al. (Reference Ranjitha, Srinivasan and Rajesh2014) used a spectroradiometer, from 70 to 90 days, after sowing. Canopy reflectance was recorded and SVIs were estimated. The hyper-spectral radiometer recorded the spectral reflectance in blue (450–520 nm), green (520–590 nm), red (620–680 nm) and NIR (770–860 nm), at 30 cm above the cotton canopy. The results showed that the reflectance decreased in NIR, while RGB reflectance increased compared to undamaged plants. Red band (at wavelengths 691 and 710 nm) and green-red vegetative index were found to be more sensitive to thrips damage. The sensitivity curve shows a single peak in the blue region (at about 496 nm), which is characteristic of the thrips damage.
To determine a whitefly infestation, Nigam et al. (Reference Nigam, Kot, Sandhu, Bhattacharya, Chandi, Singh, Singh and Manjunath2016) determined the relation of the infestation with and biotic stress with remote sensors. They used a spectroradiometer with different sampling intervals across the spectral region of 350–2500 nm at 1 nm. Chlorophyll concentration was measured to determine the relationship between whitefly infestation damage severity and chlorophyll concentration. A whitefly-infested cotton crop showed a low-reflectance value between 350–1335 nm and 1526–1769 nm. Whitefly-infested leaf-tissue was damaged and reflectance, in NIR, also went down drastically compared to healthy plants.
Microscope
To detect bacterial leaf blight, myrothecium and alternaria present, Rothe and Rothe (Reference Rothe and Rothe2019) used a DSLR camcorder and Leica Wild M3C microscope in natural situations.
Summary
Sensing techniques were used to detect cotton diseases and insect pests. These techniques allowed capturing information of crop symptoms, environmental conditions or physical characteristics of the insect pest or disease. Sensing techniques captured (i) images and (ii) environmental conditions. In the case of the images, multi-spectral cameras, DSLR cameras, spectroradiometers and microscopes were used (Ranjitha et al., Reference Ranjitha, Srinivasan and Rajesh2014; Yang et al., Reference Yang, Odvody, Thomasson, Isakeit and Nichols2016; Rothe and Rothe, Reference Rothe and Rothe2019).
In the case of the cameras, most were installed in UAVs with a flight altitude between 100 and 700 m, aircrafts with a flight altitude of 3050 m or satellites of low Earth orbit at an altitude of 705 km for Landsat TM5 and 786 km for Sentinel-2A. Cameras, in 38% of the articles, were the most used in the detection of diseases and insect pests in cotton.
In the case of in-situ sensors, environment-temperature sensors, humidity sensors, soil-moisture sensors, leaf-wetness sensors and water sensors were used (Nigam et al., Reference Nigam, Kot, Sandhu, Bhattacharya, Chandi, Singh, Singh and Manjunath2016; Sarangdhar and Pawar, Reference Sarangdhar and Pawar2017). In the selected studies, it was demonstrated that with low-cost sensors, it was possible to take enough information to make predictions of insect pests or diseases. The detection techniques that were used in the selected papers include cameras, soil moisture sensors, temperature sensors, water sensors, humidity sensors, leaf wetness sensors, spectroradiometers and microscopes (see Fig. 5).

Fig. 5. Sensing techniques used to detect insect pests or diseases in cotton.
Discussion
In this study, we have systematically searched the scientific literature, from 2014 to 2021, to establish the state-of-the-art on management (detection, diagnosis, etc.) of diseases and insect pests in cotton. Many AI algorithms were used to detect cotton diseases and insect pests. AI algorithms allowed an automatic detection of crop symptoms, environmental conditions or physical characteristics of the pest or disease.
AI algorithms
Regarding AI algorithms, it was found that articles focused on classification algorithms, image segmentation and feature extraction. The classification algorithms that stood out most for their results were CNNs, ISODATA, BPNN, fuzzy inference and SVM – the latter most frequently. For segmentation, algorithms, ACM, MCWT and Otsu's segmentation were used. Finally, for feature extraction, DWT, EPSO, HOG and PLSR were equally used.
HOG focuses on the structure or the shape of an object. HOG + SVM gave better results than scale-invariant feature transform + SVM or than spectral asymmetry index + SVM. PLSR is often used when there are a lot of explanatory variables, possibly correlated. A key advantage of DWT is that it has temporal resolution: DWT captures both frequency and location in timed information. Regarding EPSO, it has several advantages such as simplicity, convergence speed and robustness.
More recent works have focused on the use of CNN, which has led to greater accuracy in the classification of pests and diseases (Caldeira et al., Reference Caldeira, Santiago and Teruel2021; Liang, Reference Liang2021). The results were better compared with traditional approaches for the processing of images. The main disadvantage is that CNN can, sometimes, take much longer to train (Kamilaris and Prenafeta-Boldú, Reference Kamilaris and Prenafeta-Boldú2018). To solve this, Liang (Reference Liang2021) used SSO on the training process, in different architectures (including Vgg, DesenNet, and ResNet and S-DesneNet), in small samples.
Insect-pest detection techniques
The most investigated insect pest was the whitefly, followed by thrips and pink bollworm (see Fig. 6). The sensors that were used for the whitefly were spectroradiometers, soil-moisture sensors, temperature sensors, humidity sensors and leaf-wetness sensors. In the case of thrips, in addition to the sensors used with whitefly, satellites were used. These insect pests have been the most studied because they have the capacity to infest several crops; for instance, cotton, rose, soybean, corn, pepper, tomato and lettuce. The degree of infestation is rapid, for example, the whitefly can lay 130 eggs (Boissard et al., Reference Boissard, Martin and Moisan2008), which is why early detection of this pest is important. Image recognition was mainly used, but the analysis of environmental conditions was also important to discriminate biotic stress (Nigam et al., Reference Nigam, Kot, Sandhu, Bhattacharya, Chandi, Singh, Singh and Manjunath2016) that can encourage the appearance of insect pests; for instance, this is the case of the whitefly which develops rapidly in warm weather.
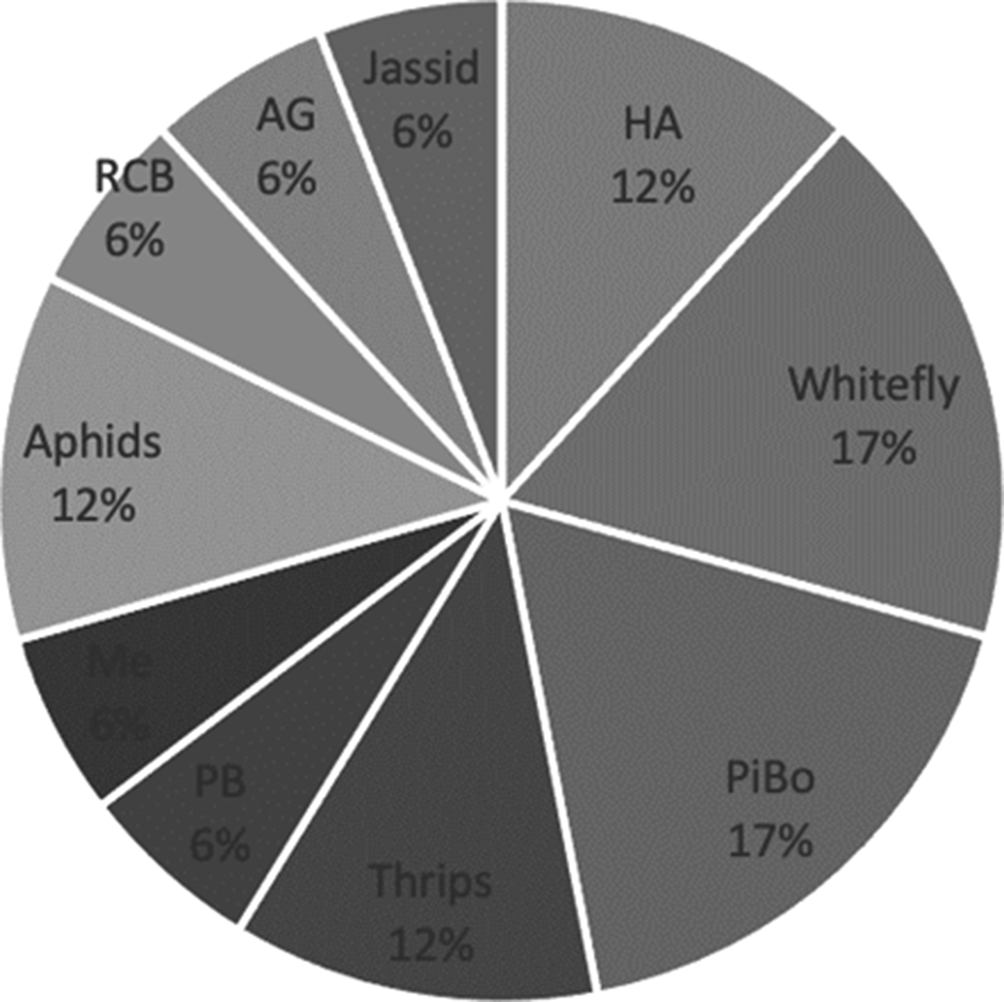
Fig. 6. Insect pests for cotton that were studied in the reviewed papers. HA, Helicoverpa armigera; WF, whitefly; PiBo, pink and American bollworm; PB, pod borer; RCB, red cotton bug; AG, Anthonomus grandis; mealybug, Me.
According to the AI problem, whether it was classification, image segmentation or feature extraction, the authors combined image sensing or field sensing techniques to detect insect pests in cotton (see Table 6). Two papers used field sensors to classify insect pests and four papers used images. Other papers focused on AI techniques for other tasks (segmentation and feature extraction) and did not describe the sensing techniques (N/A means that sensing techniques were not available).
Table 6. Sensing techniques and AI problems to detect insect pests in cotton

Sensing technique for images: cameras or spectroradiometers; mainly cameras.
N/A, not available.
Disease-detection techniques
The most investigated diseases were root rot using cameras (see Fig. 7), followed by bacterial blight using sensors. The sensors that were used to detect the bacterial blight were soil-moisture sensors, temperature sensors, humidity sensors, cameras, microscopes and water sensors (Pagariya and Bartere, Reference Pagariya and Bartere2014; Sarangdhar and Pawar, Reference Sarangdhar and Pawar2017; Toseef and Khan, Reference Toseef and Khan2018; Rothe and Rothe, Reference Rothe and Rothe2019). The research studies were, mainly, conducted in disease recognition. For this purpose, the authors used close-up images of diseased leaves of cotton captured with cameras (Revathi and Hemalatha, Reference Revathi and Hemalatha2014; Zhang et al., Reference Zhang, Kong, Wu, Han and Zhai2018; Rothe and Rothe, Reference Rothe and Rothe2019). Cameras were mounted on aircrafts, satellites or UAV platforms, to capture images of entire fields of cotton, to make prescription maps or monitor diseases, in cotton (Yang et al., Reference Yang, Odvody, Thomasson, Isakeit and Nichols2016; Song et al., Reference Song, Yang, Wu, Zhao, Yang, Hoffmann and Huang2017; Xavier et al., Reference Xavier, Souto, Statella, Galbieri, Santos, Suli and Zeilhofer2019).
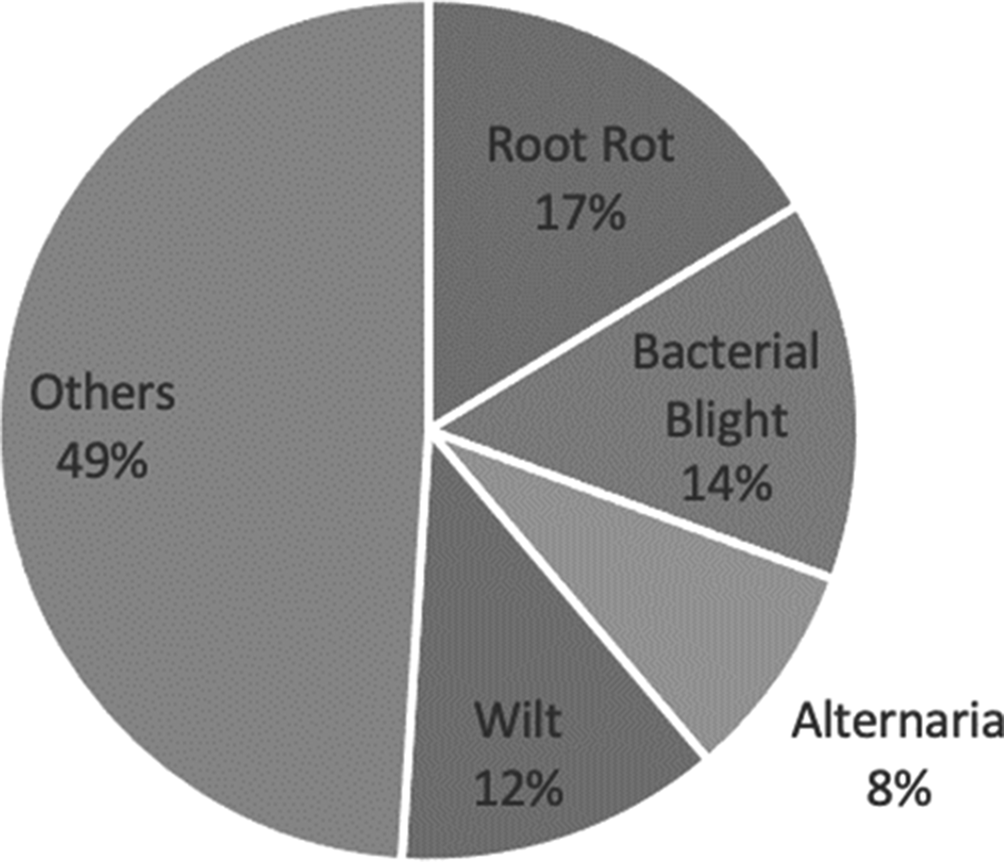
Fig. 7. Diseases for cotton that were studied in the reviewed papers.
The reviewed papers were classified according to the AI problem and the sensing techniques to detect diseases (see Table 7). Most studies used classification with images and some with field sensors. For the combination of classification and image segmentation, mainly cameras or microscopes (images) were used. Only two papers used field sensors, one of which supplemented it with cameras.
Table 7. Sensing techniques and AI problems to detect diseases in cotton

The image sensing techniques used cameras or microscopes, mainly cameras.
N/A, not available.
Trends in the reviewed articles
The main results from the selected articles are summarized in Fig. 8. In the upper part, we can note from left to right aspects such as: (i) AI tasks, (ii) the most used AI techniques, (iii) the most researched pest and disease in cotton and (iv) the sensing techniques (for detection). The width of the nodes and their links is proportional to the number of reviewed articles in each of the categories. Different colours were used in the links, to facilitate the visualization of the connections. Overall, there was more research on diseases compared to insect pests for cotton. For diseases and insect pests, the AI tasks were classification, image segmentation and feature extraction. SVM and fuzzy inference were widely used for disease classification, and k-means was used for image segmentation of diseases and insect pests. The images were taken with microscopes, spectroradiometers and cameras – the latter most frequently. Finally, regarding sensing techniques, soil-moisture sensors, humidity sensors and temperature sensors were frequently used in combination, for both, diseases and insect pests.

Fig. 8. Trends in the reviewed articles are divided into diseases and insect pests, AI techniques and sensing techniques. Clas, classification task; FeaExt, feature extraction task; ImgSeg, image segmentation task; AI techniques (ISODATA, iterative self-organizing data-analysis technique algorithm; SVM, support vector machine; fuzzy, fuzzy logic; KM, k-means; BPNN, back-propagation neural-network; CNN, convolutional neural networks; OFeaExt, others feature extraction algorithms); pest (WF, whitefly; PiBo, pink bollworm); disease (Rot, root rot; Ramularia, ramularia leaf blight; BB, bacterial blight; GreyM, grey mildew); sensing techniques (SoMoS, soil-moisture sensor; TeS, temperature sensor; WaS, water sensor; HuS, humidity sensor; LeWeS, leaf-wetness sensors; Spect, spectroradiometer).
Comparison of the results with respect to previous SLRs
Same as this SLR, Patrício and Rieder (Reference Patrício and Rieder2018) found that the SVM classifier was the most used with good results. In addition to SVM, Iqbal et al. (Reference Iqbal, Khan, Sharif, Shah, ur Rehman and Javed2018) found neural networks as the most used for classification. Patrício and Rieder (Reference Patrício and Rieder2018) worked in precision agriculture for grain crops and Iqbal et al. worked in the detection of citrus-plant diseases. Iqbal et al. also found that k-means clustering performs well for image segmentation. Regarding remote sensing, Zhang et al. (Reference Zhang, Huang, Pu, Gonzalez-Moreno, Yuan, Wu and Huang2019) found studies that used hyperspectral and multispectral systems to monitor plant diseases and pests.
In the papers reviewed by Patrício and Rieder (Reference Patrício and Rieder2018), they found that deep learning has been used for the detection of some stored-grain insects, while Iqbal et al. (Reference Iqbal, Khan, Sharif, Shah, ur Rehman and Javed2018) found that deep learning has been used for the detection of some citrus-fruit diseases. Regarding remote sensing, Zhang et al. (Reference Zhang, Huang, Pu, Gonzalez-Moreno, Yuan, Wu and Huang2019) found studies that used fluorescence and thermal systems, synthetic aperture radar and light detection and ranging equipment. It is worth noting that, Zhang et al. did not include studies with in-situ sensors like this SLR.
Limitations of the selected papers
The limitations of the papers selected according to the research questions in this SLR are described below.
Limitations of AI to manage diseases and insect pests in cotton
AI has contributed to the development of agriculture, in pest and disease management, and specifically, to detect and diagnose diseases and insect pests in cotton. AI allows detecting diseases and insect pests in, timely, quickly and with more precision (Xia et al., Reference Xia, Chon, Ren and Lee2014; Khattab et al., Reference Khattab, Habib, Ismail, Zayan, Fahmy and Khairy2019). To harvest a high cotton yield, it is very important the integrated management of diseases and insect pests (Anees and Shad, Reference Anees and Shad2020; Chohan et al., Reference Chohan, Perveen, Abid, Nouman and Sajid2020). Despite the importance of insect pest and disease monitoring with AI, there are few works with neural networks, deep learning, deep residual learning and no work on meta-cognition, which have been used successfully in other studies (Cheng et al., Reference Cheng, Zhang, Chen, Wu and Yue2017; Li et al., Reference Li, Wang, Dang, Sadeghi-Niaraki and Moon2020; Shi et al., Reference Shi, Zhai, Liu, Jiang and Gao2020). Finally, no works include simultaneously diseases and insect pests.
Limitations of sensing techniques to detect diseases and insect pests
Remote sensing has allowed us to obtain monitoring data, in real-time, of diseases and insect pests (Singh et al., Reference Singh, Dutta and Dharaiya2016). This allows us to provide an overview for large areas using, for example, satellites, airplanes and UAV platforms (Ranjitha et al., Reference Ranjitha, Srinivasan and Rajesh2014; Song et al., Reference Song, Yang, Wu, Zhao, Yang, Hoffmann and Huang2017; Xavier et al., Reference Xavier, Souto, Statella, Galbieri, Santos, Suli and Zeilhofer2019). In-situ sensors allow obtaining data, in real-time, of environmental variables (e.g. temperature, humidity, moisture) (Pratheepa et al., Reference Pratheepa, Verghese and Bheemanna2016; Chopda et al., Reference Chopda, Raveshiya, Nakum and Nakrani2018). However, only one study tried data fusion and included computer vision with cameras and in-situ sensors to measure simultaneously soil moisture, temperature, humidity and water (Sarangdhar and Pawar, Reference Sarangdhar and Pawar2017). The combination of a larger set of sensor data can increase the accuracy and truthfulness of the data. There was no research that combined sensors, AI and pheromone traps for boll weevil. There are also no studies, on the presence of the cotton boll weevil in post-harvest, which take into account that boll weevil takes refuge for a long period during post-harvest.
Future research trends
In this review, we found that many AI and sensing techniques were used in the selected articles. For future research, however, there are different challenges due to the need to use data to make better decisions on the treatment of diseases and insect pests, with the possibility of anticipation of an outbreak. These challenges are summarized in the next sessions.
Develop predictive models to know when and where the diseases and insect pests attack
This challenge represents the opportunity to work with the prediction of diseases and insect pests simultaneously, using new techniques of prediction. Previous research did not deal, specifically, with both at the same time.
Implement prescriptive models to define how to control diseases and insect pests
The prescriptive models help to determine what needs to be done to attack diseases and insect pests. The prescriptive models define what activities and tasks are necessary to do when this type of problem appears in cotton. These models are important because they will allow the farmer to know what to do.
Make a smart pheromone traps system to predict the spread of pests
A smart pheromone traps system must define two aspects: firstly, determine how the pest spread; secondly, where to put geo-spatially the traps. This way, the system has the prediction task and also self-defines where put the traps. None of the previous systems did this simultaneously.
Develop diagnostic disease models
The diagnostic models allow defining the causes of the disease. This is important for those who make the decisions because might attack the causes to solve the problem. Iqbal et al. (Reference Iqbal, Khan, Sharif, Shah, ur Rehman and Javed2018) and Zhang et al. (Reference Zhang, Huang, Pu, Gonzalez-Moreno, Yuan, Wu and Huang2019) found some papers of detection and diagnosis for other crops, but not for cotton.
Make multi-detection models of diseases or pest attacks
This challenge includes multi-label techniques using labels related to diseases and insect pests (Araujo et al., Reference Araujo, Aguilar and Aponte2003). This technique allows detecting, simultaneously, if there are pests and diseases.
Define a cotton-crop management system using a cognitive-computing architecture
No articles dealt with cognitive computing. In previous reviews, only (Boissard et al., Reference Boissard, Martin and Moisan2013) found one study where cognitive vision was used for pest detection. One challenge is the use of cognitive computing to manage cotton better. According to Crowder and Friess (Reference Crowder and Friess2011), metacognition and metamemory allow AI systems to reason and adapt to the situation with self-awareness. Meta-learning facilitates the selection of appropriate AI algorithms, or adjusts them according to the task (Grąbczewski, Reference Grąbczewski2014). Meta-reasoning gives systems the ability to reason, deliberate and self-optimize a decision-making process to produce effective action on time (Russell and Wefald, Reference Russell and Wefald1991; Svegliato and Zilberstein, Reference Svegliato and Zilberstein2018).
Select the most useful variables
All challenges that have been described need to establish the right variables for each model. These features can be used to improve the performance of machine-learning algorithms. The stress in crops may be generated by variables such as climatic conditions, pest damage and diseases, and the study and selection of the right variables can be complex (Ranjitha et al., Reference Ranjitha, Srinivasan and Rajesh2014; Yang et al., Reference Yang, Odvody, Fernandez, Landivar, Minzenmayer and Nichols2014). It is needed to analyse which variables are most useful for each knowledge model (Pacheco et al., Reference Pacheco, Rangel, Aguilar, Cerrada and Altamiranda2014; Jiménez et al., Reference Jiménez, Aguilar, Monsalve-Pulido and Montoya2021).
Develop smart sticky-traps for whitefly, aphids and thrips
As an example, the whitefly eggs have a length of about 0.2 mm. Xia et al. (Reference Xia, Chon, Ren and Lee2014) used sticky traps to take whitefly-egg samples in tomato crops. Nonetheless, in the articles analysed in this SLR, no sticky traps were used. These traps could be combined with AI in a similar manner as pheromone traps. These traps could be used for boll weevil (A. grandis Boheman), which affects cotton, in several countries (Neupert et al., Reference Neupert, Marciniak, Köhler, Nachman, Suh and Predel2018), but only one research was found related to the boll weevil and the use of AI for its detection (Alves et al., Reference Alves, Souza and Borges2020). Boissard et al. (Reference Boissard, Martin and Moisan2013) found one study with sticky traps, for whitefly and aphids, using video to record the insects flying.
Conclusions
AI techniques were employed mainly in the context of (i) image classification, (ii) image segmentation and (iii) feature extraction of images. These techniques were successfully used for insect pests and diseases for cotton. The most used sensors were cameras, and field sensors such as temperature and humidity sensors. Future work should apply knowledge models, combined with the Internet of Things, to monitor and control diseases and insect pests.
Acknowledgements
The authors thank the anonymous reviewers for their insights, comments and suggestions.
Author contributions
J. Aguilar, M. Toro, M. Caro and R. Toscano-Miranda conceived and designed the study. J. Aguilar, M. Toro, M. Caro and R. Toscano-Miranda conducted data gathering. J. Aguilar, M. Toro, M. Caro, A. Marulanda, A. Trebilcok and R. Toscano-Miranda performed statistical analyses. J. Aguilar, M. Toro, M. Caro, A. Marulanda, A. Trebilcok and R. Toscano-Miranda wrote the article.
Financial support
This work was supported by the Colombian Science, Technology and Innovation Fund (FCTeI) of the General Royalty System (SGR); Universidad EAFIT and Universidad de Córdoba.
Conflict of interest
The authors declare there are no conflicts of interest.


