Molecular and machine learning approaches to study the impact of climatic factors on the evolution of cranberry fruit rot
 Khadijeh Aghel
 Benjamin Cinget
 Matteo Conti
  Caroline Labbé
 Richard R. Bélanger
- Centre de Recherche en Innovation des Végétaux, Département de Phytologie, Université Laval, Québec, QC, Canada
Introduction: Cranberry (Vaccinium macrocarpon) is an important crop grown in the United States and Canada, with the province of Québec being the world’s largest producer of organic cranberry. However, cranberry fruit rot (CFR), caused by 12 fungal species, has become a major issue affecting yield.
Methods: A molecular detection tool was used to detect the presence of the 12 CFR fungi and evaluate CFR species across three farms with different fungicide strategies in Québec. The incidence and frequency of CFR fungi were evaluated for 2020 and compared with 2018 data from the same farms in Québec. Machine-learning models were used to determine the possibility of explaining CFR disease and species based on climate, and analyze the effects of weather variables on CFR presence andprimary fungal species.
Results: The most predominant CFR species remained the same in both years, with Godronia cassandrae and Coleophoma empetri being the two most common, but some species showed changes in relative abundance. Furthermore, this study examined the diversity variations in 2018 and 2020, with data showing an overall increase in diversity over the period. The results showed that fungicide applications impacted the species composition of CFR among the farms. Five weather variables (daily snow on the ground (cm), total daily precipitation (mm), daily atmospheric pressure (kPa), daily relative humidity (%) and daily temperature (°C)) were selected and found to contribute differently to the model with atmospheric pressure being the most important. Surprisingly, temperature and precipitations did not influence much the incidence of fungal pathogen species and each CFR species behaved differently in response to environmental factors.
Discussion: Overall, this study highlights the complexity of predicting CFR disease, as caused by 12 fungi, and of developing effective disease management strategies for CFR.
Introduction
Large cranberry (Vaccinium macrocarpon, Ait.) is a member of the Ericaceae family, which also encompasses many other species, such as Scotch heather (Calluna vulgaris), Rhododendrons (Rhododendron spp.) and blueberries (Vaccinium augustifolium, V. corymbosum) (Freedman, 2023). Second to United States, Canada had a total annual output of 161,903 tons in 2020, accounting for 24% of world production (FAOSTAT Statistical database, 2021). In 2020, the provinces of Quebec (QC) and British Columbia (BC) alone accounted for almost 94% of the Canadian production.
Cranberry fruit rot (CFR) is a disease complex caused by several necrotrophic and hemibiotrophic fungi, which makes its diagnosis difficult based on symptoms (McManus, 2001). Today, nine symptomatic diseases caused by 12 different fungal species are commonly recognized (McManus, 2001). These diseases remain mostly asymptomatic until the fruit begins to mature in late August (Tadych et al., 2015). Fruit rot can result in 100% crop losses in some growing regions, making it one of the industry’s most critical challenges (McManus, 2001). The 12 main fungal pathogens that cause fruit rot belong to the taxonomic group Ascomycetes,and include: Allantophomoposis lycopodina (Höhn.) Carris, Allantophomopsis cytisporea (Fr.) Petr., Botryosphaeria vaccinii Shear, Colletotrichum fioriniae Marcelino & Gouli ex R.G. Shivas & Y.P. Tan (part of Colletotrichum acutatum species complex), Colletotrichum fructivorum V.P. Doyle, P.V. Oudem. & S.A. Rehner (part of Colletotrichum gloeosporioides species complex), Coleophoma empetri Rostr., Godronia cassandrae Peck, Monilinia oxycocci (Woronin) Honey, Phomopsis vaccinii Shear (teleomorph Diaporthe vaccinii; abbreviated in text as P. vaccinii), Phyllosticta vaccinii Earle (abbreviated in text as Phyl. vaccinii), Physalospora vaccinii (Shear) Arx & E. Müll. (Abbreviated in text as Phys. vaccinii) and Strasseria geniculata (Berk. & Broome) Höhn (Conti et al., 2022. Among the nine types of rot, black rot (BKR) and bitter rot (BIR), involve a complex of species. The BKR encompasses three species: A. cytisporea, A. lycopodina and S. geniculata. For its part, BIR is caused by two species, C. gloeosporioides and C. acutatum.
Cranberry fruit rot was initially described as a simple behavioral disease (Oudemans et al., 1998), which, if left untreated, progressed from one year to the next. Incidence and severity can vary among geographical regions and may change over time from one year to the next (Sabaratnam et al., 2014). According to Wells-Hansen and McManus (2017), in a survey conducted in New Jersey and Wisconsin over three years, the prevalence of CFR-causing pathogens may remain constant, increase, or decrease over time resulting in a tremendous temporal variation among seasons. In another study conducted to determine the variation within five species of CFR pathogens across four geographic regions over two years, the results showed that the geographical distribution of CFR species varied according to the region (Polashock et al., 2009). Similar observations were reported by Stiles and Oudemans (1999) on the spatio-temporal variations of the frequency and distribution of fruit-rotting fungi in New Jersey cranberry fields over three years. More recently, a large-scale study conducted in three different geographical areas in Quebec showed that the contribution of any given species to the disease complex of CFR differed among three farms (Conti et al., 2022). Depending on meteorological conditions, the concentration of spores in the atmosphere fluctuates (Troutt and Levetin, 2001). In addition, soilborne fungi are more abundant on wet-harvested fruits than on dry-harvested fruits but do not outgrow the pathogens responsible for CFR (McManus, 2001). Every biological process is impacted by temperature, and there is no exception for fungal diseases in their epidemiological stage. Temperature can influence fungal interactions, and the ability of fungi to grow varies at different temperatures. If the temperature is favorable for one fungus, the growth of another fungus may be affected (Contreras et al., 2022). Among the favorable conditions of pathogenic fungi, high humidity and elevated temperatures are general predictors (Romero et al., 2022). Many fungi that can cause CFR are settled in the beds and may pose a problem during bloom, especially if precipitations are persistent (Pscheidt and Ocamb, 2023).
The major problem encountered with abundance data is the selection of the most suitable model for explaining disease incidence. Ordinary linear regression models have two challenges considering that count data distributions are often positively skewed, with many observations with zero values and cannot be transformed into normal distributions. In addition, conventional statistical models like Poisson and negative binomial regression models used to analyze count data may be affected by an excess number of zeros, and results in overdispersion problems (Green, 2021). As an alternative, machine learning approaches perform slightly better than traditional regression models (Wah et al., 2012). To deal with zero values, they may be used to perform classifications of experimental units based on presence-absence of species (Lewin et al., 2010). Transforming count data into presence-absence data leads to imbalanced classes (Yen and Lee, 2006). However, it has been shown that ensemble methods such as Random Forest, Decision Tree, and XGboost algorithms are very effective in analyzing count data through classification approaches, providing high efficiency and accuracy simultaneously (Mahesh, 2020; Ghafarian et al., 2022).
Data sets in ecology and evolution are often binary (e.g., the presence or absence of a species at a site), whereas basic statistics rely on normally distributed data. It is equally important to consider the absence of species as ignoring this aspect would hide informative evidence about the phenomenon under study (Bolker et al., 2009). The skewness and sparsity of count-based data severely limit linear regression models. On the other hand, in the generalized linear regression model (GLMs), the dependence of the repeated observations over time is not considered. Hence, generalized linear mixed-effects models must be extended to GLMs to consider random effects in nonnormal data. The assumptions in linear parametric models are often difficult to verify, whereas data-driven machine-learning methods can be applied to raw data without making prior assumptions. Considering the non-normality of the data and the large number of zeros for the abundance of some species in some fields, as well as the advantages of machine learning over the traditional analysis method, the machine learning approach was used in an attempt to better understand the factors that influenced CFR. This study hypothesized that meteorological factors affected the incidence of cranberry fruit rot and the composition of fungal species. The objectives of this study were to compare the changes in the relative abundance of CFR fungi and diversity between 2018 and 2020 among three farms with different regimes of fungicide application and attempt to determine the effect of environmental factors on the incidence of CFR.
Materials and methods
Study sites and sample collection
The three Québec farms previously surveyed by Conti et al. (2022) were considered in this study. They were selected with sufficient geographic distancing to avoid cross-contamination and in accordance with different fungicide schemes used to manage CFR. One organic farm located north of Lac-Saint-Jean (Farm 1; 48°49’56.7”N, 71°52’52.0”W), one transitioned farm that no longer uses fungicides since 2015 located in the regions of Lanaudière (Farm 2; 46°08’54.2’’N, 73°30’29.8’’W) and one conventional farm using three fungicide applications (quinone outside inhibitors and demethylation inhibitors in alternance) per year situated in “Centre du Québec” (Farm 3; 45°52’22.2’’N, 72°21’20.3’’W) were surveyed for the experiments (Figure 1).
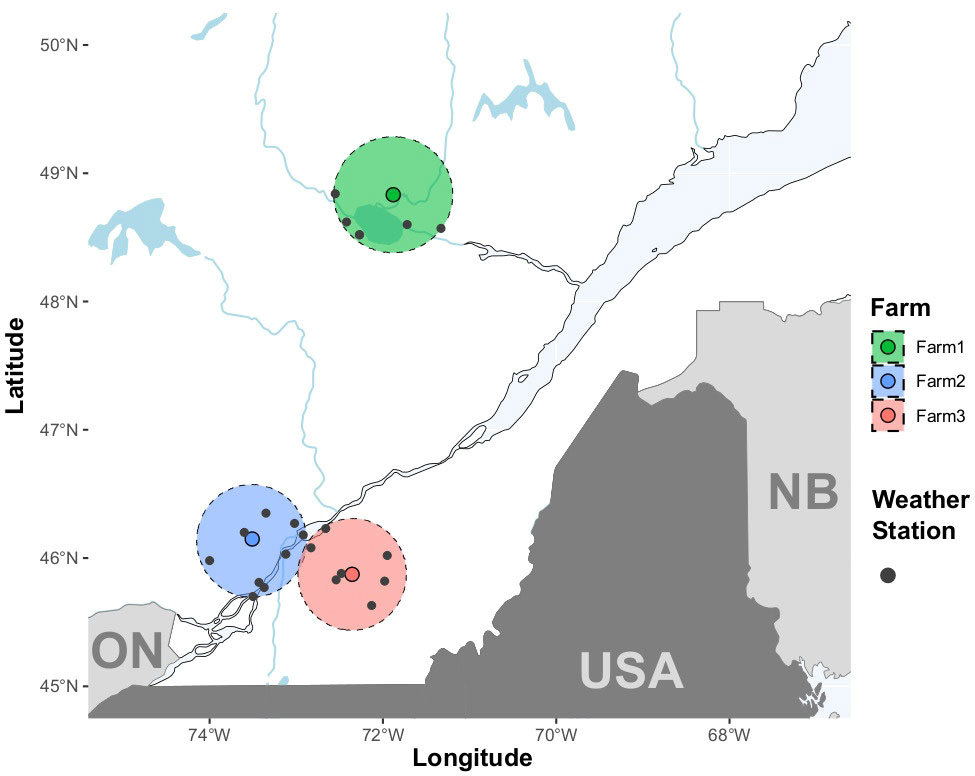
Figure 1 Location of the three farms surveyed for cranberry fruit rot in Québec, Canada. The organic farm (farm 1, denoted with green color) is located in Saguenay–Lac-Saint-Jean. Blue and red colors denote the transitional (Farm 2) and the conventional farms (Farm 3), respectively. The farms are located in the regions of Lanaudière (farm 2) and Centre du Québec (farm 3). Areas delimited by a dash line represent the 50-km perimeters around the farms where weather stations (grey points) were located.
To complete data obtained in 2018 by Conti et al. (2022) and perform a comparative analysis over two years, rotten cranberry fruit were sampled at harvest on the three farms in 2020. After sampling, collected fruit were kept at −20°C until analysis. Samples were surface-sterilized after being taken out of the freezer. Five samples containing five surface-sterilized fruit were taken from each field, following the methodology used by Conti et al. (2022). In total, the same 116 fields were surveyed in 2018 and 2020 from the three farms: 34 fields from farm 1, 21 fields from farm 2 and 61 fields from farm 3.This study analyzed a total of 1160 samples, broken down in 116 fields, each contributing 5 samples (of 5 fruit each) over two years of data collection. Each sample was tested for the presence of the 12 fungi detected by PCR (Conti et al., 2022).
Material preparation, DNA extraction and PCR detection of CFR fungi
To extract DNA, the previously surface sterilized fruit were frozen at -80°C before being lyophilized with the sublimation occurring at about -55°C under vacuum conditions (low than 1 mAtm) at 7.7 kg/m.s using a Labconco Freezone 6 (Labconco Corporation, Kansas City, MO) for 24 hours. Each sample was powdered homogeneously with an Omni Bead Ruptor 24 (Omni International Inc., Kennesaw, GA) for two cycles of 45 seconds at 6.95 m/s with a 30-s pause between each round. About 50 mg of fruit powder were used for DNA extraction. The in-house protocol described in Conti et al., 2019 was used to process CTAB-based DNA extraction. After the extraction procedure, a NanoDrop™ One Microvolume UV-Vis Spectrophotometer (Thermo Scientific, WI, USA) was used to control nucleic acid purity and concentration. As a standard procedure, the absorbance ratios 260/280nm and 260/230nm are used to assess the purity of DNA. Prior to being used in multiplex reactions, DNA extracts were standardized to 50 ng.µL-1 and stored at -20°C.
Multiplex PCR (mPCR) amplifications were processed as described in Conti et al. (2019), except for Godronia cassandrae primers replaced by those described in Conti et al. (2022). Briefly, to identify the presence of the 12 fungal species, the mPCR was divided into three main reactions (A, B and G). The reaction A allows for detecting M. oxycocci, Phyl. vaccinii, and fungi from the Phacidiaceae family; reaction B detects Pho. vaccinii, Phyl. elongata, C. empetri, Phys. vaccinii, and fungi from the Glomerellaceae family while G. cassandrae was detectable in reaction G. Two subset reactions were considered to identify the species in the two families (Phacidiaceae and Glomerellaceae) (C and D). Reaction C was used to discriminate A. lycopodina, A cytisporea, and S. geniculata belonging to the Phacidiaceae family, and reaction D allows the distinction between Colletotrichum species. PCR was performed in 25 mL reaction volume with OneTaq® DNA Polymerase (New England Biolabs, MA, USA) by using 4 µL DNA template. Primers were diluted in ultrapure water to a final concentration of 100 μM. For amplification, PCR conditions were optimized for each reaction with consideration of several factors as described by Conti et al. (2019); Conti et al. (2022): DNA concentration, primer concentration, and the PCR cycling program. Each PCR reaction was performed with a T100 Thermal Cycler (Bio-Rad, Hercules, CA). The analyses of PCR products were run on a QIAxcel Advanced system (Qiagen, Hilden, Germany) by using QIAxcel DNA Screening Kit and the OM320 method implemented in the QIAxcel ScreenGel Software v.1.6, with the default parameters (Qiagen, Hilden, Germany). Data of molecular detection of the 12 CFR species targeted in this study can be found in supplementary data (Supplementary Table 3).
Data analysis
Relative abundance of CFR species
Species relative abundance (SRA) represents the proportion of each species in relation to the total number of observations considering the field as an experimental unit. For both 2018 and 2020, SRA was estimated from mPCR results with the following formula:
where Nsij and ΣNsij are respectively the numbers of positive mPCR detections of the species i and the total number of positive detections for the n species in the jth field. The SRA values were calculated from mPCR results with R v.4.2.2 (R Core Team, 2022).
CFR species diversity
Considering the field as an experimental unit, the species diversity was estimated by species richness (SR) as defined by Hurlbert (1971), for 2018 and 2020 for each farm. The value for SR refers simply to the number of species simultaneous detected by mPCR in a same field and ranges from 0 to 12 in this study. Because the relative abundance of each species is not considered when measuring SR (Kiernan, 2014), the Shannon-Weiner index (H’, Shannon, 1948) and Pielou evenness (J’, Pielou, 1975) were also estimated.
The H’ index is widely used to measure diversity considering both species richness and relative abundances (Fedor and Zvaríková, 2019) and is estimated as follows:
where SRAi is the relative abundance (see above-mentioned section “Relative abundances of CFR species” and Ln(SRAi) is the natural logarithm of the SRA of the species i, for the n species detected in the jth field. The higher the value of H’, the higher is the diversity of species in a field.
Pielou’s evenness (J’) is an index that measures diversity along with species richness. While species richness is the number of different species in a field, evenness is a measure of individuals of each species in a field.
where H’j and SRj are the Shannon-Weiner Index and the Species Richness in the jth field.
The three diversity indexes were calculated for each field with the R package Vegan v.2.5.2 (Oksanen et al., 2018) in R v.4.2.2 (R Core Team, 2022).
Climatic data and selection of relevant weather variables
The weather data corresponding to the years of this study (2018 and 2020) were obtained from Environment and Climate Change Canada (https://climate.weather.gc.ca) using R package weathercan v.0.6.2 (LaZerte and Albers, 2018) in R v.4.2.2 (R Core Team, 2022). Acquisition was performed by downloading data from weather stations found in a 50-km perimeter around each farm. Overall, data were gathered from a total of 21 meteorological stations, and their geographic coordinates can be found in supplementary data (Supplementary Table 1). Six, eight and seven weather stations were found within 50 km of farms 1, 2 and 3, respectively (Figure 1). After downloading climatic data, data for 52 variables were obtained (Supplementary Table 1, 2). Among them, the 32 corresponding to definition variables, giving information or comment on variable (station ids, variable flag, etc) and three with missing value proportions higher than 20% were not considered in the study. Of the 17 remaining, seven other variables with low relevance for CFR modeling (wind direction and speed, wind chill, climatization or heating limit temperatures, gust direction and speed) were ruled out. Finally, a look for any high (|value| > 0.8) correlation values and visual inspection for general interaction behavior of these last 10 variables resulted in the conservation of five climatic variables (Figure 2). The five weather variables selected for modeling were monthly average of daily snow on the ground (cm), total daily precipitation (mm), daily atmospheric pressure (kPa), daily relative humidity (%) and daily temperature (°C). After selection, the variables selected were averaged by 12-month periods and by farm.
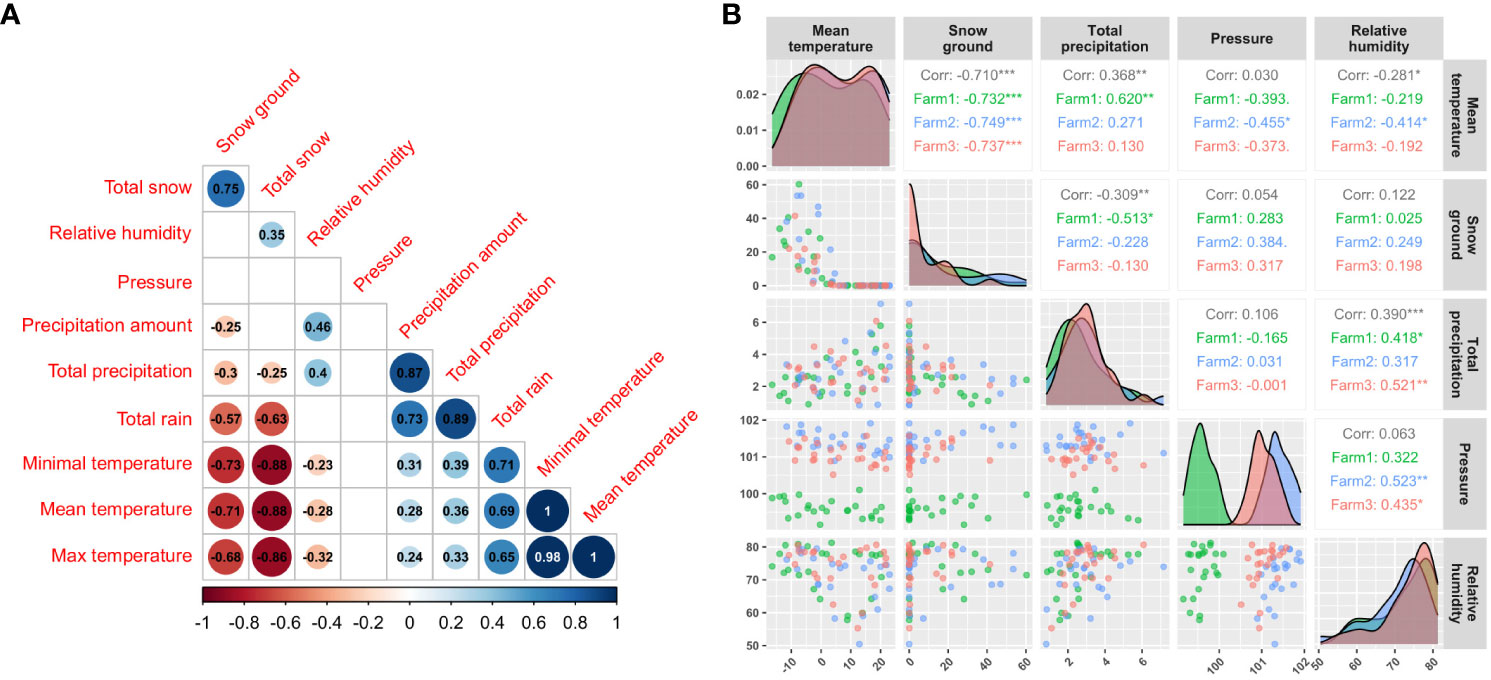
Figure 2 Correlation and interaction behavior between the main climatic variables selected to model cranberry fruit rot presence. The correlogram on the left (A) was built between climatic variable before correlation filtering, and the right (B) gives information for the last five climatic variables selected for modeling.
Statistical analysis
Evolution of CFR patterns over time
The variations in CFR composition were evaluated by testing the differences in species diversity indexes (species richness, SR; Shannon’s Index, H’ and Pielou’s evenness, J’) and in SRA between 2018 and 2020. None of three diversity indexes and SRA respected the assumptions of linear ANOVAs (normality and homoscedasticity). Consequently, diversity variation between years and farms was tested with Wilcoxon rank sum test and SRA variation by species was tested with Wilcoxon signed rank test on paired samples by considering farms and years as grouping variables. Analyses were performed with R package rstatix v.0.7.2 (Kassambara, 2023) in R v.4.2.2 (R Core Team, 2022).
Impact of climatic factors on CFR
Because weather variables were available by month, all 12 months were used as features and a month variable was also included in an extreme gradient boosting as implemented in XGBoost algorithm (Chen and Guestrin, 2016) to evaluate their impact on target values, defined as presence-absence (P/A) of CFR or of one of main species in cranberry field. In addition, farm and sampling year were also included. For each field, target values were obtained from SR or from SRA by considering values > 0 as CFR or main species presence, respectively.
Encoding data for CFR or species P/A resulted in a strongly imbalanced dataset. This is well-known to affect training XGBoost model (Lemaître et al., 2017). Because the objective of this study was to determine if weather factors influenced the presence of CFR or one of the main CFR species found in Quebec, the overall performance of explanation was favored to the detriment of the right probability of case prediction. Consequently, a weighting strategy based on classes frequencies was applied to balance positive and negative cases.
Since XGBoost can run only with numeric values, a second encoding was used for the categorical feature “Farm”. Each one was selected on the fungicide strategy used in its farm. Consequently, this feature was encoded as an ordinal variable to represent the importance of fungicide use in each farm. The values of 0, 1 and 2 were chosen to represent the organic (farm 1), the transitional (farm 2) and the conventional (farm 3) production, respectively.
Using tree-based model (named gbtree in XGBoost) as booster, logistic regressions for binary classification were used as learning task objective to fit model on P/A targets (named binary:logistic in XGBoost). In order to find the best model, seven hyperparameters were optimized: the number of trees (nrounds in XGBoost), the maximum tree depth (max_depth), the learning rate (eta), the minimum loss reduction (gamma), the column sampling (colsample_bytree), the minimum leaf weight (min_child_weight), and the row sampling (subsample).
To limit model overfitting, five repeats of 10-fold cross-validation (RCV) were used to estimate the model performance during all the training process. Because same fields were sampled in 2018 and 2020, data splitting was done on field name (ID) to consider repeated measure structure of the data during the training step. This simple splitting allowed to ensure that measurements from the same fields exist either exclusively in the training or exclusively in the test set and used in the RCV procedure. The impact of each optimization step on the model performance was evaluated based on changes in receiver operating characteristic (ROC) metrics according to the best model from the previous step. The set of hyperparameters that maximized the ROC within the withheld portion of the training data was selected and the performance of the final model was evaluated on its capacity to correctly assess the presence or absence of CFR by comparing absolute metric differences obtained from training steps and those obtained from optimal model prediction on full dataset (Grandini et al., 2020).
Although the final model had already been restricted to include only the weather variables from the above selection approach, both importance and contribution of these variables on the prediction of P/A values were further interpreted with Shapley additive explanation (SHAP) (Lundberg and Lee, 2017). These SHAP values form an additive feature attribution measure to interpret complex machine-learning models. In contrast with the raw importance values, the SHAP values present the feature contribution to cross-validated predictions using by marginal contribution to the model outcome (Liu and Just, 2021). The SHAP values were estimated in the grouped cross validation (repeated field measures not included in the training data for each fold).
The optimization steps were done with R packages caret v. 6.0-93 (Kuhn, 2008) and xgboost v. 1.7.5.1; SHAP evaluation was done with R package SHAPforxgboost v.0.1.1 (Liu and Just, 2021) in R v.4.2.2 (R Core Team, 2022). Optimization procedure can be found as Supplementary Material (Supp Text 1).
Results
Species diversity and composition over time and farms
Diversity variations
Based on the species presence in each field determined by molecular detection, species diversity by field was estimated by using three different indexes (see ‘CFR species diversity’ section in Materials and Methods). Two main results emerged from the diversity comparisons between year and among farms (Figure 3). First, an overall increase of diversity was observed from 2018 to 2020. Comparison variations between years showed significant differences in farm 1 and 3 with the greater one observed in farm 3 (Figure 3A). Interestingly, if the three indexes reported these differences for farm 3, Pielou’s evenness (J’) was only significantly different between 2018 and 2020 for farm 3.
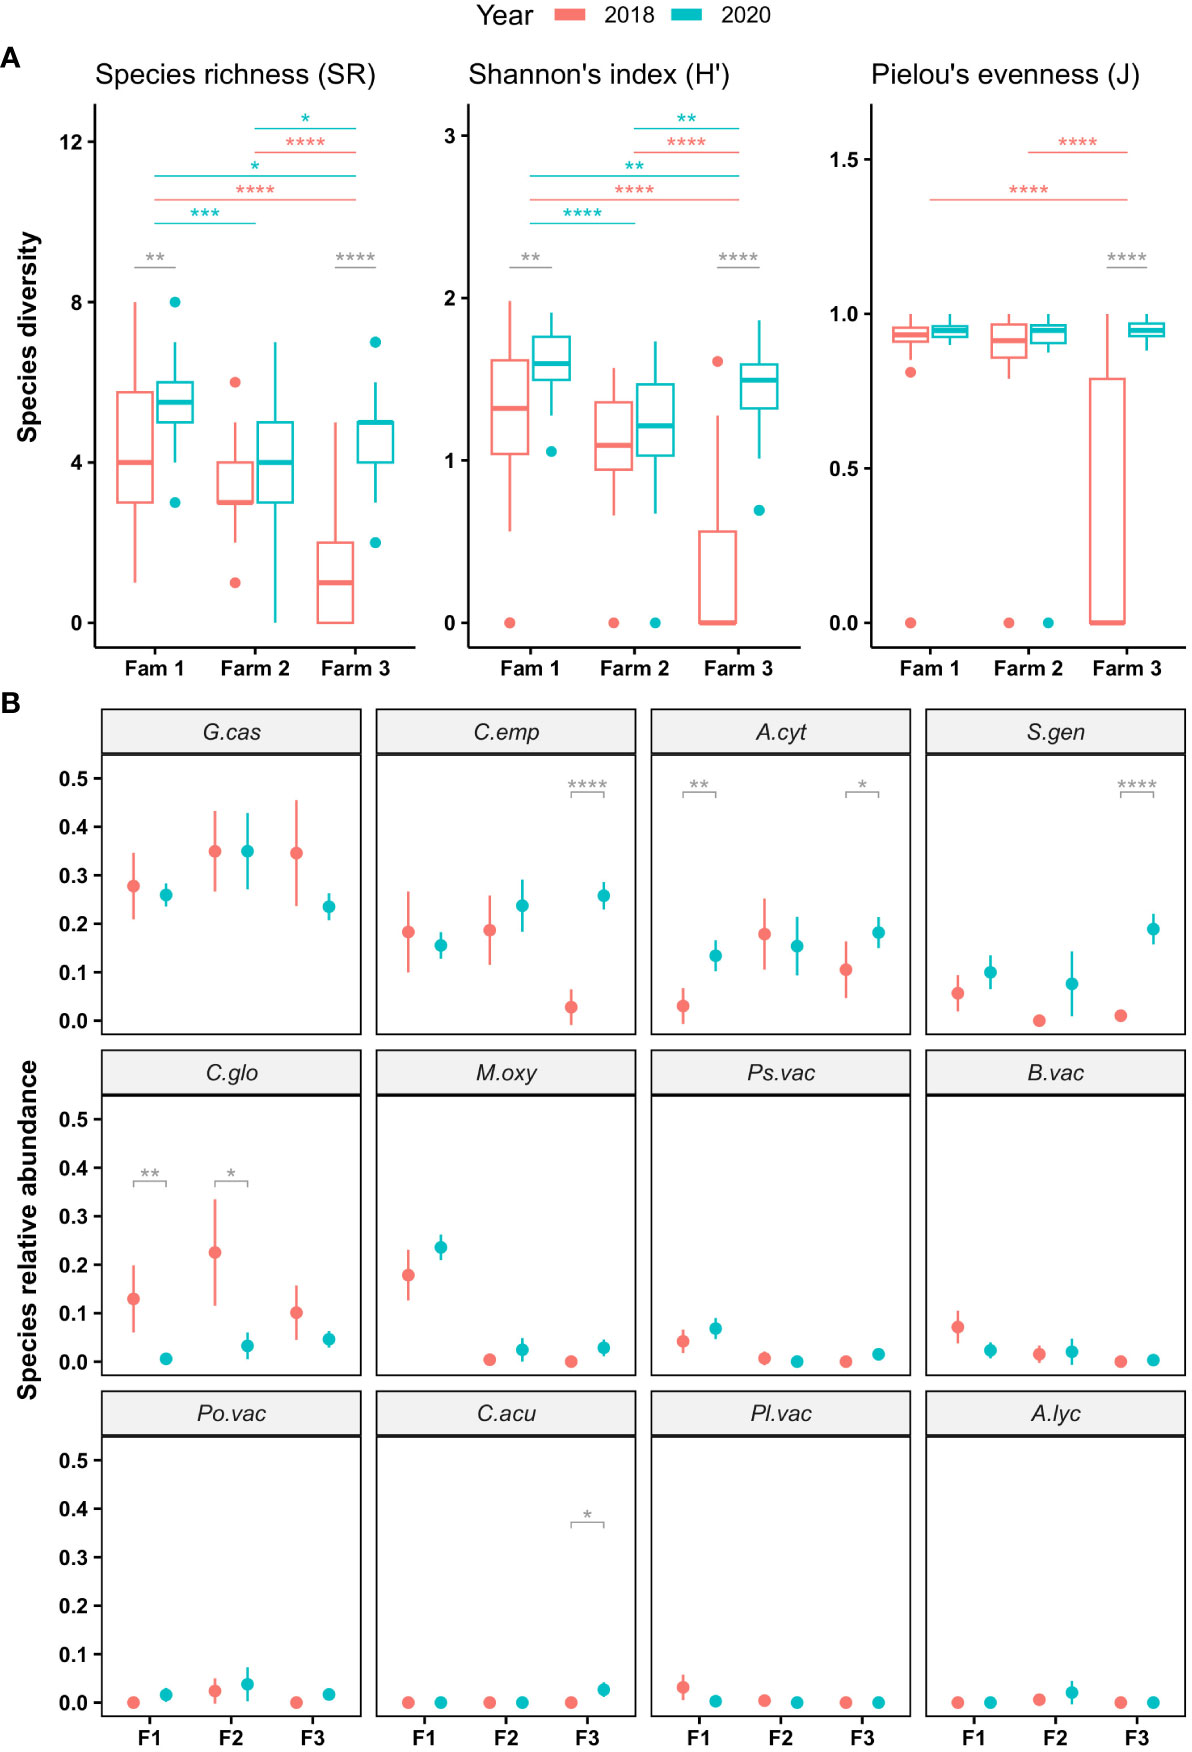
Figure 3 Diversity variation (A) and species relative abundance variation (B) of cranberry fruit rot fungi over two years and three farms. Only significant statistical differences detected with Wilcoxon tests are reported in grey for between years per farm comparisons, in red and blue for between farms comparisons in 2018 and 2020, respectively. Asterisks denote level of significance (ns: p > 0.05, *: p<= 0.05, **: p<= 0.01, ***: p<= 0.001, ****: p<= 0.0001). In (B), a dot represents the mean of species relative abundance (SRA) and vertical bar gives the 95% confident interval. Horizontal axis is organized according to farms (F1: Farm 1. F2: Farm 2 and F3: Farm 3). Facets are organized from the most to the less abundant species and inform on species with A.cyt, Allantophomopsis cystisporea; A.lyc, Allantophomopsis lycopodina; B.vac, Botryosphaeria vaccinii; C.emp, Coleophoma empetri; C.acu, Colletotrichum acutatum; C.glo, Colletotrichum gloeosporioides; G.cas, Godronia cassandrae; M.oxy, Monilinia oxycocci; Pl.vac, Phyllosticta vaccinii; Po.vac, Phomopsis vaccinii; Ps.vac, Physalospora vaccinii; S.gen, Strasseria geniculata.
As a second important observation, diversity was greatest in farm1 and lowest in farm 3, except in 2020, where diversity in farm 3 was higher than in farm 2. Comparison of diversity among farms in 2018 showed significative differences (Figure 3A) between farm 3 and the two other farms for the three indexes. By contrast, differences of diversity between each farm in 2020 was significant only based on species richness (SR) and Shannon’s index (H’).
Species detection and SRA variations
The six most predominant CFR species in Quebec farms remained the same in 2018 and 2020 (Figure 3B), namely in order of importance: Godronia cassandrae, Coleophoma empetri, Allantophomopsis cystisporea, Strasseria geniculata, Colletotrichum gloeosporioides and Monilinia oxycocci. Although relatively few significant differences in SRAs were detected between 2018 and 2020, three main patterns could be observed. Species with an increased SRA in 2020 such as S. geniculata and M. oxycocci, species with a decrease in SRA such as C. gloeosporioides and finally, species with a balancing SRA between 2018 and 2020 such as G. cassandrae and C. empetri (Figures 3A, B). In addition, some species represented interesting issues as M. oxycocci detected mainly in farm 1 in 2018 and 2020, or S. geniculata and C. empetri for which a significant difference in SRA between 2018 and 2020 was exclusively observed in farm 3 (Figure 3B). Another notable result was A. cystisporea SRA in 2020, which was significantly higher than in 2018 in farms 1 and 3.
Finally, among the nine rots of the CFR disease complex, two are considered caused by a complex of species: the black rot (BKR) and the bitter rot (BIR). Of the three species involved in BKR, only A. cystisporea and S. geniculata were detected in the three surveyed Quebec farms (Figure 3B), while only C. gloeosporioides was detected as species involved in BIR. In 2018, S. geniculata was found in the organic farm only, but similar SRAs were observed in the three farms in 2020 with important increases from 2018 to 2020.
Modeling influence of weather factors on CFR
Machine learning model
All the process of optimization and hyperparameters tuning can be found in supplementary data (Supp Text 1). Briefly, five weather variables, farm origin and year of sampling were used in a XGBoost approach to evaluate their impact on CFR presence or on the presence of the six main species detected in Québec farms. Because weather variables were available by month, a total of eight features were used in modeling of P/A values.
For CFR P/A, the evaluation of the optimal model resulted in an ROC value of 0.930, corresponding to a sensitivity of 0.958 (True positive rate) and specificity of 0.847 (True negative rate). Briefly, ROC values from models for the six main CFR species P/A ranged from 0.776 (sensitivity = 0.667 and specificity = 0.649) to 0.946 (sensitivity = 0.859 and specificity = 0.740) for C. gloeosporioides and M. oxycocci, respectively. Detailed results and parameter values obtained for each optimal model can be found in Table 1.
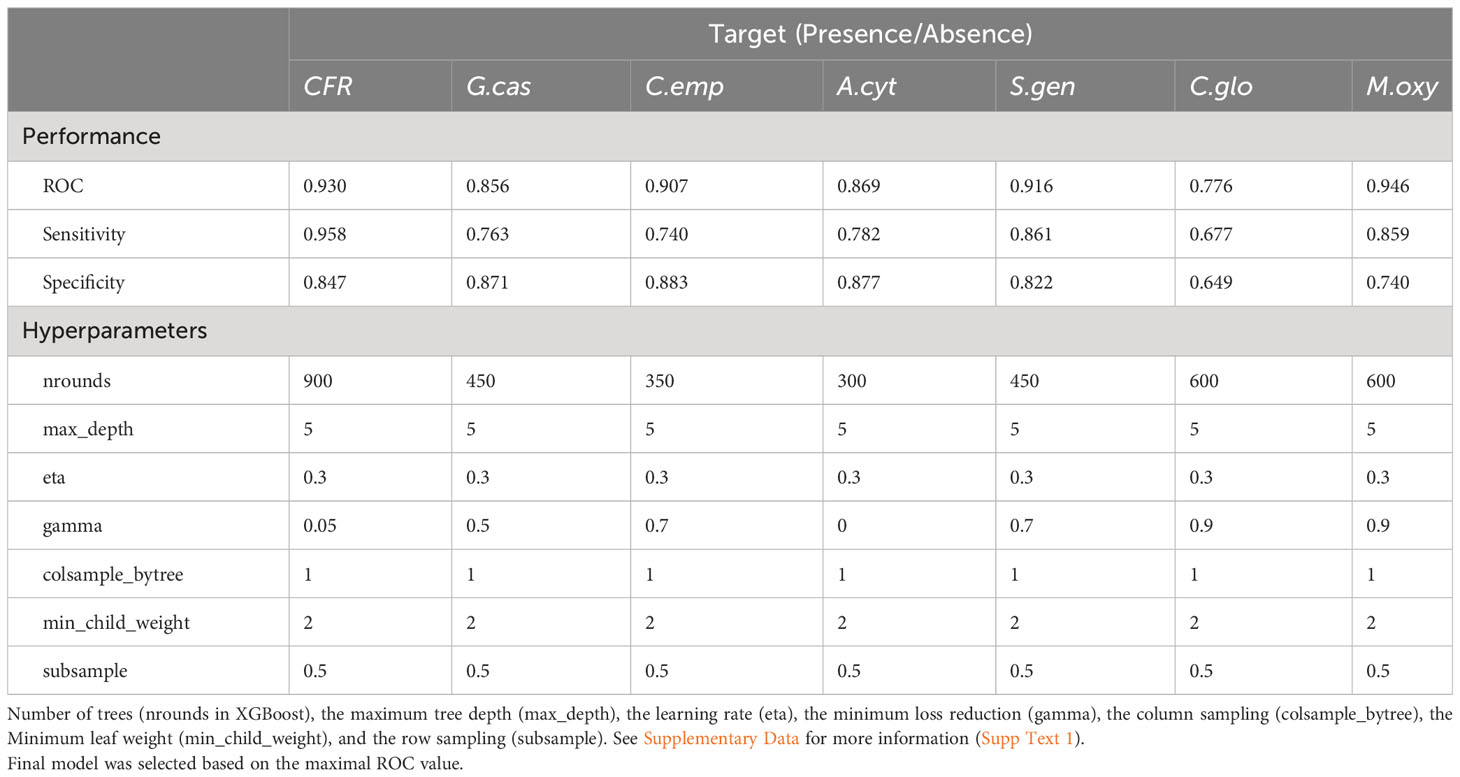
Table 1 Predictive performance and optimal hyperparameters for the fully trained XGBoost Models obtained from cranberry fruit rot or main species presence (Godronia cassandrae (G.cas), Coleophoma empetri (C.emp), Allantophomopsis cytisporea (A.cyt), Starsserai geniculata (S.gen), Colletotrichum gloeosporioides (C.glo) and Monilinia oxycocci (M.oxy)) in thre three Québec farms surveyed.
The SHAP overview plot illustrated different patterns of feature importance on CFR and the main six fungal species (Figure 4).The rank of the mean absolute SHAP values suggested that the top key contributing variables to predicting the presence-absence of CFR (Figure 4A) were atmospheric pressure, the total precipitation, the relative humidity, the temperature, and the snow on the ground. Interestingly, variables year and farm (i.e. fungicide use) had minimal effects in the prediction of CFR occurrence in a field and the month variable seemed to show that monthly variations of weather variables impacted the presence of CFR. For the by-species models (Figures 4B–G), year ranked at the top, excepted for C. gloeosporioides, showing there was a strong annual variability only when regarded by species. The atmospheric pressure was at the second rank in all species, except for C. empetri. The farm variable contributed differently depending on the species considered. It was a major contributor to models for G. cassandrae, C. empetri, S. geniculata and M. oxycocci, by contrast farm variable contributed poorly for A. cystisporea and C. gloeosporioides. The temperature, relative humidity and total precipitation had similar contributions to predict the presence-absence of each species with a notable exception however for C.gloeosporioides. The rank of the mean absolute SHAP values suggested that the temperature and the relative humidity were the top key contributing variables to predicting the presence-absence of this species (Figure 4F). Finally, with the exception for C. empetri, month ranked last suggesting a minimal effect of seasonality on the incidence of other species.
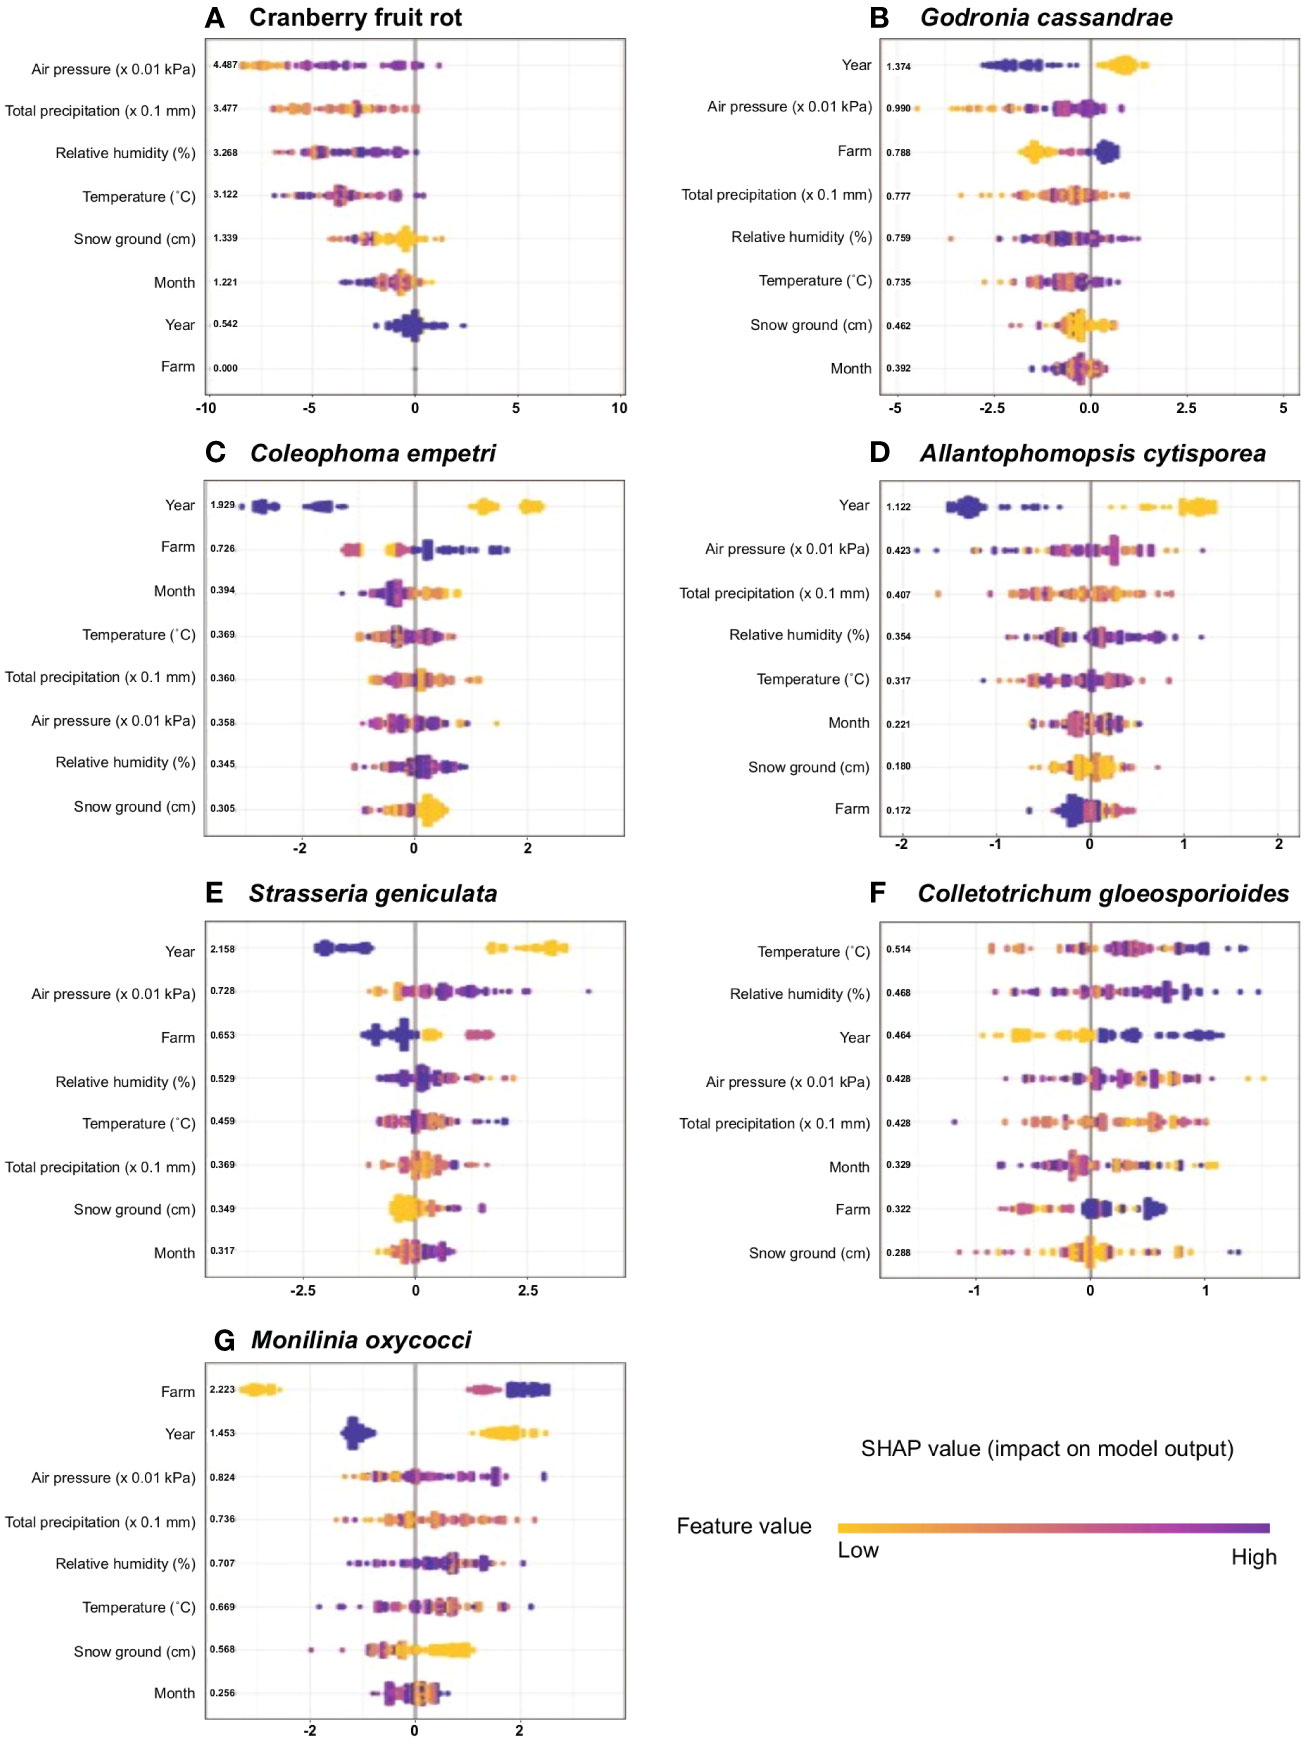
Figure 4 Sina plots for cranberry fruit rot (CFR) and six individual fungal species causing CFR show the distribution of feature contributions to predictions of absence using SHAP values of each feature for every field. The subpanels show models for cranberry fruit rot (A) and the main six fungal species (B–G). Features were ordered on the y axis by their mean absolute SHAP values over all observations (bold on the right of the variable names). The color is scaled to the feature value (purple high, yellow low).
Discussion
Disease management strategies for CFR are challenging because of the complex nature of the disease, the limited knowledge about its epidemiology and the lack of prediction models. Considering the difficult task of identifying the 12 fungal agents potentially responsible for CFR, few studies have been able to describe with precision and reproducibility the etiology of the disease. The recent development of a multiplex PCR approach to detect all 12 species in one sample (Conti et al., 2019) has offered new opportunities to investigate the disease with greater accuracy. In a recent study, Conti et al. (2022) argued that CFR species composition was mainly influenced by fungicide applications, but they suggested that environmental variables also played a role. In this study, we attempted to draw a more detailed picture of CFR in Quebec and provide new information concerning the impact of environmental factors on CFR occurrence.
Species diversity and composition confirmed the constant dynamic of CFR over time and space as reported in previous studies (Stiles and Oudemans, 1999; Wells-Hansen and McManus, 2017; Conti et al., 2022). Spatial divergences and temporal fluctuations of species diversity were estimated by using three different indexes (SR, H’ and J’, see Figure 3A). Based on the strict number of species by field, the SR showed an overall increase from 2018 to 2020 in the three farms with the greatest difference observed in farm 3. Such temporal variations supposed one or more fluctuating factor(s), such as weather variables, impacted the system under study. When observed among farms, farm 3 presented the lowest diversity in 2018, but, surprisingly, the second one in 2020. This increase of SR in farm 3, using recurrent fungicides to control the disease, implies an interaction between weather and fungicides, especially in the context of fungicide resistance (see below). Incidentally, Pielou’s evenness (J’), measuring diversity along with species richness, was drastically lower in the conventional farm (farm 3) compared to the other ones, denoting the presence of dominant species in fields for this farm. Considering the recurrent use of fungicides and the impact of fungicides on species diversity (Ma et al., 2021), dominant species could evolve because of resistance mechanisms.
Among the main species detected in Quebec, M. oxycocci, the causal agent of cotton ball disease, was exclusively found in the organic farm (farm 1) suggesting its sensitivity to fungicides. This observation is in adequation with fungicide sensitivity observed for other Monilinia spp. (Luo et al., 2010; Hily et al., 2011). This may also explain the absence of this species in previous surveys conducted in areas where fungicide applications are common (Oudemans et al., 1998). The causal agent of bitter rot, C. gloeosporioides, was detected without distinction in the three farms, but SRA changed greatly between years, suggesting no fungicide efficiency and high probable impact of weather change between 2018 and 2020. These results corroborated numerous reports on fungicide resistance commonly found in this species (Chung et al., 2010; Gama et al., 2021).
Among the three black rot (BKR) species, A. cytisporea and S. geniculata and A. lycopodina, only the latter, reported as sensitive to QoI fungicides, Quadris ® (Syngenta, Crop Protection AG, n.d.) was not detected in Quebec in any of the three farms (Figure 3B). The two other BKR species are the third and the fourth most abundant CFR fungi found in Quebec (Figure 3B) and showed two SRA patterns. In the organic farm (farm 1), A. cytisporea presented a lower SRA than in transitional and conventional farms (farm 2 and farm 3, respectively) indicating a potential fungicide resistance for this species.
If the impact of fungicides was already reported to reduce fungal diversity and alter the composition of fungal communities in other agricultural systems (Bending et al., 2007; Cwalina-Ambroziak and Nowak, 2012; Sang and Kim, 2012; Ma et al., 2021), disease severity can also shift under micrometeorological changes (Huber and Gillespie, 1992). Consequently, the fluctuations both in diversity and species abundance observed in the three studied cranberry farms could have resulted from yearly weather changes. For this reason, we attempted to link different weather factors with CFR by applying machine learning approaches. Of the five variables taken into consideration, only the year-based time trend was found as a key feature in the specific models. When considered as a global disease, this indicates that the CFR occurs recurrently in Quebec, independently of the year, although data over more years would help refine the observation. The contribution of farms (farm considered according with its fungicide use) was also very low when plotting the SHAP estimates, revealing that fungicides did not alter species diversity. On the other hand, the presence predictions of C. gloeosporioides were also marked by a low rank position of the farm variable by SHAP estimates. In modeling presence-absence of this species, farms were split based on fungicide usage. Consequently, the low contribution of this variable shows that fungicides do not act efficiently on this species in Quebec farms and reveals a resistance potential against chemical control in cranberry. Colletotrichum species are well-known to have a strong propension to develop resistance (e.g Chung et al., 2010; Gama et al., 2021). Even if it is not yet a major concern because C. gloeosporioides is only the fifth species of importance in Quebec, monitoring of its resistance level should be implemented. The same consideration applies to other regions of production where the species is more problematic. A similar concern can be raised for A. cytisporea, the third main CFR species detected in this study. Fungicide impact ranked last in the model prediction of the presence-absence of this species. More worrying again, the highest values (i.e. for conventional farm) were linked with the higher value of absence prediction, highlighting the presence of this species mainly in the conventional farm. Allantophomopsis cytisporea is one of the three species involved in black rot (BKR), a major storage rot in cranberry and its resistance was unexpected because chemical control of the disease is recommended. By contrast, the farm was in the third key variable in the presence-absence prediction of the four other species (G. cassandrae, C.empetri, S. geniculata and M. oxycocci). Monilinia oxycocci presented the strongest impact of fungicide on the model prediction, with low value (corresponding to the organic farm) associated with the lowest value of prediction. This confirms the great sensitivity of Monilinia sp. to fungicides, especially strobilurins (Hily et al., 2011).
As for the CFR global model, atmospheric pressure was among the key variables explaining the model, except for C. empetri. In a recent study, Sadyś et al. (2016) suggested that spore release and germination of fungal pathogens may be influenced by air pressure. It was interesting to observe that in CFR fungi, high air pressure values had a negative impact on the presence of CFR species. These results suggest that in the context of cranberry culture, because wines grow close to the ground, monitoring air pressure at the ground level could be a useful option to manage CFR.
In conclusion, many factors contribute to climate change effect on fungal distribution, including physiology, reproduction, survival, allocation of resources, and competition with the fungal community (Duñabeitia et al., 2004). The effect of environmental factors illustrates that each species’ behavior is unique, and that a one-sided approach cannot be considered for all species. If XGBoost machine learning showed promising solutions to help explain CFR, binary classification was chosen in this study as an approach to assess the presence of CFR or CFR species in accordance with different weather variables. Although commonly used, binarization implies the loss of quantitative information linked with the abundance of species detected. Consequently, a way of improving the model should be to further consider multiclass or Poisson regression models directly. These models can be implemented in machine learning approach such as XGBoost (Chen and Guestrin, 2016). Another level of complexity was the multi-species system involved in CFR. As 12 fungi can cause CFR and up to eight different species were found simultaneously in one field, multioutput models (Pedregosa et al., 2011) may be a suitable alternative to generating models applied to a such complex disease. The next step could focus on exploring geographically distant locations with varying climate conditions. Conducting this study over an extended period could yield more comprehensive insights into the CFR complex disease. In light of meteorological data, identifying specific pathogens in problematic CFR farms could aid in developing targeted disease management programs, assuming the climatic conditions are conducive to the disease. This approach could result in cost-effective measures that reduce the need for environmentally harmful fungicides. However, given the complexity of the disease and the diverse environmental factors contributing to its occurrence, devising a general guideline to predict its incidence remains a daunting challenge.
Data availability statement
The original contributions presented in the study are included in the article/Supplementary Material. Further inquiries can be directed to the corresponding author.
Author contributions
KA contributed to the conceptualization of the research project, gathered the molecular data, conducted data analysis, and was involved in writing the manuscript. BC played a key role in conceptualizing the study, conducting revisions, assisting in data analysis, and contributing to the writing process. MC developed the methodology related to the molecular aspects of the work and provided data for the 2018 season. CL conducted laboratory analyses, and contributed to the experimental work. RB contributed to the conceptualization of the project, managed various aspects of the research and was involved in writing the manuscript. All authors contributed to the article and approved the submitted version.
Funding
The author(s) declare financial support was received for the research, authorship, and/or publication of this article. This research was supported by grant ALLRP 561831 - 21 of the Natural Sciences and Engineering Research Council of Canada to RB in collaboration with Ocean Spray Inc. and three cranberry producers.
Acknowledgments
We express our sincere gratitude to Jean-Pierre Deland of Ocean Spray for his generous contribution of multiple fruit samples.
Conflict of interest
The authors declare that the research was conducted in the absence of any commercial or financial relationships that could be construed as a potential conflict of interest.
The authors declare that this study received funding from Ocean Spray Inc. and the three cranberry producers. Of the three funders, only producers had the following involvement in the study: collection of rotten fruit samples.
Publisher’s note
All claims expressed in this article are solely those of the authors and do not necessarily represent those of their affiliated organizations, or those of the publisher, the editors and the reviewers. Any product that may be evaluated in this article, or claim that may be made by its manufacturer, is not guaranteed or endorsed by the publisher.
Supplementary material
The Supplementary Material for this article can be found online at: https://www.frontiersin.org/articles/10.3389/fagro.2023.1235218/full#supplementary-material
Supplementary Table 1 | Spatial coordinates of weather stations found in a 50-km perimeter around studied farms.
Supplementary Table 2 | Data for the 52 variables obtained from the weather stations selected.
Supplementary Table 3 | Data of molecular detection of the 12 CFR species targeted.
Supplementary Text 1 | R Markdown document containing code used to obtain results and images of the paper.
Abbreviations
CFR, Cranberry Fruit Rot; SRA, Species Relative Abundance; H', Shannon-Weiner index; J', Pielou’s evenness; P/A, Presence/Absence; XGBoost, Extrem Gradient Boosting; RCV, Repeated Cross Validation; ROC, Receiver Operating Characteristic; SHAP, Shapley additive explanation; BKR, Black Rot; BIR, Bitter Rot.
References
Bending G. D., Rodríguez-Cruz M. S., Lincoln S. D. (2007). Fungicide impacts on microbial communities in soils with contrasting management histories. Chemosphere 69, 82–88. doi: 10.1016/j.chemosphere.2007.04.042
Bolker B. M., Brooks M. E., Clark C. J., Geange S. W., Poulsen J. R., Stevens M. H. H., et al. (2009). Generalized linear mixed models: a practical guide for ecology and evolution. Trends Ecol. Evol. 24, 127–135. doi: 10.1016/j.tree.2008.10.008
Chen T., Guestrin C. (2016). “Xgboost: A scalable tree boosting system,” in Proceedings of the 22nd ACM SIGKDD International Conference on Knowledge Discovery and Data Mining (KDD '16 (New York, NY, USA: Association for Computing Machinery), 785–794. doi: 10.1145/2939672.2939785
Chung W. H., Chung W. C., Peng M. T., Yang H. R., Huang J. W. (2010). Specific detection of benzimidazole resistance in Colletotrichum gloeosporioides from fruit crops by PCR-RFLP. New Biotechnol. 27, 17–24. doi: 10.1016/j.nbt.2009.10.004
Conti M., Cinget B., Labbé C., Asselin Y., Bélanger R. R. (2022). New insights into the fungal diversity of cranberry fruit rot in Québec farms through a large-scale molecular analysis. Plant Dis. 106, 215–222. doi: 10.1094/PDIS-06-21-1163-RE
Conti M., Cinget B., Vivancos J., Oudemans P., Bélanger R. R. (2019). A molecular assay allows the simultaneous detection of 12 fungi causing fruit rot in cranberry. Plant Dis. 103, 2843–2850. doi: 10.1094/PDIS-03-19-0531-RE
Contreras T. S., Íñiguez-Moreno M., Sánchez L. G., Sánchez J. A. R., Zapata J. A. N., Santoyo M. C. (2022). Effect of temperature on the interaction between Rhizopus stolonifer and Colletotrichum sp., postharvest pathogens of jackfruit (Artocarpus heterophyllus Lam.). Nova Scientia 12. doi: 10.21640/ns.v14i28.2966
Cwalina-Ambroziak B., Nowak M. (2012). The effects of biological and chemical controls on fungal communities colonising tomato (Mill.) plants and soil. Folia Hortic. 24, 13–20. doi: 10.2478/v10245-012-0002-4
Duñabeitia M. K., Hormilla S., Garcia-Plazaola J. I., Txarterina K., Arteche U., Becerril J. M. (2004). Differential responses of three fungal species to environmental factors and their role in the mycorrhization of Pinus radiata D. Don. Mycorrhiza 14, 11–18. doi: 10.1007/s00572-003-0270-5
FAOSTAT Statistical database (2021). Cranberries: Yield and production quantity (Rome, Italy: Food and Agriculture Organization of the United Nations).
Fedor P., Zvaríková M. (2019). “Biodiversity indices,” in Encyclopedia of Ecology (Second Edition), Section: Conservation Ecology, vol. 2019 . Ed. Fath B. (Kidlington, United Kingdom: Elsevier), 337–346. doi: 10.1016/B978-0-12-409548-9.10558-5
Freedman B. (2023). “"Heath family (Ericaceae).",” in The Gale Encyclopedia of Science. Available at: https://www.encyclopedia.com/science/encyclopedias-almanacs-transcripts-and-maps/heath-family-ericaceae.
Gama A. B., Cordova L. G., Rebello C. S., Peres N. A. (2021). Validation of a decision support system for blueberry anthracnose and fungicide sensitivity of Colletotrichum gloeosporioides isolates. Plant Dis. 105, 1806–1813. doi: 10.1094/PDIS-09-20-1961-RE
Ghafarian F., Wieland R., Lüttschwager D., Nendel C. (2022). Application of extreme gradient boosting and Shapley Additive explanations to predict temperature regimes inside forests from standard open-field meteorological data. Environ. Model. Software 156, 105466. doi: 10.1016/j.envsoft.2022.105466
Grandini M., Bagli E., Visani G. (2020). Metrics for multi-class classification: an overview. arXiv preprint arXiv 2008, 5756. doi: 10.48550/arXiv.2008.05756
Green J. A. (2021). Too many zeros and/or highly skewed? A tutorial on modelling health behaviour as count data with Poisson and negative binomial regression. Health Psychol. Behav. Med. 9, 436–455. doi: 10.1080/21642850.2021.1920416
Hily J. M., Singer S. D., Villani S. M., Cox K. D. (2011). Characterization of the cytochrome b (cyt b) gene from Monilinia species causing brown rot of stone and pome fruit and its significance in the development of QoI resistance. Pest Manage. Sci. 67, 385–396. doi: 10.1002/ps.2074
Huber L., Gillespie T. J. (1992). Modeling leaf wetness in relation to plant disease epidemiology. Annu. Rev. Phytopathol. 30, 553–577. doi: 10.1146/annurev.py.30.090192.003005
Hurlbert S. H. (1971). The nonconcept of species diversity: a critique and alternative parameters. Ecology 52, 577–586. doi: 10.2307/1934145
Kassambara A. (2023). rstatix: Pipe-Friendly Framework for Basic Statistical Tests (R package version 0.7.2). Available at: https://rpkgs.datanovia.com/rstatix/.
Kiernan D. (2014). Quantitative measures of diversity, site similarity, and habitat suitability. Natural Resources Biometrics Ed. Kiernam D. (New York, USA: Open SUNY Textbooks).
Kuhn M. (2008). Building predictive models in R using the caret package. J. Stat. Software 28, 1–26. doi: 10.18637/jss.v028.i05
LaZerte S. E., Albers S. (2018). weathercan: Download and format weather data from Environment and Climate Change Canada. J. Open Source Software 3, 571. doi: 10.21105/joss.00571
Lemaître G., Nogueira F., Aridas C. K. (2017). Imbalanced-learn: A python toolbox to tackle the curse of imbalanced datasets in machine learning. J. Mach. Learn. Res. 18, 559–563. doi: 10.48550/arXiv.1609.06570
Lewin W. C., Freyhof J., Huckstorf V., Mehner T., Wolter C. (2010). When no catches matter: Coping with zeros in environmental assessments. Ecol. Indic. 10, 572–583. doi: 10.1016/j.ecolind.2009.09.006
Liu Y., Just A. (2021). _SHAPforxgboost: SHAP Plots for 'XGBoost'_ (R package version 0.1.1). Available at: https://CRAN.R-project.org/package=SHAPforxgboost.
Lundberg S. M., Lee S.-I. (2017). “A unified approach to interpreting model predictions,” in Advances in Neural Information Processing Systems, Ed. Guyon I., Luxburg Von U., Bengio S., Wallach H., Fergus R., Vishwanathan S., Garnett. R., et al (Red Hook, NY, USA: Curran Associates, Inc.) 4765–4774.
Luo C. X., Hu M. J., Jin X., Yin L. F., Bryson P. K., Schnabel G. (2010). An intron in the cytochrome b gene of Monilinia fructicola mitigates the risk of resistance development to QoI fungicides. Pest Manage. Sci. 66, 1308–1315. doi: 10.1002/ps.2016
Ma G., Gao X., Nan J., Zhang T., Xie X., Cai Q. (2021). Fungicides alter the distribution and diversity of bacterial and fungal communities in ginseng fields. Bioengineered 12, 8043–8056. doi: 10.1080/21655979.2021.1982277
Mahesh B. (2020). Machine learning algorithms-a review. Int. J. Sci. Res. 9, 381–386. doi: 10.21275/ART20203995
Oksanen J., Blanchet F. G., Friendly M., Kindt R., Legendre P., McGlinn D., et al. (2018). vegan: Community Ecology Package (R package version 2). Available at: http://CRAN.R-project.org/package=vegan
Oudemans P. V., Caruso F. L., Stretch A. W. (1998). Cranberry fruit rot in the Northeast: a complex disease. Plant Dis. 82, 1176–1184. doi: 10.1094/PDIS.1998.82.11.1176
Pedregosa F., Varoquaux G., Gramfort A., Michel V., Thirion B., Grisel O., et al. (2011). Scikit-learn: machine learning in python. J. Mach. Learn. Res. 12, 2825–2830.
Polashock J. J., Oudemans P., Constantelos C., Caruso F. L., McManus P., Crouch J. (2008). Species identification and variation in the North American cranberry fruit rot complex. Acta Hortic. 810, 395–400. doi: 10.17660/ActaHortic.2009.810.51
Pscheidt J. W., Ocamb C. M. senior editors. (2023). Pacific Northwest Plant Disease Management Handbook [online]. (Corvallis, OR: Oregon State University). Available at: https://pnwhandbooks.org/plantdisease (accessed 31 March 2023).
R Core Team (2022). R: A language and environment for statistical computing (Vienna, Austria: R Foundation for Statistical Computing). Available at: https://www.R-project.org/.
Romero F., Cazzato S., Walder F., Vogelgsang S., Bender S. F., van der Heijden M. G. A. (2022). Humidity and high temperature are important for predicting fungal disease outbreaks worldwide. New Phytologist 234, 1553–1556. doi: 10.1111/nph.17340
Sabaratnam S., Wood B., Nabetani K., Sweeney M. (2014). “Surveillance of cranberry fruit rot pathogens, their impact and grower education,” in Interim research report (Abbotsford, BC, Canada: Abbotsford Agriculture Centre, Ministry of Agriculture).
Sadyś M., Kennedy R., West J. S. (2016). Potential impact of climate change on fungal distributions: analysis of 2 years of contrasting weather in the UK. Aerobiologia 32, 127–137. doi: 10.1007/s10453-015-9402-6
Sang M. K., Kim K. D. (2012). Plant growth-promoting rhizobacteria suppressive to Phytophthora blight affect microbial activities and communities in the rhizosphere of pepper (Capsicum annuum L.) in the field. Appl. Soil Ecol. 62, 88–97. doi: 10.1016/j.apsoil.2012.08.001
Shannon C. E. (1948). A mathematical theory of communication. Bell System Tech. J. 27, 379–423. doi: 10.1002/j.1538-7305.1948.tb01338.x
Stiles C. M., Oudemans P. V. (1999). Distribution of cranberry fruit-rotting fungi in New Jersey and evidence for nonspecific host resistance. Phytopathology 89, 218–225. doi: 10.1094/PHYTO.1999.89.3.218
Tadych M., Vorsa N., Wang Y., Bergen M. S., Johnson-Cicalese J., Polashock J. J., et al. (2015). Interactions between cranberries and fungi: the proposed function of organic acids in virulence suppression of fruit rot fungi. Front. Microbiol. 6. doi: 10.3389/fmicb.2015.00835
Troutt C., Levetin E. (2001). Correlation of spring spore concentrations and meteorological conditions in Tulsa, Oklahoma. Int. J. Biometeorology 45, 64–74. doi: 10.1007/s004840100087
Wah Y. B., Nasaruddin N., Voon W. S., Lazim M. A. (2012). Decision tree model for count data. In: Proceedings of the World Congress on Engineering Vol. I. (London, U.K.).
Wells-Hansen L. D., McManus P. S. (2017). Year-to-year incidence of cranberry fruit rot and persistence of fungal pathogens. Plant Health Progress 18, 114–119. doi: 10.1094/PHP-12-16-0073-RS
Yen S. J., Lee Y. S. (2006). “Under-sampling approaches for improving prediction of the minority class in an imbalanced dataset,” in Huang DS., Li K., Irwin G.W. (eds) Intelligent Control and Automation Lecture Notes in Control and Information Sciences, Kunming, China(Berlin, Heidelberg: Springer) 344. doi: 10.1007/978-3-540-37256-1_89
Keywords: Vaccinium macrocarpon, small fruits, pathogen detection, fungicides, climatic factors, machine learning, evolution, fungal diversity
Citation: Aghel K, Cinget B, Conti M, Labbé C and Bélanger RR (2023) Molecular and machine learning approaches to study the impact of climatic factors on the evolution of cranberry fruit rot. Front. Agron. 5:1235218. doi: 10.3389/fagro.2023.1235218
Received: 05 June 2023; Accepted: 15 November 2023;
Published: 01 December 2023.
Edited by:
Timothy Miles, Michigan State University, United StatesReviewed by:
Sudhir Navathe, Agharkar Research Institute, IndiaJames Polashock, United States Department of Agriculture, United States
Copyright © 2023 Aghel, Cinget, Conti, Labbé and Bélanger. This is an open-access article distributed under the terms of the Creative Commons Attribution License (CC BY). The use, distribution or reproduction in other forums is permitted, provided the original author(s) and the copyright owner(s) are credited and that the original publication in this journal is cited, in accordance with accepted academic practice. No use, distribution or reproduction is permitted which does not comply with these terms.
*Correspondence: Richard R. Bélanger, richard.belanger@fsaa.ulaval.ca