The role of teleconnection in the occurrence probability of extreme precipitation over China based on extreme value theory
 Xiaoping Kang1,2
  Juan Dai
 Xihui Gu
- 1State Key Laboratory of Water Resources and Hydropower Engineering Science, Wuhan University, Wuhan, China
- 2Department of Atmospheric Science, School of Environmental Studies, China University of Geosciences, Wuhan, China
- 3Changjiang River Scientific Research Institute, Wuhan, China
- 4Centre for Severe Weather and Climate and Hydro-geological Hazards, Wuhan, China
- 5Hubei Key Laboratory of Yangtze Catchment Environmental Aquatic Science, School of Environmental Studies, China University of Geosciences, Wuhan, China
- 6State Environmental Protection Key Laboratory of Source Apportionment and Control of Aquatic Pollution, Ministry of Ecology and Environment, Wuhan, China
Non-stationarity of extreme climate events has been reported worldwide in recent decades, and traditional stationary analysis methods are no longer sufficient to properly reveal the occurrence probability of climate extremes. Based on the 0.25°C × 0.25°C gridded precipitation data (i.e., CN05.1), stationary and non-stationary models of generalized extreme value (GEV) and generalized Pareto (GP) distributions are adopted to estimate the occurrence probability of extreme precipitation over China during 1961–2018. Low-frequency oscillation (LFO) indices, such as El Niño-Southern Oscillation (ENSO), Indian Ocean Dipole (IOD), North Atlantic Oscillation (NAO), Southern Annular Mode (SAM), and Pacific Decadal Oscillation (PDO), are included as time-varying covariates in the non-stationary GEV and GP models. Results illustrate that the occurrence probability of extreme precipitation estimated from the stationary GEV and GP distributions shows a significant increasing trend in northwestern and southeastern China, and the opposite trend in southwestern, central, and northeastern China. In comparison with stationary model, the fitness of extreme precipitation series is improved for both the GEV and GP distributions if these LFO indices are used as time-varying covariates. Positive ENSO, IOD and PDO tend to cause negative anomalies in the occurrence probability of extreme precipitation in northeastern China and Tibet Plateau, and positive anomalies in southern China. Positive NAO and SAM phases mainly tend to cause positive anomalies in southern China. The circulation patterns of extreme precipitation anomalies associated with these LFO indices are discussed from aspects of precipitable water, vertical integrated moisture transport, 500-hPa geopotential height and 850-hPa wind field.
Highlights
• Non-stationary frequency analysis for both AM- and POT-sampled extreme precipitation events.
• A framework for non-stationary frequency analysis models by taking the LFO indices as covariates.
• Circulation patterns of the LFO indices impact on occurrence probability of extreme precipitation over China are discussed.
1 Introduction
Global warming can aggrandize atmospheric water vapor amounts (Liu et al., 2021), which in turn has led to increased extreme precipitation (O’Gorman and Schneider, 2009; Yu et al., 2022). Extreme precipitation can induce disasters such as floods, slope landslides and mudslides, causing casualties and property damage (Cazelles and Hales, 2006; Gu et al., 2020; Lai et al., 2020; 2021; Liu et al., 2019; Salinger and Griffiths, 2001). Therefore, more and more attention has been focused on the variation in extreme precipitation events (Gu et al., 2017a; Zhang et al., 2018). Although climate change does not necessarily lead to an increase in total precipitation, it exacerbates the frequency and magnitude of extreme precipitation (Ibrahim, 2019). Hydrological frequency analysis is a scientific criterion for natural disasters assessment, especially water disasters caused by extreme hydrological events (Bodini and Klotz, 2002). We use hydrologic frequency analysis to build the relations between the hydrological design values and the return period based on flood data or flow data, or indirectly using precipitation data. It is the scientific basis for the planning, design and management of hydraulic engineering (Li et al., 2019). Therefore, frequency analysis is essential for relating the severity of extreme precipitation events to their frequency.
The current frequency analysis on extreme events requires that the series satisfy the stationary assumption, assuming that the frequency of extreme events is not time-varying. That is, the probability distribution or statistical law of extreme events remains constant in the past, present and future, and there are no trends or abrupt changes in the extreme value series (Klein Tank and Zwiers, 2009; Wang et al., 2015). However, the climatic mechanisms underlying the occurrence probability of extreme precipitation events are constantly changing, leading to disruptions in the stationarity of the time series of extreme precipitation events. Thus, the reliability of the probability estimation for extreme precipitation events based on the stationary assumption has been strongly questioned (Hejazi and Markus, 2009; Held and Soden, 2006; Tan and Gan, 2017; Yang and Tian, 2009), and many recent studies have shown that the stationary assumption does not conform to the reality (Giraldo Osorio and García Galiano, 2012; Wagesho et al., 2012; Ishak et al., 2013). For example, Wi et al. (2016) found an increasing trend of extreme precipitation in Korea; Tan and Gan (2017) pointed out the temporal non-stationarities in extreme precipitation across Canada. Therefore, it is necessary to construct a non-stationary frequency analysis framework for extreme precipitation events, study the changing characteristics of occurrence probability of extreme precipitation events, and explore the circulation patterns behind the variation in the occurrence probability of extreme precipitation events.
To consider the effects of low-frequency climate variability, many studies have analyzed extreme precipitation frequency analysis through non-stationary generalized extreme value (GEV) and generalized Pareto (GP) distributions (Gao and Xie, 2016; Tan and Gan, 2017; Stojkovic and Simonovic, 2019). In such models, the parameters of GEV and GP distributions depend on the covariates, which are usually Low-frequency oscillation (LFO) indices representing climate variability (Cheng et al., 2014; Mondal and Mujumdar, 2015; Nasri et al., 2016; Zhang et al., 2010). It can be seen that extreme precipitation are influenced by LFO indices in previous studies. For instance, Mallakpour and Villarini (2016) analyzed the relations between the frequency of extreme precipitation and five LFO indices, found that the Pacific-North American Model (PNA) plays a major role in changes in extreme precipitation events overAmerica. Duzenli et al. (2018) showed that the North Atlantic Oscillation (NAO) is the most effective driver of extreme precipitation variability in winter in Turkey. Tan and Gan (2017) used four LFO indices as covariates with non-stationary probability distributions to analyze their effects on extreme precipitation in Canada.
Extreme precipitation in China is strongly impacted by several LFO indices, including El Niño-Southern Oscillation (ENSO) (Fu et al., 2013; Lv et al., 2019; Zhang et al., 2017), Indian Ocean Dipole (IOD) (Saji and Yamagata, 2003; Xiao et al., 2016; Gao et al., 2017), NAO (W. Gu et al., 2009), Pacific Decadal Oscillation (PDO) (Gao et al., 2017; Sang et al., 2020), and Southern Annular Mode (SAM) (Gao et al., 2022). Precipitation in China is basically constrained by the East Asian monsoon, under the significant influence of ENSO (Chen et al., 2013). Many studies have shown an association between seasonal precipitation and the positive/negative phase of ENSO in China (Gong and Wang, 1999; Chan and Zhou, 2005; Xiao et al., 2015; Gao et al., 2022). Gu et al. (2017a) showed that SOI, NAO, PDO and IOD had certain effects on the incidence of intense precipitation. The precipitation affected by NAO appear in northwestern China and the Tibet Plateau (Ding and Wang, 2005; Cuo et al., 2013). SAM will cooperate with NAO to influence precipitation in southern China in summer (Li et al., 2017). The main rain belt (such as precipitation magnitude and location) over the monsoon areas of China are significantly influenced by PDO (Li et al., 2010; Xu et al., 2015; Zhu et al., 2011).
Following the framework built by Tan and Gan (2017), we construct a non-stationary analytical model of extreme precipitation events based on GEV and GP distributions to detect the variation in the occurrence probability of extreme precipitation events in China. We select ENSO, IOD, NAO, PDO and SAM as influencing factors, and attempt to address the following two scientific questions: 1) has the occurrence probability of extreme precipitation events changed significantly in China over the past few decades? 2) does the LFO indices have a significant moderating effect on the change of the occurrence probability of extreme precipitation events?
2 Data
2.1 Gridded daily precipitation data
The daily precipitation is collected from a 0.25°C×0.25°C gridded dataset CN05.1. This dataset was built by Wu et al. (2013) based on observations from more than 2,400 ground-based weather stations and interpolated by the “distance level approximation” method. The CN05.1 dataset covers the period 1961–2018, including daily precipitation, and other meteorological elements; this dataset is widely used to analyze climate characteristics in China (He et al., 2021; Li et al., 2021; Wei et al., 2021; Wu et al., 2017).
2.2 Low-frequency oscillation indices
LFO indices impact significantly on precipitation processes in China. Numerous studies have confirmed the importance of ENSO (Fu et al., 2013; Lv et al., 2019; Zhang et al., 2017), IOD (Saji and Yamagata, 2003; Xiao et al., 2016; Gao et al., 2017), NAO (Gu et al., 2009), SAM (Gao et al., 2017), and PDO (Sang et al., 2020) on precipitation variability in China. Therefore, in this study, ENSO, IOD, NAO, SAM, and PDO are selected as the LFO indices (time-varying covariates) that affect the occurrence probability of extreme precipitation in China. We obtain the monthly time series of ENSO, NAO, IOD, SAM, and PDO during 1961–2018 from the United States National Climate Center.
2.3 Large-scale environmental variables
The large-scale environmental variables (e.g., geopotential height, meridional and zonal winds, precipitable water, and meridional and zonal water vapor transport) are used to analyze the circulation patterns that how LFO indices modulate occurrence probability of extreme precipitation events in China. These large-scale environmental variables are obtained from the JRA-55 reanalysis data of Japan Meteorological Agency. This six-hours reanalysis dataset covers the period 1961–2018, with a spatial resolution of 1.25°C × 1.25°C. The six-hours data are converted into daily values.
3 Methodology
3.1 Identification of extreme precipitation events
We use the annual maximum (AM) and peak-over-threshold (POT) methods to identify extreme precipitation events (Smith, 2002; Khaliq et al., 2006). The AM series consist of the annual maximum daily precipitation, that is, the maximum value is extracted annually to form the AM time series (a total of 58 values per grid cell during the period 1961–2018). There may be multiple extreme precipitation events in the rainy year and no intense precipitation events in the dry year, resulting in the problem of omission or inclusion of false information in the AM series. Therefore, in addition to AM series, extreme precipitation series are constructed using the POT series (Tan and Gan, 2017). For the POT series, the 95% quantile value of all daily precipitation larger than 0.1 mm is taken as the threshold, and the values above the threshold (i.e. the 95% quantile value) are identified as heavy precipitation. Consecutive heavy precipitation days are taken as one heavy precipitation event. The POT series consist of all identified heavy precipitation events during the period 1961–2018.
3.2 Stationary and non-stationary GEV distribution
The AM series is fitted by the GEV distribution (Smith, 2002; Tan and Gan, 2017):
Where
where
3.3 Stationary and non-stationary GP distribution
The extreme precipitation series obtained from POT sampling can be fitted by the GP distribution (Tan & Gan, 2017; Ibrahim, 2019):
3.3 1 Non-stationary GP models
Similar to the GEV model, the GP distribution scale parameter can be defined by a linear function of the covariates as follows:
When
3.4 Model performance tests
The Kolmogorov-Smirnov (K-S) test is used to assess the goodness-of-fit of GEV/GP distribution (Santos et al., 2015; Tan and Gan, 2017; Romali et al., 2018). The null hypothesis is that the stationary GEV/GP distribution is suitable to fit the observed extreme precipitation series. The likelihood ratio test is used to evaluate whether the non-stationary model has a better performance than the stationary model (Xavier et al., 2020; Zakaria et al., 2021). The null hypothesis is that there is no difference between non-stationary and stationary models in fitting the observed extreme precipitation series. The false discovery rate (FDR) test is employed to assess whether the improvement of the non-stationary model can be considered as field-significant across China (Wilks, 2006). The null hypothesis is that the improvement of the non-stationary model is not field-significant. The above null hypotheses are rejected when the corresponding p-value is smaller than 0.05.
3.5 Detection of changes in probability index and occurrence rate
For AM time series, the non-exceeding probability (i.e.,
For POT time series, we use a Poisson distribution to estimate the change in occurrence rate of extreme precipitation events (Thiombiano et al., 2018):
Where,
4 Results and discussion
4.1 Modeling extreme precipitation with stationary distribution
The distribution of extreme precipitation thresholds in China during 1961–2018 (Figure 1A) shows that extreme precipitation thresholds in China generally exhibit higher in southeast than in northwest, and the highest precipitation thresholds (with values up to 28 mm or more) appear in southern China. This is in consistant with the results obtained by Jin et al. (2021). The variance distribution is consistent with the mean distribution (Figures 1B,C). Both the mean and variance of precipitation decrease from south to north in China (also see Xie et al., 2022). The large variance in southern China (Figure 1C) indicates that precipitation in these areas is highly dispersed. To evaluate the degree of dispersion, the coefficient of dispersion is calculated (Figure 1D). According to the distribution of dispersion coefficients (Figure 1D), most of the grid points (about 89.4%) have a significant performance of dispersion coefficients (ratio of variance to mean > 1). Heavy precipitation in China exhibits non-stationary behavior of point process of occurrences, which is indicated by these over-dispersion characteristics (Tan and Gan, 2017).
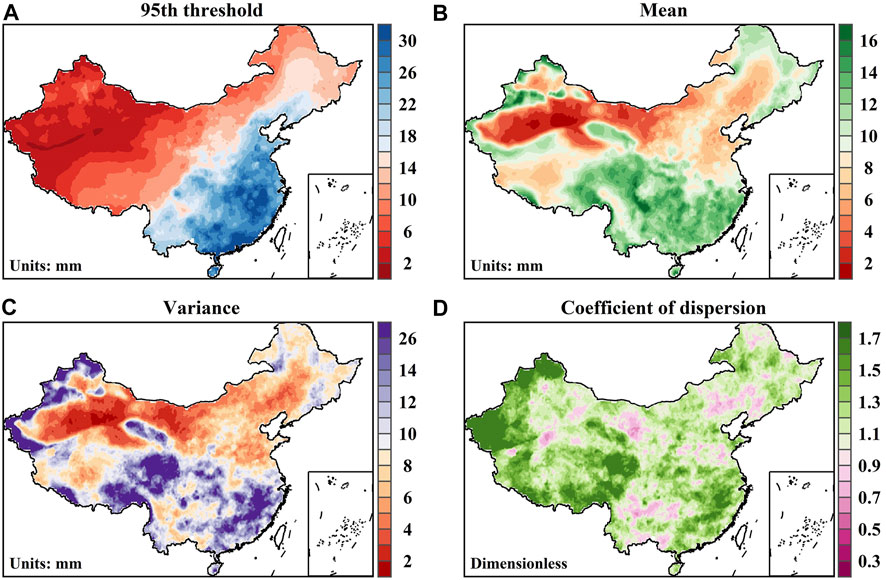
FIGURE 1. Information of peak-over-threshold (POT) sampling for extreme precipitation: (A) 95th percentile of non-zero precipitation as the threshold in POT sampling; (B) annual average days with precipitation exceeding this threshold; (C) the variance of annual number of days with precipitation exceeding this threshold; and (D) the coefficient of dispersion (i.e., the variance divided by the mean).
The stationary GEV/GP simulations are carried out for the AM/POT series respectively, and the K-S test was adopted to assess the models’ goodness of fit (Figure 2) (Santos et al., 2015; Tan and Gan, 2017; Romali et al., 2018). From Figures 2A,D, almost all grid points accept the null hypothesis that the time series can be fitted by the stationary GEV/GP distribution, demonstrating that the AM series satisfies the stationary GEV distribution and the POT series satisfies the stationary GP distribution. The spatial distribution of the parameters of the stationary GEV and GP models shows that the location (Figures 2A,D) and scale (Figures 2B,E) parameters decrease from southeastern China to northwestern China and from coastal areas to inland areas, with the highest values located in southern and east-central coastal regions of China. The shape parameters do not have a clear spatial distribution (Figures 2C,F), but almost all grid points have non-zero shape parameters, indicating that the AM series can be modeled by a GEV distribution with heavy tail behavior (Eq. 1,
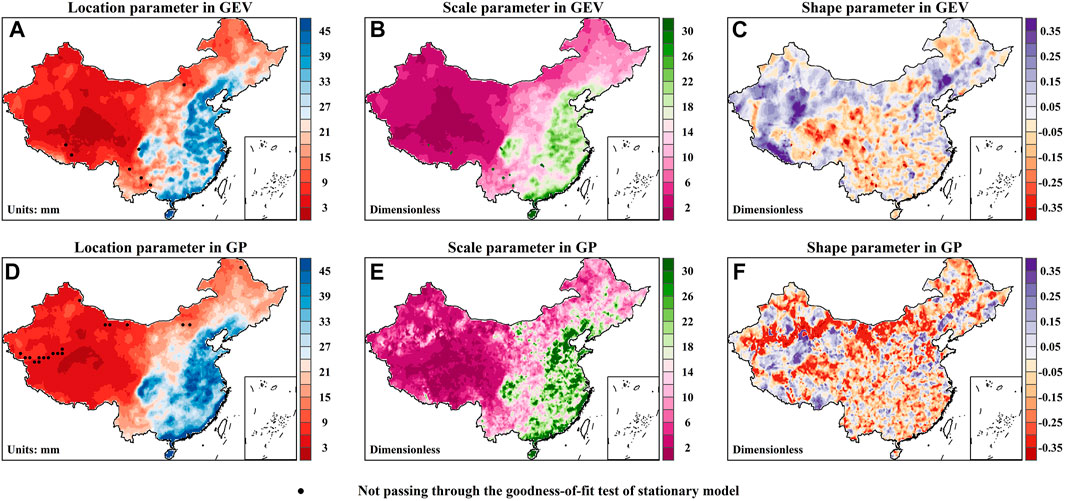
FIGURE 2. Spatial distributions of location, scale, and shape parameters in GEV distribution (A–C) and GP distribution (D–F). The black dots in a and d indicate that the time series of extreme precipitation reject the null hypothesis at 0.05 significance level. The null hypothesis is that the time series can be fitted by the stationary GEV/GP distribution.
The AM and POT series are selected to estimate precipitation magnitude at different return period levels (10-, 20-, and 50- years) through the stationary GEV and GP distributions, respectively (Figure 3). Overall, the spatial distribution of precipitation magnitudes among different recurrence levels remains consistent and is similar to the spatial distribution of the location and scale parameters, showing decreases from southeastern China to northwestern China. Furthermore, the spatial distribution of the 10-, 20- and 50- year return period precipitation estimated by the GEV and GP distributions is also very similar, but the 10-, 20- and 50-year return period precipitation estimated by the GEV distribution is less than that estimated by the GP distribution. In general, the 10-, 20- and 50-year return period precipitation estimated by the GEV distribution is 36%, 30%, and 25% smaller than that estimated by the GP distribution, respectively (the right column in Figure 3).
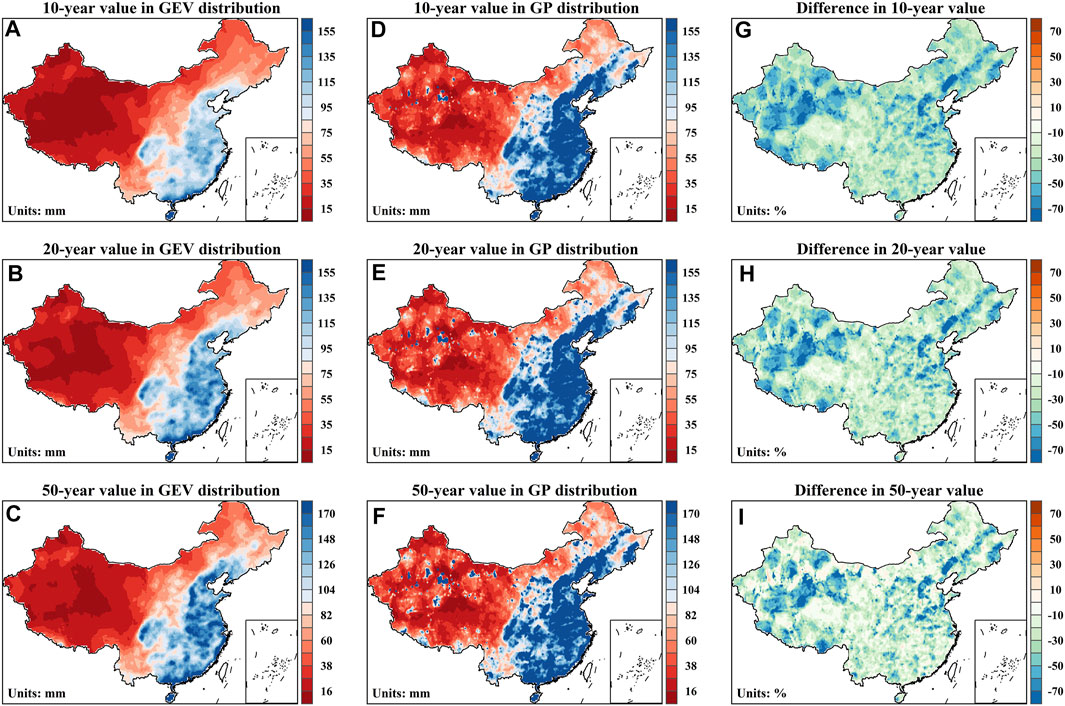
FIGURE 3. Return period (value occurs once in n years on average) of extreme precipitation estimated by the stationary GEV/GP distribution. (A–C/D–F) are the 10-, 20-, and 50-year value estimated by the stationary GEV/GP distribution based on the extreme precipitation time series during 1961–2018. (G–I) are the corresponding difference in 10-, 20-, and 50-year value between GEV and GP distribution.
4.2 Modelling extreme precipitation with non-stationary distribution
Based on the stationary GEV distribution, we estimate the probability index of AM extreme precipitation and detect their trends in each grid during 1961–2018 (Figure 4A). Decreasing probability index is found in northeastern China and eastern Tibet plateau, while increasing probability index occurs in northwestern and southeastern China. These results indicate extreme precipitation become more (less) intense and have a higher (lower) occurrence probability in northwestern and southeastern China (northeastern China and eastern Tibet Plateau).
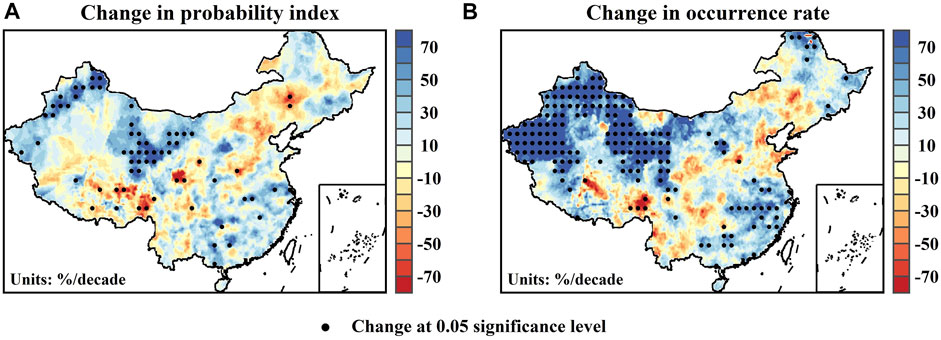
FIGURE 4. Changes in probability index (A) and occurrence rate (B) during 1961–2018 over China. The probability index is estimated based on the GEV distribution and the occurrence rate is estimated based on the Poisson distribution (see Section 3). The black dots indicate the change at 0.05 significance level.
We also detect changes in occurrence rate of extreme precipitation events obtained from POT sampling (Figure 4B). The spatial pattern of changes in occurrence rate (Figure 4B) is highly consistent with that of changes in probability index (Figure 4A). We notice that occurrence rate of extreme precipitation events shows significantly increasing trends in northwestern China. Increasing trends in both probability index and occurrence rate are found in northwestern China and southeastern China, meaning that the two regions have experienced more intense and frequent extreme precipitation events [similar results also see Zhai et al. (2005)]. Zhai et al. (2005).
The increase of probability index and occurrence rate in southeastern China may be prompted by the change of East Asian summer monsoon (EASM) (Huijun, 2001). After 1970s, the East Asian monsoon circulation weakened and the rain belt lacked the power to jump northward, and stayed in southern China, increasing the extreme precipitation here (Zhai et al., 2005). In northwestern China, with the westward extension of the West Pacific Subtropical High (WPSH) and the strengthening of the Mongolian anticyclone, the southwest airflow is enhanced, resulting in an anomalous increase in southwest water vapor transport, and increasing the precipitation (Chen et al., 2021).
Figure 5 shows the difference in the occurrence probability of 20-year extreme precipitation between the five years with the largest positive values and the lowest negative values of given LFO indices. LFO indices are used as covariates for the location and scale parameters of the GEV distribution. The dotted area is the grids that show a significant improvement in the non-stationary GEV distribution through the likelihood ratio and FDR tests (Wilks, 2006). Table 1 lists the percentage of these grid points. By modeling AM series using time to build the non-stationary GEV distribution, the first and the last 5 years of the period 1961–2018 (i.e., 1961–1965 and 2014–2018) for each grid point. To avoid the influence of abrupt change, the precipitation data were detrended.
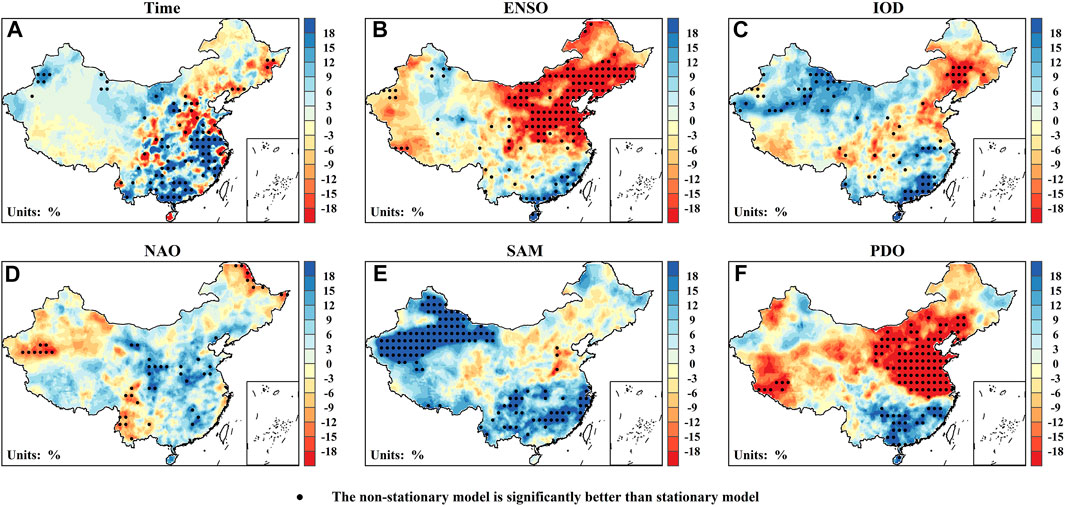
FIGURE 5. Change in the occurrence probability of 20-year extreme precipitation estimated by the non-stationary GEV distribution. The six covariates in the non-stationary GEV distribution are time (A), ENSO (B), IOD (C), NAO (D), SAM (E) and PDO (F). For example, the ENSO is taken as the covariate, and the change is the difference in occurrence probability estimated from the maximum and minimum five ENSO values. The blue/red areas indicate the occurrence probability of 20-year extreme precipitation is higher/lower during extreme ENSO positive than negative phase. Black dots indicate that the non-stationary model has better performance than the stationary model at 0.05 significance level.
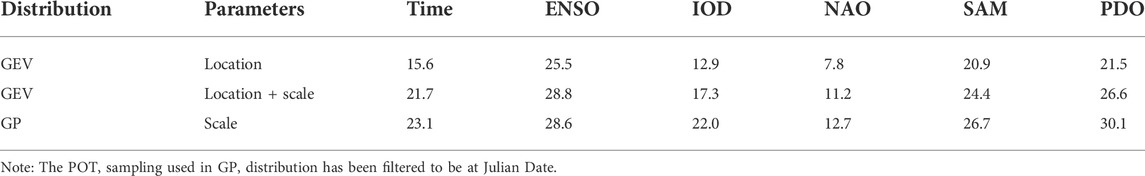
TABLE 1. Percentage (%) of stations showing statistically significant improvements with the inclusion of covariates compared to consistent stationary models.
Figure 6 shows the difference between the estimated occurrence probability of 20-year extreme precipitation, conditional on the positive and negative phases of the covariates with the climate indices as the scale parameter of the GP distribution. The result of GP distribution based on the POT series with time, ENSO, IOD, NAO, SAM and PDO as the covariate are similar to the GEV distribution (Figure 5).
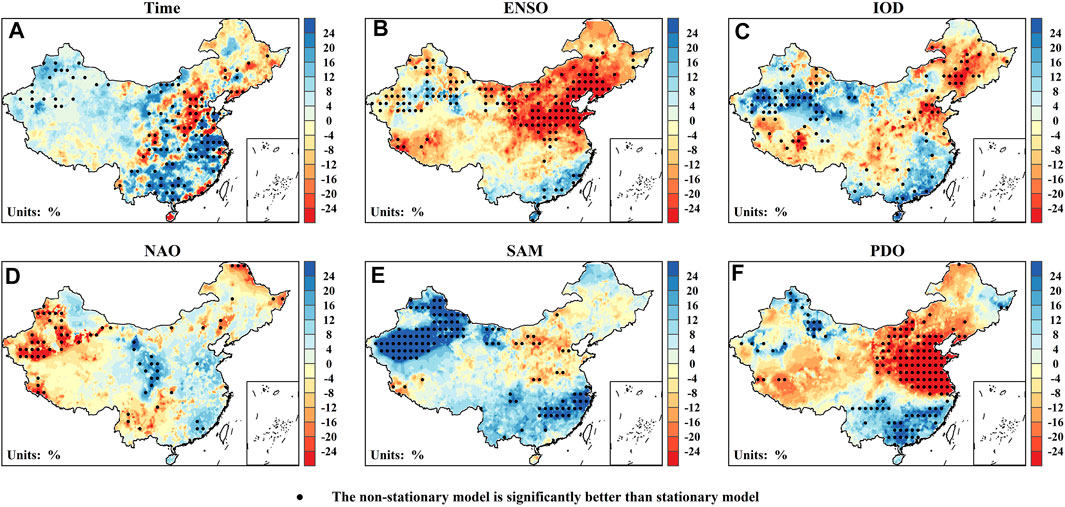
FIGURE 6. The same as Figure 5 but for the non-stationary GP distribution.
When only taking the time as the covariate for the location parameter, approximately 15.6% of the AM time series fit to the GEV distribution showing a significantly better fit to the stationary distribution (Table 1). The percentage of AM series with a good fit to the GEV distribution increased to about 21.7% when the time is included as a covariate for location and scale parameters. With time as the covariate for the scale parameter of the GP distribution, about 23.1% of POT series fitted the GP distribution significantly better than the stationary GP distribution (Table 1). The regions where the occurrence probability of 20-year extreme precipitation increases significantly are mainly located in southeastern China, and northwestern China also shows an increase (Figures 5A, 6A). While there is a decrease trend in the occurrence probability, especially in northeastern and east-central China and the eastern Tibet Plateau (Figures 5A, 6A). This is consistent with the results of J. Sun & Zhang (2017). In addition, Ma et al. (2015) also pointed an increase of intense precipitation events in southeastern China.
When ENSO is used as a covariate of GEV distribution location parameter, about 25.5% of the regions showed significant improvement. With ENSO as the covariate of location and scale parameters, the good fitting region between AM series and GEV distribution is about 28.8%. When ENSO is used as the covariate for the scale parameter of the GP distribution, the significant improvement area was about 28.6% (Table 1). Figures 5B, 6B show the effect of ENSO on the occurrence probability of 20-year extreme precipitation, where positive ENSO events imply El Niño and negative ENSO events imply La Niña. In the summer when El Niño develops, China shows negative precipitation anomalies except the southeastern China. The results of Li et al. (2020) are consistent with our study showed that during El Niño (La Niña) phases, positive (negative) precipitation anomalies occur in southern China, while the opposite in northern China and the Tibet Plateau. Sun et al. (2017) pointed out that during El Niño years, southeastern China has an increased risk of extreme precipitation, while most areas in northern China experience drier conditions during El Niño.
More AM series show significantly better fit to the stationary GEV distribution with IOD as the covariate for the location parameter (12.9%) or the location and scale parameters (17.3%). Using IOD as the scale parameter for the GP distribution, the POT series are also more suitable for the GP distribution, improving about 22.0% (Table 1). Li and Zhao (2019) showed that positive IOD events cause a decrease of extreme precipitation in southwestern and northeastern China. This is consistent with our findings (Figures 5C, 6C). In addition, there is a certain synergy between IOD and ENSO, positive (negative) IOD events always accompany the occurrence of positive (negative) ENSO events (Ashok et al., 2003). The combined effects of ENSO and IOD contribute to increased precipitation in summer in southern China (Xiao et al., 2015; Xu et al., 2016). Therefore, IOD has important effects on the occurrence probability of extreme precipitation over the China monsoon region, and the significant area of GP distribution is more concentrated in the northwest than the GEV distribution.
When NAO is included as the covariate of the location (location and scale) parameters of the GEV distribution, the fit was improved for 7.8% (11.2%) of the AM series. And 12.7% of the POT series are also better fitted with NAO as the covariate for the scale parameter of the GP distribution (Table 1). The distribution of the effect of NAO on the occurrence probability of extreme precipitation (Figures 5D, 6D) shows that most of the regions in China show positive correlations with NAO, except for parts of northwestern, southwestern and northeastern China, which showed negative anomalies. Linderholm et al. (2011) showed that summer NAO has a positive correlation with precipitation in southeastern China, while negative summer NAO events tend to lead to drought in southeastern China.
About 20.9% (24.4%) of the stations fits are significantly improved with SAM as the covariate for the location (position and scale) parameters of the GEV distribution, and up to 26.7% when SAM is used as the covariate for the scale parameter of the GP distribution (Table 1). Many studies show that spring SAM is positively correlated with summer precipitation in southeastern China. During positive SAM, summer precipitation in southeast China increases because of the change of EASM (Li et al., 2017; Nan and Li, 2003; Wu et al., 2009). Wang and Fan (2005) analyzed the temporal variation of the Antarctic Atmospheric Oscillation (AAO) and precipitation in central-northern China during summer and found precipitation in this region is significantly negatively related to the AAO. The AAO is an alias for SAM (Limpasuvan and Hartmann, 1999, 2000; Baldwin, 2001). And we also found that positive SAM phase tends to cause increasing extreme precipitation in most areas of China, while it demonstrated a non-significant decreasing trend in the central, central-north and northeastern regions (Figures 5E, 6E).
Using PDO as the covariate for the location (location and scale) parameters of the GEV distribution, about 21.5% (26.6%) of the AM series have an improved fit to the GEV distribution. When PDO is used as a covariate of GP distribution scale parameter, the improvement even reached about 30.1% (Table 1). The interannual relationship between ENSO and the climate can be regulated by PDO, and the impact of ENSO on wet and dry changes varies with PDO (Library et al., 2016; S. Wang et al., 2014; Xue et al., 2018; Yang et al., 2017). Therefore, PDO and ENSO have strong synergistic effects, and the distributions of their impacts on the occurrence probability of extreme precipitation in China are relatively consistent (Figures 5B,F). From Figures 5F, 6F, significant negative (positive) correlation between PDO and the occurrence probability of extreme precipitation is found in northern (southeastern) China. Zeng et al. (2021) found that during positive PDO, summer precipitation increase in the southeast and decrease in the north. Zhu et al. (2011) found that in negative PDO, precipitation increase and decrease were distributed in east-central and southeast China, respectively. There are also many findings of decreased summer precipitation in east-central Chinaduring positive PDO (Lin et al., 2016; Yang et al., 2017).
4.3 Large-scale circulation patterns associated with the low-frequency oscillation indices
The date when extreme precipitation events occur in China (Julian Date) is identified as the seasonal characteristics (Son et al., 2017). The 80% interval of the empirical cumulative distribution of AM and POT series is used to select the respective Julian Date (Figure 7). The annual maximum precipitation events are mainly concentrated on days 143–244, and strong precipitation events are also concentrated around days 146–249, and their overlapping dates are taken as the Julian Date of extreme precipitation events (146–244). Extreme precipitation over China is concentrated in summer (May–August).
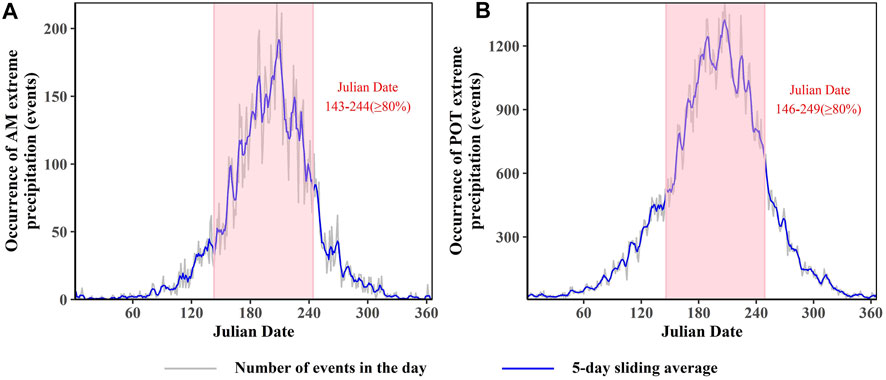
FIGURE 7. Intra-annual distribution of extreme precipitation events obtained from annual maximum (AM; (A) and POT sampling (B).
To further understand the regional influence of the positive/negative ENSO, IOD, NAO, SAM, and PDO on the occurrence probability of extreme precipitation events over China, we extract the anomalies of large-scale climate variables during Julian Date (146–244), based on the data of atmospheric precipitable water, vertically integrated moisture transport (VIMT), 500 hPa geopotential height and 850 hPa wind field. Furthermore, the atmospheric circulation patterns of LFOs affecting the occurrence probability of extreme precipitation events are analyzed. Figure 8 explains the thermodynamic factor of the precipitation driving mechanism and Figure 9 explains the dynamical factor.
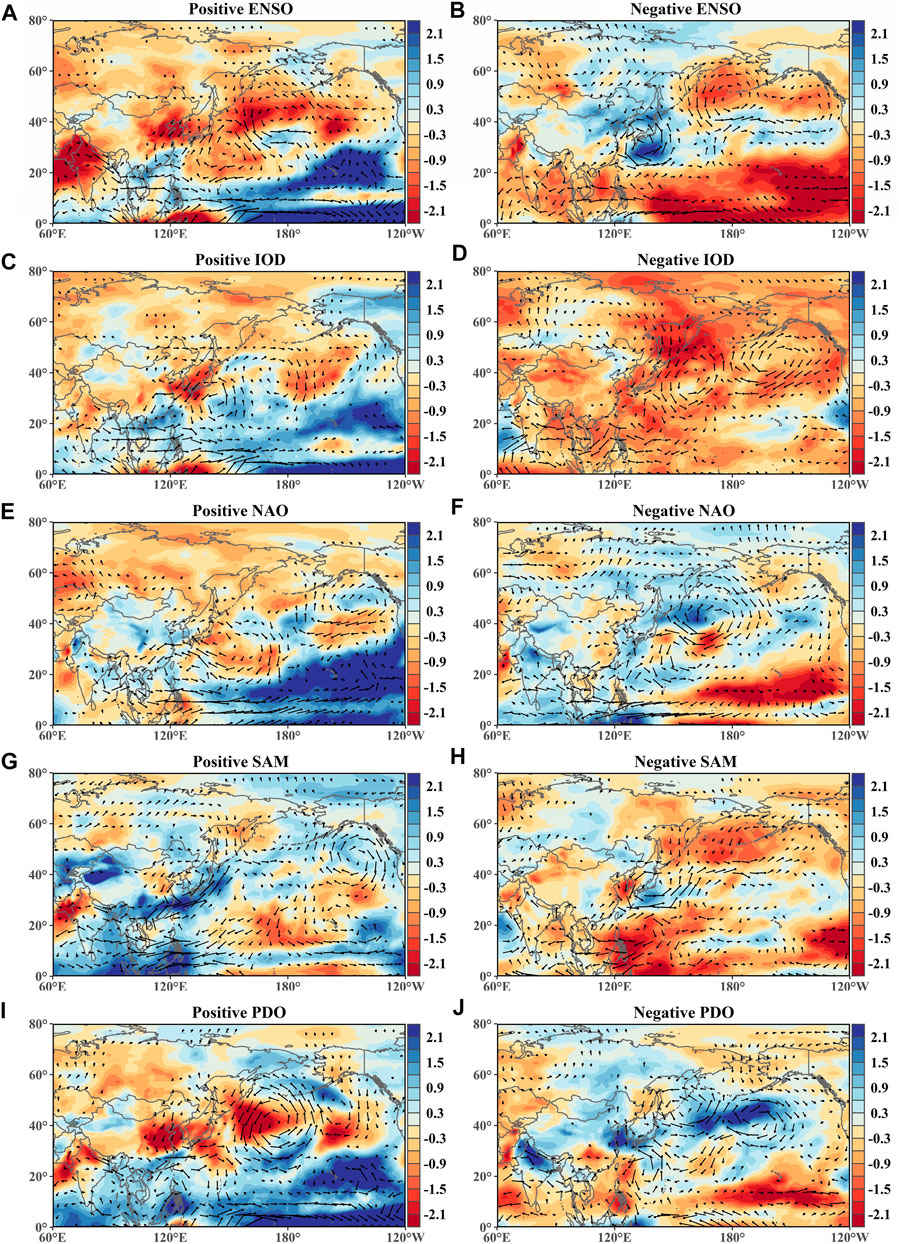
FIGURE 8. Composite patterns of precipitable water (shadows) and water vapor flux (arrows) anomalies in the days (Julian days 146–244) that extreme precipitation frequently occurred in. The anomalies are obtained from the most five positive and negative phases of ENSO (A–B), IOD (C–D), NAO (E–F), SAM (G–H), and PDO (I–J), respectively.
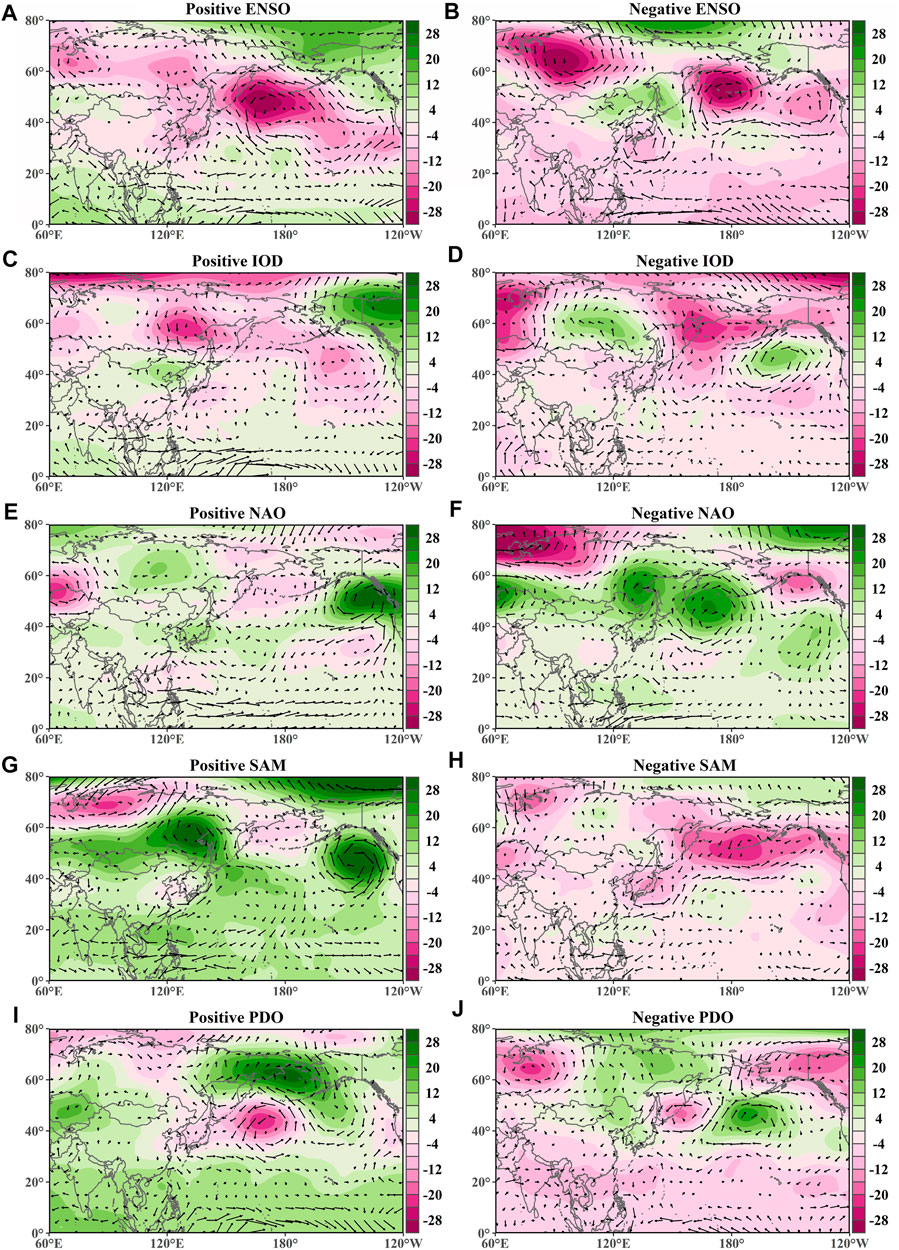
FIGURE 9. The same as Figure 8 but for 500-hPa potential height (shadows) and 850-hPa wind field (arrows) anomalies.
When ENSO is in the negative phase, that is, La Niña occurs, a cyclonic water vapor circulation anomaly appears on the east direction of China (Figure 8B). The positive geopotential height anomaly in the northeast direction of China and the negative anomaly over Japan accompanied by the easterly wind anomaly (Figure 9B), which transports more water vapor to most parts of China. Therefore, a precipitation configuration opposite to the positive ENSO is generated.
Li and Mu (2001) pointed out that IOD affects precipitation of southern China mainly by influencing the Indian summer monsoon. In IOD positive phase, there are anomalous southeasterly winds over the equatorial eastern Indian Ocean (EIO) (Hong et al., 2008), anomalous westerly winds over the Indian Peninsula, anomalous westerly winds over the Bay of Bengal to the South China Sea (SCS) (Li and Mu, 2001) (Figure 9C). There are cyclone anomalies in the Tibet Plateau and southwestern China, and a positive anomaly center of precipitable water in the SCS (Figure 8C). This circulation anomaly enhances the humid southwesterly winds blowing from the Bay of Bengal into southern China, promoting precipitation in southern China (Qiu et al., 2014). The anomalous southerly winds over the Indian peninsula also deliver wet summer monsoon to northwest China, increasing precipitation in the northwest. In addition, positive pressure anomalies exist in most of China, particularly in the north (Weng et al., 2011) (Figure 9C), and the water vapor lacks the power to continue northward after reaching the south, leading to the decrease of precipitation in northern China.
Positive and negative IOD events are asymmetrical (Qiu et al., 2014). In IOD negative phase, there is a weak westerly wind anomaly over the equatorial EIO (Hong et al., 2008) (Figure 9D), which means that the Indian summer monsoon is weak, and the northern hemisphere is mostly in a state of water vapor scarcity (Figure 8D). Moreover, due to the interaction of the positive pressure anomaly in Central Siberia and the negative pressure anomaly in Eastern Siberia (Figure 9D), the less vapor in the northwestern China is taken away, making the northwest extremely dry during negative IOD.
Positive (negative) NAO causes negative (positive) geopotential height anomaly in northeastern Asia, which affects precipitation in eastern China. When NAO is in a positive phase, low geopotential height anomalies are located in southeastern Russia and southeastern China, which are consistent with positive precipitation anomalies. Positive NAO corresponds to negative precipitation anomaly in western China (Linderholm et al., 2011). A negative pressure anomaly exists in eastern Tibet plateau, producing a low-level northward (southward) airflow anomaly over northern (southern) China (Figure 9E). The anomalous northward and southward winds convergence enhance the summer precipitation in east-central China (Wang et al., 2018). In addition, there is a negative pressure anomaly covering the SCS and southern China. This cyclone anomaly brings sufficient water vapor from the middle and low latitudes of the Pacific (Figure 8E) to southern China and into central China, causing increased precipitation in these regions.
Negative NAO may be the driving factor of drought in northern China. When NAO is in the negative phase, the easterly extension of the North Atlantic jet could be enhanced by the cyclonic vortex-driven jet, and the excited Ross by wave energy anomaly spreads to the Mongolia and northern China, enhancing the anticyclonic anomaly in northern China and making the precipitation in northeastern China decrease (Du et al., 2020). In southern China, due to the negative pressure anomaly advancing inland China, accompanied by the anticyclonic anomaly in northern China (Figure 9F), water vapor went deep into the inland China and accumulated there (Figure 8F), so the precipitation in western China increased.
SAM can affect precipitation in southern China by impacting the Maskelyne high pressure and Australian high pressure, thus causing changes in the Somali Rapids and the SCS trans-equatorial flow. These air flows cause East Asian summer wind anomalies and WPSH intensity and position anomalies, and affect precipitation in southern China through the Indian Ocean and the Pacific Ocean channel (Li, 2016; Li et al., 2017). In positive, mid-latitude Eurasia is controlled by an anomalous anticyclonic circulation. And there is a weak cyclonic anomaly in eastern China, allowing the anomalous northerly flow to extend from mid-latitudes along the East Asian coast to southern China (Figure 9G). The prevailing northerly anomalous meridional airflow in the mid-latitude westerlies in Asia promotes the ability of cold air mass from higher latitudes to reach the middle and lower latitudes, generating abundant convective conditions and promoting precipitation in southern China (Nan and Li, 2003; Dou et al., 2020). At the same time, the position of the WPSH is to the west and south, which provides favorable circulation conditions for more summer precipitation in southern China (J. Li, 2016). In addition, the negative pressure anomaly in eastern China also brings abundant water vapor from the northwest Pacific Ocean (Figure 8G) into northwest China, contributing to increased precipitation there.
When SAM is in the negative phase, the water vapor and air pressure configuration are nearly opposite to the positive SAM (Figures 8H, 9H). Cyclonic circulation anomalies over Japan and anticyclonic circulation anomalies over the SCS are manifested in eastern China as anomalous southerly winds. The weak meridional airflow in subpolar westerlies is not favorable to the cold air southward movement, and convective conditions are attenuated, making precipitation in southern China decrease (Nan & Li, 2003).
The interannual relationship between ENSO and global climate can be regulated by PDO (S. Wang et al., 2014). PDO and ENSO affect SST and cyclic patterns in a very similar way (Gershunov and Barnett, 1998). During the positive PDO phase, anomalous cyclones in the extratropical North Pacific and anomalous strengthening of the westerly wind in the tropical Central Pacific (Figure 9I) favor the formation of El Niño events (Song & Wang, 2020). Since the Asian summer monsoon mainly originates from the heat difference between land and sea in the north, there are positive pressure anomalies over the Asian continent, which weakens the Asian summer monsoon, and is not conducive for the water vapor transport from low latitudes to eastern and northeastern China (Dong, 2016). Consequently, precipitation increases in southeastern China, while it decreases in northeastern and inland areas (Hu et al., 2011; Qian and Zhou, 2014). However, when PDO is in the negative phase, the cyclonic anomaly in southeastern Russia accompanied by the positive pressure anomaly in northeastern China leads to the easterly wind anomaly (Figure 9J), which brings sufficient water vapor in the North Pacific Ocean (Figure 8J) to northern and inland China, and promotes increased precipitation in the region.
5 Conclusion
Stationary and non-stationary GEV/GP distributions are used to estimate the occurrence probability of extreme precipitation over China during 1961–2018. ENSO, IOD, NAO, SAM and PDO are selected as covariates of the non-stationary GEV/GP distribution.
The location and scale parameters of the stationary GEV distribution fitted by the AM series and the stationary GP distribution fitted by the POT series showed a decreasing trend from southeast to northwest, consistent with the spatial distribution of extreme thresholds. The 10-, 20-, and 100-year extreme precipitation return values estimated by the GEV distribution are 36%, 30%, and 25% smaller than those of the GP distribution, respectively. The GEV distribution mainly underestimates the extreme precipitation in east-central, northeastern and northwestern China.
The fit of AM/POT series is improved by the non-stationary GEV/GP distributions obtained using LFO indices as time-varying covariates. ENSO and PDO have a synergistic effect, and the impact on the occurrence probability of extreme precipitation over China mainly results in significantly decreasing in northeastern, central China and Tibet Plateau, and increasing in southeastern China. IOD is supposed to have similar impact to ENSO, but the active southwestern airflow from the Indian Ocean into northwestern China makes it show a significant increase. The influence of NAO on the occurrence probability of extreme precipitation over China is less significant, which mainly shows an increase in central China and a decrease in northwestern and southwestern China. SAM has contributed to the development of precipitation and a large range of increasing occurrence probability of extreme precipitation occurred in China, with northwestern and southern China being the main significant regions.
The effects of the five LFO indices on extreme precipitation over China are mainly regulated by the summer monsoon. El Niño occurs when the EASM weakens because of the strengthening of the WPSH and cyclonic anomalies over the East Asia-North Pacific. The same effect is produced by the anomaly of positive pressure in the Asian continent during positive PDO, which gives rise to an increase in southeast and a decrease in northeast. Cyclonic anomalies exist over the Tibet Plateau at the time of positive IOD, so the Indian summer monsoon carrying moist southwesterly airflow is strengthened and the precipitation increases in northwestern China. The cyclonic anomalies over the SCS extend into southern China at positive NAO and anticyclonic anomalies in north have increased precipitation in southeastern and east-central China. The positive SAM occurs when widespread anticyclonic anomalies over Asia and Europe, as well as negative pressure anomalies in eastern China, and provides sufficient power for water vapor transport, resulting in increased precipitation over a wide area of China.
Many previous studies have investigated spatio-temporal changes in extreme precipitation (such as magnitude and frequency) in China during the past decades, and explored the circulation patterns behind these changes in extreme precipitation. Our study built stationary and non-stationary frequency analysis models to detect changes in occurrence probability (i.e. return level) of extreme precipitation, and explore the dependence between the occurrence probability and LFO. In comparison with directly analyzing the variation in magnitude and frequency of extreme precipitation shown in previous studies, the occurrence probability (i.e. return level) analysis has closer relations with the design of hydraulic engineerings, such as sewerage engineering. By taking the LFO indices be the covariates to build the non-stationary frequency analysis model, we further quantify the impacts of LFO indices on the occurrence probability of extreme precipitation. Strong regional patterns of dependence between the occurrence probability and given LFO index are found in China. These regional patterns indicate that these LFO indices could be taken as a predictor for the risk evaluation of hydraulic engineering under extreme precipitation.
Data availability statement
The CN05.1 datasets can be requested by contacting Jia Wu (http://ccrc.iap.ac.cn/resource/detail?id=228). The monthly ENSO, NAO, IOD, SAM, and PDO can be obtained from the US National Climate Center (http://www.esrl.noaa.gov/psd/data/climateindices/list/), and the JAR-55 re-analysis data are available at https://rda.ucar.edu/datasets/ds628.0/index.html.
Author contributions
XG and JD design this study, XK conducts the data calculation and visualization, and writes the first draft, all the authors review and editing the final draft and contribute to the interpretations of results.
Funding
This study is supported by the open funding from State Key Laboratory of Water Resources and Hydropower Engineering Science (Wuhan University) (Grant 2021SWG01), the Central Educational Reform Fund for Colleges and Universities (Grant 2020G12), and Innovation and Entrepreneurship Training Program for College Students (Grant 202210491006).
Acknowledgments
We thank Dr. Jia Wu for providing the gridded precipitation dataset (i.e. CN05.1) (P. Wu et al., 2013). Many thanks are given to the Editor and two reviewers.
Conflict of interest
The authors declare that the research was conducted in the absence of any commercial or financial relationships that could be construed as a potential conflict of interest.
Publisher’s note
All claims expressed in this article are solely those of the authors and do not necessarily represent those of their affiliated organizations, or those of the publisher, the editors and the reviewers. Any product that may be evaluated in this article, or claim that may be made by its manufacturer, is not guaranteed or endorsed by the publisher.
References
Ashok, K., Guan, Z., and Yamagata, T. (2003). A look at the relationship between the ENSO and the Indian Ocean Dipole. J. Meteorological Soc. Jpn. 81 (1), 41–56. doi:10.2151/JMSJ.81.41
Baldwin, M. P. (2001). Annular modes in global daily surface pressure. Geophys. Res. Lett. 28 (21), 4115–4118. doi:10.1029/2001GL013564
Bodini, A., and Klotz, S. (2002). “The science of ecology for a sustainable world,” in Knowledge for sustainable development: An insight into the encyclopaedia of life support systems (Oxford, United Kingdom: EOLSS Publishers Co. Ltd).
Cazelles, B., and Hales, S. (2006). Infectious diseases, climate influences, and nonstationarity. PLoS Med. 3 (8), e328. doi:10.1371/JOURNAL.PMED.0030328
Chan, J. C. L., and Zhou, W. (2005). PDO, ENSO and the early summer monsoon rainfall over south China. Geophys. Res. Lett. 32 (8), L08810–L08815. doi:10.1029/2004GL022015
Chen, F., Chen, J., and Huang, W. (2021). Weakened East Asian summer monsoon triggers increased precipitation in northwest China. Sci. China Earth Sci. 64 (5), 835–837. doi:10.1007/s11430-020-9731-7
Chen, W., Feng, J., and Wu, R. (2013). Roles of ENSO and PDO in the link of the east asian winter monsoon to the following summer monsoon. J. Clim. 26 (2), 622–635. doi:10.1175/JCLI-D-12-00021.1
Cheng, L., AghaKouchak, A., Gilleland, E., and Katz, R. W. (2014). Non-stationary extreme value analysis in a changing climate. Clim. Change 127 (2), 353–369. doi:10.1007/s10584-014-1254-5
Cuo, L., Zhang, Y., Wang, Q., Zhang, L., Zhou, B., Hao, Z., et al. (2013). Climate change on the northern Tibetan plateau during 1957–2009: Spatial patterns and possible mechanisms. J. Clim. 26 (1), 85–109. doi:10.1175/JCLI-D-11-00738.1
Ding, Q., and Wang, B. (2005). Circumglobal teleconnection in the northern hemisphere summer. J. Clim. 18 (17), 3483–3505. doi:10.1175/JCLI3473.1
Dong, X. (2016). Influences of the pacific decadal oscillation on the east asian summer monsoon in non-ENSO years. Atmos. Sci. Lett. 17 (1), 115–120. doi:10.1002/asl.634
Dou, J., Wu, Z., and Li, J. (2020). The strengthened relationship between the yangtze river Valley summer rainfall and the Southern Hemisphere annular mode in recent decades. Clim. Dyn. 54 (3–4), 1607–1624. doi:10.1007/s00382-019-05078-4
Du, Y., Zhang, J., Zhao, S., and Chen, H. (2020). Impact of the eastward shift in the negative-phase NAO on extreme drought over northern China in summer. J. Geophys. Res. Atmos. 125 (16), e2019JD032019. doi:10.1029/2019JD032019
Duzenli, E., Tabari, H., Willems, P., and Yilmaz, M. T. (2018). Decadal variability analysis of extreme precipitation in Turkey and its relationship with teleconnection patterns. Hydrol. Process. 32 (23), 3513–3528. doi:10.1002/HYP.13275
Fu, G., Yu, J., Yu, X., Ouyang, R., Zhang, Y., Wang, P., et al. (2013). Temporal variation of extreme rainfall events in China, 1961-2009. J. Hydrology 487, 48–59. doi:10.1016/j.jhydrol.2013.02.021
Gao, T., Wang, H. J., and Zhou, T. (2017). Changes of extreme precipitation and nonlinear influence of climate variables over monsoon region in China. Atmos. Res. 197, 379–389. doi:10.1016/j.atmosres.2017.07.017
Gao, T., and Xie, L. (2016). Spatiotemporal changes in precipitation extremes over yangtze river basin, china, considering the rainfall shift in the late 1970s. Glob. Planet. Change 147, 106–124. doi:10.1016/J.GLOPLACHA.2016.10.016
Gao, T., Xu, Y., Wang, H. J., Sun, Q., Xie, L., and Cao, F. (2022). Combined impacts of climate variability modes on seasonal precipitation extremes over China. Water Resour. manage. 36 (7), 2411–2431. doi:10.1007/s11269-022-03150-z
Gershunov, A., and Barnett, T. P. (1998). Interdecadal modulation of ENSO teleconnections. Bull. Am. Meteorological Soc. 79 (12). doi:10.1175/1520-0477(1998)079<2715:IMOET>2.0.CO;2
Giraldo Osorio, J. D., and García Galiano, S. G. (2012). Non-stationary analysis of dry spells in monsoon season of senegal river basin using data from regional climate models (RCMs). J. Hydrology 450–451, 82–92. doi:10.1016/J.JHYDROL.2012.05.029
Gong, D., and Wang, S. (1999). Impacts of ENSO on rainfall of global land and china. Chin. Sci. Bull. 4444 (99), 852–857. doi:10.1007/BF02885036
Gu, W., Li, C., Li, W., Zhou, W., and Chan, J. C. L. (2009). Interdecadal unstationary relationship between NAO and east China’s summer precipitation patterns. Geophys. Res. Lett. 36 (13), L13702. doi:10.1029/2009GL038843
Gu, X., Zhang, Q., Li, J., Chen, D., Singh, V. P., Zhang, Y., et al. (2020). Impacts of anthropogenic warming and uneven regional socio-economic development on global river flood risk. J. Hydrology 590, 125262. doi:10.1016/j.jhydrol.2020.125262
Gu, X., Zhang, Q., Singh, V. P., Liu, L., and Shi, P. (2017a). Spatiotemporal patterns of annual and seasonal precipitation extreme distributions across china and potential impact of tropical cyclones. Int. J. Climatol. 37 (10), 3949–3962. doi:10.1002/JOC.4969
Gu, X., Zhang, Q., Singh, V. P., and Shi, P. (2017b). Changes in magnitude and frequency of heavy precipitation across china and its potential links to summer temperature. J. Hydrology 547, 718–731. doi:10.1016/j.jhydrol.2017.02.041
He, L., Hao, X., Li, H., and Han, T. (2021). How do extreme summer precipitation events over eastern China subregions change? Geophys. Res. Lett. 48 (5). doi:10.1029/2020GL091849
Hejazi, M. I., and Markus, M. (2009). Impacts of urbanization and climate variability on floods in northeastern Illinois. J. Hydrol. Eng. 14 (6), 606–616. doi:10.1061/(ASCE)HE.1943-5584.0000020
Held, I. M., and Soden, B. J. (2006). Robust responses of the hydrological cycle to global warming. J. Clim. 19 (21), 5686–5699. doi:10.1175/JCLI3990.1
Hong, C. C., Lu, M. M., and Kanamitsu, M. (2008). Temporal and spatial characteristics of positive and negative indian ocean dipole with and without ENSO. J. Geophys. Res. 113 (8), D08107. doi:10.1029/2007JD009151
Hu, K., Huang, G., and Huang, R. (2011). The impact of tropical indian ocean variability on summer surface air temperature in China. J. Clim. 24 (20), 5365–5377. doi:10.1175/2011JCLI4152.1
Huijun, W. (2001). The weakening of the asian monsoon circulation after the end of 1970’s. Adv. Atmos. Sci. 1818 (33), 376–386. doi:10.1007/BF02919316
Ibrahim, M. N. (2019). Generalized distributions for modeling precipitation extremes based on the L moment approach for the amman zara basin, jordan. Theor. Appl. Climatol. 138 (1–2), 1075–1093. doi:10.1007/s00704-019-02863-3
Ishak, E. H., Rahman, A., Westra, S., Sharma, A., and Kuczera, G. (2013). Evaluating the non-stationarity of australian annual maximum flood. J. Hydrology 494, 134–145. doi:10.1016/J.JHYDROL.2013.04.021
Jin, H., Chen, X., Wu, P., Song, C., and Xia, W. (2021). Evaluation of spatial-temporal distribution of precipitation in mainland China by statistic and clustering methods. Atmos. Res. 262, 105772. doi:10.1016/J.ATMOSRES.2021.105772
Khaliq, M. N., Ouarda, T. B. M. J., Ondo, J. C., Gachon, P., and Bobée, B. (2006). Frequency analysis of a sequence of dependent and/or non-stationary hydro-meteorological observations: A review. J. Hydrology 329 (3–4), 534–552. doi:10.1016/j.jhydrol.2006.03.004
Klein Tank, A. B. G., and Zwiers, F. W. (2009). Guidelines on analysis of extremes in a changing climate in support of informed decisions for adaptation. World Meteorological Organization.
Lai, Y., Li, J., Gu, X., Chen, Y. D., Kong, D., Gan, T. Y., et al. (2020). Greater flood risks in response to slowdown of tropical cyclones over the coast of China. Proc. Natl. Acad. Sci. U. S. A. 117 (26), 14751–14755. doi:10.1073/PNAS.1918987117/
Lai, Y., Li, J., Gu, X., Liu, C., and Chen, Y. D. (2021). Global compound floods from precipitation and storm surge: Hazards and the roles of cyclones. J. Clim. 34 (20), 1–55. doi:10.1175/JCLI-D-21-0050.1
Li, C., and Mu, M. (2001). The influence of the Indian ocean dipole on atmospheric circulation and climate. Adv. Atmos. Sci. 18 (5), 831–843. doi:10.1007/bf03403506
Li, C., and Zhao, T. (2019). Seasonal responses of precipitation in China to El Niño and positive Indian Ocean Dipole modes. Atmosphere 10 (7), 372. doi:10.3390/ATMOS10070372
Li, F., Lin, W., and Li, J. (2020). ENSO-related impact on the vapor sources of china based on case simulations of summer 2015 and 2010. J. Atmos. Solar-Terrestrial Phys. 211, 105489. doi:10.1016/J.JASTP.2020.105489
Li, H., Dai, A., Zhou, T., and Lu, J. (2010). Responses of East Asian summer monsoon to historical SST and atmospheric forcing during 1950-2000. Clim. Dyn. 34 (4), 501–514. doi:10.1007/s00382-008-0482-7
Li, J. (2016). Impacts of annular modes on extreme climate events over the east asian monsoon region. Dyn. Predict. Large-Scale, High-Impact Weather Clim. Events, 343–353. doi:10.1017/CBO9781107775541.028
Li, J. X., Ren, H. L., Lu, B., Liu, J. P., and Kang, Y. Z. (2017). Collaborative effects of phase configurations of north atlantic oscillation and southern annular mode on summer precipitation anomalies over southern china. Acta Geophys. Sin. 60 (10), 3730–3744. doi:10.6038/CJG20171004
Li, M., Li, X., and Ao, T. (2019). Comparative study of regional frequency analysis and traditional at-site hydrological frequency analysis. WaterSwitzerl. 11 (3), 486. doi:10.3390/w11030486
Li, Z., Zhou, P., Shi, X., and Li, Y. (2021). Forest effects on runoff under climate change in the upper dongjiang river basin: insights from annual to intra-annual scales. Environ. Res. Lett. 16 (1), 014032. doi:10.1088/1748-9326/abd066
Library, W. O., Dong, X., Li, Y., Jia, Q., Zi, H., and Yang, C. (2016). Influences of the pacific decadal oscillation on the east asian summer monsoon in non-ENSO years. Atmos. Sci. Lett. 17 (1), 115–120. doi:10.1002/ASL.634
Limpasuvan, V., and Hartmann, D. L. (1999). Eddies and the annular modes of climate variability. Geophys. Res. Lett. 26 (20), 3133–3136. doi:10.1029/1999GL010478
Limpasuvan, V., and Hartmann, D. L. (2000). Wave-maintained annular modes of climate variability. J. Clim. 13 (24). doi:10.1175/1520-0442(2000)013<4414:WMAMOC>2.0.CO;2
Lin, R., Zhu, J., and Zheng, F. (2016). Decadal shifts of East Asian summer monsoon in a climate model free of explicit GHGs and aerosols. Sci. Rep. 6 (11), 38546–38549. doi:10.1038/srep38546
Linderholm, H. W., Ou, T., Jeong, J. H., Folland, C. K., Gong, D., Liu, H., et al. (2011). Interannual teleconnections between the summer North Atlantic oscillation and the east asian summer monsoon. J. Geophys. Res. 116 (D13), D13107. doi:10.1029/2010JD015235
Liu, B., Peng, S., Liao, Y., and Wang, H. (2019). The characteristics and causes of increasingly severe saltwater intrusion in Pearl River Estuary. Estuar. Coast. Shelf Sci. 220, 54–63. doi:10.1016/J.ECSS.2019.02.041
Liu, J., You, Y., Li, J., Sitch, S., Gu, X., Nabel, J. E. M. S., et al. (2021). Response of global land evapotranspiration to climate change, elevated CO2, and land use change. Agric. For. Meteorology 311, 108663. doi:10.1016/j.agrformet.2021.108663
Lv, A., Qu, B., Jia, S., and Zhu, W. (2019). Influence of three phases of El Niño-Southern oscillation on daily precipitation regimes in China. Hydrol. Earth Syst. Sci. 23 (2), 883–896. doi:10.5194/hess-23-883-2019
Ma, S., Zhou, T., Dai, A., and Han, Z. (2015). Observed changes in the distributions of daily precipitation frequency and amount over China from 1960 to 2013. J. Clim. 28 (17), 6960–6978. doi:10.1175/JCLI-D-15-0011.1
Mallakpour, I., and Villarini, G. (2016). Investigating the relationship between the frequency of flooding over the central United States and large-scale climate. Adv. Water Resour. 92, 159–171. doi:10.1016/J.ADVWATRES.2016.04.008
Min, S. K., Zhang, X., Zwiers, F. W., and Hegerl, G. C. (2011). Human contribution to more-intense precipitation extremes. Nature 470 (7334), 378–381. doi:10.1038/nature09763
Mondal, A., and Mujumdar, P. P. (2015). Modeling non-stationarity in intensity, duration and frequency of extreme rainfall over India. J. Hydrology 521, 217–231. doi:10.1016/J.JHYDROL.2014.11.071
Nan, S., and Li, J. (2003). The relationship between the summer precipitation in the Yangtze River valley and the boreal spring Southern Hemisphere annular mode. Geophys. Res. Lett. 30 (24), 2266. doi:10.1029/2003GL018381
Nasri, B., Tramblay, Y., el Adlouni, S., Hertig, E., and Ouarda, T. B. M. J. (2016). Atmospheric predictors for annual maximum precipitation in north africa. J. Appl. Meteorol. Climatol. 55 (4), 1063–1076. doi:10.1175/JAMC-D-14-0122.1
O’Gorman, P. A., and Schneider, T. (2009). The physical basis for increases in precipitation extremes in simulations of 21st-century climate change. Proc. Natl. Acad. Sci. U. S. A. 106 (35), 14773–14777. doi:10.1073/PNAS.0907610106/SUPPL_FILE/0907610106SI
Qian, C., and Zhou, T. (2014). Multidecadal variability of north china aridity and its relationship to PDO during 1900-2010. J. Clim. 27 (3), 1210–1222. doi:10.1175/JCLI-D-13-00235.1
Qiu, Y., Cai, W., Guo, X., and Ng, B. (2014). The asymmetric influence of the positive and negative IOD events on China’s rainfall. Sci. Rep. 4, 4943. doi:10.1038/srep04943
Romali, N. S., Yusop, Z., and Ismail, A. Z. (2018). Application of HEC-RAS and Arc GIS for floodplain mapping in Segamat town, Malaysia. Int. J. Geomate 15 (47). doi:10.21660/2018.47.3656
Saji, N. H., and Yamagata, T. (2003). Possible impacts of indian ocean dipole mode events on global climate. Clim. Res. 25 (2), 151–169. doi:10.3354/cr025151
Salinger, M. J., and Griffiths, G. M. (2001). Trends in new zealand daily temperature and rainfall extremes. Int. J. Climatol. 21 (12), 1437–1452. doi:10.1002/JOC.694
Sang, Y. F., Fu, Q., Singh, V. P., Sivakumar, B., Zhu, Y., and Li, X. (2020). Does summer precipitation in china exhibit significant periodicities? J. Hydrology 581, 124289. doi:10.1016/j.jhydrol.2019.124289
Santos, E. B., Lucio, P. S., and Santos e Silva, C. M. (2015). Seasonal analysis of return periods for maximum daily precipitation in the brazilian Amazon. J. Hydrometeorol. 16 (3), 973–984. doi:10.1175/JHM-D-14-0201.1
Smith, E. P. (2002). An introduction to statistical modeling of extreme values. Technometrics 44 (4), 397. doi:10.1198/tech.2002.s73
Son, S. W., Lim, Y., Yoo, C., Hendon, H. H., and Kim, J. (2017). Stratospheric control of the madden–julian oscillation. J. Clim. 30 (6), 1909–1922. doi:10.1175/JCLI-D-16-0620.1
Song, W. J., and Wang, Q. G. (2020). CP El Niño and PDO variability affect summer precipitation over east China. Adv. Meteorology, 1–15. doi:10.1155/2020/2747194
Stojkovic, M., and Simonovic, S. P. (2019). Mixed general extreme value distribution for estimation of future precipitation quantiles using a weighted ensemble - case study of the lim river basin (Serbia). Water Resour. manage. 33 (8), 2885–2906. doi:10.1007/s11269-019-02277-w
Sun, J., and Zhang, F. Q. (2017). Daily extreme precipitation and trends over China. Sci. China Earth Sci. 60 (1212), 2190–2203. doi:10.1007/S11430-016-9117-8
Sun, Q., Miao, C., Qiao, Y., and Duan, Q. (2017). The nonstationary impact of local temperature changes and ENSO on extreme precipitation at the global scale. Clim. Dyn. 49 (11–12), 4281–4292. doi:10.1007/s00382-017-3586-0
Tan, X., and Gan, T. Y. (2017). Non-stationary analysis of the frequency and intensity of heavy precipitation over canada and their relations to large-scale climate patterns. Clim. Dyn. 48 (9–10), 2983–3001. doi:10.1007/s00382-016-3246-9
Thiombiano, A. N., St-Hilaire, A., el Adlouni, S. E., and Ouarda, T. B. M. J. (2018). Nonlinear response of precipitation to climate indices using a non-stationary poisson-generalized pareto model: Case study of southeastern Canada. Int. J. Climatol. 38, e875–e888. doi:10.1002/JOC.5415
Wagesho, N., Goel, N. K., and Jain, M. K. (2012). Investigation of non-stationarity in hydro-climatic variables at rift valley lakes basin of ethiopia. J. Hydrology 444 (445), 113–133. doi:10.1016/J.JHYDROL.2012.04.011
Wang, H., and Fan, K. (2005). central-north China precipitation as reconstructed from the qing dynasty: Signal of the antarctic atmospheric oscillation. Geophys. Res. Lett. 32 (24), 247055–L24714. doi:10.1029/2005GL024562
Wang, S., Huang, J., He, Y., and Guan, Y. (2014). Combined effects of the pacific decadal oscillation and el niño-southern oscillation on global land dry-wet changes. Sci. Rep. 4, 6651. doi:10.1038/SREP06651
Wang, Y., Li, J., Feng, P., and Hu, R. (2015). A time-dependent drought index for non-stationary precipitation series. Water Resour. manage. 29 (15), 5631–5647. doi:10.1007/s11269-015-1138-0
Wang, Z., Yang, S., Lau, N. C., and Duan, A. (2018). Teleconnection between summer NAO and east China rainfall variations: A bridge effect of the tibetan plateau. J. Clim. 31 (16), 6433–6444. doi:10.1175/JCLI-D-17-0413.1
Wei, T., Liu, C., Dong, W., Yu, H., Yang, S., Yan, Q., et al. (2021). Reduction in extreme climate events and potential impacts by the use of technological advances. Int. J. Climatol. 41 (4), 2495–2508. doi:10.1002/joc.6971
Weng, H., Wu, G., Liu, Y., Behera, S. K., and Yamagata, T. (2011). Anomalous summer climate in china influenced by the tropical indo-pacific oceans. Clim. Dyn. 36 (3), 769–782. doi:10.1007/s00382-009-0658-9
Wi, S., Valdés, J. B., Steinschneider, S., and Kim, T. W. (2016). Non-stationary frequency analysis of extreme precipitation in south korea using peaks-over-threshold and annual maxima. Stoch. Environ. Res. Risk Assess. 30 (2), 583–606. doi:10.1007/s00477-015-1180-8
Wilks, D. S. (2006). On “field significance” and the false discovery rate. J. Appl. Meteorol. Climatol. 45 (9), 1181–1189. doi:10.1175/JAM2404.1
Wu, J., Gao, X., Giorgi, F., and Chen, D. (2017). Changes of effective temperature and cold/hot days in late decades over china based on a high resolution gridded observation dataset. Int. J. Climatol. 37, 788–800. doi:10.1002/joc.5038
Wu, P., Christidis, N., and Stott, P. (2013). Anthropogenic impact on earth’s hydrological cycle. Nat. Clim. Chang. 3 (9), 807–810. doi:10.1038/nclimate1932
Wu, Z., Li, J., Wang, B., and Liu, X. (2009). Can the Southern Hemisphere annular mode affect china winter monsoon? J. Geophys. Res. 114 (D11), 11107. doi:10.1029/2008JD011501
Xavier, A. C. F., Rudke, A. P., Fujita, T., Blain, G. C., de Morais, M. V. B., de Almeida, D. S., et al. (2020). Stationary and non-stationary detection of extreme precipitation events and trends of average precipitation from 1980 to 2010 in the Paraná River basin, Brazil. Int. J. Climatol. 40 (2), 1197–1212. doi:10.1002/joc.6265
Xiao, M., Zhang, Q., and Singh, V. P. (2015). Influences of ENSO, NAO, IOD and PDO on seasonal precipitation regimes in the yangtze river basin, china. Int. J. Climatol. 35 (12), 3556–3567. doi:10.1002/JOC.4228
Xiao, M., Zhang, Q., Singh, V. P., and Liu, L. (2016). Transitional properties of droughts and related impacts of climate indices in the Pearl River basin, China. J. Hydrology 534, 397–406. doi:10.1016/j.jhydrol.2016.01.012
Xie, W., Yi, S., Leng, C., Xia, D., Li, M., Zhong, Z., et al. (2022). The evaluation of IMERG and ERA5-Land daily precipitation over China with considering the influence of gauge data bias. Sci. Rep. 12 (11), 8085–8121. doi:10.1038/S41598-022-12307-0
Xu, K., Zhu, C., and Wang, W. (2016). The cooperative impacts of the El Niño–Southern oscillation and the indian ocean dipole on the interannual variability of autumn rainfall in China. Int. J. Climatol. 36 (4), 1987–1999. doi:10.1002/JOC.4475
Xu, Z., Fan, K., and Wang, H. (2015). Decadal variation of summer precipitation over china and associated atmospheric circulation after the late 1990s. J. Clim. 28 (10), 4086–4106. doi:10.1175/JCLI-D-14-00464.1
Xue, X., Chen, W., Chen, S., and Feng, J. (2018). PDO modulation of the ENSO impact on the summer south asian high. Clim. Dyn. 50 (3–4), 1393–1411. doi:10.1007/s00382-017-3692-z
Yang, Q., Ma, Z., Fan, X., Yang, Z. L., Xu, Z., and Wu, P. (2017). Decadal modulation of precipitation patterns over eastern China by sea surface temperature anomalies. J. Clim. 30 (17), 7017–7033. doi:10.1175/JCLI-D-16-0793.1
Yang, Y., and Tian, F. (2009). Abrupt change of runoff and its major driving factors in Haihe River Catchment, China. J. Hydrology 374 (3–4), 373–383. doi:10.1016/J.JHYDROL.2009.06.040
Yu, X., Gu, X., Kong, D., Zhang, Q., Cao, Q., Slater, L. J., et al. (2022). asymmetrical shift toward less light and more heavy precipitation in an urban agglomeration of East China: Intensification by urbanization. Geophys. Res. Lett. 49 (4). doi:10.1029/2021GL097046
Zakaria, S. A., Amin, N. A. M., Radi, N. F. A., and Hamidin, N. (2021). Stationary and non-stationary models of extreme ground-level ozone in peninsular malaysia. ms. 9 (3), 357–370. doi:10.13189/ms.2021.090318
Zeng, Y., Huang, C., Tang, Y., and Peng, J. (2021). Precipitation variations in the flood seasons of 1910–2019 in hunan and its association with the PDO, AMO, and ENSO. Front. Earth Sci. (Lausanne). 9, 204. doi:10.3389/feart.2021.656594
Zhai, P., Zhang, X., Wan, H., and Pan, X. (2005). Trends in total precipitation and frequency of daily precipitation extremes over China. J. Clim. 18 (7), 1096–1108. doi:10.1175/JCLI-3318.1
Zhang, Q., Gu, X., Li, J., Shi, P., and Singh, V. P. (2018). The impact of tropical cyclones on extreme precipitation over coastal and inland areas of china and its association to ENSO. J. Clim. 31 (5), 1865–1880. doi:10.1175/JCLI-D-17-0474.1
Zhang, R. H., Min, Q. Y., and Su, J. Z. (2017). Impact of El Niño on atmospheric circulations over east asia and rainfall in China: role of the anomalous Western North Pacific anticyclone. Sci. China Earth Sci. 60 (6), 1124–1132. doi:10.1007/s11430-016-9026-x
Zhang, X., Wan, H., Zwiers, F. W., Hegerl, G. C., and Min, S. K. (2013). Attributing intensification of precipitation extremes to human influence. Geophys. Res. Lett. 40 (19), 5252–5257. doi:10.1002/grl.51010
Zhang, X., Wang, J., Zwiers, F. W., and Groisman, P. Y. (2010). The influence of large-scale climate variability on winter maximum daily precipitation over north America. J. Clim. 23 (11), 2902–2915. doi:10.1175/2010JCLI3249.1
Keywords: extreme precipitation, GEV distribution, GP distribution, low-frequency oscillations, non-stationary frequency analysis
Citation: Kang X, Min R, Dai J and Gu X (2022) The role of teleconnection in the occurrence probability of extreme precipitation over China based on extreme value theory. Front. Environ. Sci. 10:1013636. doi: 10.3389/fenvs.2022.1013636
Received: 07 August 2022; Accepted: 26 September 2022;
Published: 13 October 2022.
Edited by:
Zengyun Hu, Chinese Academy of Sciences, ChinaReviewed by:
Xiang Song, Northwest Institute of Eco-Environment and Resources, CAS, ChinaZifeng Yu, China Meteorological Administration, China
Copyright © 2022 Kang, Min, Dai and Gu. This is an open-access article distributed under the terms of the Creative Commons Attribution License (CC BY). The use, distribution or reproduction in other forums is permitted, provided the original author(s) and the copyright owner(s) are credited and that the original publication in this journal is cited, in accordance with accepted academic practice. No use, distribution or reproduction is permitted which does not comply with these terms.
*Correspondence: Juan Dai, 841602471@qq.com; Xihui Gu, guxh@cug.edu.cn