Underwater Raman microscopy—a novel in situ tool for deep-sea microscale target studies
 Qingsheng Liu1
  Jinjia Guo1*
  Yuan Lu1
  Zihao Wei1 Shuang Liu1 Lulu Wu1 Wangquan Ye1
  Ronger Zheng1 Xilin Zhang2*
- 1College of Physics and Optoelectronic Engineering, Ocean University of China, Qingdao, China
- 2Key Laboratory of Gas Hydrate, Ministry of Natural Resources, Qingdao, China
Microscale processes and interactions in the ocean are pervasive. They play a fundamental role in global biogeochemical cycles and have a significant impact on benthic marine ecosystems. However, our understanding of microscale processes and interactions that appeared in the benthic environment is still very limited, particularly for the deep ocean, due to a lack of appropriate in situ observation and detection methods. To address this challenge, we have developed an in situ observation and detection system for microscopic targets suitable for the deep sea and have successfully deployed the instrument on a remotely operated vehicle (ROV) to achieve in situ microscopic Raman detection of targets on the seabed over a depth of 770 m. This is a combined system that integrated microscopic imaging and Raman detection techniques for in situ observation and analysis of underwater microscale targets. The complete system consists of an electronics chamber, a detection probe, and a precision external positioning device. Power supply and real-time data transmission are achieved via ROV tethers. This allows researchers to operate the instrument in real time to perform microscopic imaging capture and Raman spectroscopy acquisition of interesting targets on the seafloor. The first sea trial of the system was conducted in the South China Sea in 2020, and during the cruise, microscopic image acquisition and in situ compositional analysis of shell fragments, seabed rock samples, and live sea stars were successively performed. The system has solved the key technical challenges of deep-sea microscopic imaging, demonstrated the feasibility of deep-sea microscopic imaging, and illustrated the great potential of combining Raman spectroscopy and microscopic imaging in marine research. In this paper, we present the unique design of the instrument and the deep-sea results. With further optimization, the system promises to be a versatile instrument providing a unique perspective for deep-sea geochemical and biochemical studies.
1 Introduction
Microscale processes and interactions occurring in the marine can significantly influence benthic ecology and play an essential role in the formation and evolution of seabed landscapes at the macrolevel (Murray et al., 2002). Microscale processes and interactions dominated by sediment microbial communities and benthic organisms have already proved to play a fundamental role in global material cycling and energy exchange (Nguyen et al., 2022). In addition, microscale processes under extreme conditions in deep ocean waters, the seafloor, and the deep biosphere provide a way to reveal the processes that led to the origin of life and the potential for life on other planets and their moons (Colman et al., 2017). However, due to the lack of effective in situ observation methods, most benthic microscale studies were conducted by sampling (Sogin et al., 2006; Breier et al., 2012). Except for some stable processes that can correctly reproduce in the laboratory, much progress requires unique physical and chemical conditions (e.g., oligotrophic, low temperatures, high pressure, and, in some cases, limited oxygen concentrations). They are only stable in specific environments and cannot be completely simulated in the laboratory (Breier et al., 2010; Liang et al., 2021). For such processes, the best solution is to conduct in situ studies in the environment where it occurs. Over the past 20 years, the Global Ocean Observing System (GOOS) has promoted the Deep Ocean Observation Strategy (DOOS), which enhances the need for comprehensive and fine-grained ocean observations at greater depths (Levin et al., 2019). Nowadays, massive sensor arrays and observation networks extending thousands of miles over the seafloor make it possible to acquire real-time environmental data at greater depths and larger scales (Lin and Yang, 2020). In contrast, the development of microscale process detection in the marine environment remains slow, especially for the deep-sea benthic habitat, and only very few works about shallow water applications were reported (Mullen et al., 2016).
The challenges of performing microimaging in the deep sea are apparent: the system must surmount the harsh application environment and simultaneously provide good maneuverability. On the one hand, system vibrations caused by currents and ROV thrusters will be accumulated and amplified by the microscopic imaging system, resulting in dynamic blurring of the images. Thus, the system must operate in a fast imaging mode, which requires high brightness illumination and a fast precision focus to ensure the quality of the microscopic images. On the other hand, instrument operation is a significant challenge for deep-sea microimaging. Solid targets on the seabed are often opaque, complex, and non-homogeneous mixtures requiring micron-scale precision-focusing capabilities. In the laboratory, researchers can manually operate the microscope for microimaging directly. Even in shallow waters, underwater imaging systems can be deployed and adjusted with the help of divers. However, in deep sea, interactive tasks primarily depend on the ROV’s robotic arm, which, unlike conventional electrically powered manipulator (Fu et al., 2022; Liu et al., 2022), is hydraulically actuated and therefore its positioning accuracy is usually limited to several centimeters (Aggarwal and Albiez, 2013). This is far from meeting underwater microscopy imaging systems’ micron-level positioning accuracy requirements. Therefore, microimaging must incorporate a fast, high-precision auxiliary positioning function to compensate for the inadequate accuracy of the robotic arm. In addition, considering that target characteristics under a microscopic view may differ from macroperception, especially for complex targets without preprocessing, the underwater microimaging system should have additional qualitative recognition capabilities to aid target recognition.
In this paper, we established a deep-sea microscopic imaging system—MICROcean—and presented the first attempt to perform microimaging in the deep sea. The system integrates a high-speed optical zoom lens and an external auxiliary mechanical positioner to compensate for the ROV manipulator accuracy. In addition, it employs co-axial illumination to provide dynamic and uniform light to the imaging area during the optical zoom. Meanwhile, it integrates underwater Raman spectroscopy to provide analysis and recognize ability. Here, we presented the novel design of the instrument and demonstrated some typical applications to illustrate the detection capability of the device.
2 Materials and methods
2.1 Description of system
As shown in Figure 1A, MICROcean adopts a modular design, and its internal components are divided into three functional units (electronics module, probe, and positioner) and packaged in separate compartments. Among them, the probe and positioner are fixed together as the actuating detection section and the electronic compartment as the detection and control section. Different chambers are connected by watertight cables or oil-filled cables for power supply and communication. During underwater deployment, the electronic cabin was fixed inside the sampling basket to the front of the ROV, and the manipulator carried the positioner and probe to detect the interesting targets, as Figure 1B illustrated.
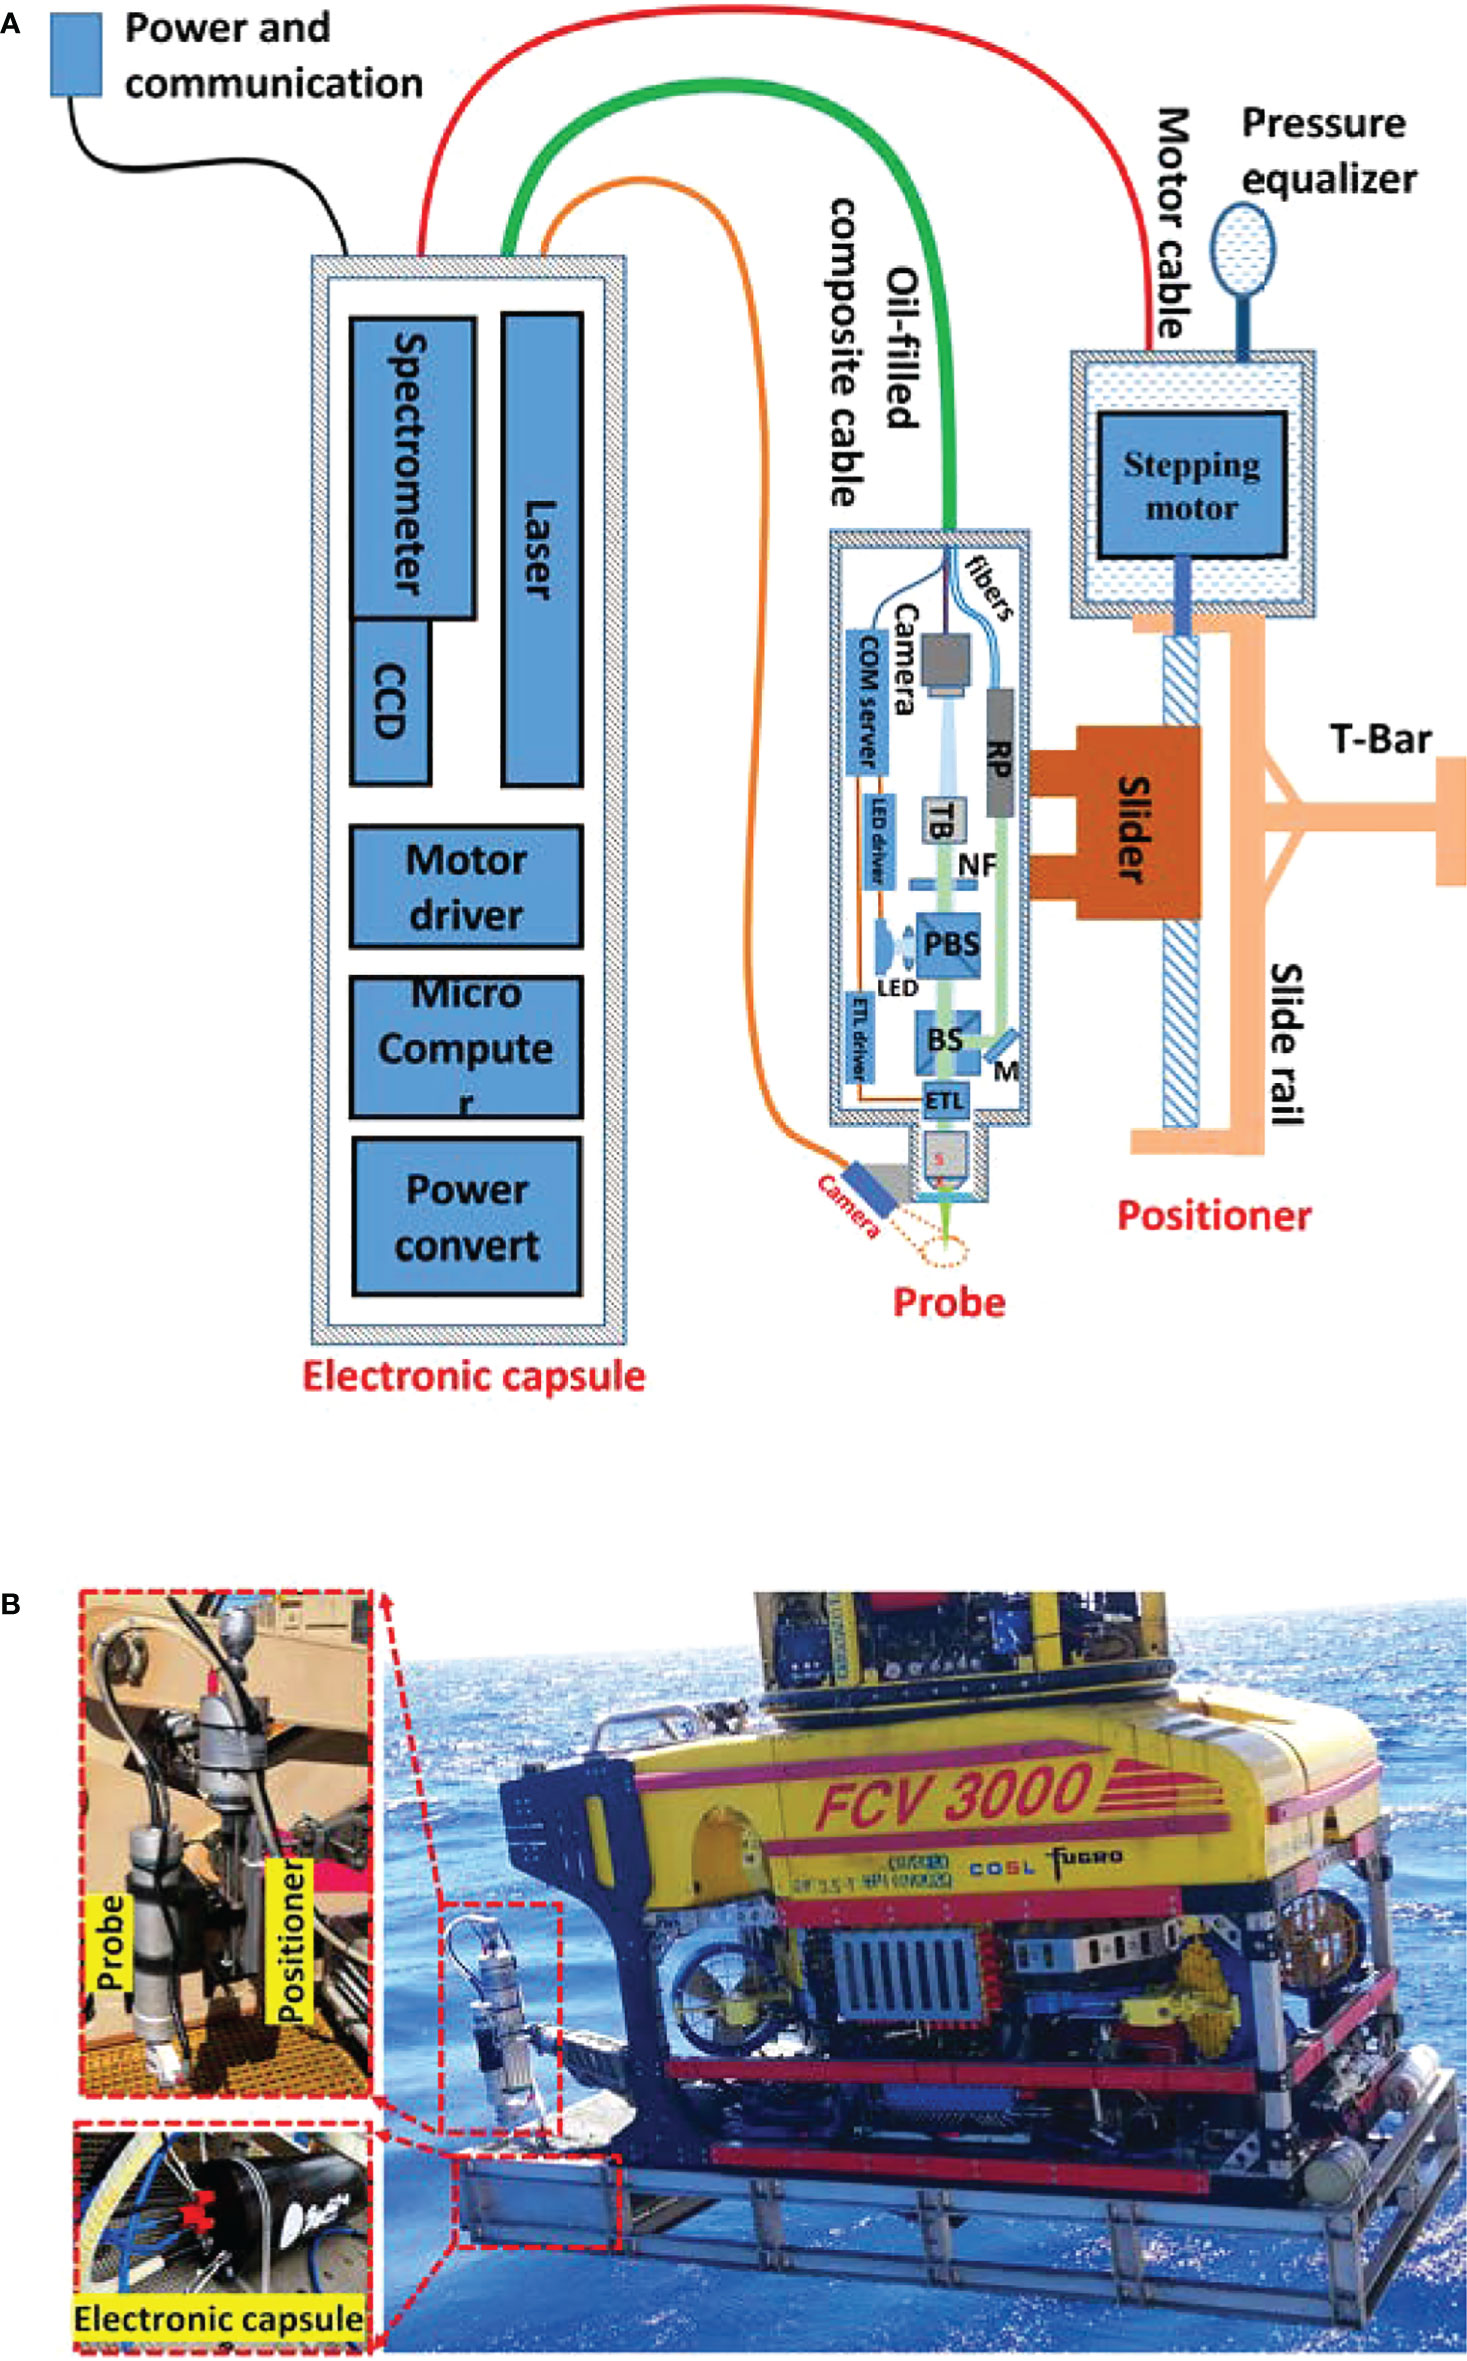
Figure 1 System composition and its deployment in the sea trial. (A) The schematic diagram of MICROcean. (B) The deployment of the MICROcean in the sea trail.
2.1.1 Optical layout
In the MICROcean, a long working distance objective (Mitutoyo M Plan Apo 5X, NA 0.14) was selected as the standard configuration to achieve non-invasive observations of underwater microscale targets. It provides a long working distance of 34 mm in air. After considering the refractive index of seawater and the effect of the optical inspection window, the actual working distance in seawater was approximately 40 mm (from the optic window to the targets). Such a distance is sufficient for the non-invasive observation of most targets and provides an adequate margin for system zooming. In addition, a focus tunable lens (Optotune EL-10-30-C Vis) was introduced into the microscope to dynamically change the system’s working distance to provide fast focusing. The MICROcean system also incorporates a Raman spectroscopy module to assist the recognition of microscale targets. Raman spectroscopy is a standard tool to help microscopic identification in the laboratory, and its potential in assisting underwater microimaging has already been proven in our previous work (Liu et al., 2022). As shown in Figure 2, the microimaging and Raman modules are co-axially coupled in the probe using a 50:50 standard beam splitter. They share the same microscope objective and electronic zoom lens to ensure coincidence between the imaging plane and the Raman detection plane.
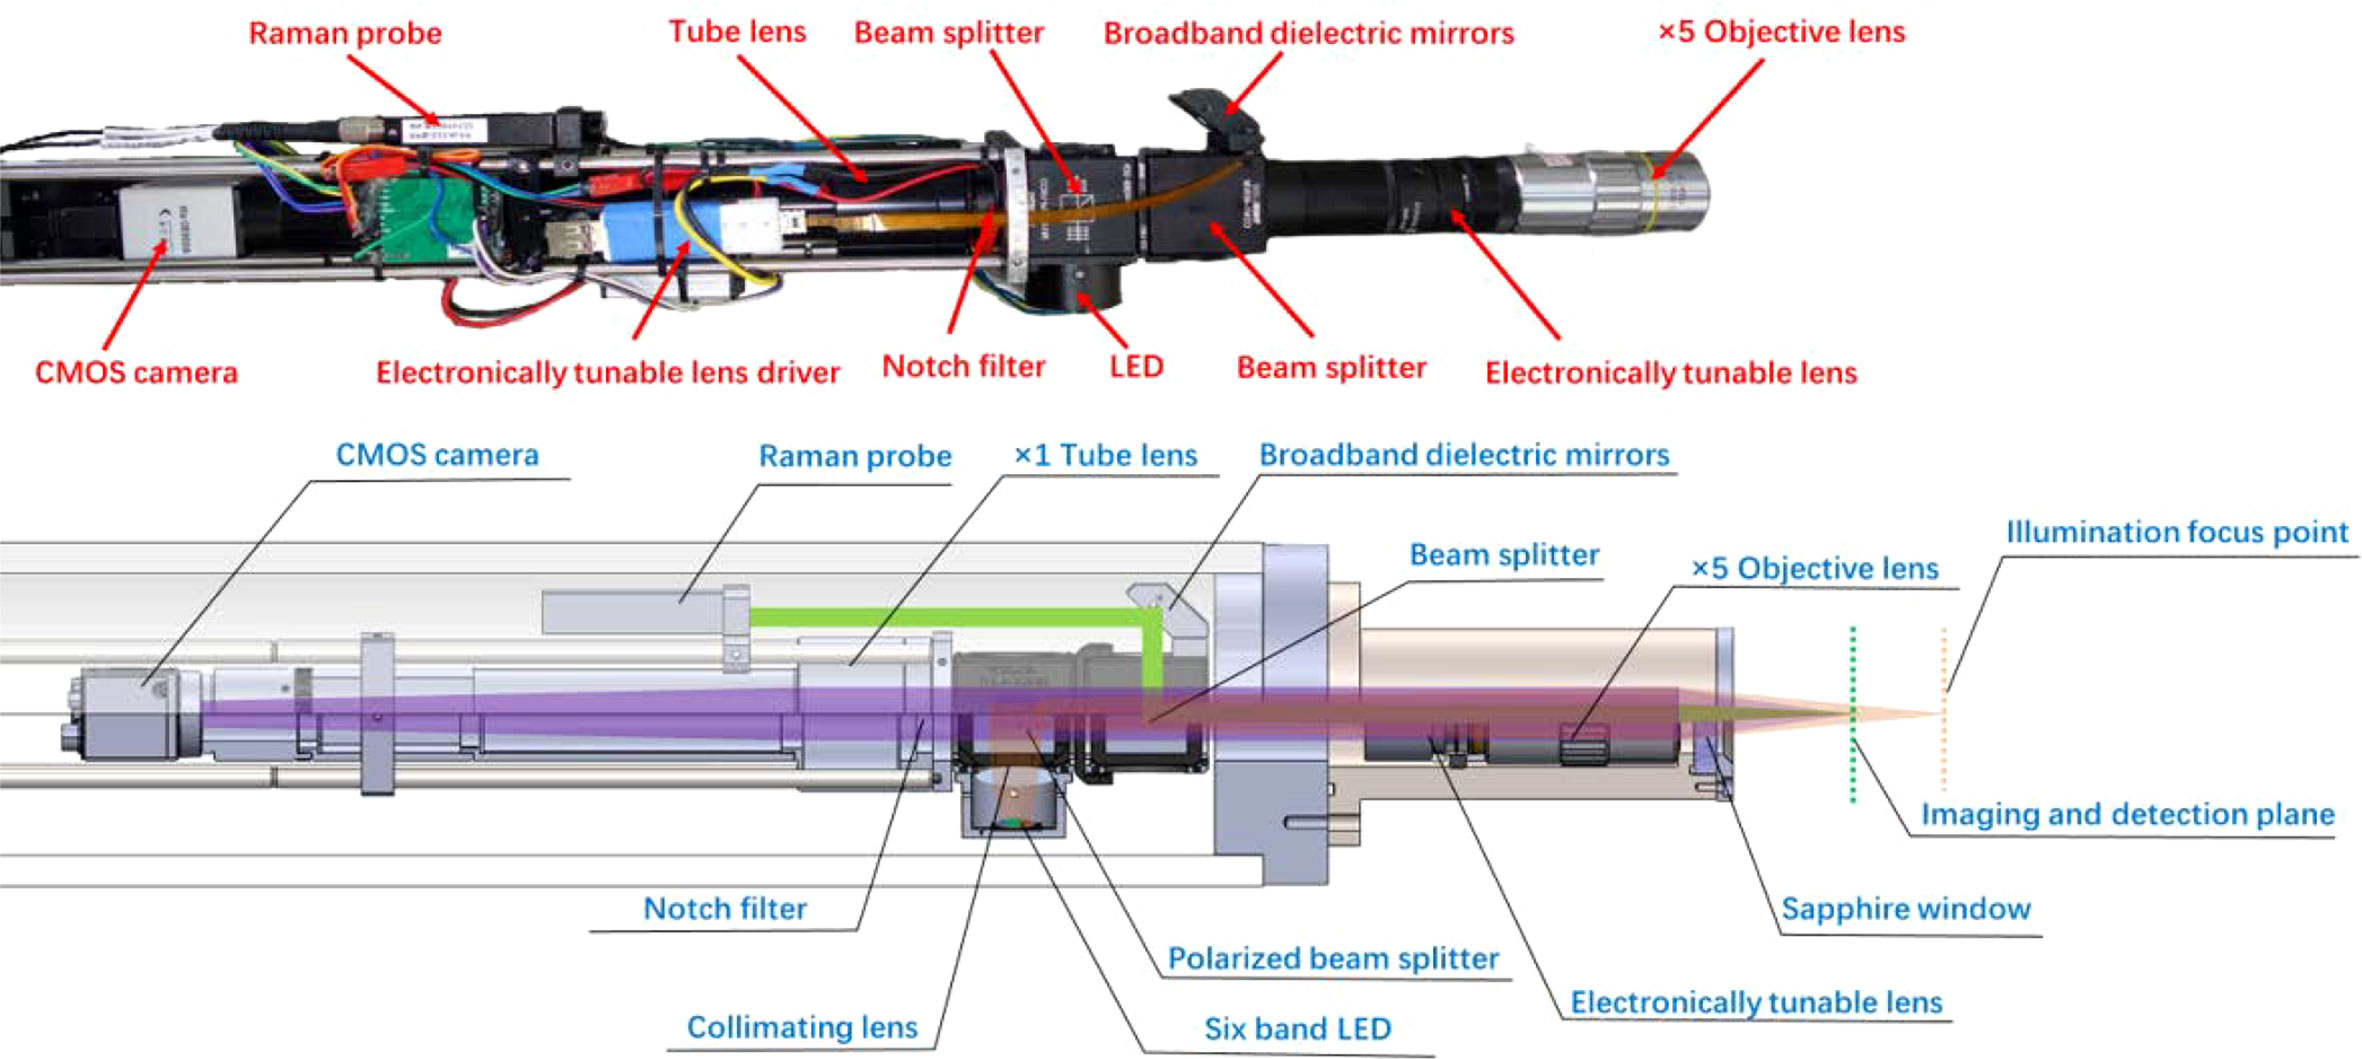
Figure 2 The optical layout of the microimaging and Raman detection in MICROcean.
Under the electronic zoom mode, the microscope imaging plane will move as the tunable lens diopter changes. Hence, the traditional external illuminate method with a fixed lighting field is not suitable again. Thus, in the MICROcean system, we used a co-axial illumination structure, where the illuminator was coupled to the imaging light path by a polarizing beam splitting prism. Here, the camera and the illumination LEDs jointly consisted of an orthogonally polarized imaging structure, which can reduce the loss of the imaging beam at this point and suppress stray light interference between the mirrors in the system’s optical path. The illuminator contained six lighting chips that were packaged in one bead. Every chip had its special wavebands, namely, red, yellow, green, blue, ultraviolet, and white, to meet the illumination needs of different water types (Liu et al., 2018). In addition, a fly-eye lens with a 5° divergence angle was used to homogenize the light field and avoid the LED beads imaged in the microimaging plane. When operating, the original light from the LED was separated by the polarizing beam splitter into P- and S-polarization, where the P-polarized component passed through the beam splitter along the incidence direction and was eventually absorbed by the light block. In contrast, the S-polarized component was reflected and coupled into the imaging light path. Then, it was redistributed by the standard prism and went through the tunable lens, objective lens, inspect window, seawater medium, and finally illuminated the target. The rough surface of the target depolarized the reflection ray (Lythgoe, 1972; Schechner and Karpel, 2005). Both the P- and S-polarized reflections were transmitted along the previous path and separated at the polarizing splitter. Only the P-polarization can enter the following imaging parts and focus on the camera as an image. The polarizing splitter will block the remaining S-polarized reflection to improve the contrast. The LED illuminator provided 100 levels for the light changes from the maximum to the darkness.
To get a better spectral performance in long work distance, the Raman module employed a 532-nm continuous wave laser as the excitation source. It can provide a tunable laser output in the range of 0–240 mW to meet the detection needs of different targets. Meanwhile, a wide range spectrometer, which can cover the Raman detection range of 0–4,500 cm-1 with a spectral resolution about 10 cm-1, was selected for spectral detection. Both the laser and the spectrometer were mounted in the electronics cabin and connected to the Raman probe via two optical fibers, which were sealed in oil-filled composite cables. In the progress of Raman detection, the laser from the input fiber was collimated by the Raman probe, reflected by a broadband dielectric mirror and standard beam splitter, then coupled into the imaging path. The coupled laser went through the tunable lens, objective lens, optical window, seawater, and finally focused on the target. Similarly, the Raman scatting went back and transmitted into the Raman probe, where the signal was abstracted and delivered through the output fiber to the spectrometer for further analysis.
2.1.2 The positioning and focusing
Compared with macroimaging, microimaging has a shallow depth of focus whose typical value is limited in the range of several microns to tens of microns and requires precise position. In contrast, the positioning accuracy of robotic arms is usually on the order of centimeters, which is far from satisfying the requirements. Two available methods can address the problem, one is adding the precise auxiliary positioner, and the other one is optical zoom adjust (Fahrbach et al., 2013; Bradbury, 2014). The front method changes the distance between the microscope and the target to achieve an appropriate position to capture images. It neither changes the system’s magnification nor introduces additional imaging aberration. Meanwhile, it is easy to employ and can extend to a long range. However, due to the properties of the mechanics, it moves slowly and will produce significant errors when the direction of the motion is changed. On the contrary, the latter can obtain a clear image by adjusting the optical parameters rather than moving the position. Hence, it can achieve fast and accurate focus. But for an optimized system, the changes in optical parameters will increase the aberration and changes magnification. Meanwhile, its adjustment range is also limited to a small scale. No method can simultaneously meet the needs of an accurate and fast focusing over a wide range during deep-sea microimaging. Hence, this system proposes a hybrid focusing strategy that fuses the optical zoom adjust and mechanical positioner. It breaks the focus tasks into three steps, namely, roughly move, coarse modify, and fast fine adapts action. In the roughly move step, the ROV’s manipulator brings the positioner and probe over the detection target. As this progress usually needs to drive a long distance, the movement error from the manipulator is tolerable. Then, the mechanical positioner is responsible for carrying the probe for coarse adjustment and locating the imaging plane to the target. Finally, the tunable lens fast zooms in available range to track the targets and capture clear images.
The main body of the positioner is a linear actuator driven by a servo motor and screw rod. Under the control command, the motor drives the screw rod rotation and promotes the slider plate to a specific position. Benefiting from the closed-loop controller, the positioner step accuracy can reach 2 μm over a trip range of 30 cm. The optical zoom relies on the tunable lens, which can dynamically change its diopter according to the drive voltage. The test results showed that the ETL diopter changed from −1.5 to 3.5, and the work distance of the MICROcean changed 24 mm underwater, with a maximum focus error of 90 µm. During the focusing process, the gray-level gradient function was used to determine the sharpness of the image and combined with the hill climbing algorithm for auto-focus tracking. Meanwhile, a continuous slice imaging function along the gradient direction was integrated into the control software to cope with the problem of the inability to stabilize the focus when tracking dynamic targets. In addition, at the front of the probe, we added a macrocamera to supply a transitional view from the ROV’s wide-angle camera to the microscopy. The macrocamera also provided a rough reference for the first two levels of positioning.
2.1.3 Control and communication
The control and communication of the whole system mainly depended on the center-embedded computer located in the electronic cabin. It connected all the peripheral equipment and established a communication channel to the deck server through the ROV umbilical cable. In the electronic chamber, the embedded computer, electronic controller, and power drivers were regularly installed on an aluminum bench, which was fixed on the front cap. Among them, the high-power items such as the servo motor driver and power converter removed the cooling fins and directly contacted the bench to accelerate the heat exchange with the seawater.
To improve adaptation, the system developed two operation modes: remote process mode and local process mode. In the remote mode, the embedded computer and the ROV nodes consisted of a transparent network. All the information from the peripheral equipment was packaged and sent to the deck server for further processing. Since all the complex data process tasks are transmitted to the powerful deck server in this mode, it can operate some more advanced real-time algorithms to offer a better user experience. However, this mode must transmit the amount of original data requiring a wide network band and stable connection. In the local process model, the embedded computer plays the communication center and the processing center at the same time. It needs to respond to the commands from the deck server, control the equipment for data sampling, process original data, and send the results to the endpoint. In this mode, the MICROcean is an independent system that can automatically work with the default parameters, and all the results will be saved in local storage; hence, it can work with low-speed networks. However, limited by the embedded computer’s weak performance, the system can only operate at a low sampling rate.
2.2. Microimaging performance and calibration
For infinity-corrected microscopy, the inserted plane optic elements such as the beam splitter and the notch filter will not change the imaging quality, as the light has the same optical path in those elements. But when it comes to the tunable lens, the situation became complex. The tunable lens has a variable diopter, which can affect the work distance, magnification, and imaging quality. It is hard to calculate the changes while the specific structure and parameters of the objective lens are unknown. Here, we performed an imaging test using the USAF1951 targets to evaluate the imaging performance under the different diopters. The tunable lens can dynamically change the diopter from −1.5 to 3.5 as the drive current increases from 0 to 300 mA with a linear relationship (Chen et al., 2021; Optotune, 2022). The transformational relation between the current and diopter can present in the following form:
In the equation, Ic is the drive current, Dc represents the diopter, Imax indicates the max drive current (300 mA), and the Dmax and Dmin mean the maximum diopter and minimum diopter in the turnable range, respectively. The ETL offers 300 tunable levels of the drive current, and we evenly selected 16 points with the current increment of 20 mA. For each point, we carefully moved the target to obtain the clearest image and record the target position. The imaging results are shown in Figure 3. Generally, a 5× microscope objective with matching tube lens can provide standard five times system magnification. But when an additional element with non-zero diopter is inserted, the specific system diopter contributed by the objective lens and tube lens will be changed, causing the original magnification to alter. If the diopter of the inserted element is positive, the overall system diopter will increase, resulting in a larger magnification; if the diopter of the inserted element is negative, the overall system diopter will decrease and make the magnification smaller. A large magnification is helpful to improve the imaging resolution. According to the experimental results, it can be clearly observed that as the driving current increased, both the system magnification and the imaging quality had a different degree of improvement. When the drive current was zero, which corresponded to the diopter of ETL of −1.5, the system amplification was about 3.7 times. When the current raised to 300 mA, the ETL diopter changed to 3.5, and the amplification became 8.1 times. Correspondingly, the imaging area also expanded from 1.04×0.87 mm to 1.87×2.23 mm. The imaging quality was inferior at the beginning 6 points, corresponding to currents of 0–100 mA, where the fly-eye lens’ pattern appeared on the image causing uneven illumination and accompanying image blur. When the drive current was above 100 mA, the microimaging became clear and stable, with only slight resolution differences. Furthermore, we selected the image obtained at the middle current between 100 and 300 mA (200 mA) as a sample to analyze. As shown in Figure 4A, there are totally four complete line-pair groups (the fourth, fifth, sixth, and seventh groups) of negative target that appeared in the vision field. Limited by the contrast, the first element in the seventh group already cannot be identified, but all the elements of the sixth group can be recognized as independent elements. Figure 4B illustrates the intensity distribution of the vertical profile of each element in the sixth set of pairs. Such test result means that the system imaging resolution can reach 114.0 line pairs/mm, corresponding to the 4.4-μm resolution.
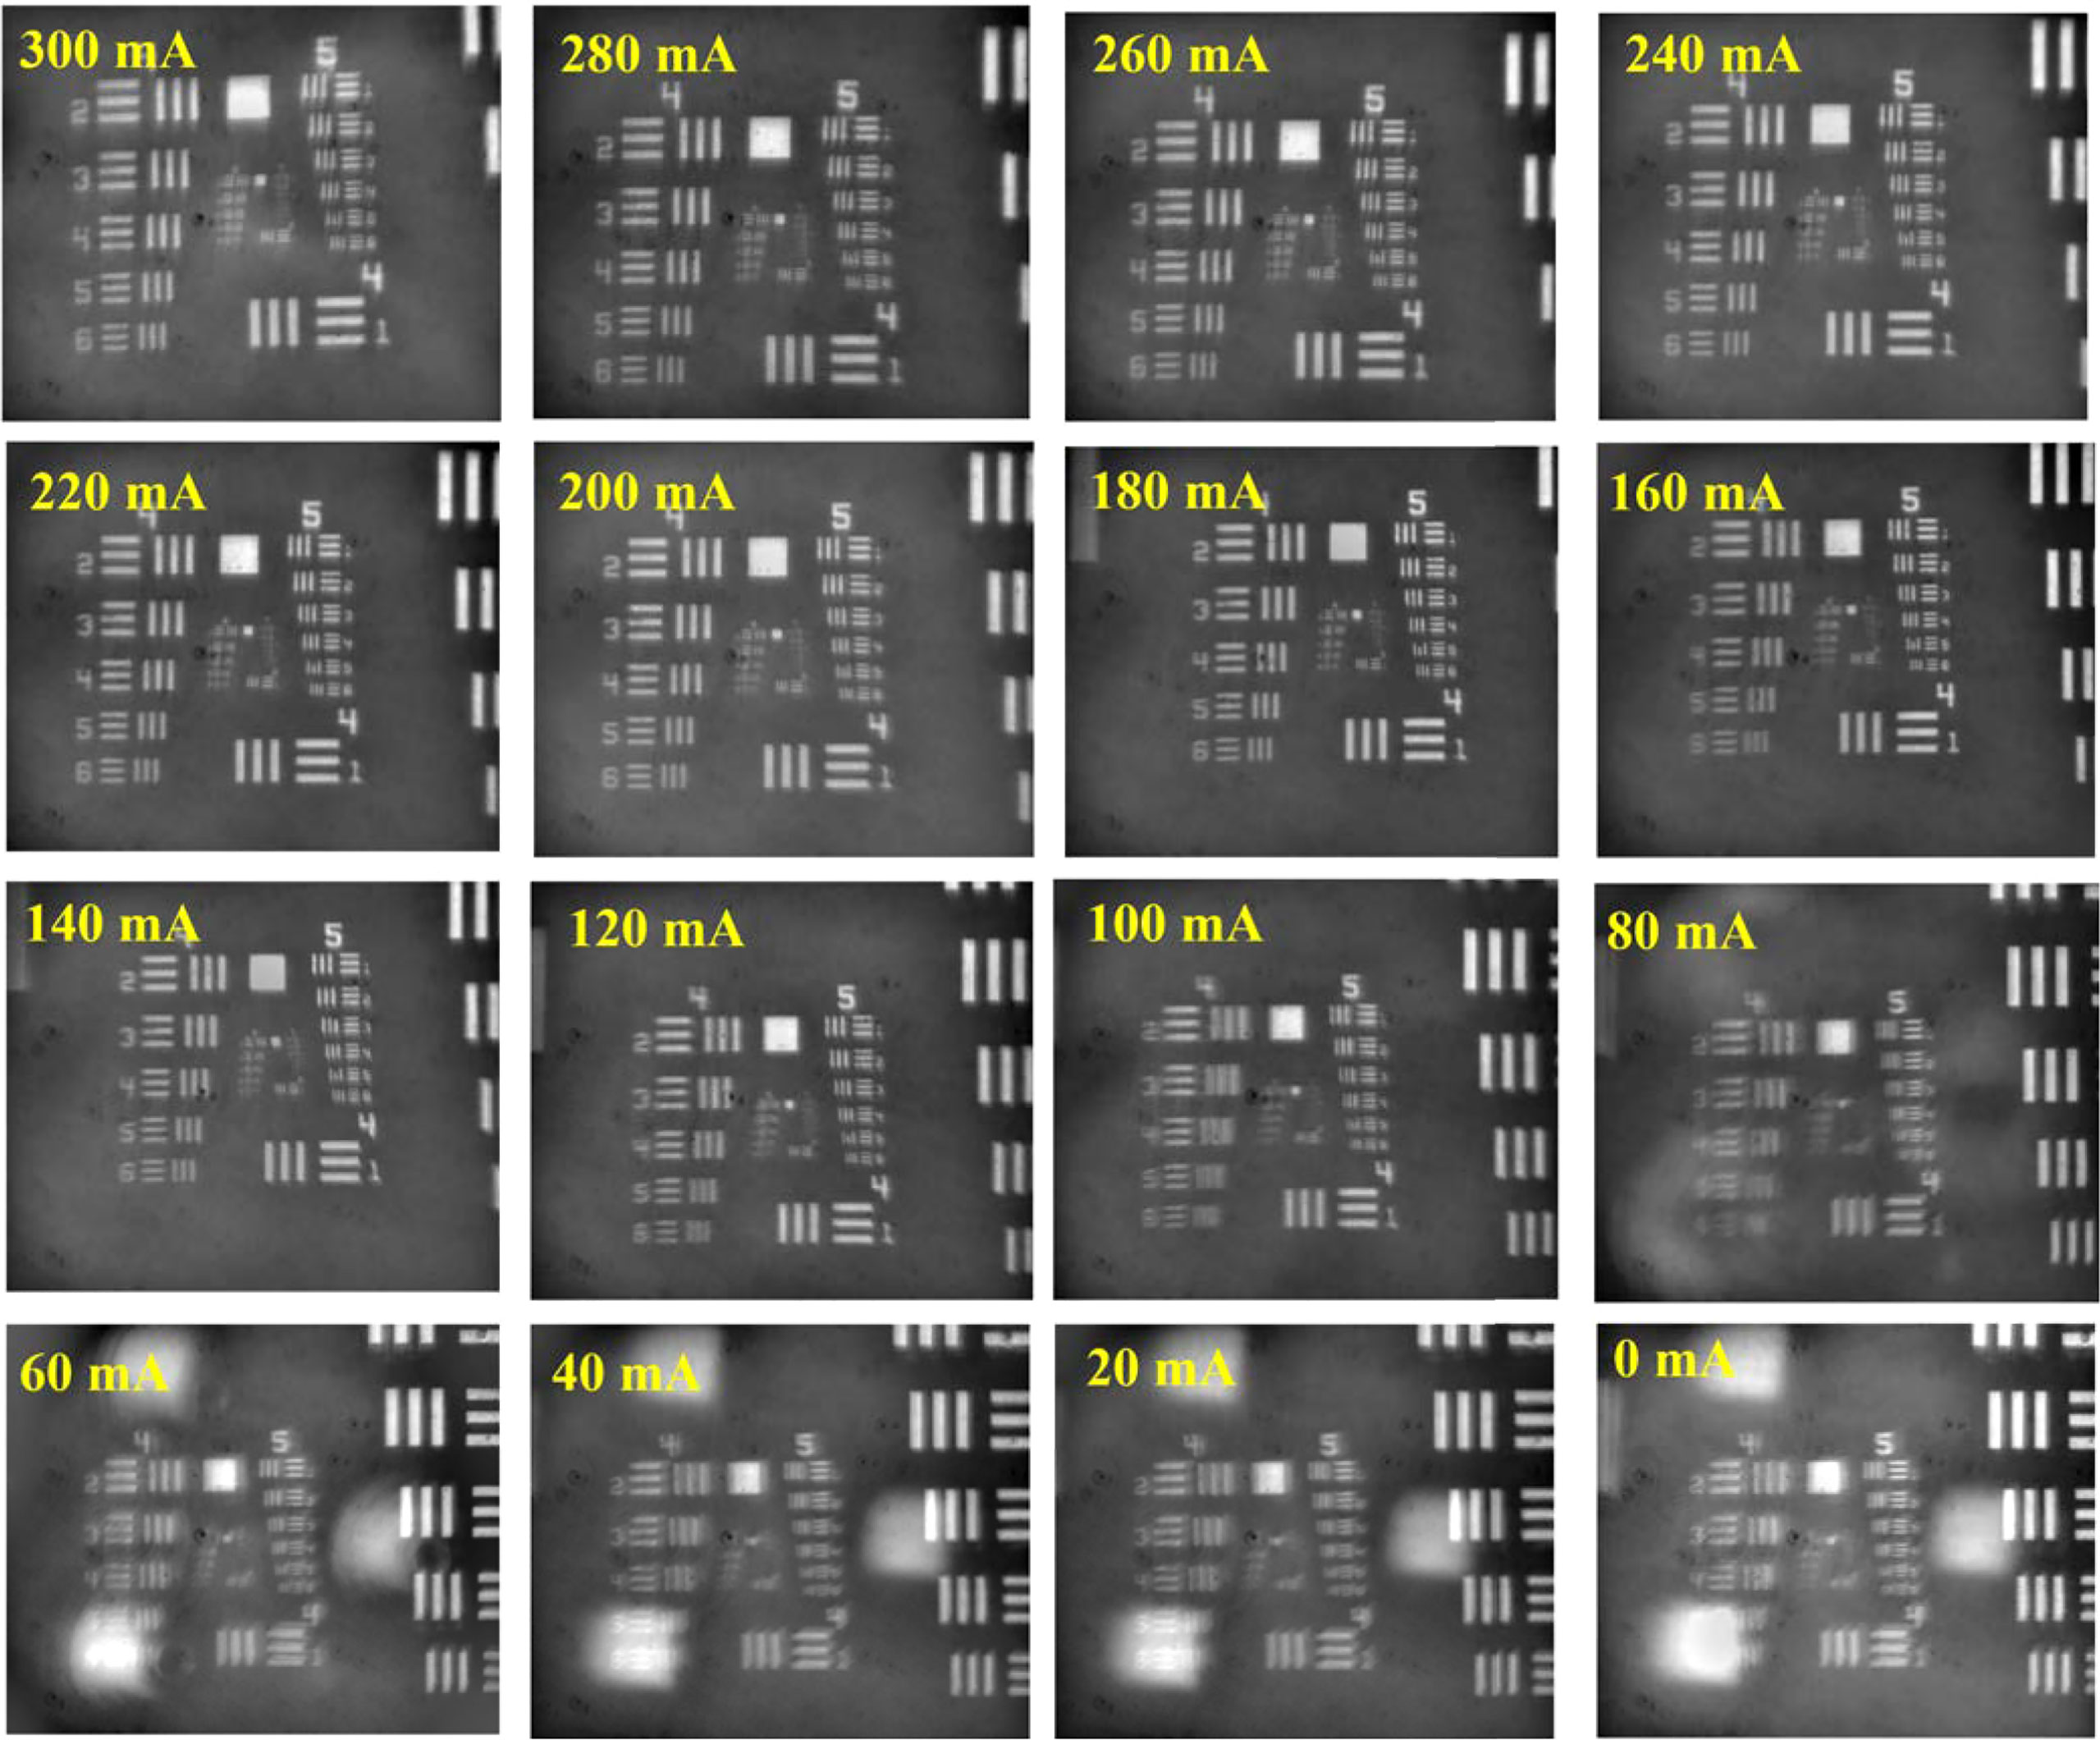
Figure 3 The imaging results of MICROcean under different drive currents.
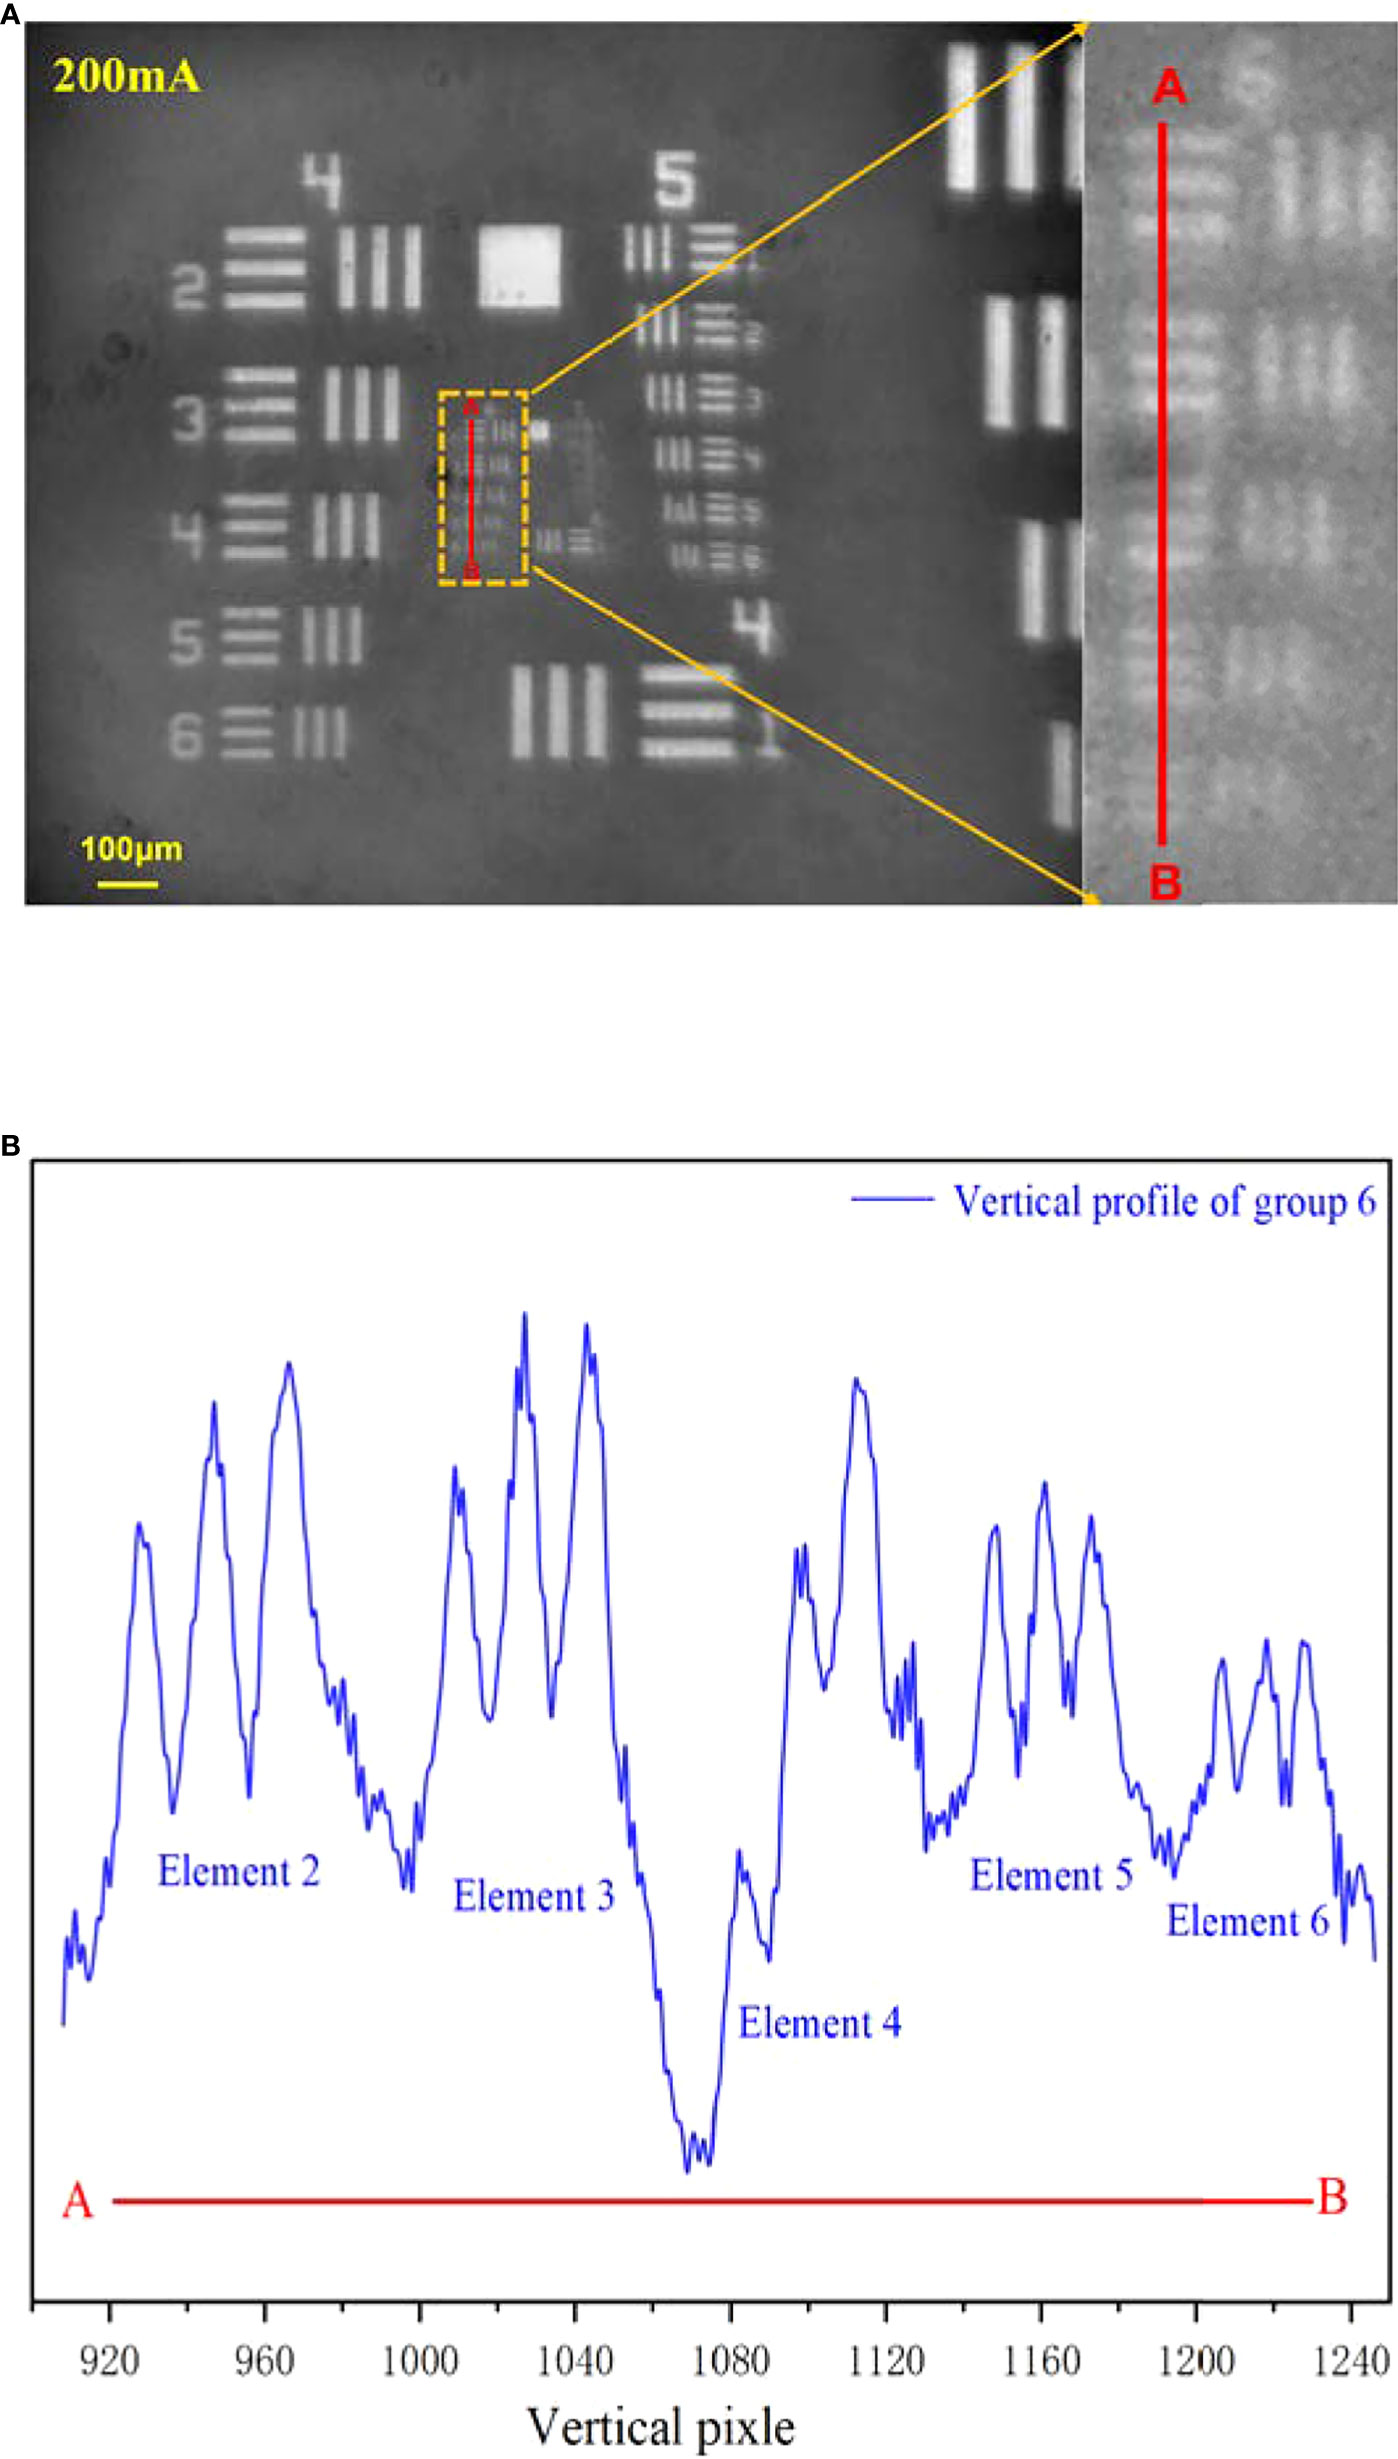
Figure 4 The MICROcean imaging resolution at the current of 200 mA. (A) The original image and its enlarge image in the sixth line pairs group. (B) The vertical intensity profile of group 6.
Due to the notch filter’s existence, the laser spot focused on the microimage is invisible. Hence, the system must employ an alignment to map the detection region to the specific position of the microimage. In the alignment progress, a laser observation card (VRC2, Thorlabs), absorbing laser and irradiating the fluorescence, was used to indicate the position and the focus spot size. As shown in Figure 5, the alignment result shows that the laser spot located at the pixel (1,158,802) and its radius occupied about 300 pixels. Although the system magnification will change as the ETL diopter turns, the shared ETL and the objective lens can keep the laser spot always at the same position and occupy about the same pixels. When the system magnification was 5×, the spot diameter was 450 μm. In addition, the Raman detection model was also calibrated using an argon mercury lamp (AvaLight-CAL-Mini) before deployment.
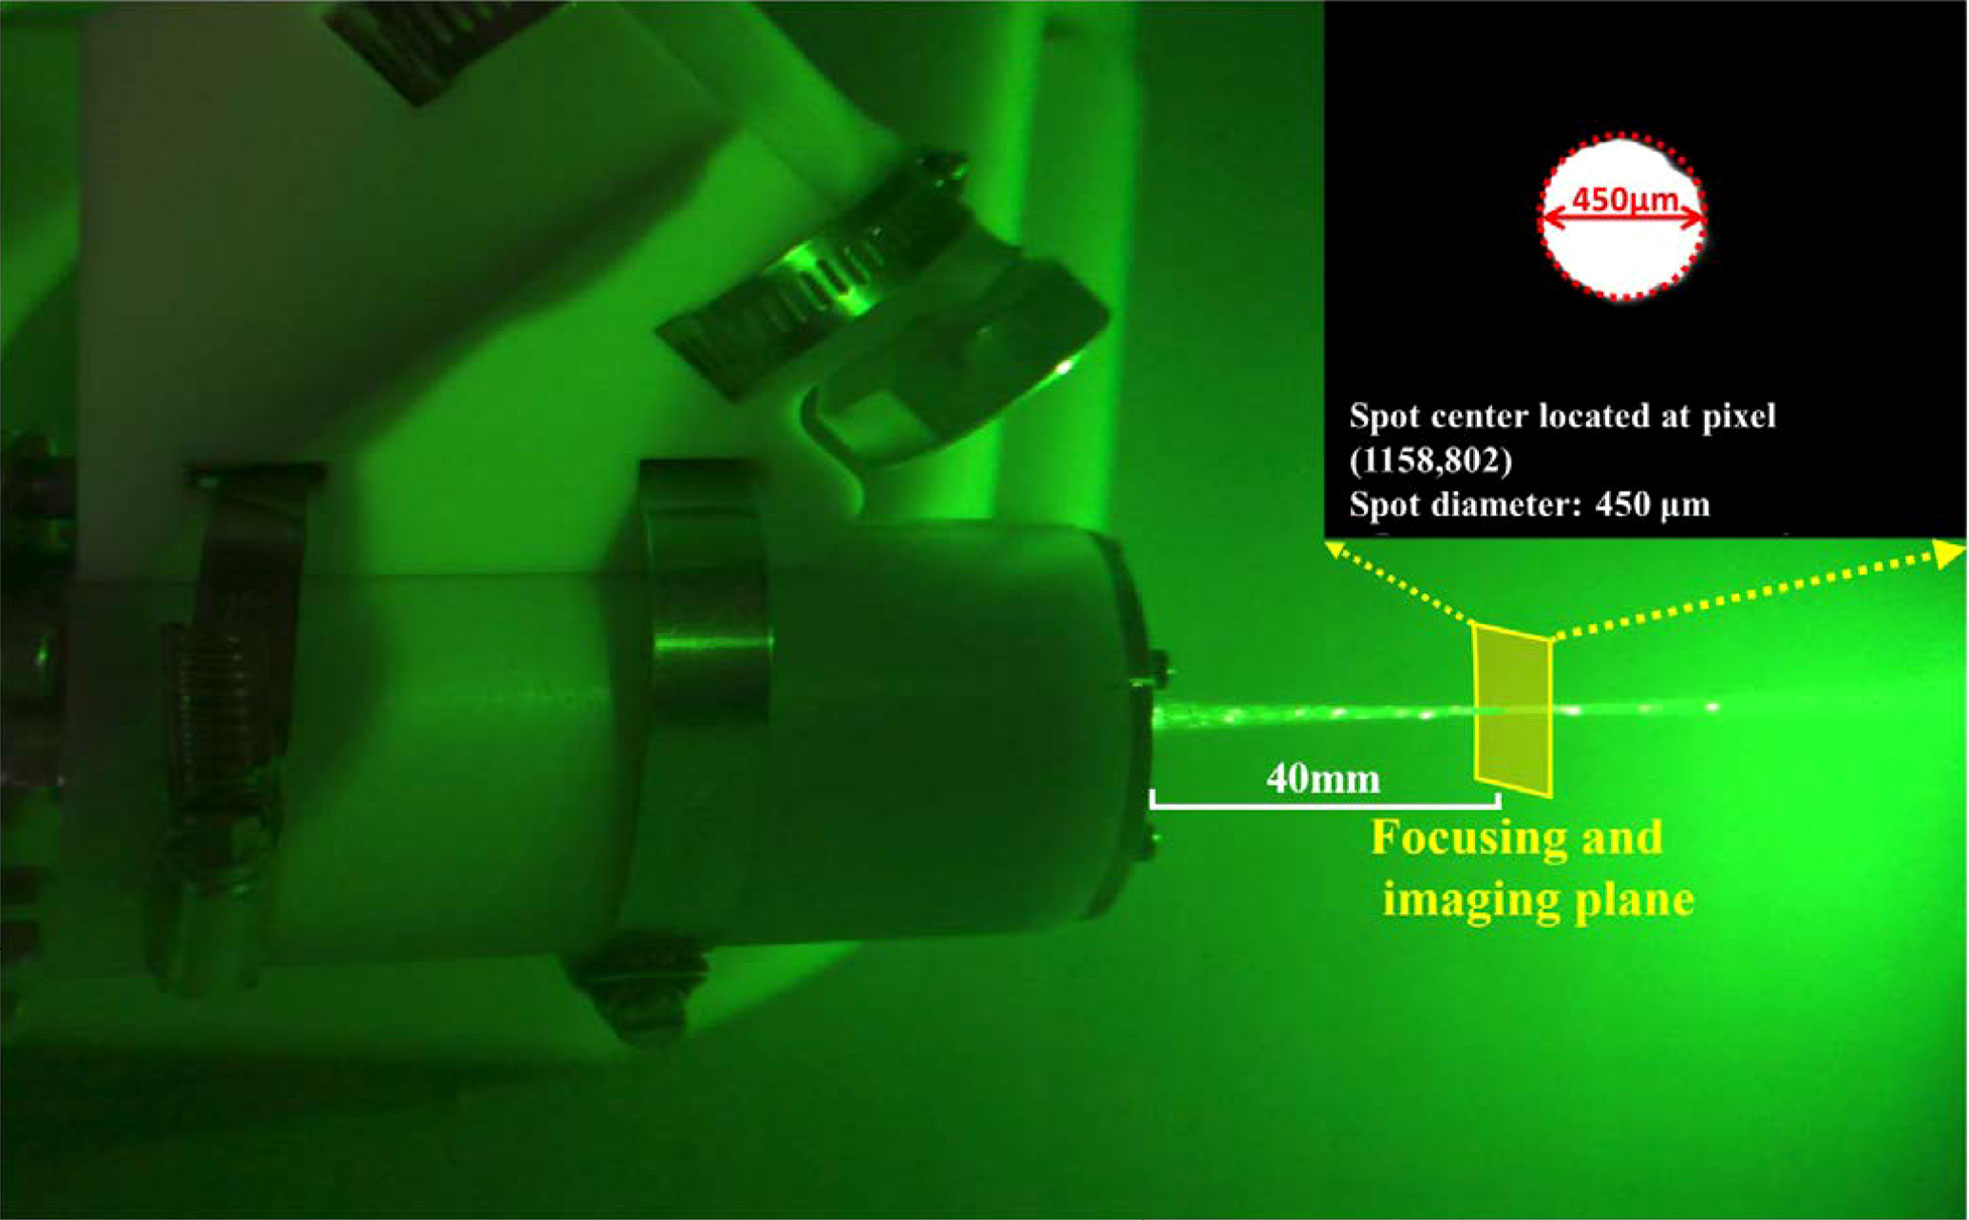
Figure 5 The align results of the laser-focused spot and the microimage.
3 Sea trials and deployment
The MICROcean carried out its first sea trials in the South China Sea in August 2020. In this sailing, a deep-sea work class ROV, FCV3000, was used as the underwater carrying platform. It is equipped with “Schilling Titan4” and “Schilling Rig Master,” two hydraulic-driven manipulators for interaction. The “Schilling Titan4” has seven degrees of freedom (DOFs), six for movement, and one for end grab. It possesses the ability to reach the target from different multi directions in its workspace, having enough flexibility to finish the complex operation. The “Schilling Rig Master” is a heavy payload manipulator with only five DOFs, four position degrees, and one grab degree. Considering stability, the “Schilling Rig Master” has better payload ability and stiffness, which contribute to restraining the end shaking during the microimaging. Hence, we selected the “Schilling Rig Master” as the prima action hand and the remaining hand, “Schilling Titan4,” as an auxiliary to assist in the observation and sampling. As shown in Figure 1B, the electronic capsule was fixed in the front sampling basket, and the manipulator “Schilling Rig Master” grabbed the positioner and probe for imaging and detection. In this deep-sea investigation, the MICROcean reached a maximum depth of 1,100 m and captured thousands of in situ microimages and spectroscopic images, including living starfish, shell debris, and stone samples at 700–800 m depths. Next, we present some typical results obtained in the first sea trial.
4 Results and discussion
4.1 Biological target—starfish
Starfish (phylum Echinodermata) are ecologically important and diverse members of marine ecosystems in all of the world’s oceans, from the shallow water to the hadal zone (Mu et al., 2018). When the ROV cruised over the sand seabed, a starfish was found crawling over the seabed at 774 m. From the morphological analysis, the starfish belong to the Goniasteridae, Circeaster pullus, and is very similar to the species (D2-EX1605-L1-12-21:57:29) found by NOAA in the South Pacific, Johnston Atoll, and the Musicians seamounts during 2015–2017 NOAA, 2022. Both of them were found in the same depth range (600–800 m). As shown in Figure 6A, the starfish has five arms and a polygonal, ordered plate. Abactinal, marginal, and actinal plate surfaces are covered with enlarged, well-spaced granules. Enlarged granules also form a border around plates. Arms elongate tapering, with tips upturned. The further microimaging, top 2 images in Figure 6B, proved that the starfish has at least two large granules in the plate, one with small semicircular bumps along the edge and the other with flat edges and tight connections. At the plate edge, shown in the bottom of Figure 6B, the granules become minor and jumbled, and their shapes change from regular polygons to circles.
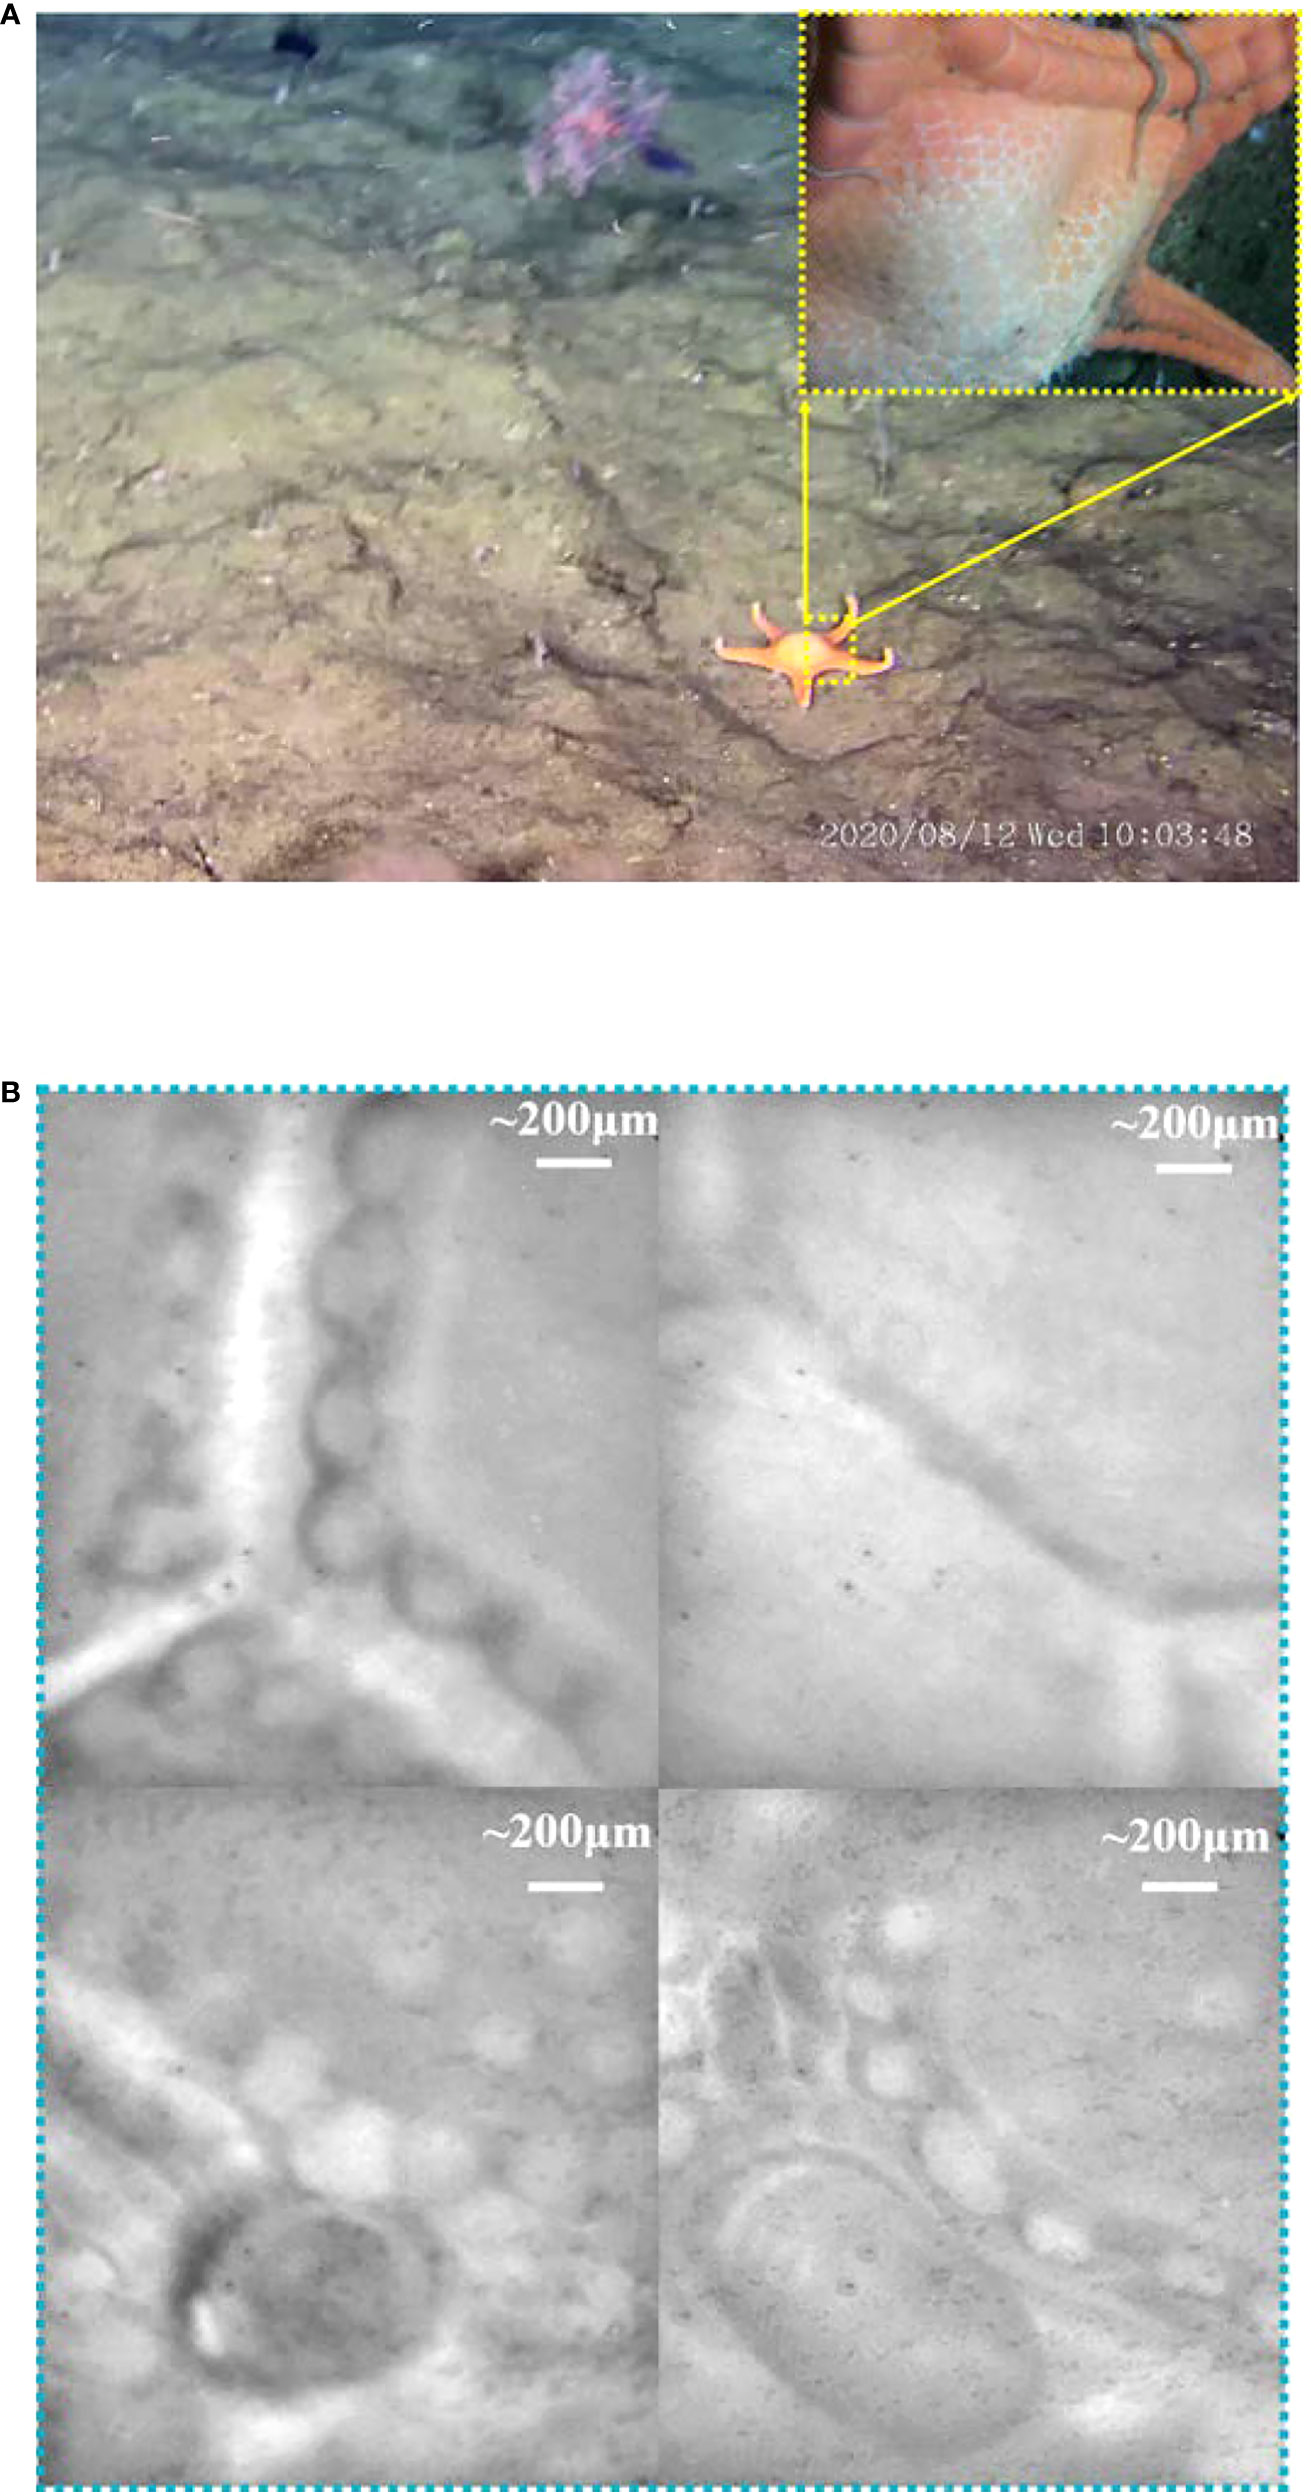
Figure 6 The macromorphology and microimaging of the starfish. (A) The image obtained by ROV HD camera and probe-side-mounted macrocamera. (B) The microimages captured by the microscopy.
The starfish body wall is composed of magnesium calcite ossicles connected by collagenous tissue and muscles. It shows flexibility in stiffness, which is attributed to the mechanical mutability of the collagenous component (Blowes et al., 2017). On the seabed, we analyzed the body wall composition of the star fish using Raman spectroscopy, as shown in Figure 7A. To prevent biological samples damaged by high-energy lasers, the output laser energy was limited to 50 mW, and the exposure times were set to 15 s to depress the noise. The detected results, presented in Figure 7B, revealed that the starfish body wall exhibits a typical biological characteristic, rich in beta-carotenoids. The Raman bands located in 1,520, 1,157, and 1,008 cm−1 are the typical carotenoid peaks that can be assigned to C=C (v1) stretching, C–C (v2) stretching, and C–CH3 bending, respectively (de Oliveira et al., 2010). The Raman band in 981 cm-1 is contributed by the sulfate ion in the seawater (Brewer et al., 2004; Man’kovsky, 2012), and the fluorescence band located at 677 nm is caused by the chlorophyll that may drop from the upper water (Graf, 1989). In addition, the spectra have a unique band at 2,950 cm-1/630 nm, which has never been observed in other targets. This band is so strong that it even changed the shape of the biggest Raman band, which belongs to the water H–O–H bending mode, and its shoulder peak at 3,260 cm-1 already has the same height as the main peak at 3,420 cm-1. By contrast, in these two spectra, starfish I and starfish II, we induct that this fluorescent band may not be caused by pigment, as it does not have any other Raman bands; meanwhile, it is also too strong compared with the carotenoid. Meanwhile, it certainly does not belong to the material in the water because the water is already well mixed and will not have such a big difference in the microscale. The possible origin is that it is caused by the protein and lipids in the collagenous tissue or muscles (Li et al., 2019). In addition, the band located at 671 nm may have the same origin, as it has a similar trend when the band changes.
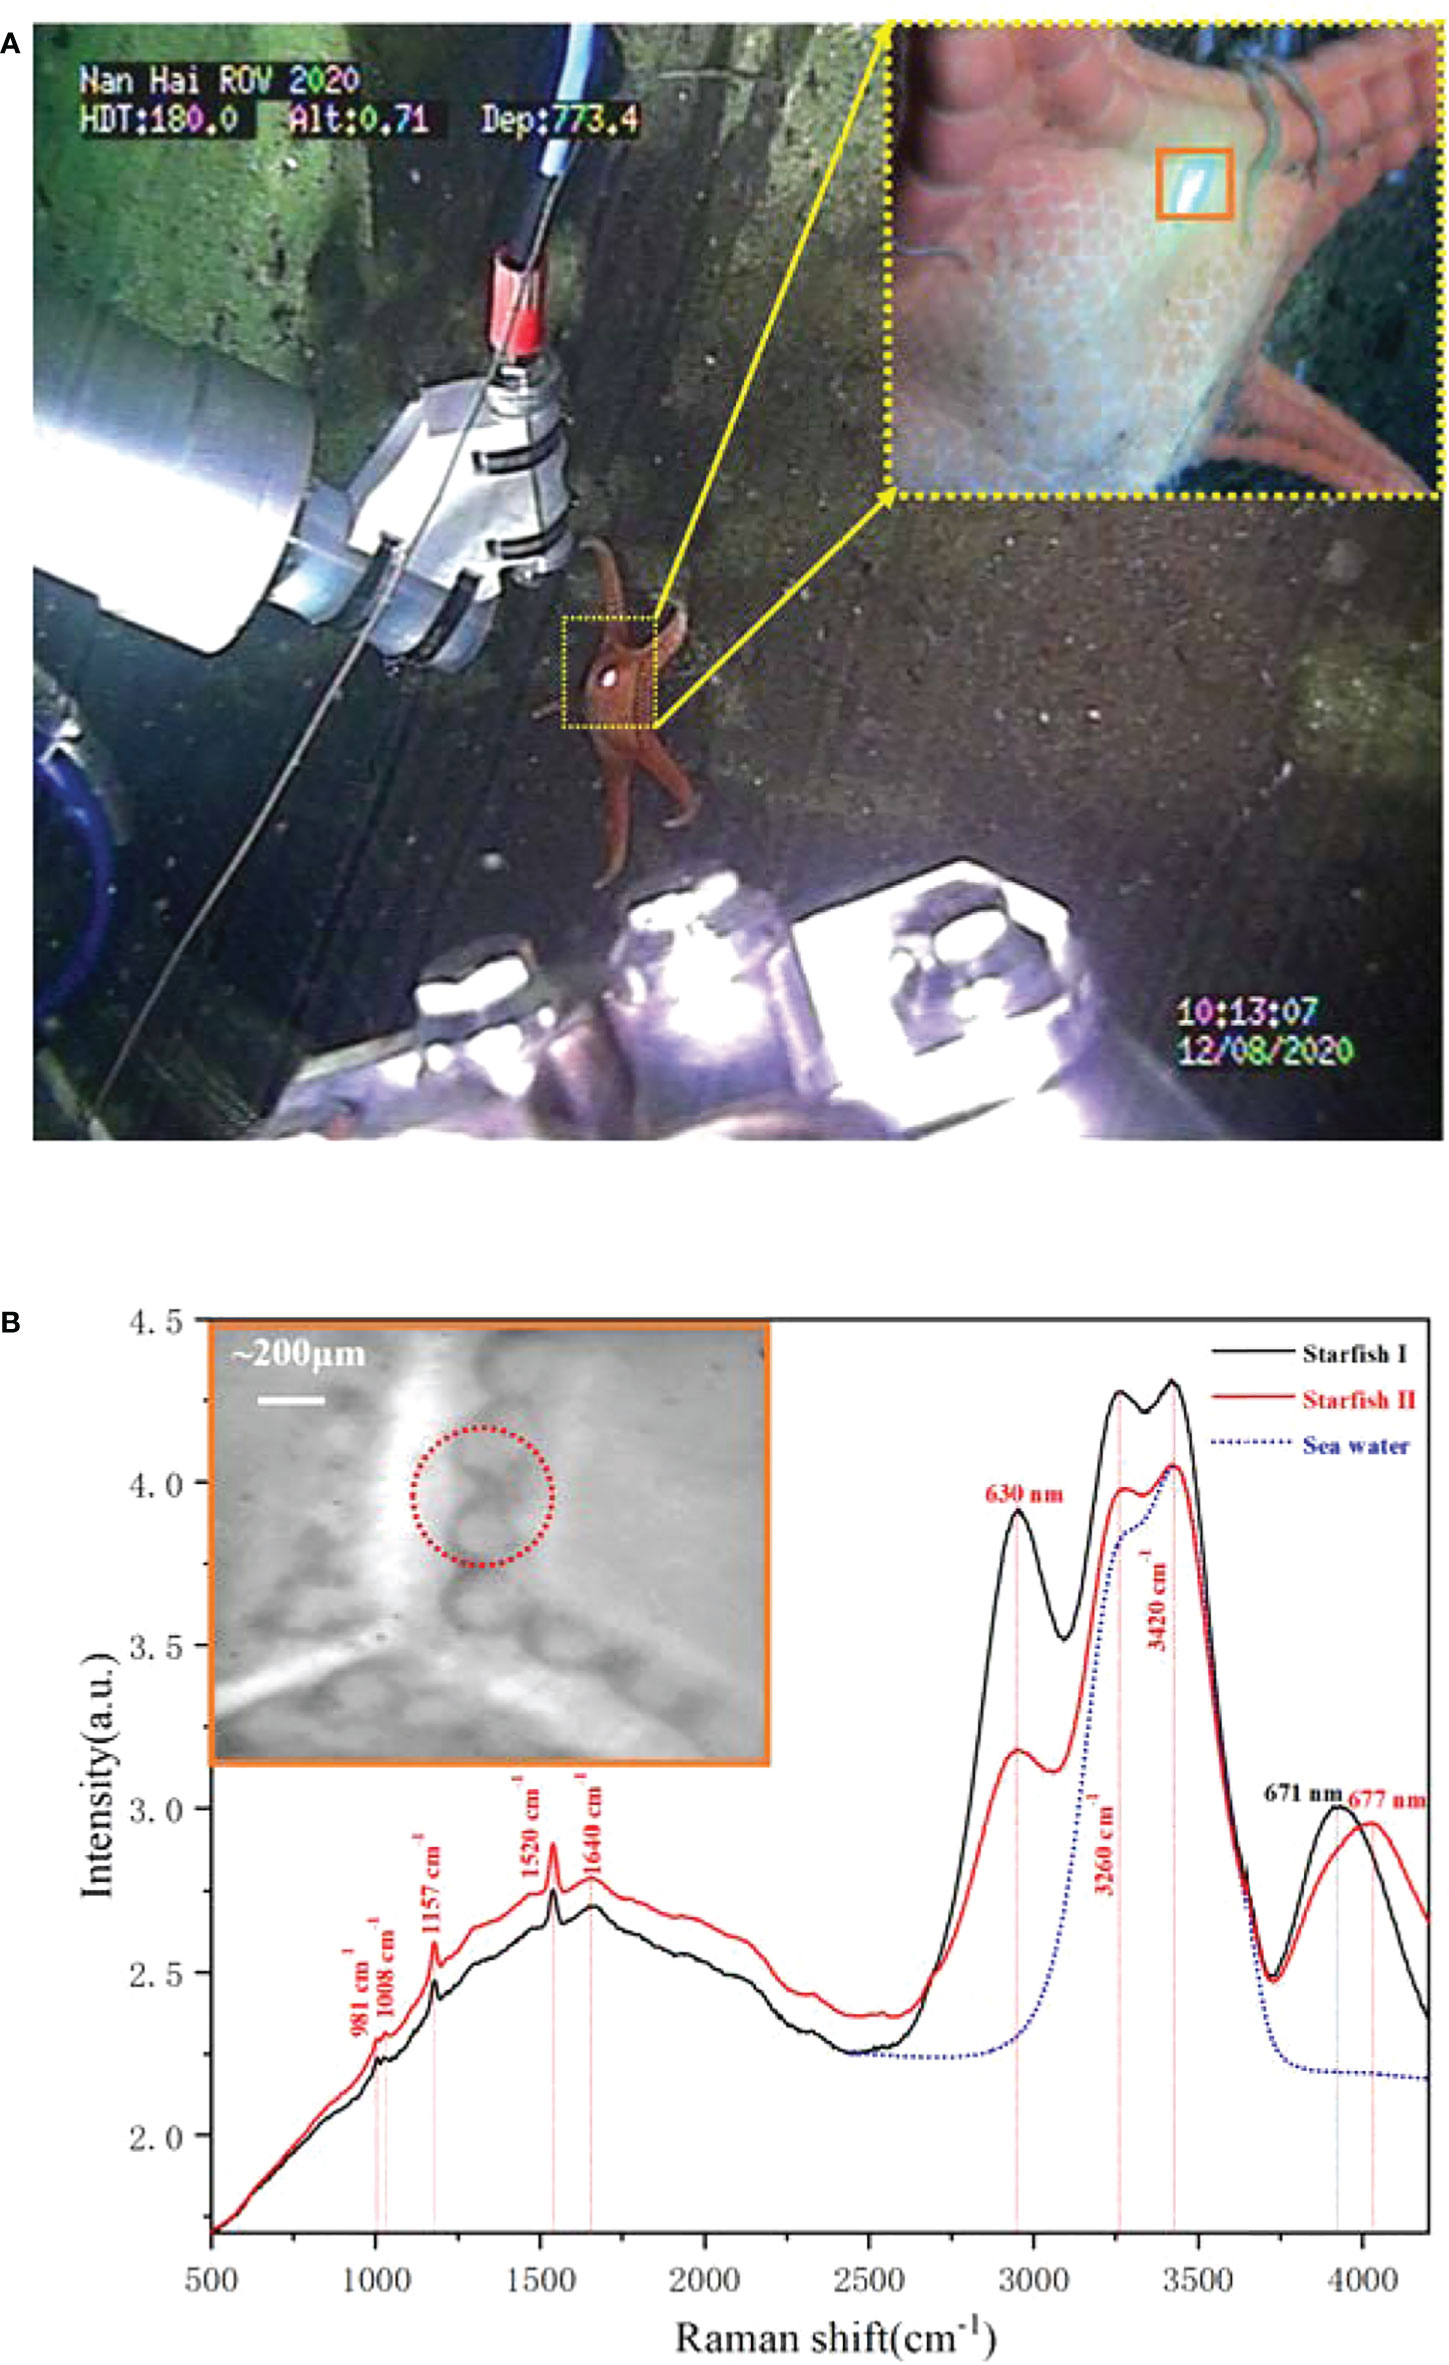
Figure 7 The in situ Raman detection of the starfish. (A) The scenes of in situ detection. (B) The Raman spectra of the starfish obtained at 773.4 m depth.
4.2 Rock target—limestone
Besides the biological targets, we also detected a rock target in the exposed seabed. Unlike the common sandy seabed in this region, this exposed seabed has a dark gray appearance, but its fresh section shows a yellowish color, as shown in Figure 8A. Its structure is loose, has low strength, and is easily broken. For further analysis, we operated the “TITAN 4” manipulator and took a rock sample from the seabed. The microscopic imaging results of the sample’s new fracture are shown in Figure 8B. These microimages from different positions of the fracture exhibit very similar features—numerous spherical granularities with 0.1–0.3 mm diameter were glued together by some amorphous cement, and it indicates that the seabed base is a homogeneous matter. According to its microscopic appearance, the rock sample may be some type of granular limestone or sandstone. Furthermore, we performed Raman detection on the rock samples as shown in Figure 9A. For rocks with high damage thresholds, the laser output energy was set to a maximum of 240 mW to get a better excitation effect, and the spectra are collected with an exposure time of 15 s. The in situ Raman spectra of the rock sample’s new fracture, presented in Figure 9B, indicated that the main component of the sample is calcite. The Raman peaks at 281, 714, and 1,085 cm-1 corresponded to the out-of-plane bending vibration, in-plane bending vibration, and symmetric stretching vibration of calcite, respectively (Gunasekaran et al., 2006). The sulfate ion in the seawater contributed to the Raman band at 981 cm-1. The Raman bands located at 1,520 and 1,157 cm-1 correspond to the carotenoid C=C (v1) stretching and C–C (v2) stretching bending, separately. The fluorescence band at 677 nm can be assigned to the chlorophyll. Similar to the previous starfish spectra, the chlorophyll most likely comes from the phytoplankton particles that dropped from the upwater and attached to the seabed (Smith et al., 2008). To determine the difference between the surface and interior of the seabed rocks, we compared the Raman spectra of the new rock sections with the original exposed rocks of the seabed. Figure 9 presents two spectra obtained from the old exposed surface and new fracture, and the major differences between them are fluorescence and carotenoid. Compared to the new section, the surface contained more biological material, causing stronger fluorescence and carotenoid Raman bands. Combining the spectral results and microscopic images of the samples, it was not difficult to infer that the seabed is a granular limestone with calcite as the main component.
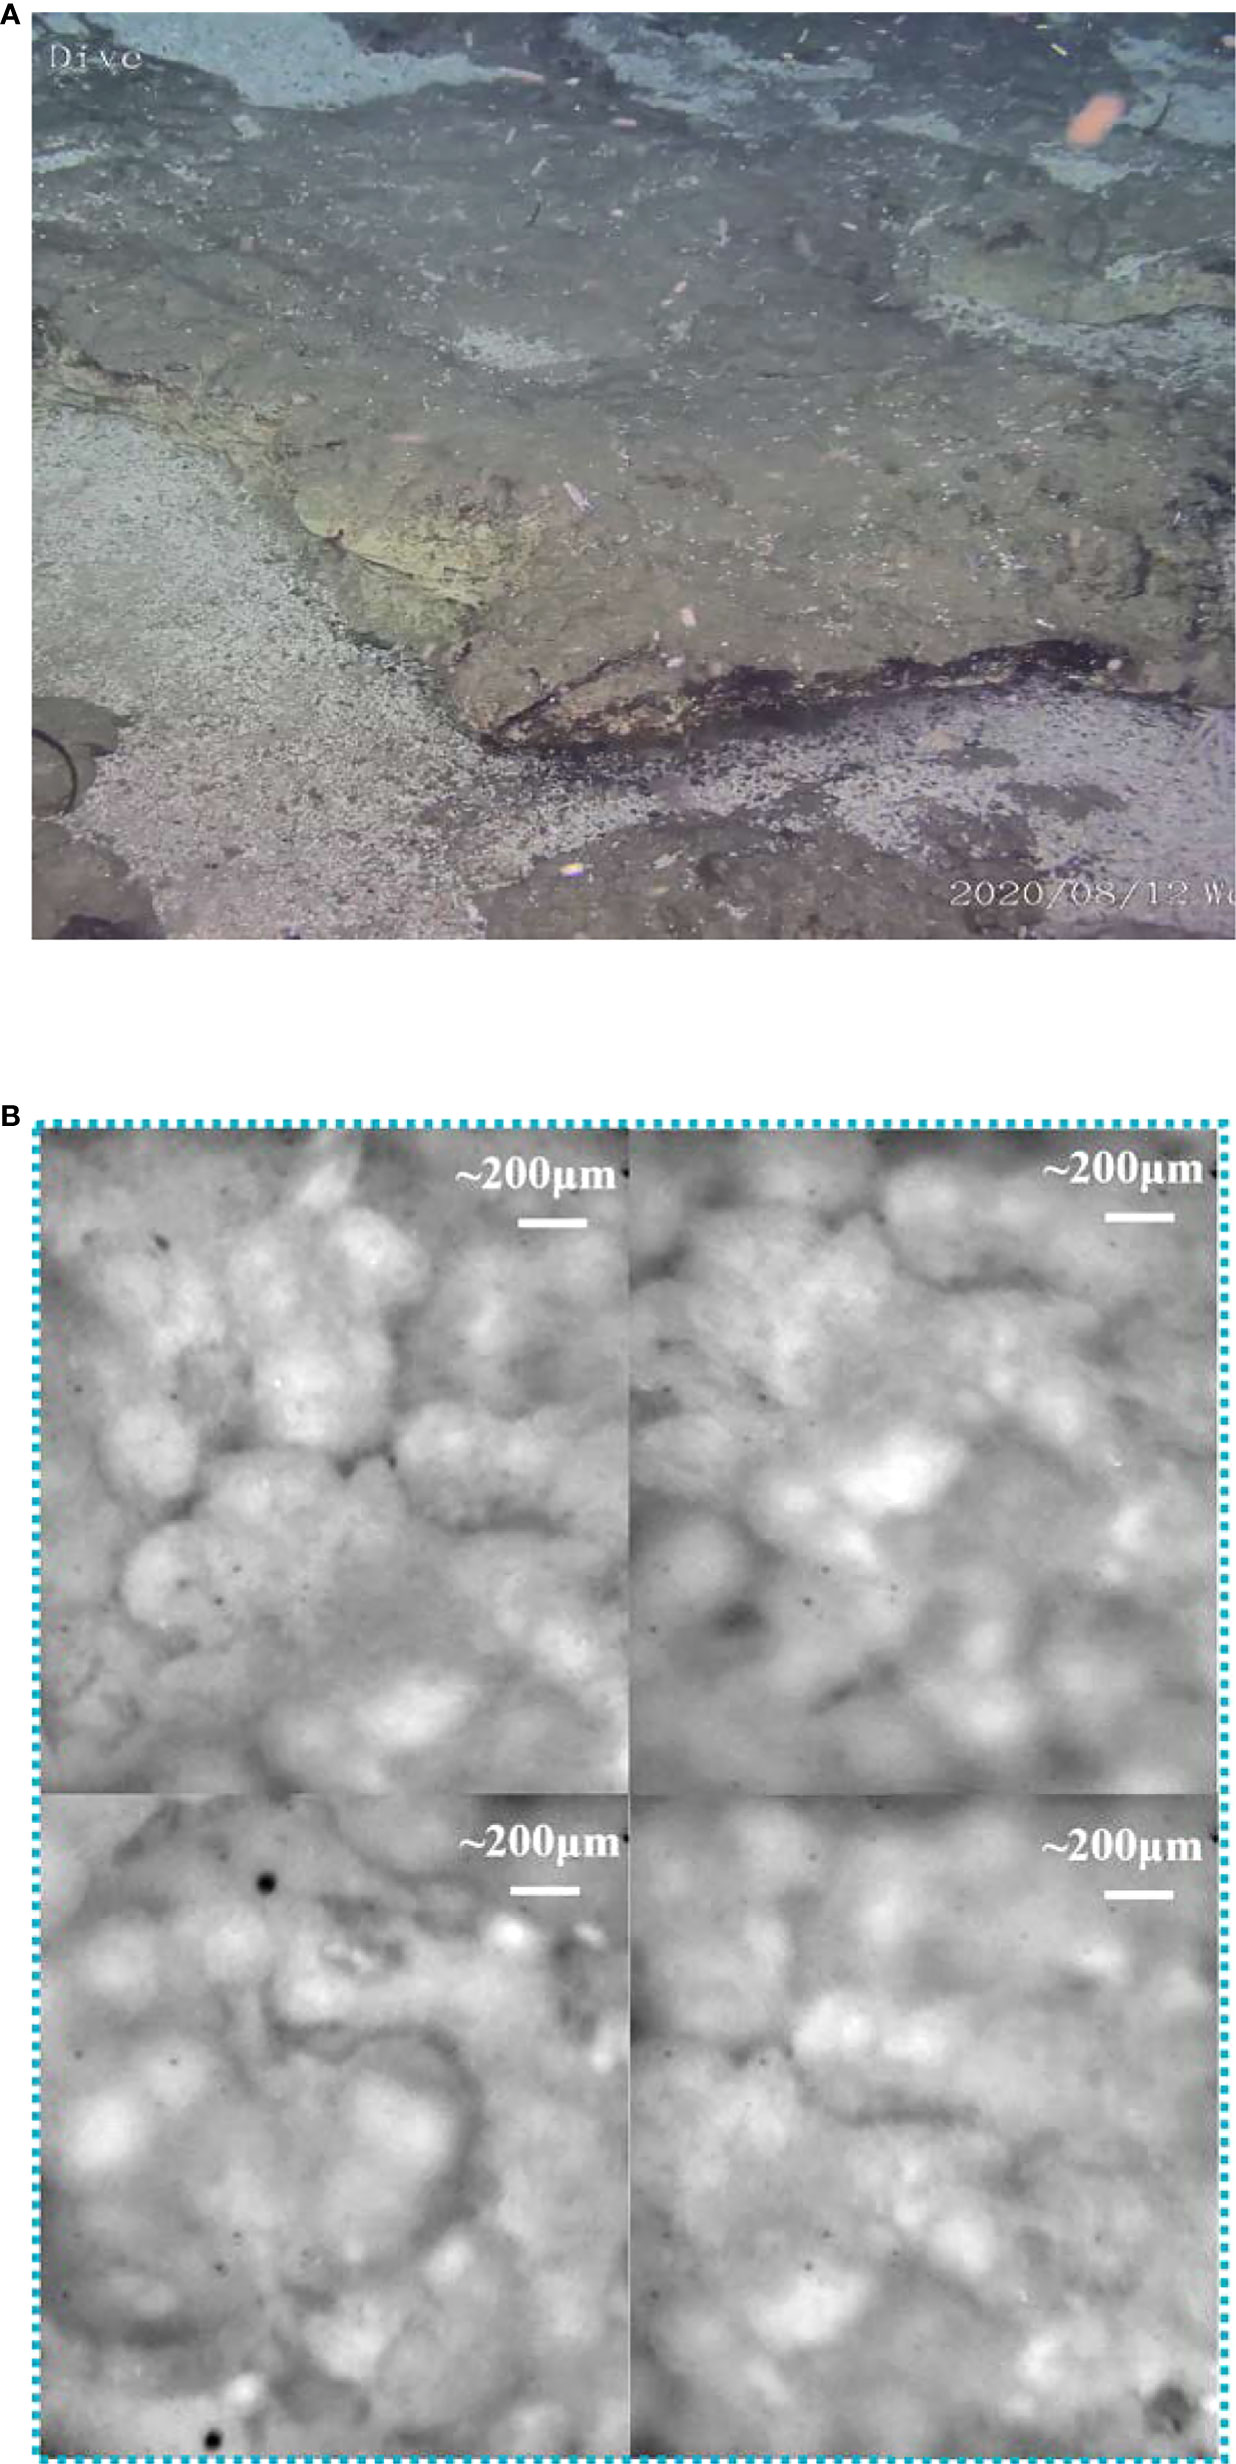
Figure 8 The macroimage of the seabed rock sample and its microimaging results. (A) The macroimages of the seabed obtained by ROV HD camera. (B) The microimaging results of the rock sample.
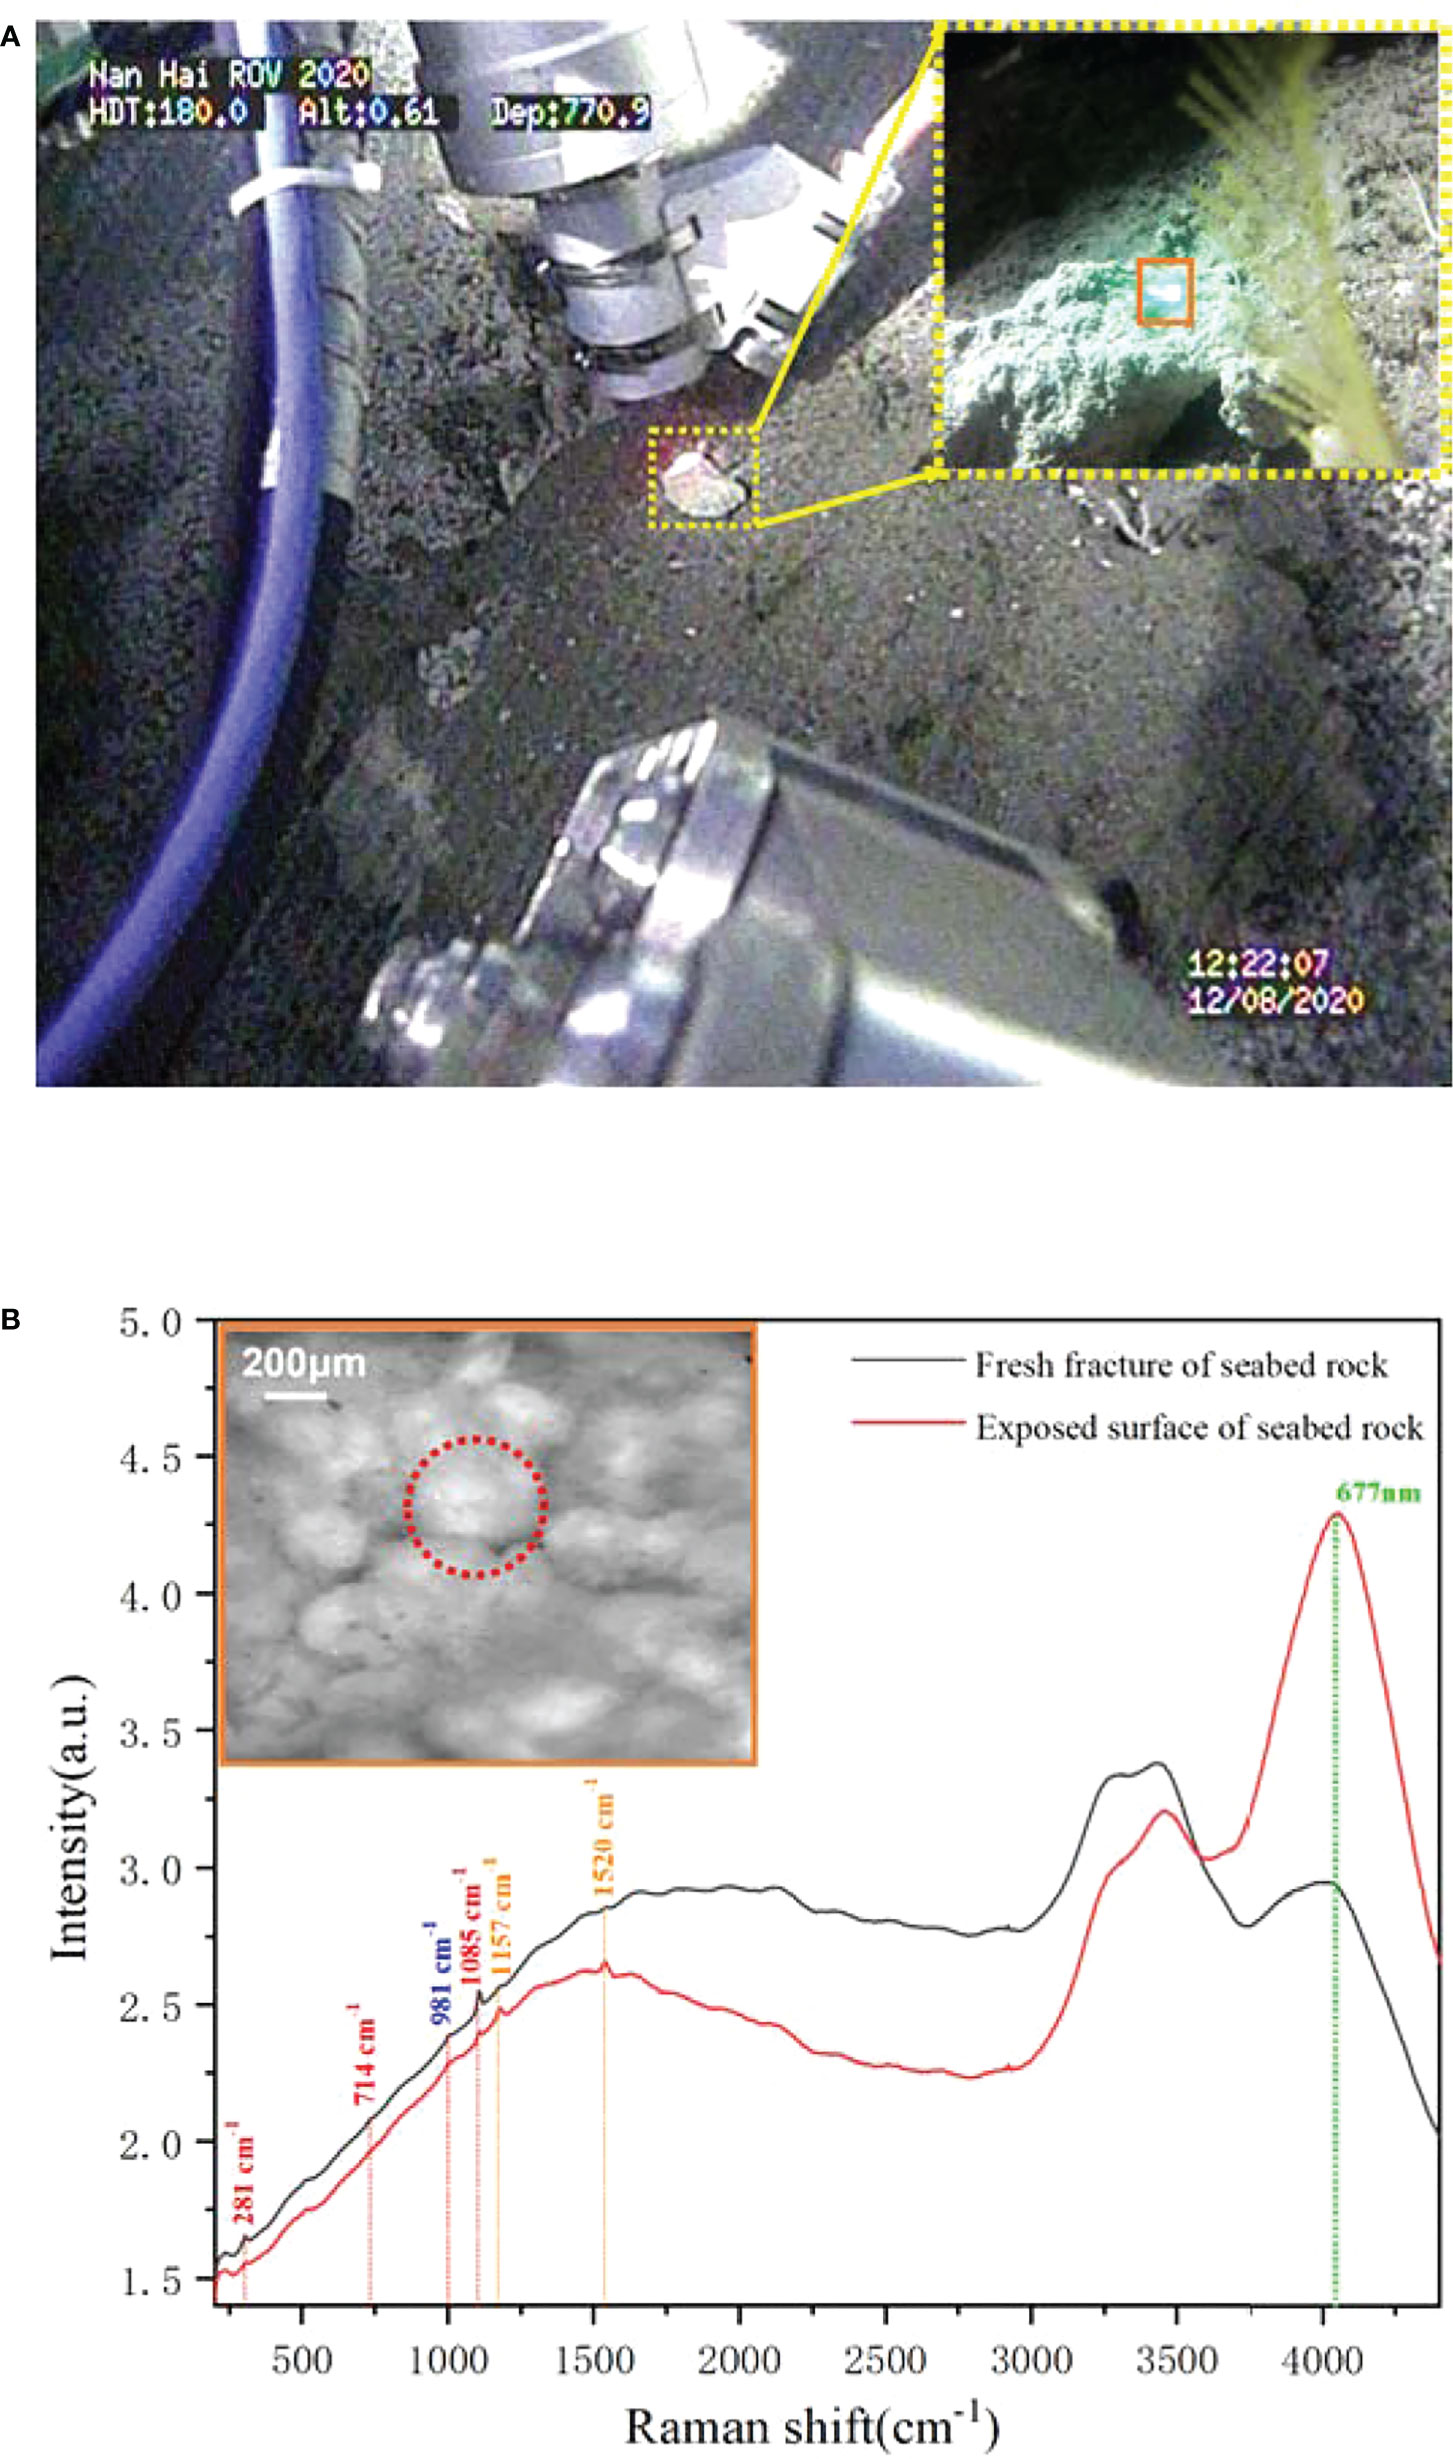
Figure 9 The in situ Raman detection and microimaging of the rock sample. (A) The scenario of underwater imaging and detection. (B) The Raman spectra obtained from the benthic rock sample.
4.3 Biomineralization targets—shell
At the seabed crevices, we found numerous shell fragments as shown in Figure 10A, but no living shelled benthic organisms were found in this area. They were more likely transported by bottom currents and retained in the seabed crevices. Further macroscopic imaging by the probe-side-mounted camera showed that these shells were mainly from brachiopod detritus, including Agulthasia, Magellania, and Discinisca. These brachiopods are common on the continental shelf, with only a few occurring at shelf breaks associated with the presence of deep-water corals (Brand et al., 2003). Although they can be found from the littoral waters (generally subtidal) through to the abyssal zone, their fragile shell makes it difficult to obtain complete samples of deep water. Further detection shows that the shell’s spectra are really simple, except for the seawater bands and a big florescence bump over the whole range, and only a symmetric stretching band of carbonate is observed in Figure 5. It indicates that the shell is already completely bleached, without any organic matter left. Limited by the microvision field, we can only observe the partial part of the shells, and the crushed shell also indicated that the brachiopod in the shell was already dead for a long time.
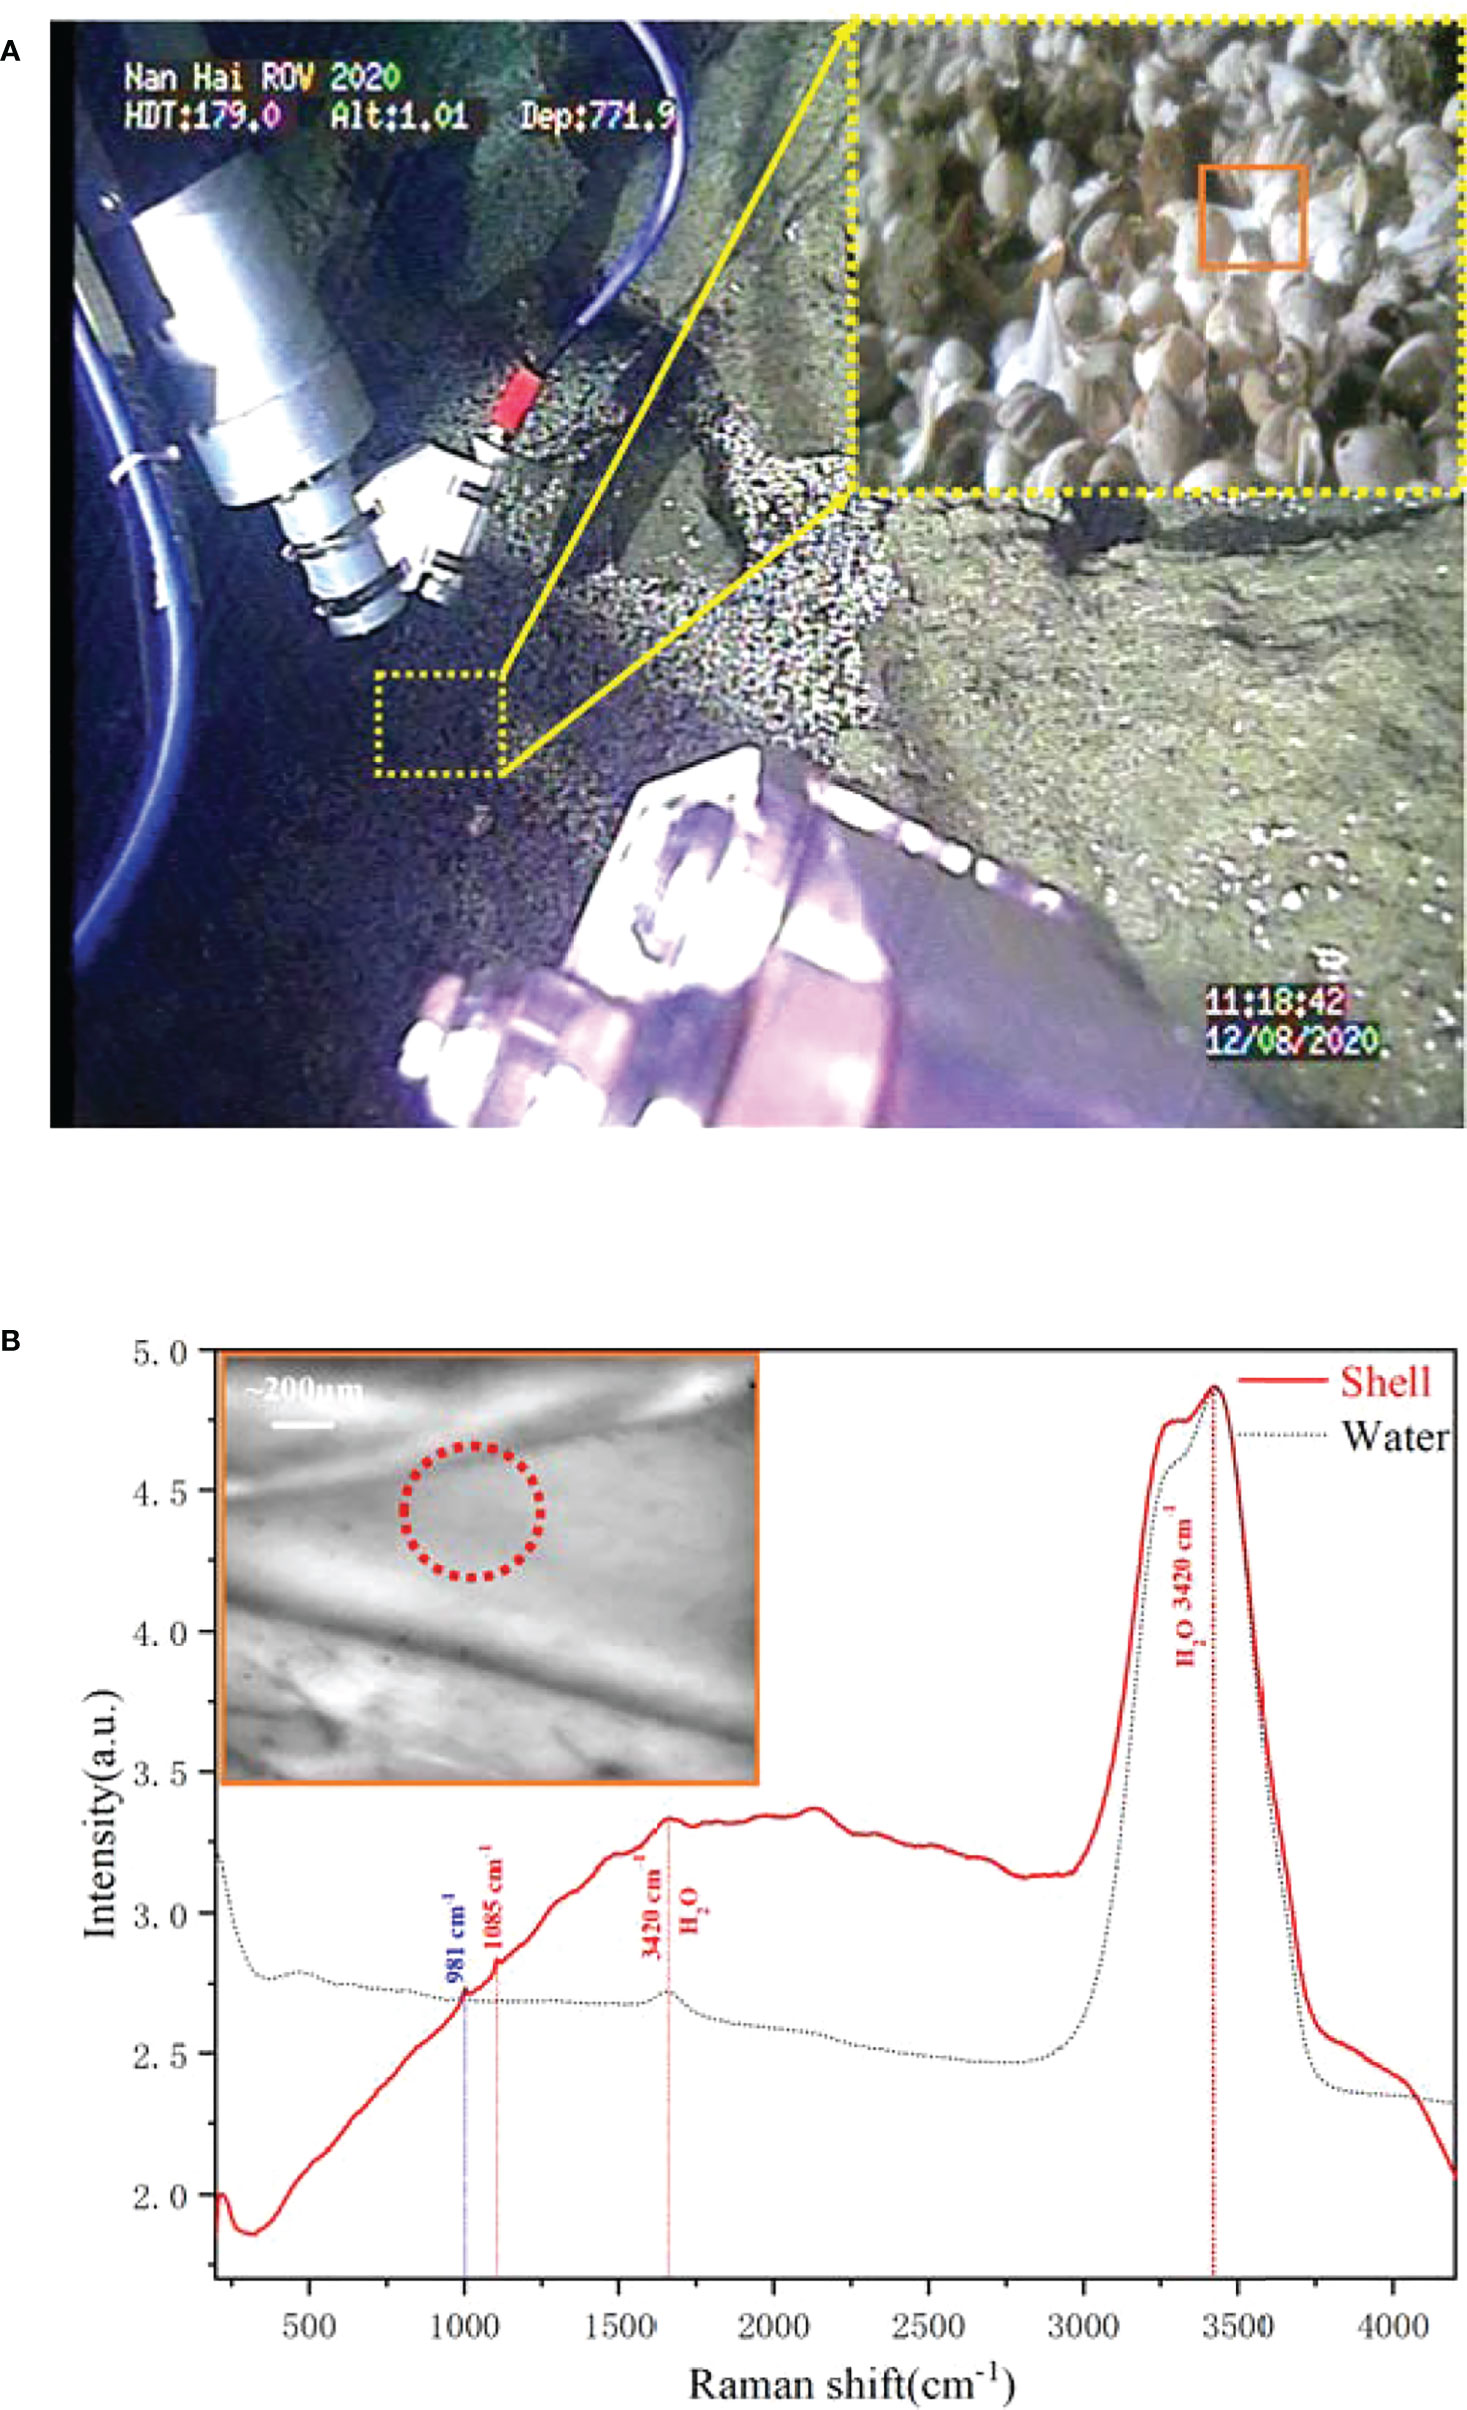
Figure 10 The in situ Raman detection and microimaging of deep-sea brachiopods shell. (A) The scenario of deep-sea in situ imaging and detection. (B) The Raman spectra of deep sea brachiopods shell.
5 Conclusion
To solve the problem of in situ observation of deep-sea microscale targets, an ROV-based deep-sea microimaging system, MICROcean, was developed. It adapted hybrid positioning method, using mechanical position and optical zoom to overcome the challenge of employing precise focus in the deep sea. Meanwhile, it further coupled a Raman detection model to assist the target identification. In the next sea trials, the system successfully obtained thousands of microimages and Raman spectra of deep-sea benthic target, such as starfish, rocks, and brachiopod shells, at 770 m. This is the first attempt to perform in situ microscopic observation of benthic targets in the deep sea; it extends the existing observation methods and provides new perspectives for deep-sea investigations. This system demonstrates the feasibility of microscopic imaging in the deep sea and shows its great potential in deep-sea investigation. Next, we will optimize and improve the system for some problems that have not yet been adequately solved, such as low contrast and attenuation in resolution, and promote it to become a common technique for underwater investigation.
Data availability statement
The original contributions presented in the study are included in the article/Supplementary Material. Further inquiries can be directed to the corresponding authors.
Author contributions
QL and JG proposed the conception and built the system. YL provided the solution for microscope imaging. ZW and WY built the software. SL and LW performed the calibration and laboratory test. RZ provided technical guidance for the system setup. XZ planned experiments and led the sea trials. All authors contributed to manuscript revision, read, and approved the submitted version.
Funding
This research was funded by Shandong Special Fund of Pilot National Laboratory for Marine Science and Technology (Qingdao) (No. 2021QNLM020002), Provincial Key Research and Development Program of Shandong, China (2019GHZ010, 2019JZZY010417), and Fundamental Research Funds for the Central Universities (201961006).
Acknowledgments
We would like to thank the captain and crew of the research vehicle “Zhangjian” and the ROV pilots for their skilled operation support in the sea trial.
Conflict of interest
The authors declare that the research was conducted in the absence of any commercial or financial relationships that could be construed as a potential conflict of interest.
The handling editor ZS declared a past co-authorship with the author JG.
Publisher’s note
All claims expressed in this article are solely those of the authors and do not necessarily represent those of their affiliated organizations, or those of the publisher, the editors and the reviewers. Any product that may be evaluated in this article, or claim that may be made by its manufacturer, is not guaranteed or endorsed by the publisher.
References
Aggarwal A., Albiez J. (2013). “Autonomous trajectory planning and following for industrial underwater manipulators,” in 2013 OCEANS-San Diego (New York: IEEE), 1–7.
Blowes L. M., Egertová M., Liu Y., Davis G. R., Terrill N. J., Gupta H. S., et al. (2017). Body wall structure in the starfish asterias rubens. J. Anat. 231, 325–341. doi: 10.1111/joa.12646
Brand U., Logan A., Hiller N., Richardson J. (2003). Geochemistry of modern brachiopods: applications and implications for oceanography and paleoceanography. Chem. Geol. 198, 305–334. doi: 10.1016/S0009-2541(03)00032-9
Breier J., Gomez-Ibanez D., Reddington E., Huber J., Emerson D. (2012). A precision multi-sampler for deep-sea hydrothermal microbial mat studies. Deep Sea Res. Part I: Oceanographic Res. Papers 70, 83–90. doi: 10.1016/j.dsr.2012.10.006
Breier J., White S., German C. (2010). Mineral–microbe interactions in deep-sea hydrothermal systems: a challenge for raman spectroscopy. Philos. Trans. R. Soc. A: Mathematical Phys. Eng. Sci. 368, 3067–3086. doi: 10.1098/rsta.2010.0024
Brewer P. G., Malby G., Pasteris J. D., White S. N., Peltzer E. T., Wopenka B., et al. (2004). Development of a laser raman spectrometer for deep-ocean science. Deep Sea Res. Part I: Oceanographic Res. Papers 51, 739–753. doi: 0.1016/j.dsr.2003.11.005
Chen L., Ghilardi M., Busfield J. J., Carpi F. (2021). Electrically tunable lenses: a review. Front. Robotics AI 166. doi: 10.3389/frobt.2021.678046
Colman D. R., Poudel S., Stamps B. W., Boyd E. S., Spear J. R. (2017). The deep, hot biosphere: Twenty-five years of retrospection. Proc. Natl. Acad. Sci. 114, 6895–6903. doi: 10.1073/pnas.1701266114
de Oliveira V. E., Castro H. V., Edwards H. G., de Oliveira L. F. C. (2010). Carotenes and carotenoids in natural biological samples: a raman spectroscopic analysis. J. Raman Spectrosc. 41, 642–650. doi: 10.1002/jrs.2493
Fahrbach F. O., Voigt F. F., Schmid B., Helmchen F., Huisken J. (2013). Rapid 3d light-sheet microscopy with a tunable lens. Optics Express 21, 21010–21026. doi: 10.1364/OE.21.021010
Fu J., Poletti M., Liu Q., Iovene E., Su H., Ferrigno G., et al (2022). Teleoperation Control of an Underactuated Bionic Hand: Comparison between Wearable and Vision-Tracking-Based Methods. Robotics 11:61. doi: 10.3390/robotics11030061
Graf G. (1989). Benthic-pelagic coupling in a deep-sea benthic community. Nature 341, 437–439. doi: 10.1038/341437a0
Gunasekaran S., Anbalagan G., Pandi S. (2006). Raman and infrared spectra of carbonates of calcite structure. J. Raman Spectrosc. 37, 892–899. doi: 10.1002/jrs.1518
Levin L. A., Bett B. J., Gates A. R., Heimbach P., Howe B. M., Janssen F., et al. (2019). Global observing needs in the deep ocean. Front. Mar. Sci. 6, 241. doi: 10.3389/fmars.2019.00241
Liang J., Feng J.-C., Zhang S., Cai Y., Yang Z., Ni T., et al. (2021). Role of deep-sea equipment in promoting the forefront of studies on life in extreme environments. Iscience 24, 103299. doi: 10.1016/j.isci.2021.103299
Lin M., Yang C. (2020). Ocean observation technologies: A review. Chin. J. Mechanical Eng. 33, 1–18. doi: 10.1186/s10033-020-00449-z
Liu Q., Guo J., Lu Y., Liu S., Nie M., Wei Z., et al. (2022). Microimage coupled raman optical probes for benthic solid target detection. J. Raman Spectrosc. doi: 10.1002/jrs.6411
Liu F., Han P., Wei Y., Yang K., Huang S., Li X., et al. (2018). Deeply seeing through highly turbid water by active polarization imaging. Optics Lett. 43, 4903–4906. doi: 10.1364/OL.43.004903
Liu X., Li X., Su H., Zhao Y., Ge S. S. (2022). The opening workspace control strategy of a novel manipulator-driven emission source microscopy system. ISA transactions (early access) 53, 1604–1613. doi: 10.1016/j.isatra.2022.09.002
Li X., Zhang D., Bai Y., Wang W., Liang J., Cheng J.-X. (2019). Fingerprinting a living cell by raman integrated mid-infrared photothermal microscopy. Analytical Chem. 91, 10750–10756. doi: 10.1021/acs.analchem.9b02286
Lythgoe J. N. (1972). “The adaptation of visual pigments to the photic environment,” in Photochemistry of vision (Springer) (Amsterdam: Elsevier) 566–603.
Man’kovsky V. (2012). Spectral contributions of the components of seawater to the beam attenuation coefficient in surface waters of the mediterranean sea. Phys. Oceanography 21, 305–319. doi: 10.1007/s11110-012-9124-z
Mu W., Liu J., Zhang H. (2018). The first complete mitochondrial genome of the mariana trench freyastera benthophila (asteroidea: Brisingida: Brisingidae) allows insights into the deep-sea adaptive evolution of brisingida. Ecol. Evol. 8, 10673–10686. doi: 10.1002/ece3.4427
Mullen A. D., Treibitz T., Roberts P. L., Kelly E. L., Horwitz R., Smith J. E., et al. (2016). Underwater microscopy for in situ studies of benthic ecosystems. Nat. Commun. 7, 1–9. doi: 10.1038/ncomms12093
Murray J. M., Meadows A., Meadows P. S. (2002). Biogeomorphological implications of microscale interactions between sediment geotechnics and marine benthos: a review. Geomorphology 47, 15–30. doi: 10.1016/S0169-555X(02)00138-1
Nguyen T. T., Zakem E. J., Ebrahimi A., Schwartzman J., Caglar T., Amarnath K., et al. (2022). Microbes contribute to setting the ocean carbon flux by altering the fate of sinking particulates. Nat. Commun. 13, 1–9. doi: 10.1038/s41467-022-29297-2
NOAA (2022) Data from: Noaa ocean exploration benthic deepwater animal identification guide. Available at: http://oceanexplorer.noaa.gov/okeanos/animalguide/animalguide.html
Optotune (2022) Data from: Optotune el-10-30 datasheet. Available at: https://www.optotune.com/el-10-30-c-lens
Schechner Y. Y., Karpel N. (2005). Recovery of underwater visibility and structure by polarization analysis. IEEE J. Oceanic Eng. 30, 570–587. doi: 10.1109/JOE.2005.850871
Smith C. R., Mincks S., DeMaster D. J. (2008). The foodbancs project: introduction and sinking fluxes of organic carbon, chlorophyll-a and phytodetritus on the western antarctic peninsula continental shelf. Deep Sea Res. Part II: Topical Stud. Oceanography 55, 2404–2414. doi: 10.1016/j.dsr2.2008.06.001
Keywords: deep sea, in-situ, micro-imaging, raman spectroscopy, remotely operated vehicle
Citation: Liu Q, Guo J, Lu Y, Wei Z, Liu S, Wu L, Ye W, Zheng R and Zhang X (2022) Underwater Raman microscopy—a novel in situ tool for deep-sea microscale target studies. Front. Mar. Sci. 9:1018042. doi: 10.3389/fmars.2022.1018042
Received: 12 August 2022; Accepted: 22 September 2022;
Published: 14 October 2022.
Edited by:
Zhilei Sun, Qingdao Institute of Marine Geology (QIMG), ChinaCopyright © 2022 Liu, Guo, Lu, Wei, Liu, Wu, Ye, Zheng and Zhang. This is an open-access article distributed under the terms of the Creative Commons Attribution License (CC BY). The use, distribution or reproduction in other forums is permitted, provided the original author(s) and the copyright owner(s) are credited and that the original publication in this journal is cited, in accordance with accepted academic practice. No use, distribution or reproduction is permitted which does not comply with these terms.
*Correspondence: Jinjia Guo, opticsc@ouc.edu.cn; Xilin Zhang, ouczhxl@163.com