De novo Creation and Assessment of a Prognostic Fat-Age-Inflammation Index “FAIN” in Patients With Cancer: A Multicenter Cohort Study
 Liangyu Yin1,2
  Chunhua Song3
  Jiuwei Cui4
  Xin Lin1
  Na Li1 Yang Fan1 Ling Zhang1 Jie Liu1 Feifei Chong1 Chang Wang4 Tingting Liang4
  Xiangliang Liu4 Li Deng4 Mei Yang5 Jiami Yu5 Xiaojie Wang5 Xing Liu6 Shoumei Yang6 Zheng Zuo6 Kaitao Yuan7 Miao Yu7 Minghua Cong8
  Zengning Li9 Min Weng10
  Qinghua Yao11 Pingping Jia12 Suyi Li6
  Zengqing Guo5
  Wei Li4*
  Hanping Shi12*
  Hongxia Xu1*
- 1Department of Clinical Nutrition, Daping Hospital, Army Medical University (Third Military Medical University), Chongqing, China
- 2Institute of Hepatopancreatobiliary Surgery, Southwest Hospital, Army Medical University (Third Military Medical University), Chongqing, China
- 3Department of Epidemiology, College of Public Health, Zhengzhou University, Zhengzhou, China
- 4Cancer Center, The First Hospital, Jilin University, Changchun, China
- 5Department of Medical Oncology, Fujian Cancer Hospital, Fujian Medical University Cancer Hospital, Fuzhou, China
- 6Department of Nutrition and Metabolism of Oncology, The First Affiliated Hospital of University of Science and Technology of China (Anhui Provincial Cancer Hospital), Hefei, China
- 7Center of Gastrointestinal Surgery, The First Affiliated Hospital of Sun Yat-sen University, Guangzhou, China
- 8Department of Comprehensive Oncology, National Cancer Center or Cancer Hospital, Chinese Academy of Medical Sciences and Peking Union Medical College, Beijing, China
- 9Department of Clinical Nutrition, The First Hospital of Hebei Medical University, Shijiazhuang, China
- 10Department of Clinical Nutrition, The First Affiliated Hospital of Kunming Medical University, Kunming, China
- 11Department of Integrated Chinese and Western Medicine, Cancer Hospital of the University of Chinese Academy of Science (Zhejiang Cancer Hospital), Hangzhou, China
- 12Department of Gastrointestinal Surgery and Department of Clinical Nutrition, Beijing Shijitan Hospital, Capital Medical University, Beijing, China
Background and Aims: Malnutrition is highly prevalent and is related to multiple impaired clinical outcomes in cancer patients. This study aimed to de novo create an objective, nutrition-related index specially for prognostic purposes in oncology populations.
Methods: We performed a multicenter cohort study including 14,134 cancer patients. The prognostic impact for each baseline characteristic was estimated by calculating Harrell's C-index. The optimal parameters reflecting the nutritional and inflammatory impact on patients' overall survival were selected to develop the fat-age-inflammation (FAIN) index. The associations of the FAIN with the nutritional status, physical performance, quality of life, short-term outcomes and mortality of patients were comprehensively evaluated. Independent external validation was performed to further assess the prognostic value of the FAIN.
Results: The study enrolled 7,468 men and 6,666 women with a median age of 57 years and a median follow-up of 42 months. The FAIN index was defined as: (triceps skinfold thickness + albumin) / [age + 5 × (neutrophil count/lymphocyte count)]. There were significant associations of the FAIN with the nutritional status, physical performance, quality of life and short-term outcomes. The FAIN also showed better discrimination performance than the Nutritional Risk Index, the Prognostic Nutritional Index and the Controlling Nutritional Status index (all P < 0.05). In multivariable-adjusted models, the FAIN was independently associated with a reduced death hazard both as a continuous variable (HR = 0.57, 95%CI = 0.47–0.68) and per one standard deviation (HR = 0.83, 95%CI = 0.78–0.88). External validation in a multicenter lung cancer cohort (n = 227) further confirmed the prognostic value of the FAIN.
Conclusions: This study created and assessed the prognostic FAIN index, which might act as a feasible option to monitor the nutritional status and help develop intervention strategies to optimize the survival outcomes of cancer patients.
Introduction
Cancer is a huge threat to human health, with an estimated 19.3 million global incident cases and almost 10.0 million deaths annually (1). Despite the recent introduction of new treatment options (2, 3), the poor prognosis of many cancers remains largely unchanged, and the number of new cases is predicted to increase significantly in the foreseeable future (1, 4). Therefore, novel diagnostic, therapeutic and management strategies have been continuously sought, and multimodal cancer care is being emphasized in current oncology practice (5, 6).
Oncology patients frequently experience reduced food intake, weight loss, physical inactivity, metabolic changes and systemic inflammation, which have been ascribed to the chronic consumptive nature of the malignancy itself and/or the side effects of various anti-cancer therapies (7, 8). Thus, they are at particularly high risk for malnutrition compared to other patient groups (9). Additionally, cancer-related malnutrition is often linked to other nutrition status-related conditions such as cachexia and sarcopenia (5, 10–12). These conditions can independently or jointly lead to an impaired quality of life (QOL) (13–15), reduced treatment tolerance (16), increased postoperative complications (17), delayed rehabilitation of organ function (18) and a shortened overall survival (7, 19, 20). Previous studies have estimated that 10–20% of cancer deaths can be attributed to malnutrition rather than the cancer itself (21, 22). However, malnutrition is often underestimated (23), misclassified (24), or left untreated (25) in oncology populations. To address these challenges, the European Society of Clinical Nutrition and Metabolism (ESPEN) recommends in its guidelines that all cancer patients should be evaluated regularly for the risk or presence of malnutrition to guide subsequent intervention strategies (5, 6).
Of the validated approaches used to screen for the risk or assess the severity of malnutrition, the Nutritional Risk Screening 2002 (NRS2002) (26) and the Patient-Generated Subjective Global Assessment (PG-SGA) (27) are the most widely used tools in Chinese oncology patients (15, 19, 28). The Global Leadership Initiative on Malnutrition (GLIM) (11), a set of ESPEN-endorsed guidelines aiming to unify the diagnosis of malnutrition in patients with a wide spectrum of diseases, have also been garnering increasing interest from the nutrition society (7, 8, 14, 15, 17, 19, 20, 28). In addition to these questionnaire- or expert opinion-based tools, several nutrition-related indices have also been implemented to assess the nutritional status of patients, such as the Nutritional Risk Index (NRI) (29), the Controlling Nutritional Status (CONUT) index (30) and the Prognostic Nutritional Index (PNI) (31). These scoring indices were derived from objective laboratory blood tests with/without anthropometric parameters, which have shown significant prognostic value in oncology populations (31–33). However, to our knowledge, although previous studies indicated that cancer patients can have different malnutrition phenotypes, including different anthropometric parameters compared to other patient groups (34, 35), there is not yet an objective, prognosis-oriented, nutrition-related and simple-to-obtain index that is designed specifically for oncology populations.
In the present study conducted in a large-scale, multicenter oncology cohort, we created a prognostic fat-age-inflammation (FAIN) index using a data-driven, outcome-oriented algorithm. We then compared the prognostic performance of the FAIN with five existing scoring systems and comprehensively investigated the associations of the FAIN with other patient characteristics, including the nutritional status, physical performance, QOL and short-term outcomes. Finally, we analyzed the associations of the FAIN, as both a continuous and categorical variable, with cancer mortality.
Methods
Population and Design
This was a nationwide, multicenter cohort study. All patients were derived from the Investigation on Nutrition Status and its Clinical Outcome of Common Cancers (INSCOC) project of China which was registered online at https://www.chictr.org.cn (ID: ChiCTR1800020329). The full design of the INSCOC project has been described previously (36) and the detailed inclusion and exclusion criteria are shown in Supplementary Table 1. For the present study, we included 14,908 patients aged over 18 years who were diagnosed with cancer and/or were hospitalized for anti-cancer treatment from November 2011 to April 2019 at multiple centers in four geographical regions (east, south, west and north) of China. After excluding 509 patients with non-solid malignancies and 265 patients with an unclear pathological diagnosis, we finally included 14,134 patients with 17 types of cancer as the study population (Supplementary Figure 1). An independent cohort including 355 esophageal cancer patients diagnosed from December 2014 to November 2019 (not included in the INSCOC project) in our institution was used as the validation set to evaluate the prognostic performance of the FAIN. The study was approved by the Ethics Committees of all participating institutions and all data was analyzed anonymously. All participants in the study provided written consent for the scientific use of their data and the principles of the Declaration of Helsinki were followed.
Data Acquisition
The following information was collected at baseline within 48 h upon admission by a project-trained researcher via a face-to-face interview or physical examination: age, sex, smoking (active tobacco smoker before admission), alcohol drinking (once a week or more frequent alcohol consumption in the past 1 year, regardless of amount), tea consumption (once a week or more frequent tea consumption in the past 1 year, regardless of amount), comorbidities, height, weight, body mass index (BMI), mid-arm circumference (MAC, non-dominant arm), triceps skinfold thickness (TSF, non-dominant arm), handgrip strength (HGS, non-dominant hand), mid-arm muscle circumference (MAMC), calf circumference (CC, left calf), unintentional weight loss within and beyond 6 months, the NRS2002 score (≥ 3 indicating nutritional risk) (26), the PG-SGA score (27), the Karnofsky Performance Status (KPS) score (37) and the European Organization for Research and Treatment of Cancer QLQ-C30 score (QLQ-C30) (38).
In the present study, the BMI was also categorized as underweight (<18.5 kg/m2); normal (18.5 to <24 kg/m2), overweight (24 to <28 kg/m2), or obese (≥28 kg/m2) according to the Chinese recommendation (39). The detailed approaches and instruments used to obtain the anthropometric information (height, weight, BMI, MAC, TSF, HGS, MAMC, CC and weight loss) have been described previously (40), and are also shown in Supplementary Table 2. The gastrointestinal symptoms within the PG-SGA scale were extracted and analyzed independently. For the QLQ-C30, the global QOL scale was used in the present study, with a higher score indicating a better overall QOL.
The disease and treatment information, including the cancer site, clinical stage, differentiation grade, anticancer therapies used, serum indices, length of hospital stay, presence of intensive care unit stay, length of hospitalization, cost and thirty-day death were retrospectively retrieved from electronic medical records. Serum indices were all measured at the clinical laboratories of the participating institutions using fasting blood samples drawn upon admission.
Follow-Up and Main Outcome
Patients were followed annually after enrollment via telephone or face-to-face interviews to obtain the survival information. The all-cause mortality was the main outcome of the present study, and the overall survival time was calculated as the time interval (months) between the first admission and the patient's date of death, the date of the last valid follow-up, or April 2020.
Creation of the Fat-Age-Inflammation (FAIN) Index
A data-driven, outcome-oriented approach was used to create an index reflecting the nutritional and inflammatory impact on the patients' overall survival. First, Harrell's C-index was calculated to assess the prognostic impact of each baseline parameter. Then, the TSF (mm) (20), age (years), neutrophil to lymphocyte ratio (NLR, as an inflammatory marker, same unit for the neutrophils and lymphocytes, such as number/L) (15) and the serum albumin (g/L, as an inflammatory and prognostic marker) (41) were manually selected to develop the FAIN index since they showed the highest C-index within their respective categories. The prototypic definition of the FAIN was: (TSF + albumin)/(age + NLR). To maximize the prognostic value, the optimal formula of the FAIN was explored by multiplying each component with different coefficients (the other three parameters remained unchanged during the tuning of one parameter) and the corresponding C-index was observed. The FAIN index was finally determined to be: (TSF + albumin) / [age + 5 × (neutrophil count/lymphocyte count)].
Statistical Analysis
Continuous data are shown as the medians [interquartile range] and were compared using Wilcoxon's rank-sum test. Categorical data were expressed as numbers (percentage) and compared using a Chi-squared test. The two-variable correlation was examined using a Spearman's rank correlation test. The baseline NRI, PNI and CONUT indices were also calculated to compare their prognostic value with the FAIN according to the following approaches: NRI = (1.519 × serum albumin, g/L) + (41.7 × present weight / usual weight); PNI = 10*serum albumin (g/dl) + 0.005*total lymphocyte count (mm3); CONUT includes the serum albumin level, total lymphocyte counts and serum total cholesterol level. The detailed scoring method of the CONUT has been described previously (31).
A restricted cubic spline was used to flexibly analyze the potential non-linear associations of the continuous FAIN index with survival. The potential non-linearity was tested using a likelihood ratio test with P < 0.05 indicating a non-linear relationship. We also categorized the continuous FAIN as a dichotomous variable to define the low and high groups using the median value and the optimal stratification (OS)-defined threshold. The OS method selects the threshold for a continuous factor by maximizing the between-group log-rank statistic for the overall survival (42). We also categorized the FAIN in tertiles, quartiles and quintiles to partially minimize the limitations associated with the variable dichotomization. The associations between the FAIN categories and survival was evaluated using Kaplan-Meier curves and log-rank tests. Multivariable-adjusted Cox proportional hazards models were used and hazard ratios (HR) with 95% confidence intervals (95%CIs) were calculated to estimate the association between the FAIN and mortality. We used the Schoenfeld individual test and Kaplan-Meier curves to statistically and visually estimate the proportional hazards assumption for each covariate adjusted (Schoenfeld test P > 0.05 indicates that the proportional hazards assumption is satisfied). The linearity assumption between covariates and outcome was confirmed by the Martingale residual plots.
Incremental models with increasing numbers of covariates were created. A dual-direction stepwise method based on the Bayesian Information Criterion (BIC) was used to help select the significant covariates. Model 1 was an unadjusted crude model. Model 2 was adjusted for the age at baseline. Model 3 was adjusted for age, sex and the BIC-screened independent predictors, including the tumor stage, radical surgery, curative chemotherapy, serum prealbumin level, HGS, the NRS2002 score, length of hospital stay and cancer type. Model 4 was adjusted for all variables in Model 3, plus the calf circumference, PG-SGA score, KPS score and the global QOL score.
Sensitivity analyses were performed to test the robustness of the multivariate Cox regression models by excluding the patients who died within the first 3 (Model 5), 6 (Model 6) and 12 months (Model 7), respectively. Multiplicative interactions were tested by adjusting the cross-product terms. Those covariates showing a statistically significant multiplicative interaction (P < 0.05) were defined as potential effect modifiers and subgroup analyses were performed in different strata of these variables to evaluate the modification of the associations observed in the overall population. The proportional hazards assumption and linearity assumption were also confirmed for the Cox regression models obtained through stratification using the approaches described above. All tests were two-sided, and P < 0.05 was regarded as statistically significant. All analyses were performed using R (version 3.6.3, http://www.rproject.org).
Results
Cohort Overview and Derivation of the FAIN
The study included 7,468 men and 6,666 women with a mean age of 57 years. The tumors were most frequently located in the lung (22.9%), colorectum (15.7%), breast (15.6%), stomach (10.6%), esophagus (8.8%), and nasopharynx (7.9%). The predominant clinical stages were III (39.9%) and IV (24.0%). There were 3,266 (23.1%) underweight patients, 7,396 (52.3%) patients with a normal weight, 2,761 (19.5%) overweight patients, and 711 (5.0%) obese patients. There were 3,241 deaths among 14,134 patients during a median follow-up time of 42 months. The patient age (C-index = 0.583, 95%CI = 0.573–0.593), albumin (C-index = 0.595, 95%CI = 0.585–0.605), NLR (C-index = 0.580, 95%CI = 0.570–0.590), and TSF (C-index = 0.589, 95%CI = 0.579–0.599) showed the highest prognostic value among the various baseline data (reflecting the demographic, inflammatory and anthropometric/nutritional dimensions, Table 1), so these were incorporated to develop the FAIN index. A coefficient screen showed that the FAIN had a maximal C-index when the NLR value was multiplied by 5 (Supplementary Table 3). Thus, the formula to generate the FAIN was determined to be: [TSF (mm) + albumin (g/L)]/[age (years) + 5 × (neutrophil count/lymphocyte count)] and the FAIN index was calculated for each patient using the baseline data.
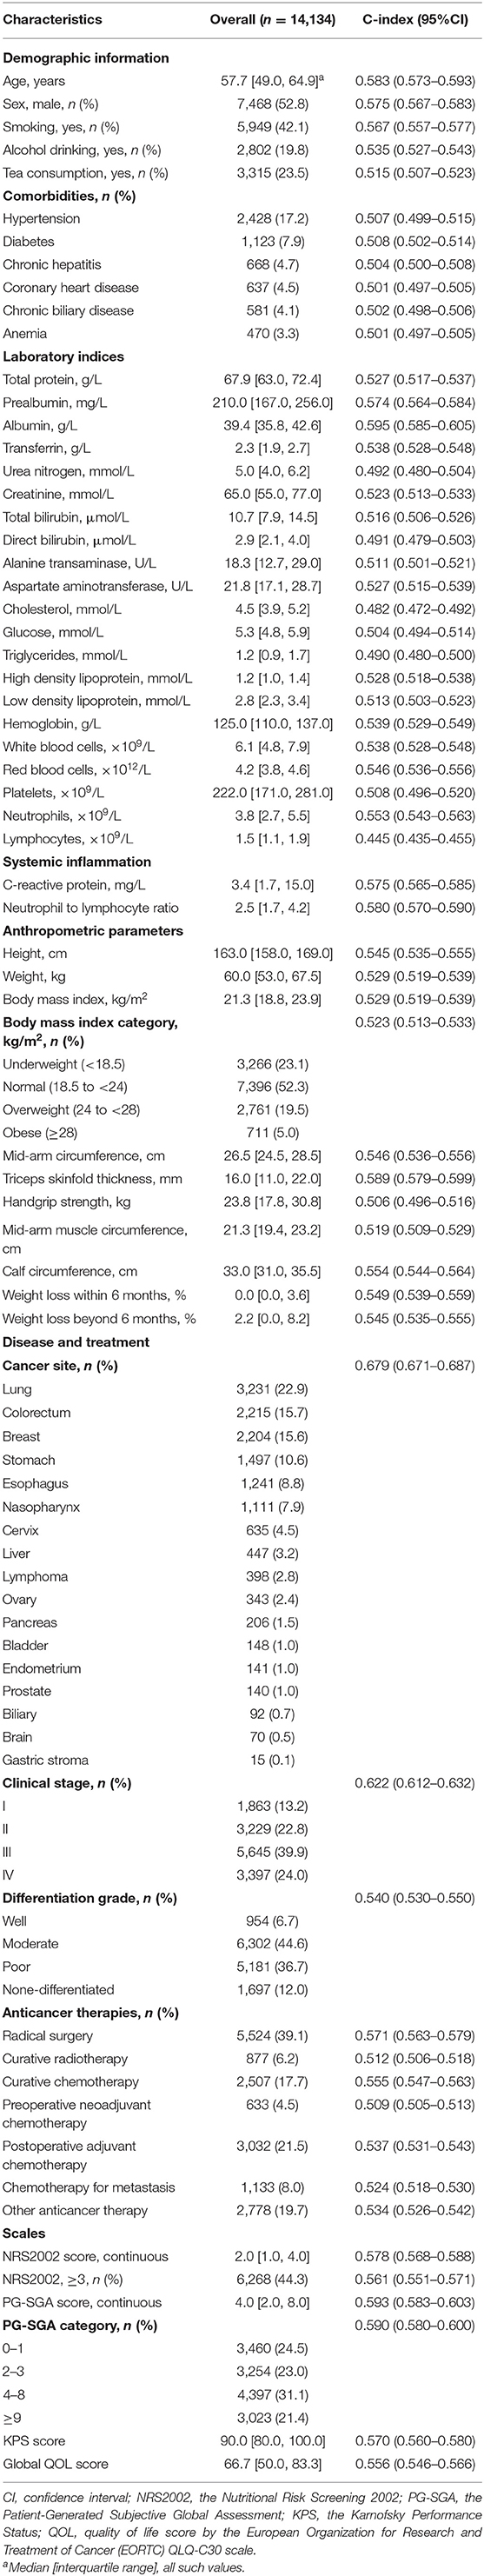
Table 1. Baseline information and corresponding Harrell's C-index.
The FAIN and Patient Characteristics
The baseline patient characteristics, as stratified by the median-dichotomized FAIN, are presented in Table 2. Compared to the FAIN low group, the FAIN high group was associated with a higher value/rate of total protein, pre-albumin, albumin, transferrin, alanine transaminase, cholesterol, triglycerides, high density lipoprotein, low density lipoprotein, hemoglobin, red blood cells, platelets, lymphocytes, weight, BMI, MAC, TSF, HGS, CC, radical surgery, postoperative adjuvant chemotherapy, KPS score, global QOL score, NRI score, and PNI score, and was associated with a lower value/rate of age, male sex, smoking, alcohol drinking, tea consumption, hypertension, diabetes, coronary heart disease, chronic biliary disease, anemia, urea nitrogen, creatinine, total bilirubin, direct bilirubin, glucose, white blood cells, neutrophils, C-reactive protein, NLR, height, MAMC, weight loss within and beyond 6 months, curative radiotherapy, curative chemotherapy, other anticancer therapy, NRS2002 score, PG-SGA score, gastrointestinal symptoms (no appetite, nausea, vomiting, constipation, dry mouth, things taste funny or have no taste, dysphagia, feel full quickly, abdominal pain and other symptoms) and the CONUT score. As was expected, the cancer types, clinical stage and differentiation grade were also different between the low and high FAIN groups. Additionally, a univariate analysis on the short-term outcomes also showed that a higher FAIN was associated with a shorter length of hospital stay, fewer incidents of an intensive care unit stay, lower costs during hospitalization and lower rates of thirty-day mortality (all P < 0.05).
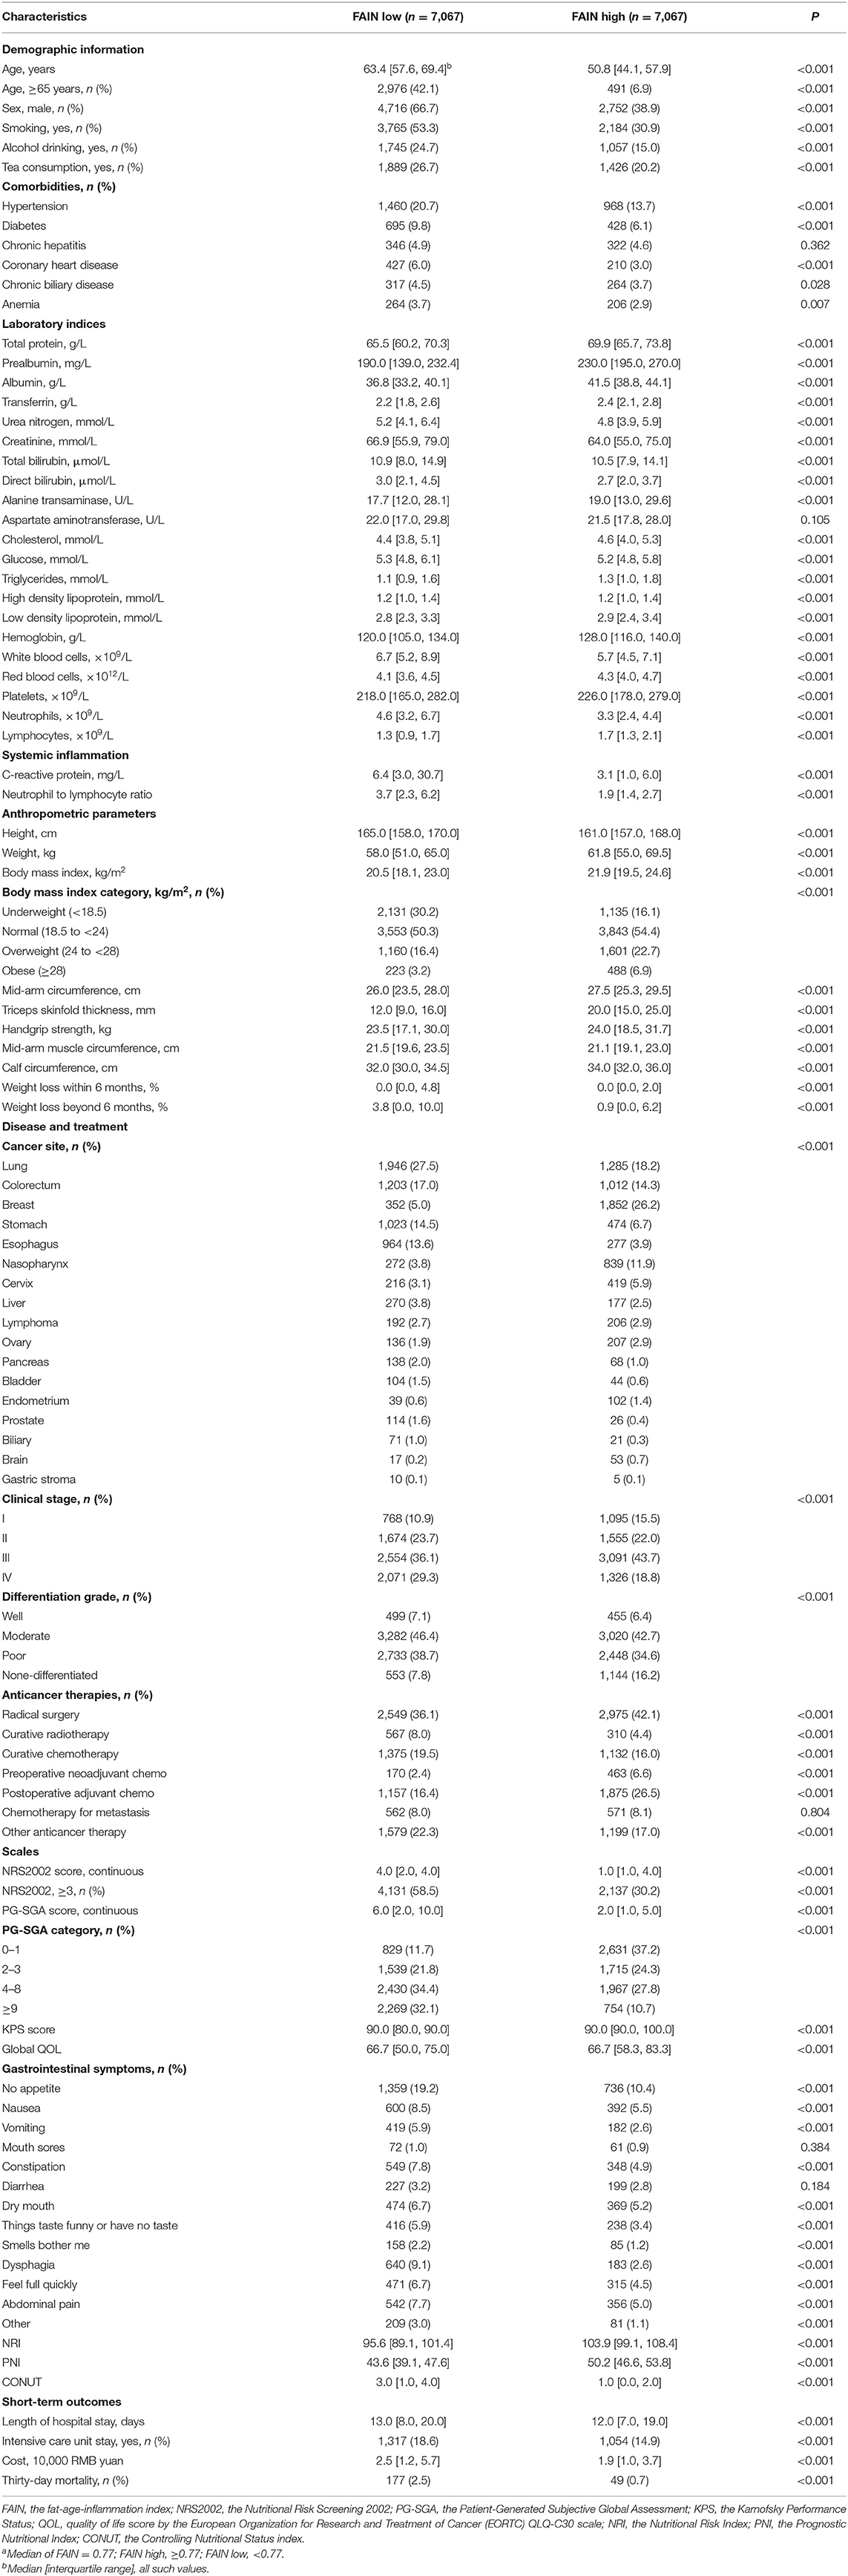
Table 2. Associations between the patient characteristics and median-dichotomized FAINa.
Correlations
Sex-specific spearman's rank correlation tests were performed to assess the degree of relevance for the associations of the continuous FAIN with the BMI, weight loss beyond 6 months, CC, HGS, C-reactive protein, NRS2002 score, PG-SGA score, KPS score and global QOL score (Figure 1). The results were similar for both genders, showing a positive correlation between the FAIN and BMI (Figure 1A), CC (Figure 1C), HGS (Figure 1D), KPS score (Figure 1H) and global QOL score (Figure 1I), and a negative correlation between FAIN and weight loss (Figure 1B), C-reactive protein (Figure 1E), NRS2002 score (Figure 1F) and PG-SGA score (Figure 1G, all P < 0.05).
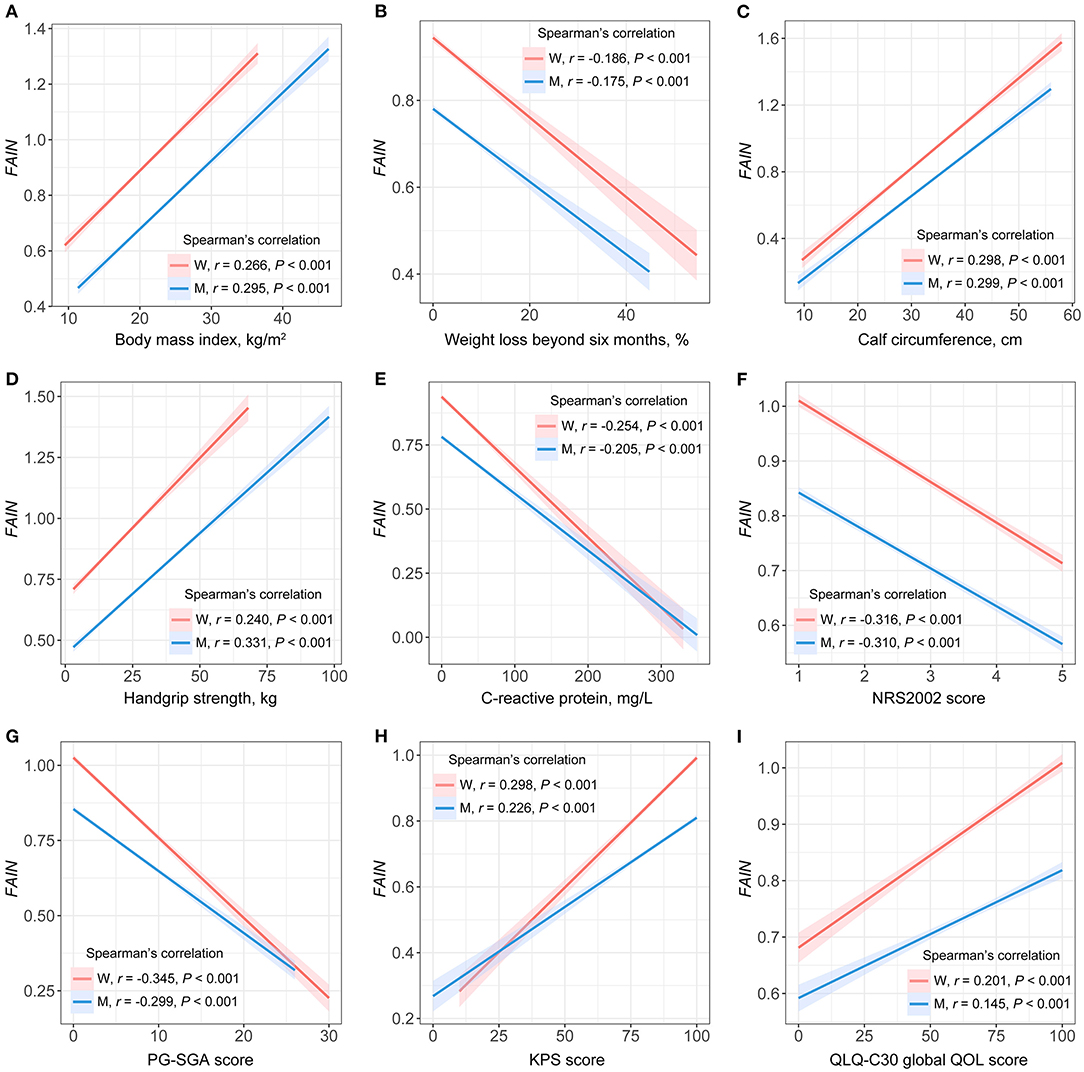
Figure 1. Spearman's rank correlations between the fat-age-inflammation (FAIN) index and patient characteristics. W, women; M, men; NRS2002, the Nutritional Risk Screening 2002; PG-SGA, the Patient-Generated Subjective Global Assessment; KPS, the Karnofsky Performance Status score; QOL, quality of life. (A) FAIN vs. body mass index. (B) FAIN vs. weight loss beyond six months. (C) FAIN vs. calf circumference. (D) FAIN vs. handgrip strength. (E) FAIN vs. C-reactive protein. (F) FAIN vs. NRS2002. (G) FAIN vs. PG-SGA. (H) FAIN vs. KPS score. (I) FAIN vs. QLQ-C30 global QOL score.
Prognostic Value Compared to Five Existing Systems
The Harrell's C-index of the FAIN was statistically compared to those calculated for the NRI, PNI, CONUT, NRS2002, and PG-SGA. The results showed that the FAIN had the highest prognostic value, with a C-index = 0.634 (95%CI = 0.624–0.644) compared to the NRI (C-index = 0.599, 95%CI = 0.589–0.609, P < 0.001), PNI (C-index = 0.595, 95%CI = 0.585–0.605, P < 0.001), CONUT (C-index = 0.575, 95%CI = 0.565–0.585, P < 0.001), NRS2002 (C-index = 0.578, 95%CI = 0.568–0.587, P < 0.001), and PG-SGA (C-index = 0.593, 95%CI = 0.583–0.603, P < 0.001).
Univariate Survival Analysis
A restricted cubic spline analysis showed that the continuous FAIN index was associated with a reduced mortality risk (P < 0.001) and no significant non-linearity was observed for this relationship (P = 0.489). The optimal threshold of the FAIN was 0.82, as determined by the OS (high: ≥0.82; low: <0.82, Figure 2A). Kaplan-Meier curves demonstrated that patients with a higher FAIN had better overall survival than those in the lower groups, regardless of the categorization approach used (all P < 0.001). For the FAIN tertiles, quartiles and quintiles, the tests for P of the trend indicated that the FAIN was monotonically associated with better overall survival of the patients (all P for trend <0.001, Figures 2B–F).
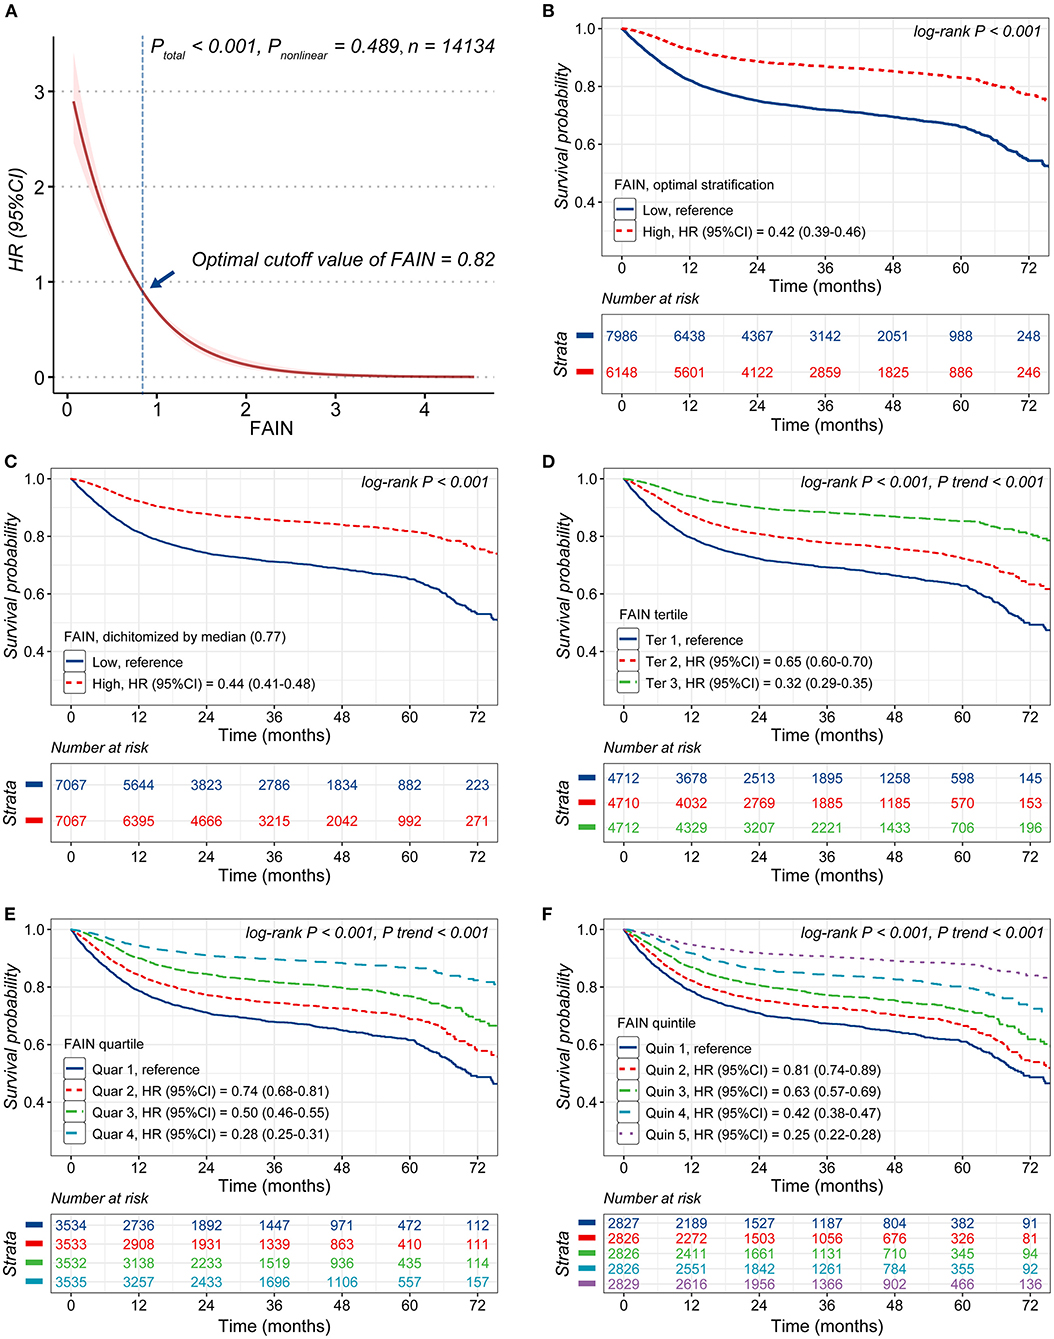
Figure 2. Analysis of the associations of the fat-age-inflammation (FAIN) index with survival. (A) Restricted cubic spine (RCS) analysis of the association of the FAIN with survival. (B) Kaplan-Meier curves stratified by FAIN (dichotomized using the threshold calculated by optimal stratification). (C) Kaplan-Meier curves stratified by the FAIN (dichotomized using the median value). (D) Kaplan-Meier curves stratified by FAIN tertiles. (E) Kaplan-Meier curves stratified by FAIN quartiles. (F) Kaplan-Meier curves stratifi ed by FAIN quintiles.
Multivariable Survival Analysis
The results of the multivariable Cox proportional hazards models on the associations between the FAIN and mortality are shown in Table 3. The FAIN was analyzed as a continuous variable, per each standard deviation and as a categorical variable. In the fully-adjusted model (Model 4), the FAIN was independently associated with a reduced death hazard as both a continuous variable (HR = 0.57, 95%CI = 0.47–0.68) and for separation by one standard deviation (HR = 0.83, 95%CI = 0.78–0.88). Similar results were observed when the FAIN was dichotomized based on the OS (HR = 0.71, 95%CI = 0.64–0.78) or the median value (HR = 0.78, 95%CI = 0.71–0.86). These associations were all sustained when excluding those patients died within the first 3 (Model 5), 6 (Model 6) and 12 months (Model 7), except that the association between the median-dichotomized FAIN and mortality was not sustained in Model 7. This partially supports the use of the OS to generate an outcome-oriented FAIN threshold.
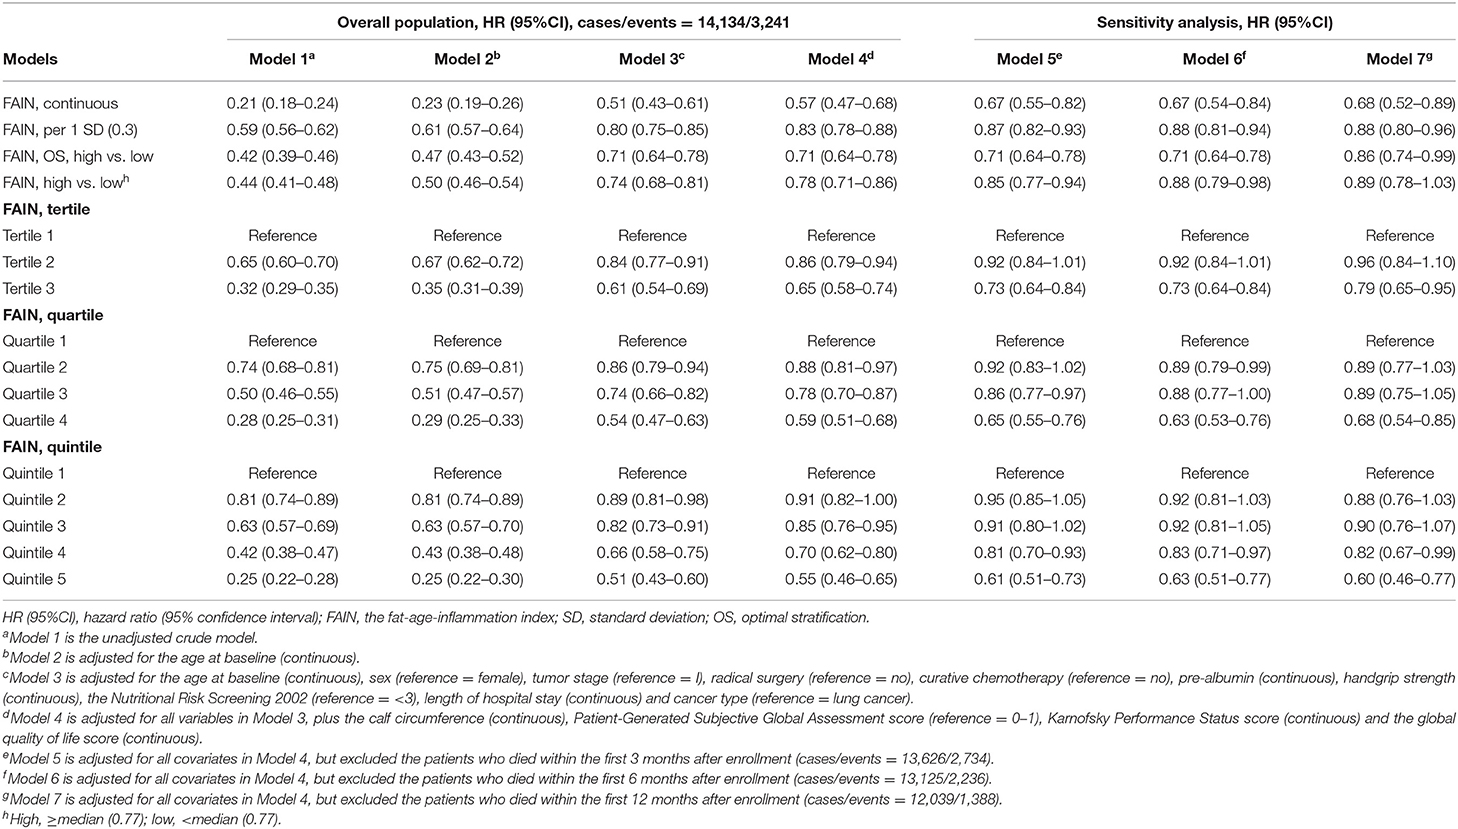
Table 3. Multivariable models for the FAIN and overall survival.
The results were also similar when the FAIN was analyzed as tertiles, quartiles or quintiles. Compared to those in the lowest tertile, patients in the highest tertile had a significantly reduced death hazard (Model 4, HR = 0.65, 95%CI = 0.58–0.74). Similar patterns were observed for the highest quartile (Model 4, HR = 0.59, 95%CI = 0.51–0.68, vs. the lowest quartile) and the highest quintile (Model 4, HR = 0.55, 95%CI = 0.46–0.65, vs. the lowest quintile). These associations were all sustained in the sensitivity analysis (Model 5–7) and tests for P of the trend showed that the positive associations between the FAIN and overall survival were all “dose-dependent” (all P for trend <0.001).
Interaction and Subgroup Analysis
All covariates were screened for potential interactive effects, and the patient sex, tumor stage, curative chemotherapy, prealbumin, cancer type, PG-SGA category, KPS score and global QOL score showed statistically significant interactions with the FAIN (all P < 0.05). The fully-adjusted models were then repeated in different variable strata to study the effect modifications (Table 4). The positive association between the FAIN and overall survival (HR = 0.57, 95%CI = 0.47–0.68, as continuous) was strengthened in female patients (HR = 0.40, 95%CI = 0.30–0.54), those with stage III tumors (HR = 0.49, 95%CI = 0.36–0.67), patients who did not receive curative chemotherapy (HR = 0.51, 95%CI = 0.41–0.64), the higher serum prealbumin group (HR = 0.52, 95%CI = 0.40–0.67), those with lung cancer (HR = 0.47, 95%CI = 0.34–0.66), colorectal cancer (HR = 0.39, 95%CI = 0.23–0.64) and other cancers (HR = 0.53, 95%CI = 0.38–0.73), those in PG-SGA category B (HR = 0.48, 95%CI = 0.38–0.63), with a higher KPS (HR = 0.52, 95%CI = 0.43–0.64) and in the higher global QOL group (HR = 0.39, 95%CI = 0.26–0.58). In contrast, this relationship was attenuated in male patients (HR = 0.70, 95%CI = 0.56–0.88), those with a lower tumor stage (stage I, HR = 0.86, 95%CI = 0.45–1.64; stage II, HR = 0.72, 95%CI = 0.46–1.13), patients who received curative chemotherapy (HR = 0.69, 95%CI = 0.49–0.98), the lower serum prealbumin group (HR = 0.63, 95%CI = 0.48–0.82), those with breast (HR = 0.90, 95%CI = 0.36–2.25) and gastric cancer (HR = 0.97, 95%CI = 0.71–1.34), patients in PG-SGA category A (HR = 0.59, 95%CI = 0.37–0.93) and C (HR = 0.83, 95%CI = 0.61–1.12), with a lower KPS (HR = 0.76, 95%CI = 0.45–1.29) and those in the lower global QOL group (HR = 0.63, 95%CI = 0.51–0.77).
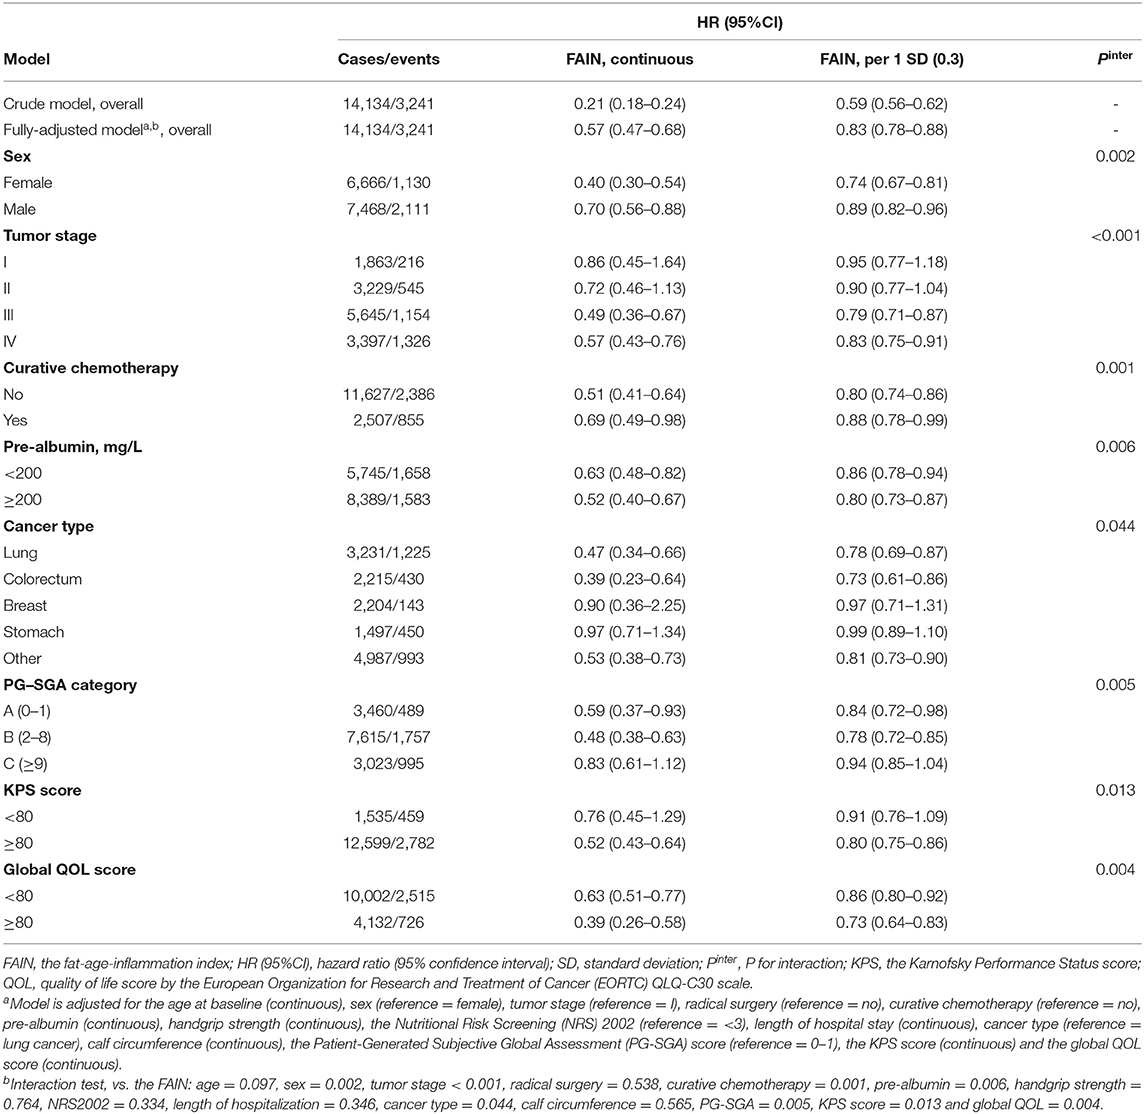
Table 4. Multivariable models stratified by factors showing interactive effects with the FAIN.
Independent Validation
The prognostic impact of the FAIN was further assessed in an independent multicenter lung cancer cohort (n = 227) which was not used for the derivation of the FAIN. The baseline characteristics of the validation cohort are shown in Supplementary Table 4. The Harrell's C-index of the FAIN in the validation cohort was 0.639 (95%CI = 0.586–0.691) which was higher than the NRI (C-index = 0.589, 95%CI = 0.535–0.643, P = 0.030), PNI (C-index = 0.591, 95%CI = 0.536–0.647, P = 0.031), CONUT (C-index = 0.572, 95%CI = 0.518–0.627, P < 0.001), NRS2002 (C-index = 0.554, 95%CI = 0.502–0.607, P = 0.003), and PG-SGA (C-index = 0.585, 95%CI = 0.535–0.634, P = 0.031). Consistent with the findings in the original dataset, a multivariable Cox regression analysis in the validation cohort also showed that the FAIN was independently associated with a reduced death hazard, both as a continuous variable (HR = 0.21, 95%CI = 0.06–0.76) and when assessed as per one standard deviation (HR = 0.70, 95%CI = 0.53–0.94, Supplementary Table 5).
Discussion
This was a large-scale, observational cohort study including 14,134 patients with 17 cancers at multiple centers in China. Based on a data-driven, outcome-oriented approach, we developed a new prognostic index, the FAIN, that integrates information on the inflammation and nutrition. To our knowledge, this is the first study to date that proposes such an index specially designed for oncology populations. We demonstrated that this index effectively reflects the nutritional status, physical performance and QOL of the patients, and is associated with the short-term clinical outcomes of patients. We also performed parallel comparisons that indicated that the FAIN index has better discrimination performance to predict cancer mortality than the existing NRI, PNI, CONUT, NRS2002 and PG-SGA systems in the study population. We revealed that the FAIN is independently associated with the death hazard. Importantly, the components used to create the FAIN index were simple to obtain, and the association between the FAIN and mortality is linear-like and robust to time. Additionally, we validated the performance of the FAIN in an independent lung cancer cohort. These findings suggest that the FAIN might act as a feasible, cost-effective option to monitor the nutritional status of patients and help develop intervention strategies to optimize the survival outcomes of cancer patients.
A distinct feature of the FAIN index is the inclusion of a fat mass assessment, which is not included in most existing scoring systems such as the NRI, PNI and CONUT. The PNI and CONUT only consist of serum laboratory indices, while the NRI also considers some anthropometric changes of patients (e.g., weight loss) (31). However, the weight loss parameter is often obtained based on patient-reported usual/historic weights, which is subject to recall bias that can cause instability when calculating the NRI. In contrast, the fat mass assessment (through measurement of the skinfold thickness) is a relatively objective parameter, which was included in the PG-SGA (27), a nutritional assessment tool dedicated to oncology patients which is currently recommended for use in China. A previous study conducted in a large Chinese oncology cohort also indicated that a low TSF was associated with poorer nutritional status and had greater prognostic impact on cancer mortality than other muscle parameters such as the CC and MAMC (40). A lower TSF was also associated with increased death hazard and actually enhanced the prognostic value of the GLIM-diagnosed malnutrition in lung cancer patients (20). Similarly, the positive association between a low TSF and mortality was also reported in patients with cancer cachexia (43) and in terminally ill cancer patients (44). These results are consistent with our observations in the present study and further support the inclusion of the TSF in the FAIN. Additionally, the inclusion of an objective measurement of body fat might partially explain the superior prognostic value of the FAIN compared to the other three scoring systems in cancer patients. However, the impact of the fat mass on cancer mortality can vary based on the cancer type (40). For example, higher adiposity was associated with higher all-cause and cancer-specific mortality in breast cancer patients (45). In the present study, the favorable impact of the FAIN on patient survival was also attenuated in breast cancer patients (Table 4), which might suggest that the FAIN would be of limited use in breast cancer patients. Intriguingly, a recent study conducted in a large dataset has shown that, paradoxically, in patients with HER2-positive advanced breast cancer, a higher BMI was independently associated with improved survival (46). Since we lack the data about HER2 expression in our patients, this possible link cannot be assessed in our study cohort, and future studies with gene test results are needed to clarify the role of the FAIN in greater detail among breast cancer patients. Another related concern is the potential impact of sex difference of TSF on the prognostic performance of the FAIN. To examine this, we calculated sex-specific FAIN thresholds (male < 0.69 or female < 0.82) based on the OS method to defined a low FAIN in an exploratory analysis. However, this leaded to a statistically significant reduction of the Harrell's C-index (0.592 vs. 0.601, P = 0.002) compared to the current threshold (<0.82) calculated for the overall study population. Therefore, pragmatically, we used the gender-neutral threshold 0.82 to maximize the prognostic value of the dichotomized FAIN in the present study. Nevertheless, the optimal approach to define a low FAIN should be re-evaluated when the FAIN index is used for non-prognostic purposes in future studies. In an exploratory analysis, we also calculated thresholds for the most prevalent lung cancer (value = 0.83) and colorectal cancer (value = 0.68) based on the OS method. However, limited to the study scope, future studies need to evaluate the prognostic value of these thresholds in specific cancer groups.
The definition of malnutrition is still not possible using a universally-accepted framework (11, 19, 26–28), largely due to the factors including the diversity of indices used for its identification, the different parameter thresholds, racial/disease-specific differences, complicated etiology and even the continuously evolving but inconsistent understanding of this issue (11, 19, 28). Of note, fat mass assessment was not included as a component in the recent GLIM criteria that were proposed for assessing malnutrition (11). However, depletion of the free fat mass is prevalent in cancer patients, especially among those undergoing chemotherapy/radiotherapy or having cancer cachexia (10), and has been correlated with impaired clinical outcomes (47, 48). A recent study conducted in a Chinese lung cancer population also indicated that adding the TSF can help assess nutritional status and enhance the prognostic value of GLIM-defined malnutrition (20). In support of that study, our present findings also suggest that fat mass assessment might be helpful during the assessment of cancer patients for malnutrition. However, since the present study did not consider the use and impact of nutritional intervention, future studies are still needed to explore whether inclusion of a fat mass assessment during the nutritional assessment would help guide the subsequent nutritional intervention in cancer patients.
There are several potential limitations of this study that must be noted. First, we used a data-driven approach to derive the FAIN index, so the associations between the FAIN and cancer mortality might not be generalizable to other populations. Future validation of the FAIN is needed in all types of cancer and in different populations with characteristics different from those of the group where it was developed before being put into routine clinical or research applications. Second, some the associations we observed in the multivariable survival analysis may be explained by reverse causality. However, we performed sensitivity analyses by excluding those patients who died within the first 3, 6, and 12 months, and the results were robust to time, which should help to reduce this probability. Third, unmeasured confounders are possible in all observational studies. However, we comprehensively collected the baseline characteristic of patients and adjusted the covariates based on both statistical and scientific approaches to minimize this possibility. Fourth, since Asian populations have anthropometric differences compared with their Western counterparties (12), the generalizability of the FAIN should be re-evaluated when applied in non-Asian oncology populations. Fifth, we proposed median value and outcome-oriented threshold that transformed the FAIN into a dichotomous variable (low vs. high). However, dichotomizing continuous variables can lead to an reduction of information (49). Although additional statistical approaches (by analyzing the FAIN as continuous, per standard deviation and percentiles) might provide additional insights, future assessment is still required to determine the optimal grouping algorithm/risk intervals of the FAIN to facilitate its clinical use. Sixth, although being inexpensive and simple, TSF was less accurate to measure body fat than those parameters obtained from more advanced technologies such as dual-energy X-ray absorptiometry. Future studies need to assess the certainty of the FAIN index in greater details. Eighth, we did not have data on other treatments (besides anticancer therapies) which might confound the associations we observed in the present study. Ninth, since not all of the continuous variables (such as the weight loss percentage) had normal distribution, we conservatively used non-parametric statistical approaches to test between-group differences despite the large sample size. Parametric method may have better performance for some normally-distributed continuous variables. Future studies need to address the above issues.
In conclusion, this study de novo created and assessed a prognostic index, the FAIN, that integrates information on the patient fat mass/nutrition, age and inflammation. This index effectively reflects the nutritional status, physical performance and QOL of oncology patients, and is associated with improved short-term clinical outcomes. The FAIN has better discrimination performance to predict cancer mortality than the existing NRI, PNI, CONUT, NRS2002, and PG-SGA systems. The impact of the FAIN on cancer mortality is linear-like, independent and robust to time. These findings suggest that the FAIN might act as a feasible, simple-to-obtain option to monitor the nutritional status and help develop intervention strategies to optimize the survival outcomes of cancer patients.
Data Availability Statement
The datasets generated and/or analyzed during the current study are not publicly available to protect patient confidentiality but are available from the corresponding author on reasonable request.
Ethics Statement
The studies involving human participants were reviewed and approved by the Ethics Committee of Daping Hospital. The patients/participants provided their written informed consent to participate in this study.
Author Contributions
LY, WL, HS, and HX designed the study. CS, JC, XinL, NL, YF, LZ, JL, FC, CW, TL, XiaL, LD, MYa, JY, XW, XingL, SY, ZZ, KY, MYu, MC, ZL, MW, QY, PJ, SL, and ZG recruited participants and collected data. LY conducted the study, analyzed the data, and drafted the manuscript. All authors read and approved the final manuscript.
Funding
This work was supported by the Chongqing Municipal Science Committee, Health Commission Joint Research Project (2019QNXM008, YF), the National Key Research and Development Program (2017YFC1309200, HS), and the Clinical Science Foundation of the Daping Hospital (2014YLC08, HX).
Conflict of Interest
The authors declare that the research was conducted in the absence of any commercial or financial relationships that could be construed as a potential conflict of interest.
Publisher's Note
All claims expressed in this article are solely those of the authors and do not necessarily represent those of their affiliated organizations, or those of the publisher, the editors and the reviewers. Any product that may be evaluated in this article, or claim that may be made by its manufacturer, is not guaranteed or endorsed by the publisher.
Acknowledgments
The authors would like to thank the INSCOC project members for their substantial work on data collection and patient follow-up.
Supplementary Material
The Supplementary Material for this article can be found online at: https://www.frontiersin.org/articles/10.3389/fnut.2022.860285/full#supplementary-material
Supplementary Figure 1. A flow chart of the patient inclusion.
Supplementary Table 1. Inclusion and exclusion criteria for the INSCOC project.
Supplementary Table 2. Approaches and instruments used to obtain the anthropometric information in the present study.
Supplementary Table 3. The different coefficients of each parameter in the fat-age-inflammation (FAIN) index and the corresponding C-index.
Supplementary Table 4. Baseline characteristics of the validation lung cancer cohort.
Supplementary Table 5. Multivariable models for the fat-age-inflammation (FAIN) index and overall survival in the validation cohort.
Abbreviations
FAIN, the fat-age-inflammation index; HR, hazard ratio; CI, confidence interval; QOL, quality of life; ESPEN, the European Society of Clinical Nutrition and Metabolism; NRS2002, the Nutritional Risk Screening 2002; PG-SGA, the Patient-Generated Subjective Global Assessment; GLIM, the Global Leadership Initiative on Malnutrition; NRI, the Nutritional Risk Index; CONUT, the Controlling Nutritional Status index; PNI, the Prognostic Nutritional Index; INSCOC, the Investigation on Nutrition Status and its Clinical Outcome of Common Cancers project of China; BMI, body mass index; MAC, mid-arm circumference; TSF, triceps skinfold thickness; HGS, hand grip strength; MAMC, mid-arm muscle circumference; CC, calf circumference; KPS, the Karnofsky Performance Status score; QLQ-C30, the European Organization for Research and Treatment of Cancer QLQ-C30 score; NLR, neutrophil to lymphocyte ratio; OS, optimal stratification; BIC, the Bayesian Information Criterion.
References
1. Sung H, Ferlay J, Siegel RL, Laversanne M, Soerjomataram I, Jemal A, et al. Global cancer statistics 2020: GLOBOCAN estimates of incidence and mortality worldwide for 36 cancers in 185 countries. CA Cancer J Clin. (2021) 71:209–49. doi: 10.3322/caac.21660
2. Chen YP, Liu X, Zhou Q, Yang KY, Jin F, Zhu XD, et al. Metronomic capecitabine as adjuvant therapy in locoregionally advanced nasopharyngeal carcinoma: a multicentre, open-label, parallel-group, randomised, controlled, phase 3 trial. Lancet. (2021) 398:303–13. doi: 10.1016/S0140-6736(21)01123-5
3. Wang L, Dai C, Jiang L, Tong G, Xiong Y, Khan K, et al. Advanced devices for tumor diagnosis and therapy. Small. (2021):e2100003. doi: 10.1002/smll.202100003
4. Chen W, Zheng R, Baade PD, Zhang S, Zeng H, Bray F, et al. Cancer statistics in China, 2015. CA Cancer J Clin. (2016) 66:115–32. doi: 10.3322/caac.21338
5. Arends J, Bachmann P, Baracos V, Barthelemy N, Bertz H, Bozzetti F, et al. ESPEN guidelines on nutrition in cancer patients. Clin Nutr. (2017) 36:11–48. doi: 10.1016/j.clnu.2016.07.015
6. Arends J, Baracos V, Bertz H, Bozzetti F, Calder PC, Deutz NEP, et al. ESPEN expert group recommendations for action against cancer-related malnutrition. Clin Nutr. (2017) 36:1187–96. doi: 10.1016/j.clnu.2017.06.017
7. Yin L, Lin X, Liu J, Li N, He X, Zhang M, et al. Classification tree-based machine learning to visualize and validate a decision tool for identifying malnutrition in cancer patients. JPEN J Parenter Enteral Nutr. (2021) 45:1736–48. doi: 10.1002/jpen.2070
8. Yin L, Lin X, Zhao Z, Li N, He X, Zhang M, et al. Is hand grip strength a necessary supportive index in the phenotypic criteria of the GLIM-based diagnosis of malnutrition in patients with cancer? Support Care Cancer. (2021) 29:4001–13. doi: 10.1007/s00520-020-05975-z
9. Ryan AM, Power DG, Daly L, Cushen SJ, Ni Bhuachalla E, Prado CM. Cancer-associated malnutrition, cachexia and sarcopenia: the skeleton in the hospital closet 40 years later. Proc Nutr Soc. (2016) 75:199–211. doi: 10.1017/S002966511500419X
10. Fearon K, Strasser F, Anker SD, Bosaeus I, Bruera E, Fainsinger RL, et al. Definition and classification of cancer cachexia: an international consensus. Lancet Oncol. (2011) 12:489–95. doi: 10.1016/S1470-2045(10)70218-7
11. Cederholm T, Jensen GL, Correia M, Gonzalez MC, Fukushima R, Higashiguchi T, et al. GLIM criteria for the diagnosis of malnutrition - A consensus report from the global clinical nutrition community. Clin Nutr. (2019) 38:1–9. doi: 10.1016/j.clnu.2018.08.002
12. Chen LK, Woo J, Assantachai P, Auyeung TW, Chou MY, Iijima K, et al. Asian working group for sarcopenia: 2019 consensus update on sarcopenia diagnosis and treatment. J Am Med Dir Assoc. (2020) 21:300–7 e2. doi: 10.1016/j.jamda.2019.12.012
13. Gupta D, Lis CG, Granick J, Grutsch JF, Vashi PG, Lammersfeld CA. Malnutrition was associated with poor quality of life in colorectal cancer: a retrospective analysis. J Clin Epidemiol. (2006) 59:704–9. doi: 10.1016/j.jclinepi.2005.08.020
14. Yin L, Liu J, Lin X, Li N, Shi M, Zhang H, et al. Development and validation of a rapid-decision pathway to diagnose malnutrition in patients with lung cancer. Nutrition. (2021) 84:111102. doi: 10.1016/j.nut.2020.111102
15. Yin L, Lin X, Li N, Zhang M, He X, Liu J, et al. Evaluation of the global leadership initiative on malnutrition criteria using different muscle mass indices for diagnosing malnutrition and predicting survival in lung cancer patients. JPEN J Parenter Enteral Nutr. (2021) 45:607–17. doi: 10.1002/jpen.1873
16. Preiser JC, Schneider SM. ESPEN disease-specific guideline framework. Clin Nutr. (2011) 30:549–52. doi: 10.1016/j.clnu.2011.07.006
17. Yin L, Cheng N, Chen P, Zhang M, Li N, Lin X, et al. Association of malnutrition, as defined by the PG-SGA, ESPEN 2015, and GLIM criteria, with complications in esophageal cancer patients after esophagectomy. Front Nutr. (2021) 8:632546. doi: 10.3389/fnut.2021.632546
18. Harada H, Yamashita Y, Misumi K, Tsubokawa N, Nakao J, Matsutani J, et al. Multidisciplinary team-based approach for comprehensive preoperative pulmonary rehabilitation including intensive nutritional support for lung cancer patients. PLoS ONE. (2013) 8:e59566. doi: 10.1371/journal.pone.0059566
19. Yin L, Song C, Cui J, Lin X, Li N, Fan Y, et al. A fusion decision system to identify and grade malnutrition in cancer patients: machine learning reveals feasible workflow from representative real-world data. Clin Nutr. (2021) 40:4958–70. doi: 10.1016/j.clnu.2021.06.028
20. Yin L, Fan Y, Lin X, Zhang L, Li N, Liu J, et al. Fat mass assessment using the triceps skinfold thickness enhances the prognostic value of the Global Leadership Initiative on Malnutrition criteria in patients with lung cancer. Br J Nutr. (2021). doi: 10.1017/S0007114521002531. [Epub ahead of print].
21. Pressoir M, Desne S, Berchery D, Rossignol G, Poiree B, Meslier M, et al. Prevalence, risk factors and clinical implications of malnutrition in French Comprehensive Cancer Centres. Br J Cancer. (2010) 102:966–71. doi: 10.1038/sj.bjc.6605578
22. Wie GA, Cho YA, Kim SY, Kim SM, Bae JM, Joung H. Prevalence and risk factors of malnutrition among cancer patients according to tumor location and stage in the National Cancer Center in Korea. Nutrition. (2010) 26:263–8. doi: 10.1016/j.nut.2009.04.013
23. Gyan E, Raynard B, Durand JP, Lacau Saint Guily J, Gouy S, Movschin ML, et al. Malnutrition in patients with cancer: comparison of perceptions by patients, relatives, and physicians-results of the NutriCancer2012 study. JPEN J Parenter Enteral Nutr. (2018) 42:255–60. doi: 10.1177/0148607116688881
24. Attar A, Malka D, Sabate JM, Bonnetain F, Lecomte T, Aparicio T, et al. Malnutrition is high and underestimated during chemotherapy in gastrointestinal cancer: an AGEO prospective cross-sectional multicenter study. Nutr Cancer. (2012) 64:535–42. doi: 10.1080/01635581.2012.670743
25. Hebuterne X, Lemarie E, Michallet M, de Montreuil CB, Schneider SM, Goldwasser F. Prevalence of malnutrition and current use of nutrition support in patients with cancer. JPEN J Parenter Enteral Nutr. (2014) 38:196–204. doi: 10.1177/0148607113502674
26. Kondrup J, Allison SP, Elia M, Vellas B, Plauth M, Educational, et al. ESPEN guidelines for nutrition screening 2002. Clin Nutr. (2003) 22:415–21. doi: 10.1016/S0261-5614(03)00098-0
27. Ottery FD. Rethinking nutritional support of the cancer patient: the new field of nutritional oncology. Semin Oncol. (1994) 21:770–8.
28. Yin L, Liu J, Lin X, Li N, Guo J, Fan Y, et al. Nutritional features-based clustering analysis as a feasible approach for early identification of malnutrition in patients with cancer. Eur J Clin Nutr. (2021) 75:1291–301. doi: 10.1038/s41430-020-00844-8
29. Veterans Affairs Total Parenteral Nutrition Cooperative Study Group. Perioperative total parenteral nutrition in surgical patients. N Engl J Med. (1991) 325:525–32. doi: 10.1056/NEJM199108223250801
30. Ignacio de Ulibarri J, Gonzalez-Madrono A, de Villar NG, Gonzalez P, Gonzalez B, Mancha A, et al. CONUT: a tool for controlling nutritional status. First validation in a hospital population. Nutr Hosp. (2005) 20:38–45.
31. Wang A, He Z, Cong P, Qu Y, Hu T, Cai Y, et al. Controlling Nutritional Status (CONUT) score as a new indicator of prognosis in patients with hilar cholangiocarcinoma is superior to NLR and PNI: a single-center retrospective study. Front Oncol. (2020) 10:593452. doi: 10.3389/fonc.2020.593452
32. Wang J, Liu Y, Mi X, Shao M, Liu L. The prognostic value of prognostic nutritional index (PNI) and neutrophil to lymphocyte ratio (NLR) for advanced non-small cell lung cancer treated with platinum-based chemotherapeutics. Ann Palliat Med. (2020) 9:967–78. doi: 10.21037/apm.2020.04.31
33. Mao YS, Hao SJ, Zou CF, Xie ZB, Fu DL. Controlling nutritional status score is superior to prognostic nutritional index score in predicting survival and complications in pancreatic ductal adenocarcinoma: a Chinese propensity score matching study. Br J Nutr. (2020) 124:1190–7. doi: 10.1017/S0007114520002299
34. Christensen JF, Jones LW, Andersen JL, Daugaard G, Rorth M, Hojman P. Muscle dysfunction in cancer patients. Ann Oncol. (2014) 25:947–58. doi: 10.1093/annonc/mdt551
35. Stene GB, Balstad TR, Leer ASM, Bye A, Kaasa S, Fallon M, et al. Deterioration in muscle mass and physical function differs according to weight loss history in cancer cachexia. Cancers. (2019) 11:1925. doi: 10.3390/cancers11121925
36. Xu H, Song C, Wang C, Fu Z, Guo Z, Lin Y, et al. Investigation on nutrition status and clinical outcome of patients with common cancers in Chinese patients: a multicenter prospective study protocol. Int J Clin Trials. (2020) 7:94–102. doi: 10.18203/2349-3259.ijct20201052
37. Murri R, Scoppettuolo G, Damiano F, Ammassari A, Fantoni M, Antinori A. Karnofsky performance status and assessment of global health status. J Acquir Immune Defic Syndr Hum Retrovirol. (1996) 13:294–5. doi: 10.1097/00042560-199611010-00013
38. Wan C, Meng Q, Yang Z, Tu X, Feng C, Tang X, et al. Validation of the simplified Chinese version of EORTC QLQ-C30 from the measurements of five types of inpatients with cancer. Ann Oncol. (2008) 19:2053–60. doi: 10.1093/annonc/mdn417
39. Chen C Lu FC Department Department of Disease Control Ministry of Health PRC. The guidelines for prevention and control of overweight and obesity in Chinese adults. Biomed Environ Sci. (2004) 17:1–36.
40. Yin L, Zhang L, Li N, Guo J, Liu L, Lin X, et al. Several anthropometric measurements and cancer mortality: predictor screening, threshold determination, and joint analysis in a multicenter cohort of 12138 adults. Eur J Clin Nutr. (2021). doi: 10.1038/s41430-021-01009-x. [Epub ahead of print].
41. Evans DC, Corkins MR, Malone A, Miller S, Mogensen KM, Guenter P, et al. The use of visceral proteins as nutrition markers: an ASPEN position paper. Nutr Clin Pract. (2021) 36:22–8. doi: 10.1002/ncp.10588
42. Yin L, Zhang L, Li N, Guo J, Liu L, Lin X, et al. Comparison of the AWGS and optimal stratification-defined handgrip strength thresholds for predicting survival in patients with lung cancer. Nutrition. (2021) 90:111258. doi: 10.1016/j.nut.2021.111258
43. Ge YZ, Ruan GT, Zhang KP, Tang M, Zhang Q, Zhang X, et al. Which anthropometric measurement is better for predicting survival of patients with cancer cachexia? Br J Nutr. (2021). doi: 10.1017/S0007114521002853. [Epub ahead of print].
44. Ho SY, Guo HR, Chen HH, Peng CJ. Nutritional predictors of survival in terminally ill cancer patients. J Formos Med Assoc. (2003) 102:544–50.
45. Bandera EV, Qin B, Lin Y, Zeinomar N, Xu B, Chanumolu D, et al. Association of body mass index, central obesity, and body composition with mortality among black breast cancer survivors. JAMA Oncol. (2021) 7:1–10. doi: 10.1001/jamaoncol.2021.1499
46. Modi ND, Tan JQE, Rowland A, Koczwara B, Abuhelwa AY, Kichenadasse G, et al. The obesity paradox in early and advanced HER2 positive breast cancer: pooled analysis of clinical trial data. NPJ Breast Cancer. (2021) 7:30. doi: 10.1038/s41523-021-00241-9
47. Ferrao B, Neves PM, Santos T, Capelas ML, Makitie A, Ravasco P. Body composition changes in patients with head and neck cancer under active treatment: a scoping review. Support Care Cancer. (2020) 28:4613–25. doi: 10.1007/s00520-020-05487-w
48. Pinto AC, Sousa AS, Amaral TF, Guerra RS. Association between anthropometric indicators of nutrition status and length of hospital stay in hospitalized patients. JPEN J Parenter Enteral Nutr. (2020) 45:381–93. doi: 10.1002/jpen.1844
Keywords: cancer, malnutrition, mortality, fat mass, inflammation
Citation: Yin L, Song C, Cui J, Lin X, Li N, Fan Y, Zhang L, Liu J, Chong F, Wang C, Liang T, Liu X, Deng L, Yang M, Yu J, Wang X, Liu X, Yang S, Zuo Z, Yuan K, Yu M, Cong M, Li Z, Weng M, Yao Q, Jia P, Li S, Guo Z, Li W, Shi H and Xu H (2022) De novo Creation and Assessment of a Prognostic Fat-Age-Inflammation Index “FAIN” in Patients With Cancer: A Multicenter Cohort Study. Front. Nutr. 9:860285. doi: 10.3389/fnut.2022.860285
Received: 22 January 2022; Accepted: 14 March 2022;
Published: 13 April 2022.
Edited by:
Refaat Hegazi, Abbott, United StatesReviewed by:
Humberto Astiazaran-Garcia, Consejo Nacional de Ciencia y Tecnología (CONACYT), MexicoMingwei Zhu, Beijing Hospital, China
Copyright © 2022 Yin, Song, Cui, Lin, Li, Fan, Zhang, Liu, Chong, Wang, Liang, Liu, Deng, Yang, Yu, Wang, Liu, Yang, Zuo, Yuan, Yu, Cong, Li, Weng, Yao, Jia, Li, Guo, Li, Shi and Xu. This is an open-access article distributed under the terms of the Creative Commons Attribution License (CC BY). The use, distribution or reproduction in other forums is permitted, provided the original author(s) and the copyright owner(s) are credited and that the original publication in this journal is cited, in accordance with accepted academic practice. No use, distribution or reproduction is permitted which does not comply with these terms.
*Correspondence: Wei Li, liwei66@jlu.edu.cn; Hanping Shi, shihp@ccmu.edu.cn; Hongxia Xu, hx_xu2015@163.com