 Rong Wang
 Kuan Liu
 Xue-Jie Zhang1
 Wen-Li Chen
 Xiao-Jian Qu
 Shou-Jin Fan
- 1Shandong Provincial Key Laboratory of Plant Stress Research, College of Life Science, Shandong Normal University, Jinan, China
- 2State Key Laboratory of Systematic and Evolutionary Botany, Institute of Botany, Chinese Academy of Sciences, Beijing, China
Cleistogenes (Orininae, Cynodonteae, Chloridoideae, Poaceae) is an ecologically important genus. The phylogenetic placement of Cleistogenes and phylogenetic relationships among Cleistogenes taxa remain controversial for a long time. To resolve the intra- and inter-generic relationships of Cleistogenes, the plastomes of 12 Cleistogenes taxa (including 8 species and 4 varieties), one Orinus species, 15 Triodia species, two Tripogon species, and two Aeluropus species were included in the present study. All the taxa showed a similar pattern in plastome structure, gene order, gene content, and IR boundaries. The number of simple sequence repeats ranged from 145 (O. kokonorica) to 161 (T. plurinervata and T. schinzii). Moreover, 1,687 repeats were identified in these taxa, including 1,012 forward, 650 palindromic, 24 reverse, and one complement. Codon usage analysis revealed that these plastomes contained 16,633 (T. stipoides) to 16,678 (T. tomentosa) codons. Sequence divergence analysis among Cleistogenes and closely related genera identified five non-coding regions (trnS-UGA-psbZ, rpl32-trnL-UAG, trnQ-UUG-psbK, trnD-GUC-psbM, trnT-GGU-trnE-UUC). Phylogenetic analysis of complete plastomes indicated that Cleistogenes is sister to a clade composed of Orinus and Triodia, whereas it did not support the sister relationship between the recently proposed subtribe Orininae (Cleistogenes and Orinus) and Triodia. The subtribe Orininae was not supported by our complete plastome data. The split between Cleistogenes and Orinus-Triodia clade go back to 14.01 Ma. Besides, our findings suggested that C. squarrosa and C. songorica are the successive early diverging groups in the phylogenetic analysis. The other 10 taxa are divided into two groups: a monophyletic group composed of Cleistogenes sp. nov. and C. caespitosa var. ramosa is sister to other eight Cleistogenes taxa. Cleistogenes was estimated to have experienced rapid divergence within a short period, which could be a major obstacle in resolving phylogenetic relationships within Cleistogenes. Collectively, our results provided valuable insights into the phylogenetic study of grass species.
Introduction
As an ecologically important genus in the grass family (Poaceae) (Liang et al., 2002; Wang et al., 2003), Cleistogenes is composed of about 13 species, which are mainly distributed in South Europe to Turkey and eastward through central Asia, China, Pakistan, Northwest India, and Japan (Chen, 1990; Chen et al., 2006; Clayton et al., 2006). A large proportion of such species are found in semi-arid regions, where they are excellent forage grass and sand-binding grass (Shan et al., 2010; Shi, 2011; Tao et al., 2017). It is well documented that Cleistogenes has the C4 photosynthetic pathway and can adapt to a dry environment (Redmann et al., 1995; Su et al., 2011). Two Cleistogenes species including C. squarrosa and C. songorica are commonly used as plant materials to study grass competition and drought stress (Gao et al., 2005; Niu and Nan, 2017). This genus is remarkable for the cleistogamous spikelets, which often exist in the leaf sheaths to ensure the seed production even under severe conditions. These cleistogamous spikelets usually have fewer florets, which are smaller and narrower lemmas with longer awns compared with the chasmogamous spikelets (Chen et al., 2006).
Several phylogenetic studies have studied Cleistogenes and its closely related genera, while the inter-generic relationships remain uncertain. Cleistogenes is either classified within Eragrostideae or Cynodonteae based on morphological characters in traditional classification (Tutin and Al, 1980; Tzvelev, 1989; Chen, 1990; Chen et al., 2006). These two tribes are belonging to the subfamily Chloridoideae. Cleistogenes has been suggested to be within Cynodonteae in molecular phylogenetic analyses (Peterson et al., 2010; Soreng et al., 2015, 2017). Cleistogenes is considered as an incertae sedis genus due to its different placement in ITS, plastid, and combined trees (Peterson et al., 2010; Soreng et al., 2015). Recent studies show that Aeluropodinae (Aeluropus and Odyssea), Triodiinae (Triodia), and Orininae (Cleistogenes and Orinus) form a monophyletic clade (Peterson et al., 2017; Soreng et al., 2017), while the relationships among them are incongruence. Cleistogenes is sister to Orinus in an ITS tree, and in a combined tree (Peterson et al., 2010, 2016). The clade composed of Cleistogenes and Orinus is sister to the clade consisting of Aeluropodinae and Triodiinae in the ITS tree (Peterson et al., 2010) and a successive sister to Aeluropodinae and Triodiinae in the combined tree (Peterson et al., 2016). Cleistogenes and Orinus are difficult to seperate morphologically, and Orinus kokonorica was once described as a Cleistogenes species (Hao, 1938). Cleistogamous spikelets are morphological characters used to distinguish Cleistogenes from Orinus (Chen, 1990; Chen et al., 2006). Based on these studies, Peterson et al. (2016) have proposed a new subtribe Orininae, including Cleistogenes and Orinus. However, inter-generic relationships of Cleistogenes and closely related genera remain poorly resolved in the plastid tree (Peterson et al., 2010). The phylogenetic relationships among Cleistogenes and closely related genera are controversial. Moreover, the sister relationship between Cleistogenes and Orinus was merely moderately supported. Poor phylogenetic resolution is likely due to the lack of informative sites in the selected molecular markers, which appears to be a common problem in multi-locus phylogenetic studies. A robust phylogenetic tree between Cleistogenes and closely related genera was urgently need to understand their phylogenetic relationships among Cleistogenes and closely related genera.
Only very few studies have studied the intra-generic relationships of Cleistogenes. Species delimitation is explored using morphological characters. Cleistogenes was previously considered to be invalid because the name is coincident with a technical term. Kengia was originally published to replace Cleistogenes Keng (Packer, 1960). However, Art. 20.2 of the Vienna Code retroactively permits the formation of names based on non-Latin terms, and, thereby, validates Cleistogenes and retroactively makes Kengia illegitimate and superfluous. Yu and Zhao (2005) have suggested that there are 18 species and eight varieties of Kengia in China. In Flora of China, there are 10 species and a variety, including C. squarrosa, C. songorica, C. ramiflora, C. mucronate, C. festucacea, C. caespitosa var. caespitosa, C. kitagawae, C. polyphylla, C. hackelii var. hackelii, C. hancei, and C. hackelii var. nakaii (Chen et al., 2006). Moreover, 13 records have been accepted in the plant list1, including C. caespitosa var. caespitosa, C. festucacea, C. gatacrei, C. hackelii var. hackelii, C. hancei, C. kitagawae, C. mucronate, C. nedoluzhkoi, C. polyphylla, C. ramiflora, C. serotine, C. songorica, and C. squarrosa. Two species including C. songorica and C. polyphylla have been shown as successive early diverging groups based on seven plastid regions and ITS regions, while the relationships among the remaining taxa remain largely unexplored (Peterson et al., 2016). Therefore, more evidence is required to clarify intrageneric relationships of Cleistogenes.
As an important organelle in plant cells, chloroplast participates in many biological processes (Leister, 2003; Lancien et al., 2006; Leister and Kleine, 2008). Chloroplast genome (plastome) of angiosperm usually has a typical quadripartite structure with two inverted repeat (IR) regions separated by a large single-copy (LSC) region and a small single-copy (SSC) region (Jansen and Ruhlman, 2012). Plastomes usually contain 110–130 genes, including ∼80 protein-coding genes (PCGs), ∼30 transfer RNA (tRNAs) genes, and four ribosomal RNA (rRNA) genes (Guisinger et al., 2010). Although plastomes are conserved in grass species, they exhibit different levels of sequence divergence in different regions of plastomes, such as IR regions, PCGs, and intergenic regions. Plastome sequences can offer valuable insights into phylogenetic relationships in plants (Dong et al., 2012; Curci et al., 2016). They have been increasingly adopted in phylogenetic studies of Poaceae species due to the rapid development of next-generation sequencing technology (Saarela and Graham, 2010; Burke et al., 2016; Duvall et al., 2016, 2020; Guo et al., 2019; Orton et al., 2019; Liu et al., 2020; Welker et al., 2020; Hardion et al., 2021). Plastomes have been used to study phylogenetic relationships within Eragrostis and Triodia of Chloridoideae (Anderson et al., 2019; Somaratne et al., 2019). Relationships among tribes and some genera of chloridoid grasses have been clarified based on the complete plastome (Duvall et al., 2016).
In the present work, we aimed to: (1) explore the plastomes of Cleistogenes and its closely related genera; (2) determine the phylogenetic placement of Cleistogenes within Ael-Cle-Ori-Trio clade (Aeluropus, Cleistogenes, Orinus, and Triodia); and (3) study the intrageneric relationships of Cleistogenes. A total of 15 plastomes were sequenced and assembled, including 12 Cleistogenes taxa (including 8 species and 4 varieties), two Tripogon species, and one Aeluropus species. Collectively, we, for the first time, comprehensively analyzed Cleistogenes plastomes.
Materials and Methods
Taxon Sampling, DNA Extraction, and Sequencing
In the present study, 32 plastomes representing 32 taxa were included in the phylogenetic analysis. Among them, 15 taxa including two outgroup taxa (Tripogon bromoides and T. chinensis) were newly sequenced, and the other 17 taxa were downloaded from GenBank [Aeluropus lagopoides (NC_042858), Orinus kokonorica (NC_042859), Triodia basedowii (NC_042860), T. chichesterensis (NC_042861), T. concinna (NC_042862), T. glabra (NC_042863), T. lanigera (NC_042872), T. longiceps (NC_042864), T. mallota (NC_042865), T. plurinervata (NC_042866), T. rigidissima (NC_042867), T. schinzii (NC_042870), T. scintillans (NC_042871), T. stipoides (NC_037157), T. tomentosa (NC_042868), T. vanleeuwenii (NC_042869), T. wiseana (NC_037161)]. Fresh leaves of these 15 taxa were collected in the field, followed by the drying process with silica gel. Voucher specimens and silica-dried leaves were stored at the College of Life Sciences, Shandong Normal University (SDNU), Jinan, China. Table 1 lists the sampling locality and GenBank accession numbers of these taxa. Total genome DNA was extracted using a modified CTAB method (Doyle and Doyle, 1987). The isolated DNA was subjected to agarose gel electrophoresis to assess the DNA quality. The concentration of total DNA was determined using a NanoDrop 2000 spectrophotometer (Thermo Scientific, Wilmington, DE, United States). A final DNA concentration of >30 ng/μL was selected for library preparation. Sequencing library was generated using NEB Next® UltraTM DNA Library Prep Kit (Illumina, NEB, United States). Genomic DNA were fragmented by sonication to a size of 350 bp. Then DNA fragments were end-polished, A-tailed, and ligated with the full-length adapter for Illumina sequencing, followed by further PCR amplification. DNA libraries were sequenced through the Illumina NovaSeq 6000 platform and 150 bp paired-end reads were generated at Novogene (Beijing, China).
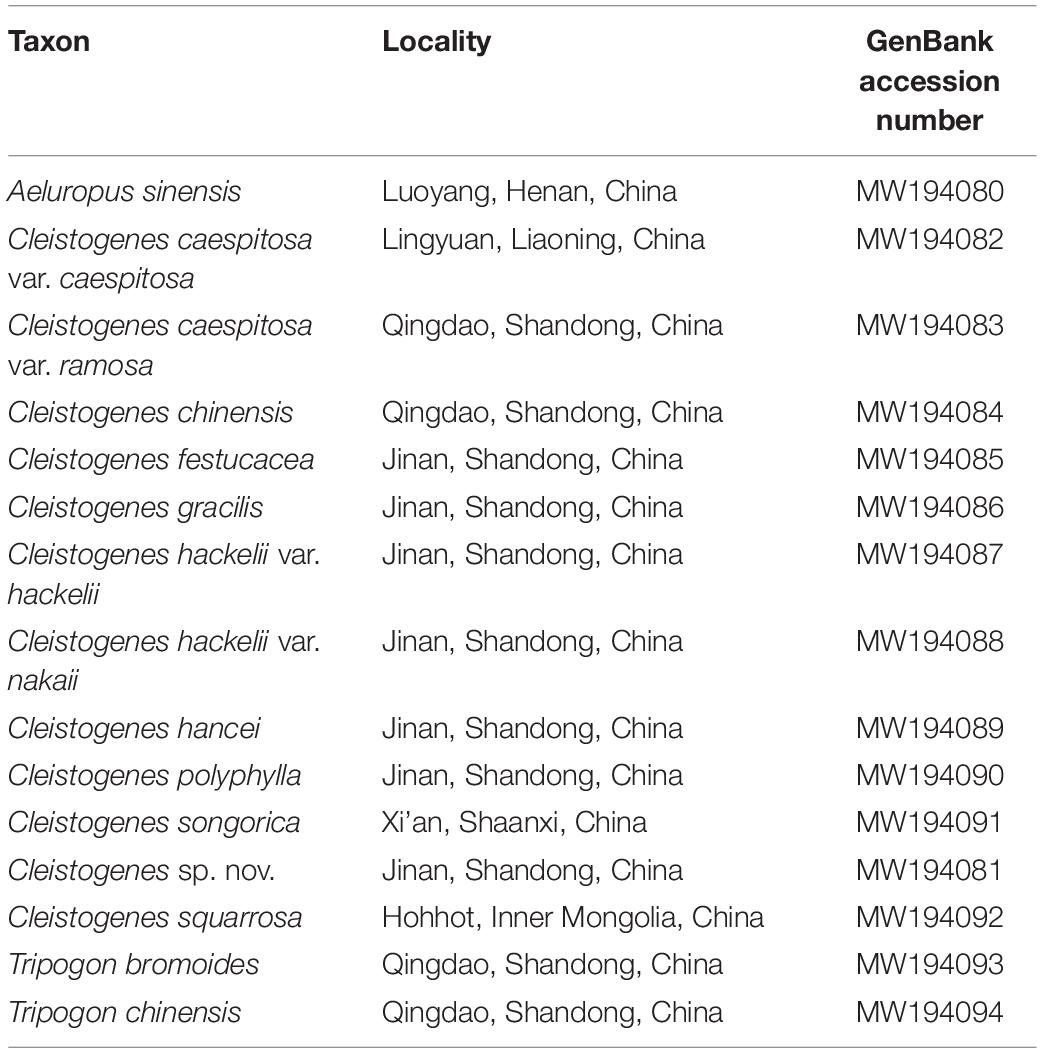
Table 1. The information of the sequenced taxa in the present study.
Plastome Assembly and Annotation
After sequencing data were obtained, plastomes were assembled as described in Qu et al. (2019a). Both the Organelle Genome Assembler (OGA) pipeline and Spades v3.13.0 (Bankevich et al., 2012) were used in plastome assembly. The latter one was with the “careful”-option and k-mers of 61, 81, 101, and 121. Annotation was carried out using PGA (Qu et al., 2019b). A manual correction was conducted using Geneious v9.1.4. Plastome sequences downloaded from the NCBI database were re-annotated using PGA, followed by manual correction. The circular maps for newly sequenced plastomes were generated using the OGDRAW tool (Stephan et al., 2019).
Repeat Sequence Analysis
MISA was adopted to detect the simple sequence repeats (SSRs) of 32 taxa (Beier et al., 2017), and the thresholds of 8, 4, 4, 3, 3, and 3 repeat units were set for mono-, di-, tri-, tetra-, penta-, and hexa-nucleotides, respectively (Vieira et al., 2016). REPuter2 was used to identify palindromic, direct, reverse, and complement repeats, with a hamming distance set to 3, a minimum repeat size set to 30 bp, and a sequence identity set to >90% (Kurtz et al., 2001).
Codon Usage Analysis
Referring to the unequal use of synonymous codons in an organism, codon usage can be used to determine the gene expression level, etc. Codon usage analysis of 32 taxa was performed on PCGs. The PCGs shorter than 300 bp were removed to avoid sampling bias (Wright, 1990; Rosenberg et al., 2003). The frequency of the nucleotides G + C at the third position (GC3s), the frequency of each base A, T, G, and C at the third position of codons (A3s, T3s, G3s, and C3s), the relative values of synonymous codon usage (RSCU) and GC content were determined using CodonW v1.4.23. RSCU is a simple measure of non-uniform usage of synonymous codons in a coding sequence. If RSCU value of a codon >1, that codon is frequently used than expected whereas RSCU value < 1, means that the codon is less frequently used than expected. If RSCU equals 1, it means that the codon is used randomly and equally with other synonymous codons (Sharp et al., 1986).
Sequence Divergence Analysis
Both the PCGs and non-coding regions (NCRs) longer than 200 bp were aligned using MAFFT v7.313 (Katoh and Standley, 2013). Variable sites and parsimony-informative (parsim-info) sites were calculated using Mega v7.0 (Sudhir et al., 2016). Whole plastome comparison of 12 Cleistogenes taxa (including 8 species and 4 varieties), two Aeluropus species, 15 Triodia species, two Tripogon species, and one Orinus species was performed by mVISTA (Frazer et al., 2004) using A. lagopoides as the reference.
Phylogenetic Analysis and Divergence Time Estimations
One copy of IR was removed before the phylogenetic analysis. All 32 taxa were used for phylogenetic analyses of complete plastomes, PCGs, and NCRs. Sequences were aligned using MAFFT v7.313 (Katoh and Standley, 2013). The maximum likelihood (ML) tree was constructed using RAxML v8.2.10 (Alexandros, 2014) with 1,000 bootstrap replicates and the GTR + I + G model. The best model of evolution was determined using jModelTest2 (Darriba et al., 2012). The Bayesian inference (BI) tree was constructed using MrBayes v3.2.6 with The Markov Chain Monte Carlo (MCMC) was run for 1,000,000 steps with a random starting tree, birth–death default priors, and sampled one tree every 1,000 steps. We discarded the first 25% steps as burn-in. A relaxed clock method and penalized likelihood were involved in dating analyses using treePL (Sanderson, 2002; Smith and O’Meara, 2012). We generated 1,000 ML bootstrap trees with branch lengths by using RAxML. The minimum age of the Tripogon crown node was constrained at 20 Ma (Anderson et al., 2019). The maximum age of Aeluropus, Cleistogenes, Orinus, Triodia, and Tripogon crown node was assigned as 25 million years ago (Ma) (Anderson et al., 2019). The minimum age of Aeluropus, Cleistogenes, Orinus, Triodia, and Tripogon crown was assigned as 7.9 Ma (Anderson et al., 2019). The minimum and maximum age for the internal nodes were calculated from dating 1,000 bootstrap trees by using treePL and TreeAnnotator v1.8.495 (Drummond et al., 2012).
Results
Characteristics of Ael-Cle-Ori-Trio Clade Plastomes
The size of the 12 Cleistogenes plastomes ranged from 134,233 bp (C. caespitosa var. ramosa) to 134,654 bp (C. caespitosa var. caespitosa). All of them had a typical circular quadripartite structure as most angiosperms, consisting of an LSC region (80,003–80,430 bp), an SSC region (12,648–12,671 bp), and a pair of IR regions (20,780–20,782 bp) (Figure 1 and Table 2). The GC content of these plastomes was 38.4%. The values of total genes, total PCGs, total tRNA, total rRNA, unique genes, and unique PCGs are the same for all taxa analyzed. A total of 132 genes (111 unique) were annotated, including 86 PCGs (77 unique), 38 tRNA genes (30 unique), and eight rRNA genes (four unique). These above-mentioned genes were in the same order and could be assigned into four groups as follows: photosynthesis-related genes, self-replication-related genes, other genes, and functionally unknown genes (Supplementary Table 1). Moreover, 10 PCGs had introns (atpF, ndhA, ndhB, petB, petD, rpl2, rpl16, rps12, rps16, and ycf3), two (rps12 and ycf3) of them had two introns, and the other eight genes had a single intron. The rps12 was a trans-spliced gene, with the 5′-end exon located in the LSC region, while its 3′-end exon and intron were duplicated and located in the IR regions. Seven PCGs (rps19, rpl2, rpl23, ycf2, ndhB, rps7, and rps15), eight tRNA genes (trnH-GUG, trnI-CAU, trnL-CAA, trnV-GAC, trnI-GAU, trnA-UGC, trnR-ACG, and trnN-GUU) and four rRNA genes (rrn16, rrn23, rrn4.5, and rrn5) were duplicated in the IR regions.
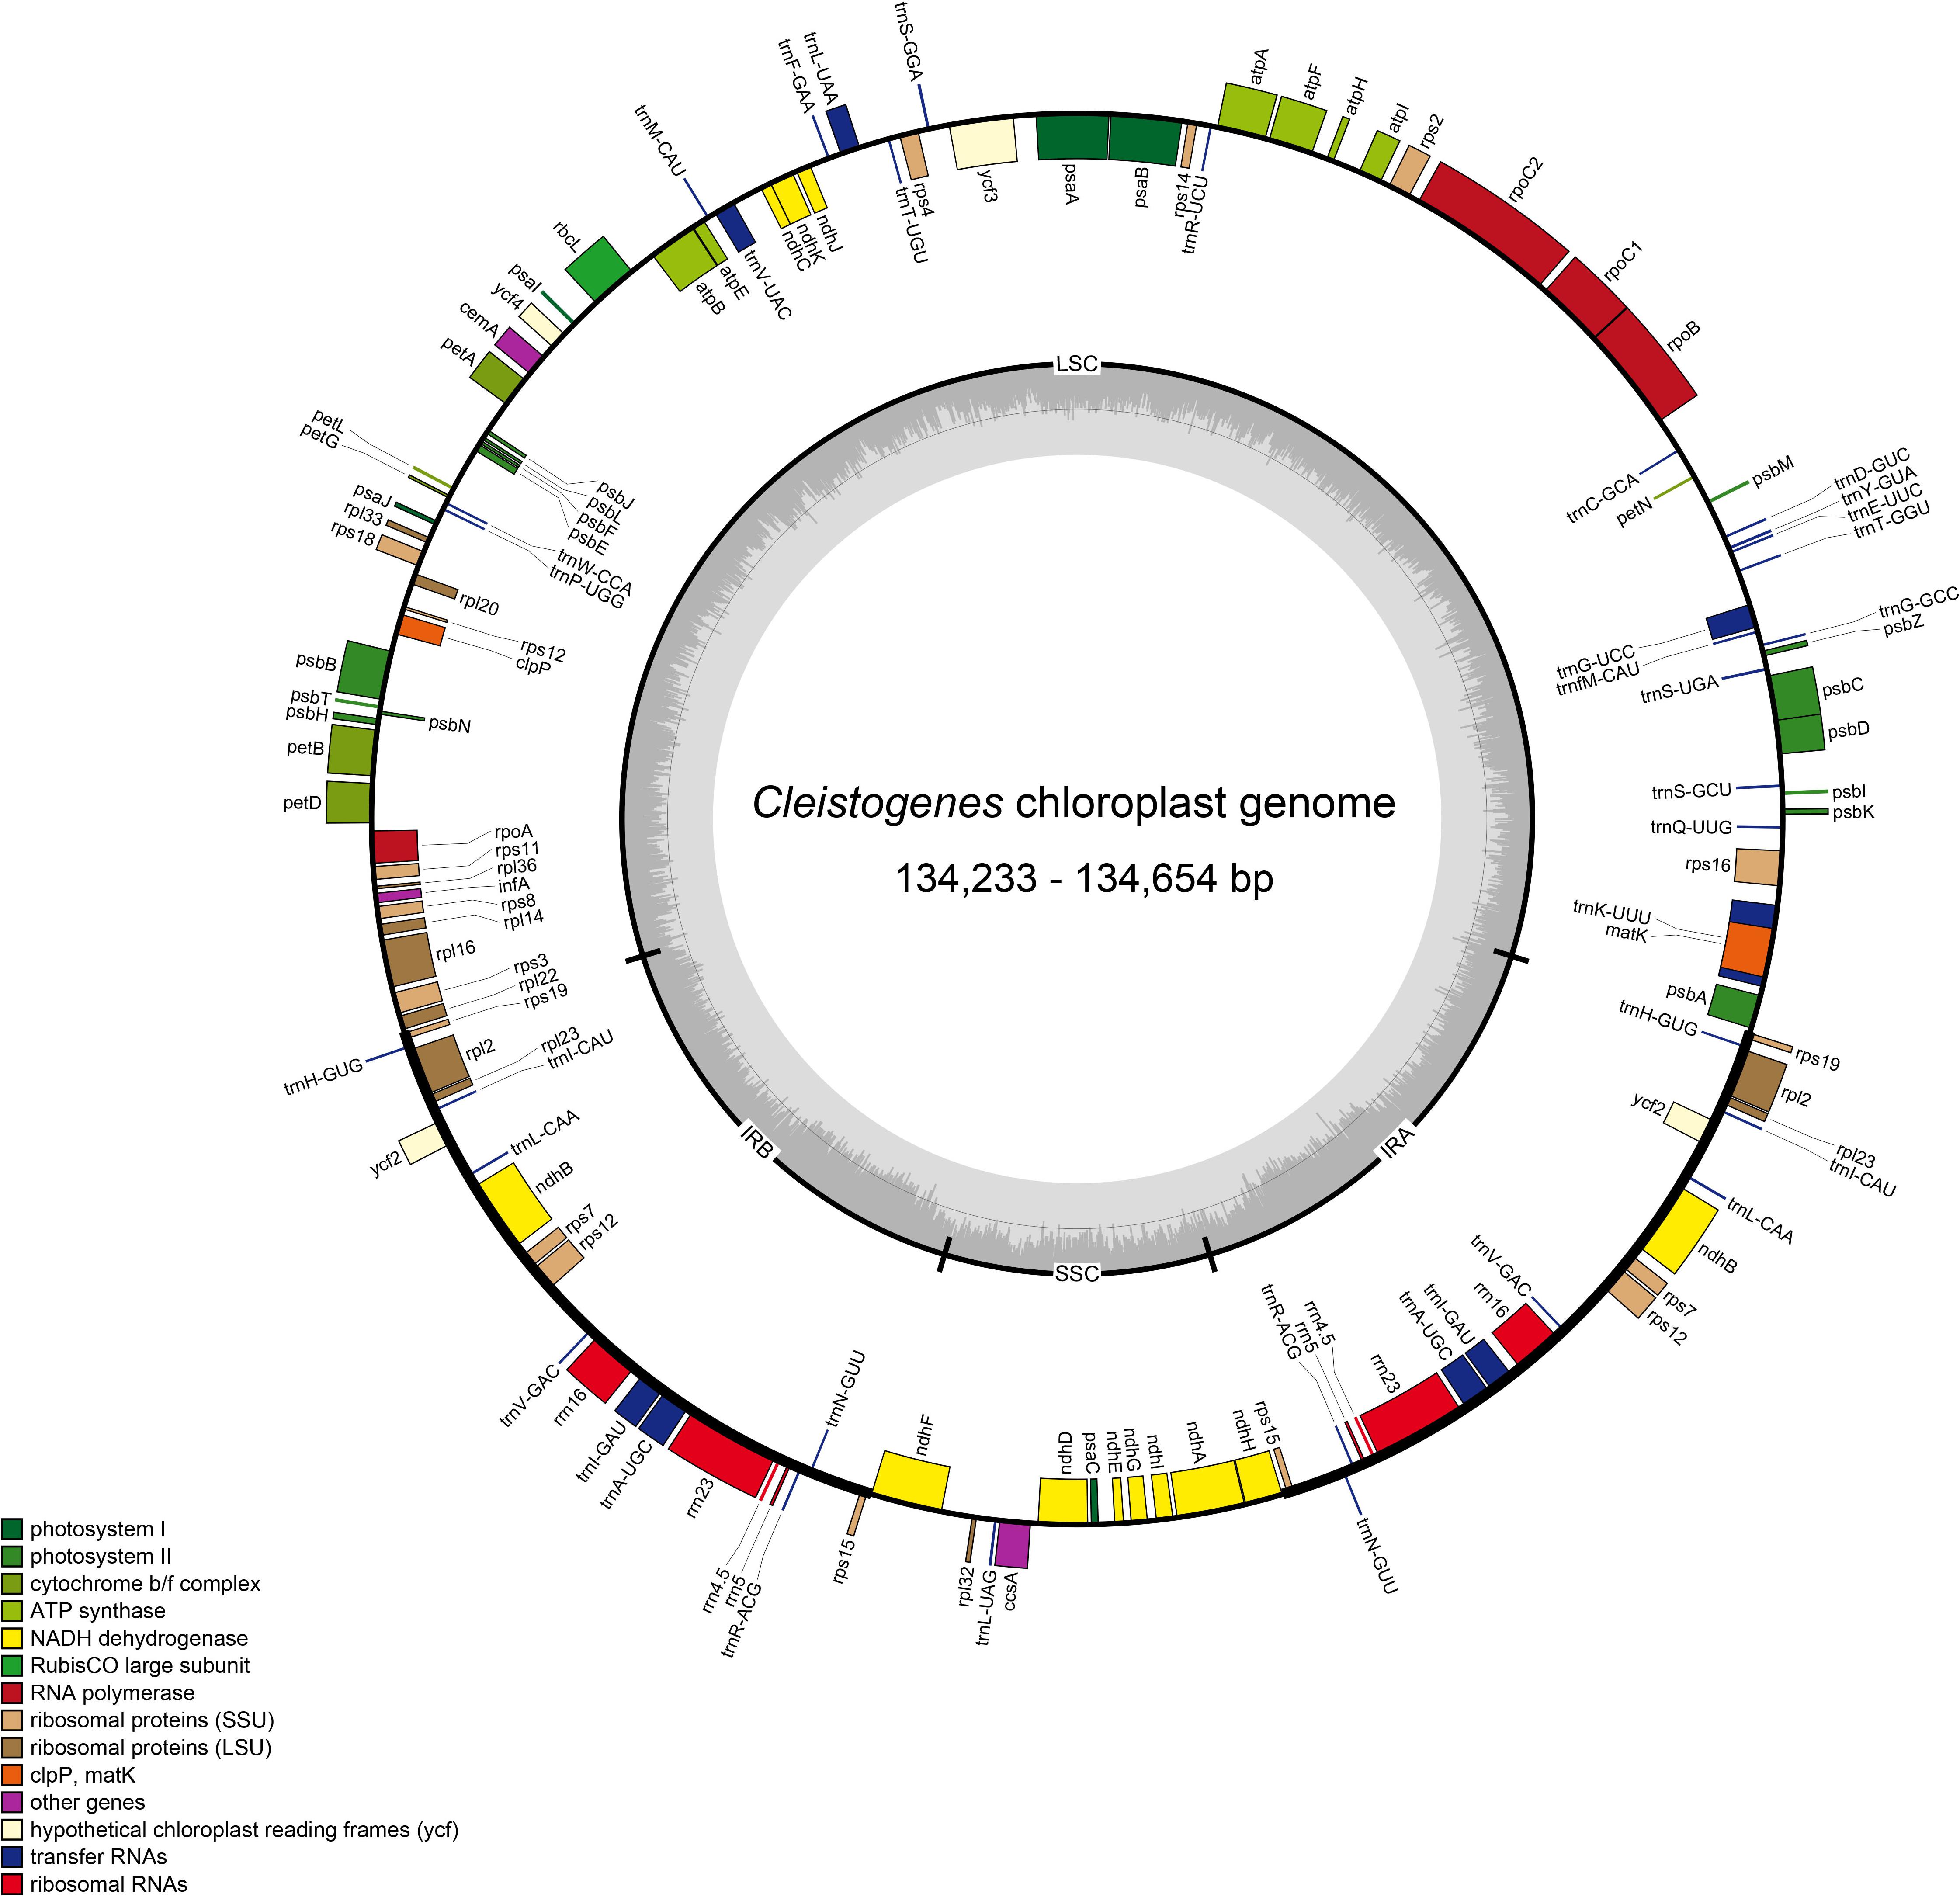
Figure 1. Plastome map of twelve Cleistogenes taxa. Genes on the inside of the map are transcribed in the clockwise direction, while genes on the outside of the map are transcribed in the counterclockwise direction. The dashed darker gray area in the inner circle indicates the GC content, while the lighter gray area shows the AT content. IR, inverted repeat; SSC, small single-copy; LSC, large single-copy.
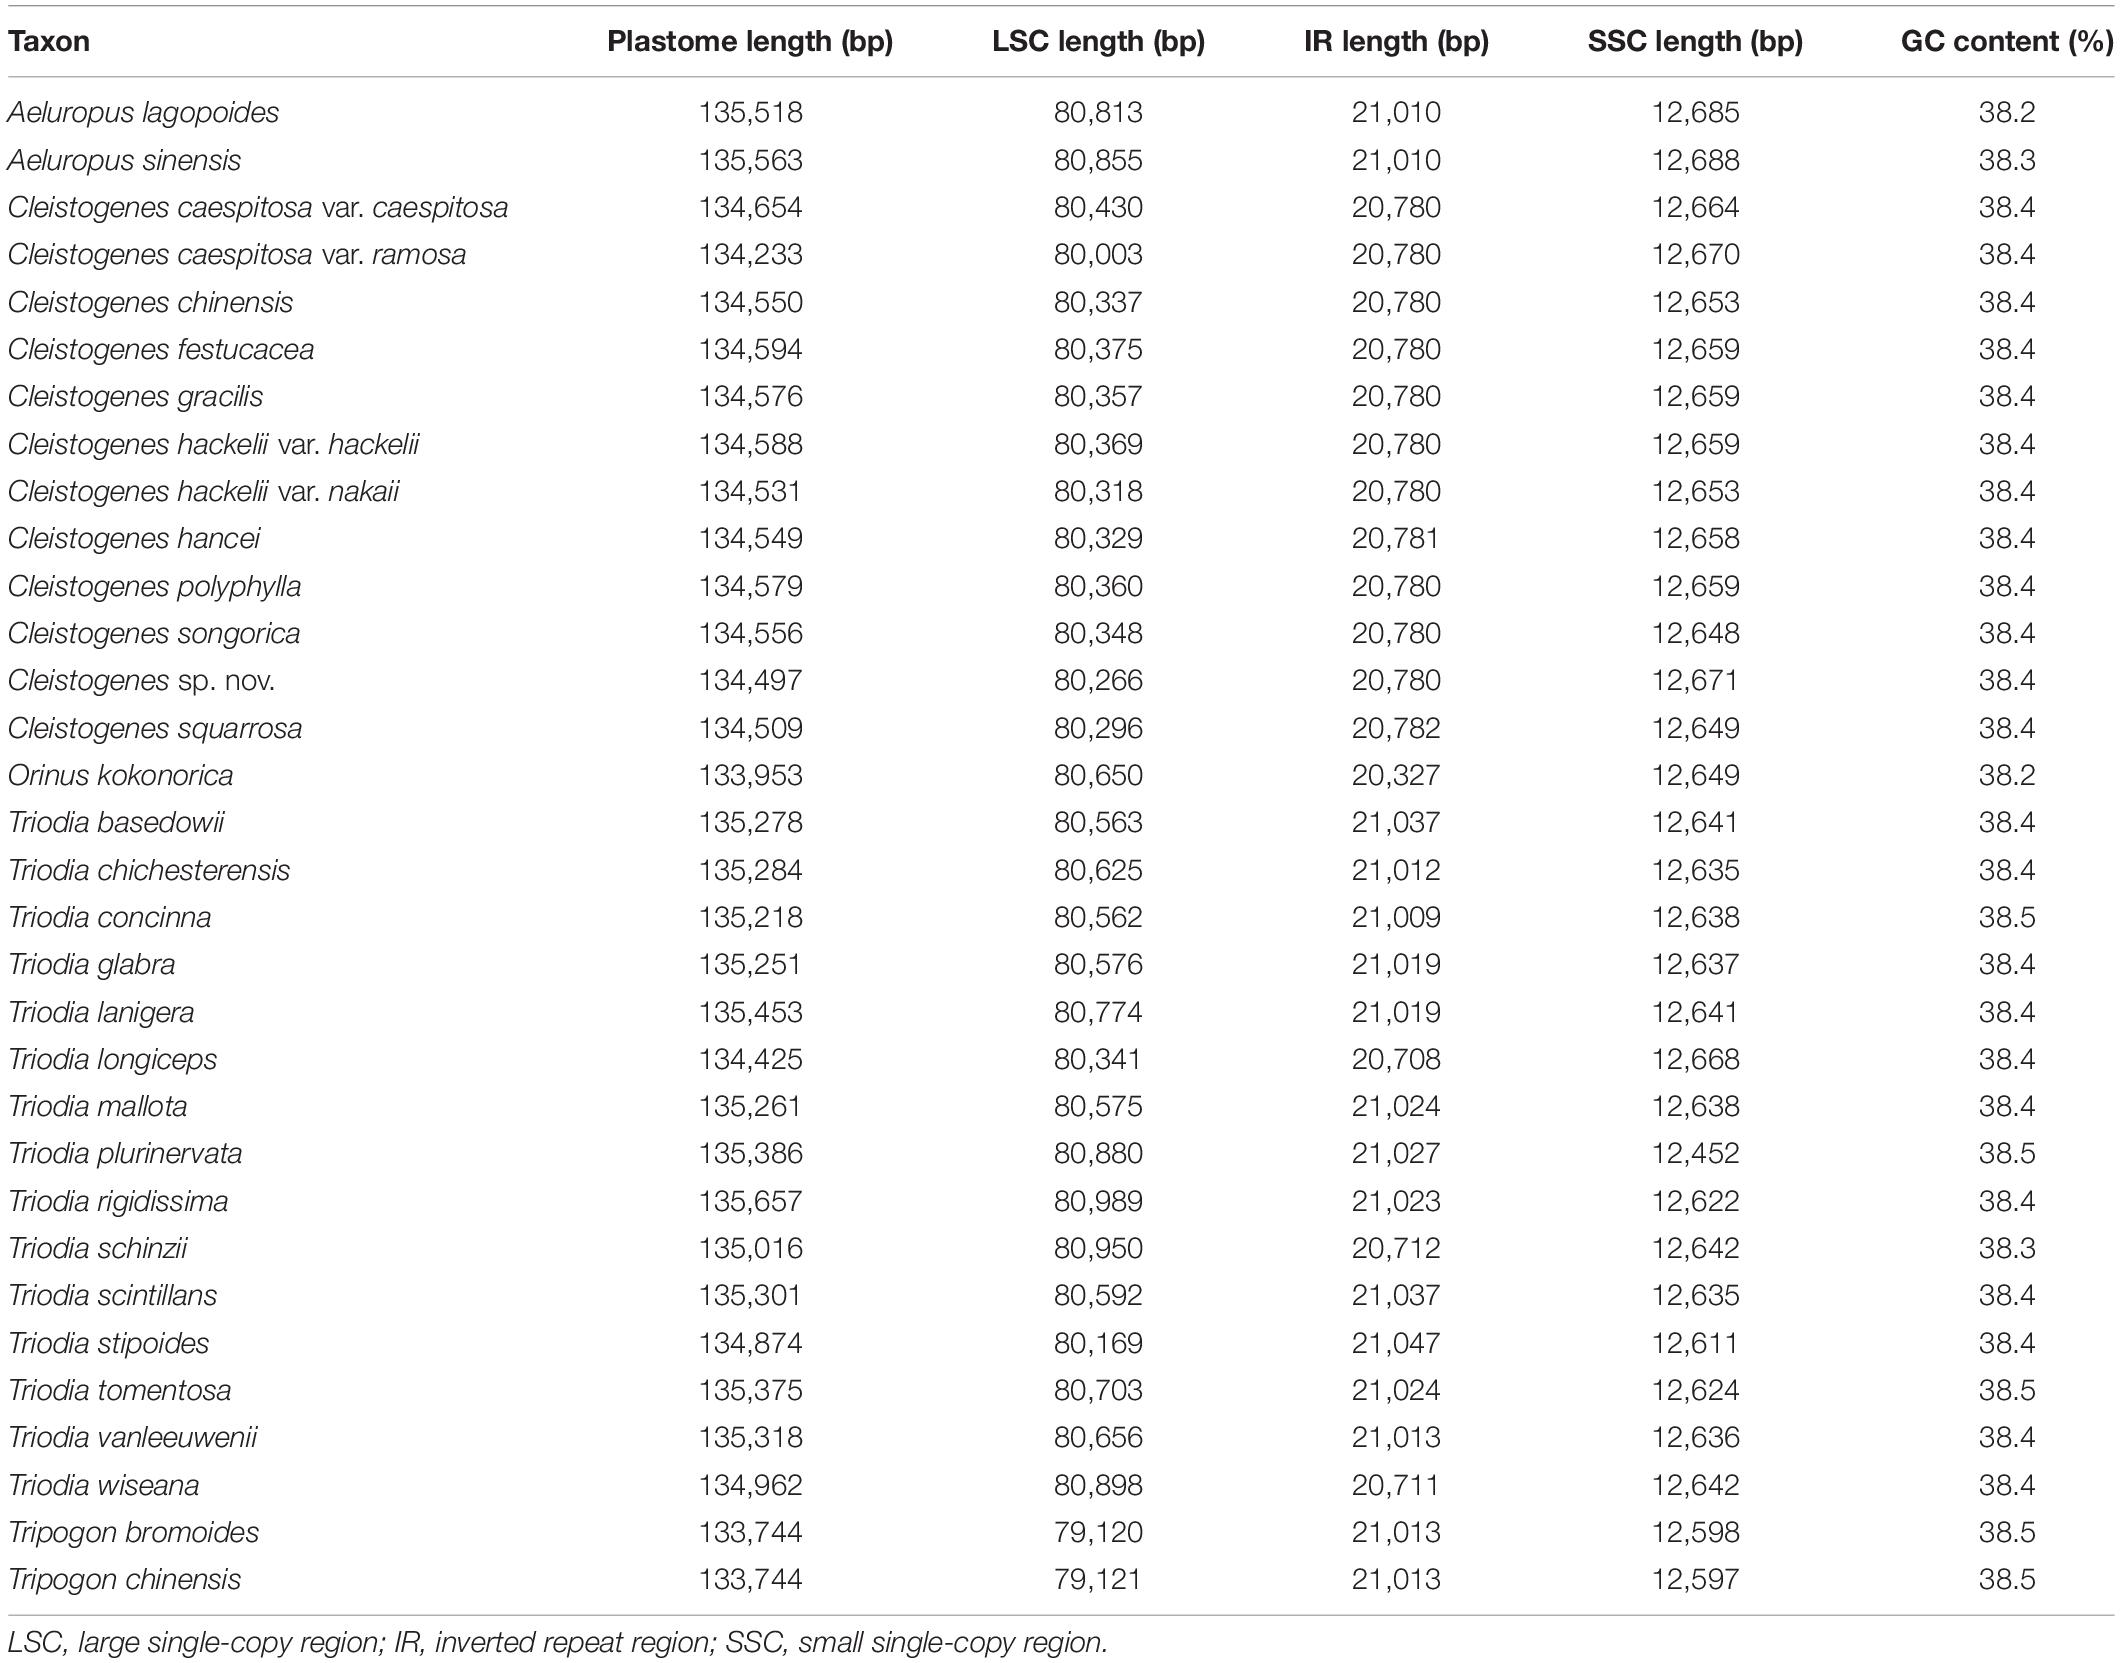
Table 2. Summary of major characteristics of the 32 plastomes.
Among all the 32 taxa, the plastomes of two Tripogon taxa (133,744 bp) were the smallest, while the plastome of Triodia rigidissima (135,657 bp) was the largest (Table 2). The length of LSC and SSC ranged from 80,003 bp (C. caespitosa var. ramosa) to 80,989 bp (T. rigidissima), and from 12,452 bp (T. plurinervata) to 12,688 bp (A. sinensis), respectively. The GC content ranged from 38.2 to 38.5%. All these plastomes encoded 132 genes (111 unique), including 86 PCGs (77 unique), 38 tRNA genes (30 unique), and eight rRNA genes (four unique).
Repeat Sequence Analysis
A total of 1,687 repeats were identified in these 32 plastomes by Reputer, including 1,012 forward, 650 palindromic, 24 reverse, and one complement. The sole complement repeat was only identified in C. chinensis. The number of repeats ranged from 45 (T. stipoides) to 76 (T. lanigera). Most taxa had 45–60 pairs of repeats. The repeat lengths in 30–39 bp were most common, accounting for 64.1%. Repeats with the lowest proportion (7.1%) ranged in size from 50 to 59 bp. Repeat lengths in 50–59 bp were not identified in Cleistogenes taxa.
Figure 2 shows that the number of SSRs for all taxa ranged from 145 (Orinus kokonorica) to 161 (T. plurinervata and T. schinzii). The number of SSRs found in Cleistogenes taxa ranged from 155 to 159. There were six categories of SSRs detected in these taxa, including mono-nucleotide, di-nucleotide, tri-nucleotide, tetra-nucleotide, penta-nucleotide, and hexa-nucleotide repeats. In all taxa, mono-nucleotides were the most common SSRs, accounting for 74.4%, followed by di-nucleotide (19.1%). There were some types of SSRs found in all plastomes, including mono-(A/C/G/T), di-(AG/AT/CT/GA/TA/TC), tri-(AAT), and tetra-(AACG/AATA/GTAG/YCGT/TTCT) (Supplementary Table 2). Penta-nucleotide repeats were only found in T. longiceps and T. plurinervata, and hexa-nucleotide repeats (AAATAT) were only found in Cleistogenes sp. nov. and C. caespitosa var. ramosa.
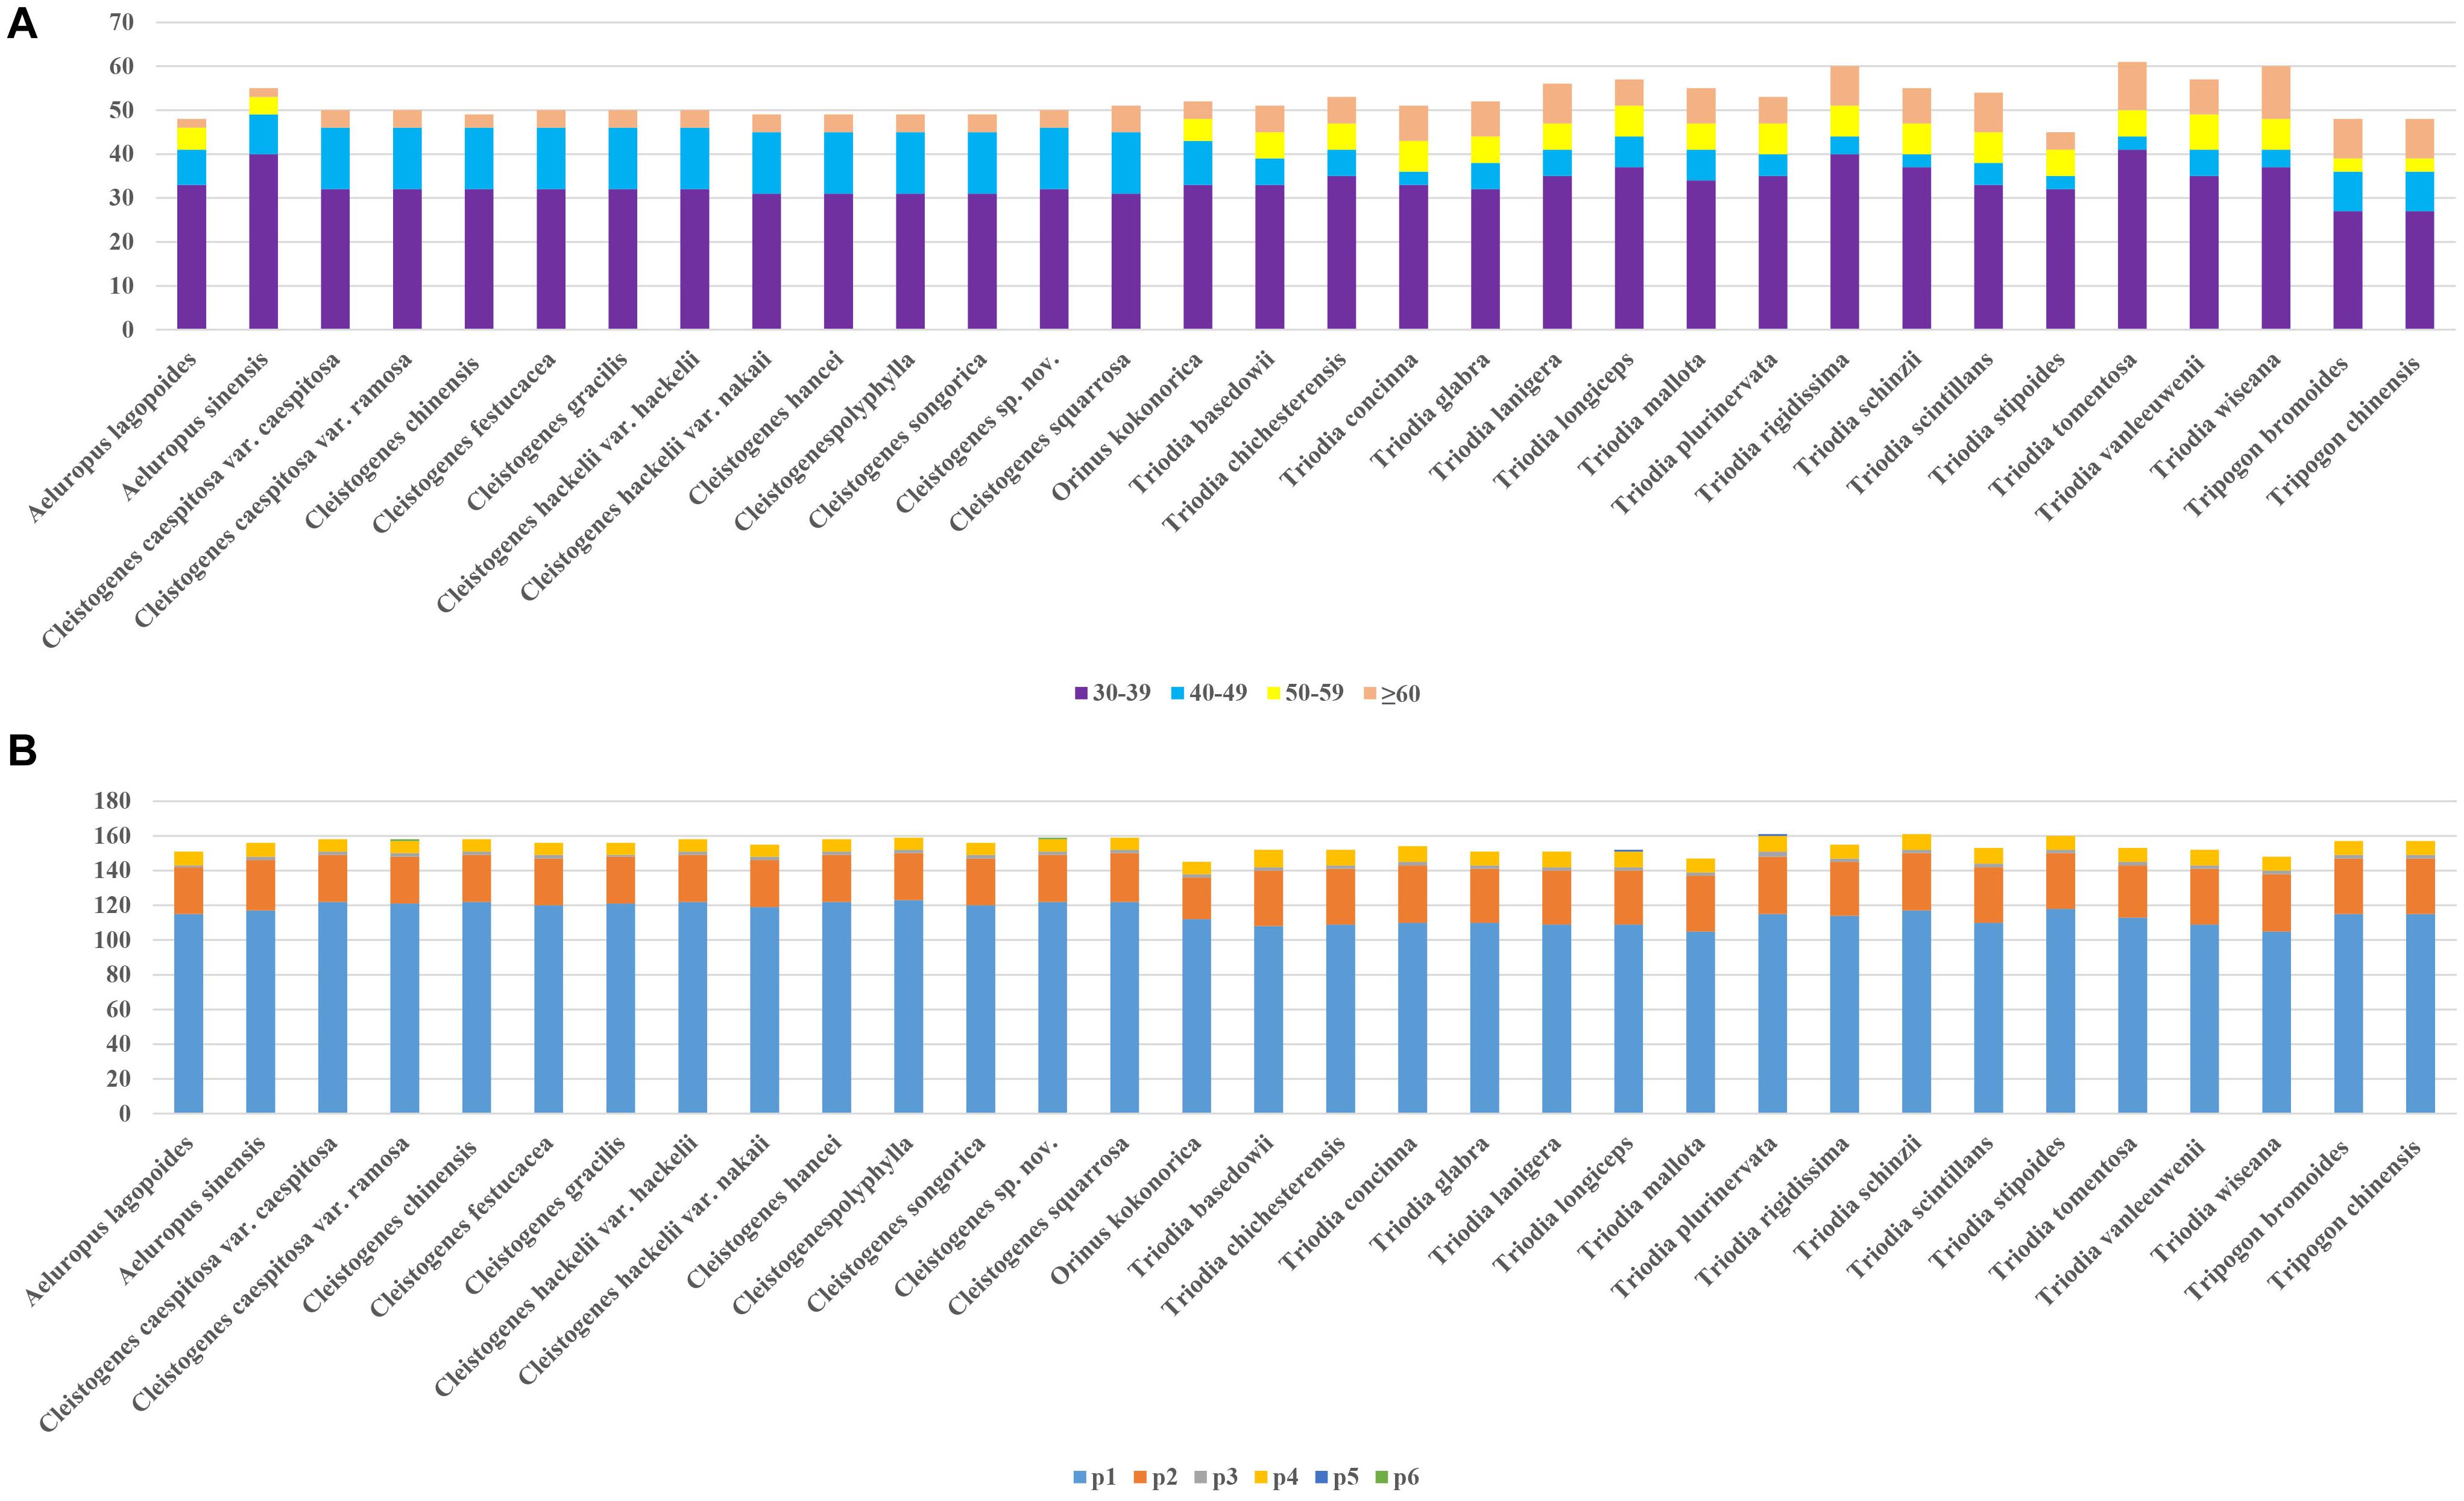
Figure 2. Repeats in 32 plastomes. (A) The number of repetitive sequences by lengths; (B) The number of different types of SSRs (p1–p6 indicate mono-, di-, tri-, tetra-, penta-, hexanucleotides, respectively).
Codon Usage Analysis
A total of 48 PCGs were used in the codon usage analysis. The number of codons identified in the codon usage analysis ranged from 16,633 (T. stipoides) to 16,678 (T. tomentosa) (Supplementary Table 3). The GC contents of the entire plastomes, the frequency of the nucleotides G + C at the third position (GC3s), and the frequency of each base A, T, G, and C at the third position of codons (A3s, T3s, G3s, and C3s) were similar in all taxa. The GC content was approximately 39%, suggesting an abundance of AT. A3s and T3s were larger than G3s and C3s. Leucine was the most frequent amino acid in the plastomes (∼10.8%), while cysteine was the least frequent amino acid (∼1.0%) (Supplementary Table 4). The relative values of synonymous codon usage (RSCU) were determined to estimate the preference for the use of synonymous codons. In all taxa, nearly all the amino acid codons had a bias (RSCU > 1 or RSCU < 1) except for methionine (AUG, RSCU = 1) and tryptophan (UGG, RSCU = 1).
IR Expansion and Contraction of Ael-Cle-Ori-Trio Clade Plastomes
The IR/SSC and IR/LSC boundary regions of these taxa were very conserved (Figure 3). The junctions of LSC/IRb and IRa/LSC were located in intergenic regions. LSC/IRb was located between rpl22 and rps19. The fragment size of rpl22-rps19 located in the IRb region was 34 bp in O. kokonorica, 36 bp in T. plurinervata, 42 bp in two Tripogon species, and 35 bp in other taxa. IRa/LSC was located between rps19 and psbA. The length of rps19-psbA located in the IRa region was 35 bp in most taxa, 34 bp in O. kokonorica, 36 bp in T. plurinervata, and 42 bp in two Tripogon species. The IRb/SSC boundaries were located in the ndhF gene, and part of this gene was duplicated from 20 to 34 bp in the IRb region. The ndhH gene crossed the SSC/IRa region in all taxa, and this gene extended 1 to 15 bp into the IRa region.
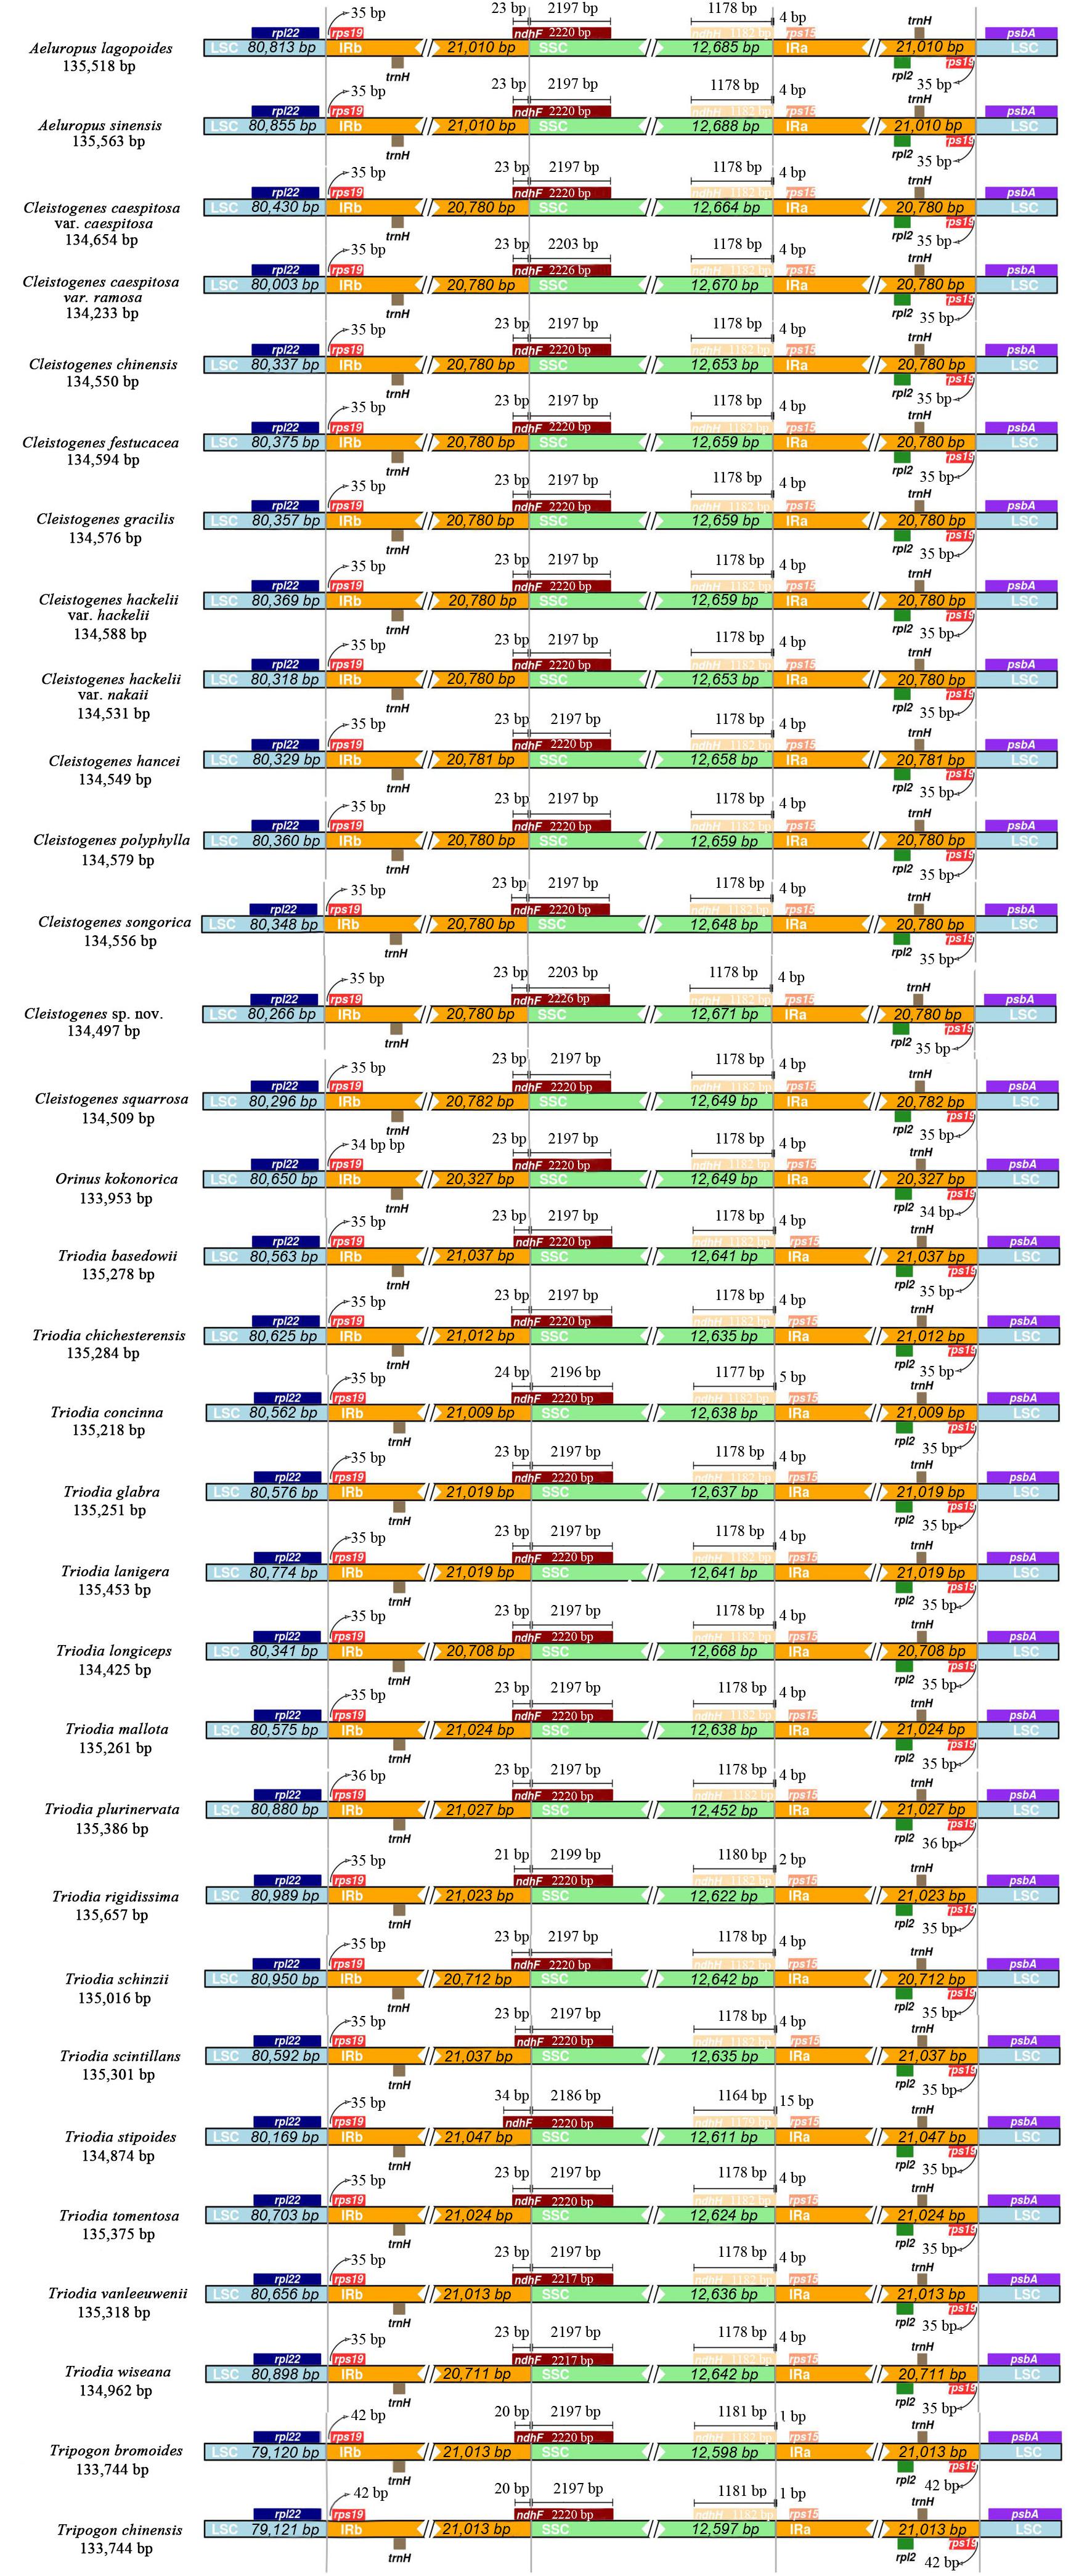
Figure 3. Comparison of the boundaries between LSC/SSC and IR regions among the 32 plastomes.
Sequence Divergence Analysis
To compare the sequence divergence among all the taxa, variable and parsim-info sites were calculated for PCGs and NCRs (Figure 4). The sequence divergence of NCRs was generally higher compared with the PCGs. For the PCGs, the percentage of parsim-info (Pi%) sites ranged from 0% (psbE and psbH) to 4.44% (rps3), and the percentage of variable sites ranged from 0.21% (rps7) to 11.30% (ycf2). For the NCRs, the percentage of parsim-info sites ranged from 0% (rpl2 intron, rps12 intron and trnV-GAC-rrn16) to 12.48% (trnS-UGA-psbZ), and the percentage of variable sites ranged from 0.45% (rpl2 intron) to 13.12% (rpl32-trnL-UAG). Five PCGs with a high percentage of parsim-info sites were selected, including rps3, ndhF, matK, rpl22 and petD. Five NCRs were identified, including trnS-UGA-psbZ, rpl32-trnL-UAG, trnQ-UUG-psbK, trnD-GUC-psbM, trnT-GGU-trnE-UUC. The mVISTA results showed that all aligned plastome sequences were highly similar, and the NCRs showed a higher divergence compared with the PCGs (Figure 5).
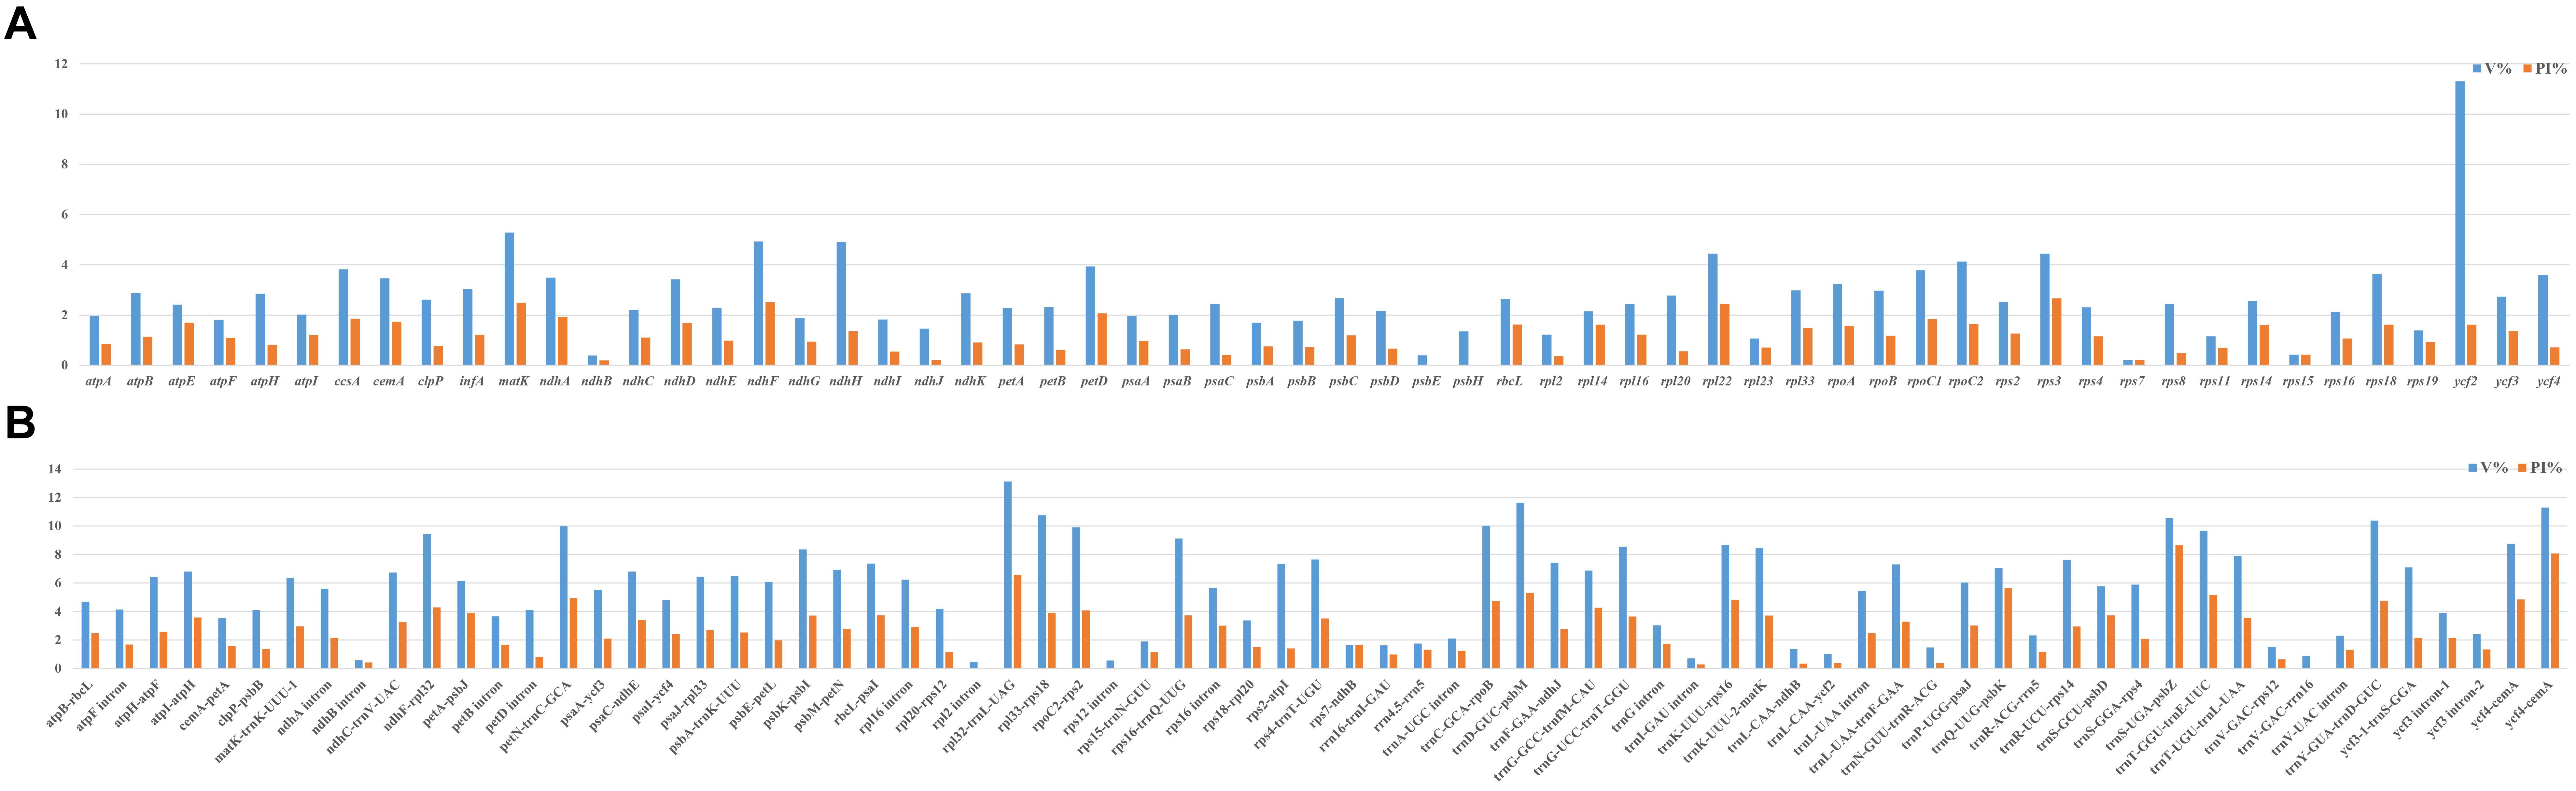
Figure 4. Comparison of percentage of parsim-info sites among 32 plastomes. (A) PCGs, X-axis: name of PCGs, Y-axis: percentage of variable sites; (B) NCRs, X-axis: name of NCRs, Y-axis: percentage of parsim-info sites.
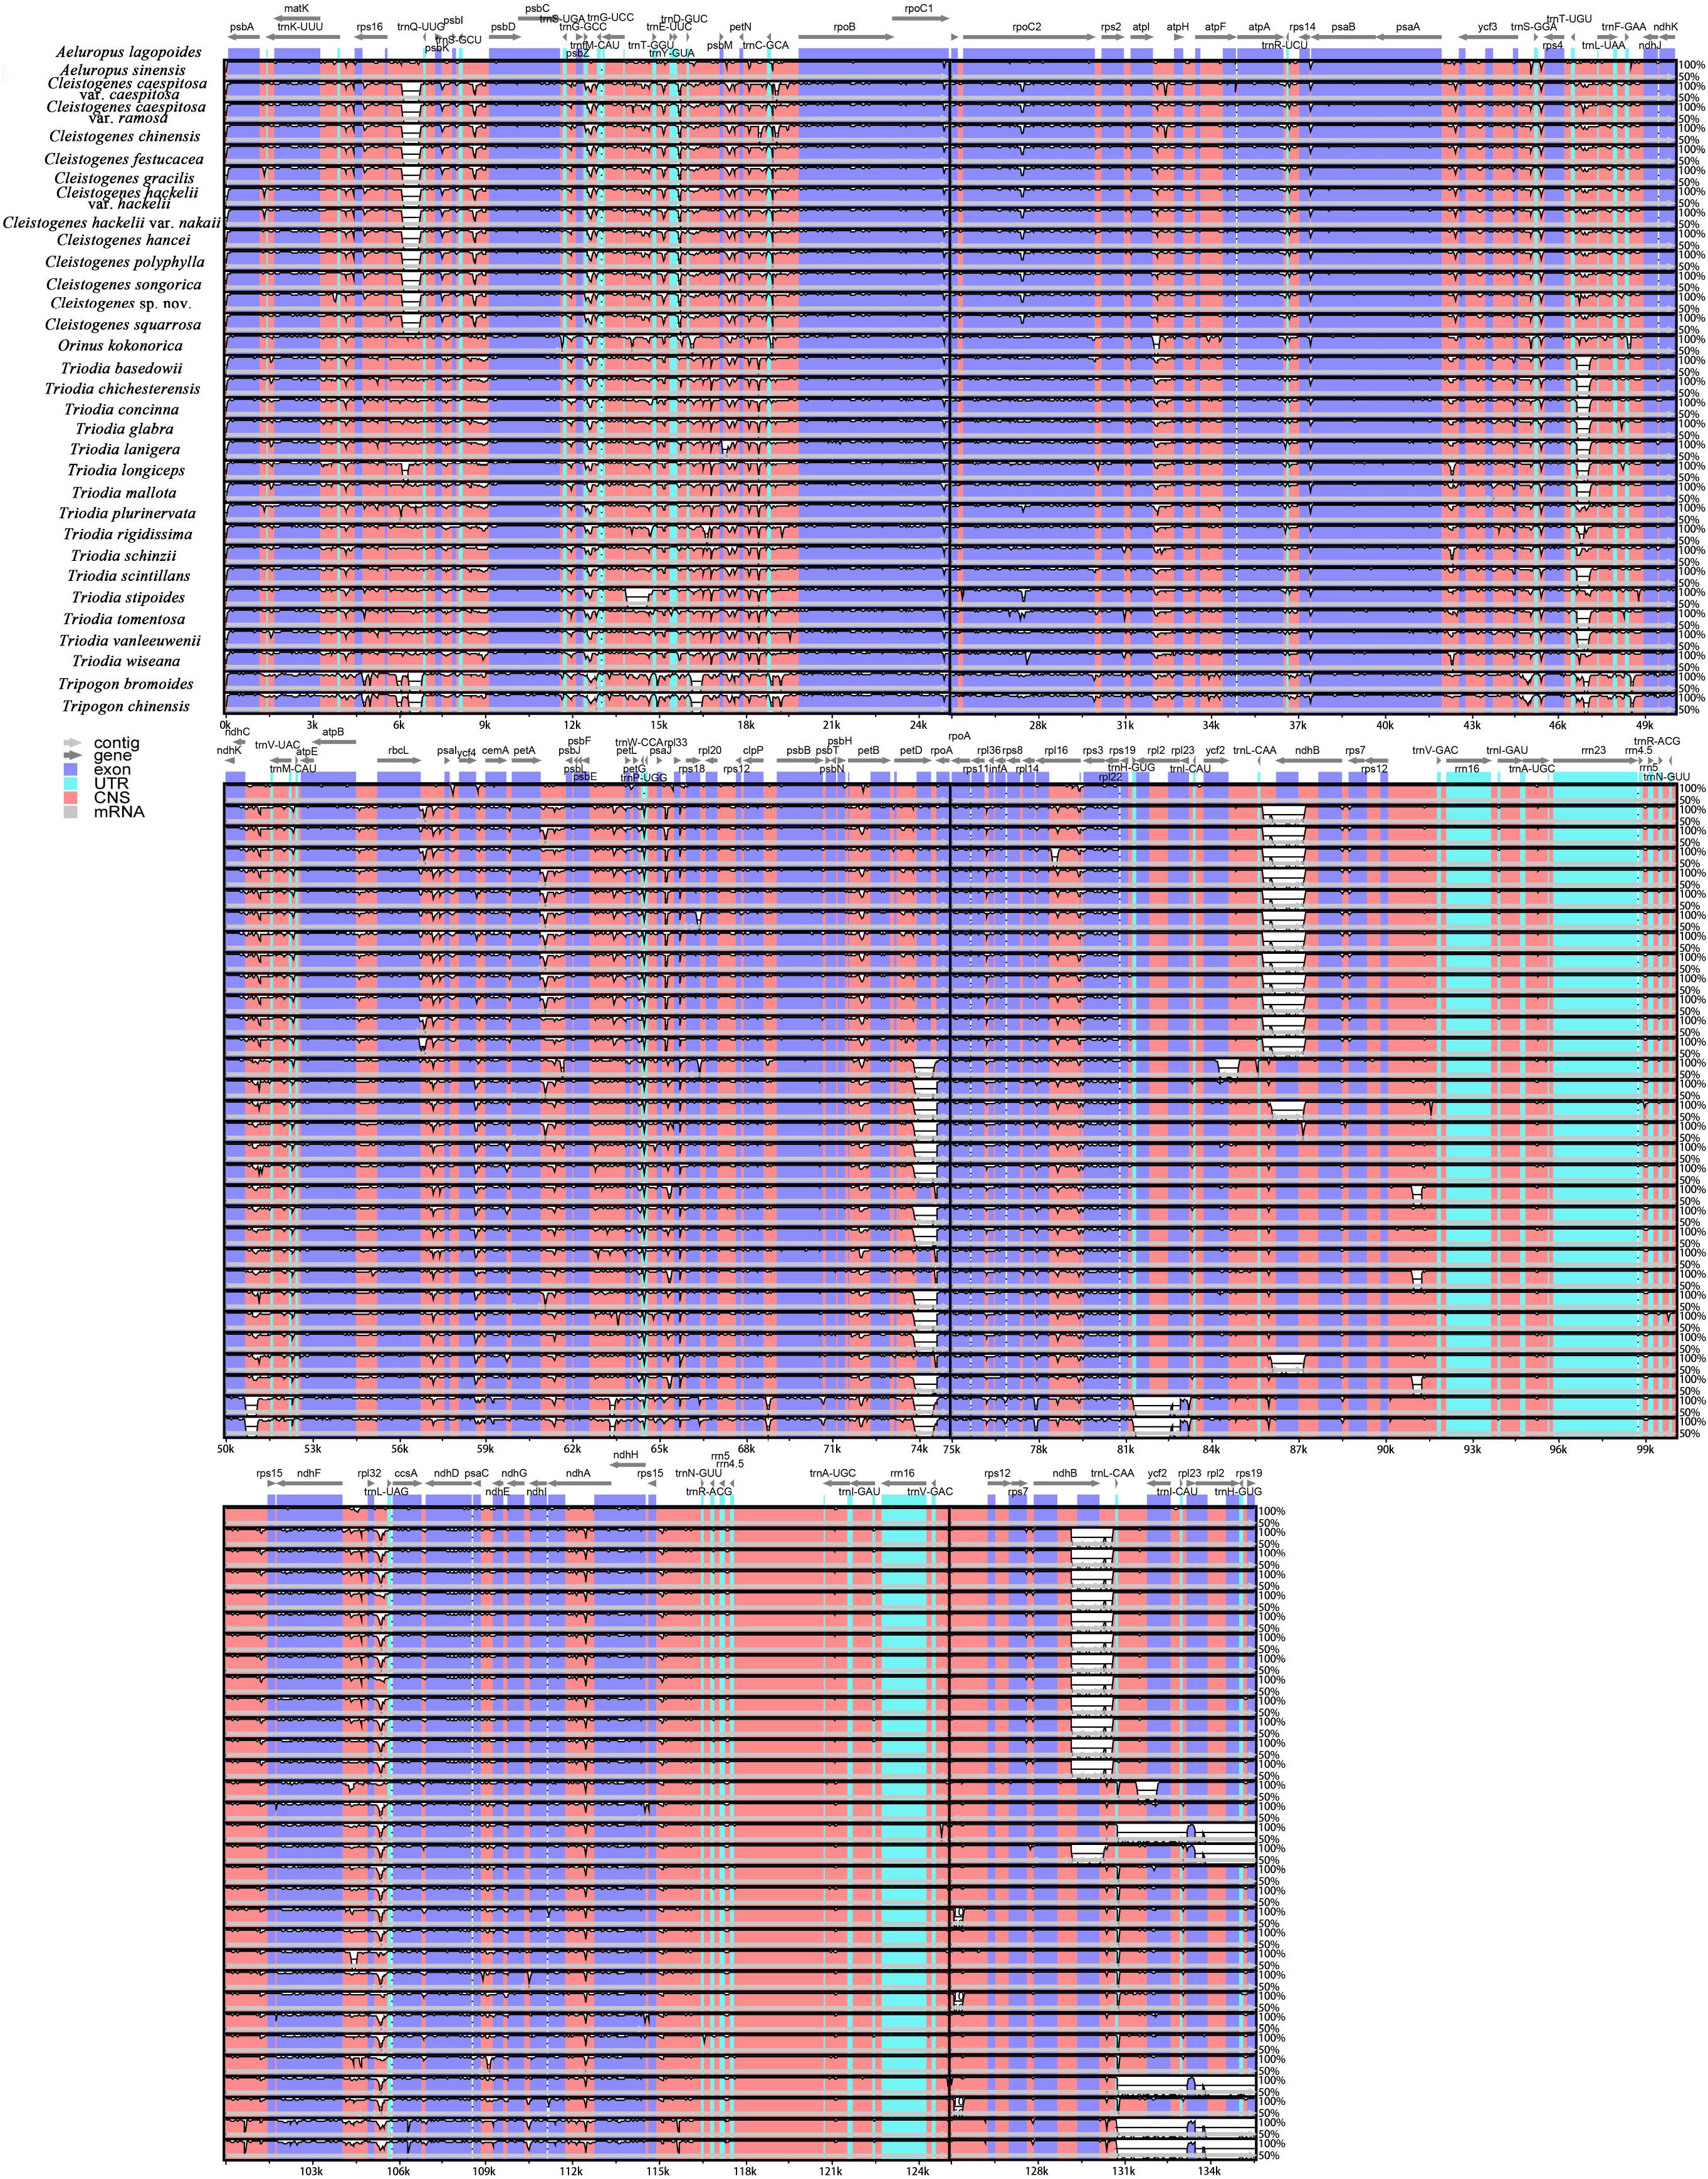
Figure 5. Comparative analysis of the plastomes of 32 taxa. The plastome of Aeluropus lagopoides was used as a reference. The vertical scale indicates the percentage of identity, ranging from 50 to 100%. Genome regions are color-coded as exon, UTR, and conserved non-coding sequences (CNS).
Phylogenetic Analysis and Divergence Time Estimations
Maximum likelihood and Bayesian inference phylogenetic analyses using three datasets (complete plastomes, PCGs, and NCRs) generated identical topologies for Cleistogenes and its closely related genera in the present study (Figure 6, Supplementary Figures 1–6). Aeluropus lagopoides and A. sinensis form a monophyletic clade with a strong support (BS = 100, PP = 1.00). Cleistogenes is strongly supported as a monophyletic group in ML and BI analysis (BS = 100, PP = 1.00). The clade composed of Orinus and Triodia (BS = 100, PP = 1.00) is sister to Cleistogenes. The sister relationship of Cleistogenes and Orinus-Triodia clade have a BS value of 85 and a PP value of 1. Cleistogenes taxa are grouped into four clades. Two species including C. squarrosa and C. songorica are the successive early diverging groups (BS = 100, PP = 1.00). The other 10 taxa are strongly supported to be divided into two groups: Cleistogenes sp. nov. and C. caespitosa var. ramosa form a monophyletic group (BS = 100, PP = 1.00) sister to other eight Cleistogenes taxa, and the clade composed of eight taxa (C. hackelii var. hackelii, C. polyphylla, C. festucacea, C. hancei, C. hackelii var. nakaii, C. chinensis, C. caespitosa var. caespitosa, and C. gracilis) are detected with short internal branch length. The results of divergence time estimations were shown in Figure 7 and Supplementary Table 5. The divergence time between Cleistogenes and Orinus-Triodia was estimated at 14.01 Ma (13.07 to 16.04 Ma) in Miocene. The split between Triodia and Orinus was estimated at 12.54 Ma (11.86 to 14.6 Ma) in Miocene. The result indicated that Cleistogenes began to diversify in Pliocene or Pleistocene (1.34–5.2 Ma).
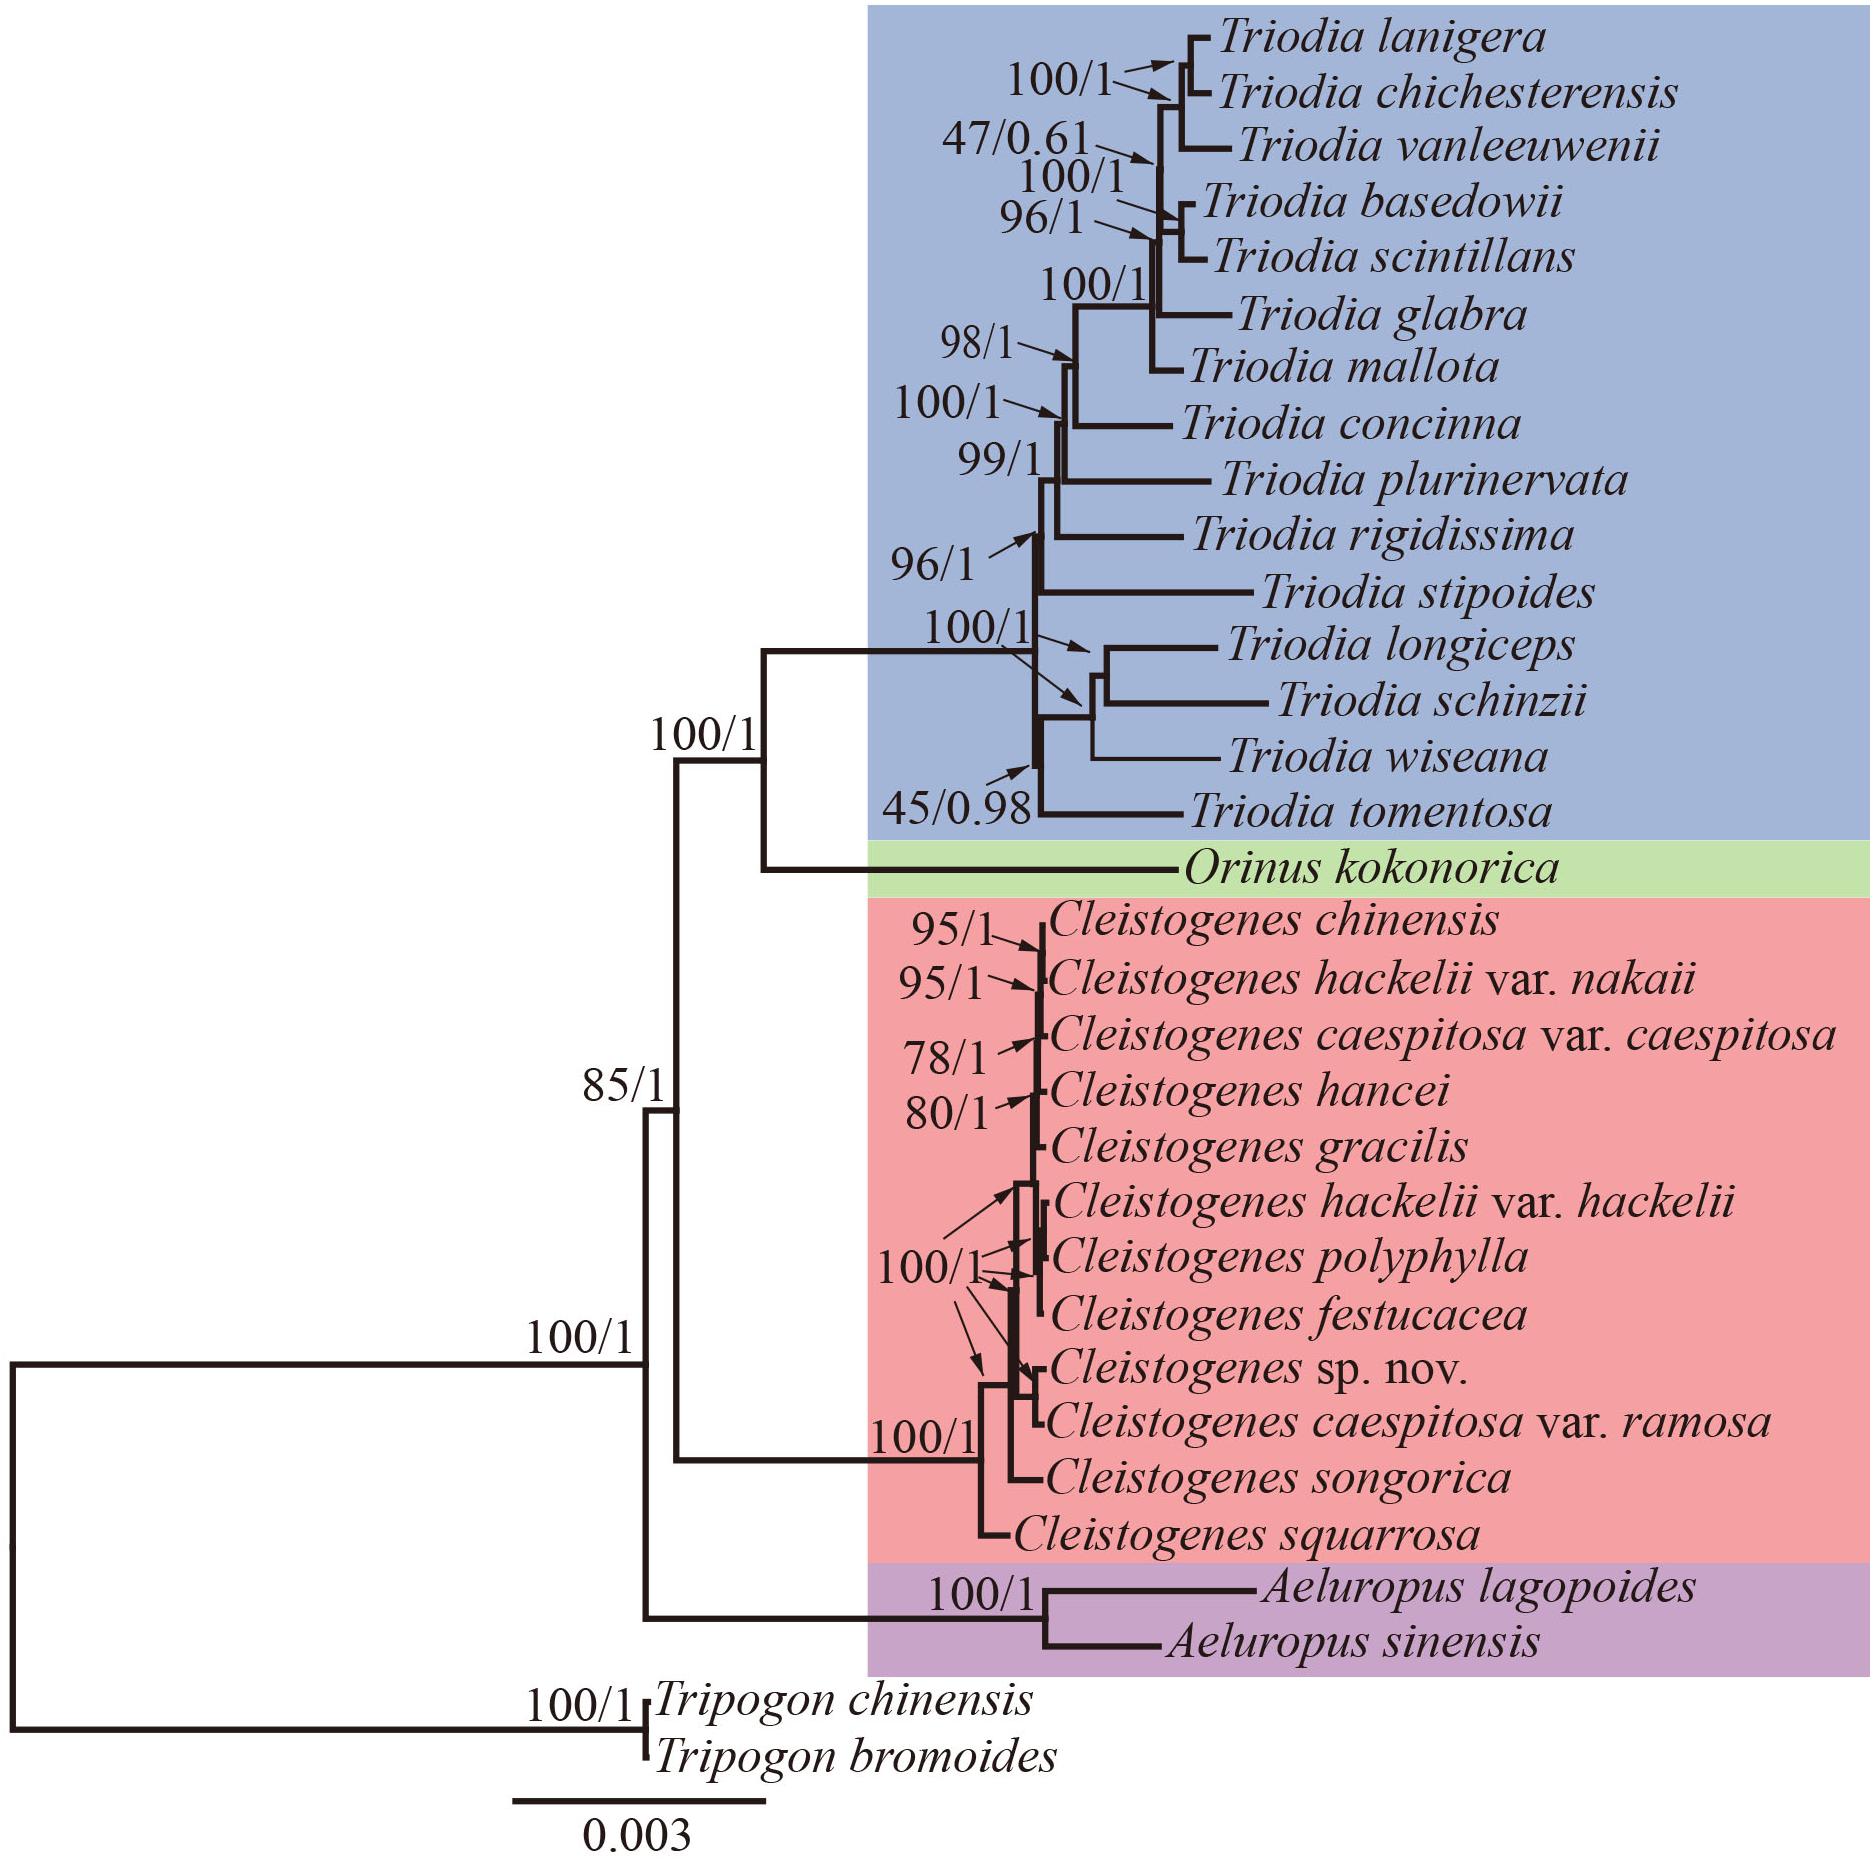
Figure 6. The ML phylogeny of Cleistogenes and its closely related genera based on complete plastomes. The obtained bootstrap values (BS) and Bayesian inference posterior probabilities (PP) are marked above the tree node (BS/PP). Cleistogenes taxa (including 8 species and 4 varieties) are highlighted in red, Orinus species are highlighted in green, Triodia species are highlighted in blue, and Aeluropus species are highlighted in purple.
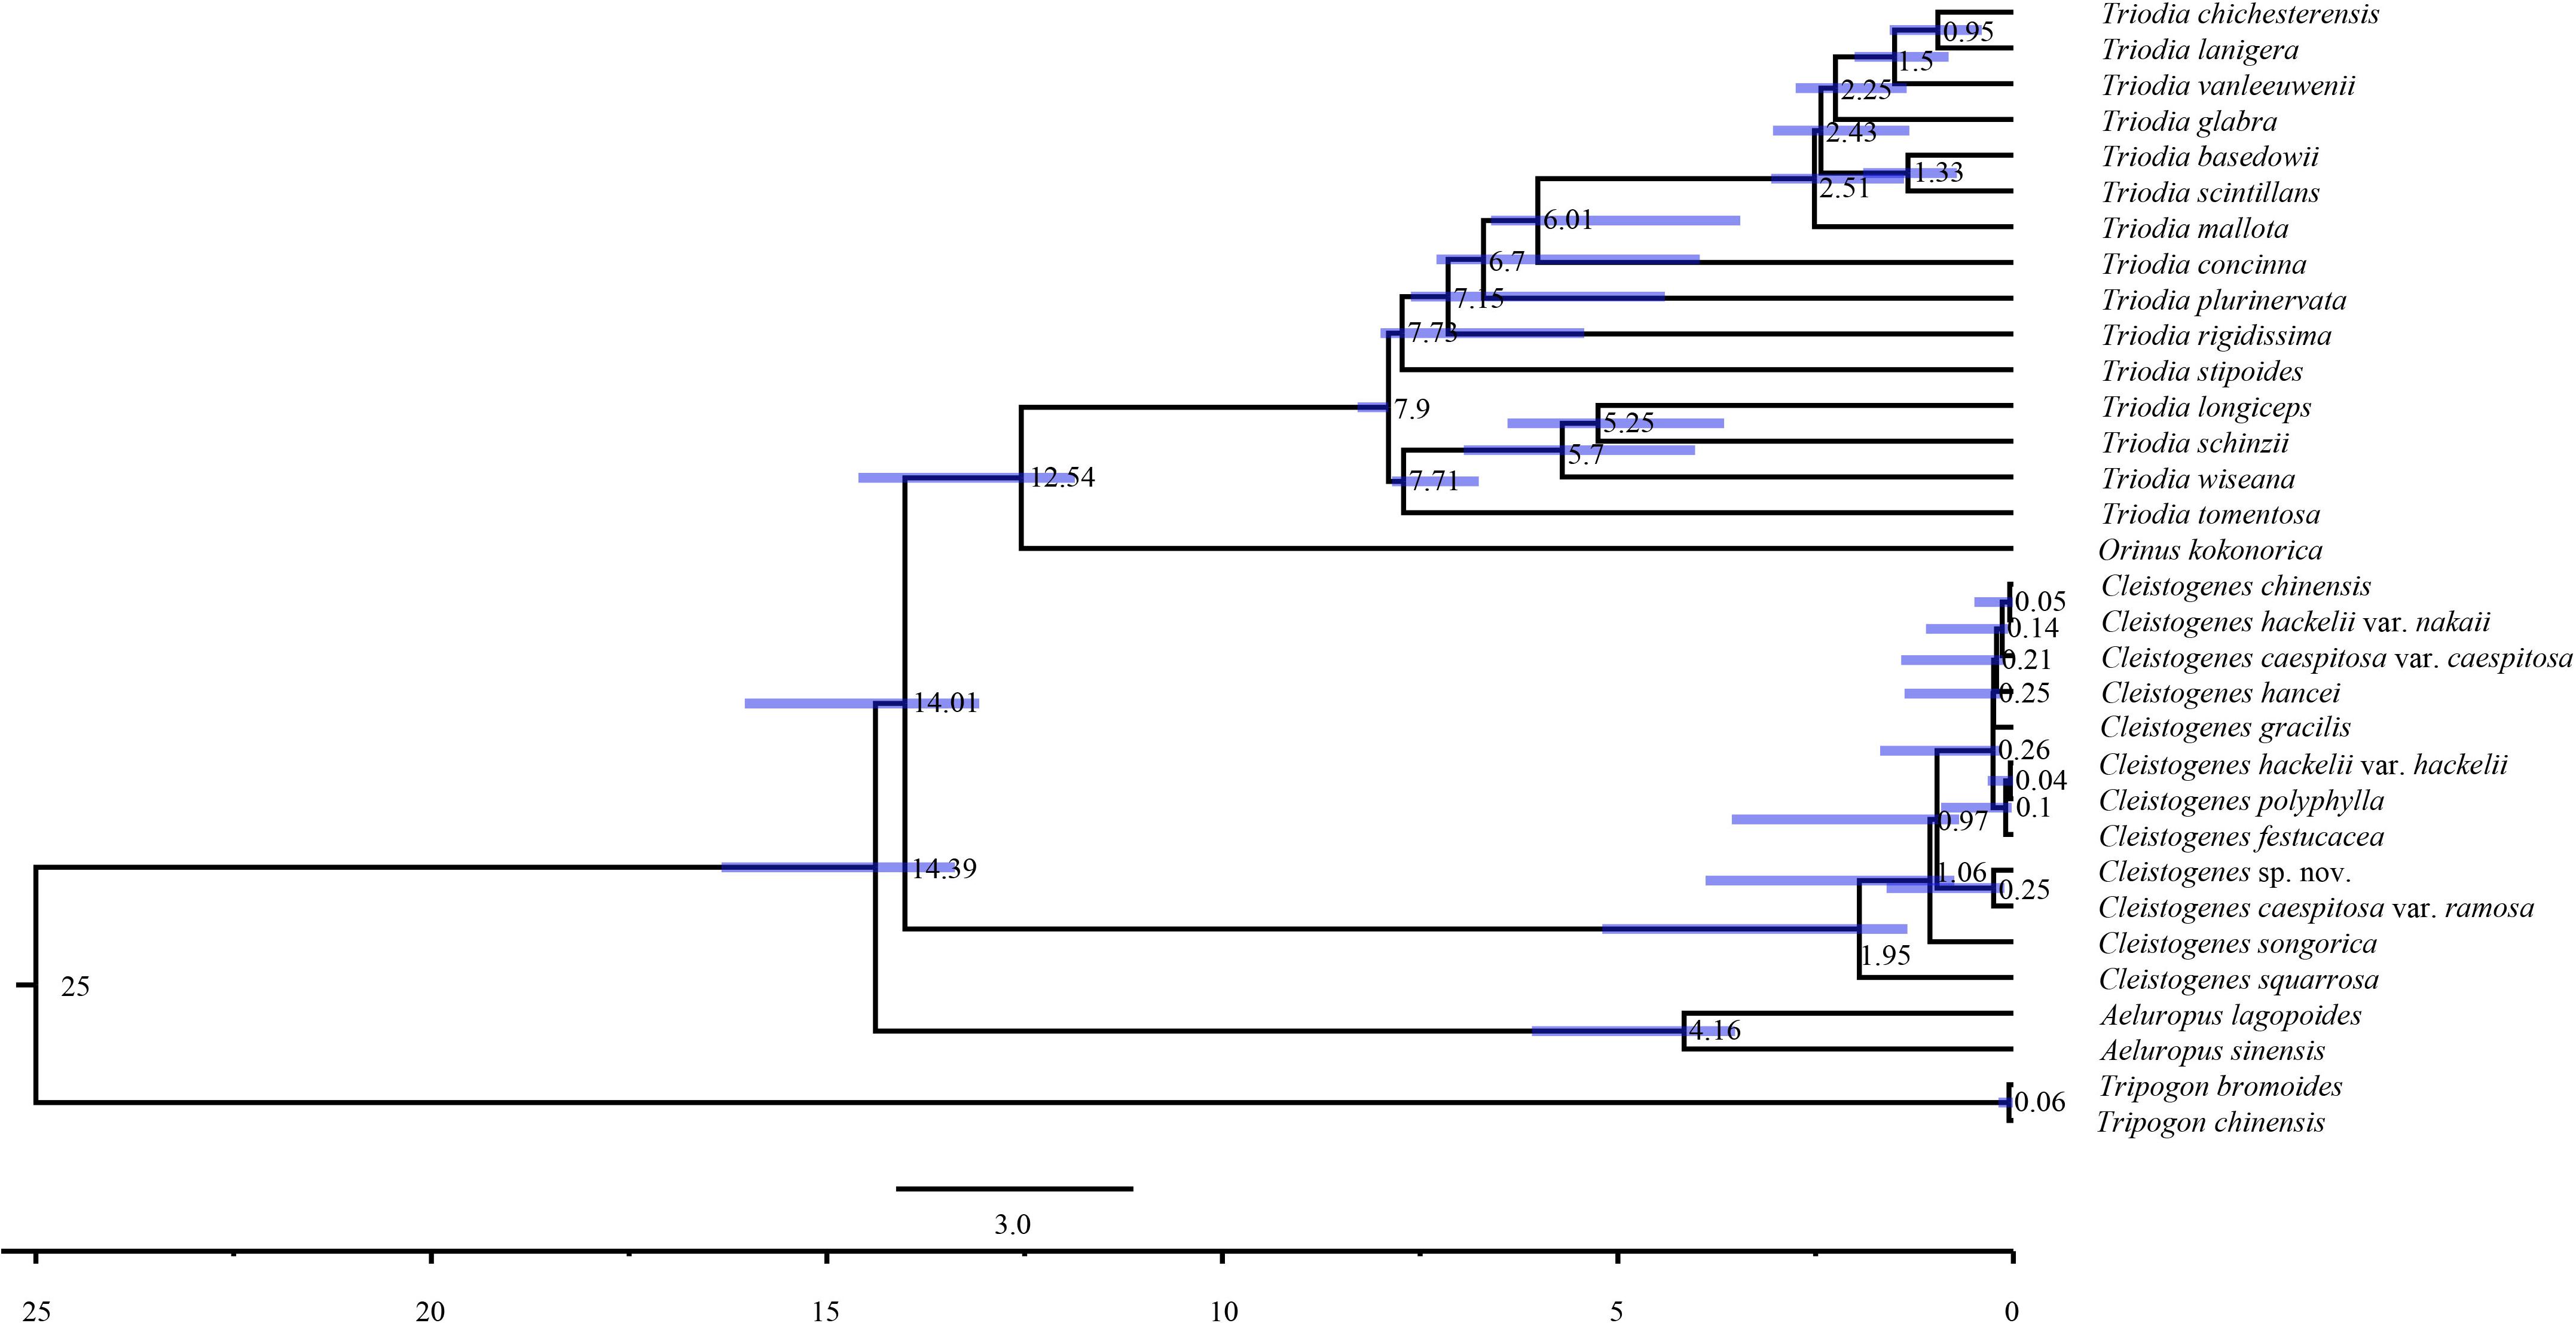
Figure 7. Chronogram of 32 taxa based on complete plastomes inferred by using treePL. Blue bars represent the minimum and maximum estimation of node ages.
Morphological Comparison of O. kokonorica and C. songorica
Spikelet, lemma and underground part of O. kokonorica and C. songorica were compared in the present study (Figure 8). Spikelets of O. kokonorica and C. songorica were laterally compressed, fewer florets in O. kokonorica. O. kokonorica is charactered by lemma thin, dorsally black-brown but yellow-brown at base and apex, with loosely pilose at margins and lower keel. Lemma of C. songorica was wider than O. kokonorica and glabrous. Underground part of these two taxa were significant different. Long scaly rhizomes can be observed in this part of O. kokonorica, while they were not present in C. songorica.
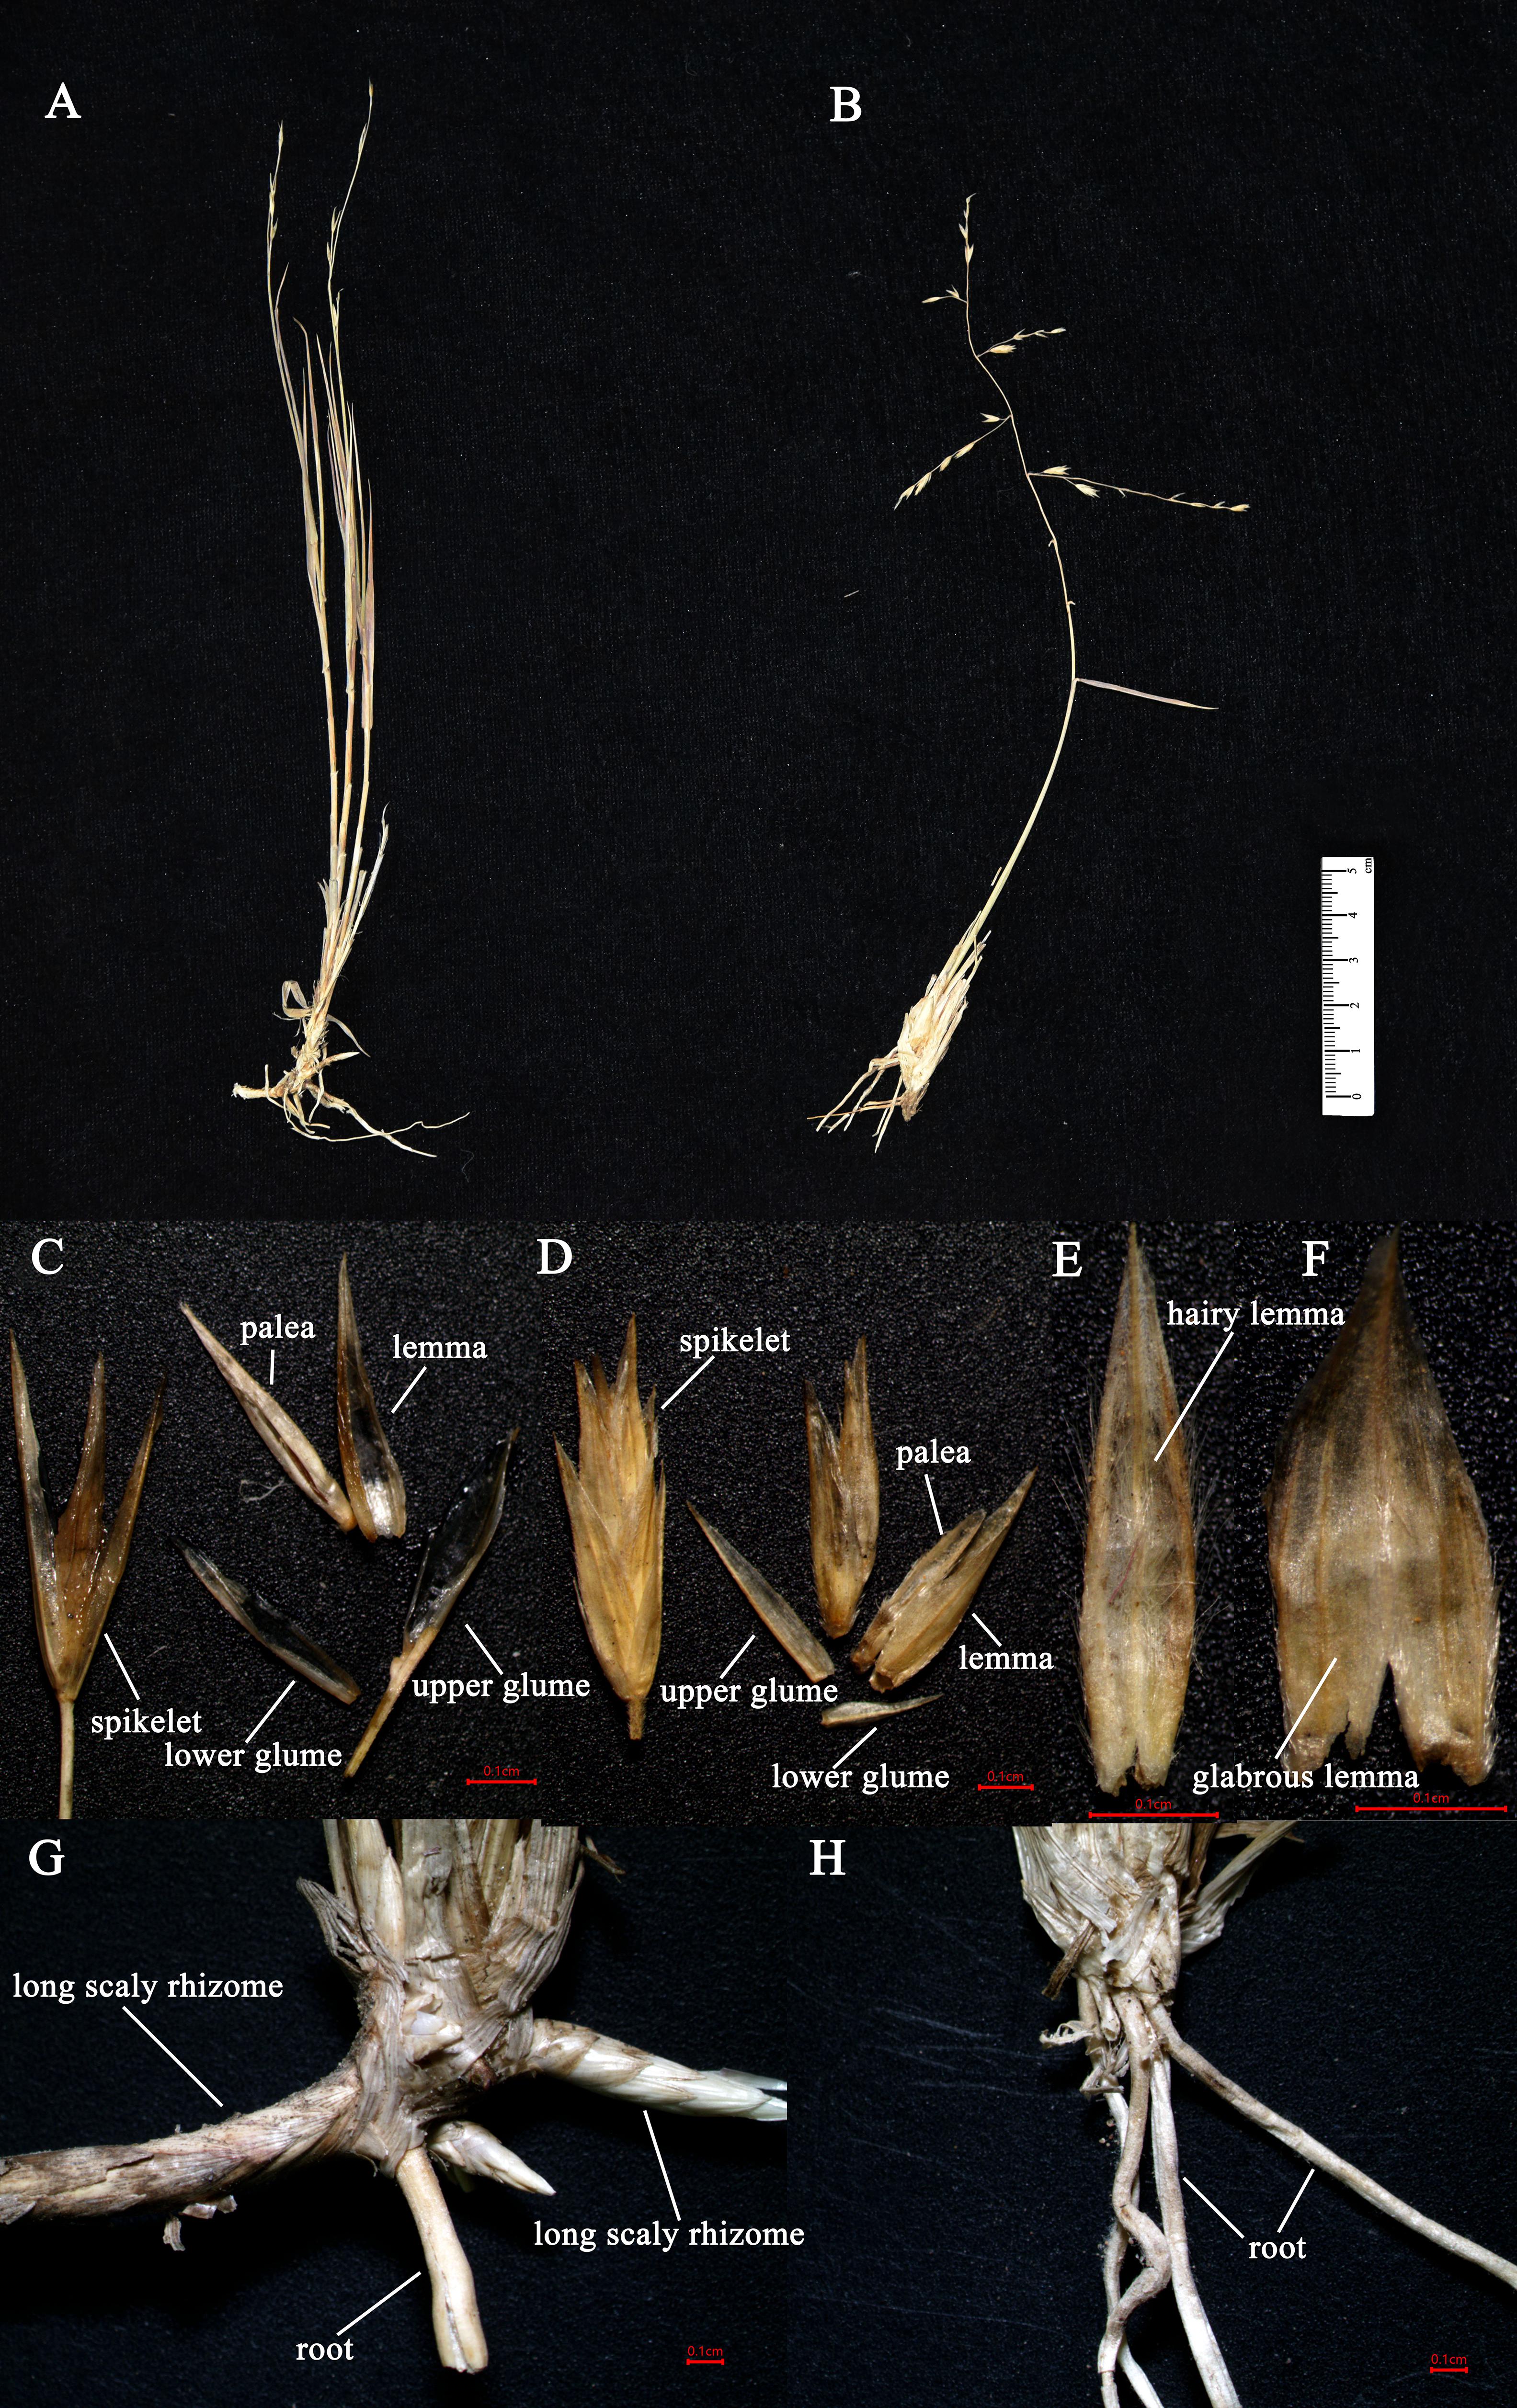
Figure 8. The morphology of O. kokonorica and C. songorica: (A) individual of O. kokonorica; (B) individual of C. songorica; (C) spikelet of O. kokonorica; (D) spikelet of C. songorica; (E) lemma of O. kokonorica; (F) lemma of C. songorica; (G) underground part of O. kokonorica; (H) underground part of C. songorica.
Discussion
Plastome Evolution
Plastomes of land plants have greatly conserved genome size, gene content, gene order, and organization (Palmer, 1991; Bock, 2007). Previous studies have assessed the organization and evolution of Poaceae plastomes (Katayama and Ogihara, 1993; Guisinger et al., 2010). In the present study, the plastomes had high structural similarity among all taxa, including genome size, gene content, and gene order. The plastomes of these taxa had an average genome size of approximately 135 kb. Plastomes of these taxa showed the typical quadripartite structure as previously reported Poaceae species, consisting of an LSC region and an SSC region, and separated by a pair of IR regions (Rousseau-Gueutin et al., 2015; Huang et al., 2017). Each plastome contained the same number of genes (86 PCGs, 38 tRNAs, and eight rRNAs), with a similar GC content and conserved intron positions. There were some unusual features of Poaceae plastomes compared with other angiosperm species, including three gene loss (accD, ycf1, and ycf2) and intron loss from two genes (clpP and rpoC1) (Katayama and Ogihara, 1996; Guisinger et al., 2010). In the present study, accD and ycf1 were not annotated in all taxa. These two genes might be useful molecular markers for phylogenetic analysis of land plants, playing essential roles in leaf development (Kode et al., 2005) and plant viability (Kikuchi et al., 2013). In the case of ycf2 gene loss, different lengths of ycf2 were found, suggesting a progressive degradation. The ycf2 gene retained segments in different lengths, ranging from 105 to 792 bp. The ycf2 gene plays a significant undetermined function in higher plants (Drescher et al., 2000). This gene can provide effective variable sites for reconstructing a generally well-supported phylogeny (Huang et al., 2010). Intron losses of clpP and rpoC1 were detected in all 32 taxa. Gene and intron losses can lead to a decrease in grass plastome size (Zhang J. et al., 2011).
The expansion and contraction of the IR region have been proposed as an important source of length variation in plastomes (Palmer et al., 1987; Aii et al., 1997; Liu et al., 2018). However, in our present study, all taxa exhibited a highly conserved pattern of IR boundaries with only slight structural variations. In Poaceae, ndhH and ndhF are located near opposite ends of the SSC region and can extend into IR regions (Maier et al., 1990; Davis and Soreng, 2010). In the early diverged grasses and closest relatives, ndhH extends 175 to 200 nucleotides into the IR region, while ndhF is confined to the SSC region (Davis and Soreng, 2010). Davis and Soreng (2010) have reported that a part of ndhH and ndhF less than 30 nucleotides migrates into IR regions in PACMAD clade of the Poaceae family. A similar pattern has been observed in Eragrostideae species except for Eragrostis tenellula (Somaratne et al., 2019). In our present study, this phenomenon was observed in most taxa, except for Triodia stipoides, in which ndhF extended 34 nucleotides into the IRb region. The different migrations of gene termini relative to the two SSC-IR junctions are also of significance in terms of the gene overlap (Davis and Soreng, 2010).
As tandemly repetitive DNA sequences, SSRs show high levels of polymorphism. They are abundant across plastomes. As they are reliable and highly polymorphic, they have been increasingly used in phylogenetics, species identification and population genetic studies (Kalia et al., 2011). Similar to the results of other Poaceae species, the predominant type of SSRs is mono-nucleotides, of which A or T repeats account for the majority (Tanaka et al., 2016; Somaratne et al., 2019). The abundance and distribution pattern of penta-nucleotide and hexa-nucleotide repeats were different in the present study. Penta-nucleotide repeats and hexa-nucleotide repeats are the most common types among all the Oryza species (Tripathy et al., 2019), while they were species-specific in the present study. Penta-nucleotide repeats were only found in T. longiceps and T. plurinervata, and hexa-nucleotide repeats (AAATAT) were only detected in Cleistogenes sp. nov. and C. caespitosa var. ramosa. In the present study, penta-nucleotide repeats were distributed in both coding regions and NCRs, while hexa-nucleotide repeats were distributed in NCRs. Repeats identified by Reputer were assigned into four categories, including forward, reverse, complement, and palindromic. Most of the repeats were forward and reverse repeats. All the identified repeats in the present study might be useful in future studies on population genetics of these 32 taxa.
Synonymous codon usage bias represents the differences in the relative frequency of synonymous codons for individual amino acids in protein-coding sequences, and many biological factors, such as gene expression, amino acid composition of protein, and protein structure, are correlated to such bias (Angellotti et al., 2007). Base composition is a balance between G + C nucleotide pairs and mutational pressure, which is a pervasive effect on codon usage (Sueoka, 1962). In the present study, the GC content was highly conserved, suggesting that these plastomes achieved evolutionary equilibrium (Zhang Y. R. et al., 2012). Our findings were consistent with previously reported Poaceae plastomes that all the 32 plastomes had similar codon usage patterns, and the AT-rich bias was the strongest in the third codon position (Somaratne et al., 2019). Preferred codons could be useful in designing degenerate primers, the introduction of point mutation, and evolutionary studies. In the standard genetic codes, there are 64 codons, 61 of which encode 20 different amino acids, and 3 of which are stop codons. All amino acids are encoded by two to six synonymous codons except for Met and Trp. Among the stop codons (UAA, UAG, and UGA), the predominantly used one was UAA (RSCU > 1.63) in the present study. Similar favorite stop codons have been found in some Poaceae species, e.g., Zizania latifolia (Zhang et al., 2016) and Pennisetum glaucum (Raveendar et al., 2019).
Phylogenetically Informative Markers
Plastid regions are widely used in the phylogenetic study of Poaceae (Johnson, 1997; Bouchenak-Khelladi et al., 2008; Rua et al., 2010; Barbera et al., 2020). Previous studies of Cleistogenes and its closely related genera mainly include 11 plastid regions (ndhA, ndhA intron, ndhF, rps16-trnK, rps16 intron, rps3, rpl32-trnL, rps16, rpoC2, ccsA, and matK), while these regions are not effective in resolving the intra- and intergeneric relationships of Cleistogenes. Some of them (e.g., rps16, rpoC2, ndhA intron, and rps16 intron) had a low percentage of parsim-info sites (Figure 4). Therefore, phylogenetic trees based on these regions generated low resolution and different topologies. In the present study, rps3 was the most divergent PCG, while Pi% was only 4.44%. Insufficient sequence polymorphism of the markers hindered their use for phylogenetic study. Therefore, it is important to identify more informative markers to study the intra- and inter-genus phylogeny for Cleistogenes.
In Poaceae plastomes, PCGs and IR regions are more conserved at the sequence divergence level compared with NCRs and single-copy (SC) regions, respectively (Bortiri et al., 2008; Qiu et al., 2019; Somaratne et al., 2019). In the present study, the whole plastome comparative analysis showed that IR regions were more conserved compared with the SC regions, and comparison of the percentage of parsim-info sites confirmed that NCRs had higher Pi% than PCGs. NCRs evolve via accumulating nucleotide substitutions and microstructural mutations (insertions, deletions, and inversions) (Yamane et al., 2006). Currently, NCRs of plastomes have become an important tool in studying phylogenetic relationships in Poaceae (Liu et al., 2008; Zhang Y. X. et al., 2012; Oliveira et al., 2014). In the present study, five regions displayed remarkably higher Pi% (>5%), including four regions (trnS-UGA-psbZ, trnQ-UUG-psbK, trnD-GUC-psbM, trnT-GGU-trnE-UUC) located in the LSC region and one region (rpl32-trnL-UAG) located in the SSC region. These regions might be potential molecular markers in the phylogenetic analysis of Cleistogenes and its related genera. Among the five phylogenetically informative markers, two regions (rpl32-trnL-UAG and trnT-trnE) have been reported as highly variable markers to study phylogenetic relationships of Poaceae species (Rousseau-Gueutin et al., 2015; Qiu et al., 2019).
Whether Orininae Should Be Established?
The monophyly of the Ael-Cle-Ori-Trio clade has been strongly supported in previous studies (Soreng et al., 2015, 2017). However, there are some incongruences about the phylogenetic relationships among these four genera (Chen et al., 2006; Shan et al., 2010; Soreng et al., 2015, 2017; Peterson et al., 2016). In the present study, the analysis of complete plastomes strongly supported the highly congruent phylogenetic topology for Ael-Cle-Ori-Trio clade (Figure 6). Aeluropus species including A. lagopoides and A. sinensis form a monophyletic clade, which is located at the basal position in the tree. The Cle-Ori-Trio clade is detected with a high bootstrap value. Cleistogenes is strongly supported as a monophyletic group and sister to the clade composed of Orinus and Triodia. The position of Cleistogenes recovered here is incongruent with other studies. The placement of Cleistogenes is not resolved in the plastid tree based on seven plastid regions. However, Cleistogenes is sister to Orinus in the ITS tree (Peterson et al., 2010) and combined tree (Peterson et al., 2010, 2016). Subtribe Orininae has been newly proposed in a phylogenetic analysis of 213 species based on seven plastid regions and ITS (Peterson et al., 2016). The present study showed that Cleistogenes is sister to the clade composed of Orinus and Triodia, which indeed did not support the establishment of Orininae (Peterson et al., 2016). These three genera are different in morphology. Inflorescences of Cleistogenes and Orinus are sparse panicle (Chen et al., 2006). Inflorescence of Triodia is usually a panicle of solitary spikelets, and sometimes it is a spike or raceme (Lazarides, 1997). Cleistogenes is a genus of Eurasian flowering plants in the grass family. It is remarkable for cleistogamous spikelets hidden in the upper leaf sheaths (Chen et al., 2006), while cleistogamous spikelets are not found in Orinus and Triodia. Cleistogamy flowering assures plant reproduction under variable environmental conditions, and its development is known to be affected by drought, chilling, salinity, and light (Morinaga et al., 2008). Orinus is a genus of Asian plants in the grass family (Chen et al., 2006). Triodia is a large genus of hummock-forming grass endemic to Australia (Lazarides, 1997; Gamage et al., 2012). Eurasia and Australia have been separated by oceans at ca. 90 Ma (Davis et al., 2002), earlier than the origin of Cle-Ori-Trio clade. Therefore, long-distance dispersal must have played a dominant role in the transoceanic distribution of this clade. The split between these three genera go back to 14.01 Ma (Miocene). The Malay Archipelago probably facilitated biotic dispersal between Asia and Australia during the Miocene (Welzen et al., 2005). The habitat conditions of Orinus and Triodia were similar. They all distribute in arid regions on sandy or stony soils. Morphologically, leaf blades of Orinus and Triodia species are linear to involute and rigidly straight. Leaf involution is often hypothesized to confer survival value in xeric habitats by reducing stomatal and cuticular conductance and postponing desiccation. We compared the morphology of O. kokonorica and C. songorica (Figure 8). Lemmas of Cleistogenes are almost glabrous. Lemmas of Orinus are hairy all over or only on margins. Lemmas of Triodia species are entire or minutely to deeply 2- or 3-lobed and hairy. Trichomes (also called leaf hairs) are specialized cell types in the epidermal layer, that enhance the protection of plant tissues from the external factors both mechanically and chemically (Hauser, 2014). Long scaly rhizomes are recognized as an important character of Orinus (Chen, 1990; Chen et al., 2006). The scaly rhizomes allow the plants to survive unfavorable dry spells or seasons in dormancy and to re-sprout from the axils of the scale-like leaves when conditions improved. Orinus-Triodia and Cleistogenes may represent two different ways to adapt to extreme environments. Meanwhile, there are some similar micromorphological characters recognized in Orinus and Triodia. Papillae occurring on long cells and dumbbell-shaped silica cells are observed as two similar lemma micromorphological characters in Triodia and Orinus, while papillae and silica cells are absent in Cleistogenes taxa (Liu et al., 2010). From the above-mentioned results, some conflicts existed between plastome- and ITS-based trees. These conflicts could mostly result from rapid divergence, hybridization and incomplete lineage sorting. The Cle-Ori-Trio clade was estimated to have experienced rapid divergence in a short period (12.54 to 14.01 Ma), which could be an obstacle in resolving phylogenetic relationships within the clade. Natural hybridization and incomplete lineage sorting are very common in numerous plants (Ellstrand et al., 1996; Maddison, 1997). Hybridization would lead to alleles with mixed histories, therefore resulting in high character conflict (Folk et al., 2016). Incomplete lineage sorting may be defined as the failure for two or more allelic lineages to coalesce within a population (Degnan and Rosenberg, 2009). Hybridization and incomplete lineage sorting can lead to discord in phylogenetic analyses (Kubatko and Degnan, 2007). In conclusion, the establishment of Orininae was not supported by plastomes data.
Phylogenetic Relationship Within Cleistogenes
Cleistogenes is a monophyletic genus in the tree based on complete plastomes, which reinforce the previous study using ITS and plastid sequences (Peterson et al., 2016). Cleistogenes began to diversify in Pliocene or Pleistocene (1.34–5.2 Ma). It is suggested that there is a climate shift in the Pliocene across large area of East Asia, as well as an even colder and drier Quaternary compared with the late Pliocene (Wang et al., 2019). As a kind of cool- and dry-adapted grass, Cleistogenes was probably diversified caused by climate change. The phylogenetic relationship among Cleistogenes taxa have been rarely studied. The lack of a well-supported intra-generic phylogenetic framework has posed a problem for the classification of Cleistogenes. Phylogenetic relationships within Cleistogenes recovered here are not congruent with the previous study. It is shown that C. songorica and C. polyphylla are early diverging groups in the phylogenetic analysis of Cynodonteae based on seven plastid regions and ITS regions (Peterson et al., 2016). In the present study, C. songorica and C. squarrosa are resolved as a highly supported successive sister group to the remaining 10 taxa. It is reported that C. squarrosa is a dominant grass species in grasslands (Wang et al., 2000; Liang et al., 2002). Dense foliage is on the low mounds of the culm, and upper internodes of the dried culm are curling and elongate. Awned spikelets are always with few flowers. These above-mentioned characteristics distinguish it from the remaining taxa of Cleistogenes (Chen et al., 2006). C. songorica is a dominant species of desert grassland, and it has excellent drought tolerance (Zhang J. et al., 2011; Zhang et al., 2014; Muvunyi et al., 2018). This species has dense tufts of gray-green leaves. Spikelets are purple and awnless, usually with broader lemmas. These two species including C. songorica and C. squarrosa can adapt to dry environment. In the complete plastome phylogenetic tree, C. caespitosa var. ramosa was sister to Cleistogenes sp. nov., while C. caespitosa var. caespitosa clusters with the other seven Cleistogenes taxa. The difference between this variety and its original variety was that the upper stem was much branched, and the panicle was extremely narrow. Similar morphological characters of C. caespitosa var. ramose and C. caespitosa var. caespitosa could be attributed to parallel evolution. Palea of Cleistogenes sp. nov. significantly shorter compared with the other Cleistogenes taxa. The clade composed of C. hackelii var. hackelii, C. polyphylla, C. festucacea, C. hancei, C. hackelii var. nakaii, C. chinensis, C. caespitosa var. caespitosa, and C. gracilis is found with short internal branch length. The short branches most likely represent a case of rapid radiation with lineage-specific heterogeneity in rates of substitution. Cleistogenes was estimated to have experienced rapid divergence within a short period, which could be a main reason for short internal branches between these 10 Cleistogenes taxa in phylogenetic tree. Lemma micromorphological characters of C. caespitosa var. caespitosa, C. chinensis, and C. hackelii var. hackelii are highly conserved (Liu et al., 2010). Straight outline of intercostal long cells, semi-circle-shaped cork cell, triangular-shaped stomata subsidiary cell, and papillate-based macro hair have been observed in C. caespitosa var. caespitosa, C. chinensis, and C. hackelii var. hackelii. In the present study. the phylogeny of complete plastomes revealed the intra-generic framework of Cleistogenes. However, future studies with a larger sample size at the population level or the next-generation sequencing approach may help resolve their phylogenetic relationships.
Conclusion
Collectively, we sequenced, assembled, and annotated 15 plastomes of Cleistogenes and its closely related genera. Plastomes of 12 Cleistogenes taxa (including 8 species and 4 varieties), 15 Triodia species, one Orinus species, two Tripogon species, and two Aeluropus species were included in the present study. All the plastomes were highly conserved in plastome structure, gene content, gene order, and IR boundaries. The type and number of repeat sequences and SSRs were calculated and could be used in studies of phylogenetics, species identification, and population genetics. By examining variable sites and parsim-info sites, five highly variable regions were identified, which could be used for phylogenetics, population genetics, and biogeography of Cleistogenes and its closely related genera. Phylogenetic analysis revealed that Cleistogenes is sister to a clade composed of Orinus and Triodia, whereas recently proposed Orininae (Cleistogenes and Orinus) is not supported in the present study. It is suggested that C. squarrosa and C. songorica are the successive early diverging groups. The other 10 taxa are divided into two groups. Cleistogenes sp. nov. and C. caespitosa var. ramosa form a monophyletic group sister to the other eight Cleistogenes taxa. Our current findings provided valuable insights into the phylogenetic study of grass species. Moreover, more nuclear data will be necessary for further study on the intra- and inter-generic relationships of Cleistogenes.
Data Availability Statement
The datasets presented in this study can be found in online repositories. The names of the repository/repositories and accession number(s) can be found below: https://www.ncbi.nlm. nih.gov/genbank/, MW194080; https://www.ncbi.nlm.nih.gov/genbank/, MW194081; https://www.ncbi.nlm.nih.gov/genbank/, MW194082; https://www.ncbi.nlm.nih.gov/genbank/, MW1940 83; https://www.ncbi.nlm.nih.gov/genbank/, MW194084; https://www.ncbi.nlm.nih.gov/genbank/, MW194085; https://www.ncbi. nlm.nih.gov/genbank/, MW194086; https://www.ncbi.nlm.nih. gov/genbank/, MW194087; https://www.ncbi.nlm.nih.gov/genbank/, MW194088; https://www.ncbi.nlm.nih.gov/genbank/, MW194089; https://www.ncbi.nlm.nih.gov/genbank/, MW1940 90; https://www.ncbi.nlm.nih.gov/genbank/, MW194091; https://www.ncbi.nlm.nih.gov/genbank/, MW194092; https://www.ncbi. nlm.nih.gov/genbank/, MW194093; and https://www.ncbi.nlm.nih. gov/genbank/, MW194094.
Author Contributions
X-JZ, X-JQ, and S-JF designed the experiments. RW and KL carried out the experiment and analyzed the data. RW wrote the first draft of the manuscript. X-JZ, W-LC, X-JQ, and S-JF supervised and completed the writing. All authors collected the samples, revised, and approved the final manuscript.
Funding
This work was supported by the National Natural Science Foundation of China (31170173 and 31470298).
Conflict of Interest
The authors declare that the research was conducted in the absence of any commercial or financial relationships that could be construed as a potential conflict of interest.
Supplementary Material
The Supplementary Material for this article can be found online at: https://www.frontiersin.org/articles/10.3389/fpls.2021.638597/full#supplementary-material
Supplementary Figure 1 | The ML phylogeny of Cleistogenes and its closely related genera based on protein-coding genes.
Supplementary Figure 2 | The BI phylogeny of Cleistogenes and its closely related genera based on protein-coding genes.
Supplementary Figure 3 | The ML phylogeny of Cleistogenes and its closely related genera based on non-coding regions.
Supplementary Figure 4 | The BI phylogeny of Cleistogenes and its closely related genera based on non-coding regions.
Supplementary Figure 5 | The ML phylogeny of 78 chloridoid grasses based on complete plastomes.
Supplementary Figure 6 | The BI phylogeny of 78 chloridoid grasses based on complete plastomes.
Supplementary Table 1 | List of genes annotated in 12 Cleistogenes plastomes.
Supplementary Table 2 | Types of SSRs.
Supplementary Table 3 | Results of codon usage analysis.
Supplementary Table 4 | Percentage of each amino acid.
Supplementary Table 5 | Estimated divergence time for the Ael-Cle-Ori-Tri clade.
Footnotes
- ^ http://www.theplantlist.org/
- ^ http://bibiserv.techfak.uni-bielefeld.de/reputer/
- ^ http://sourceforge.net/projects/codonw/
References
Aii, J., Kishima, Y., Mikami, T., and Adachi, T. (1997). Expansion of the IR in the chloroplast genomes of buckwheat species is due to incorporation of an SSC sequence that could be mediated by an inversion. Curr. Genet. 31, 276–279. doi: 10.1007/s002940050206
Alexandros, S. (2014). RAxML version 8: a tool for phylogenetic analysis and post-analysis of large phylogenies. Bioinformatics 30, 1312–1313. doi: 10.1093/bioinformatics/btu033
Anderson, B. M., Thiele, K. R., Grierson, P. F., Krauss, S. L., Nevill, P. G., Small, I. D., et al. (2019). Recent range expansion in Australian hummock grasses (Triodia) inferred using genotyping-by-sequencing. AoB Plants 11:lz017.
Angellotti, M. C., Bhuiyan, S. B., Chen, G., and Wan, X. F. (2007). CodonO: codon usage bias analysis within and across genomes. Nucleic Acids Res. 35(Suppl._2), W132–W136.
Bankevich, A., Nurk, S., Antipov, D., Gurevich, A. A., Dvorkin, M., Kulikov, A. S., et al. (2012). SPAdes: a new genome assembly algorithm and its applications to single-cell sequencing. J. Comput. Biol. 19, 455–477. doi: 10.1089/cmb.2012.0021
Barbera, P., Soreng, R. J., Peterson, P. M., Romaschenko, K., Quintanar, A., and Aedo, C. (2020). Molecular phylogenetic analysis resolves Trisetum (Poaceae: Pooideae: Koeleriinae) polyphyletic: evidence for a new genus, Sibirotrisetum and resurrection of Acrospelion. J. Syst Evol. 58, 517–526. doi: 10.1111/jse.12523
Beier, S., Thiel, T., Münch, T., Scholz, U., and Mascher, M. (2017). MISA-web: a web server for microsatellite prediction. Bioinformatics 33, 2583–2585. doi: 10.1093/bioinformatics/btx198
Bock, R. (2007). “Structure, function, and inheritance of plastid genomes,” in Cell and Molecular Biology of Plastids, ed. R. Bock (Berlin: Springer), 29–63. doi: 10.1007/4735_2007_0223
Bortiri, E., Coleman-Derr, D., Lazo, G. R., Anderson, O. D., and Gu, Y. Q. (2008). The complete chloroplast genome sequence of Brachypodium distachyon: sequence comparison and phylogenetic analysis of eight grass plastomes. BMC Res. Notes 1:61. doi: 10.1186/1756-0500-1-61
Bouchenak-Khelladi, Y., Salamin, N., Savolainen, V., Forest, F., and Hodkinson, T. R. (2008). Large multi-gene phylogenetic trees of the grasses (Poaceae): progress towards complete tribal and generic level sampling. Mol. Phylogen. Evol. 47, 488–505. doi: 10.1016/j.ympev.2008.01.035
Burke, S. V., Wysocki, W. P., Zuloaga, F. O., Craine, J. M., Pires, J. C., Edger, P. P., et al. (2016). Evolutionary relationships in Panicoid grasses based on plastome phylogenomics (Panicoideae; Poaceae). BMC Plant Biol. 16, 140. doi: 10.1186/s12870-016-0823-3
Chen, S. L. (1990). “Tribe Eragrostideae Stapf,” in Flora Reipublicae Popularis Sinicae, ed. S. L. Chen (Beijing: Science Press), 8–67.
Chen, S. L., Li, D. Z., Zhu, G. H., Wu, Z. L., Lu, S. L., and Liu, L. (2006). “Poaceae,” in Flora of China, eds Z. Y. Wu, P. H. Raven, and D. Y. Hong (Beijing: Science Press), 461–464.
Clayton, W. D., Vorontsova, M. S., Harman, K. T., and Williamson, H. (2006). GrassBase – The Online World Grass Flora [Online]. Kew: The Board of Trustees, Royal Botanic Gardens.
Curci, P. L., De Paola, D., and Sonnante, G. (2016). The chloroplast genome as a tool for exploring genetic relationships among globe artichoke, leafy cardoons and wild artichokes. Acta Hortic. 1147, 61–68. doi: 10.17660/actahortic.2016.1147.9
Darriba, D., Taboada, G. L., Doallo, R., and Posada, D. (2012). jModelTest 2: more models, new heuristics and parallel computing. Nat. Methods 9, 772–772. doi: 10.1038/nmeth.2109
Davis, C. C., Bell, C. D., Mathews, S., and Donoghue, M. (2002). Laurasian migration explains Gondwanan disjunctions: evidence from Malpighiaceae. Proc. Natl. Acad. Sci. U.S.A. 99, 6833–6837. doi: 10.1073/pnas.102175899
Davis, J. I., and Soreng, R. J. (2010). Migration of endpoints of two genes relative to boundaries between regions of the plastid genome in the grass family (Poaceae). Am. J. Bot. 97, 874–892. doi: 10.3732/ajb.0900228
Degnan, J. H., and Rosenberg, N. A. (2009). Gene tree discordance, phylogenetic inference and the multispecies coalescent. Trends Ecol. Evol. 24, 332–340. doi: 10.1016/j.tree.2009.01.009
Dong, W. P., Liu, J., Yu, J., Wang, L., and Zhou, S. L. (2012). Highly variable chloroplast markers for evaluating plant phylogeny at low taxonomic levels and for DNA barcoding. PLoS One 7:e35071. doi: 10.1371/journal.pone.0035071
Doyle, J., and Doyle, J. L. (1987). Genomic plant DNA preparation from fresh tissue-CTAB method. Phytochem. Bull 19, 11–15.
Drescher, A., Ruf, S., Calsa, T. Jr., Carrer, H., and Bock, R. (2000). The two largest chloroplast genome-encoded open reading frames of higher plants are essential genes. Plant J. 22, 97–104. doi: 10.1046/j.1365-313x.2000.00722.x
Drummond, A. J., Suchard, M. A., Xie, D., and Rambaut, A. (2012). Bayesian phylogenetics with BEAUti and the BEAST 1.7. Mol. Biol. Evol. 29, 1969–1973. doi: 10.1093/molbev/mss075
Duvall, M. R., Burke, S. V., and Clark, D. C. (2020). Plastome phylogenomics of Poaceae: alternate topologies depend on alignment gaps. Bot. J. Linn. Soc. 192, 9–20. doi: 10.1093/botlinnean/boz060
Duvall, M. R., Fisher, A. E., Columbus, J. T., Ingram, A. L., Wysocki, W. P., Burke, S. V., et al. (2016). Phylogenomics and plastome evolution of the chloridoid grasses (Chloridoideae: Poaceae). Int. J. Plant Sci. 177, 235–246. doi: 10.1086/684526
Ellstrand, N. C., Whitkus, R., and Rieseberg, L. H. (1996). Distribution of spontaneous plant hybrids. Proc. Natl. Acad. Sci. U.S.A. 93, 5090–5093. doi: 10.1073/pnas.93.10.5090
Folk, R. A., Mandel, J. R., and Freudenstein, J. V. (2016). Ancestral gene flow and parallel organellar genome capture result in extreme phylogenomic discord in a lineage of angiosperms. Syst. Biol. 66, 320–337.
Frazer, K. A., Pachter, L., Poliakov, A., Rubin, E. M., and Dubchak, I. (2004). VISTA: computational tools for comparative genomics. Nucleic Acids Res. 32, W273–W279.
Gamage, H. K., Mondal, S., Wallis, L. A., Memmott, P., Martin, D., Wright, B. R., et al. (2012). Indigenous and modern biomaterials derived from Triodia (spinifex) grasslands in Australia. Aust. J. Bot. 60, 114–127. doi: 10.1071/bt11285
Gao, Y. Z., Wang, S. P., Han, X. G., Patton, B. D., and Nyren, P. E. (2005). Competition between Artemisia frigida and Cleistogenes squarrosa under different clipping intensities in replacement series mixtures at different nitrogen levels. Grass Forage Sci. 60, 119–127. doi: 10.1111/j.1365-2494.2005.00458.x
Guisinger, M. M., Chumley, T. W., Kuehl, J. V., Boore, J. L., and Jansen, R. K. (2010). Implications of the plastid genome sequence of Typha (Typhaceae, Poales) for understanding genome evolution in Poaceae. J. Mol. Evol. 70, 149–166. doi: 10.1007/s00239-009-9317-3
Guo, C., Guo, Z. H., and Li, D. Z. (2019). Phylogenomic analyses reveal intractable evolutionary history of a temperate bamboo genus (Poaceae: Bambusoideae). Plant Divers. 41, 213–219. doi: 10.1016/j.pld.2019.05.003
Hao, K.-S. (1938). Pflanzengeographische Studien über den Kokonor-See und über das angrenzende Gebiet. Bot. Jahrb. Syst. 68, 515–668.
Hardion, L., Verlaque, R., Kaymak, E., Vila, B., Haan-Archipoff, G., Martinez Martin, M., et al. (2021). Plastome sequencing of a 167-year-old herbarium specimen and classical morphology resolve the systematics of two potentially extinct grass species. Bot. J. Linn. Soc. 195, 115–123. doi: 10.1093/botlinnean/boaa065
Hauser, M.-T. (2014). Molecular basis of natural variation and environmental control of trichome patterning. Front. Plant. Sci. 5:320. doi: 10.3389/fpls.2014.00320
Huang, J. L., Sun, G. L., and Zhang, D. M. (2010). Molecular evolution and phylogeny of the angiosperm ycf2 gene. J. Syst. Evol. 48, 240–248. doi: 10.1111/j.1759-6831.2010.00080.x
Huang, Y. Y., Cho, S. T., Haryono, M., and Kuo, C. H. (2017). Complete chloroplast genome sequence of common bermudagrass (Cynodon dactylon (L.) Pers.) and comparative analysis within the family Poaceae. PLoS One 12:e0179055. doi: 10.1371/journal.pone.0179055
Jansen, R. K., and Ruhlman, T. A. (2012). “Plastid genomes of seed plants,” in Genomics of Chloroplasts and Mitochondria, eds R. Bock and V. Knoop (Dordrecht: Springer), 103–126. doi: 10.1007/978-94-007-2920-9_5
Johnson, H. J. L. (1997). Systematics of Eleusine Gaertn (Poaceae: Chloridoideae): chloroplast DNA and total evidence. Ann. Mo. Bot. Gard. 84, 841–847. doi: 10.2307/2992029
Kalia, R. K., Rai, M. K., Kalia, S., Singh, R., and Dhawan, A. K. (2011). Microsatellite markers: an overview of the recent progress in plants. Euphytica 177, 309–334. doi: 10.1007/s10681-010-0286-9
Katayama, H., and Ogihara, Y. (1993). Structural alterations of the chloroplast genome found in grasses are not common in monocots. Curr. Genet. 23, 160–165. doi: 10.1007/bf00352016
Katayama, H., and Ogihara, Y. (1996). Phylogenetic affinities of the grasses to other monocots as revealed by molecular analysis of chloroplast DNA. Curr. Genet. 29, 572–581. doi: 10.1007/s002940050087
Katoh, K., and Standley, D. M. (2013). MAFFT multiple sequence alignment software version 7: improvements in performance and usability. Mol. Biol. Evol. 30, 772–780. doi: 10.1093/molbev/mst010
Kikuchi, S., Bedard, J., Hirano, M., Hirabayashi, Y., Oishi, M., Imai, M., et al. (2013). Uncovering the protein translocon at the chloroplast inner envelope membrane. Science 339, 571–574. doi: 10.1126/science.1229262
Kode, V., Mudd, E. A., Iamtham, S., and Day, A. (2005). The tobacco plastid accD gene is essential and is required for leaf development. Plant J. 44, 237–244. doi: 10.1111/j.1365-313x.2005.02533.x
Kubatko, L. S., and Degnan, J. H. (2007). Inconsistency of phylogenetic estimates from concatenated data under coalescence. Syst. Biol. 56, 17–24. doi: 10.1080/10635150601146041
Kurtz, S., Choudhuri, J. V., Ohlebusch, E., Schleiermacher, C., Stoye, J., and Giegerich, R. (2001). REPuter: the manifold applications of repeat analysis on a genomic scale. Nucleic Acids Res. 29, 4633–4642. doi: 10.1093/nar/29.22.4633
Lancien, M., Lea, P. J., and Azevedo, R. A. (2006). “Amino acid synthesis in plastids,” in The Structure and Funciton of Plastids, eds R. R. Wise and J. K. Hoober (Dordrecht: Springer), 355–385. doi: 10.1007/1-4020-4061-x_18
Lazarides, M. (1997). A revision of Triodia including Plectrachne (Poaceae, Eragrostideae, Triodiinae). Aust. Syst. Bot. 10, 381–489. doi: 10.1071/sb96012
Leister, D. (2003). Chloroplast research in the genomic age. Trends Genet. 19, 47–56. doi: 10.1016/s0168-9525(02)00003-3
Leister, D., and Kleine, T. (2008). Towards a comprehensive catalog of chloroplast proteins and their interactions. Cell Res. 18, 1081–1083. doi: 10.1038/cr.2008.297
Liang, C., Michalk, D. L., and Millar, G. D. (2002). The ecology and growth patterns of Cleistogenes species in degraded grasslands of eastern Inner Mongolia, China. J. Appl. Ecol. 39, 584–594. doi: 10.1046/j.1365-2664.2002.00735.x
Liu, J. X., Zhou, M. Y., Yang, G. Q., Zhang, Y. X., and Li, D. Z. (2020). ddRAD analyses reveal a credible phylogenetic relationship of the four main genera of Bambusa-Dendrocalamus-Gigantochloa complex (Poaceae: Bambusoideae). Mol. Phylogen. Evol. 146:106758. doi: 10.1016/j.ympev.2020.106758
Liu, L. X., Wang, Y. W., He, P. Z., Li, P., and Fu, C. X. (2018). Chloroplast genome analyses and genomic resource development for epilithic sister genera Oresitrophe and Mukdenia (Saxifragaceae), using genome skimming data. BMC Genomics 19:235. doi: 10.1186/s12864-018-4633-x
Liu, Q., Zhang, D. X., and Peterson, P. M. (2010). Lemma micromorphological characters in the Chloridoideae (Poaceae) optimized on a molecular phylogeny. S. Afr. J. Bot. 76, 196–209. doi: 10.1016/j.sajb.2009.10.006
Liu, Z., Chen, Z., Pan, J., Li, X., Su, M., Wang, L., et al. (2008). Phylogenetic relationships in Leymus (Poaceae: Triticeae) revealed by the nuclear ribosomal internal transcribed spacer and chloroplast trnL-F sequences. Mol. Phylogenet. Evol. 46, 278–289. doi: 10.1016/j.ympev.2007.10.009
Maier, R., Döry, I., Igloi, G., and Kössel, H. (1990). The ndhH genes of gramminean plastomes are linked with the junctions between small single copy and inverted repeat regions. Curr. Genet. 18, 245–250. doi: 10.1007/bf00318388
Morinaga, S. I., Nagano, A. J., Miyazaki, S., Kubo, M., Demura, T., Fukuda, H., et al. (2008). Ecogenomics of cleistogamous and chasmogamous flowering: genome-wide gene expression patterns from cross-species microarray analysis in Cardamine kokaiensis (Brassicaceae). J. Ecol. 96, 1086–1097. doi: 10.1111/j.1365-2745.2008.01392.x
Muvunyi, B. P., Yan, Q., Wu, F., Min, X. Y., Yan, Z. Z., Kanzana, G., et al. (2018). Mining Late Embryogenesis Abundant (LEA) family genes in Cleistogenes songorica, a xerophyte perennial desert plant. Int. J. Mol. Sci. 19:3430. doi: 10.3390/ijms19113430
Niu, X. L., and Nan, Z. B. (2017). Roots of Cleistogenes songorica improved soil aggregate cohesion and enhance soil water erosion resistance in rainfall simulation experiments. Water Air Soil Pollut. 228:109.
Oliveira, R. P., Clark, L. G., Schnadelbach, A. S., Monteiro, S. H., Borba, E. L., Longhi-Wagner, H. M., et al. (2014). A molecular phylogeny of Raddia and its allies within the tribe Olyreae (Poaceae, Bambusoideae) based on noncoding plastid and nuclear spacers. Mol. Phylogen. Evol. 78, 105–117. doi: 10.1016/j.ympev.2014.04.012
Orton, L. M., Burke, S. V., and Duvall, M. R. (2019). Plastome phylogenomics and characterization of rare genomic changes as taxonomic markers in plastome groups 1 and 2 Poeae (Pooideae; Poaceae). PeerJ 7:e6959. doi: 10.7717/peerj.6959
Packer, J. (1960). A note on the nomenclature of the genus Cleistogenes Y. Keng (Gramineae). Bot. Not. 113, 289–294.
Palmer, J. D. (1991). “Plastid chromosomes: structure and evolution,” in The Molecular Biology of Plastids, eds L. Bogorad and I. K. Vasil (San Diego, CA: Academic Press), 5–53. doi: 10.1016/b978-0-12-715007-9.50009-8
Palmer, J. D., Nugent, J. M., and Herbon, L. A. (1987). Unusual structure of geranium chloroplast DNA: a triple-sized inverted repeat, extensive gene duplications, multiple inversions, and two repeat families. Proc. Natl. Acad. Sci. U.S.A. 84, 769–773. doi: 10.1073/pnas.84.3.769
Peterson, P., Romaschenko, K., and Herrera Arrieta, Y. (2016). A molecular phylogeny and classification of the Cynodonteae (Poaceae: Chloridoideae) with four new genera: Orthacanthus, Triplasiella, Tripogonella, and Zaqiqah; three new subtribes: Dactylocteniinae, Orininae, and Zaqiqahinae; and a subgeneric classification of Distichlis. Taxon 65, 1263–1287. doi: 10.12705/656.4
Peterson, P. M., Romaschenko, K., and Herrera Arrieta, Y. (2017). Four new subtribes: Allolepiinae, Jouveinae, Kaliniinae, and Sohnsiinae in the Cynodonteae (Poaceae: Chloridoideae). Phytoneuron 44, 1–9. doi: 10.3897/phytokeys.93.21079
Peterson, P. M., Romaschenko, K., and Johnson, G. (2010). A classification of the Chloridoideae (Poaceae) based on multi-gene phylogenetic trees. Mol. Phylogen. Evol. 55, 580–598. doi: 10.1016/j.ympev.2010.01.018
Qiu, Y., Hirsch, C. D., Yang, Y., and Watkins, E. (2019). Towards improved molecular identification tools in fine fescue (Festuca L., Poaceae) turfgrasses: nuclear genome size, ploidy, and chloroplast genome sequencing. Front. Genet. 10:1223. doi: 10.3389/fgene.2019.01223
Qu, X. J., Fan, S. J., Wicke, S., and Yi, T. S. (2019a). Plastome reduction in the only parasitic gymnosperm Parasitaxus is due to losses of photosynthesis but not housekeeping genes and apparently involves the secondary gain of a large inverted repeat. Genome Biol. Evol. 11, 2789–2796. doi: 10.1093/gbe/evz187
Qu, X. J., Michael, J. M., Li, D. Z., and Yi, T. S. (2019b). PGA: a software package for rapid, accurate, and flexible batch annotation of plastomes. Plant Methods 15:50.
Raveendar, S., Lee, G. A., Lee, K. J., Shin, M. J., Lee, J. R., Lee, S. Y., et al. (2019). The complete chloroplast genome of pearl millet (Pennisetum glaucum (L.) R. Br.) and comparative analysis within the family Poaceae. Cereal Res. Commun. 47, 1–10. doi: 10.1556/0806.46.2018.064
Redmann, R. E., Yin, L. J., and Wang, P. (1995). Photosynthetic pathway types in grassland plant species from Northeast China. Photosynthetica 31, 251–255.
Rosenberg, M. S., Sankar, S., and Sudhir, K. (2003). Patterns of transitional mutation biases within and among mammalian genomes. Mol. Biol. Evol. 20, 988–993. doi: 10.1093/molbev/msg113
Rousseau-Gueutin, M., Bellot, S., Martin, G. E., Boutte, J., Chelaifa, H., Lima, O., et al. (2015). The chloroplast genome of the hexaploid Spartina maritima (Poaceae, Chloridoideae): Comparative analyses and molecular dating. Mol. Phylogen. Evol. 93, 5–16. doi: 10.1016/j.ympev.2015.06.013
Rua, G. H., Speranza, P. R., Vaio, M., and Arakaki, M. (2010). A phylogenetic analysis of the genus Paspalum (Poaceae) based on cpDNA and morphology. Plant Syst. Evol. 288, 227–243. doi: 10.1007/s00606-010-0327-9
Saarela, J. M., and Graham, S. W. (2010). Inference of phylogenetic relationships among the subfamilies of grasses (Poaceae: Poales) using meso-scale exemplar-based sampling of the plastid genome. Botany 88, 65–84. doi: 10.1139/b09-093
Sanderson, M. (2002). Estimating absolute rates of molecular evolution and divergence times: a penalized likelihood approach. Mol. Biol. Evol. 19, 101–109. doi: 10.1093/oxfordjournals.molbev.a003974
Shan, G. L., Zhu, X., and Ning, F. (2010). The changes of community structure and species diversity in different succession stage in typical steppe. J. Arid Land Resour. Environ. 24, 163–169.
Sharp, P. M., Tuohy, T. M. F., and Mosurski, K. R. (1986). Codon usage in yeast: cluster analysis clearly differentiates highly and lowly expressed genes. Nucleic Acids Res. 14, 5125–5143. doi: 10.1093/nar/14.13.5125
Shi, J. G. (2011). The growth rhythm and meteorological index of phonological phase of three kinds of forage grass in the typical steppe regions. Pratacult. Sci. 28, 1855–1858.
Smith, S. A., and O’Meara, B. C. (2012). treePL: divergence time estimation using penalized likelihood for large phylogenies. Bioinformatics 28, 2689–2690. doi: 10.1093/bioinformatics/bts492
Somaratne, Y., Guan, D. L., Abbood, N. N., Zhao, L., Wang, W. Q., and Xu, S. Q. (2019). Comparison of the complete Eragrostis pilosa chloroplast genome with its relatives in Eragrostideae (Chloridoideae; Poaceae). Plants 8:485. doi: 10.3390/plants8110485
Soreng, R. J., Peterson, P. M., Romaschenko, K., Davidse, G., Teisher, J. K., Clark, L. G., et al. (2017). A worldwide phylogenetic classification of the Poaceae (Gramineae) II: An update and a comparison of two 2015 classifications. J. Syst. Evol. 55, 259–290. doi: 10.1111/jse.12262
Soreng, R. J., Peterson, P. M., Romaschenko, K., Davidse, G., Zuloaga, F. O., Judziewicz, E. J., et al. (2015). A worldwide phylogenetic classification of the Poaceae (Gramineae). J. Syst. Evol. 53, 117–137. doi: 10.1111/jse.12150
Stephan, G., Pascal, L., and Research, B. R. J. N. A. (2019). OrganellarGenomeDRAW (OGDRAW) version 1.3.1: expanded toolkit for the graphical visualization of organellar genomes. Nucleic Acids Res. 47, W59–W64.
Su, P. X., Xie, T. T., and Zhou, Z. J. (2011). C4 plant species and geographical distribution in relation to climate in the desert vegetation of China. Sci. Cold Arid Reg. 3, 381–391.
Sudhir, K., Glen, S., and Koichiro, T. (2016). MEGA7: molecular evolutionary genetics analysis version 7.0 for bigger datasets. Mol. Biol. Evol. 33, 1870–1874. doi: 10.1093/molbev/msw054
Sueoka, N. (1962). On the genetic basis of variation and heterogeneity of DNA base composition. Proc. Natl. Acad. Sci. U.S.A. 48, 582–592. doi: 10.1073/pnas.48.4.582
Tanaka, H., Hirakawa, H., Muguerza, M., Hashiguchi, M., Tabata, S., Akashi, R., et al. (2016). The complete chloroplast genome sequence of Zoysia matrella (L.) Merr. Crop Sci. 56, 1206–1212. doi: 10.2135/cropsci2015.08.0517
Tao, Q. B., Bai, M. J., Sun, Q. J., Han, Y. H., and Wang, Y. R. (2017). Correlation analysis of seed yield with photosynthetic rate and biomass of Cleistogenes songorica leaves in different position during seed development. Acta Agres. Sin. 25, 516–528.
Tripathy, K., Singh, B., Misra, G., and Singh, N. K. (2019). Identification, distribution and comparative analysis of microsatellites in the chloroplast genome of Oryza species. Indian J. Genet. Plant Breed. 79, 536–544.
Tutin, T. G., and Al, E. (1980). “Cleistogenes,” in Flora Europaea, eds T. G. Tutin and V. H. Heywood (London: Cambridge University Press), 256.
Tzvelev, N. N. (1989). The system of grasses (Poaceae) and their evolution. Bot. Rev. 55, 141–203. doi: 10.1007/bf02858328
Vieira, L., Dos Anjos, K. G., Faoro, H., Fraga, H. P., Greco, T. M., Pedrosa Fde, O., et al. (2016). Phylogenetic inference and SSR characterization of tropical woody bamboos tribe Bambuseae (Poaceae: Bambusoideae) based on complete plastid genome sequences. Curr. Genet. 62, 443–453. doi: 10.1007/s00294-015-0549-z
Wang, H., Lu, H., Zhao, L., Zhang, H., Lei, F., and Wang, Y. (2019). Asian monsoon rainfall variation during the Pliocene forced by global temperature change. Nat. Commun. 10:5272.
Wang, S. P., Li, Y. H., Wang, Y. F., and Chen, Z. Z. (2000). Influence of different stocking rates on plant diversity of Artemisia frigida community in Inner Mongolia Steppe. Acta Bot. Sin. 43, 89–96.
Wang, S. P., Wang, Y. F., and Chen, Z. Z. (2003). Effect of climate change and grazing on populations of Cleistogenes squarrosa in Inner Mongolia steppe. Acta Phytoecol. Sin. 27, 337–343. doi: 10.17521/cjpe.2003.0050
Welker, C. A., McKain, M. R., Estep, M. C., Pasquet, R. S., Chipabika, G., Pallangyo, B., et al. (2020). Phylogenomics enables biogeographic analysis and a new subtribal classification of Andropogoneae (Poaceae—Panicoideae). J. Syst. Evol. 58, 1003–1030. doi: 10.1111/jse.12691
Welzen, P. C., Slik, F., and Alahuhta, J. (2005). Plant distribution patterns and plate tectonics in Malesia. Biol. Skr. 55, 199–217.
Wright, F. (1990). The ‘effective number of codons’ used in a gene. Gene 87, 23–29. doi: 10.1016/0378-1119(90)90491-9
Yamane, K., Yano, K., and Kawahara, T. (2006). Pattern and rate of indel evolution inferred from whole chloroplast intergenic regions in sugarcane, maize and rice. DNA Res. 13, 197–204. doi: 10.1093/dnares/dsl012
Zhang, D., Li, K., Gao, J., Liu, Y., and Gao, L. Z. (2016). The complete plastid genome sequence of the wild rice Zizania latifolia and comparative chloroplast genomics of the rice tribe Oryzeae, Poaceae. Front. Ecol. Evol. 4:88. doi: 10.3389/fevo.2016.00088
Zhang, J., John, U. P., Wang, Y., Li, X., Gunawardana, D., Polotnianka, R. M., et al. (2011). Targeted mining of drought stress-responsive genes from EST resources in Cleistogenes songorica. J. Plant Physiol. 168, 1844–1851. doi: 10.1016/j.jplph.2011.04.005
Zhang, J. Y., Duan, Z., Jahufer, Z., An, S. J., and Wang, Y. R. (2014). Stress-inducible expression of a Cleistogenes songorica ALDH gene enhanced drought tolerance in transgenic Arabidopsis thaliana. Plant Omics 7, 438–444.
Zhang, Y. J., Ma, P. F., and Li, D. Z. (2011). High-throughput sequencing of six bamboo chloroplast genomes: phylogenetic implications for temperate woody bamboos (Poaceae: Bambusoideae). PLoS One 6:e20596. doi: 10.1371/journal.pone.0020596
Zhang, Y. R., Nie, X. J., Jia, X. O., Zhao, C. Z., Biradar, S. S., Wang, L., et al. (2012). Analysis of codon usage patterns of the chloroplast genomes in the Poaceae family. Aust. J. Bot. 60, 461–470. doi: 10.1071/bt12073
Keywords: Cleistogenes, comparative genomics, plastome evolution, molecular marker, phylogenetic relationships
Citation: Wang R, Liu K, Zhang X-J, Chen W-L, Qu X-J and Fan S-J (2021) Comparative Plastomes and Phylogenetic Analysis of Cleistogenes and Closely Related Genera (Poaceae). Front. Plant Sci. 12:638597. doi: 10.3389/fpls.2021.638597
Received: 07 December 2020; Accepted: 22 February 2021;
Published: 25 March 2021.
Edited by:
Leila Do Nascimento Vieira, Federal University of Paraná, BrazilReviewed by:
Eric De Camargo Smidt, Federal University of Paraná, BrazilCassiano Welker, Federal University of Uberlândia, Brazil
Copyright © 2021 Wang, Liu, Zhang, Chen, Qu and Fan. This is an open-access article distributed under the terms of the Creative Commons Attribution License (CC BY). The use, distribution or reproduction in other forums is permitted, provided the original author(s) and the copyright owner(s) are credited and that the original publication in this journal is cited, in accordance with accepted academic practice. No use, distribution or reproduction is permitted which does not comply with these terms.
*Correspondence: Xiao-Jian Qu, quxiaojian@sdnu.edu.cn; Shou-Jin Fan, fansj@sdnu.edu.cn