 Emmanuel Kofi Sie1,2
 Richard Oteng-Frimpong1
 Yussif Baba Kassim1†
 Doris Kanvenaa Puozaa1
 Joseph Adjebeng-Danquah1
 Abdul Rasheed Masawudu1Kwadwo Ofori2Agyemang Danquah2Alexandre Brice Cazenave3David Hoisington4
 James Rhoads4
 Maria Balota5*
- 1Council for Scientific and Industrial Research-Savanna Agricultural Research Institute, Nyankpala, Ghana
- 2West Africa Centre for Crop Improvement (WACCI), University of Ghana, Legon, Ghana
- 3Bayer Crop Science, Stanton, MN, United States
- 4Feed the Future Innovation Lab for Peanut, University of Georgia, Athens, GA, United States
- 5School of Plant and Environmental Sciences, Virginia Tech, Tidewater Agricultural Research and Extension Center, Suffolk, VA, United States
Early Leaf Spot (ELS) caused by the fungus Passalora arachidicola and Late Leaf Spot (LLS) also caused by the fungus Nothopassalora personata, are the two major groundnut (Arachis hypogaea L.) destructive diseases in Ghana. Accurate phenotyping and genotyping to develop groundnut genotypes resistant to Leaf Spot Diseases (LSD) and to increase groundnut production is critically important in Western Africa. Two experiments were conducted at the Council for Scientific and Industrial Research-Savanna Agricultural Research Institute located in Nyankpala, Ghana to explore the effectiveness of using RGB-image method as a high-throughput phenotyping tool to assess groundnut LSD and to estimate yield components. Replicated plots arranged in a rectangular alpha lattice design were conducted during the 2020 growing season using a set of 60 genotypes as the training population and 192 genotypes for validation. Indirect selection models were developed using Red-Green-Blue (RGB) color space indices. Data was collected on conventional LSD ratings, RGB imaging, pod weight per plant and number of pods per plant. Data was analyzed using a mixed linear model with R statistical software version 4.0.2. The results showed differences among the genotypes for the traits evaluated. The RGB-image method traits exhibited comparable or better broad sense heritability to the conventionally measured traits. Significant correlation existed between the RGB-image method traits and the conventionally measured traits. Genotypes 73–33, Gha-GAF 1723, Zam-ICGV-SM 07599, and Oug-ICGV 90099 were among the most resistant genotypes to ELS and LLS, and they represent suitable sources of resistance to LSD for the groundnut breeding programs in Western Africa.
Introduction
Groundnut is a nutritious crop with high protein (12% to 36%) and oil (36% to 54%) content and an important food crop worldwide. Groundnut seed also plays a crucial role in providing, vitamins, minerals, unsaturated oil and plant protein for many people in Ghana (Gaikpa et al., 2021). The nutritional value of groundnut renders it an essential component in the diet of rural people in Northern Ghana, as it complements the protein intake requirement in their mostly cereal-based diet. Daily consumption of groundnut contributes immensely to reducing protein deficiency and malnutrition in this country. In addition to increasing food and nutritional security, groundnut plays a pivotal role in the life of small-holder farmers in Ghana as a suitable vehicle for making improvements in the areas of poverty alleviation (Tyroler, 2018). In spite of its numerous benefits, cultivation and productivity of groundnut in Ghana and the world is largely hindered by numerous biotic factors (Oppong-Sekyere et al., 2015). Early Leaf Spot (ELS) caused by the fungus Passalora arachidicola previously known as Cercospora arachidicola and Late Leaf Spot (LLS) also caused by the fungus Nathopassalora personata, known previously as Cercosporidium peronatum (Denwar et al., 2021) diseases represent major destructive groundnut diseases. For example, LLS can cause loss in yield between 30 to 70% for susceptible varieties under disease conducive environmental conditions (Mugisha et al., 2004; Singh et al., 2011). The challenge to feed the growing human population in the face of numerous factors that limit the quality and quantity of groundnut production such as ELS and LLS diseases is an uphill task. Both ELS and LLS reduce the available leaf area for photosynthesis and therefore leads to defoliation and yield loss. Groundnut breeders are making efforts to screen large numbers of accessions for the development of ELS and LLS resistant varieties. Conventionally, ELS and LLS assessment in breeding programs includes visual scoring of disease severity. Nonetheless, this approach is error-prone, i.e., it depends on the evaluator experience and ability to capture small genotypic differences, it is time-consuming, and may not be able to capture adequately the physiological status of the plant (Araus, 2018). Repeatedly, the conventional methods for LSD screening have been reported as difficult to capture genotypic differences due to the partial and polygenic nature of these diseases (Dwivedi et al., 2002). Because of this, they may reduce rather than improve the efficacy of the marker-assisted selection. Unfortunately, many of the plant breeding programs in developing countries mostly rely on only conventionally recorded phenotypic data before transcribing the data into usable forms (Rife and Poland, 2015). Such data collection methods are expensive and laborious (Araus, 2018; Awada et al., 2018). Less experience evaluator will take a longer time to arrive at ELS and LLS as compare to imaging. Moreover, even if it is an experience person doing the scoring, because of the subjective nature of visual scoring, it is difficult to give the same score to the same plot scored at different time points either by the same rater or a different rater. Red-Green-Blue (RGB)-image technique therefore offers the chance to standardized ELS and LLS measurements and provides a better way to objectively quantify leaf spot severity than the visual method.
Similarly, in Ghana and other African countries, the breeding programs are in critical need for innovative techniques to improve yield and quality of groundnut. Application of RGB-image method, i.e., the science of making measurements from photographs, for automatic phenotyping may overcome the flaws of the current conventional phenotyping methods. RGB-image method saves significant time, decreases the cost of data collection, and offers the benefits of non-destructive measurements, regular assessment, accurate observations and direct storage of data (Araus, 2018). RGB-image method has been successfully used as a powerful evaluation tool for screening drought tolerance and yield in winter wheat in Texas (Balota et al., 2007), groundnut in Virginia, United States (Balota and Oakes, 2017), and groundnut LSD in Egypt (Omran, 2017). However, the effectiveness of RGB-image method for groundnut ELS and LLS selection in Ghana is yet to be exploited. The objective of this study was to explore the effectiveness of using RGB-image method as a high-throughput phenotyping tool for the assessment of groundnut LSD and yield in a breeding program in Ghana.
Materials and methods
Location of experiments, groundnut genotypes, and experimental design
Two experiments were conducted between June 2020 and October 2020 at Nyankpala, located in the Tolon district of Northern region of Ghana. Nyankpala is located at 09° 25′ 41″ N, 00° 58′ 42″ W, and altitude of 183 m above the sea level. The soils of the experimental site belong to Ferric Luvisols of the Tingoli series with a brown color, moderately drained, and free from concretions (Atakora and Kwakye, 2016). The Northern region of Ghana is characterized by a relatively dry climate with unimodal rainfall ranging between 900 and 1,200 mm annually (Savanna Agricultural Research Institute, 2012; Ndamani and Watanabe, 2014). The rains start in May and end in October with the highest rainfall occurring in August and September. The rest of the year (November to May) are dry with a small number of scattered precipitations in November (Savanna Agricultural Research Institute, 2012; Ndamani and Watanabe, 2014). The first experiment included 60 medium duration groundnut genotypes (Table 1) selected from the African Groundnut Germplasm Collection (AGGC) for leaf spot resistant and yield phenotyping. The medium duration groundnut genotypes complete their life cycle within 100–120 days after sowing. A 6 × 10 rectangular alpha lattice design with three replications was used. Each replication contained six (Balota and Oakes, 2017) blocks with 10 single row plots of 2 m length in each block. The second experiment consisted of 192 short duration groundnut genotypes (Supplementary Table 1) selected from the AGGC also for leaf spot resistant and yield screening. Short duration groundnut genotypes complete their life cycle within 85–100 days after sowing. The genotypes were arranged in an 8 × 24 rectangular alpha lattice design with three replications. Each replication contained eight (Denwar et al., 2021) blocks with 24 single row plots of 2 m length in each block.
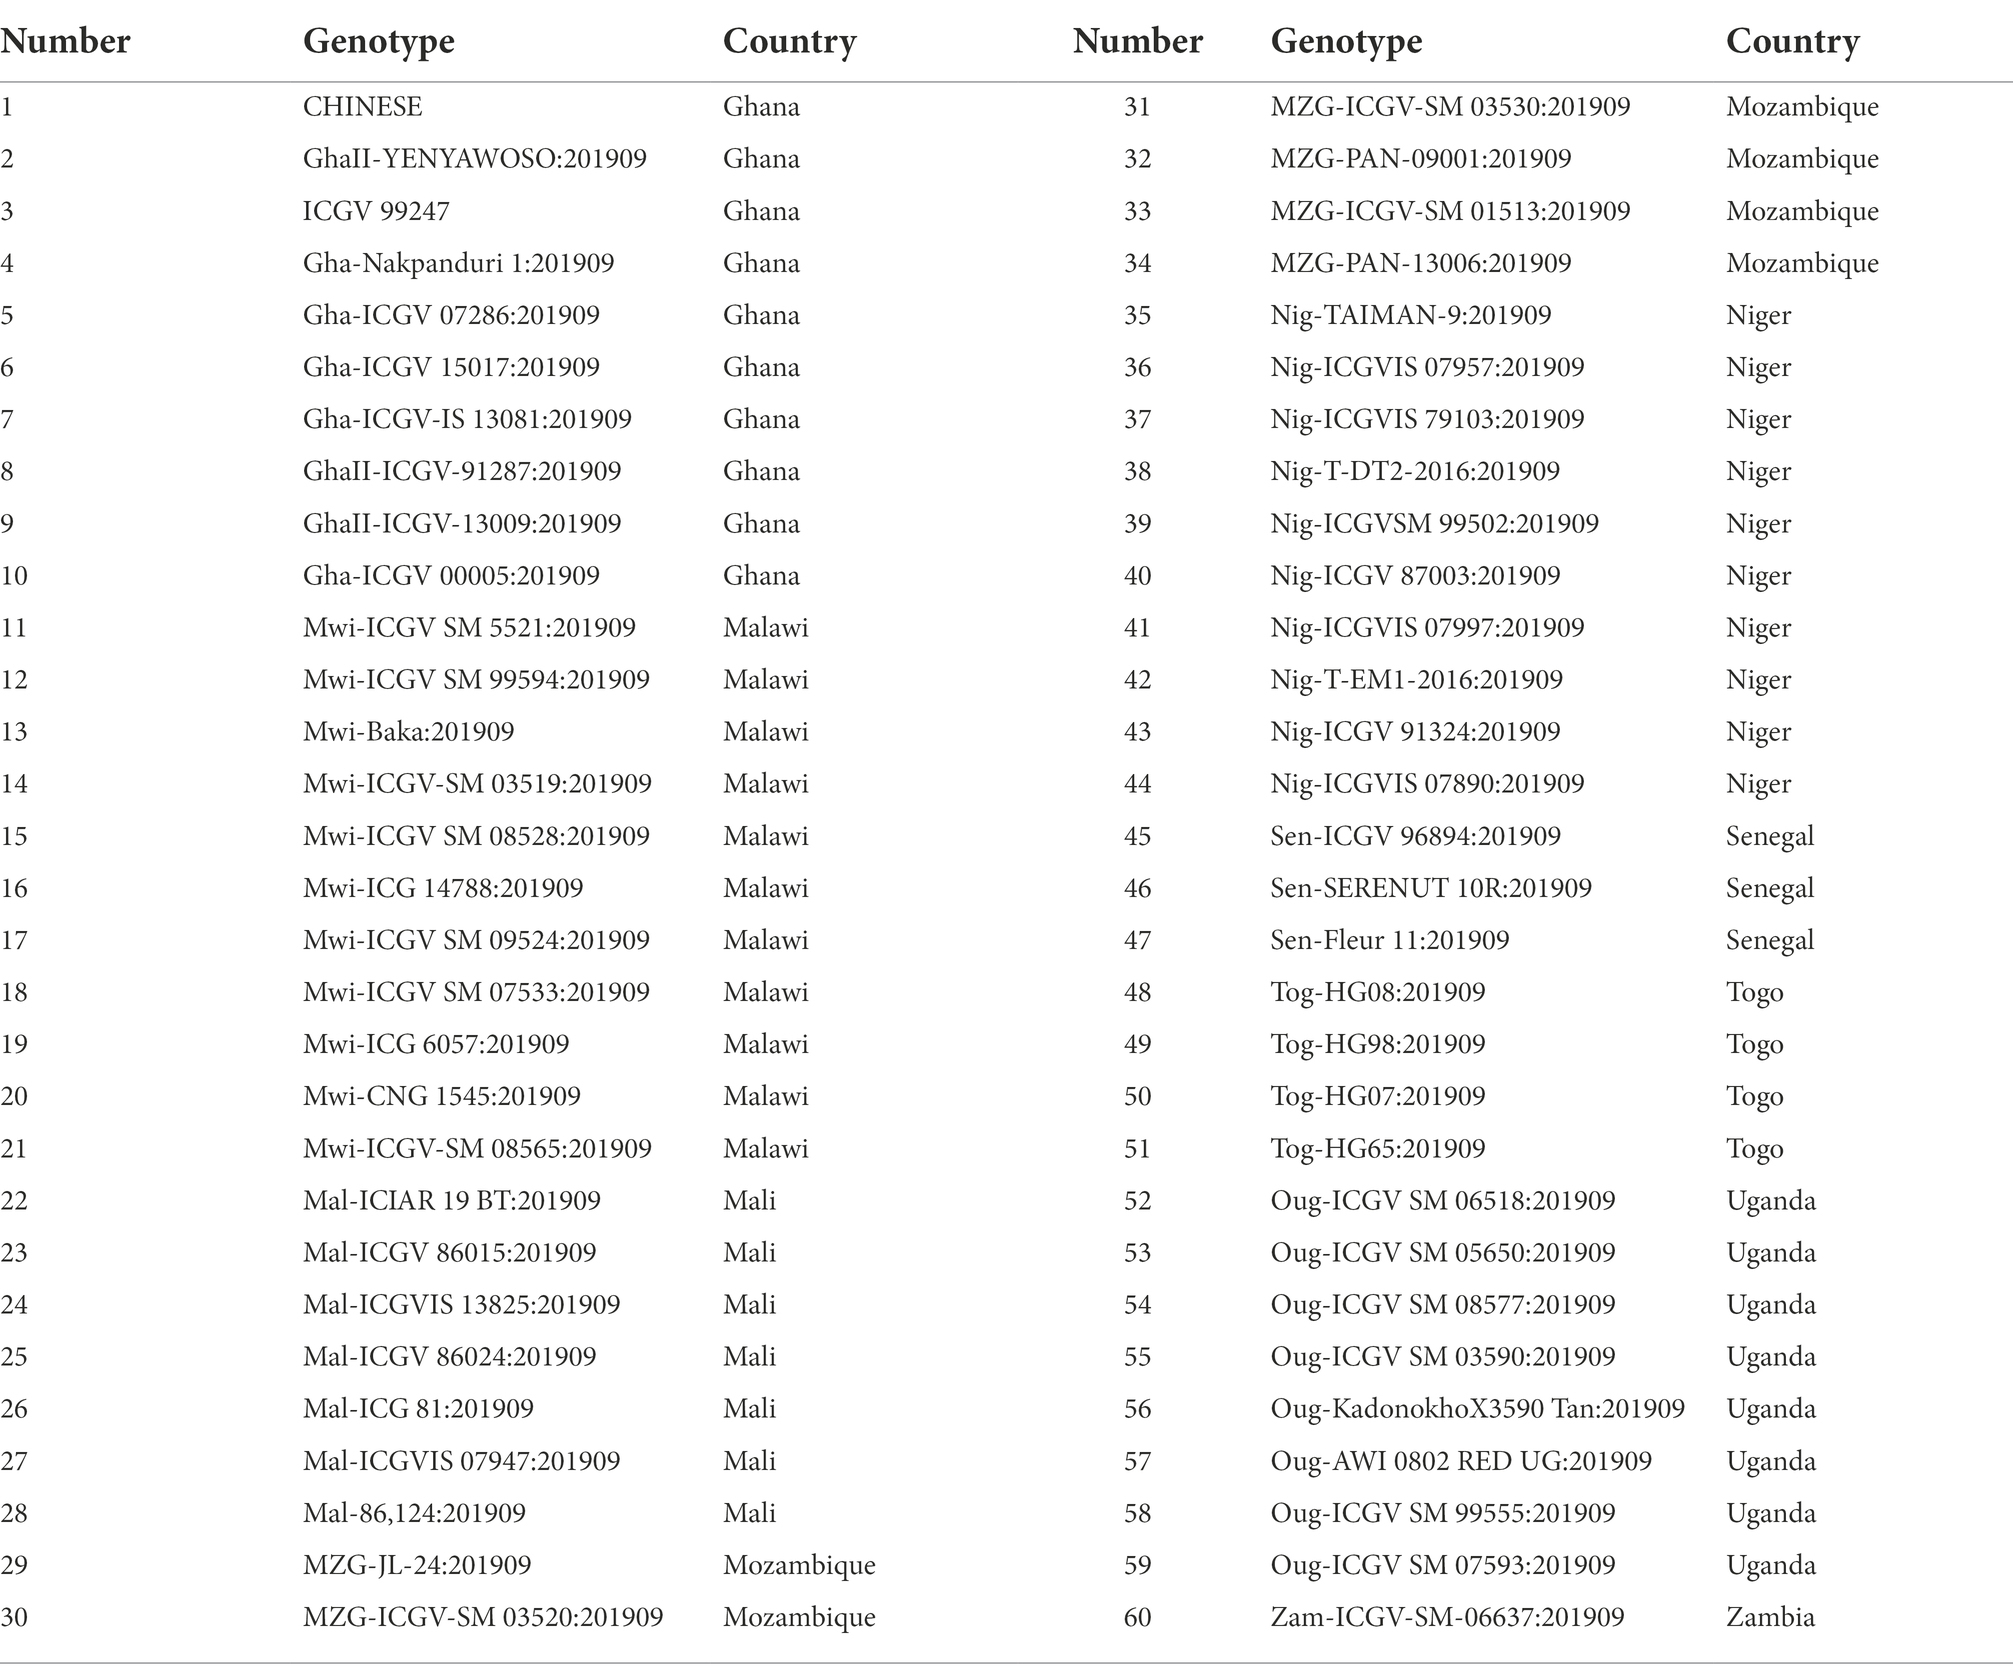
Table 1. List and countries of origin for 60 medium duration groundnut genotypes used for leaf spot resistant and yield phenotyping.
Data collection
Conventional measurements of LSD and yield
Both ELS and LLS mostly occur together in Ghana. An effort was made to distinguish ELS and LLS. It was possible to distinguish the two diseases easily because of the physical appearance of their spots (Figure 1). Symptoms of ELS are dark brown, yellow halo and sub-secular lesions on groundnut leaves whiles symptoms of LLS are darker, more circular lesions on the leaves and usually without yellow halo (Tshilenge-Lukanda et al., 2012). The severity of ELS and LLS infections was scored at 70, 80, 85 and 95 days after planting (DAP) based on their unique symptoms using the scale described by Subrahmanyam et al. (1995; Figure 2; Table 2). Genotypes with leaf spot scores from 1 to 3 were suggested to be resistant, genotypes scoring 4 to 6 were regarded as moderately resistant, and genotypes scoring 7 and above were considered susceptible (Gaikpa et al., 2021). Calculation of Area Under The Disease Progress Curve (AUDPC) was done for ELS and LLS from the severity scores of each plot using the formula: , where Yi is the level of disease severity score at a point in time, t(i + 1)-ti is the number of days between two successive scores (Shaner and Finney, 1977).
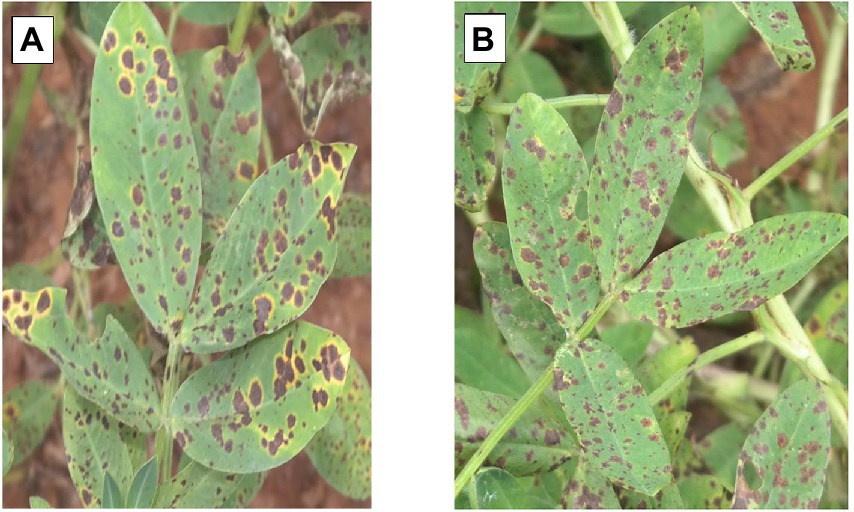
Figure 1. Lesions of ELS and LLS on infected leaves surface, represented by (A,B), respectively.
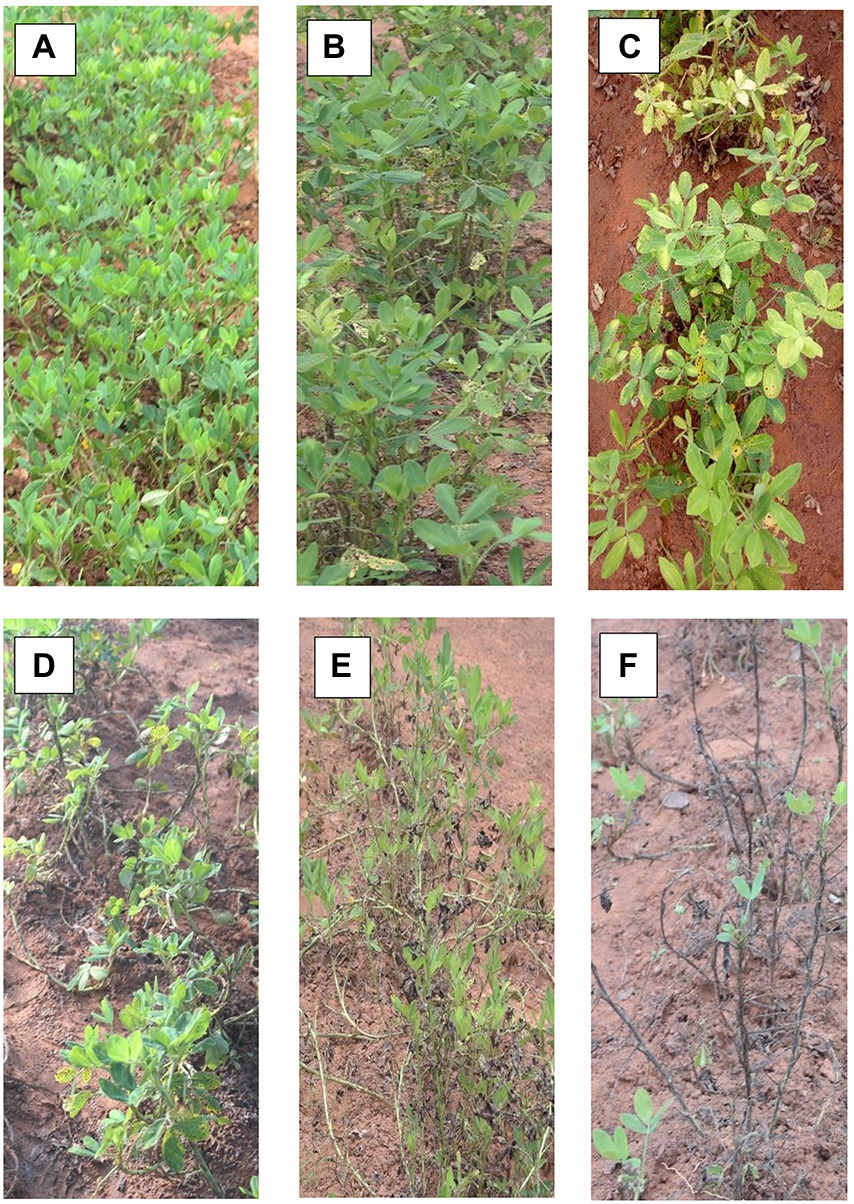
Figure 2. Examples of severity levels of leaf spot diseases used for visual rating of groundnut plots in this experiment [A–F represent scores 1, 3, 5, 6, 7, and 9, respectively, on the leaf spot scale by Subrahmanyam et al., 1995].
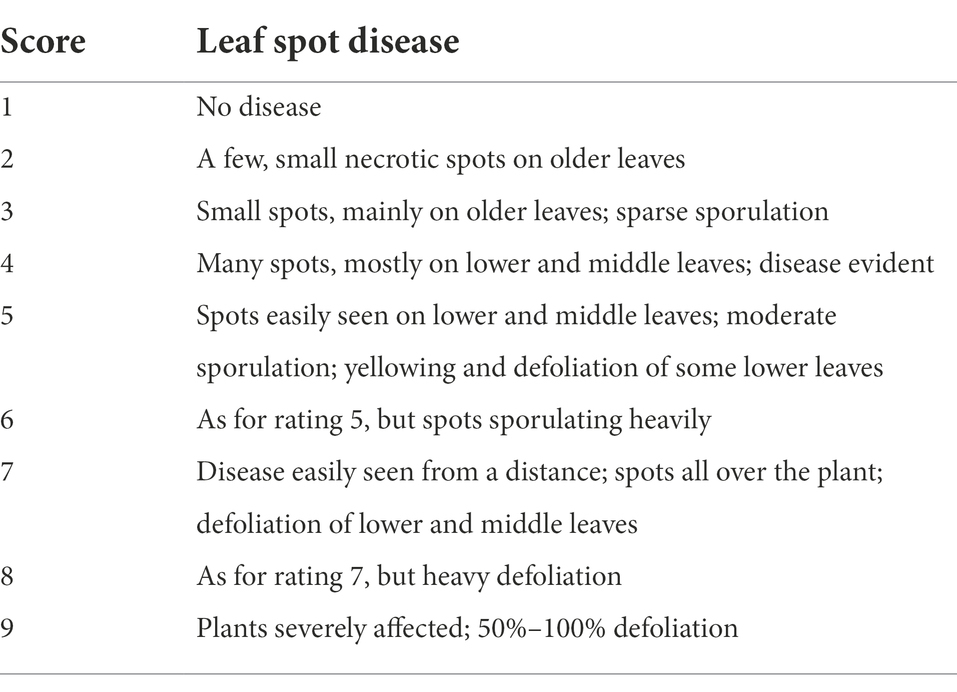
Table 2. Leaf spot severity rating scale used in this study [from Subrahmanyam et al. (1995)].
Observations were recorded on the number of pods per plant (Pods/PLT), i.e., at the physiological maturity, pods obtained from five harvested plants were individually counted and averaged. Pod weight per plant (PW/PLT) was also performed at the physiological maturity, when pods from five plants were dug manually and hand-stripped, cleaned from soil, then air dried to constant weight, and pod weight was taken using an electronic scale (KERN®, PCB 10000–1; Balingen, Germany).
Red-green-blue imaging
The images were captured on the same days as the visual LSD ratings. A Samsung Galaxy NX300 digital camera that captures 20.3 mega-pixels was used to take images of individual plots. The camera was held horizontally in landscape mode over the plots at an angle of 90° and kept at a height of 80 cm above the plant canopy for all the imaging whiles facing the sun to avoid any shadow on the pictures. The camera was set to the “auto” mode to allow automatic adjustments for sharpness, brightness and hue (H) depending on the light available. Green area (GA = H 60–120°), greener area (GGA = H 80–120°), H angle, and crop senescence index [CSI = (100*(GA-GGA)/GA); Gracia-Romero et al., 2018] were extracted using Breedpix 2.0 option from the CIMMYT maize scanner 1.16 plugin (http://github.com/george-haddad/CIMMYT open software; Copyright 2015 Shawn Carlisle Kefauver, University of Barcelona); produced as part of Image J/Fiji (open source software; http://fiji.sc/Fiji; Schindelin et al., 2012; Rueden and Eliceiri, 2017). Both GA and GGA measures the number of green pixels on an image. However, the GGA removes green tones that are yellowish from and, accordingly, differentiates leaf senescence and active photosynthetic biomass more accurately.
Data analysis
Data analysis was performed using the mixed linear model with R statistical program, version 4.0. 2 (R Core Team, 2018). This was carried out to identify the variability among genotypes for particular traits. Pearson correlation was computed and visualised among the parameters using the Agricolae package in R (Wei et al., 2017) to determine the correlation among the studied parameters.
Genotypic and phenotypic variances and coefficients of variation
Genotypic variance
Estimation of Genotypic Variance (VG) was done using the formula: , where MSG is the mean squared of genotype, MSE is the mean squared of the residual (error) and r is the number of replications (Walle et al., 2014; Oteng-Frimpong et al., 2017).
Phenotypic variance
Calculation of phenotypic variance (VP) was done using the formula: , where VG is the genotypic variance, MSE is the mean squared of the residual (error) and r is the number of replications (Walle et al., 2014; Oteng-Frimpong et al., 2017).
Genotypic coefficient of variation
The formula was used to calculate genotypic coefficient of variation with x representing the grand mean of the trait in question (Walle et al., 2014; Oteng-Frimpong et al., 2017). GCV values were categorized as low for less than 10%, moderate for between 10 and 20% and more than 20% as high (Deshmukh et al., 1986).
Phenotypic coefficient of variation
Calculation of phenotypic coefficient of variation (PCV) was also carried out using the formula , where x is the grand mean of the trait of interest (Walle et al., 2014; Oteng-Frimpong et al., 2017). PCV values were categorized as low for less than 10%, moderate for between 10% and 20% and more than 20% as high (Deshmukh et al., 1986).
Estimated broad sense heritability (H2)
Estimation of broad sense heritability was done using the formula , where VG and VP, respectively, represents the genotypic and phenotypic variances (Allard, 1999). Broad sense heritability was categorized as low for less than 30%, medium for 31%–60% and 61% and above as high (Johnson et al., 1955).
Expected genetic advance
Calculation of expected genetic advance (EGA) was performed using the formula: GA = (K) бP H2 where GA is the expected genetic advance, K is the selection differential (2.06 at 5% selection intensity) and бA is the phenotypic standard deviation (Shukla et al., 2006).
Genetic advance as percentage
The genetic advance as percentage (GAM) the of mean was calculated as: (Shukla et al., 2006). GAM was categorized as low for less than 10%, moderate for between 10 and 20% and more than 20% as high (Johnson et al., 1955).
Results
ELS and LLS reaction
The area under disease progress curve was used to understand the incidence and progression of ELS and LLS diseases among the groundnut genotypes using leaf spot severity scores taken at 70, 80, 85, and 95 DAP. However, the best associations with the traditional measurements were at 95 DAP, for which we primarily present here the data recorded at 95 DAP. The genotypes exhibited different levels of resistance to ELS and LLS diseases. For the medium duration population, the area under disease progress curve for ELS_AUDPC ranged from 32 for genotype 73–33 to 73 for Sen-DOK IT with a mean of 57 (Table 3). In the case of LLS_AUDPC, 73–33 again obtained the least score of 54 while genotype Oug-ICGV SM 06525 obtained the highest score of 145 with 106 as the mean of all genotypes. The results for the early duration population indicated that the genotype Mal-ICGV 02271:201909 had the lowest AUDPC score of 39 while Nig-ICGV 91324:201909 scored 66, which was the highest value (Supplementary Table 2). The mean AUDPC score for ELS among the genotypes was 58. Genotype Sen-SERENUT 10R:201909 scored 111 showing the lowest AUDPC for LLS, and Nig-TX903838:20190 had the highest AUDPC score of 204. The mean AUDPC score for LLS for all genotypes was 167.
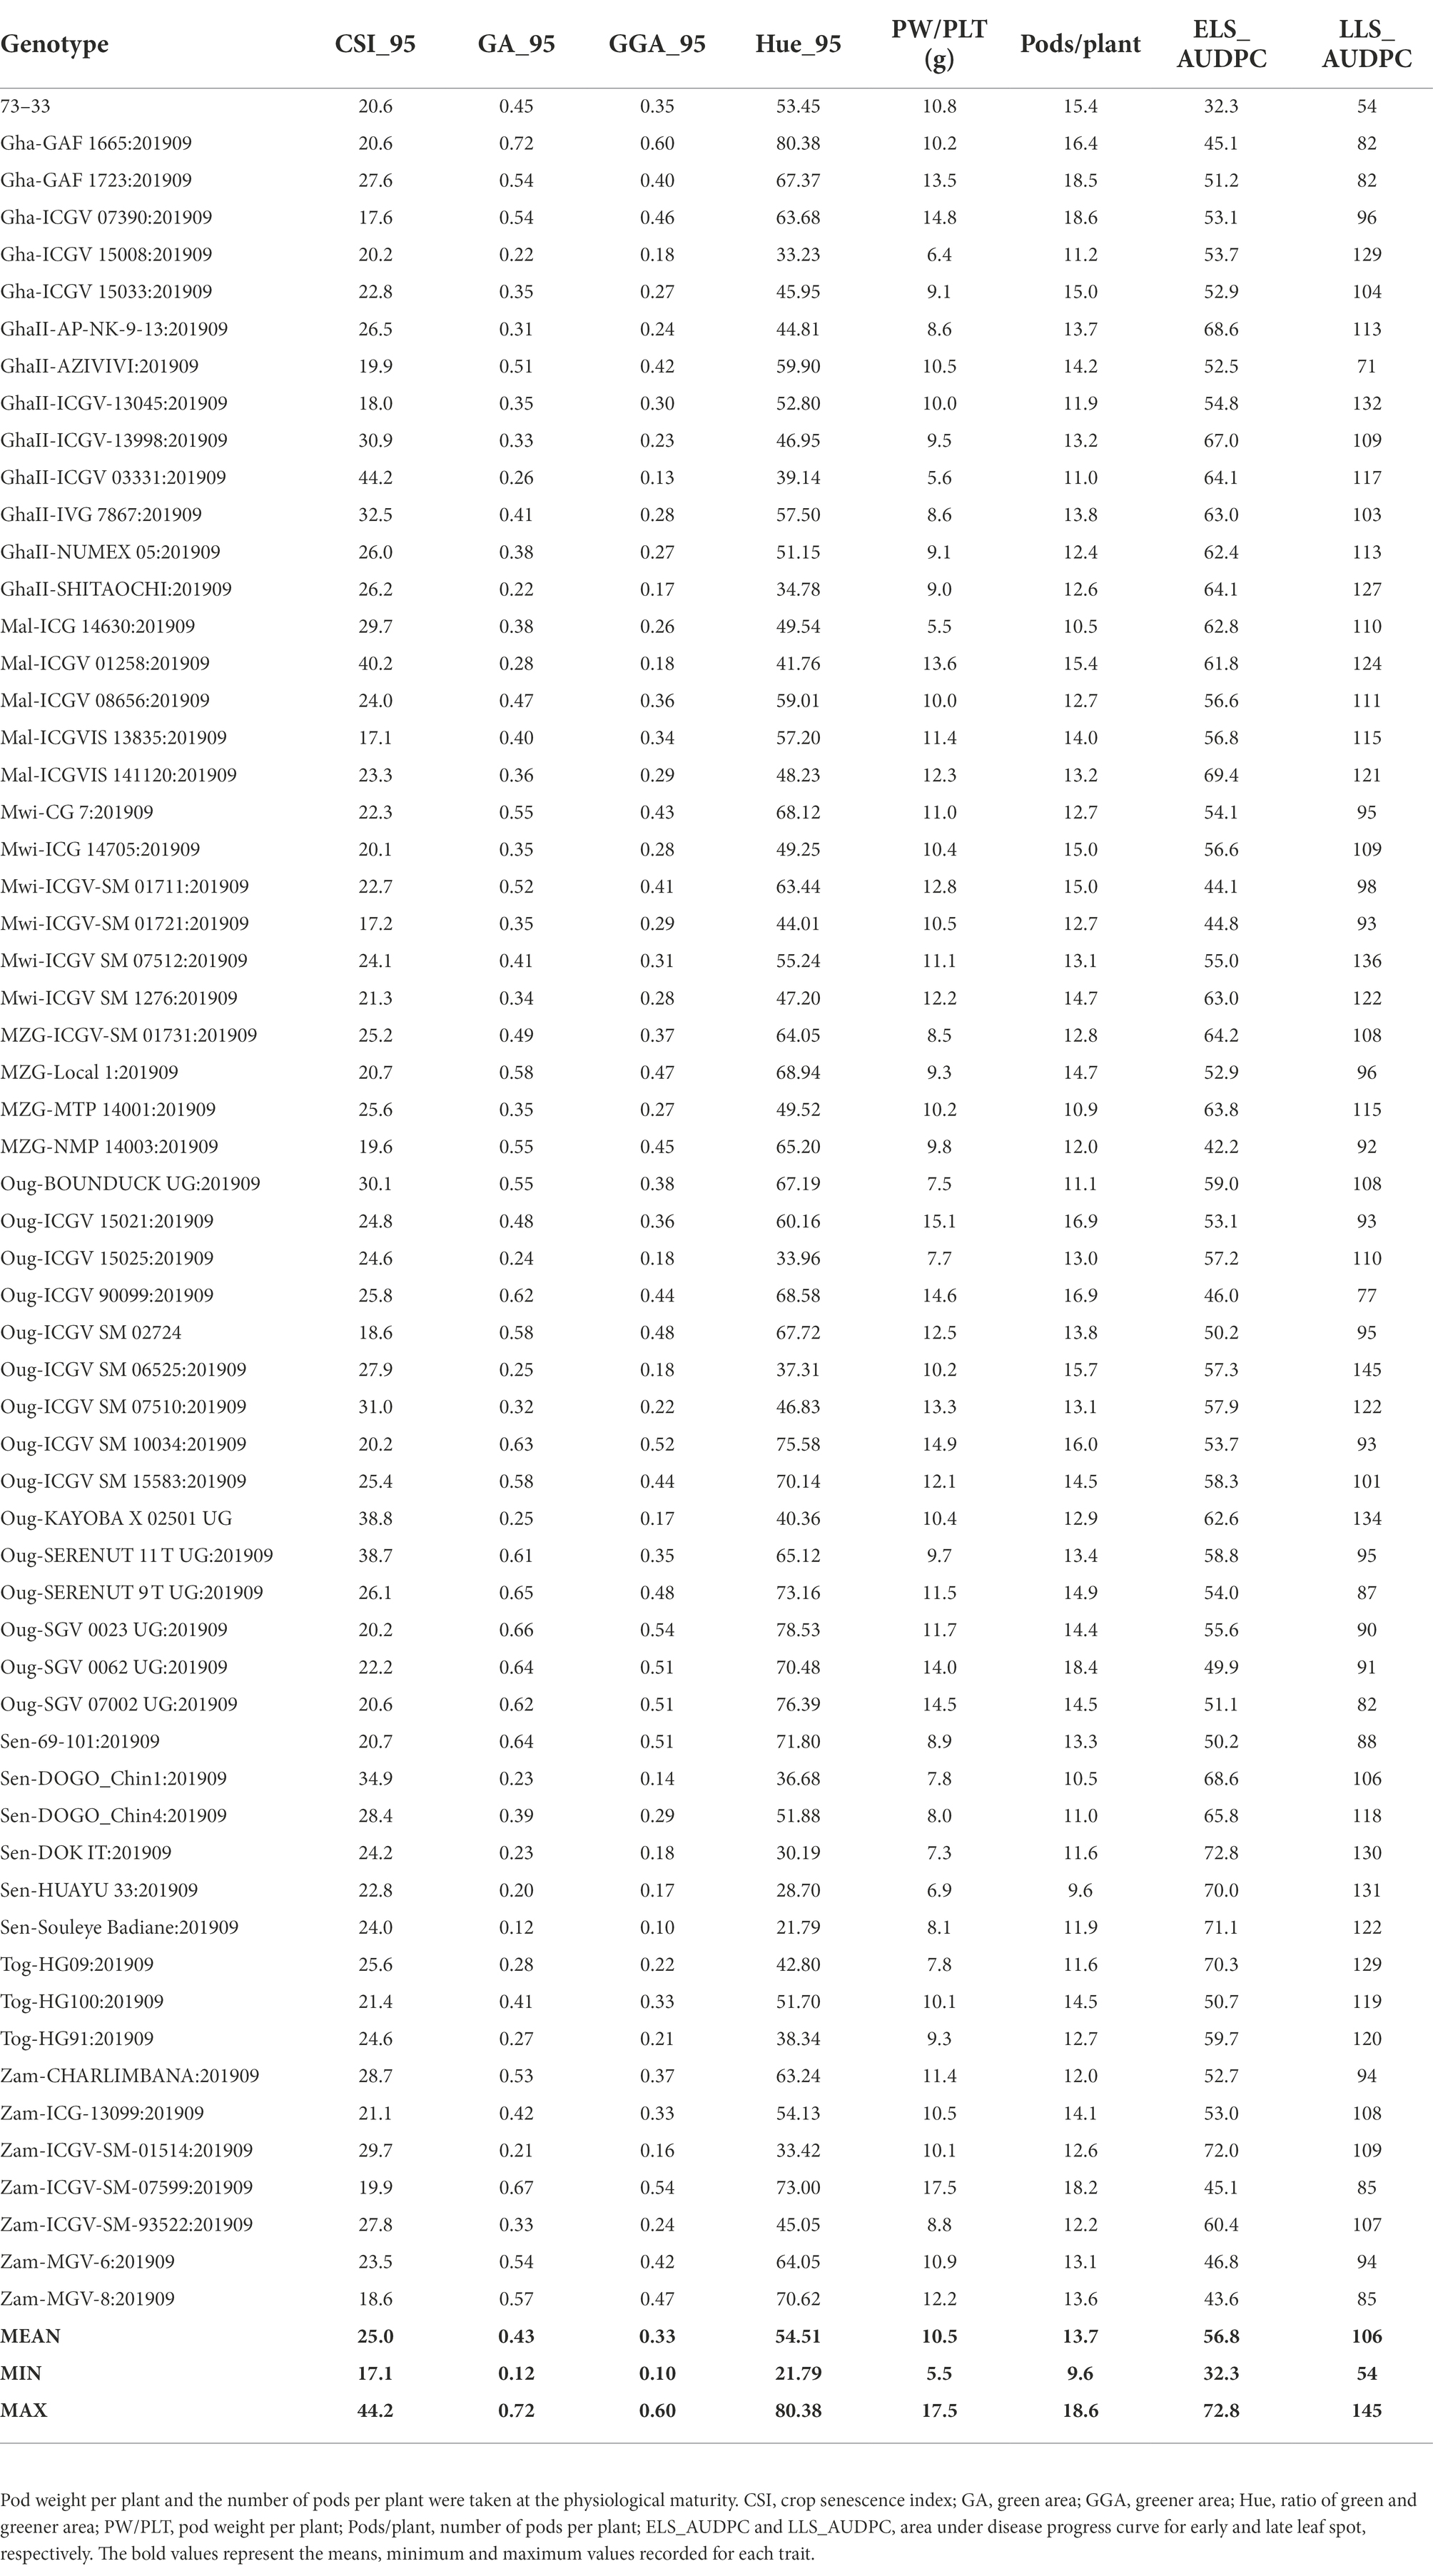
Table 3. Genotypic response of different RGB-image method and conventionally rated early and late leaf spot (ELS, LLS) in groundnut at 95 days after planting.
Yield
Genotypic differences were observed for the pod weight plant-1 (PW/PLT) and number of pods plant-1 (Pods/PLT). Among the genotypes, Mal-ICG 14630 had the lowest PW/PLT of 5.5 g, and Zam-ICGV-SM-07599 the highest of 17.5 g. The population mean was 10.5 g plant-1 (Table 3). For the Pods/PLT, in the medium duration population, genotypes Sen-HUAYU 33 and Sen-DOGO_Chin 1 had 10 pods plant-1as the lowest value, while Gha-GAF 1723 and Gha-ICGV 07390 had 19, the highest number of pods; 14 pods plant-1 was the mean of all genotypes. Among the early duration population, Oug-DOK 1 RED UG:201909 had the lowest PW/PLT of 5.1 g, whiles Gha-ICGV-IS 13144:201909 exhibited the highest of 18.9 g; the population mean was 8.7 g plant-1 (Supplementary Table 2). Oug-DOK 1 RED UG:201909 also produced the least number of pods, 8 pods plant-1, and Mal-ICGVIS 13827:201909 obtained the highest number of 21 pods plant-1. The population mean was 12 pods plant-1.
Variance components, coefficient of variation, and broad sense heritability
Genotypic (Ϭ2g) and phenotypic (Ϭ2p) variance and coefficient of variation (GCV, FCV), broad sense heritability (H2), expected genetic advance (EGA) and genetic advance as percentage of the mean (GAM) for the traits estimated in this work are presented in Tables 3, 4 for both, the medium duration and early duration populations. For the medium duration population, the values for Ϭ2g were in the range of 0.01 for GAA at 70 DAP (GGA_70) to 353.1 for LLS_AUDPC whiles values for Ϭ2p were in the range of 0.01 for GGA_70 to 384.1 for LLS_AUDPC (Table 4). The values for GCV ranged from 11.7% for hue angle at 70 DAP (Hue-70) to 40.3% for GAA at 95 DAP (GGA_95), while PCV values ranged from 13% for Hue_70 to 42.7% for GGA_95. Estimated broad sense heritability ranged from 53.5% for Pods/PLT to 93% for GA at 85 DAP (GA_85). EGA values were in the range of 0.20 for GGA_70 to 37.1 for LLS_AUDPC. GAM values ranged from 21.5 for Hue_70 to 78.4 for GGA_95. Results for the early duration population were similar with the medium duration population. For example, Ϭ2g ranged from 0.004 for GGA_70 to 299.5 for LLS_AUDPC and Ϭ2p from 0.006 for GGA_70 to 353.2 for LLS_AUDPC (Table 5). GCV values started from 9.2% for ELS_AUDPC to 38% for GGA_95 while PCV values were in the range of 11.1 to 45.3% for PW/PLT. Broad sense heritability values ranged from 29.1% for the CSI at 95 DAP (CSI_95) to 84.8% for LLS_AUDPC. Values for EGA were in the range of 0.1 for GGA_70 to 32.8 for LLS_AUDPC. GAM values ranged from 15.4 for CSI at 95 DAP (CSI_95) to 66.3 for GGA_95.
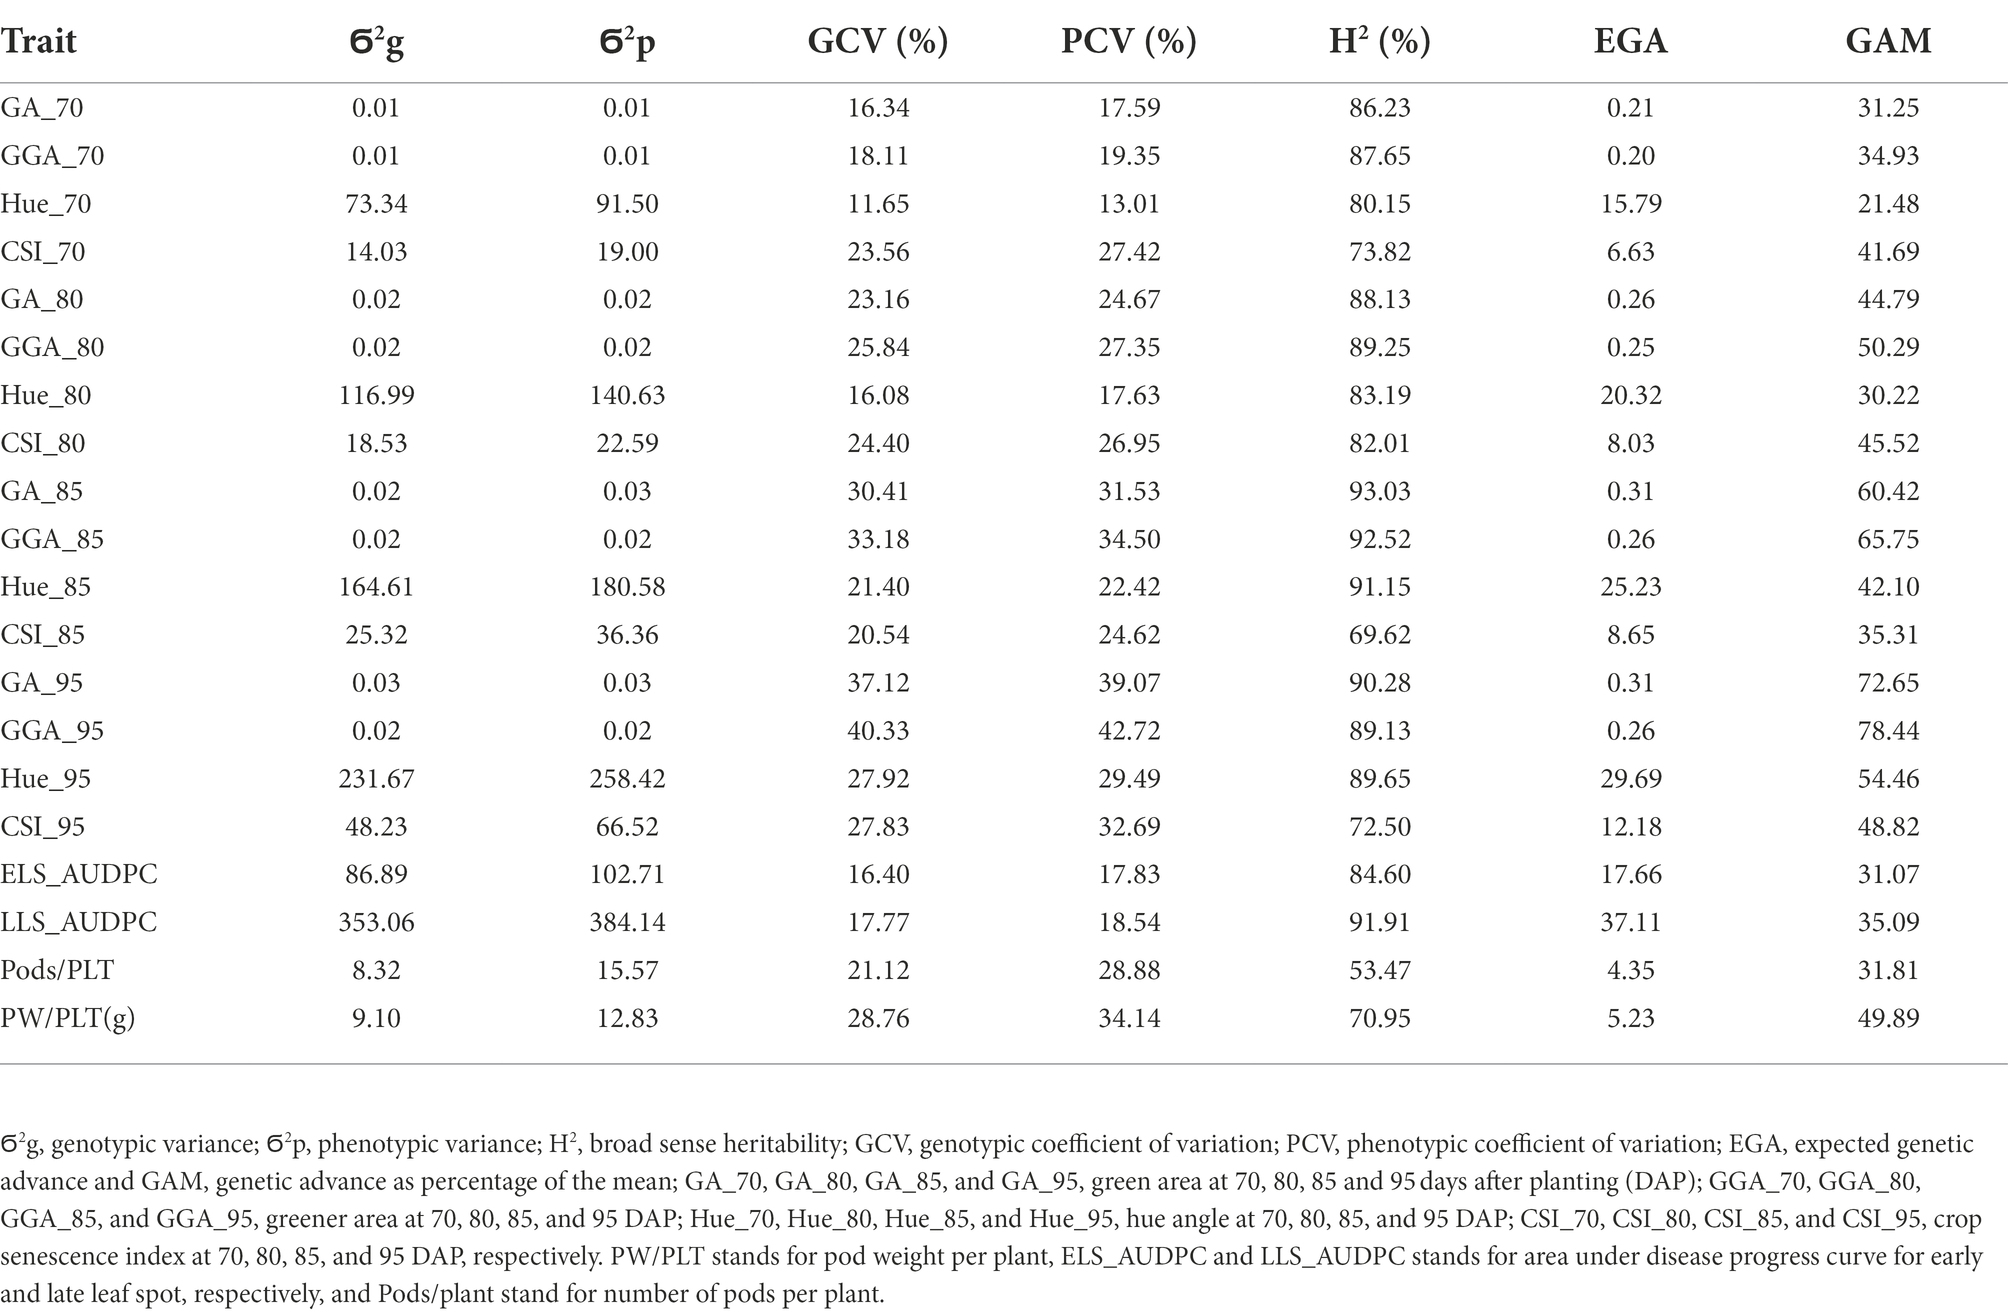
Table 4. Genotypic and phenotypic variance, genotypic and phenotypic coefficient of variation, broad sense heritability, expected genetic advance and expected genetic advance as percentage of the mean for RGB-image method and conventionally measured traits on the medium duration population.
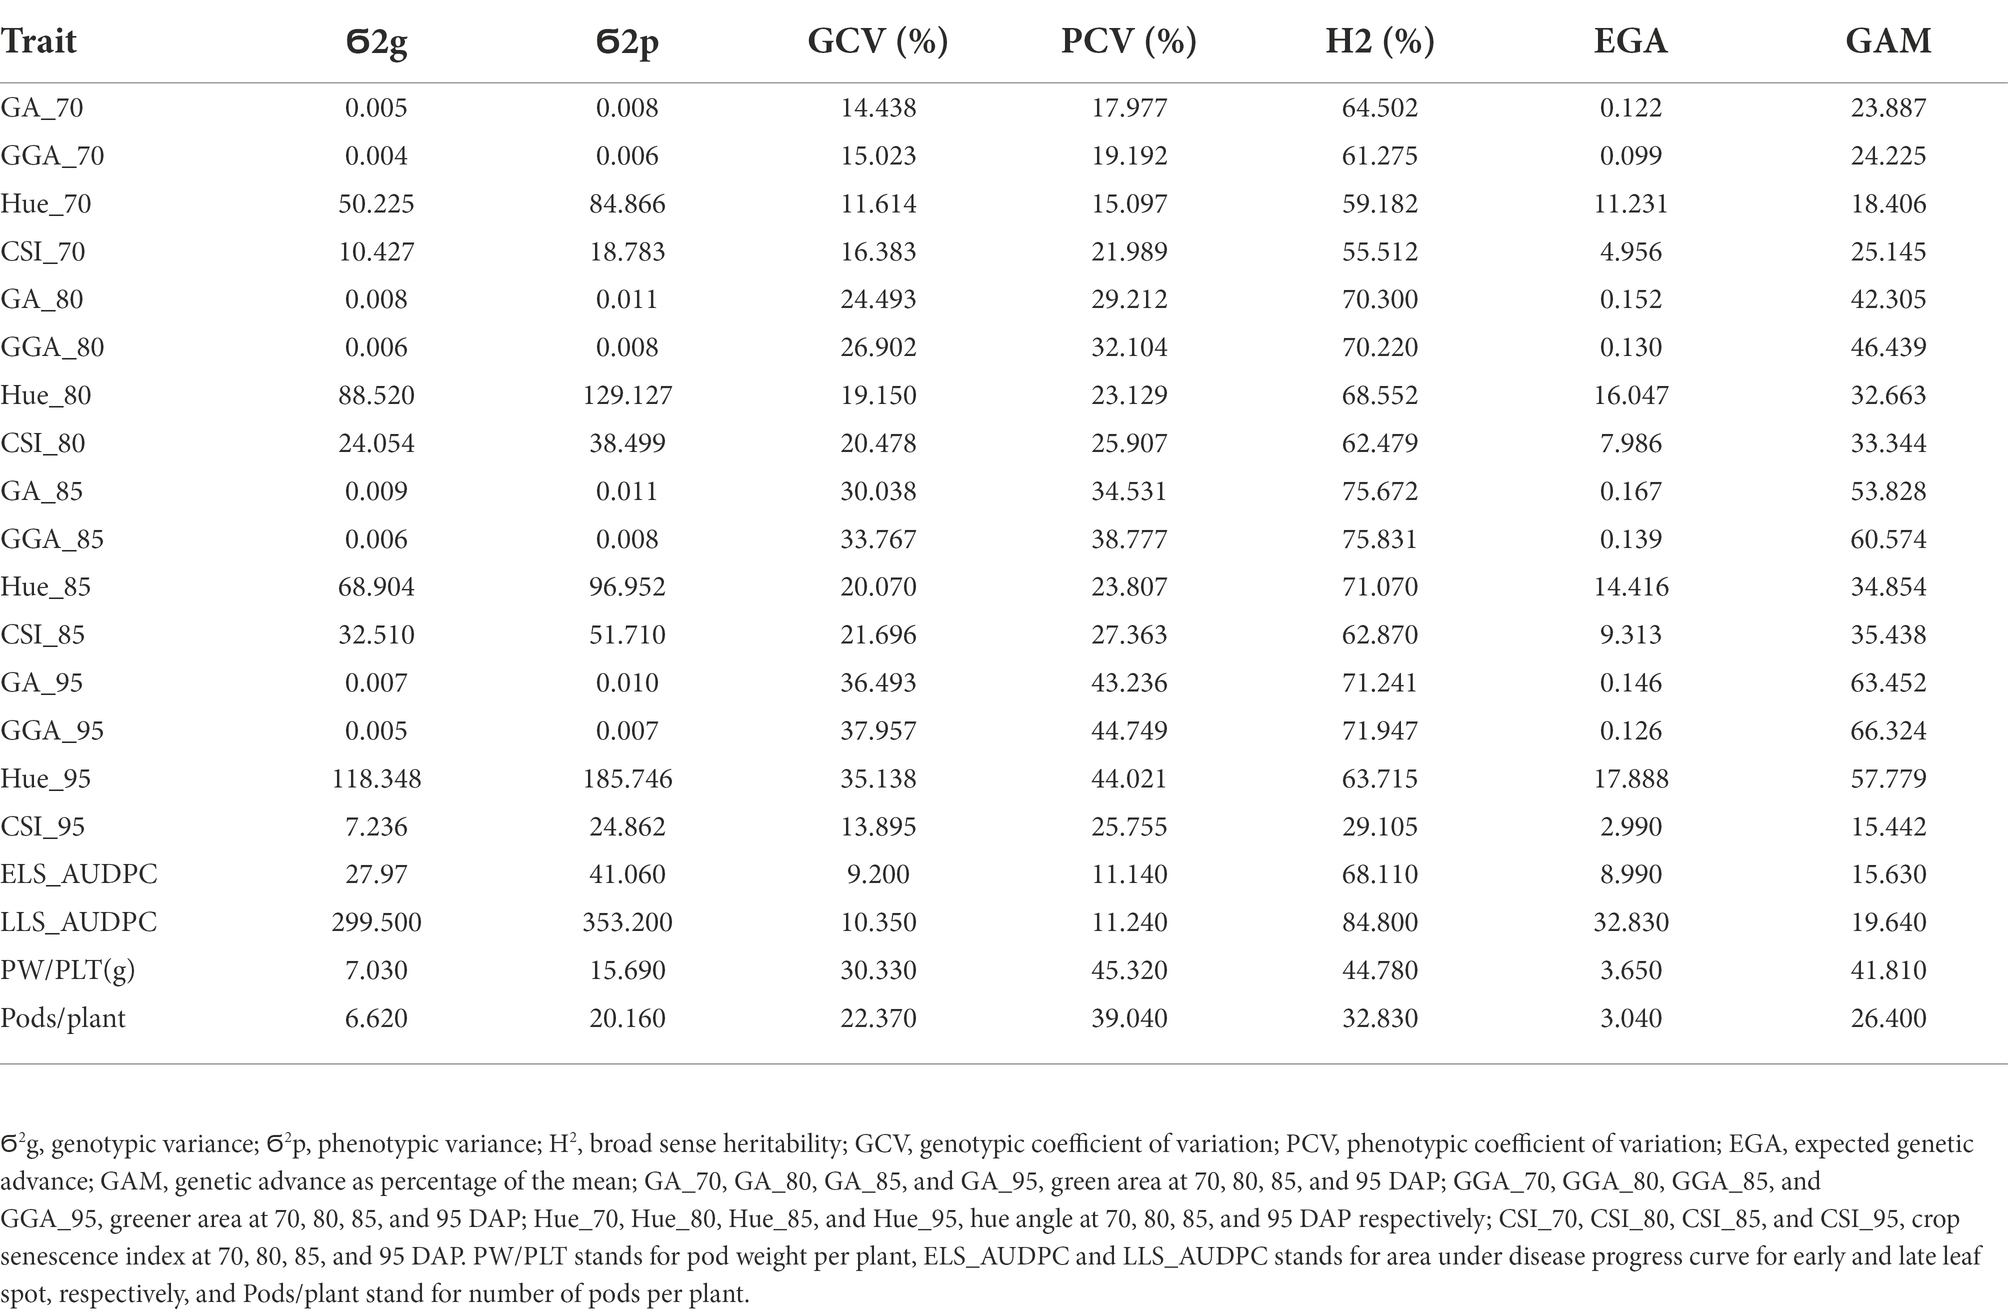
Table 5. Genotypic and phenotypic variance, genotypic and phenotypic coefficient of variation, broad sense heritability, expected genetic advance and expected genetic advance as percentage of mean for RGB-image method and conventionally measured traits on the early duration population.
Association between studied traits
The Pearson correlation matrix was employed to assess the relationship between the RGB-image method and conventionally measured traits for both, the training and validation populations. There were significant correlations (p < 0.05) among the parameters studied. The analysis showed a negative linear association between the RGB-image method traits (GA_85, GGA_85 and Hue_85) and the LSD scores (ELS_AUDPC and LLS_AUDPC) for both populations (Tables 6, 7), i.e., a smaller number of green pixels on the image corresponded to more diseased plots. Not surprising, CSI_85 exhibited a significant positive association with the ELS_AUDPC and LLS_AUDPC also for both populations, i.e., more senescence for more diseased plots. For the medium duration population, significant correlations were observed for GA_85 and ELS_AUDPC (r = −0.72, p < 0.001), GA_85 and LLS_AUDPC (r = −0.7, p < 0.001; Table 6). GA_85 and Pods/plant (r = 0.52, p < 0.001), and GA_85 and PW/PLT (r = 0.62, p < 0.001), GGA_85 also showed significant associations with ELS_AUDPC (r = −0.74, p < 0.001), LLS_AUDPC (r = −0.68, p < 0.001), Pods/plant (r = 0.56, p < 0.001), and PW/PLT (r = 0.66, p < 0.001). For the early duration population, significant correlations were observed between GA_85 with LLS_AUDPC (r = −0.66, p < 0.001) ELS_AUDPC (r = −0.45, p < 0.001), and PW/PLT (r = 0.23, p < 0.01; Table 7). GGA_95 also exhibited significant associations with ELS_AUDPC (r = −0.49, p < 0.001), LLS_AUDPC (r = −0.69, p < 0.001), and PW/PLT (r = 0.25, p < 0.01). RGB-image methodRGB-image method.
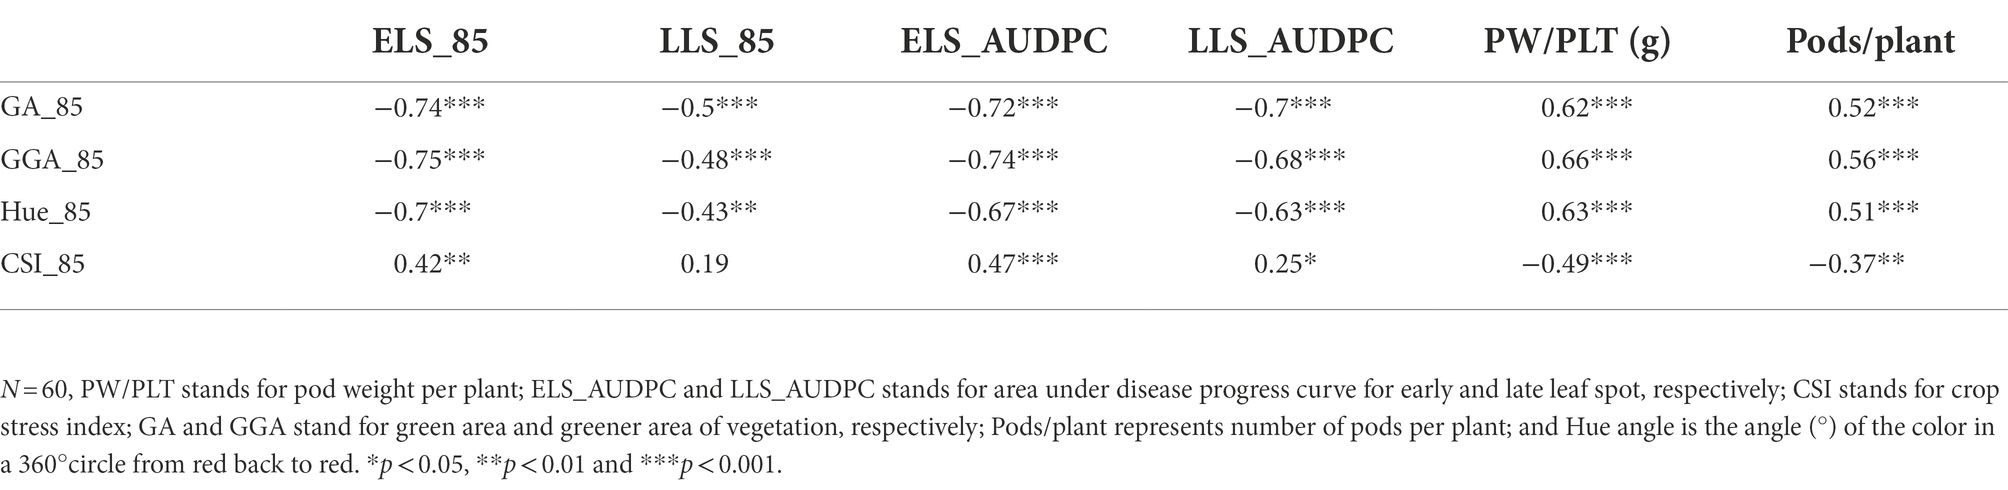
Table 6. Correlations among RGB-image and conventionally measured traits for the medium duration population at 85 D.A.P.
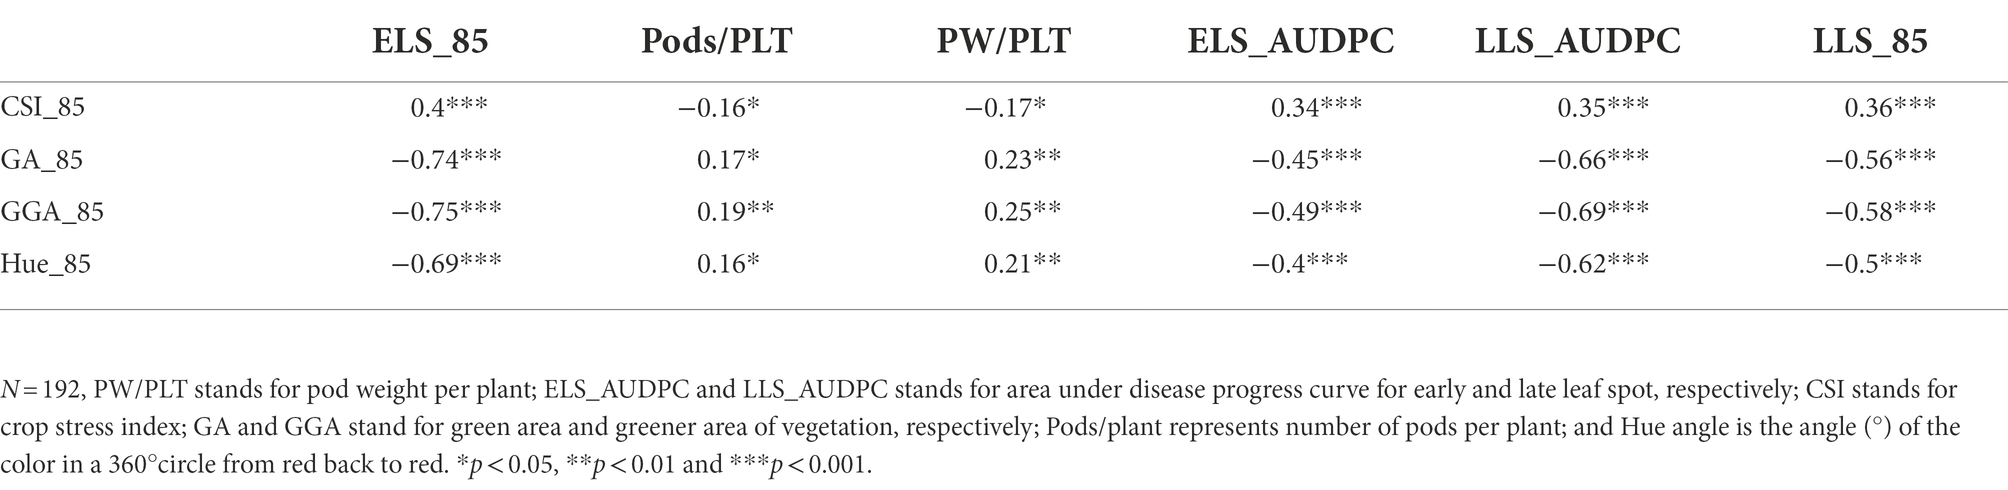
Table 7. Correlations among RGB-image and manually measured traits for early duration population at 85 D.A.P.
Principal component analysis
The Principal component analysis (PCA) was used to identify the most important traits in this study. For the training population, Principal components one (PC1) and two (PC2) were those considered with the greatest contribution to the observed variability among the genotypes based on their eigenvalues (Table 8). These two principal components cumulatively contributed to 76.8% of the total variation. PC1 accounted for 65.2% of the variation with the traits GA_95 (−0.408), GGA_95 (−0.418), Hue_95 (−0.4), ELS_AUDPC (0.351) and LLS_AUDPC (0.354) having the highest contributions to the variation. PC2 contributed to 11.7% of the variation and had traits Pods/PLT (0.627) and PW/p (0.621) as the most important traits influencing this principal component. For the validation population, the first three principal components (PC1, PC2, and PC3) were those regarded as having a significant contribution to the total observed variation existing among the genotypes judging by their eigenvalues, and they accounted for 87.5% of the total variation (Table 8). PC1 contained GA_95 (−0.469), GGA_95 (−0.475), Hue_95 (−0.452), and LLS_AUDPC (0.404) as traits accounting for most of the variation. PC2 included Pods/PLT (−0.683) and PW/PLT (−0.657), and PC3 contained CSI_95 (0.864) as the only trait accounting for most of the variation.
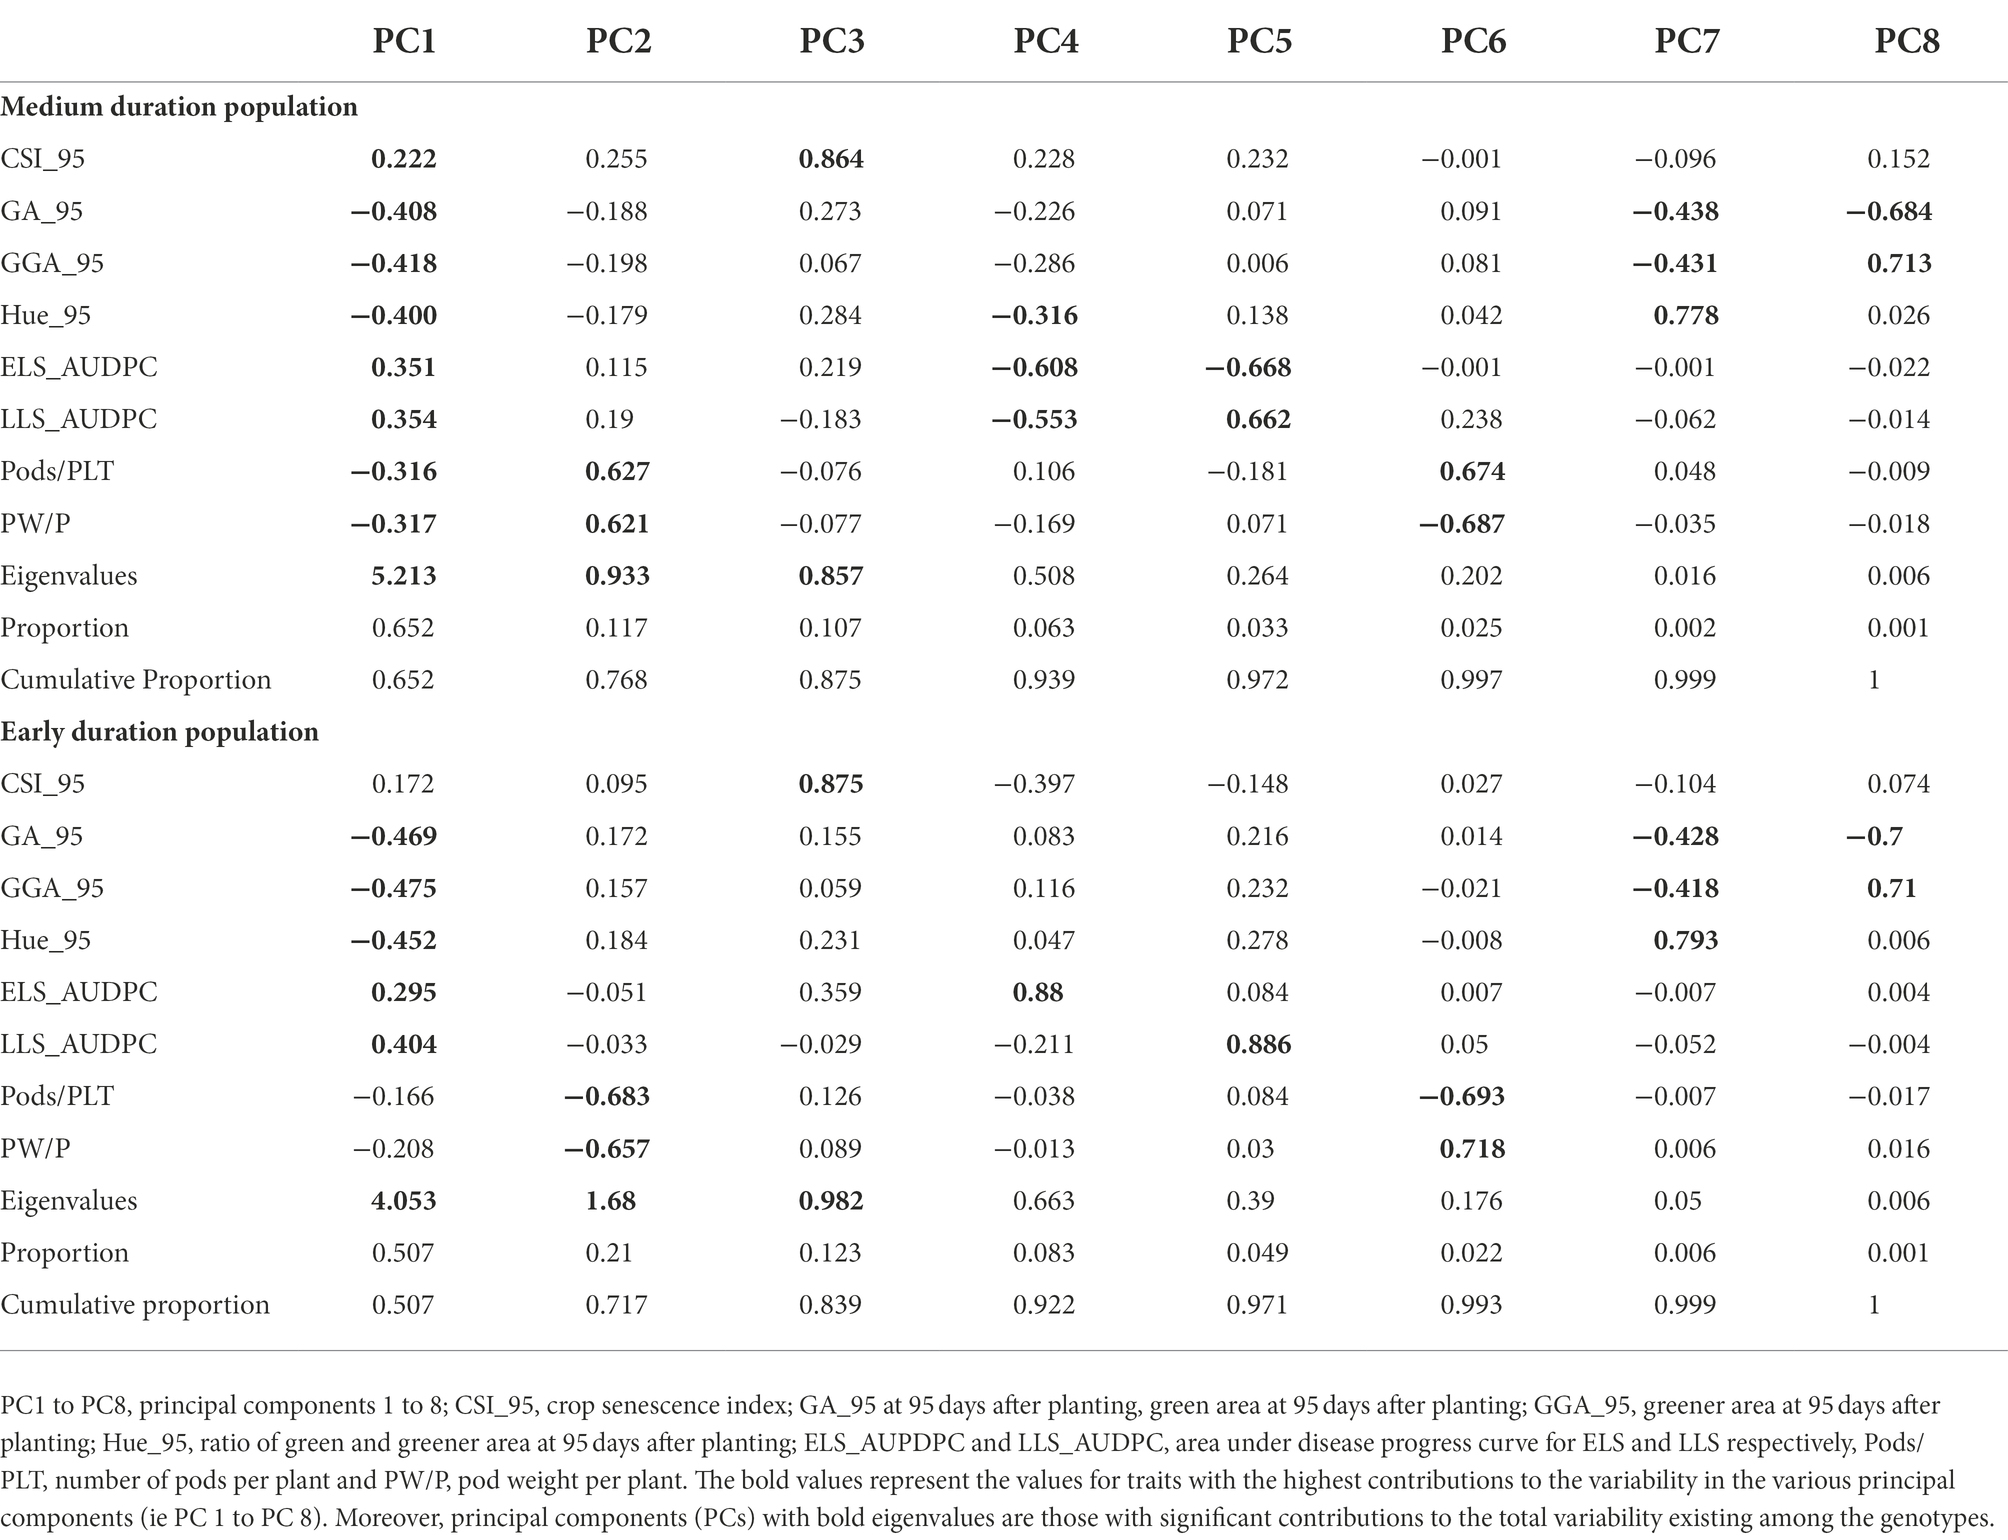
Table 8. Loadings of the traits measured at 95 days from planting (RGB-image method and disease traits), and at the physiological maturity (pod yield per plant and the number of pods per plant) onto 8 principal components for medium duration and early duration populations.
Discussion
The challenge to feed the growing human population in the face of numerous constrains for the agricultural production including biotic and abiotic stresses is an uphill task. Efficient phenotyping can help breeding programs develop more rapidly productive and resistant varieties of crops. In this study, 60 medium duration and 192 short duration accessions from the AGGC were used to develop improved phenotyping approaches for the leaf spot resistance and yield in groundnut. Originated under diverse agroecological conditions, these accessions represent an important genetic resource for biotic and abiotic stress resistance, which is the key to genetic gain and crop improvement (Zanklan, 2003). Indeed, in this study, a great diversity of ELS and LLS symptoms was observed among the genotypes that could be attributed to their genetic ability to respond differently to infection by the casual pathogens (White et al., 2012). For example, genotypes 73–33, Zam-MGV-8:201909, Mwi-ICGV-SM 01711:201909, Zam-ICGV-SM-07599:201909, Gha-GAF 1723:201909, Oug-ICGV 90099:201909, Mal-ICGV 02271:201909, Sen-SERENUT 10R:201909, and GhaII-AZIVIVI:201909 were moderately tolerant to the leaf spot diseases. Genotypes Gha-ICGV 07390:201909, Gha-GAF 1723:201909, Zam-ICGV-SM-07599:201909 and Oug-ICGV 15021:201909 exhibited high values for PW/PLT and Pods/PLT, and three out of four genotypes with good yield traits were also resistant to the LSD. Further assessment of these genotypes for use in crosses or release will go a long way to boost groundnut production in Northern Ghana. Fungicide application, which is a commonly used method in developed countries, is not applicable in Ghana because the farmers cannot afford their high cost (Denwar et al., 2021). Growing resistant varieties is the only option in controlling these diseases in developing countries. Furthermore, water pollution is minimized when farmers use less chemicals, in particular in fields neighboring water bodies where chemicals can be washed in by heavy rains following immediately after their application.
The estimated phenotypic coefficients of variation were higher compared to the genotypic coefficients of variation for the studied parameters. This observation was not different from the findings of Oteng-Frimpong et al. (2017). However, the differences between GCV% and the corresponding PCV% were narrow, suggesting lesser influence of the environmental factors in the expression of these parameters implying that variability was largely due to genetic effects (Tsegaye et al., 2007; Okwuagwu et al., 2008; Singh et al., 2013). The estimation of heritability gives information about the portion of variation which can be transferred from parent to the subsequent generation (Visscher et al., 2008). Effective exploitation of genotypic variability through selection is based on individual traits’ heritability (Bilgin et al., 2010). The high broad sense heritability of the RGB-image method indices in this study is an indication that these indices will be best to select for, as the environment has a minimal influence on their expression (Oteng-Frimpong et al., 2017). It is also worth mentioning that medium heritability for Pods/PLT and high heritability for PW/PLT were observed for the training population, suggesting high possibility of improving these traits. This observation was not surprising to us given the diverse genetic background of the genotypes. Information about heritability alone is not enough to make conclusion whether selection will lead to improvement since it does not give enough information as to the rate of genetic gain that can be obtained through selection (Singh et al., 2013). The high heritability and high genetic advance observed for some of the studied traits indicates additive gene action suggesting phenotypic selection for such traits is highly possible. For example, Hue_95 and CSI_95 with both high heritability and expected genetic advance are best selection targets for improvement of leaf spot resistance in breeding programs. High genetic advance as percentage of the mean from selecting the best 5% of the genotypes coupled with high broad sense heritability recorded for most of the RGB-image method traits in this study indicates additive gene action (Govindaraj et al., 2011; Kant et al., 2012).
Correlation analysis gives important information about the association between traits (Owusu et al., 2018; Ajayi and Gbadamosi, 2020; Mofokeng et al., 2020). Pearson correlation matrix was employed to assess the relationship between the RGB-image method and conventionally measured traits for both training and validation populations. There were significant correlations (p < 0.05) among the studied parameters indicating that RGB-image method has the potential to replace or complement the conventional methods of data collection due to the easy application and less expensive nature of the technology. Findings from this research suggest potential for automatization of disease severity and yield components assessment that will enable faster data collection at multiple/relevant time points throughout the growing season. The positive correlation between GA, GGA and Hue and yield components (PW/PLT and Pods/PLT) indicates that improving GA, GGA and Hue will directly lead to improvement in yield components. The strong association between GA and LLS_AUDPC, GGA and LLS_AUDPC and Hue and LLS_AUDPC provides an opportunity for the development of LLS resistant cultivars through indirect selection. Because of polygenic nature of ELS and LLS (Younis et al., 2020), the direct/traditional selection is hindered by the environmental effect. When selecting based on GA, GGA, and Hue, however, our data indicate less environmental effect and higher heritability than for visual selection.
The PCA was used to determine genetic variability among the groundnut genotypes for both training and validation populations. PC1 contributed to 50.7% of the total variation for the training population and 65.2% for the validation population, and contrasted GA, GGA and Hue with LLS_AUDPC, ELS_AUDPC and CSI. This observation showed that genotypes that scored lower values for GA, GGA and Hue scored high values for LLS_AUDPC, ELS_AUDPC and CSI, and such genotypes should be discarded during selection. PC2, which accounted for 21% of the total variation for the training population and 11.7% for the validation population, was mainly influenced by yield components suggesting that genotypes with the highest contribution to PC2 could be targeted for yield improvement.
Significant correlations (p ≤ 0.001) were observed between predicted and the observed disease scores for all six prediction models. GA, GGA, and Hue angle, representing the number of green RGB-image method.
Conclusion
This study showed the potential of using RGB-image method as a high-throughput tool for phenotyping leaf spot diseases and yield components estimation in groundnut. Fast progress in groundnut improvement could be achieved when RGB-image method traits are use as surrogate traits for selecting leaf spots resistance in groundnut breeding programs in Ghana. GA, GGA, Hue, and CSI can successfully replace or, at least, complement the conventional methods for leaf spot diseases phenotyping in groundnut. This study reveals that photogrammetric techniques were more effective at the later rather than early stages of vegetation and when disease symptoms are ample.
Genotypes 73–33, Gha-GAF 1723:201909, Zam-ICGV-SM-07599:201909, and Oug-ICGV 90099:201909 were identified as promising sources for leaf spot diseases resistance and high yield components for the groundnut breeding programs in Ghana.
Data availability statement
The raw data supporting the conclusions of this article will be made available by the authors, without undue reservation.
Author contributions
ES conducted the experiments, analyzed the data and wrote the manuscript. RO-F coordinated the project, provided the materials, supervised the experiments, and reviewed and edited the manuscript. YK designed the experiments, assisted in data collection and statistical analysis, review and edited the manuscript, DP, JA-D, and AM assisted in trials establishment, data analysis, reviewed and edited the manuscript. AD and KO as academic supervisors, supervised the experiments and reviewed and edited the manuscript. MB acquired the funds, coordinated the project, supervised the experiments, and reviewed and edited the manuscript. AC helped in statistical analysis, reviewed and edited the manuscript. DH and JR acquired funding for the project, reviewed and edited the manuscript. All authors contributed to the article and approved the submitted version.
Funding
This project was funded by the USAID, Feed the Future Peanut Innovation Lab.
Acknowledgments
This study is made possible by the generous support of the American people through the United States Agency for International Development (USAID) through Cooperative Agreement No. 7200AA 18CA00003 to the University of Georgia as management entity for U.S. Feed the Future Innovation Lab for Peanut (2018–2023). The contents are the responsibility of the authors and do not necessarily reflect the views of USAID or the United States Government. We are grateful to the management of CSIR-Savanna Agricultural Research Institute most especially Francis Kusi, PhD (Director, CSIR-SARI) and the groundnut improvement program for technical support and also to the management of the crop science department of the University of Ghana especial Naalamle Amissah, PhD (Department Head), lecturers, non-teaching staff, and colleague students for their technical support.
Conflict of interest
AC was employed by company Bayer Crop Science.
The remaining authors declare that the research was conducted in the absence of any commercial or financial relationships that could be construed as a potential conflict of interest.
Publisher’s note
All claims expressed in this article are solely those of the authors and do not necessarily represent those of their affiliated organizations, or those of the publisher, the editors and the reviewers. Any product that may be evaluated in this article, or claim that may be made by its manufacturer, is not guaranteed or endorsed by the publisher.
Supplementary material
The Supplementary material for this article can be found online at: https://www.frontiersin.org/articles/10.3389/fpls.2022.957061/full#supplementary-material
References
Ajayi, A. T., and Gbadamosi, A. E. (2020). Genetic variability, character association and yield potentials of twenty-five accessions of cowpea (Vigna unguiculata L. Walp). J. Pure Appl. Agric. 5, 1–16.
Araus, J. L. (2018). Translating high-throughput phenotyping into genetic gain. Trends Plant Sci. 23, 451–466. doi: 10.1016/J.Tplants.2018.02.001
Atakora, W., and Kwakye, P. (2016). Measurement and modeling nitrous oxide emissions from ferric luvisols in the Guinea savanna agro-ecological zone of Ghana. Int. J. Phys. Soc. Sci. 10, 1–8. doi: 10.9734/IJPSS/2016/24165
Awada, L., Phillips, P. W. B., and Smyth, S. J. (2018). The adoption of automated phenotyping by plant breeders. Euphytica 214, 1–15. doi: 10.1007/S10681-018-2226-Z
Balota, M., and Oakes, J. (2017). UAV remote sensing for phenotyping drought tolerance in peanuts. in: Autonomous air and ground sensing systems for agricultural optimization and phenotyping II. Vol. 10218. SPIE, 81–87.
Balota, M., Payne, W. A., Evett, S. R., and Lazar, M. D. (2007). Canopy temperature depression sampling to assess grain yield and genotypic differentiation in winter wheat. Crop Science 47, 1518–1529. doi: 10.2135/cropsci2006.06.0383
Bilgin, O., Korkut, K. Z., Bașer, I., Dağlioğlu, O., Öztürk, I., Kahraman, T., et al. (2010). Variation and heritability for some semolina characteristics and grain yield and their relations in durum wheat (Triticum durum Desf.). World J. Agric. Sci. 6, 301–308. Available at: http://www.idosi.org/.../12.pdf
Denwar, N. N., Simpson, C. E., Starr, J. L., Wheeler, T. A., and Burow, M. D. (2021). Evaluation and selection of interspecific lines of groundnut (Arachis hypogaea L.) for resistance to leaf spot disease and for yield improvement. Plan. Theory 10:873. doi: 10.3390/plants10050873
Deshmukh, S. N., Basu, M. S., and Reddy, P. S. (1986). Genetic variability, character association and path analysis of quantitative traits in Virginia bunch varieties of ground nut. Indian J. Agric. Sci. 56, 816–821.
Dwivedi, S. L., Pande, S., Rao, J. N., and Nigam, S. N. (2002). Components of resistance to late leaf spot and rust among interspecific derivatives and their significance in a foliar disease resistance breeding in groundnut (Arachis hypogaea L.). Euphytica 125, 81–88. doi: 10.1023/A:1015707301659
Gaikpa, D. S., Akromah, R., Asibuo, J. Y., and Nyadanu, D. (2021). Molecular and phenotypic resistance of groundnut varieties to leaf spots disease in Ghana. J. Microbiol. Biotechnol. Food Sci. 2021, 1043–1048. doi: 10.15414/jmbfs.2017.6.4.1043-1048
Govindaraj, M., Selvi, B., Rajarathinam, S., and Sumathi, P. (2011). Genetic variability and heritability of grain yield components and grain mineral concentration in India's pearl millet (Pennisetum glaucum (L) R. Br.) accessions. Afr. J. Food Agric. Nutr. Dev. 11, 4758–4771. doi: 10.4314/ajfand.v11i3.66627
Gracia-Romero, A., Vergara-Díaz, O., Thierfelder, C., Cairns, J. E., Kefauver, S. C., and Araus, J. L. (2018). Phenotyping conservation agriculture management effects on ground and aerial remote sensing assessments of maize hybrids performance in Zimbabwe. Remote Sensing, 10:349. doi: 10.3390/rs10020349
Johnson, H. W., Robinson, H. F., and Comstock, R. E. (1955). Estimates of genetic and environmental variability in soyabean. Agron. J. 47, 314–318. doi: 10.2134/agronj1955.00021962004700070009x
Kant, S., Yadav, Y. P., Sanjiv, K., Manender, S., Anil, K., and Pavitra, D. (2012). Variability, heritability and genetic advance in pearl millet (Pennisetum glaucum L.) for implications of selection. Environment and Ecology, 30, 1378–1380.
Mofokeng, M. A., Mashilo, J., Rantso, P., and Shimelis, H. (2020). Genetic variation and genetic advance in cowpea based on yield and yield-related traits. Acta Agric. Scand. B. Soil Plant Sci. 70, 381–391. doi: 10.1080/09064710.2020.1749295
Mugisha, J., Ogwalo, R., Ekere, W., and Ekiyar, V. (2004). Adoption of IPM groundnut production technologies in eastern Uganda. Afr. Crop. Sci. J. 12, 383–391. doi: 10.4314/acsj.v12i4.27900
Ndamani, F., and Watanabe, T. (2014). Rainfall variability and crop production in Northern Ghana: the case of lawra district. Society for Social Management Systems Internet Journal. Available at: http://hdl.handle.net/10173/1261
Okwuagwu, C. O., Okoye, M. N., Okolo, E. C., Ataga, C. D., and Uguru, M. I. (2008). Genetic variability of fresh fruit bunch yield in deli/dura x tenera breeding populations of oil palm (Elaeis guineensis Jacq.) in Nigeria. J. Trop. Agric. 46, 52–57.
Omran, E. E. (2017). Early sensing of Peanut leaf spot using spectroscopy and thermal imaging. Arch. Agron. Soil Sci. 63, 883–896. doi: 10.1080/03650340.2016.1247952
Oppong-Sekyere, D. A., Akpalu, M. M., Ninfaa, A. D., Nyamah, E. Y., Braimah, M. M., et al. (2015). Participatory rural appraisal of constraints to groundnut (Arachis Hypogaea L.) production in northern Ghana. Internal J. Curr. Res. Acad. Rev. 3, 54–76.
Oteng-Frimpong, R., Konlan, S. P., and Denwar, N. N. (2017). Evaluation of selected groundnut (Arachis hypogaea L.) lines for yield and haulm nutritive quality traits. Int. J. Agron. 2017, 1–9. doi: 10.1155/2017/7479309
Owusu, E. Y., Amegbor, I. K., Darkwa, K., Oteng-Frimpong, R., and Sie, E. K. (2018). Gene action and combining ability studies for grain yield and its related traits in cowpea (Vigna unguiculata). Cogent. Food Agric. 4:1519973. doi: 10.1080/23311932.2018.1519973
R Core Team (2018). R: A Language and Environment for Statistical Computing. Vienna, Austria: R Foundation for Statistical Computing.
Rife, T. W., and Poland, J. A. (2015). Field book: an open-source application for field data collection on android. Crop Science 54, 1624–1627. doi: 10.2135/cropsci2013.08.0579
Rueden, C. T., and Eliceiri, K. W. (2017). The ImageJ ecosystem: an open and extensible platform for biomedical image analysis. Microsc. Microanal. 23, 226–227. doi: 10.1017/S1431927617001817
Savanna Agricultural Research Institute (2012). Production Guide on Cowpea (Vigna unguiculata L. Walp). Tamale, Ghana: Savanna Agricultural Research Institute.
Schindelin, J., Arganda-Carreras, I., Frise, E., Kaynig, V., Longair, M., Pietzsch, T., et al. (2012). Fiji: an open-source platform for biological-image analysis. Nat. Methods 9, 676–682. doi: 10.1038/nmeth.2019
Shaner, G., and Finney, R. E. (1977). The effect of nitrogen fertilization on the expression of slow-mildewing resistance in Knox wheat. Phytopathology 77, 1051–1056. doi: 10.1094/Phyto-67-1051
Shukla, S., Bhargava, A., Chatterjee, A., Srivastava, A., and Singh, S. (2006). Genotypic variability in vegetable amaranth Amaranthus tricolor L for foliage yield and its contributing traits over successive cuttings and years. Euphytica 151, 103–110. doi: 10.1007/s10681-006-9134-3
Singh, M. P., Erickson, J. E., Boote, K. J., Tillman, B. L., Jones, J. W., and Van Bruggen, A. H. (2011). Late leaf spot effects on growth, photosynthesis, and yield in peanut cultivars of differing resistance. Agron. J. 103, 85–91. doi: 10.2134/agronj2010.0322
Singh, A. K., Sharma, P., and Singh, P. K. (2013). Studies on genetic characteristic of upland rice (Oryza sativa L.). Int. J. Agric. Environ. Biotechnol. 6, 515–520. doi: 10.5958/j.2230-732X.6.4.025
Subrahmanyam, P., McDonald, D., Waliyar, E., Reddy, L. J., Nigam, S. N., Gibbons, R. W., et al. (1995). Screening methods and sources of resistance to rust and late leaf spot of groundnut. (In En. Summaries in En, Fr, Sp, and Pt.) Information Bulletin no. 47. Patancheru 502 324, Andhra Pradesh, India: International Crops Research Institute for the Semi-Arid Tropics. p. 24.
Tsegaye, E., Sastry, E. V., and Dechassa, N. (2007). Genetic variability for yield and other agronomic traits in sweet potato. Indian J. Hortic. 64, 237–240. doi: 10.3923/ja.2007.94.99
Tshilenge-Lukanda, L., KKC, N., Kalonji-Mbuyi, A., and RV, K. (2012). Epidemiology of the groundnut (Arachis hypogaea L.) leaf spot disease: genetic analysis and developmental cycles. American Journal of Plant Sciences, 3:4. doi: 10.4236/ajps.2012.35070
Tyroler, C. (2018). Gender Considerations For Researchers Working in Groundnuts. USAID Feed the Future, 1–32.
Visscher, P. M., Hill, W. G., and Wray, N. R. (2008). Heritability in the genomics era—concepts and misconceptions. Nat. Rev. Genet. 9, 255–266. doi: 10.1038/nrg2322
Walle, T., Wakjira, A., and Mulualem, T. (2014). Analysis of genetic parameters on Ethiopian mustard (Brassica carinata A. Braun) genotypes in northwestern Ethiopia. Plant Breed. Seed Sci. 69, 25–34. doi: 10.1515/plass-2015-0003
Wei, T., Simko, V., Levy, M., Xie, Y., Jin, Y., and Zemla, J. (2017). R Package “Corrplot”: Visualization of a Correlation Matrix (Version 0.84). e24. Available at: https://github.com/taiyun/corrplot
White, J. W., Andrade-Sanchez, P., Gore, M. A., Bronson, K. F., Coffelt, T. A., Conley, M., et al. (2012). Field-based Phenomics For plant genetics research. Field Crop Res. 133, 101–112. doi: 10.1016/J.Fcr.2012.04.003
Younis, A. S. M., Nassar, S. M. A., Al-Naggar, A. M. M., and Bakry, B. A. (2020). Phenotypic assessment of genetic diversity among twenty groundnut genotypes under well-watered and water-stressed conditions using multivariate analysis. Asian J. Plant Sci. 19, 474–486. doi: 10.3923/ajps.2020.474.486
Zanklan, A. S. (2003). Agronomic performance and genetic diversity of the root crop yam bean (Pachyrhizus spp.) under west African conditions. Doctoral Dissertation submitted for the degree of Doctor of Agricultural Sciences to the Faculty of Agricultural Sciences Georg-August University, Gottingen-Germany. pp. 134.
Keywords: RGB image, phenotyping, leaf spot, diseases, groundnut, selection
Citation: Sie EK, Oteng-Frimpong R, Kassim YB, Puozaa DK, Adjebeng-Danquah J, Masawudu AR, Ofori K, Danquah A, Cazenave AB, Hoisington D, Rhoads J and Balota M (2022) RGB-image method enables indirect selection for leaf spot resistance and yield estimation in a groundnut breeding program in Western Africa. Front. Plant Sci. 13:957061. doi: 10.3389/fpls.2022.957061
Edited by:
Mohan Lal, North East Institute of Science and Technology (CSIR), IndiaReviewed by:
Yu-Chien Tseng, National Chiayi University, TaiwanArati Yadawad, University of Agricultural Sciences, Dharwad, India
Copyright © 2022 Sie, Oteng-Frimpong, Kassim, Puozaa, Adjebeng-Danquah, Masawudu, Ofori, Danquah, Cazenave, Hoisington, Rhoads and Balota. This is an open-access article distributed under the terms of the Creative Commons Attribution License (CC BY). The use, distribution or reproduction in other forums is permitted, provided the original author(s) and the copyright owner(s) are credited and that the original publication in this journal is cited, in accordance with accepted academic practice. No use, distribution or reproduction is permitted which does not comply with these terms.
*Correspondence: Maria Balota, mbalota@vt.edu
†ORCID: Yussif Baba Kassim, https://orcid.org/0000-0002-3994-5066