 Alejandro Carmona
 Josefa Rubio
 Teresa Millan
 Juan Gil
 Jose V. Die
 Patricia Castro
- 1Department of Genetics Escuela Técnica Superior de Ingeniería Agronómica y de Montes (ETSIAM), University of Córdoba, Córdoba, Spain
- 2Área de Mejora y Biotecnología, Instituto Andaluz de Investigación y Formación Agraria, Pesquera, Alimentaria y de la Producción Ecológica IFAPA, Córdoba, Spain
Ascochyta blight, caused by the fungal pathogen Ascochyta rabiei, is a devastating biotic stress that poses a significant threat to chickpea cultivation worldwide. To combat this disease, breeding programs have focused on developing cultivars with resistance to Ascochyta blight. However, a comprehensive understanding of the underlying plant defense mechanism is still lacking. To identify genomic regions associated with resistance, a recombinant inbred line (RIL) population was created by crossing ILC3279 (kabuli, resistant) and WR315 (desi, susceptible), which was then phenotyped and sequenced using a tuneable genotyping-by-sequencing (tGBS) protocol to obtain single nucleotide polymorphisms (SNPs). We further validated the association of genomic regions with Ascochyta blight resistance in a second recombinant inbred line population derived from the cross between JG62 (desi, susceptible) and ILC72 (kabuli, resistant). Our analysis identified four genomic regions associated with Ascochyta blight resistance in chromosomes 2 and 4, among which a region spanning from 3.52 to 8.20 Mb in chromosome 4 was the most robust candidate for resistance, being associated with resistance in both years and populations. A total of 30 genes from the identified regions were selected as robust candidates, and LOC101507066, which encodes a leucine-rich repeat receptor-like protein kinase, was the most robust candidate gene, as it plays critical roles in plant stress responses and immunity. Our findings have potential to accelerate marker-assisted genetic improvement and facilitate the development of integrated strategies for crop protection.
1 Introduction
Chickpea (Cicer arietinum L.) is a self-pollinated legume, with eight pairs of chromosomes and a relatively small genome of ~738Mb (Arumuganathan and Earle, 1991). C. arietinum is the only cultivated species in the genus Cicer. Compared with other legumes, its lower concentration of antinutritional factors and higher concentration of carbohydrates and proteins make chickpea a valuable nutritional source (Wood and Grusak, 2007). Chickpea is also one of the most important pulses, cultivated primarily for food in the five continents (Africa, America, Asia, Europe and Oceania), with an area and annual production of approximately 15 million hectares and 16 million tonnes respectively (FAOSTAT, 2021). There are two different types of cultivated chickpea: kabuli type, with white flowers and large, cream-colored seeds, preferred in the Mediterranean countries and desi type, with purple flowers and small, dark, angular seeds, mainly cultivated in Asia.
A major constraint limiting the chickpea production in more than 40 countries is Ascochyta blight (AB) disease that can cause a yield loss of 10-100% (Singh et al., 2022). AB is caused by the fungus Ascochyta rabiei (Pass.) Labr. that infects all above ground parts of the plant and survives on infested crop residues and seeds (Pande et al., 2005). Genetic resistance to AB is a complex trait to evaluate with low-to-moderate heritability and is highly influenced by environmental conditions. It has been reported different models of inheritance or AB resistance in chickpea, from qualitative to quantitative (Kaur and Singh, 2009). Those differences may be attributed to variations in the isolates, genotypes tested or screening methods. Initial studies suggested that AB resistance in chickpea is due to either a single dominant or a recessive gene (Singh and Reddy, 1991). More recent studies using recombinant inbred lines (RILs) show a continuous distribution of the disease response, and now resistance to AB in chickpea is accepted to be a quantitative trait controlled by a polygenic inheritance. Fungicides are not effective for the management of AB since sexual reproduction might provide the pathogen with resistance (Crociara et al., 2022), so these days the use of resistant varieties is considered the most efficient and sustainable management strategy. The development of blight tolerant lines has made the introduction of winter sowing possible in the Mediterranean region, notably increasing chickpea production that could be doubled (Millan et al., 2015). Thus, a number of AB resistant sources have been identified and used in breeding programs although complete resistance is not available yet (Collard et al., 2003; Du et al., 2012; Gayacharan et al., 2020; Newman et al., 2021; Shah et al., 2021).
So far, a number of quantitative trait loci (QTL) associated with AB resistance with low-to-moderate effects have been identified and located in all linkage groups (LG) of chickpea (Singh et al., 2022). Among the identified QTLs, two major ones (QTLAR1 and QTLAR2) have recurrently appeared in different crosses on LG4 (Santra et al., 2000; Flandez-Galvez et al., 2003; Millan et al., 2003; Udupa and Baum, 2003; Cho et al., 2004; Tekeoglu et al., 2004; Iruela et al., 2006; Tar’an et al., 2007; Madrid et al., 2012; Labdi et al., 2013; Sabbavarapu et al., 2013; Stephens et al., 2014). Garg et al. (2018) identified three minor QTLs on LG4 in seedling and adult plants, one of them flanked by markers ICCM0068 and CaM1158, and two of them by CKAM0847 and CKAM0964. Using a multiple QTL‐sequencing approach, Kumar et al. (2018) identified two major QTLs, qABR4.1 and qABR4.2, and a minor QTL, qABR4.3, on LG4 considering CaAHL18 a candidate gene for its possible implication in AB resistance. Deokar et al. (2019a), using next-generation sequencing (NGS) based on the bulk segregant analysis (BSA) approach in two RIL populations identified various QTLs on chromosomes Ca1, Ca4, Ca6 and Ca7. The QTLs on Ca4 were detected in both populations and overlapped with the previously reported QTLs indicating conserved regions for AB resistance across different chickpea genotypes.
NGS technologies have enabled high-throughput identification of genome-wide SNPs and cost-effective platforms for direct detection of high-quality SNP markers for genotyping mapping populations (Mardis, 2008; Schuster, 2008; Varshney et al., 2009). However, the high number of markers becomes a limitation for linkage maps and QTL mapping software to handle. To manage large datasets, a bin mapping approach has been employed in various crop plants (Chen et al., 2014; Qi et al., 2014; Han et al., 2016; Su et al., 2017). This approach uses a parent-dependent sliding window to identify true recombination breakpoints through SNP genotyping data of the entire RIL population and uses these recombination bins, instead of SNPs, to construct haplotype maps. The genotyping-by-sequencing (GBS) method is widely used for obtaining SNP markers and has been applied successfully in various species for genetic studies. However, GBS has limitations such as a high proportion of missing data and a small, but often uncorrected, percentage of SNP genotyping errors. To solve these issues, the tuneable GBS (tGBS) method has been developed, where only double-digested fragments are amplified and sequenced, improving genotyping accuracy and reducing the missing rate (Ott et al., 2017). Another method to reduce missing data is the sliding-window bioinformatics approach, where SNPs with identical genotypes are grouped into bins to mark recombination locations across the population. This bin-map method has been shown to be more effective in detecting QTLs and has been used to identify candidate genes for drought tolerance in chickpea (Kale et al., 2015).
In previous studies, we detected QTLs associated with AB resistance on Ca2 and Ca4 using a RIL population from the cross ILC3279 x WR315 (Iruela et al., 2006). However, the genetic map relied mainly on simple sequence repeat (SSR)/Gene-specific markers with limited density. So far, advanced lines including ILC3279/ILC72 as source of resistance have provided good yields under winter sowing conditions when combined with sound agronomic practices. However, the lack of useful markers has hindered the efficient selection of tolerant genotypes. To address this, in this study we aimed at generating SNP markers to increase marker density, construct haplotype maps, and precisely identify the regions linked to AB resistance previously found in the RIL population. Furthermore, we aligned these regions with gene-based SNP markers designed by other researchers to validate their effectiveness in our breeding program. Lastly, we present a list of candidates with a potential role in AB resistance.
2 Materials and methods
2.1 Plant material and phenotyping
Eighty-four RILs (F6:7) from a population (RIP8) derived from the cross between ILC3279 and WR315 were used to identify genomic regions associated with AB resistance. Another population (RIP10) consisting of 81 RILs from the cross between JG62 and ILC72 was also analyzed for validation of results. ILC3279 and ILC72 are partially AB-resistant kabuli cultivars (maintained by the International Center for Agricultural Research in the Dry Areas, ICARDA), while WR315 and JG62 are AB-susceptible desi landraces from Central India (maintained by the International Crop Research Institute for the Semi-Arid Tropics, ICRISAT). Both populations were evaluated in field conditions with two replicates using chickpea debris and ‘Blanco Lechoso’ as a spreader, following the methodology in Iruela et al. (2006). Phenotypic data for years 2002 and 2003 from a previous study were used for identification of genomic regions associated with AB resistance in RIP8 (Iruela et al., 2006).
2.2 SNP genotyping
The genotypic data of the parents and the RILs from RIP8 and RIP10 were generated using tGBS by Freedom Markers (Ott et al., 2017) with the restriction enzyme Bsp1286I on fresh leaf tissue. The DNA from both parents and the RILs were sequenced using an Illumina HiSeq X instrument, and quality trimmed sequence reads (PHRED quality score ≤ 15) were aligned to the CDC Frontier genome assembly v1 (Varshney et al., 2013, ASM33114v1 assembly) using GSNAP aligner v2019-09-12 (Wu and Nacu, 2010). Confidently mapped reads were filtered if they mapped uniquely (≤ 2 mismatches every 36 bp and < 5 bases for every 75 bp as tails) and used for subsequent analyses. Nineteen samples (10 for RIP8 and 9 for RIP10) were double-sequenced as a control of genotyping and data imputation. From the identified SNPs, a set in which each marker was genotyped in at least 50% of the samples was generated and referred to hereafter as MCR50 SNPs (minimum call rate per SNP). Finally, imputation was performed on the MCR50 SNPs using Beagle v5.4 (Browning et al., 2018) with default parameters and a VCF file containing the genotype as input. The SNPs that did not map to any linkage group after imputation were excluded from further analysis. SNPs with a minor allele frequency ≤ 5% and heterozygosity ≥ 10% were filtered as potential sequencing errors, resulting in a final dataset of high-quality polymorphic and homozygous markers. The dataset was combined with SSR/Gene-specific markers data from our previous studies (Iruela et al., 2006) for the association analysis.
2.3 Association analysis and development of a physical map
A marker-trait association analysis was conducted to identify genomic regions associated with AB resistance using the general linear model (GLM) function implemented in the TASSEL software v5.2.87 (Bradbury et al., 2007). For association analysis, P < 0.001 was considered significant, corresponding with logarithm of odds (LOD) ≥ 3. Markers with a LOD ≥ 3 were considered associated with AB resistance and kept for further analysis. The R2 values indicate the proportion of phenotypic variation explained by the marker. The final set of SNPs was organized into recombination bins to construct the haplotype map and conduct QTL mapping through association analysis (Supplementary Files 1 & 2). Recombination bins were defined as regions between two recombination points, considering a recombination point when more than 10% of lines showed recombination events, with a minimum distance of 0.50 Mb between these events. A physical map was developed to accurately locate the physical regions linked to AB resistance. The map integrates the bins, SSR/Gene-specific markers associated with AB resistance previously identified in our study, as well as KASP and SNP markers reported by Deokar et al. (2019b) presumably located in targeted areas which should be validated. SSR/Gene-specific markers were mapped onto the reference genome (ASM33114v1 assembly, NCBI) using the Primer-BLAST tool from NCBI. It is worth noting that the reference genome assembly v2.6 used by Deokar et al. (2019b) differs from the NCBI version. Hence, we repositioned those markers using the reference ASM33114v1 to align their QTLs with the QTLs found in this study. The primers for SNPs flanking QTLs were obtained from the Knowpulse database (Sanderson et al., 2019).
2.4 Functional annotation
Candidate genes were selected based on the functional annotation performed with software Blast2GO v6.0.3 (Conesa and Götz, 2008) on robust candidate bins. Gene sequences within robust candidate bins were downloaded from Genome Data Viewer in NCBI. The annotation was performed using the default parameters provided in Blast2GO. To perform a higher quality annotation, an InterProScan analysis using default parameters was performed in BLAST2GO and combined with the results from the annotation.
3 Results
3.1 Genotyping and distribution of SNPs
We performed a comprehensive analysis of the genetic variation in two populations resulting in the identification of 7,874 SNPs in RIP8 and 9,605 SNPs in RIP10, with a missing data rate of 26.9%. To ensure the accuracy of the results, SNPs with missing data higher than the minimum criteria (MCR50) were filtered out, and the remaining missing data (12.9% and 16.5% for RIP8 and RIP10, respectively) were imputed with a high accuracy (99.997% coincidence with the control samples). This resulted in 4,404 SNPs in RIP8 and 5,798 in RIP10. Subsequently, the data were further scrutinized to remove any SNPs located in scaffolds or those that could be attributed to sequencing errors. After this additional filtering, the final data set consisted of 1,084 high-quality SNPs for RIP8 and 1,184 SNPs for RIP10.
The physical mapping of the SNPs was conducted across the eight chromosomes (Table 1). On average, there were 135.5 SNPs per chromosome in RIP8 and 148 in RIP10. However, there were significant differences in the distribution of SNPs per chromosome. In RIP8, the highest number of SNPs was found on Ca4 (32.2%), while the lowest was found on Ca5 (2.9%), despite having a similar size. A similar pattern was also observed in RIP10, with Ca4 showing the highest number of SNPs (33.9%) and Ca5 the lowest (3.1%). Thus, the size of a chromosome did not correlate with the number of SNPs it contained (Supplementary File 3). This supports that the distribution of SNPs is not random and some chromosomes contain more variations than others, with the highest variation level on Ca4 in both RIPs. Furthermore, the density of SNPs was not constant across all chromosomes with some genomic regions highly saturated and some others showing a low level of saturation (Table 1 and Figure 1). These findings highlight the complex and non-uniform distribution of SNPs in the chickpea genome.
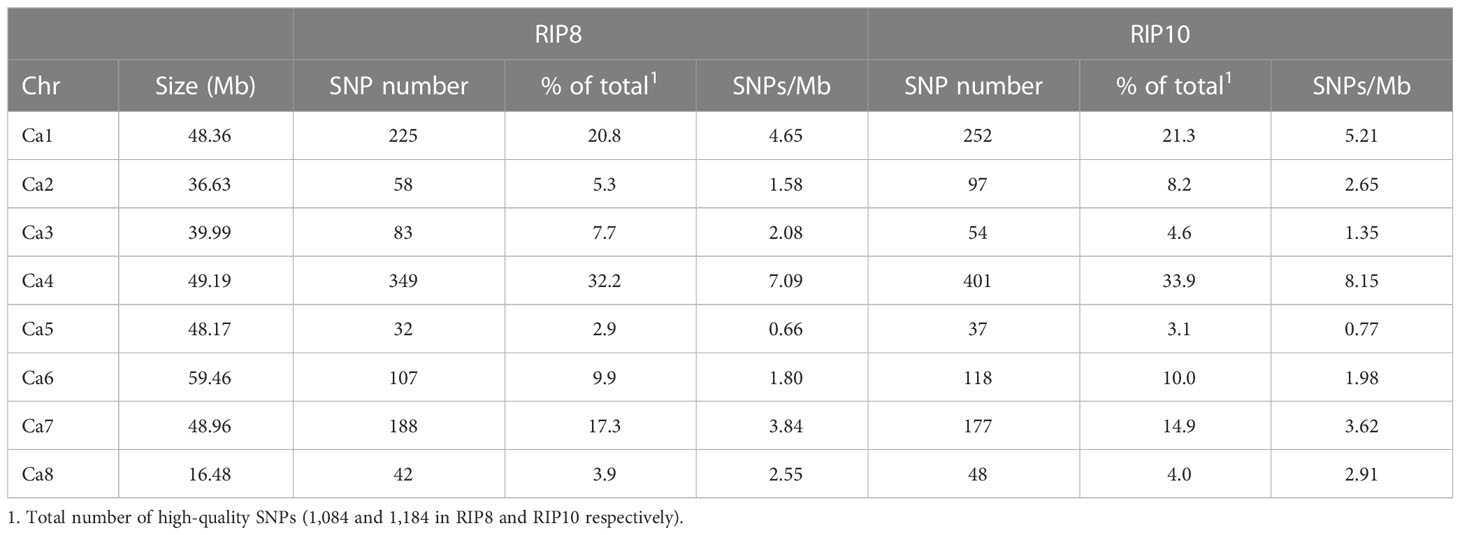
Table 1 Number of SNPs per chromosome in populations RIP8 (ILC3279 x WR315) and RIP10 (JG62 x ILC72).
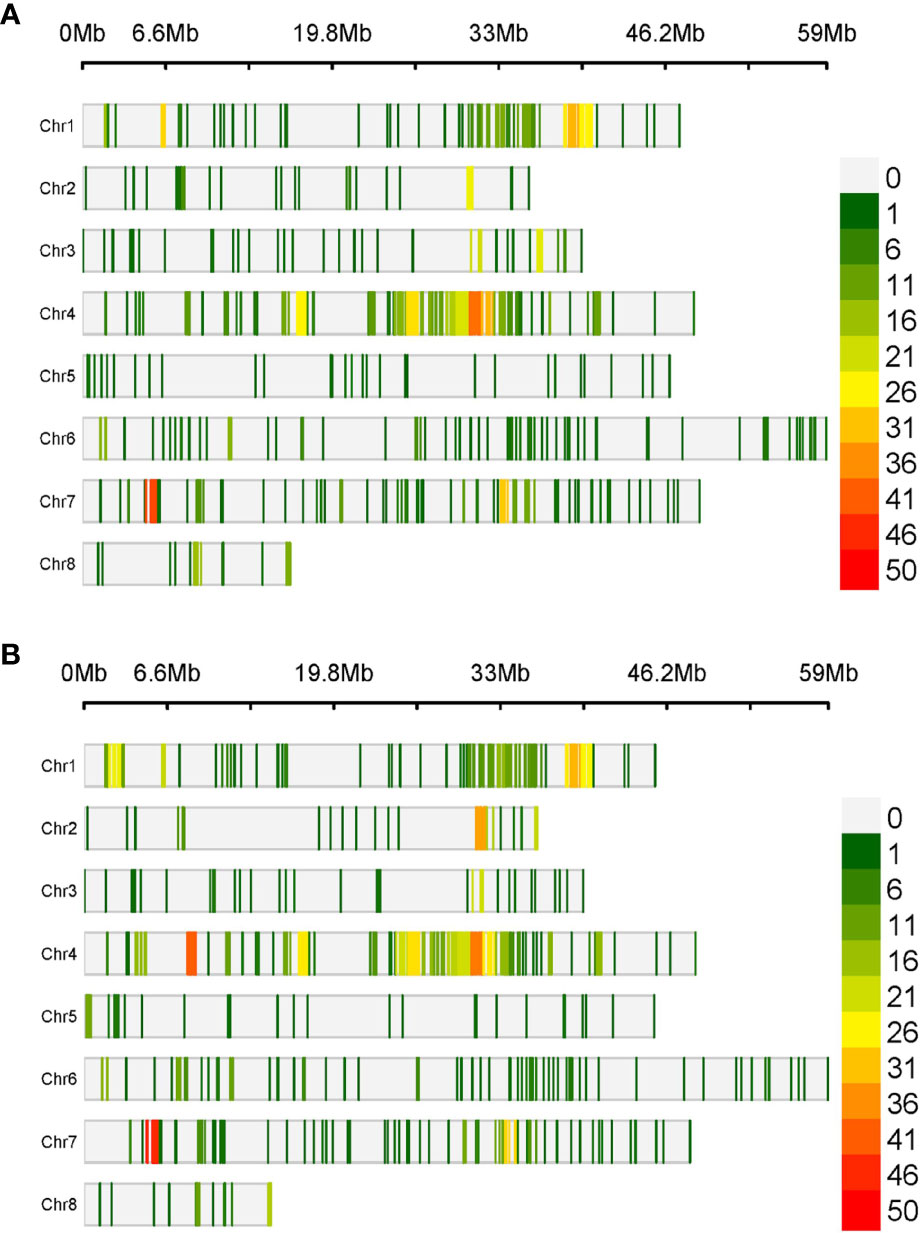
Figure 1 Density of SNPs in a 1 Mb window size over the eight chickpea chromosomes in (A) RIP8 (ILC3279 x WR315) and (B) RIP10 (JG62 x ILC72).
3.2 Identification of genomic regions associated with AB resistance and validation of QTLs
The association analysis on RIP8 identified 32 SNPs that were significantly associated with AB resistance in 2002. These SNPs were located in the chromosomes Ca2 and Ca4 and explained from 14.3% to 27.4% of the phenotypic variation. In 2003, the significant SNPs were located only in Ca4, accounting for 13.6% to 44.2% of the phenotypic variation. Noteworthy, a total of 68 different SNPs was significantly associated with AB resistance in both 2002 and 2003 (Figure 2). Chromosome Ca4 had the highest number of significant SNPs (42), and was the only chromosome involved in AB resistance in both years.
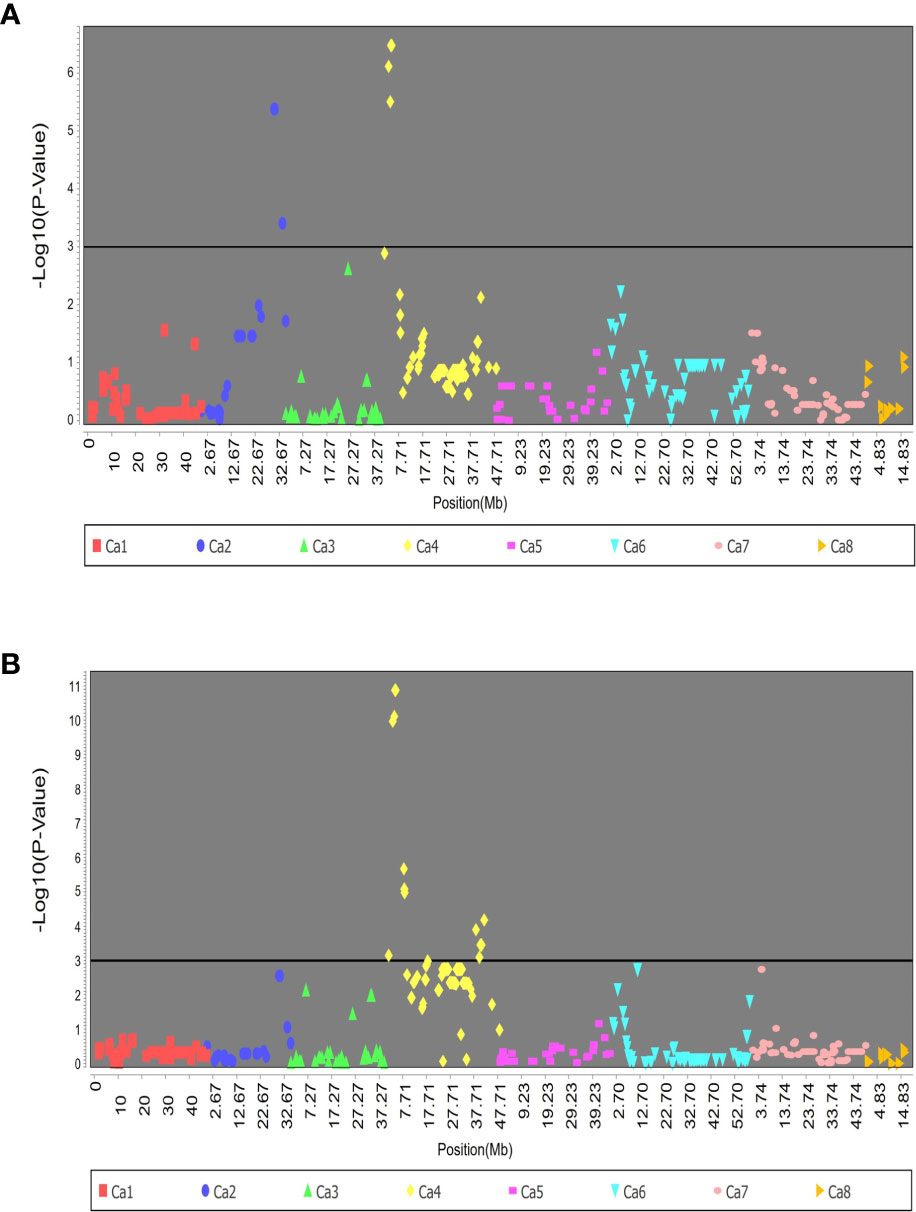
Figure 2 Association of SNPs with AB resistance evaluated in RIP8 (ILC3279 x WR315) in years (A) 2002 and (B) 2003.
All the alleles conferring AB resistance in the 68 associated SNPs list were inherited from the resistant parent ILC3279. To further validate the implication of the associated SNPs, the genotype of a pool of 20 RILs with extreme values (10 resistant and 10 susceptible) was analyzed. The analysis revealed that the resistant lines inherited the majority of SNPs from the resistant parent, while susceptible lines were genetically closer to the susceptible parent (Supplementary File 4).
The SNPs of RIP8 were organized into recombination bins and used for creating haplotype maps. The average number of bins per chromosome was 11.4, with the lowest number found in Ca8 (three) and the highest one in Ca6/Ca7 (16). The size of the bins ranged from 0.52 to 19.25 Mb, with an average of 3.82 Mb (Supplementary Files 1, 2). The significant SNPs in RIP8 were located in six bins covering three different genomic regions (Figure 3). One region is at the end of Ca2 (bins H and I) and two at both terminal ends of Ca4 (bins A, B, C and I). Bins H and I in Ca2 covering 4.83 Mb showed association in 2002. Bins A, B and C in Ca4 covering 11.25 Mb and bin I covering 10.59 Mb were associated with AB resistance in 2003. Only bin B in Ca4 showed association in 2002 and 2003 (Table 2).
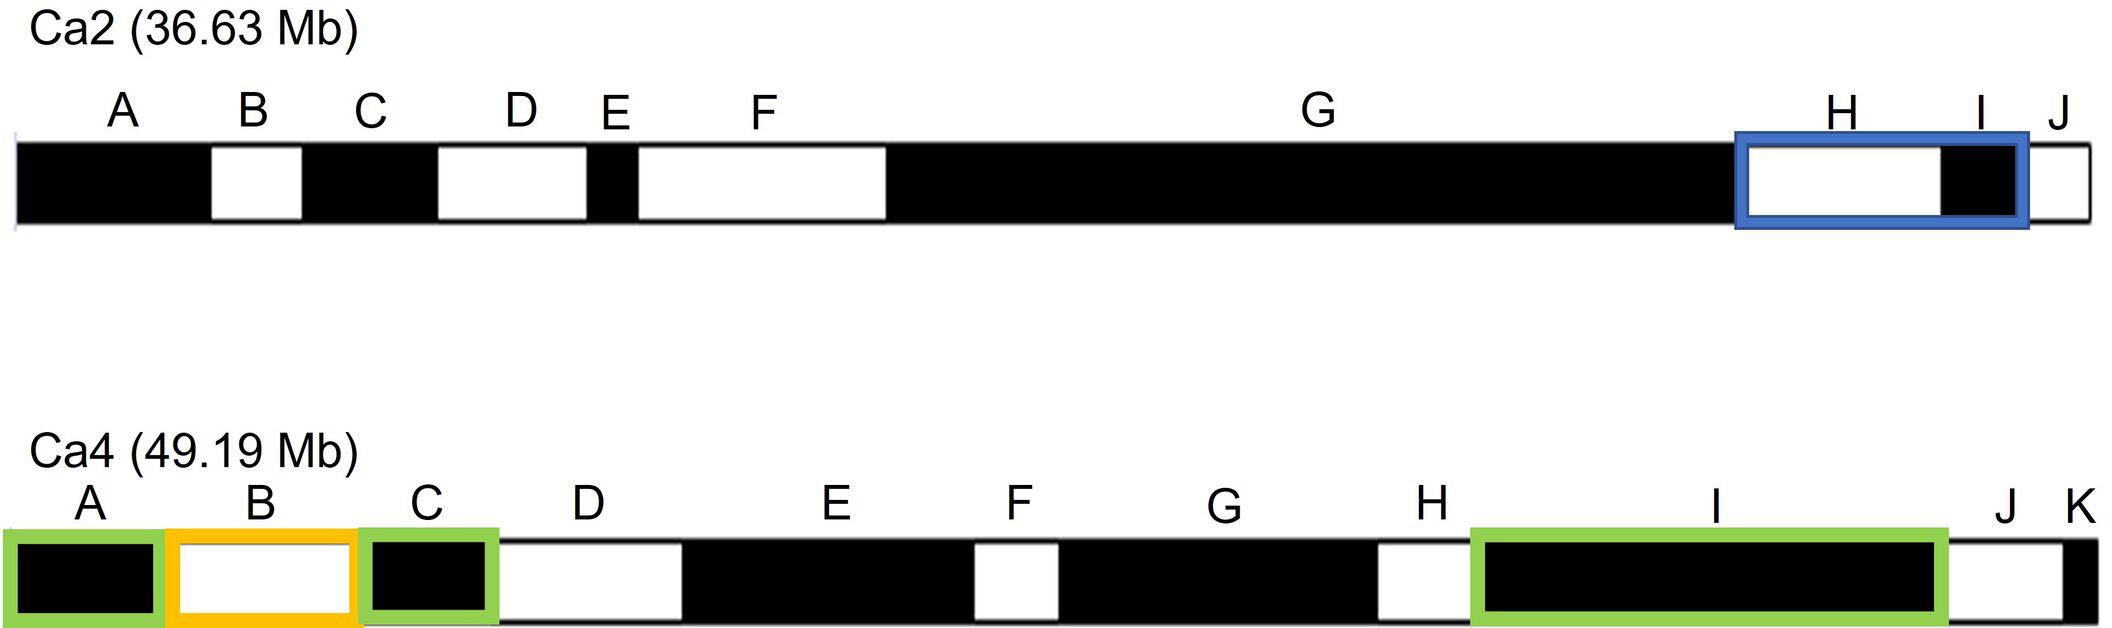
Figure 3 Schematic representation of bins in Ca2 and Ca4 for RIP8 (ILC3279 x WR315). Bins with significant association with AB resistance after SNP association analysis are highlighted in blue and green for years 2002 and 2003 respectively, while the bin with significant association for both years is marked in orange.
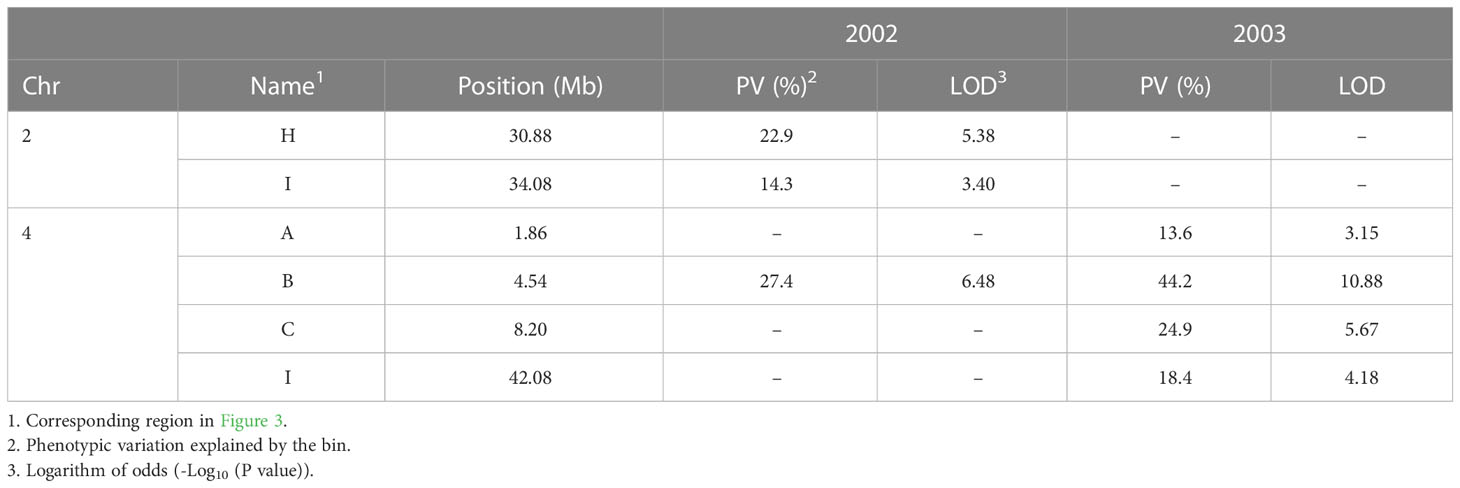
Table 2 Statistics for significant bins for RIP8 (ILC3279 x WR315) associated with AB resistance using 2002 and 2003 evaluation data after SNP association analysis.
To compare the genomic regions associated with AB resistance in this study with those previously identified by our group, an association analysis was performed using 76 SSR/Gene-specific markers genotyped in the population RIP8 (Iruela et al., 2006; Iruela et al., 2007; Madrid et al., 2012; Madrid et al., 2014). Next, the markers associated with AB resistance were physically positioned in the reference genome to determine the bin where they were located. Most markers were located within the bins that we reported after SNP association analysis as associated with AB in Ca2 (bin I) and Ca4 (bins B, C) and had similar values of phenotypic variation to those explained by the bins (Supplementary File 5). Three markers showed association with AB resistance but could not be unambiguously positioned in the reference chickpea genome. Markers TR58 and TA53 were located within the coordinates of bin G in Ca2, which was not associated with AB resistance when analyzing SNP data. Marker GA20 was within coordinates of bin I in Ca2 and explained a similar phenotypic variation as the SNPs in this bin. Markers NCPGR91, CaETR-1 and LOC101508966 were located within coordinates of bin B in Ca4 and also showed association in both years, which supports the association analysis obtained with the SNPs. Bin G in Ca4 was not associated with AB resistance using SNPs, but 4 SSR/Gene-specific markers in this bin were significantly associated (Supplementary File 5).
To confirm the results of the genomic regions associated with AB resistance in RIP8, the population RIP10 was phenotyped. The AUDPC data followed a normal distribution and the mean AUDPC value for the parental lines was significantly different (Figure 4).
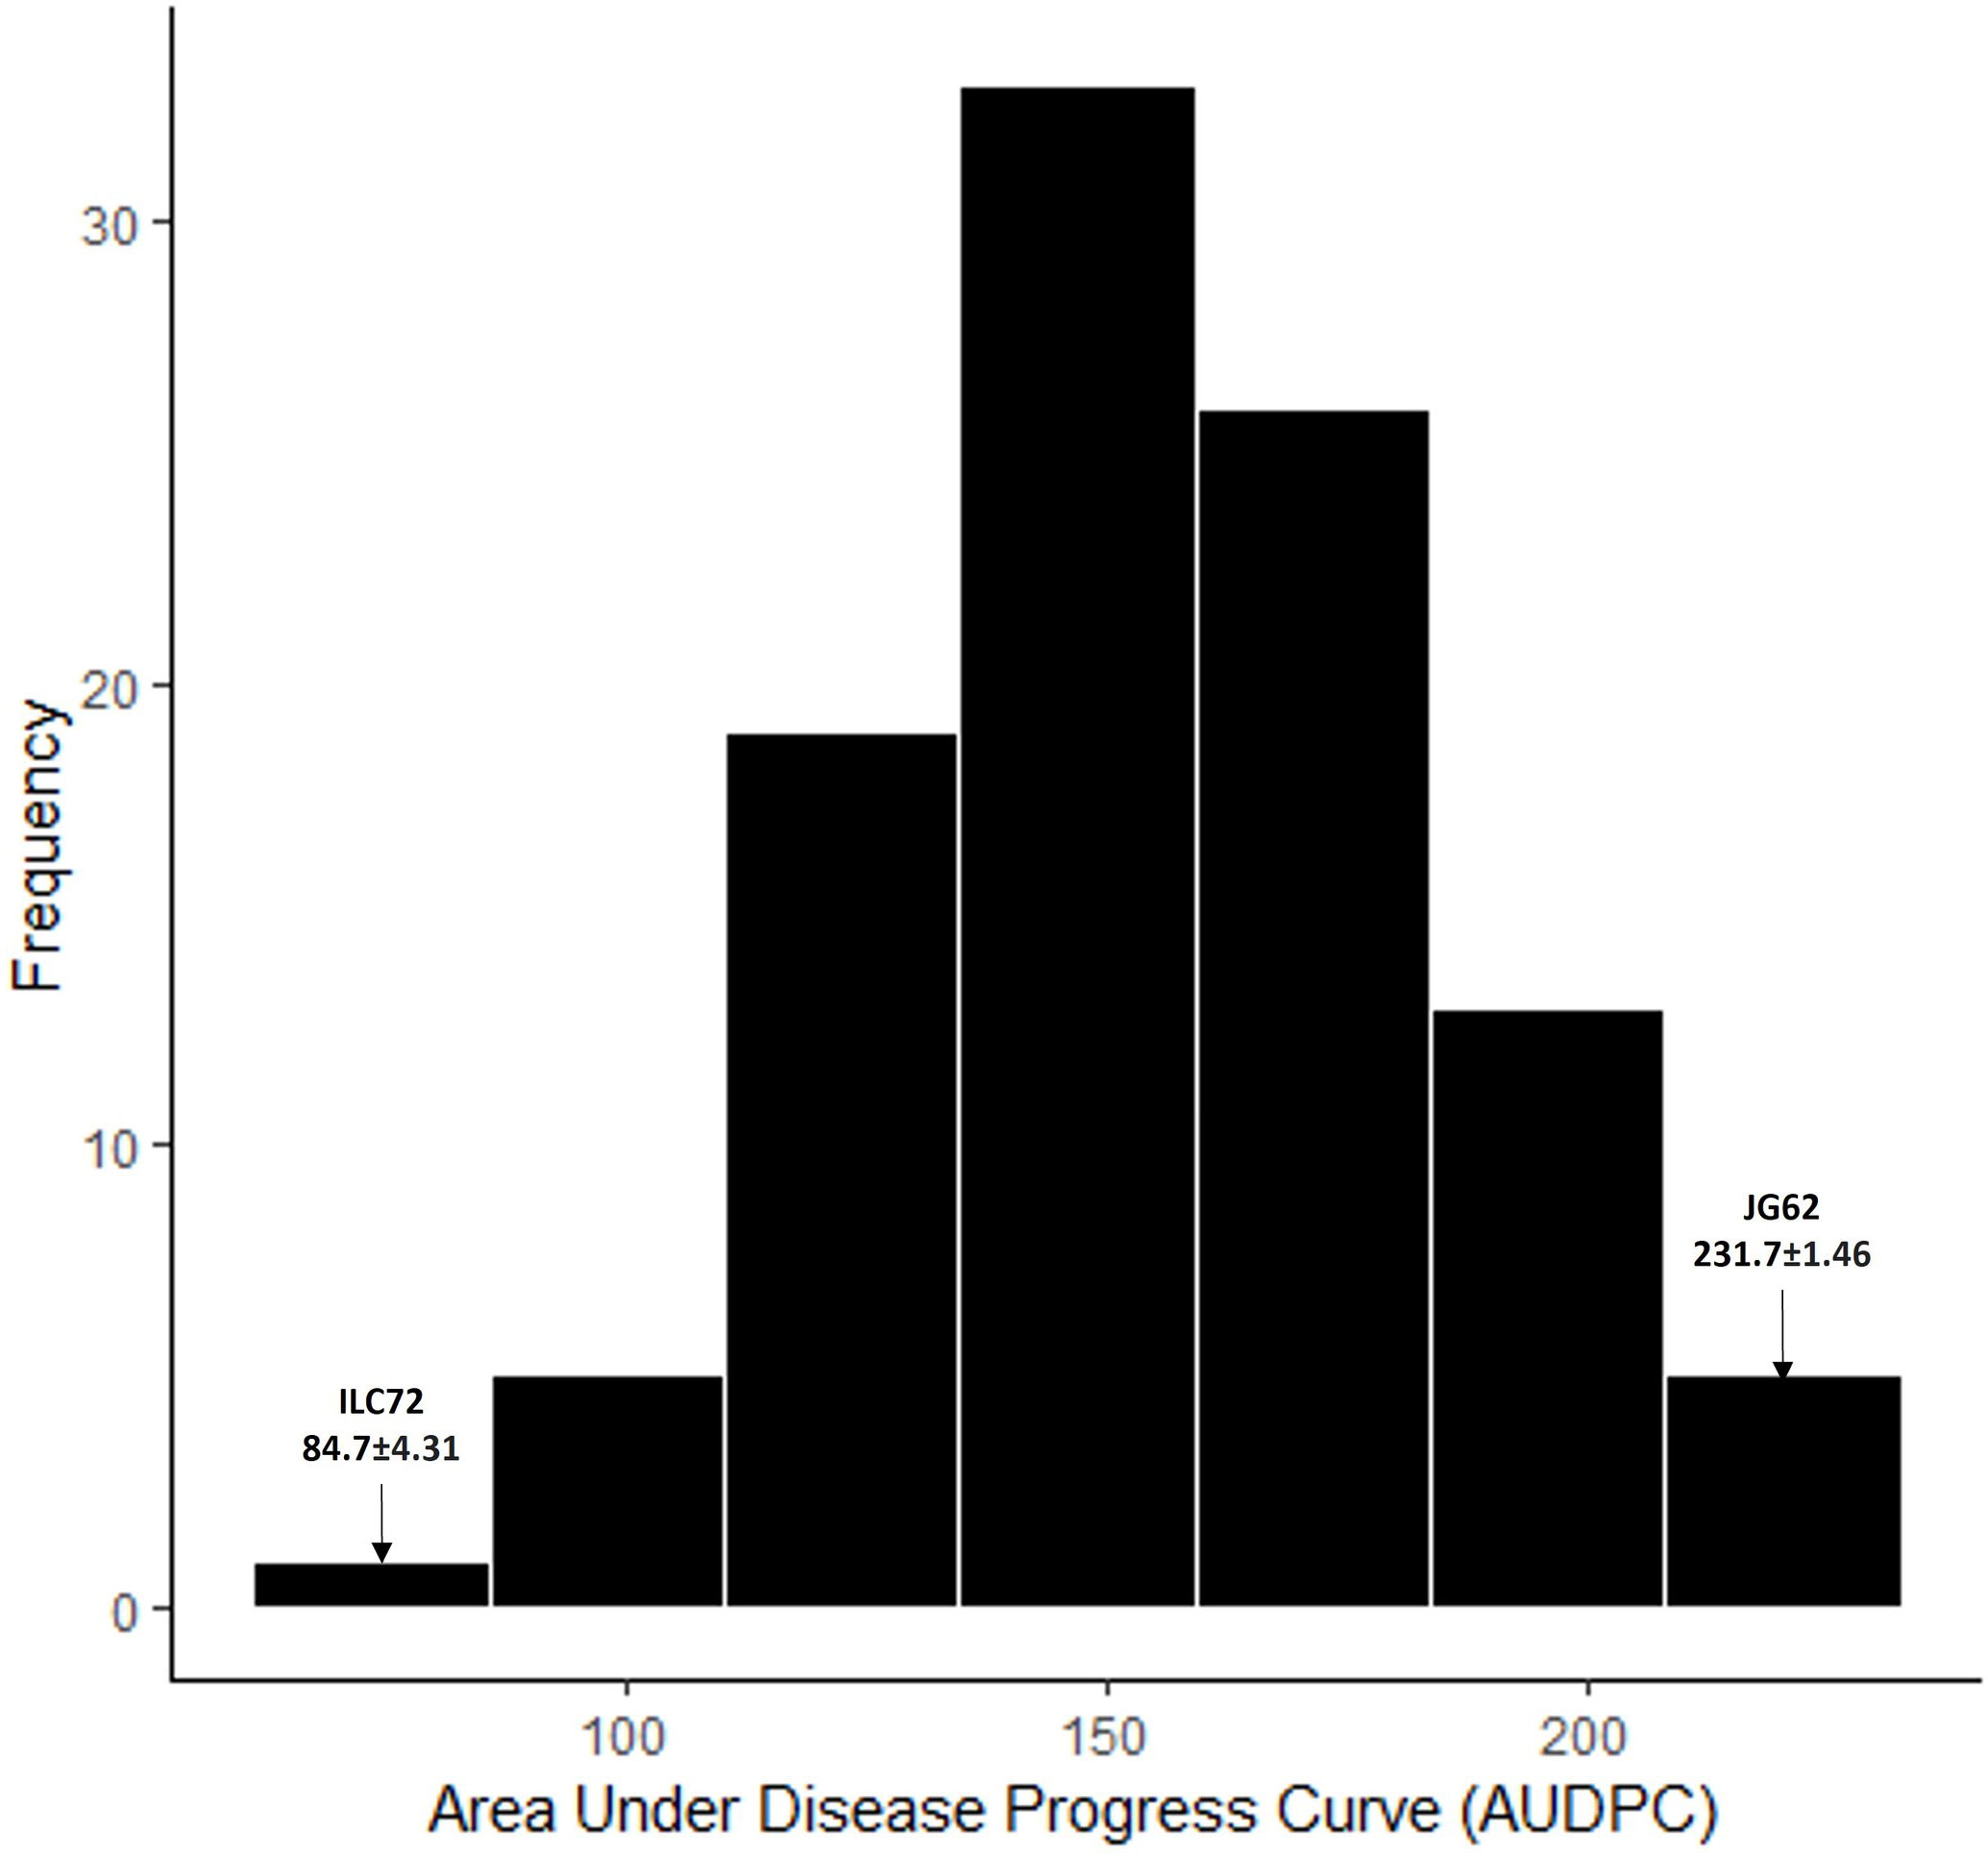
Figure 4 Frequency distribution for AUDPC values phenotyped in RIP10 (JG62 x ILC72) scored for Ascochyta blight disease in 2003. Parental values are marked with an arrow.
After association analysis, haplotype maps were developed for RIP10 following the same methodology as for RIP8 (Supplementary File 1). There was an average of 9.25 bins per chromosome, with the lowest number found in Ca8 (five) and the highest in Ca6/Ca7 (13). The bin size in this population varied from 0.50 to 28.56 Mb, with an average size of 4.69 Mb per bin. Only bin A in Ca4 (0-8.20 Mb) was associated with AB resistance in RIP10, explaining 26.6% of the phenotypic variation. The coordinates of this bin overlap with bins A and B (in Ca4) for RIP8, which are also associated with AB resistance and explain the highest value of the phenotypic variation in both years (27.4% and 44.2% in 2002 and 2003, respectively), supporting the function of this region in AB resistance (Supplementary File 6).
3.3 Physical map and candidate gene analysis
The associated SNPs and markers were physically positioned in the reference genome along with the KASP markers developed by Deokar et al. (2019b). A physical map of bins is shown in Figure 5. One region at the end of Ca2 and one at the beginning of Ca4 in the NCBI reference chickpea genome (ASM33114v1 assembly) is coincident in both studies, further emphasizing the significance of this region in the control of AB resistance. The markers from Deokar et al. (2019b) also map to the middle region of Ca4, which contains the SSR/Gene-specific markers associated in this study. The overlapping of associated regions opens future studies where KASP markers in Deokar et al. (2019b) can be genotyped in our material for narrowing the QTL regions.

Figure 5 Physical map for the associated bins and SSR/Gene-specific markers in (A) Ca2 and (B) Ca4. Markers in black represent the SSR/Gene-specific markers used in our study, while markers in brown represent the SNPs and KASP markers associated with AB resistance in Deokar et al. (2019b). Colored regions represent the bins associated with AB resistance in our study.
Some of the genomic regions associated with AB resistance in this study have support in the scientific literature. However, minimal information has been provided regarding potential genes in the region of bin I for RIP8 (Ca4: 34.79-45.38 Mb). Given the extensive length of the bin, it is crucial to keep narrowing down the region before functional annotation, but in a first attempt to analyze the data we identified those genes that carry significant SNP variants (Table 3).
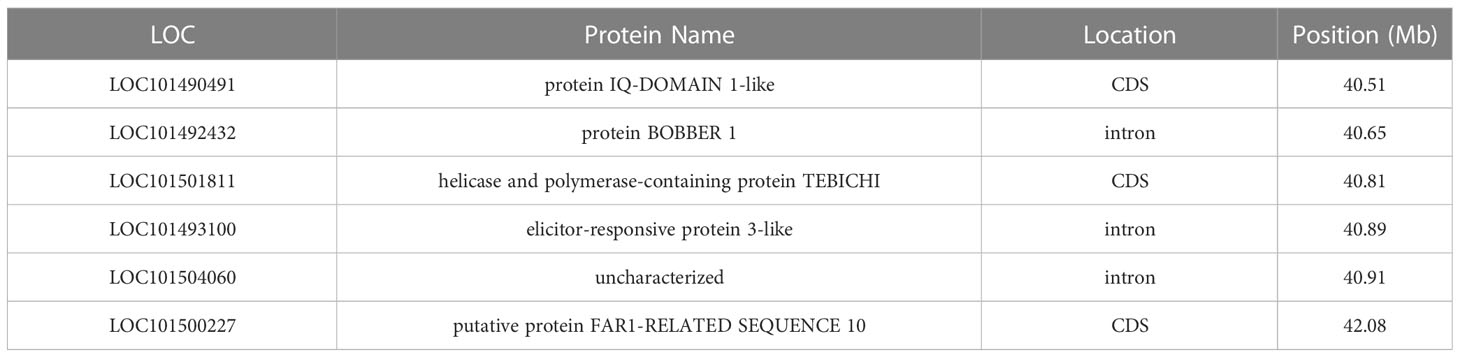
Table 3 List of genes containing SNPs within their sequences in bin I (in Ca4) for RIP8.
Moreover, bin B for RIP8 in Ca4 (spanning a region from 3.52 to 8.20 Mb) was associated with AB resistance in both years and explained the highest phenotypic variation (27.4% and 44.2% in 2002 and 2003, respectively). This bin also overlapped with an associated region in RIP10, which supports the bin as a robust candidate for conferring AB resistance. This genomic region contains approximately 500 loci, but after filtering out pseudogenes, non-coding RNAs and genes without description, a final list of 327 loci was generated for functional annotation. Out of the 327 loci, 273 sequences were fully annotated. A candidate gene list (30 genes, Supplementary File 7) was made based on GO terms with a possible function on AB resistance: DNA-binding transcription factor activity (15), response to stress (11), response to endogenous stimulus (5), response to external stimulus (4) and response to biotic stimulus (1). From this list, LOC101507066, which is a homolog of a probable leucine-rich repeat receptor-like protein kinase At5g63930, contained a SNP marker located in its intronic region. Supplementary File 8 shows a comparison in the position of candidate genes in NCBI reference genome (ASM33114v1) and a recent available genome (Garg et al., 2022).
4 Discussion
Phenotypic selection of AB resistant cultivars is a tedious process involving multiple factors affecting screening procedures. The availability of robust markers for faster development of resistant cultivars plays a key role in chickpea breeding programs but is a difficult procedure due to the polygenic nature of AB resistance and the different genetic backgrounds across cultivars. In the last decade, numerous AB resistance QTLs contributing to the expression of AB resistance have been identified and markers associated to those genomic regions have been developed (Sharma and Ghosh, 2016; Ilyas et al., 2022; Singh et al., 2022). However, the use of markers remains low as inferred from publications regarding new varieties of chickpea (Singh et al., 2022). The detection of markers in biparental populations and their validation in different genetic backgrounds could expand the marker catalog, allowing a more precise detection of resistant cultivars and thereby conferring a significant advance in chickpea breeding programs.
Combining SSR/Gene-specific markers and SNP approaches has proven to be an effective strategy for saturating physical maps (Stephens et al., 2014; Kumar et al., 2018; Sudheesh et al., 2021). Physical maps with SSR/Gene-specific markers and SNPs can be developed, providing a high-resolution map that would help narrowing QTLs linked to important agronomic traits and afterwards defining candidate genes for these traits. Furthermore, the development of haplotype maps with well-defined recombination bins can help overlapping regions associated with a trait of agronomic interest and narrowing regions where candidate genes are located.
In the present study, we used tGBS sequencing technology and developed haplotype maps to identify genomic regions associated with AB resistance in two RIL populations. Mapping of SNPs revealed that chromosome size was not correlated with the SNP number, suggesting that there is a different grade of variation on each chromosome and SNP distribution is not random. The highest number of SNPs was detected in Ca4, whereas Ca5 had the lowest number despite having a similar chromosome size. Other authors working with intraspecific populations derived from desi and kabuli crosses have obtained similar SNP distributions (Deokar et al., 2019b; Sudheesh et al., 2021), suggesting a high variability for Ca4 and a low variability for Ca5 between desi and kabuli type cultivars. More effort should be done to unravel this low variability and saturate Ca5 with more markers.
In this study, a genomic region from Ca2 was associated with AB resistance in RIP8. Marker TR58 was associated with AB resistance in other studies (Iruela et al., 2007; Kottapalli et al., 2009) and it has been positioned on the chromosome around the 29 Mb coordinate. However, the QTL peak was delimited to bin H coordinates (30.57-34.00 Mb). EIN3 gene reported by Madrid et al. (2014) is within bin H, so this gene may be the peak of the QTL reported by our markers. More markers would increase the physical map resolution and help narrowing the QTL peak around this region.
Three regions in Ca4 were involved in AB resistance in RIP8, one at the center and two at both terminal ends of the chromosome. The first region includes markers CaETR-1 and NCPGR91, which were linked to EIN4 gene reported by Madrid et al. (2012). Markers GAA47 and STMS11 were also associated with blight resistance in other studies (Tekeoglu et al., 2002; Collard et al., 2003; Rakshit et al., 2003; Cho et al., 2004; Iruela et al., 2006; Aryamanesh et al., 2010; Sabbavarapu et al., 2013), but they are distant from the QTL peak in our study. The middle region (Bin G) includes associated markers, where SCY17590 (Figure 5) explains the major phenotypic variation (29.1%), which is coincident with the results obtained in our previous study (Iruela et al., 2006). The peak of the third region is ~42.08 Mb, which is located in bin I. This is close to the qABR4.3 reported by Kumar et al. (2018) and matches with the CPR01-qAB4.4 reported in Deokar et al. (2019a), but it explains more phenotypic variation in our study, suggesting that the QTL peak is closer to the SNP reported at 42.08 Mb.
Using a population with the cultivar Amit as a source of AB resistance (ICCV96029 x Amit), Deokar et al. (2019b) identified 10 associated markers. After relocating those markers to the reference genome (NCBI, ASM33114v1 assembly), those markers were positioned within the bins significantly associated in our study reinforcing the function of these regions in the control of AB resistance. Besides, two KASP markers from Deokar et al. (2019b) and 4 SSR/Gene-specific markers from our study were located in the central region of Ca4, which is coincident with the QTLAR2 reported in Iruela et al. (2006). The SNPs around this region are nearing the defined threshold of LOD ≥ 3 (Figure 2B). This suggests that the lack of association for bin G could potentially be attributed to a significant amount of missing RIL data. These findings highlight the significance of using both traditional genetic markers and throughput sequencing methods to improve the detection of QTLs associated with AB resistance or other important agronomic traits.
Other authors (Kumar et al., 2018; Deokar et al., 2019a) have detected regions overlapping with bin I (in Ca4) for RIP8, but little information is known about candidate genes in this region. As the bin spans a large genomic region (~11 Mb), it needs first to be narrowed to perform functional annotation. Therefore, in a first attempt to analyze the bin we identified six genes with SNPs within their sequences (exon, intron or CDS molecular features). LOC101490491 contains two SNPs in its sequence causing non-synonymous amino acid changes (Asp190Asn; Asn229His). The gene encodes for a protein IQ-DOMAIN 1-like, a homolog of IQD21 in Arabidopsis thaliana (50.1% sequence identity at the amino acid level), which has a conserved domain (IQ, smart00015) present in IQD1, a protein involved in glucosinolate metabolism in response to biotic challenges like Botrytis cinerea infection (Barda and Levy, 2022). LOC101501811 has one SNP within its CDS causing a non-synonymous amino acid change (Glu1417Val) and encodes for a helicase and polymerase-containing protein TEBICHI. Analysis of the conserved domains annotated in NCBI indicated a potential involvement in DNA repair (cd08638, cd18026, cl34180). LOC101500227, which encodes for the FAR1-related sequence 10 protein, has a non-synonymous amino acid change (Asp234Asn). The conserved domains (cl24015 and cl31971) suggest that the protein may be associated with DNA transposition. LOC101492432 encodes for a BOBBER 1 protein. A homologous sequence in A. thaliana (63.2% sequence identity at the amino acid level) is known to play a crucial role in response to heat stress and thermotolerance (Perez et al., 2009). LOC101493100 encodes for an elicitor-responsive protein, which is involved in hypersensible defense response based on information from the conserved domains (cd04049). Finally, the uncharacterized protein encoded by LOC101504060 has a homolog in A. thaliana (69.6% sequence identity at the amino acid level) that belongs to the ABC1 protein family. Conserved domains of this protein (cd05121) provide information about its involvement in respiratory electron and proton transport. The candidate list presented here can serve as a valuable resource for the development of KASP markers. Further studies using more markers would help narrowing the region down, which in turn, will allow the usage of a similar approach as in bin B based on the functional annotation defining a more complete list of candidate genes.
Regarding bin B (in Ca4), we have identified it as the most promising candidate region for involvement in AB resistance for being associated in both years and populations, suggesting that this region acts under different ambiental conditions or pathotypes, while the other detected regions may be pathotype-specific or influenced by ambient (Udupa et al., 1998). Through functional annotation using gene ontology terms (Supplementary File 7), we have narrowed down a list of 30 potential candidates. Some of these sequences have already been shown to play a role in defense-related response. For instance, previous research has revealed differential expression levels of several families of transcription factors in chickpea, such as DOF zinc finger, WRKY, MYB, or ERF, during the defense mechanisms against AB (Garg et al., 2019). Among the candidates we have identified, LOC101489067, LOC105851868, LOC101495438, LOC101513362, and LOC101513681 represent these transcription factor families. LOC101488963 and LOC101493509 belong to families that have been studied for their role in AB resistance (Angelini et al., 1993; Mantri et al., 2010; Kaur et al., 2012). LOC101495110 is a homolog of a putative NPR1/NH1-interacting protein from M. truncatula (67.4% sequence identity at the amino acid level), which has a function on inducing defense genes via salicylic acid (Kumar et al., 2022). While the table on Supplementary File 7 may list other candidates with potential roles in AB resistance, LOC101507066 stands out as a strong candidate for the additional presence of a SNP within its sequence. This gene encodes a probable leucine-rich repeat receptor-like protein kinase (LRR-RLK), which is the largest and most highly conserved group of the plant RLK gene family (Shiu and Bleecker, 2001). With their structural characteristics, LRR-RLKs are crucial for mediating cell signal transduction pathways and play critical roles in plant growth, development, stress responses, and immunity (Sun et al., 2017). It is noteworthy that another LRR-RLK copy on a distant region on Ca4 (~16 Mb) was reported to be overexpressed 48h after inoculation of the pathogen in the resistant line ICC3996 (Li et al., 2017). Therefore, LOC101507066 (Ca4, ~4.5Mb) may have the potential to serve as a key player in AB resistance.
5 Conclusion
Overall, the results of this study provide valuable information on the complex genetic basis of AB resistance in chickpea, reflected in multiple genomic regions, with particular emphasis on the Ca2 and Ca4 regions. The region most strongly associated with resistance was found to span 3.52 to 8.20 Mb in Ca4, and this association was observed in both years (2002 and 2003) and populations (RIP8 and RIP10). These findings have important implications for genetic improvement for AB resistance and may help guide future studies by phenotyping and genotyping other intra- and interspecific populations with the goal of narrowing down regions associated with this and other desirable traits for chickpea breeding programs.
Data availability statement
The original contributions presented in the study are publicly available. This data can be found here: GitHub repository, accession link https://github.com/b62cajia/ABhaplotype.git.
Author contributions
JR and TM provided conceptualization of the study. AC, JD, and PC performed data curation. AC, JD, and PC made formal analysis. JR, TM, JD, and JG acquired funding for the study. AC wrote the original draft of the manuscript. TM, JR, JG, JD, and PC reviewed and edited the manuscript. All authors contributed to the article and approved the submitted version.
Funding
This research was supported by funding from projects PID2020-114952RR-I00 (RTA2020-007) co-financed by ERDF, PP.AVA.AVA2019.030 and PP.AVA23.INV2023-009 from the Junta de Andalucía. JD is a Ramón y Cajal Fellow funded by the program MCIN/AEI/10.13039/501100011033 (Ref. RYC2019-028188-I).
Conflict of interest
The authors declare that the research was conducted in the absence of any commercial or financial relationships that could be construed as a potential conflict of interest.
Publisher’s note
All claims expressed in this article are solely those of the authors and do not necessarily represent those of their affiliated organizations, or those of the publisher, the editors and the reviewers. Any product that may be evaluated in this article, or claim that may be made by its manufacturer, is not guaranteed or endorsed by the publisher.
Supplementary material
The Supplementary Material for this article can be found online at: https://www.frontiersin.org/articles/10.3389/fpls.2023.1183287/full#supplementary-material
References
Angelini, R., Bragaloni, M., Federico, R., Infantino, A., Porta-Pugua, A. (1993). Involvement of polyamines, diamine oxidase and peroxidase in resistance of chickpea to Ascochyta rabiei. J. Plant Physiol. 142, 704–709. doi: 10.1016/S0176-1617(11)80906-5
Aryamanesh, N., Nelson, M. N., Yan, G., Clarke, H. J., Siddique, K. H.M. (2010). Mapping a major gene for growth habit and QTLs for Ascochyta blight resistance and flowering time in a population between chickpea and Cicer reticulatum. Euphytica 173, 307–319. doi: 10.1007/s10681-009-0086-2
Arumuganathan, K., Earle, E. D. (1991). Nuclear DNA content of some important plant species. Plant Mol. Biol. Rep. 9, 208–218. doi: 10.1007/s10681-009-0086-2
Barda, O., Levy, M. (2022). IQD1 involvement in hormonal signaling and general defense responses against Botrytis cinerea. Front. Plant Sci. 13. doi: 10.3389/fpls.2022.845140
Bradbury, P. J., Zhang, Z., Kroon, D. E., Casstevens, T. M., Ramdoss, Y., Buckler, E. S. (2007). TASSEL: software for association mapping of complex traits in diverse samples. Bioinformatics 23, 2633–2635. doi: 10.1093/bioinformatics/btm308
Browning, B. L., Zhou, Y., Browning, S. R. (2018). A one-penny imputed genome from next-generation reference panels. Am. J. Hum. Genet. 103, 338–348. doi: 10.1016/j.ajhg.2018.07.015
Chen, Z., Wang, B., Dong, X., Liu, H., Ren, L., Chen, J., et al. (2014). An ultra-high density bin-map for rapid QTL mapping for tassel and ear architecture in a large F2 maize population. BMC Genomics 15, 433. doi: 10.1186/1471-2164-15-433
Cho, S., Chen, W., Muehlbauer, F. J. (2004). Pathotype-specific genetic factors in chickpea (Cicer arietinum l.) for quantitative resistance to ascochyta blight. Theor. Appl. Genet. 109, 733–739. doi: 10.1007/s00122-004-1693-x
Collard, B. C. Y., Pang, E. C. K., Ades, P. K., Taylor, P. W. J. (2003). Preliminary investigation of QTLs associated with seedling resistance to ascochyta blight from Cicer echinospermum, a wild relative of chickpea. Theor. Appl. Genet. 107, 719–729. doi: 10.1007/s00122-003-1297-x
Conesa, A., Götz, S. (2008). Blast2GO: a comprehensive suite for functional analysis in plant genomics. Int. J. Plant Genomics 2008, 619832. doi: 10.1155/2008/619832
Crociara, C., Valetti, L., Bernardi Lima, N., Iglesias, J., Pastor, S. (2022). Morphological and molecular characterization, pathogenicity and sexual reproduction of Ascochyta rabiei isolates of chickpea fields in Argentina. J. Phytopathol. 170, 221–232. doi: 10.1111/jph.13073
Deokar, A., Sagi, M., Daba, K., Tar’an, B. (2019a). QTL sequencing strategy to map genomic regions associated with resistance to ascochyta blight in chickpea. Plant Biotechnol. J. 17, 275–288. doi: 10.1111/pbi.12964
Deokar, A., Sagi, M., Tar’an, B. (2019b). Genome-wide SNP discovery for development of high-density genetic map and QTL mapping of ascochyta blight resistance in chickpea (Cicer arietinum l.). Theor. Appl. Genet. 132, 1861–1872. doi: 10.1007/s00122-019-03322-3
Du, W., Zhao, X., Raju, T., Davies, P., Trethowan, R. (2012). Identification of Ascochyta rabiei disease resistance in chickpea genotypes. Euphytica 186, 697–704. doi: 10.1007/s10681-011-0554-3
FAOSTAT (2021). Available at: https://www.fao.org/faostat/en/#home (Accessed March 3, 2023).
Flandez-Galvez, H., Ades, P. K., Ford, R., Pang, E. C. K., Taylor, P. W. J. (2003). QTL analysis for ascochyta blight resistance in an intraspecific population of chickpea (Cicer arietinum l.). Theor. Appl. Genet. 107, 1257–1265. doi: 10.1007/s00122-003-1371-4
Garg, V., Dudchenko, O., Wang, J., Khan, A. W., Gupta, S., Kaur, P., et al. (2022). Chromosome-length genome assemblies of six legume species provide insights into genome organization, evolution, and agronomic traits for crop improvement. J. Advanc. Res. 42, 315–329. doi: 10.1016/j.jare.2021.10.009
Garg, V., Khan, A. W., Kudapa, H., Kale, S. M., Chitikineni, A., Qiwei, S., et al. (2019). Integrated transcriptome, small RNA and degradome sequencing approaches provide insights into ascochyta blight resistance in chickpea. Plant Biotechnol. J. 17, 914–931. doi: 10.1111/pbi.13026
Garg, T., Mallikarjuna, B. P., Thudi, M., Samineni, S., Singh, S., Sandhu, J. S., et al. (2018). Identification of QTLs for resistance to fusarium wilt and ascochyta blight in a recombinant inbred population of chickpea (Cicer arietinum l.). Euphytica 214, 45. doi: 10.1007/s10681-018-2125-3
Gayacharan, Rani, U., Singh, S., Basandrai, A. K., Rathee, V. K., Tripathi, K., et al. (2020). Identification of novel resistant sources for ascochyta blight (Ascochyta rabiei) in chickpea. PloS One 15, e0240589. doi: 10.1371/journal.pone.0240589
Han, K., Jeong, H.-J., Yang, H.-B., Kang, S.-M., Kwon, J.-K., Kim, S., et al. (2016). An ultra-high-density bin map facilitates high-throughput QTL mapping of horticultural traits in pepper (Capsicum annuum). DNA Res. 23, 81–91. doi: 10.1093/dnares/dsv038
Ilyas, A., Mirza, S. A., Hussain, K., Ilyas, A., Shahzad, K. (2022). A comprehensive review on genetic resistance of chickpea to ascochyta blight. J. Plant Pathol. 104, 1337-1354. doi: 10.1007/s42161-022-01232-w
Iruela, M., Castro, P., Rubio, J., Cubero, J. I., Jacinto, C., Millan, T., et al. (2007). “Validation of a QTL for resistance to ascochyta blight linked to resistance to fusarium wilt race 5 in chickpea (Cicer arietinum l.),” in Ascochyta blights of grain legumes. Eds. Tivoli, B., Baranger, A., Muehlbauer, F. J., Cooke, B. M. (Dordrecht: Springer Netherlands), 29–37. doi: 10.1007/978-1-4020-6065-6_4
Iruela, M., Rubio, J., Barro, F., Cubero, J. I., Millan, T., Gil, J. (2006). Detection of two quantitative trait loci for resistance to ascochyta blight in an intra-specific cross of chickpea (Cicer arietinum l.): development of SCAR markers associated with resistance. Theor. Appl. Genet. 112, 278–287. doi: 10.1007/s00122-005-0126-9
Kale, S. M., Jaganathan, D., Ruperao, P., Chen, C., Punna, R., Kudapa, H., et al. (2015). Prioritization of candidate genes in “QTL-hotspot” region for drought tolerance in chickpea (Cicer arietinum l.). Sci. Rep. 5, 15296. doi: 10.1038/srep15296
Kaur, L., Singh, V. (2009). Inheritance of resistance in four elite chickpea genotypes to ascochyta blight. J. Food Legumes 22, 239–240.
Kaur, L., Singh, V. P., Gupta, A. K. (2012). Peroxidase: a marker for Ascochyta blight resistance in chickpea. Arch. Of Phytopathol. And Plant Prot. 45, 42–46. doi: 10.1080/03235400903392804
Kottapalli, P., Gaur, P. M., Katiyar, S. K., Crouch, J. H., Buhariwalla, H. K., Pande, S., et al. (2009). Mapping and validation of QTLs for resistance to an Indian isolate of ascochyta blight pathogen in chickpea. Euphytica 165, 79–88. doi: 10.1007/s10681-008-9762-x
Kumar, K., Purayannur, S., Kaladhar, V. C., Parida, S. K., Verma, P. K. (2018). mQTL-seq and classical mapping implicates the role of an AT-HOOK MOTIF CONTAINING NUCLEAR LOCALIZED (AHL) family gene in ascochyta blight resistance of chickpea. Plant Cell Environ. 41, 2128–2140. doi: 10.1111/pce.13177
Kumar, S., Zavaliev, R., Wu, Q., Zhou, Y., Cheng, J., Dillard, L., et al. (2022). Structural basis of NPR1 in activating plant immunity. Nature 605, 561–566. doi: 10.1038/s41586-022-04699-w
Labdi, M., Malhotra, R. S., Benzohra, I. E., Imtiaz, M. (2013). Inheritance of resistance to Ascochyta rabiei in 15 chickpea germplasm accessions. Plant Breed. 132, 197–199. doi: 10.1111/pbr.12038
Li, Y., Ruperao, P., Batley, J., Edwards, D., Davidson, J., Hobson, K., et al. (2017). Genome analysis identified novel candidate genes for ascochyta blight resistance in chickpea using whole genome re-sequencing data. Front. Plant Sci. 8. doi: 10.3389/fpls.2017.00359
Madrid, E., Rajesh, P. N., Rubio, J., Gil, J., Millan, T., Chen, W. (2012). Characterization and genetic analysis of an EIN4-like sequence (CaETR-1) located in QTLAR1 implicated in ascochyta blight resistance in chickpea. Plant Cell Rep. 31, 1033–1042. doi: 10.1007/s00299-011-1221-9
Madrid, E., Seoane, P., Claros, M. G., Barro, F., Rubio, J., Gil, J., et al. (2014). Genetic and physical mapping of the QTLAR3 controlling blight resistance in chickpea (Cicer arietinum l). Euphytica 198, 69–78. doi: 10.1007/s10681-014-1084-6
Mantri, N. L., Ford, R., Coram, T. E., Pang, E. C. (2010). Evidence of unique and shared responses to major biotic and abiotic stresses in chickpea. Environ. Exp. Bot. 69, 286–292. doi: 10.1016/j.envexpbot.2010.05.003
Mardis, E. R. (2008). Next-generation DNA sequencing methods. Annu. Rev. Genomics Hum. Genet. 9, 387–402. doi: 10.1146/annurev.genom.9.081307.164359
Millan, T., Madrid, E., Cubero, J. I., Amri, M., Castro, P., Rubio, J. (2015). “Chickpea,” in Grain legumes handbook of plant breeding. Ed. De Ron, A. M. (New York, NY: Springer New York), 85–109. doi: 10.1007/978-1-4939-2797-5_3
Millan, T., Rubio, J., Iruela, M., Daly, K., Cubero, J. I., Gil, J. (2003). Markers associated with ascochyta blight resistance in chickpea and their potential in marker-assisted selection. Field Crops Res. 84, 373–384. doi: 10.1016/S0378-4290(03)00103-5
Newman, T. E., Jacques, S., Grime, C., Kamphuis, F. L., Lee, R. C., Berger, J., et al. (2021). Identification of novel sources of resistance to ascochyta blight in a collection of wild cicer accessions. Phytopathology 111, 369–379. doi: 10.1094/PHYTO-04-20-0137-R
Ott, A., Liu, S., Schnable, J. C., Yeh, C.-T., Wang, K.-S., Schnable, P.S. (2017). tGBS® genotyping-by-sequencing enables reliable genotyping of heterozygous loci. Nucleic Acids Res. 45, e178. doi: 10.1093/nar/gkx853. Eddy.
Pande, S., Siddique, K. H. M., Kishore, G. K., Bayaa, B., Gaur, P. M., Gowda, C. L. L., et al. (2005). Ascochyta blight of chickpea (Cicer arietinum l.): a review of biology, pathogenicity, and disease management. Aust. J. Agric. Res. 56, 317. doi: 10.1071/AR04143
Perez, D. E., Hoyer, J. S., Johnson, A. I., Moody, Z. R., Lopez, J., Kaplinsky, N. J. (2009). BOBBER1 is a noncanonical arabidopsis small heat shock protein required for both development and thermotolerance. Plant Physiol. 151, 241–252. doi: 10.1104/pp.109.142125
Qi, X., Li, M.-W., Xie, M., Liu, X., Ni, M., Shao, G., et al. (2014). Identification of a novel salt tolerance gene in wild soybean by whole-genome sequencing. Nat. Commun. 5, 4340. doi: 10.1038/ncomms5340
Rakshit, S., Winter, P., Tekeoglu, M., Juarez Muñoz, J., Pfaff, T., Benko-Iseppon, A. M., et al. (2003). DAF marker tightly linked to a major locus for ascochyta blight resistance in chickpea (Cicer arietinum l.). Euphytica 132, 23-30. doi: 10.1023/a:1024681422799
Sabbavarapu, M. M., Sharma, M., Chamarthi, S. K., Swapna, N., Rathore, A., Thudi, M., et al. (2013). Molecular mapping of QTLs for resistance to fusarium wilt (race 1) and ascochyta blight in chickpea (Cicer arietinum l.). Euphytica 193, 121–133. doi: 10.1007/s10681-013-0959-2
Sanderson, L.-A., Caron, C. T., Tan, R., Shen, Y., Liu, R., Bett, K. E. (2019). KnowPulse: a web-resource focused on diversity data for pulse crop improvement. Front. Plant Sci. 10. doi: 10.3389/fpls.2019.00965
Santra, D. K., Tekeoglu, M., Ratnaparkhe, M., Kaiser, W. J., Muehlbauer, F. J. (2000). Identification and mapping of qtls conferring resistance to ascochyta blight in chickpea. Crop Sci. 40, 1606–1612. doi: 10.2135/cropsci2000.4061606x
Schuster, S. C. (2008). Next-generation sequencing transforms today’s biology. Nat. Methods 5, 16–18. doi: 10.1038/nmeth1156
Shah, J. A., Iqbal, A., Mahmood, M. T., Aslam, M., Abbas, M., Ahmad, I. (2021). Screening of elite chickpea germplasm against ascochyta blight under controlled conditions. PJAR 34, 774–780. doi: 10.17582/journal.pjar/2021/34.4.774.780
Sharma, M., Ghosh, R. (2016). An update on genetic resistance of chickpea to ascochyta blight. Agronomy 6, 18. doi: 10.3390/agronomy6010018
Shiu, S. H., Bleecker, A. B. (2001). Receptor-like kinases from Arabidopsis form a monophyletic gene family related to animal receptor kinases. Proc. Natl. Acad. Sci. U.S.A. 98, 10763–10768. doi: 10.1073/pnas.181141598
Singh, R., Kumar, K., Purayannur, S., Chen, W., Verma, P. K. (2022). Ascochyta rabiei: a threat to global chickpea production. Mol. Plant Pathol. 23, 1241–1261. doi: 10.1111/mpp.13235
Singh, K. B., Reddy, M. V. (1991). Advances in disease-resistance breeding in Chickpea. Adv. Agro. 45, 191–222. doi: 10.1016/S0065-2113(08)60041-3
Stephens, A., Lombardi, M., Cogan, N. O. I., Forster, J. W., Hobson, K., Materne, M., et al. (2014). Genetic marker discovery, intraspecific linkage map construction and quantitative trait locus analysis of ascochyta blight resistance in chickpea (Cicer arietinum l.). Mol. Breed. 33, 297–313. doi: 10.1007/s11032-013-9950-9
Su, C., Wang, W., Gong, S., Zuo, J., Li, S., Xu, S. (2017). High density linkage map construction and mapping of yield trait QTLs in maize (Zea mays) using the genotyping-by-Sequencing (GBS) technology. Front. Plant Sci. 8. doi: 10.3389/fpls.2017.00706
Sudheesh, S., Kahrood, H. V., Braich, S., Dron, N., Hobson, K., Cogan, N. O. I., et al. (2021). Application of genomics approaches for the improvement in ascochyta blight resistance in chickpea. Agronomy 11, 1937. doi: 10.3390/agronomy11101937
Sun, J., Li, L., Wang, P., Zhang, S., Wu, J. (2017). Genome-wide characterization, evolution, and expression analysis of the leucine-rich repeat receptor-like protein kinase (LRR-RLK) gene family in rosaceae genomes. BMC Genomics 18, 763. doi: 10.1186/s12864-017-4155-y
Tar’an, B., Warkentin, T. D., Tullu, A., Vandenberg, A. (2007). Genetic mapping of ascochyta blight resistance in chickpea (Cicer arietinum l.) using a simple sequence repeat linkage map. Genome 50, 26–34. doi: 10.1139/g06-137
Tekeoglu, M., Isik, M., Muehlbauer, F. J. (2004). QTL analysis of ascochyta blight resistance in chickpea. Turk J. Agric. For 28, 183–187.
Tekeoglu, M., Rajesh, N., Muehlbauer, J. (2002). Integration of sequence tagged microsatellite sites to the chickpea genetic map. Theor. Appl. Genet. 105, 847–854. doi: 10.1007/s00122-002-0993-2
Udupa, S. M., Baum, M. (2003). Genetic dissection of pathotype-specific resistance to ascochyta blight disease in chickpea (Cicer arietinum l.) using microsatellite markers. Theor. Appl. Genet. 106, 1196–1202. doi: 10.1007/s00122-002-1168-x
Udupa, S. M., Weigand, F., Saxena, M. C., Kahl, G. (1998). Genotyping with RAPD and microsatellite markers resolves pathotype diversity in the ascochyta blight pathogen of chickpea. Theor. Appl. Genet. 97, 299–307. doi: 10.1007/s001220050899
Varshney, R. K., Nayak, S. N., May, G. D., Jackson, S. A. (2009). Next-generation sequencing technologies and their implications for crop genetics and breeding. Trends Biotechnol. 27, 522–530. doi: 10.1016/j.tibtech.2009.05.006
Varshney, R. K., Song, C., Saxena, R. K., Azam, S., Yu, S., Sharpe, A. G., et al. (2013). Draft genome sequence of chickpea (Cicer arietinum) provides a resource for trait improvement. Nat. Biotechnol. 31, 240–246. doi: 10.1038/nbt.2491
Wood, J. A., Grusak, M. A. (2007). Nutritional value of chickpea. Chickpea breeding and management. Eds. Yadav, S. S., Redden, R. J., Chen, W., Sharma, B. (Wallingford: CABI), 101–142. doi: 10.1079/9781845932138.005
Keywords: Ascochyta, chickpea, GBS, haplotype, QTL, resistance, RIL, SNP
Citation: Carmona A, Rubio J, Millan T, Gil J, Die JV and Castro P (2023) Four haplotype blocks linked to Ascochyta blight disease resistance in chickpea under Mediterranean conditions. Front. Plant Sci. 14:1183287. doi: 10.3389/fpls.2023.1183287
Received: 09 March 2023; Accepted: 09 May 2023;
Published: 07 June 2023.
Edited by:
Jennifer Davidson, South Australian Research and Development Institute, AustraliaReviewed by:
Dongying Gao, Agricultural Research Service (USDA), United StatesAamir W. Khan, University of Missouri, United States
Sukhjiwan Kaur, La Trobe University, Australia
Copyright © 2023 Carmona, Rubio, Millan, Gil, Die and Castro. This is an open-access article distributed under the terms of the Creative Commons Attribution License (CC BY). The use, distribution or reproduction in other forums is permitted, provided the original author(s) and the copyright owner(s) are credited and that the original publication in this journal is cited, in accordance with accepted academic practice. No use, distribution or reproduction is permitted which does not comply with these terms.
*Correspondence: Jose V. Die, jose.die@uco.es