 Si-Hyun Park1†
 Jae Geun Kim1,2*†
- 1Department of Biology Education, Seoul National University, Seoul, Republic of Korea
- 2Center for Education Research, Seoul National University, Seoul, Republic of Korea
The phenology has gained considerably more attention in recent times of climate change. The transition from vegetative to reproductive phases is a critical process in the life history of plants, closely tied to phenology. In an era of climate change, understanding how environmental factors affect this transition is of paramount importance. This study consisted of field surveys and a greenhouse experiment on the reproductive biology of Northern pipevine (Aristolochia contorta Bunge). During field surveys, we investigated the environmental factors and growth characteristics of mature A. contorta, with a focus on both its vegetative and reproductive phases. In its successful flowering during the reproductive phase, A. contorta grew under the conditions of 40% relative light intensity and 24% soil moisture content, and had a vertical rhizome. In the greenhouse experiments, we examined the impact of increased CO2 concentration on the growth and development of 10-year-old A. contorta, considering the effect of rhizome direction. Planted with a vertical rhizome direction, A. contorta exhibited sufficient growth for flowering under ambient CO2 concentrations. In contrast, when planted with a horizontal rhizome direction, it was noted to significantly impede successful growth and flowering under elevated CO2 concentrations. This hindered the process of flowering, highlighting the pivotal role of substantial vegetative growth in achieving successful flowering. Furthermore, we observed a higher number of underground buds and shoots under the conditions of elevated CO2 concentration and a horizontal rhizome direction instead of flowering. Elevated CO2 concentrations also exhibited diverse effects on mature A. contorta’s flower traits, resulting in smaller flower size, shorter longevity, and reduced stigma receptivity, and pollen viability. The study shed light on elevated CO2 concentrations can hinder growth, potentially obstructing sexual reproduction and diminishing genetic diversity.
1 Introduction
Climate change is a critical global issue with far-reaching consequences for the natural environment (Kumar et al., 2020). Climate change poses numerous challenges to plant species, influencing their biology, including their growth and reproductive strategies (Piao et al., 2019; Pareek et al., 2020). Phenology has garnered significant interest in recent years (Piao et al., 2019; Shen et al., 2022). Phenological shifts, which involve the timing of key events in plant life cycles such as flowering, fruiting, leafing out, and senescence, represent some of the most visible ecological effects of global climate change (CaraDonna et al., 2014). Among these phenological events, flowering naturally serves as a significant indicator of the transitions between vegetative and reproductive phases and is important in maintaining ecological balance (Schwartz, 2003). Climate change crucially modifies flowering time, which is a vital adaptation for ensuring successful reproduction in response to shifting environmental conditions (Cortés-Flores et al., 2017; König et al., 2017). There are various types of evidence indicating that phenological traits can be changed rapidly when there is strong natural selection which is influenced by environmental factors (Schwartz, 2003; Elzinga et al., 2007; Chuine, 2010). For example, elevated CO2 concentrations may offer certain benefits as they enhance photosynthesis, increase the number of flowers and fruits, and promote blooming (Chaudhry and Sidhu, 2022). However, other plants’ changes in CO2 concentration can disrupt the delicate balance of plant reproductive timing, potentially affecting reduced seed production (Boyle and Bronstein, 2012; Nam et al., 2020).
In response to the challenges posed by climate change, certain plant species have displayed adaptations in their flowering times, with certain species flowering earlier or later than usual to align with the changing climate (Inouye, 2020; Rafferty et al., 2020). These shifts in flowering patterns enable them to optimize their reproductive success in response to altered seasonal cues and environmental conditions (Rafferty et al., 2020; Rosbakh et al., 2021). Furthermore, some species exhibit modified flowering patterns, adjusting the timing of flowering to coincide with periods of increased pollinator availability (Inouye, 2020; Martins et al., 2021; Faust and Iler, 2022). Many other plants have evolved specialized underground structures that exhibit a remarkable ability to adjust their asexual reproductive structure in response to specific characteristics of the environment (Karlova et al., 2021; Huang et al., 2022). This adaptation is particularly advantageous when the ability to sprout and establish new growth from the rhizomes becomes a crucial strategy for plant resilience (Ziska et al., 2004; McPeek and Wang, 2007). Understanding how plants respond and adapt to environmental factors is vital for predicting their long-term survival, maintaining ecosystem stability, and contributing to overall biodiversity (Cleland et al., 2007; Sun and Frelich, 2011; Davies et al., 2013). Moreover, identifying the specific factors that drive the reproduction and investigating how selection by these factors impacts the most advantageous are crucial aspects of studying the evolution of an organism’s life history (Raza et al., 2020; Pesendorfer et al., 2021).
Northern pipevine (Aristolochia contorta Bunge) has garnered attention for research on climate change impacts. This perennial herbaceous vine plant is found in fragmented natural populations along forest edges and riverbanks in East Asia (Nam et al., 2020). It employs both sexual and asexual reproductive mechanisms (Lee, 2012). During sexual reproduction, this plant typically produces flowers after three or more years of growth (Park et al., 2019). The unique features of its flowers include a straight tubular perianth, enclosing fused styles, stigma, and anthers within a chamber known as the utricle, which forms a gynostemium (Park and Kim, 2023). During asexual reproduction, the plant stores reserves in the root or rhizome and undergoes seasonal changes, shedding its aboveground parts in winter and regrowing new stems from underground buds annually (Lee, 2012). Additionally, the vulnerable butterfly, Sericinus montela, whose larvae feed solely on A. contorta, underscores the importance of conservation studies (Park et al., 2023).
Previous studies of A. contorta have mainly focused on its functional aspects, such as plant’s secondary metabolites and its optimal habitat conditions (Hashimoto et al., 1999; Cheung et al., 2006; Heinrich et al., 2009; Nakonechnaya et al., 2013; Park et al., 2019). Studies have shown that the genetic variation indices of A. contorta are low, similar to those of other rare plants (Nakonechnaya et al., 2012; Nam et al., 2020). Elevated CO2 concentrations inhibit the growth of 1- or 2-year-old A. contorta, decrease photosynthesis, and increase plant resistance, negatively impacting specialist herbivores (Park et al., 2021). The effect of climate change on the interaction between A. contorta and its specialist and generalist herbivores vary depending on the ontogenetic stage of the plant (Park et al., 2022). However, previous studies have focused only on A. contorta growth during the vegetative phase, and no research has been conducted on its reproductive phase. Furthermore, there is a lack of research on the reproductive biology of this plant under climate change.
To address this gap, we investigated the growth and reproductive characteristics of mature A. contorta under different CO2 concentrations while also examining trade-off patterns in its reproductive strategies. The field survey provided valuable insights into the conditions for flowering through a comparison of the vegetative and reproductive phases, and the greenhouse experiment was guided by the findings from the field survey to identify the factors hindering or triggering flowering. We hypothesized that (1) the elevated CO2 concentration will impede the growth of mature A. contorta, which in turn will hinder flowering and lead to a transition from sexual reproduction to asexual reproduction, and (2) the impact of elevated CO2 concentration will be more pronounced when the rhizome direction of mature A. contorta is horizontal. This research underscores the novel contributions of our study within the broader context of the impacts of climate change on plant species, with a particular focus on A. contorta. Delving into the relatively unexplored domain of its reproductive biology under varying CO2 conditions, our investigation provides critical insights into the adaptive responses of mature A. contorta to climate change and its reproductive behavior. Such knowledge is pivotal in guiding conservation efforts, aiding in mitigating the impact of climate change on A. contorta populations, preserving their genetic diversity, and ensuring their long-term survival.
2 Materials and methods
2.1 Vegetative and reproductive phases comparison
2.1.1 Environmental factor analysis
The research was conducted in Anyang, Gyeonggi Province, South Korea (37°24’2.58” N, 126°58’18.3” E) during the flowering period from May to August in, 2023, documented a mean temperature of 24.82 ± 0.29°C and a mean precipitation of 16.07 ± 3.23 mm. For the region, the 30-year annual mean temperature from, 1993 to, 2022 was 12.60 ± 0.10°C, and the annual mean precipitation was, 1337.01 ± 52.86 mm (Korea Meteorological Administration, 2023). The site was situated in a riparian area within the native distribution range of A. contorta. Relative light intensity (RLI) was measured by comparing the light intensity (µmol m−2 s−1) recorded at the top of A. contorta with that measured at the same height in an open space at the same time (Lee and Cho, 2000). We measured soil properties, including water content, pH, EC, PO4–P, NH4–N, NO3–N, Ca2+, K+, Na+, and Mg2+. Analyses of soil properties were performed by obtaining soil samples from a depth of 15 - 25 cm near the rhizomes of each individual A. contorta. To preserve moisture, the samples were sealed in plastic bags and transported to the laboratory. The soil samples were then sieved through a 2 mm mesh, and a mixture of deionized water was added at a ratio of soil 1: water 5. The resulting solution was filtered using Whatman filter paper No. 42 (Sigma-Aldrich, St. Louis, MO, USA) and used for analyses of soil environmental characteristics. The pH level was determined using a pH meter (model AP 63; Fisher Scientific, Pittsburgh, PA, USA), and the electrical conductivity (EC) was measured using a conductivity meter (Corning Checkmate model 311; Corning Incorporated, Tewksbury, MA, USA). For soil nutrients, we determined the contents of PO4–P, NH4–N and NO3–N using the methods of hydrazine (Kamphake et al., 1967), indo-phenol (Murphy and Riley, 1962), and ascorbic acid reduction (Solorzano, 1969), respectively. Exchangeable cations (Ca2+, K+, Na+ and Mg2+) were measured using an atomic absorption spectrometer (model AA240FS; Varian Medical Systems, Palo Alto, CA, USA) after extraction with 1 M ammonium acetate solution. Additionally, soil water content was determined by drying the fresh soil samples at 105°C for more than 48 hours (Kim et al., 2004), while soil organic matter contents were analyzed using loss on ignition at 450°C (John, 2004).
2.1.2 Growth trait analysis
During the transition from vegetative phase to reproductive phase (when the flower buds began to appear), 20 individuals (older than 4 years; approximately 2 m stem length, the length of the onset of flowering according to observations in field survey) were taken into account for both the flowering group, consisting of 10 individuals spaced more than 10 meters apart, and the non-flowering group of 10 individuals. The measured growth factors were stem thickness at ground level, internode length, number of branches, number of leaves, single leaf area, total leaf area, rhizome thickness, rhizome length, direction of rhizome growth, chlorophyll content, fresh and dry weights (stems, leaves, rhizomes with roots, and flowers), and C/N ratios of each part (stem, leaves, and rhizome). Stem and rhizome thickness were measured with a vernier calipers (Mitutoyo, Kanagawa, Japan; resolution, 0.01 mm). The first internode length above the ground and number of leaves were recorded for each individual. To calculate the total leaf area, we first determined the leaf area for each individual by measuring the average area of ten leaves using ImageJ (Schneider et al., 2012). Subsequently, the average leaf area was applied to the total number of leaves. For assessing rhizome direction, we excavated the soil to a depth of approximately 20 cm. We utilized an angle gauge to measure the angle between the rhizomes and the horizontal plane, providing a clear indication of their orientation. In order to gauge the chlorophyll content of leaves, we employed a chlorophyll meter (SPAD-502, Konica Minolta, Tokyo; Rodriguez and Miller, 2000). Moreover, the dry weights of stems, leaves, and rhizomes with roots were measured, and belowground/aboveground ratio was calculated by dividing the dry weight of the rhizome with roots by the dry weight of the aboveground shoot components of a plant. In order to investigate the distribution of carbon and nitrogen resources in various plant parts, we performed stoichiometric analyses of the rhizomes, stems, leaves, flowers, and fruits. The plant parts were dried in a dry oven at 60°C and then ground using a ball mill (Pulverisette 23; Fritsch, Germany) to ensure uniform mixtures for the analysis. C/N ratio of each part was measured using an elemental analyzer (Flash EA, 1112, Thermo Electron, USA) at the National Instrumentation Center for Environmental Management (NICEM) at Seoul National University.
2.2 Effects of elevated CO2 on growth and reproduction in different rhizome directions
2.2.1 Experimental design
To investigate how individuals with different inclinations respond to elevated CO2 concentrations, we conducted greenhouse experiments to elucidate the changes in the growth and reproduction of A. contorta under different CO2 concentrations. For this purpose, we purchased 10-year-old A. contorta rhizomes in March 23, 2023.
We observed that growth and reproductive characteristics differed based on whether the rhizomes were oriented vertically or horizontally in the field surveys. To replicate the natural conditions closely, we planted a total of 40 rhizomes of these plants individually, both horizontally and vertically, in 5 liters of soil each (Superlative soil, Gumok, Pohang-si, Republic of Korea; Park et al., 2019). The greenhouse, located at Seoul National University, Seoul, Republic of Korea, provided a relative light intensity of 37.9% (Park et al., 2019). We installed hexagonal Open Top Chambers (OTC; Park et al., 2021) in the greenhouse to manipulate the carbon dioxide (CO2) concentration, simulating two scenarios (Thomson et al., 2011): 1) Representative Concentration Pathways 4.5 (RCP 4.5) climate change scenario with a CO2 concentration of 540 ppm, and 2) current ambient conditions with a CO2 concentration of 400 ppm. Each OTC had its own CO2 control system to regulate elevated CO2 concentration. The control system consisted of a sensor-transmitter coupled with a CO2 controller (SH-MVG260, Soha-tech, Korea), capable of maintaining CO2 concentrations within the range of 0 – 2000 ppm. Additionally, a solenoid valve and individual CO2 gas tanks (40 L, 99.999% purity) were used in the setup (Park et al., 2021). Therefore, we conducted a greenhouse experiment using a total of 40 plants, with 10 plants for each specific condition. The experiment involved two CO2 concentrations (ambient 400 ppm and elevated 540 ppm), and two rhizome directions planting (horizontal rhizome planting, H; and vertical rhizome planting, V), resulting in four experimental treatments (400ppmCO2/H, 400ppmCO2/V, 540ppmCO2/V, 540ppmCO2/H) arranged in a factorial design. Temperature and relative humidity sensors (HOBO Pro v2, Onset, Bourne, MA, USA) were installed in each chamber, and these variables were ensured to remain consistent across all chambers throughout the experimental period. The mean air temperature and humidity recorded in the OTCs during the experimental period were as follows: 24.3°C and 69.5% in ambient CO2, 24.1°C and 68.4% in elevated CO2.
Pots were set on 50 mm thickness plates to minimize external wind effects from the bottom of the chamber induced by the ventilation system. To measure the amount of nutrients absorbed by each plant, bottom watering was used. A rope wick was inserted into the base of the pots to facilitate water absorption from the tray below the pot. During harvesting, excess water at the bottom was directed into the soil to reduce nutrient loss. To compare the nutrient absorption efficiency based on the treatment conditions, we evaluated the differences in soil nutrient levels between before and after the experiment, including NO3–N, NH4–N, PO4–P, as well as cations (K+, Na+, Ca2+, and Mg2+), along with the C/N ratio. The calculation of nutrient uptake by plants and nutrient losses (efforts were made to minimize nutrient loss during irrigation, and while some leaching was expected, the uniform water supply likely resulted in consistent nutrient loss) involved subtracting the nutrient content in the soil after the experiment from that before the experiment.
2.2.2 Analysis of growth and reproductive traits
To assess the growth and reproductive (sexual and asexual) traits of A. contorta under two CO2 concentrations and two rhizome direction plantings, we harvested all plants in the greenhouse at the initial signs of aboveground senescence. We separated the collected plants into stems, leaves, and flowers and measured the growth traits of stem length, internode length, stem thickness, number of branches, total branch length, number of leaves, single leaf area, total leaf area, chlorophyll content, changes in fresh and dry weight of each component (stem, leaf, rhizome and roots), and C/N ratios of each part (stem, leaves, rhizome and root). We assessed variations in reproductive traits related to sexual reproduction, including the first flowering day (FFD), number of flowers, flowering duration, flower longevity, perianth size, diameter of the utricle, pollen grain size, stigmatic receptivity, pollen viability, and C/N ratio of the perianth and ovary (the breeding process of A. contorta heavily relied on pollinators. Only one fruit was produced and we opted to measure the ovary instead). Flowering duration refers to the period from the FFD until the last flower wilts or fades, while flower longevity denotes the duration from the budding of a single flower until it withers. The sizes of the perianth, utricle, fruit, and seed were measured using a digital vernier calipers. Ten flowers were assessed under each condition, with ten pollen grain diameters measured from each individual flower. The sizes of pollen grains were measured using an optical microscope (DE/Axio Inager A1 microscope, Carl Zeiss, Germany) and ImageJ. For stigmatic receptivity assessment, we collected ten samples from each flowering individual on the first day of flower opening. Subsequently, we conducted separate applications of a 3% hydrogen peroxide (H2O2) solution to the stigmas of both the female and male phases (Dafni and Maués, 1998; Serrano and Olmedilla, 2012). The stigmas were observed for a duration of 3 minutes under a stereoscopic microscope (GB-742, Global4U, Republic of Korea), and the presence of bubbles served as a reliable indicator to assess their receptivity. Stigmas that displayed a substantial number of bubbles were classified as highly reactive to the compound, while those with minimal or no bubble formation were categorized as having low reactivity. It was assessed using the approach adapted from Dafni and Maués (1998), involving the assignment of scores based on the number of bubbles. These scores included no reaction (0), a weak positive reaction (1), a strong positive reaction (2), and a very strong positive reaction (3). Pollen viability was assessed using the 1% neutral red staining method (Georgieva and Kruleva, 1993). Three samples were collected from each flowering individual and prepared. Viability was calculated by counting stained (viable or semi viable) and unstained (non-viable) grains from ten samples from each flowering individual on the third day (after 48 h of opening, male phase) of flower opening. The number of underground buds and shoots were recorded as reproductive organs related to asexual reproduction. To explore the variations in the distribution of carbon and nitrogen resources under the two different CO2 concentrations, we conducted stoichiometric analyses on the rhizomes, stems, leaves, flowers, and fruits. The experimental methodology was consistent with the previously described procedure.
2.3 Statistical analyses
We employed an analysis of variance (ANOVA) after the homogeneity of variance test and post-hoc tests (Duncan’s test) to determine the significance of the observed variations in growth and reproductive parameters between the control and treatment groups. Canonical correlation analysis (CCA) was employed to confirm the relationships between environmental factors and growth traits (including the number of flowers) during the field survey, as well as between growth and reproductive traits in the greenhouse experiment. This analysis was performed using PC-ORD for Windows version 5 (B. McCune and MJ Mefford, MjM Software, Gleneden Beach, OR, USA). To comprehend the impact and interaction between rhizome direction and CO2 concentration, we conducted a multivariate analysis of variance (MANOVA). We utilized SPSS software version 23.0 (SPSS, Inc., Chicago, IL, USA) for statistical analysis, with the significance level set at p < 0.05.
3 Results
3.1 Vegetative and reproductive phases comparison
3.1.1 Environmental factor analysis
Among the environmental factors, relative light intensity and soil water content showed statistically significant differences between the vegetative and reproductive phases (Figure 1), and there were no significant differences in other environmental factors. The vegetative phase had a higher RLI (85.91%) than the reproductive phase (39.74%, Figure 1A).
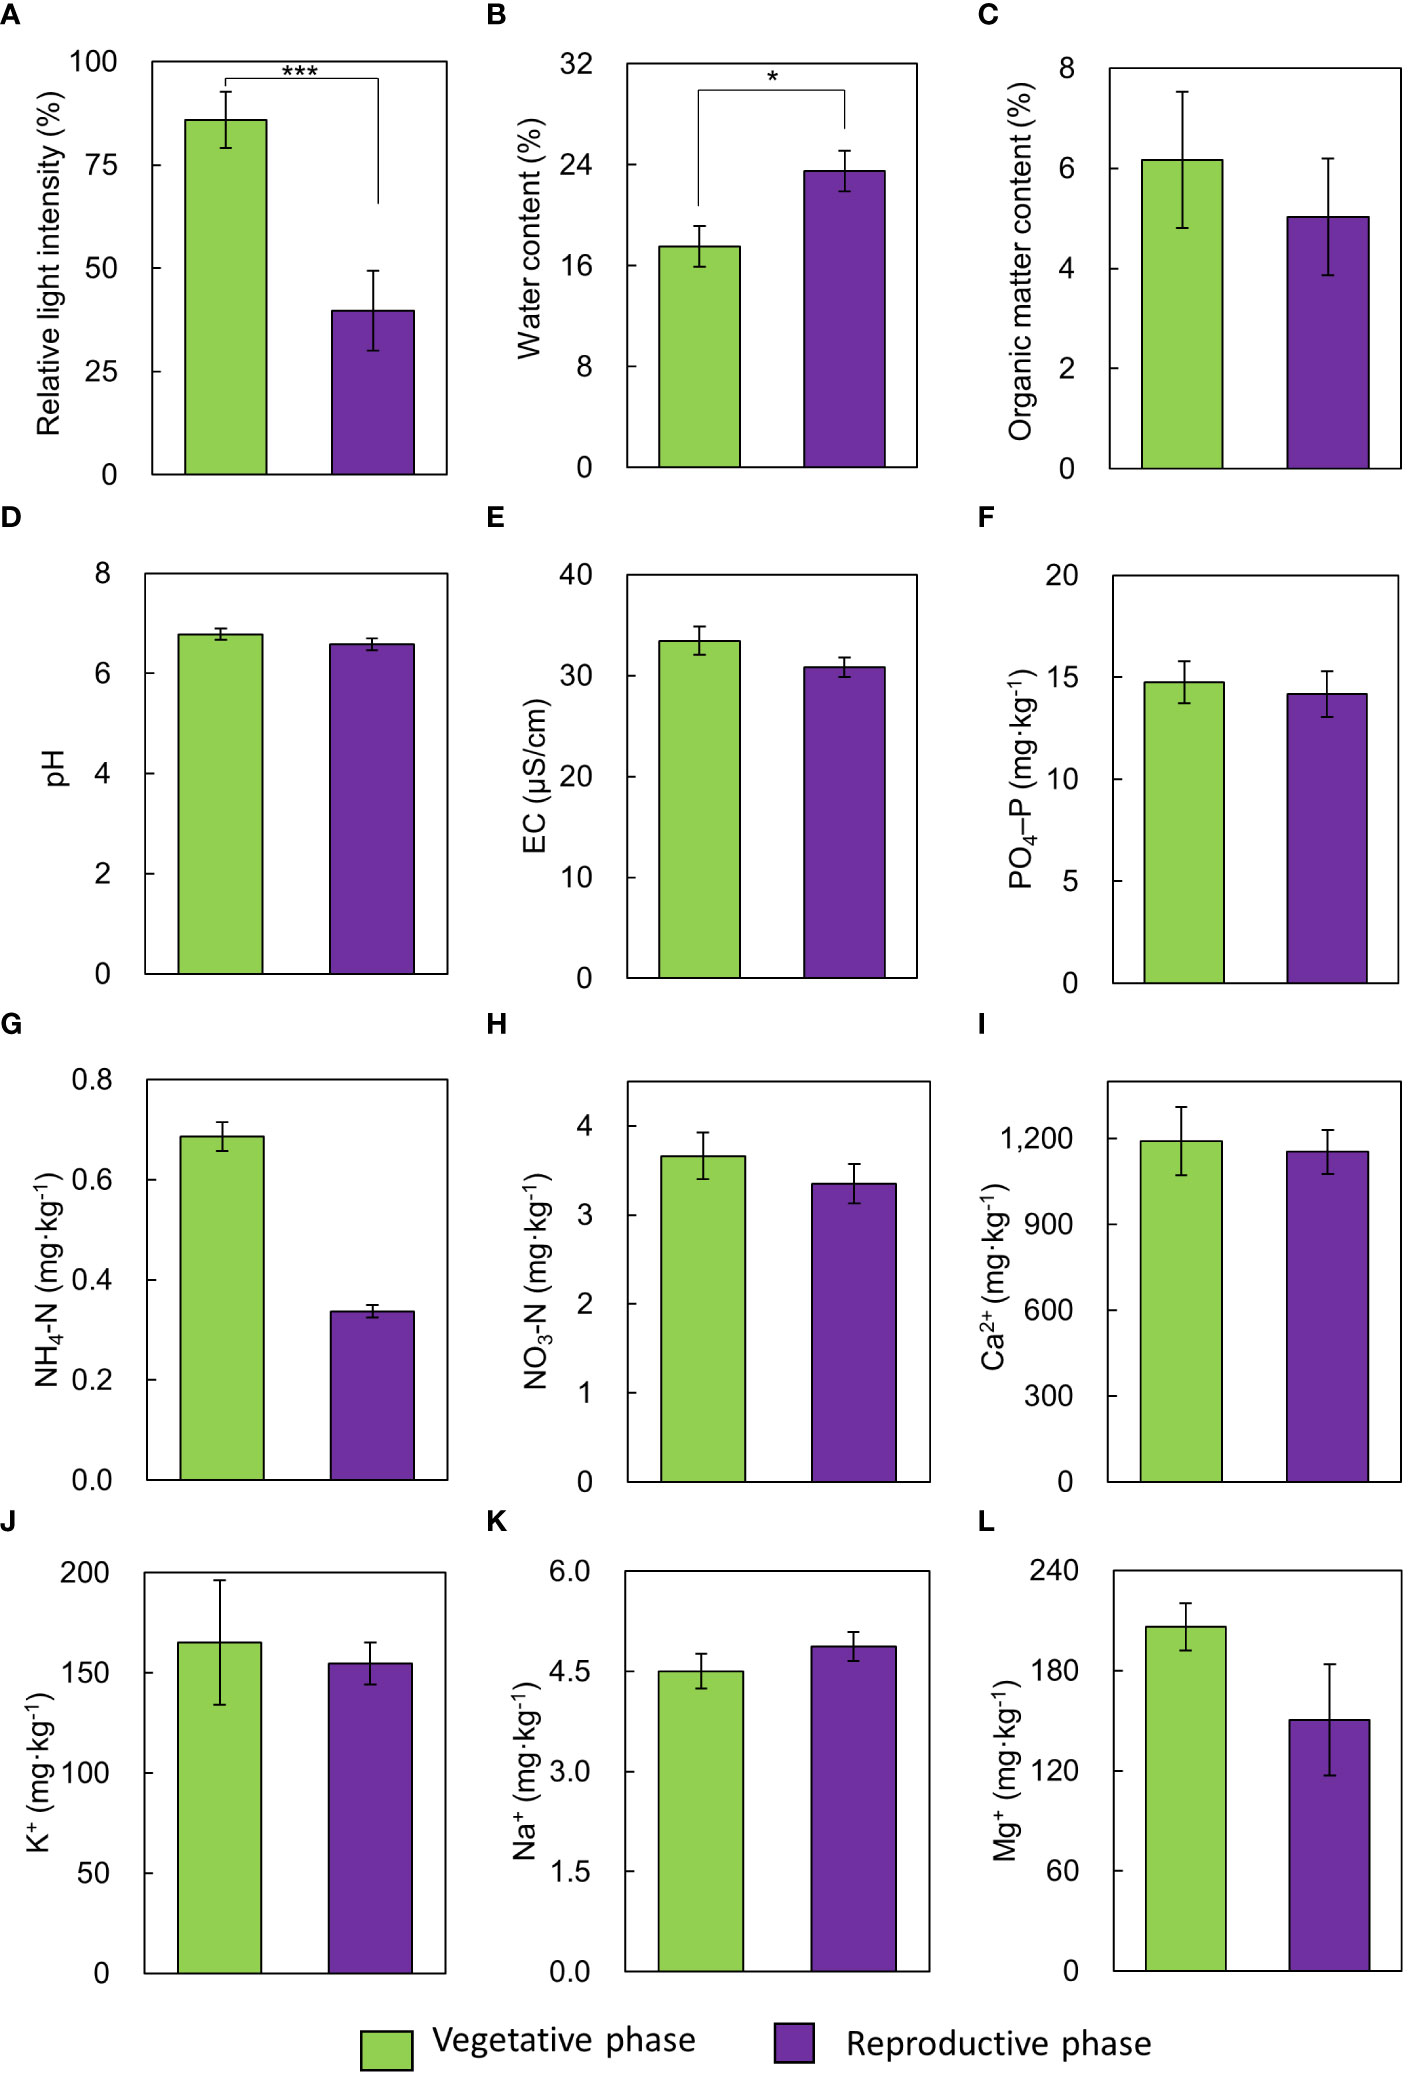
Figure 1 Comparison of environmental variables between vegetative and reproductive phases. (A) relative light intensity, (B) soil water content, (C) soil organic matter content, (D) pH, (E) EC, (F) PO4–P, (G) NH4–N, (H) NO3–N, (I) Ca2+, (J) K+, (K) Na+, (L) Mg2+. Bars indicate standard errors. *p < 0.05; ***p < 0.001.
3.1.2 Growth traits analysis
The growth traits of A. contorta during the vegetative and reproductive phases were significantly different (Figure 2). Stems were thicker in the reproductive phase (2.90 ± 0.21 mm) than in the vegetative phase (1.69 ± 0.17 mm). Internode length was longer in the reproductive phase (26.4 ± 1.2 cm) than in the vegetative phase (13.8 ± 1.2 cm). Branch and leaf numbers per quadrat were more in the reproductive phase (8.0 ± 0.5 branches, 106.4 ± 9.1 leaves) than in the vegetative phase (3.7 ± 0.7 branches, 59.0 ± 13.8 leaves). Single leaf area (34.46 ± 1.35 cm2) and total leaf area (3690.80 ± 267.46 cm2) in reproductive phase were greater than those in vegetative phase (single leaf area, 26.25 ± 1.67 cm2; total leaf area, 1542.42 ± 460.30 cm2). There were broad and horizontal leaves in reproductive phase and small leaves pasted vertically on shorter internodes in vegetative phase. Rhizome thickness (8.71 ± 0.66 mm) and length (57.4 ± 5.9 cm) were greater at reproductive phase than (rhizome thickness, 2.46 ± 0.11 mm; root length, 29.1 ± 3.4 cm). Direction of root growth in vegetative phase was 33.5 ± 5.9°, and those in reproductive phase was 71.0 ± 5.6°. Chlorophyll contents in vegetative phase (33.16 ± 0.91 mg/m2) and reproductive phase (40.27 ± 1.63 mg/m2) were different. Dry weight of each part in reproductive phase (stem, 5.70 ± 0.33 g; leaves, 3.17 ± 0.11 g; rhizome and root, 4.59 ± 0.29 g) were significantly larger than those in vegetative phase (stem, 3.15 ± 0.27 g; leaves, 1.81 ± 0.11 g; rhizome and root, 2.99 ± 0.28 g; Figure 2). The belowground/aboveground ratio showed a ratio of 0.56 in vegetative phase and 0.51 in reproductive phase (p=0.070). C/N ratios were significantly different each part of the vegetative and reproductive phases. Each part in vegetative phase were: a stem, 28.34 ± 0.74; leaves, 12.55 ± 0.46; a rhizome, 17.23 ± 2.27; and those at reproductive phase were: a stem, 41.89 ± 1.97; leaves, 14.18 ± 0.45; a rhizome, 32.84 ± 1.73 (Figure 3). The environmental variables were correlated with internode length, single leaf area, rhizome length, direction of rhizome, dry leaf weight, dry rhizome weight, dry flower weight, and number of flowers (Figure 4). Axes 1 and 2 accounted for 46.1% and 29.3% of the explained variance, respectively.
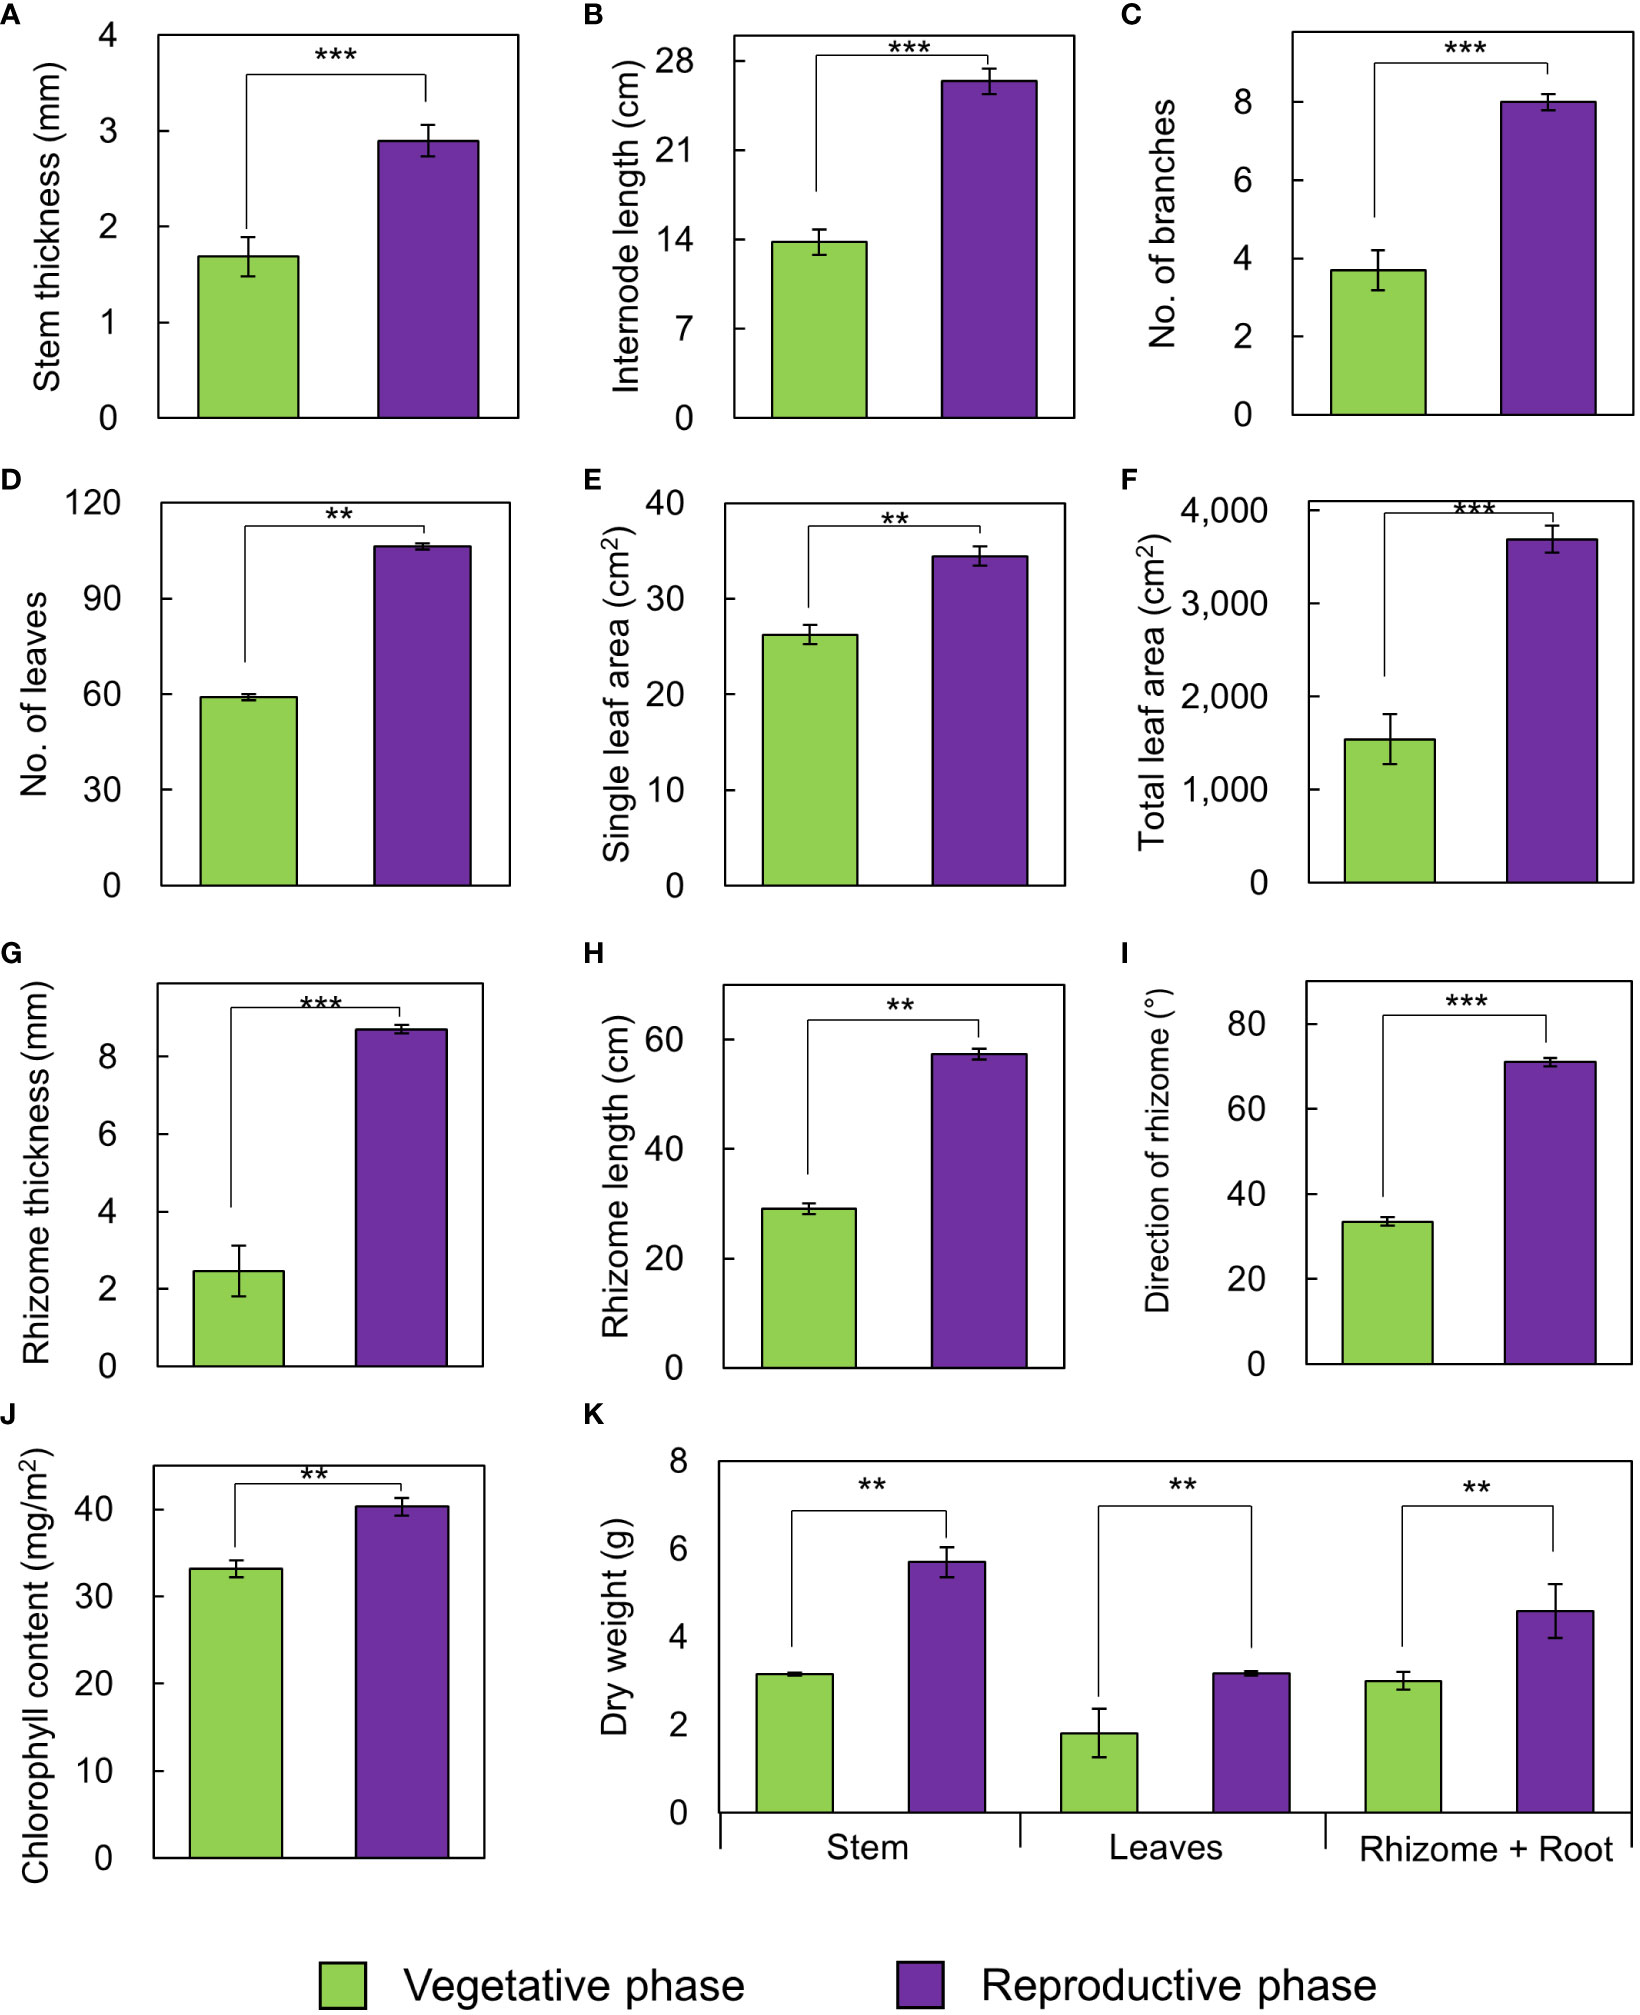
Figure 2 Growth traits of A. contorta in vegetative and reproductive phases. (A) stem thickness, (B) length of the first internode, (C) number of branches, (D) number of leaves, (E) single leaf area, (F) total leaf area, (G) rhizome thickness, (H) rhizome length, (I) direction of rhizome, (J) chlorophyll content, (K) dry weight of stem, leaves, rhizome and root. Bars indicate standard errors. **p < 0.01; ***p < 0.001.

Figure 3 C/N ratio of each part in the vegetative phase and reproductive phase. Bars indicate standard errors. *p < 0.05; **p < 0.01; ***p < 0.001.
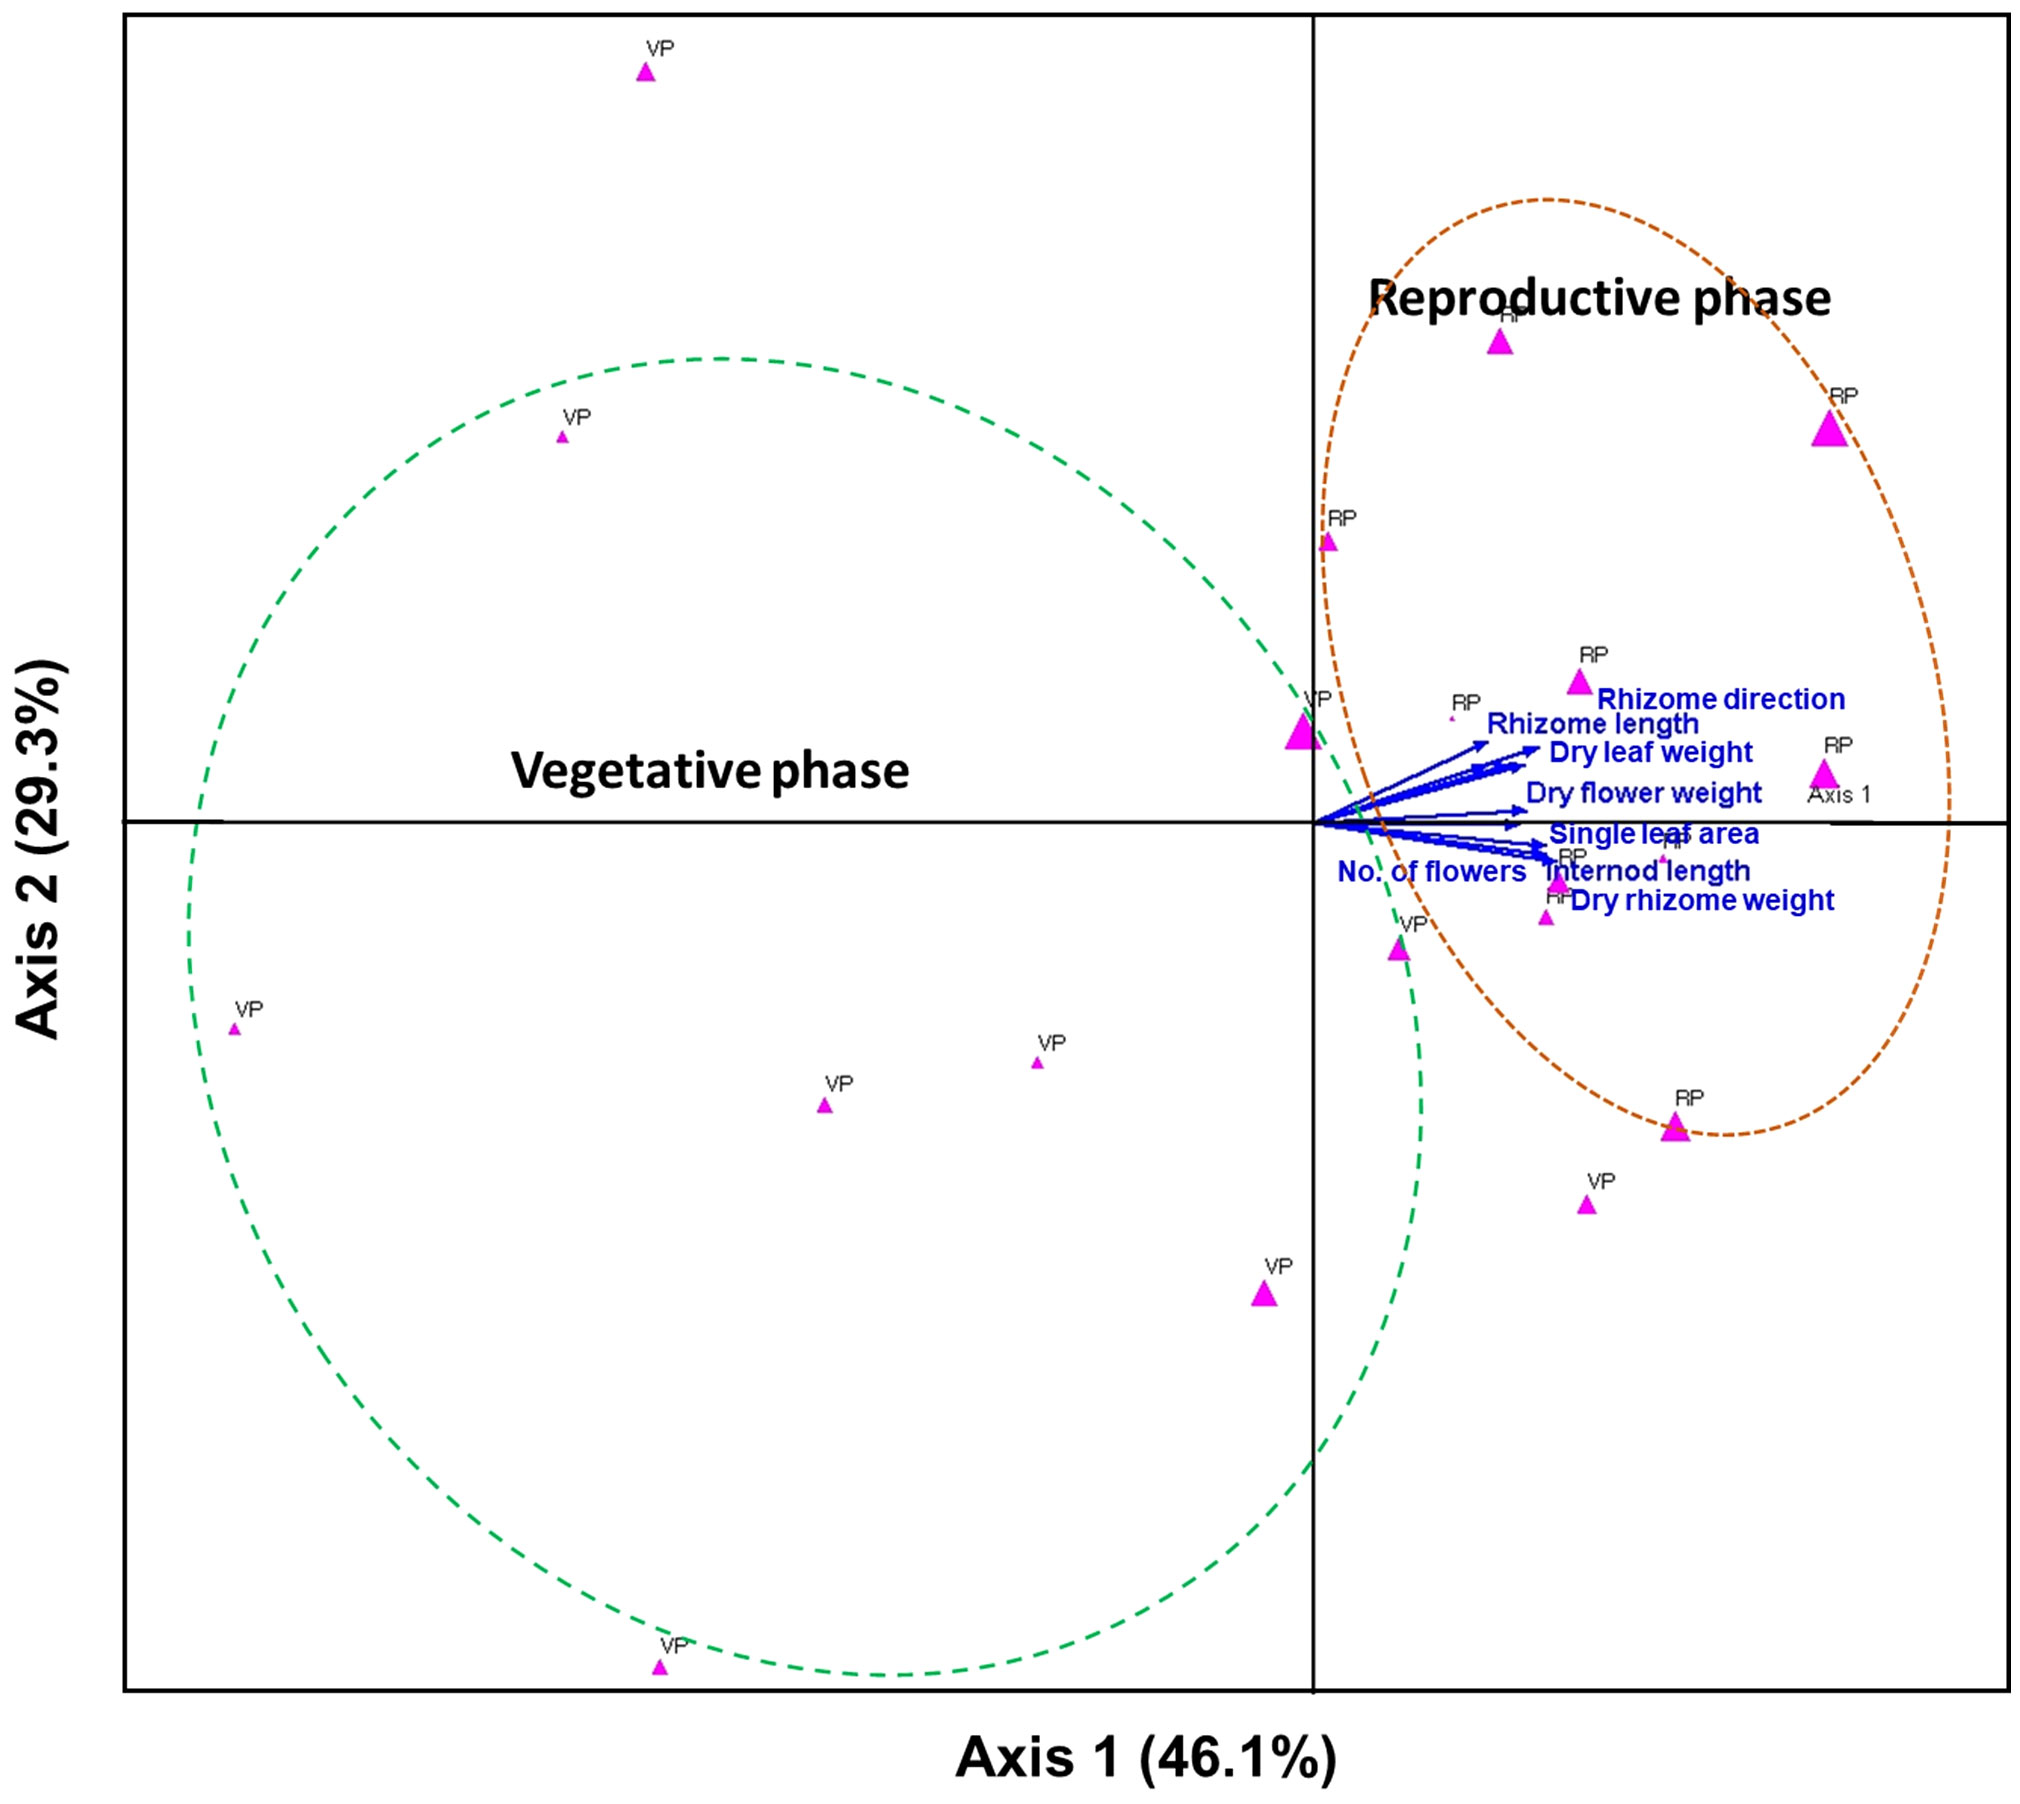
Figure 4 Canonical correlation analysis (CCA) plots to determine the relationships among the environmental factors and growth traits. The percentage (%) of each axis represents the explained variance. Dotted curves indicate groups of individuals in the vegetative and reproductive phases, which are represented by pink triangles. The arrows are strongly correlated with the axis.
3.2 Effects of elevated CO2 on growth and reproduction in different rhizome directions
3.2.1 Nutrient uptake of A. contorta and soil environmental conditions
In the greenhouse experiment, there were no significant differences in nutrient uptake for any nutrient except for potassium (Figure 5). Absorbed potassium was significantly largest in the 540ppmCO2/H (770.85 ± 33.17 mg·kg-1), followed by 540ppmCO2/V (766.13 ± 30.13 mg·kg-1), 400ppmCO2/V (569.14 ± 40.99 mg·kg-1), and 400ppmCO2/H (386.17 ± 36.60 mg·kg-1).
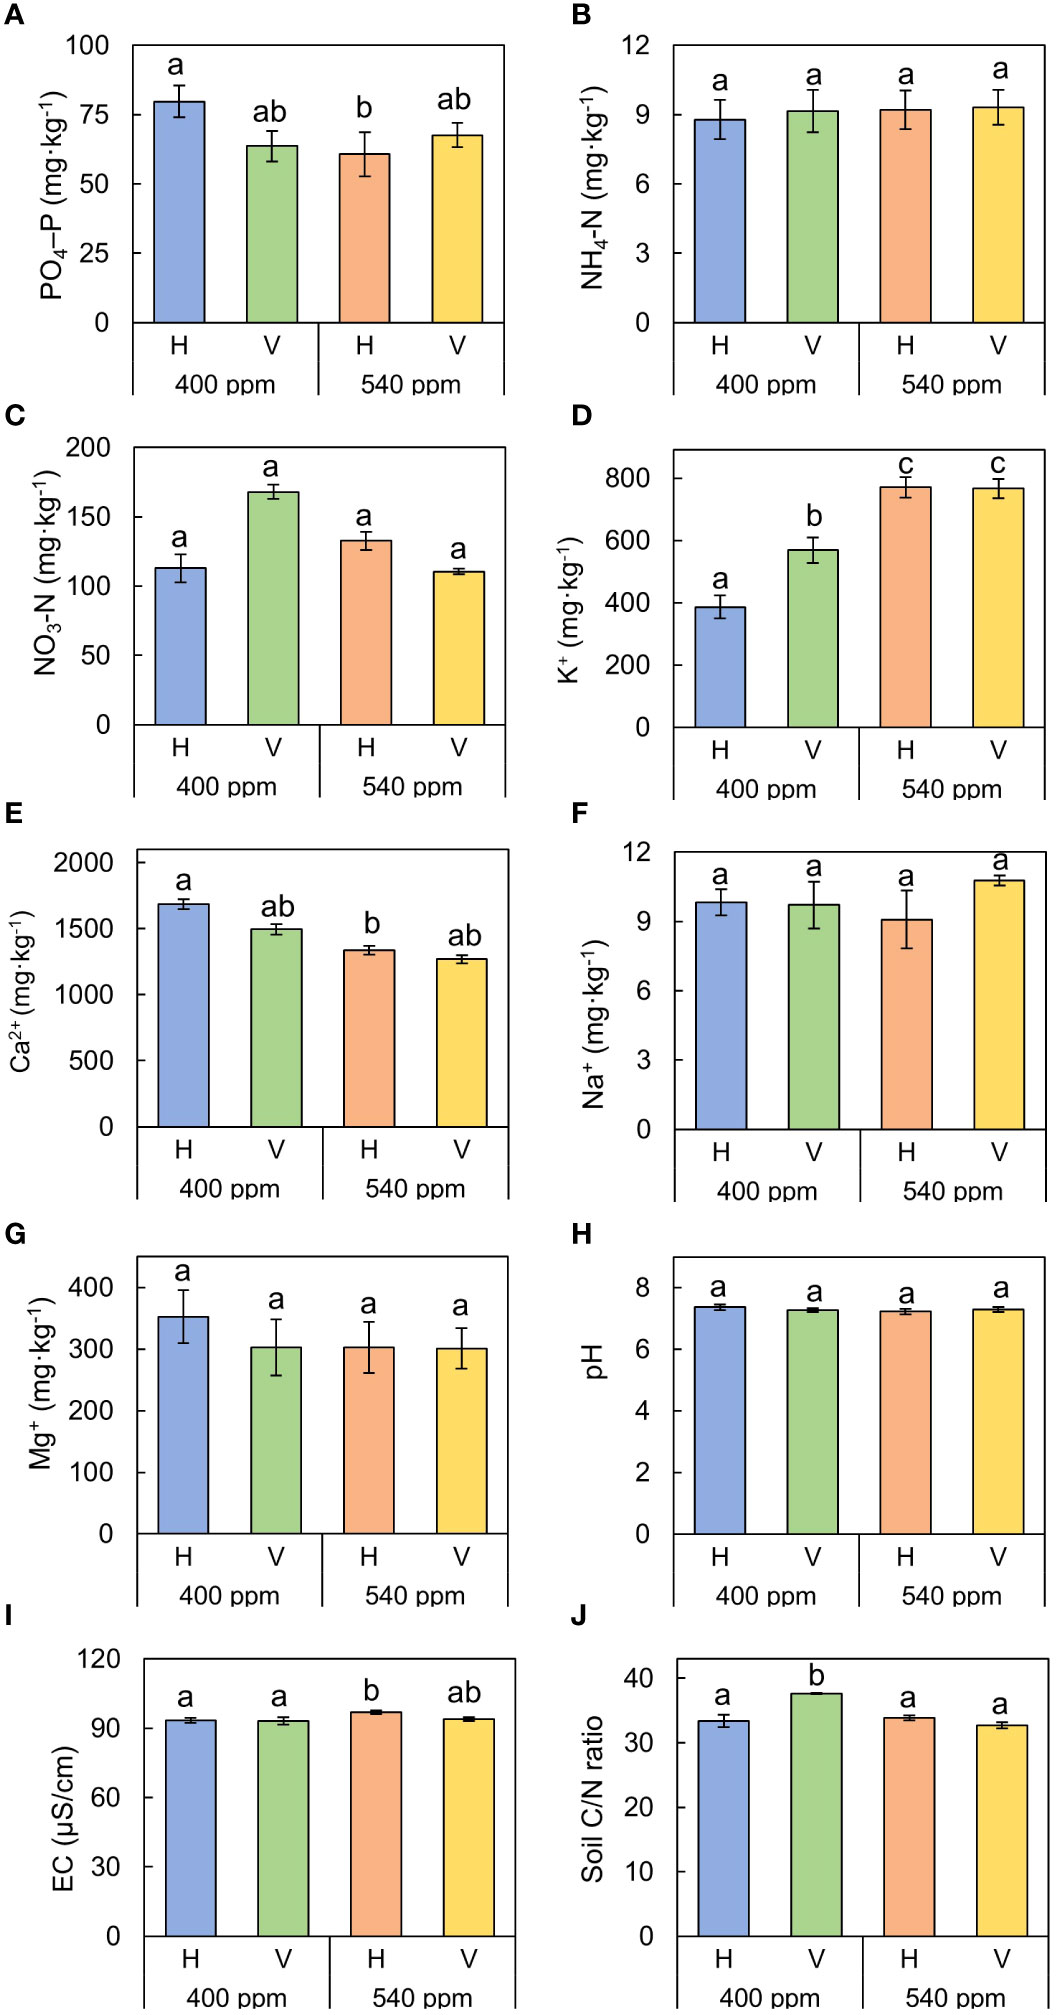
Figure 5 Sum of nutrient uptake by A. contorta and nutrient losses under two CO2 concentrations (400 ppm, 540 ppm), and two rhizome directions (horizontal rhizome planting, H; and vertical rhizome planting, V). (A) PO4–P, (B) NH4–N, (C) NO3–N, (D) Ca2+, (E) K+, (F) Na+, (G) Mg2+, (H) pH, (I) EC, (J) soil C/N ratio. Letters on the graph indicate significant differences at the 5% level, based on Duncan’s test. Bars indicate standard errors.
In the case of soil C/N ratio, the significantly highest value was observed in 400ppmCO2/V (37.66 ± 0.09), followed by 540ppmCO2/H (33.84 ± 0.37), 400ppmCO2/H (33.40 ± 0.99), and 540ppmCO2/H (32.73 ± 0.47).
3.2.2 Elevated CO2 and rhizome direction effects on growth and reproductive traits
Stems, internodes, and branches of A. contorta were significantly longer at 400ppmCO2 than at 540ppmCO2 (Figure 6). In addition, A. contorta produced a greater number of branches, and larger leaves at 400ppmCO2 than at 540ppmCO2. However, chlorophyll content was significantly higher at 540ppmCO2 than at 400ppmCO2. A. contorta with rhizome planted vertically showed longer stem, internode, and branches, thicker stem, higher number of branches and leaves, and larger leaves than individuals with rhizome planted horizontally (Figure 6). Stem length was longest in the 400ppmCO2/V (614.1 ± 67.5 cm), followed by 540ppmCO2/V (445.3 ± 40.5 cm), 400ppmCO2/H (326.8 ± 46.1 cm), and 540ppmCO2/H (216.2 ± 29.4 cm). Internode length was also longest in the 400ppmCO2/V (15.6 ± 1.2 cm), followed by 540ppmCO2/V (10.4 ± 0.8 cm), 400ppmCO2/H (10.4 ± 0.6 cm), and 540ppmCO2/H (7.5 ± 0.5 cm). Stem thickness was largest in the 400ppmCO2/V (2.83 ± 0.18 mm), followed by 540ppmCO2/V (2.64 ± 0.12 mm), 540ppmCO2/H (2.07 ± 0.23 mm), and 400ppmCO2/H (2.02 ± 0.16 mm). Rhizome direction influenced the number of branches and total branch length, with the largest values observed in the 400ppmCO2/V treatment (branches, 10.4 ± 0.9 cm; total branch length, 536.1 ± 39.2 cm), followed by the 540ppmCO2/V treatment (branches, 4.2 ± 0.4; total branch length, 220.8 ± 43.7 cm), the 400ppmCO2/H treatment (branches, 3.1 ± 0.5; total branch length, 135.7 ± 33.7 cm), and the 540ppmCO2/H treatment (branches, 2.8 ± 0.6; total branch length, 98.1 ± 19.1 cm). Number of leaves was largest in the 400ppmCO2/V (225.2 ± 22.4), followed by 540ppmCO2/V (170.1 ± 23.5), 400ppmCO2/H (102.1 ± 20.9), and 540ppmCO2/H (72.7 ± 9.7). Dried stem weight differed significantly under different CO2 concentrations (400ppmCO2, 5.35 ± 0.76 g; 540ppmCO2, 3.44 ± 0.45 g) and dried stem and leaf weights differed significantly under different rhizome directions (stem: H, 2.69 ± 0.33 g; V, 6.11 ± 0.68 g, leaves: H, 2.71 ± 0.76 g; V, 5.24 ± 0.53 g) (Figures 7A–C). The belowground/aboveground ratio was highest in the 540ppmCO2/H (0.61), followed by 400ppmCO2/H (0.39), 540ppmCO2/V (0.27), and 400ppmCO2/V (0.16) (Figure 7D). There was a 26-day difference in the FFD between conditions with 400ppmCO2 (occurring on June 13th) and conditions with 540ppmCO2 (occurring on July 9th). Under 400ppmCO2, flower longevity was extended, accompanied by an increased number of flowers (Figure 8) and larger flower size (perianth size and diameter of utricle) compared to 540ppmCO2 (Figure 9). Additionally, flowers exhibited earliest flowering, with a greater number of flowers, greater flower longevity, and larger perianth size (diameter of utricle) in vertical rhizome as opposed to horizontal rhizome. On the other hand, in terms of asexual reproductive traits, the number of underground buds and shoots was higher at 540ppmCO2 compared to 400ppmCO2.
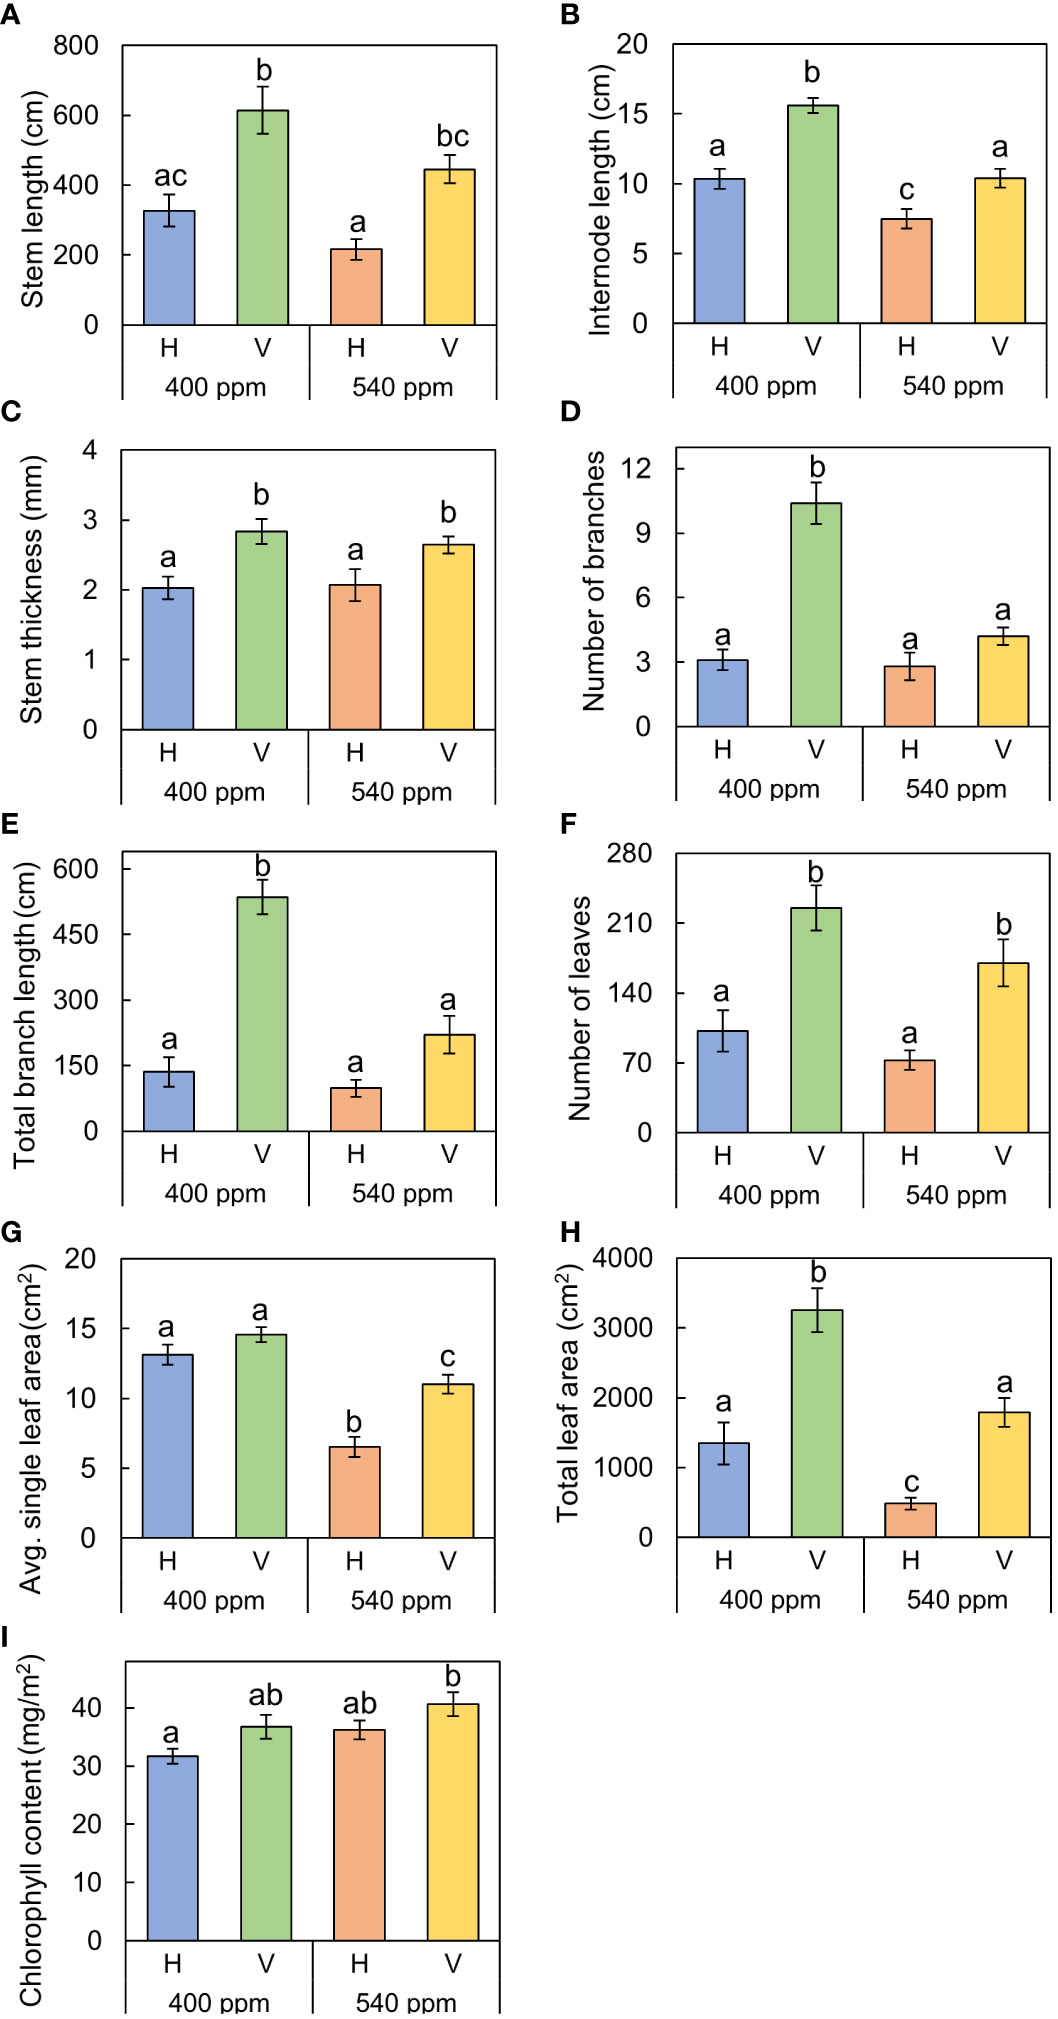
Figure 6 The growth traits of A. contorta under two CO2 concentrations (400 ppm, 540 ppm), and two rhizome directions (horizontal rhizome planting, H; and vertical rhizome planting, V). (A) stem length, (B) length of the first internode, (C) stem thickness, (D) number of branches, (E) total branch length, (F) number of leaves, (G) single leaf area, (H) total leaf area, (I) chlorophyll content. Letters on the graph indicate significant differences at the 5% level, based on Duncan’s test. Bars indicate standard errors.
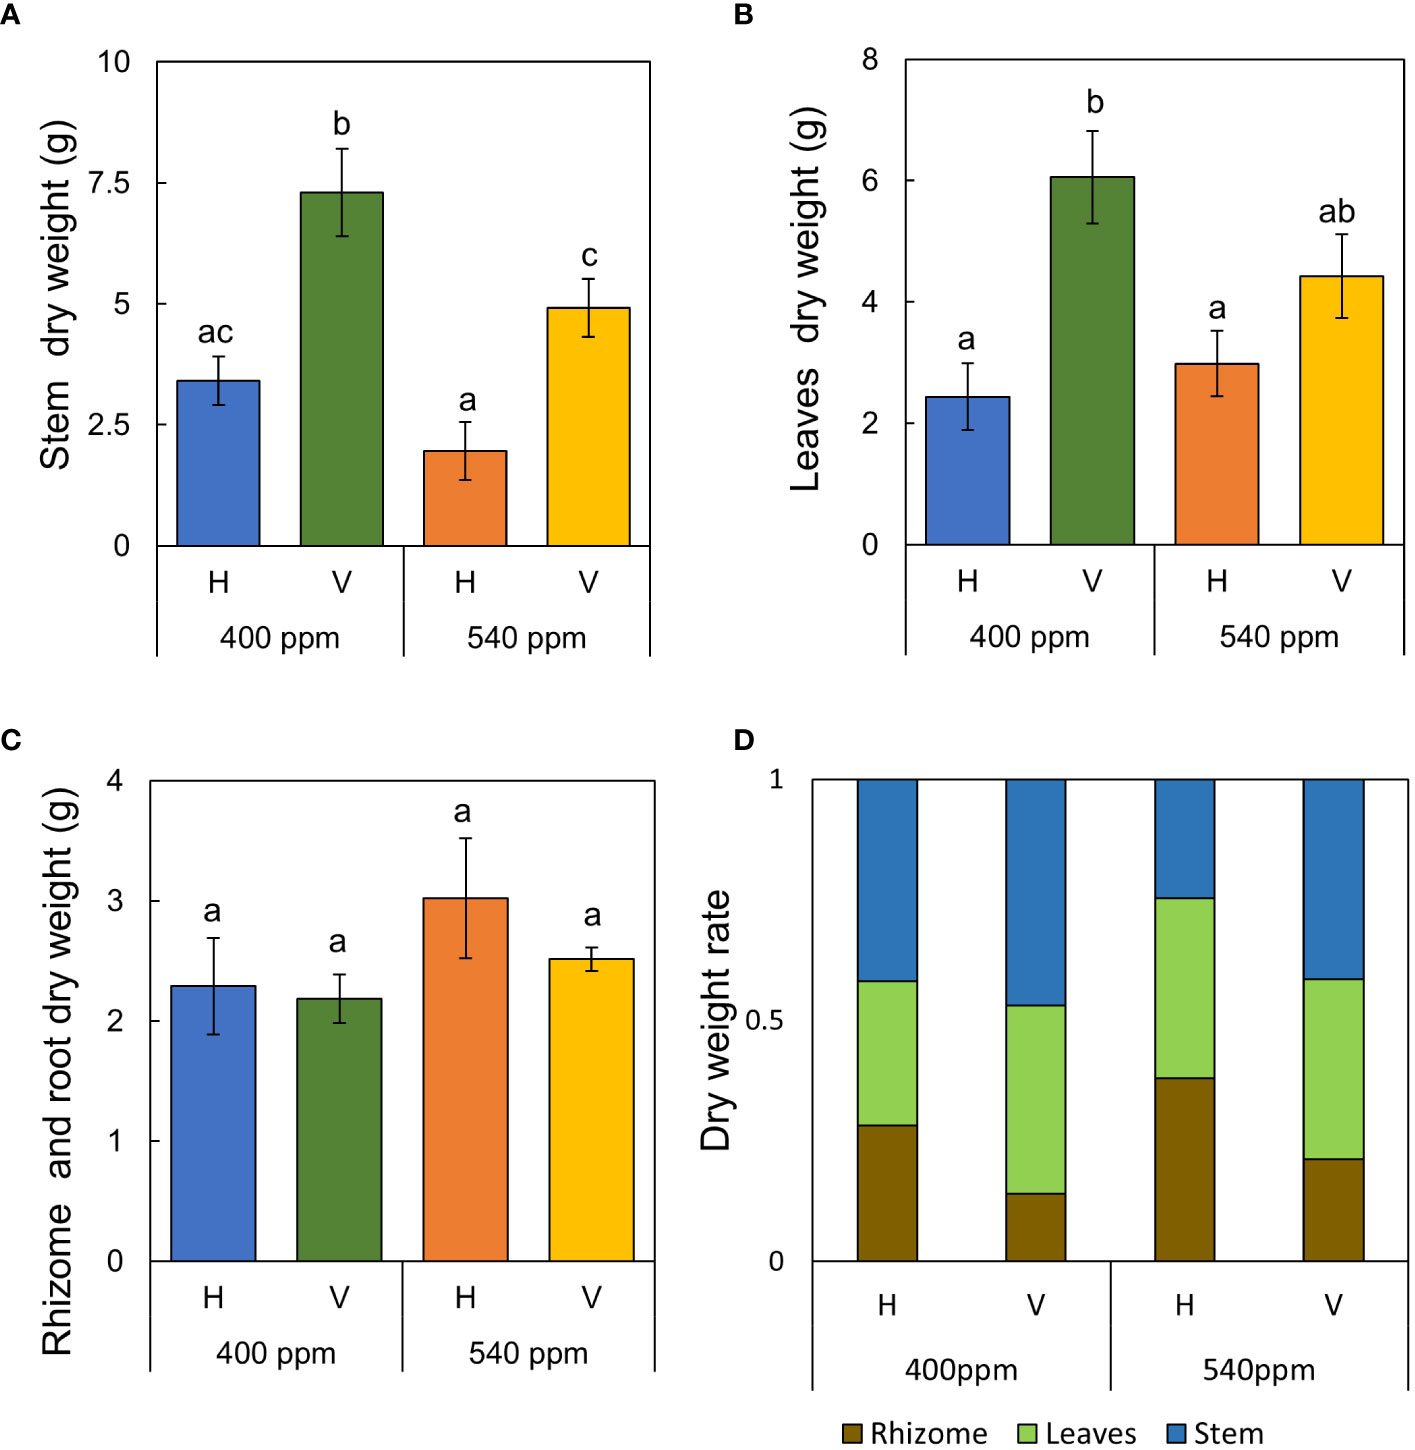
Figure 7 Dry weight of each part of A. contorta and allocation of dry weight under two CO2 concentrations (400 ppm, 540 ppm), and two rhizome directions (horizontal rhizome planting, H; and vertical rhizome planting, V). (A) stem weight, (B) leaves weight, (C) rhizome and root weight, (D) allocation of dry weight. Letters on the graph indicate significant differences at the 5% level, based on Duncan’s test. Bars indicate standard errors.
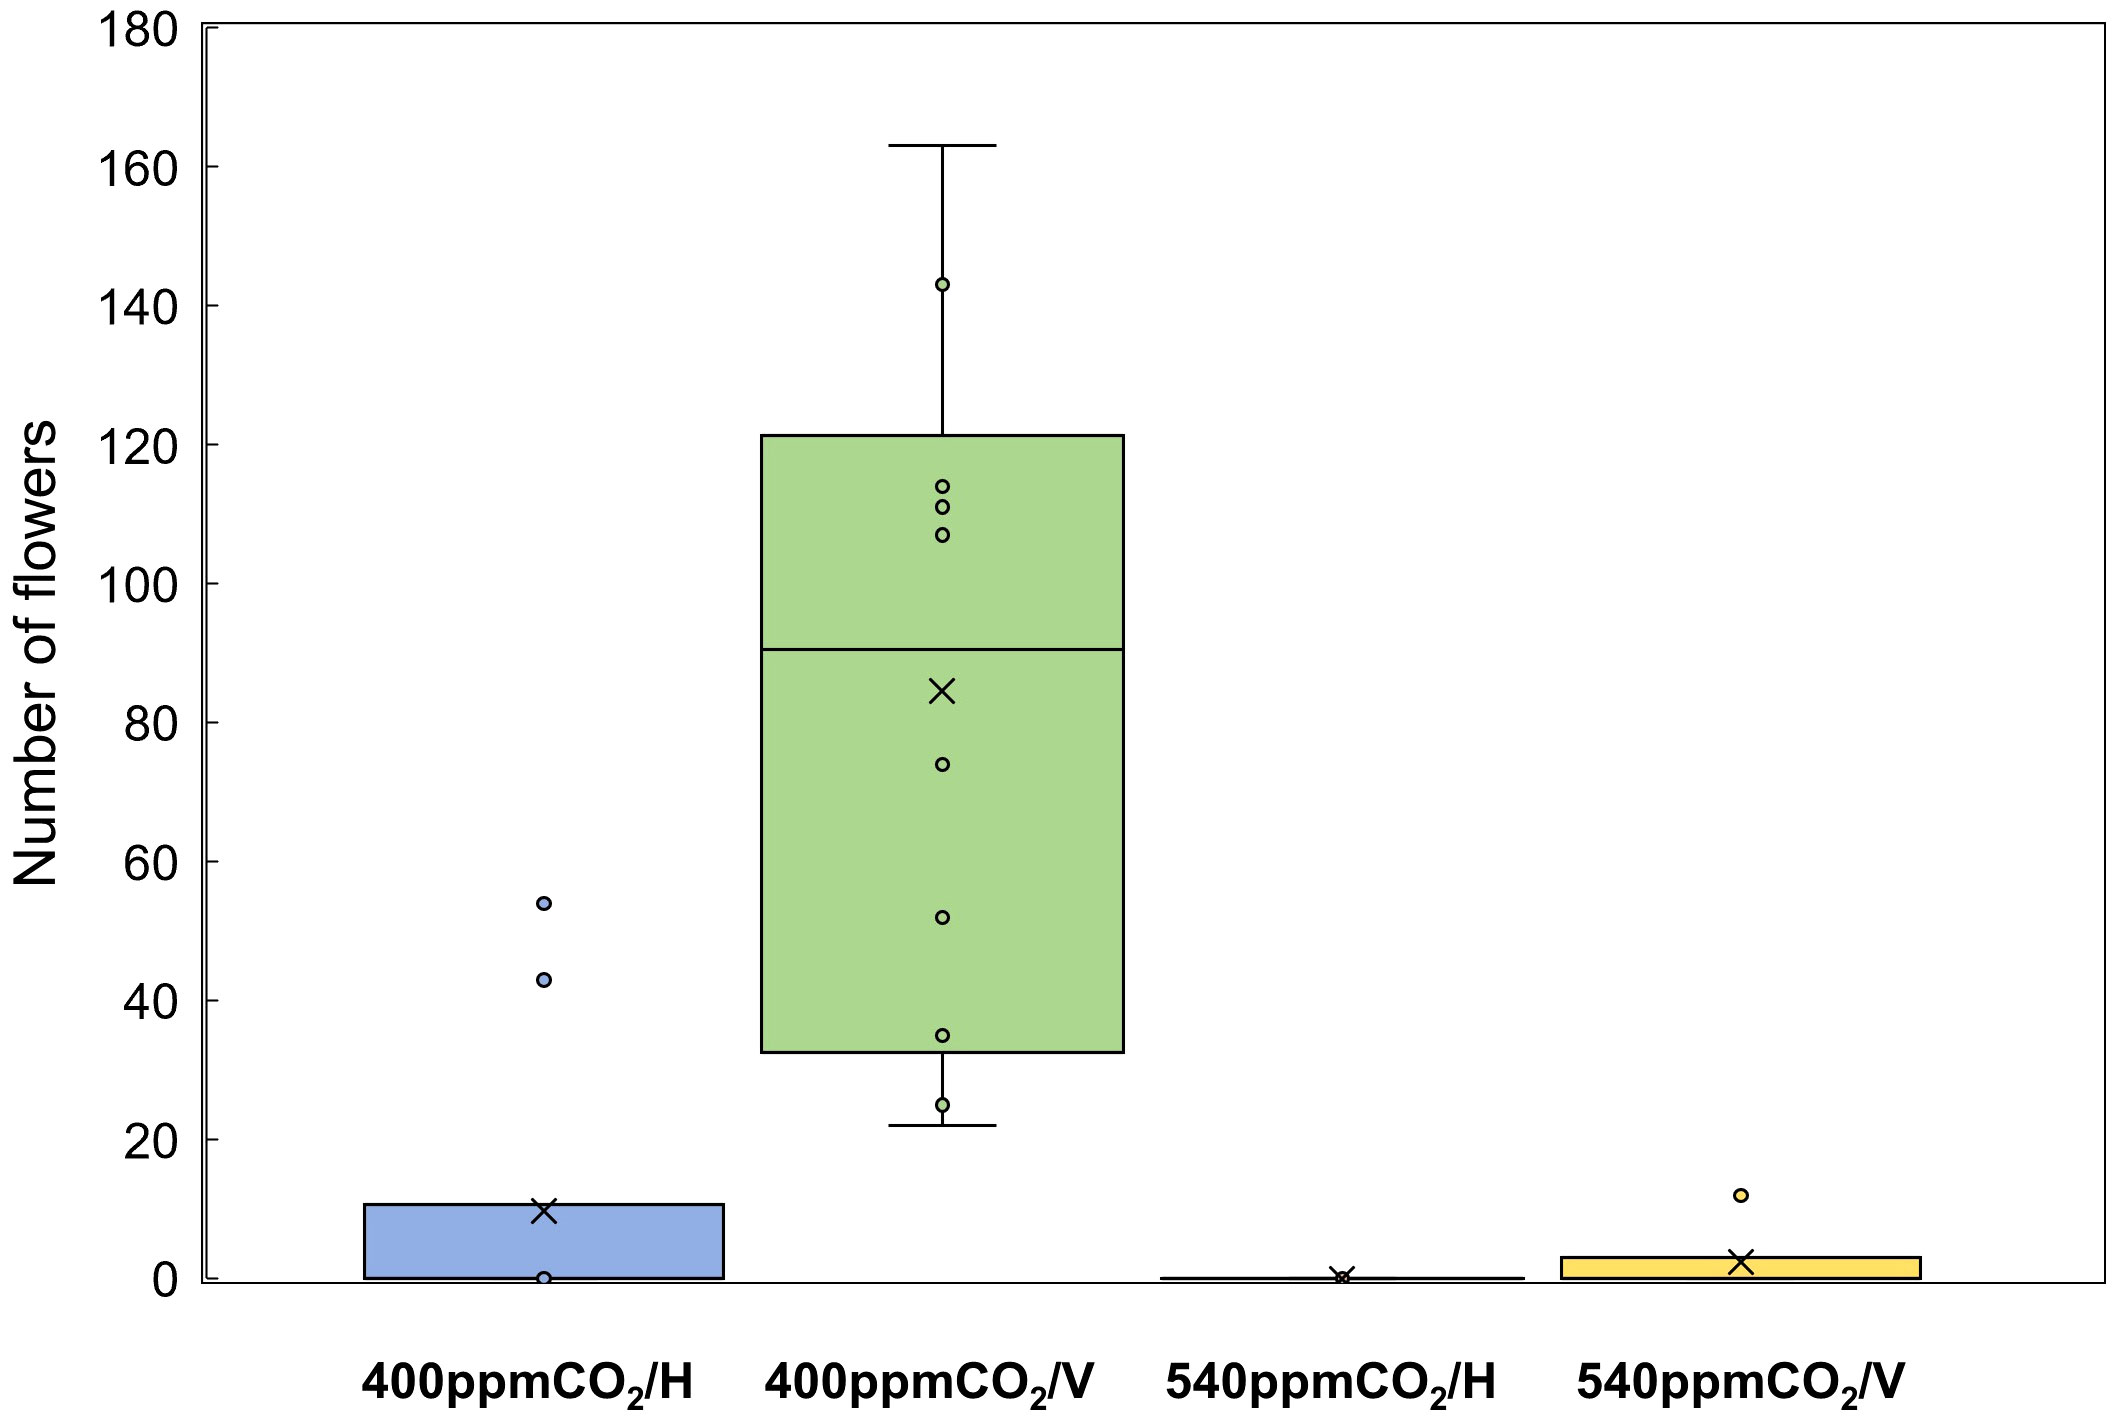
Figure 8 Number of flowers of A. contorta under two CO2 concentrations and two rhizome directions.
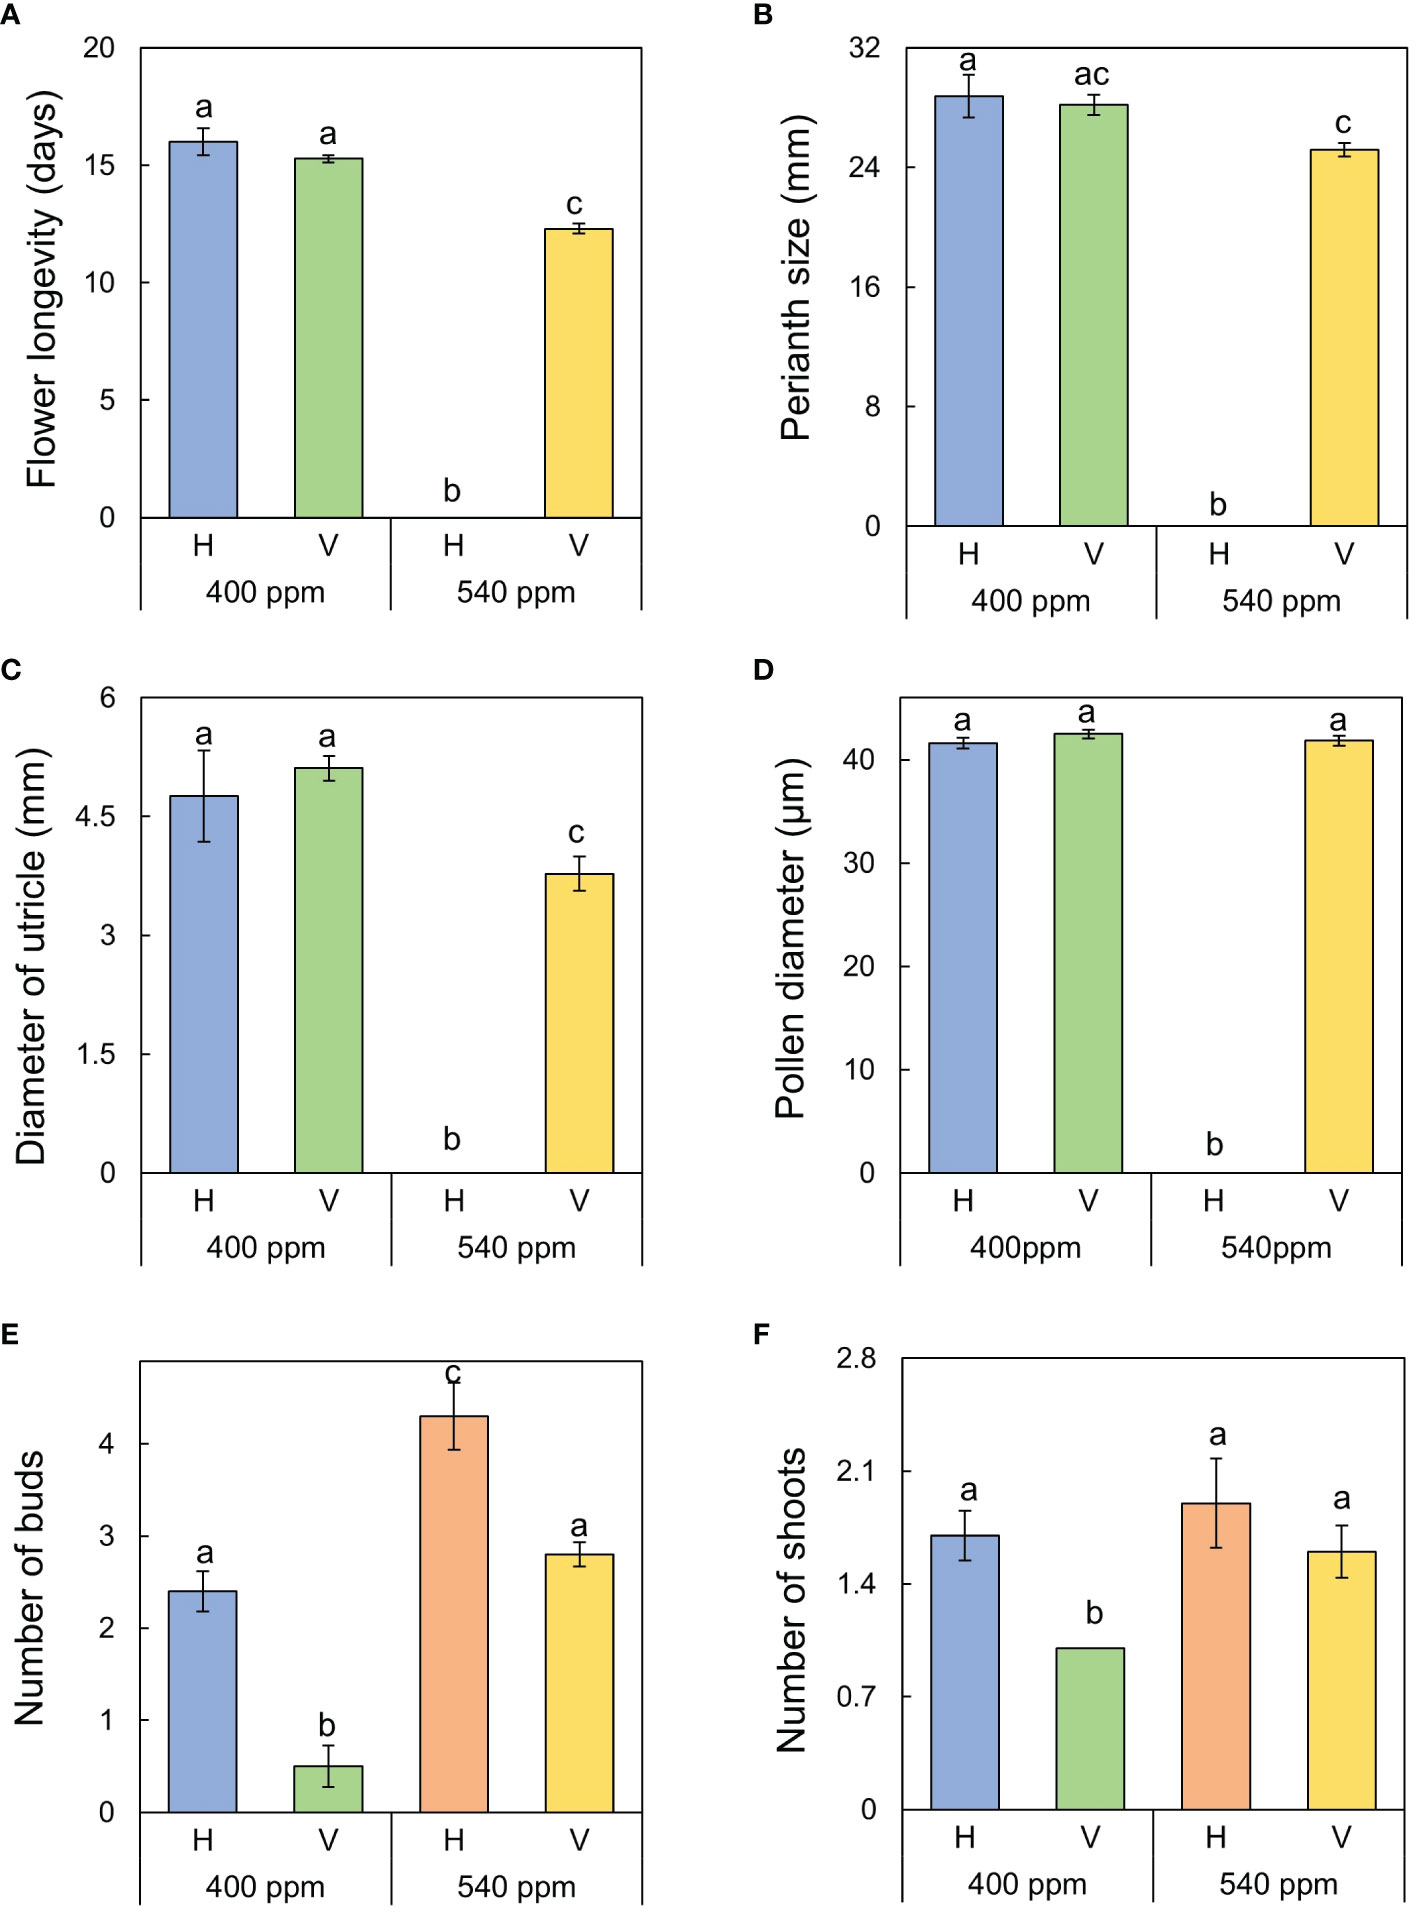
Figure 9 Reproductive (sexual and asexual) traits of A. contorta under two CO2 concentrations and two rhizome directions. (A) flower longevity, (B) perianth size, (C) diameter of utricle, (D) pollen diameter, (E) number of underground buds, (F) number of shoots. Letters on the graph indicate significant differences at the 5% level, based on Duncan’s test. Bars indicate standard errors.
All sexual reproductive traits were responsive to rhizome direction in both 400ppmCO2 and 540ppmCO2. Flower longevity was longest in 400ppmCO2/H (16.0 ± 0.6 days), followed by 400ppmCO2/V (15.3 ± 0.2 days), and 540ppmCO2/V (12.3 ± 0.2 days). Perianth size was largest in 400ppmCO2/H (28.8 ± 1.4 mm), followed by 400ppmCO2/V (28.2 ± 0.6 mm), and 540ppmCO2/V (25.2 ± 0.5 mm). Diameter of utricle was largest in 400ppmCO2/V (5.11 ± 0.08 mm), followed by 400ppmCO2/H (4.76 ± 0.12 mm), and 540ppmCO2/V (3.78 ± 0.18 mm).
Stem C/N ratio was highest in 400ppmCO2/V (19.06 ± 1.97), followed by 540ppmCO2/V (17.87 ± 0.37), 400ppmCO2/H (16.89 ± 0.76), and 540ppmCO2/H (12.3 ± 0.33) (Figure 10). The highest value of leaf C/N ratio was observed in 540ppmCO2/V (14.92 ± 0.69), followed by 540ppmCO2/H (14.24 ± 1.27), 400ppmCO2/V (12.78 ± 0.15), and 400ppmCO2/H (11.21 ± 0.66). The highest ratio of rhizome C/N ratio was found in 400ppmCO2/V (18.39 ± 0.17), followed by 540ppmCO2/V (18.04 ± 0.35), 540ppmCO2/H (14.70 ± 0.51), and 400ppmCO2/H (14.67 ± 0.16). Flower C/N ratio was highest in 400ppmCO2/H (9.76 ± 0.01), followed by 400ppmCO2/V (9.65 ± 0.14), and 540ppmCO2/V (7.09 ± 0.01). For ovary C/N ratio was highest in 400ppmCO2/V 12.04 ± 0.01), followed by 400ppmCO2/H (10.78 ± 0.01), and 540ppmCO2/V (10.02 ± 0.02).
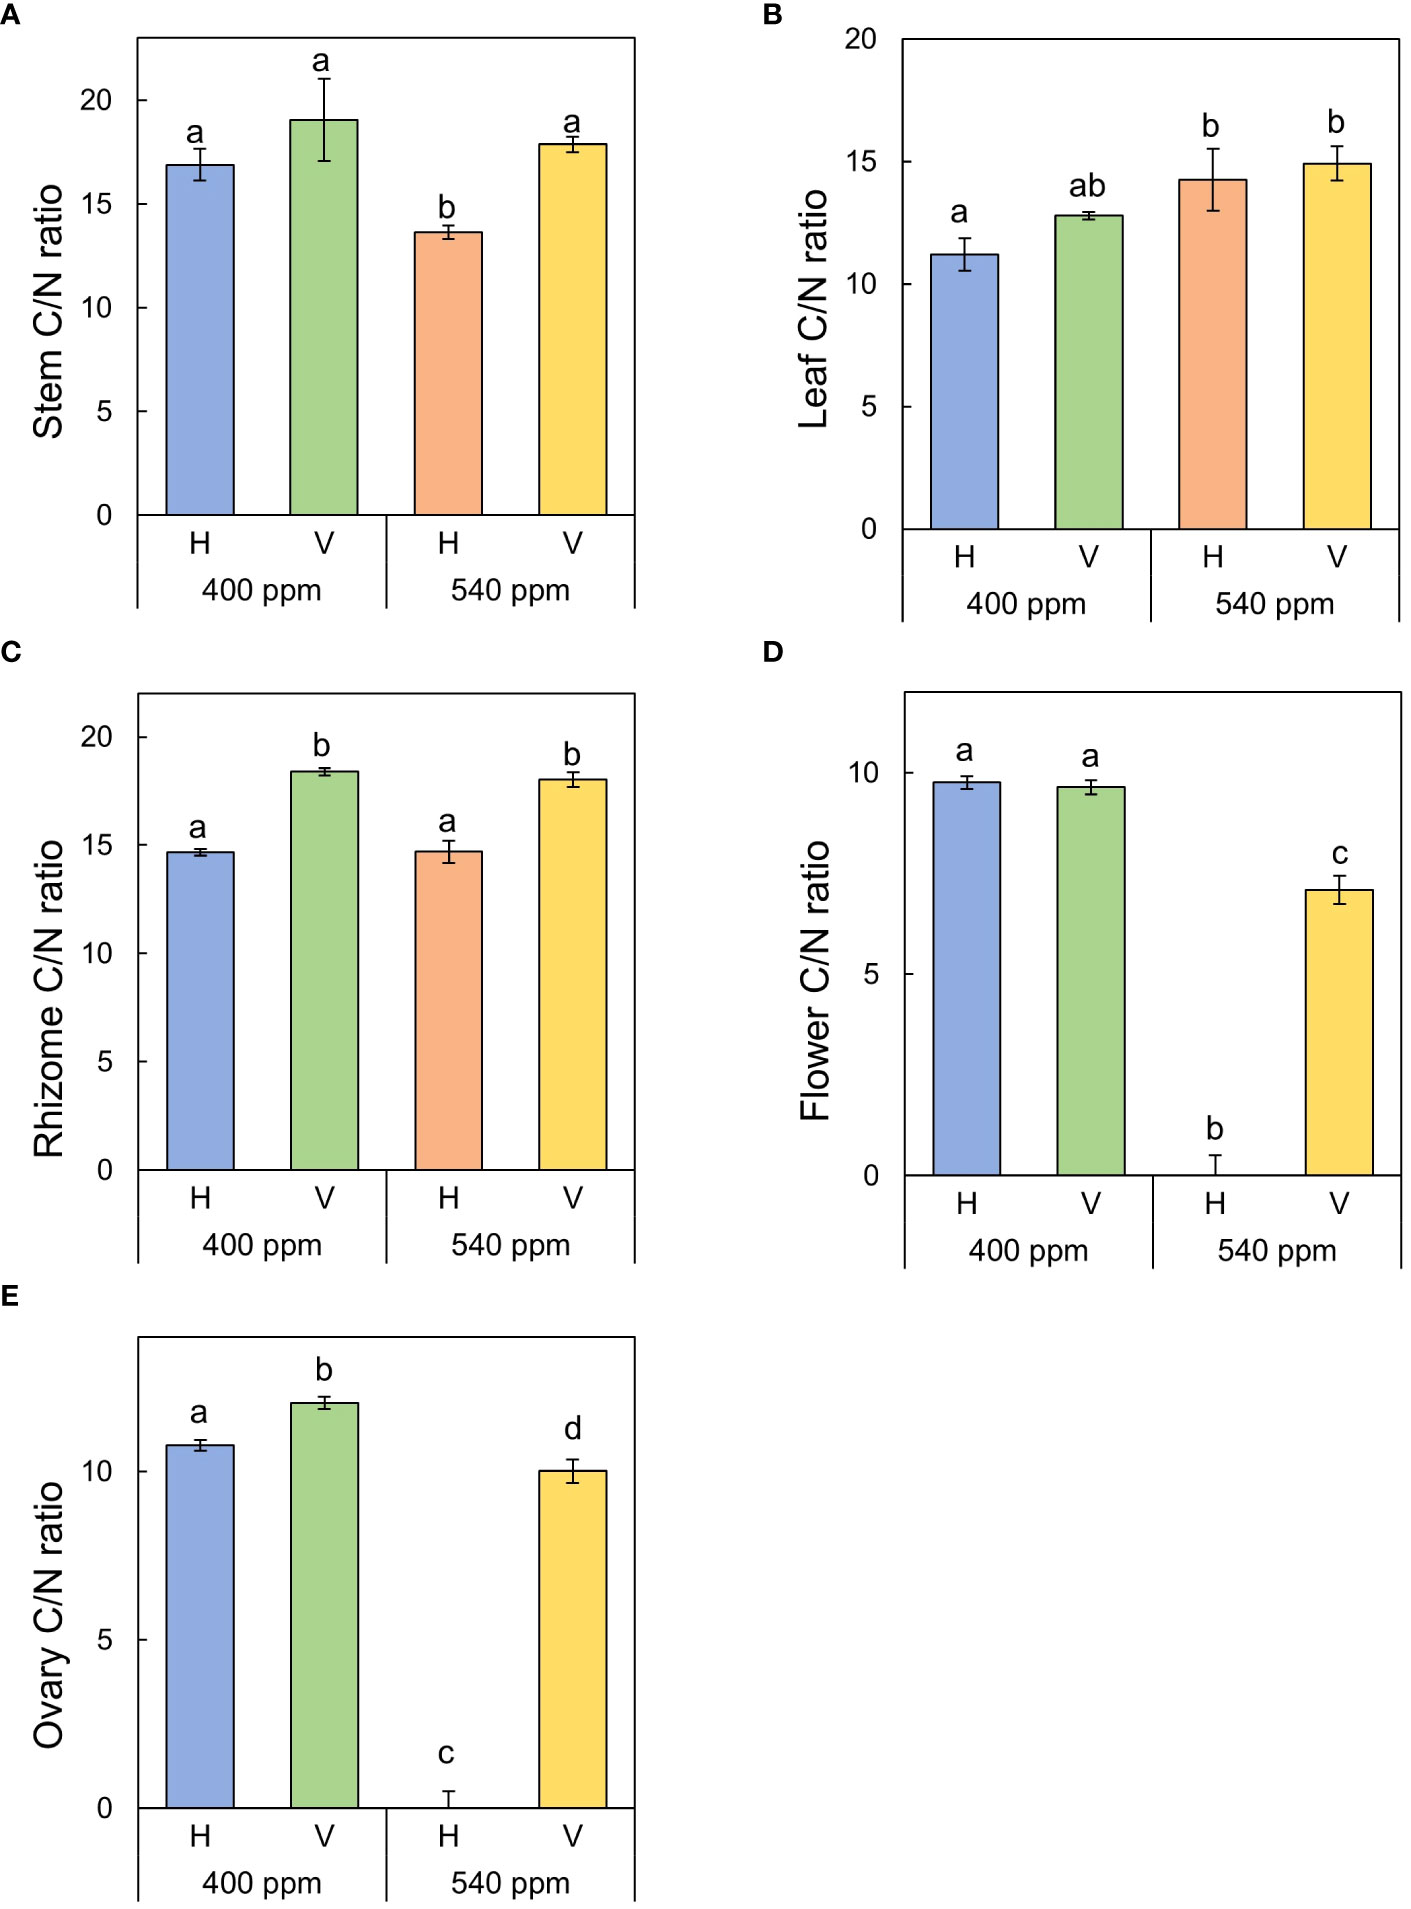
Figure 10 C/N ratio of each part of A. contorta under two CO2 concentrations and two rhizome directions. (A) stem C/N ratio, (B) leaf C/N ratio, (C) rhizome C/N ratio, (D) flower C/N ratio, (E) ovary C/N ratio.
The stigma reactions were the most intense at the 400ppmCO2/V and there were numerous bubbles at the 400ppmCO2/H (Table 1). The reactions of stigmas were not intense on at the 540ppmCO2/V with only a few bubbles on the stigma. Pollen viability rates were highest at 400ppmCO2/V (the viability range between 90.0 ± 1.2 - 97.0 ± 0.8%, reaching up to 100%), followed by 400ppmCO2/H (88.3 ± 1.7 - 93.3 ± 1.7%), and lowest at 540ppmCO2/V (71.7 ± 6.0 - 85.0 ± 2.9%, reaching up to 60%) in the observations conducted under an optical microscope (Table 2).
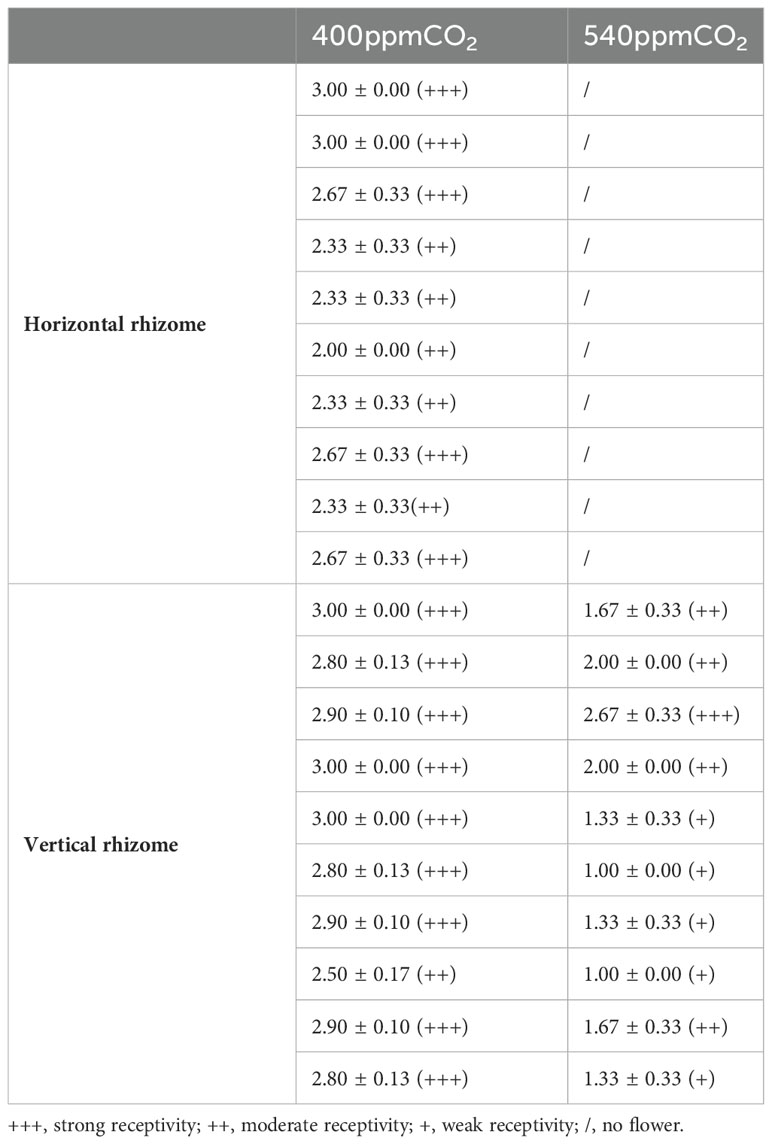
Table 1 Stigmatic receptivity of A. contorta under two CO2 concentrations and two rhizome directions.
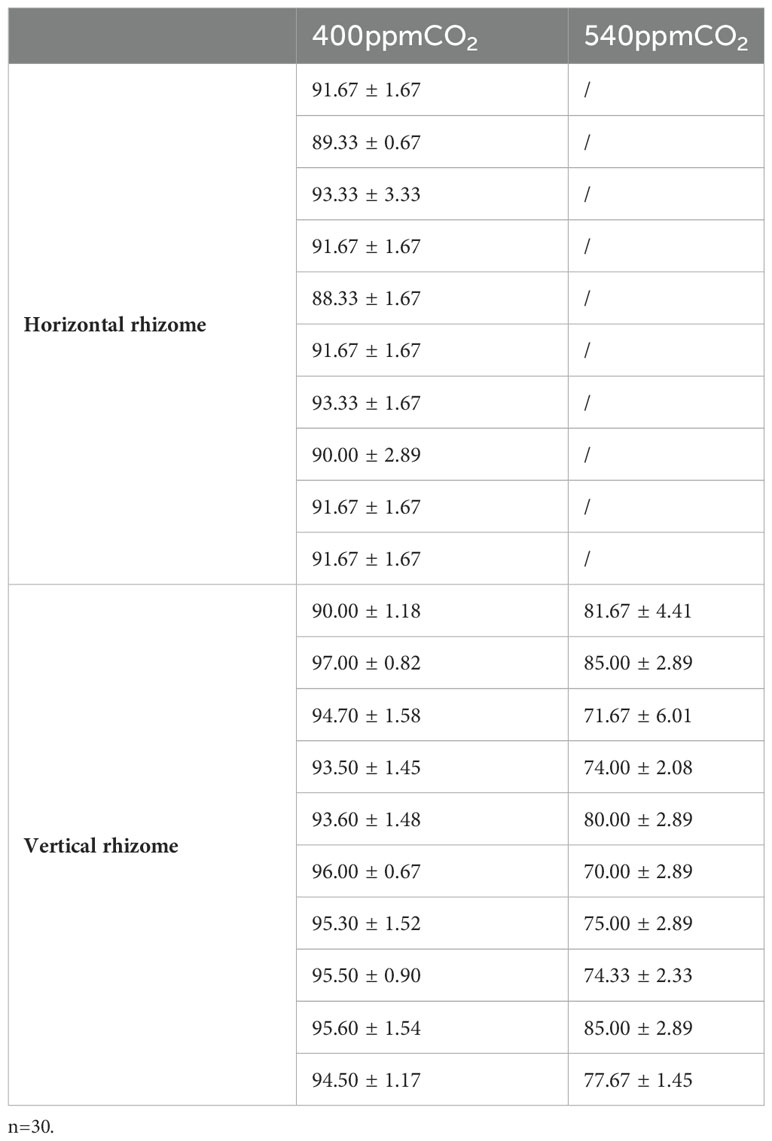
Table 2 Proportion of the stained pollen grains at A. contorta individuals (%).
3.2.3 Interactive effects of elevated CO2 concentrations and rhizome direction on growth and reproductive traits
Morphological and reproductive traits responded to differences in CO2 concentrations and rhizome directions (Table 3). For instance, number of shoots was only affected by CO2 concentrations, and stem thickness and dry leaf weight were only affected by rhizome directions. There were no interactive effects on dry rhizome weight. Morphological differences according to the CO2 concentrations were more apparent when the rhizome direction was different. We detected a significant interaction of CO2 concentrations and rhizome direction on number of branches, total branch length, single leaf area, total leaf area, dry stem weight, and sexual reproductive traits (number of flowers, flower longevity, perianth size, diameter of utricle, pollen grain size, stigmatic receptivity, and pollen viability).
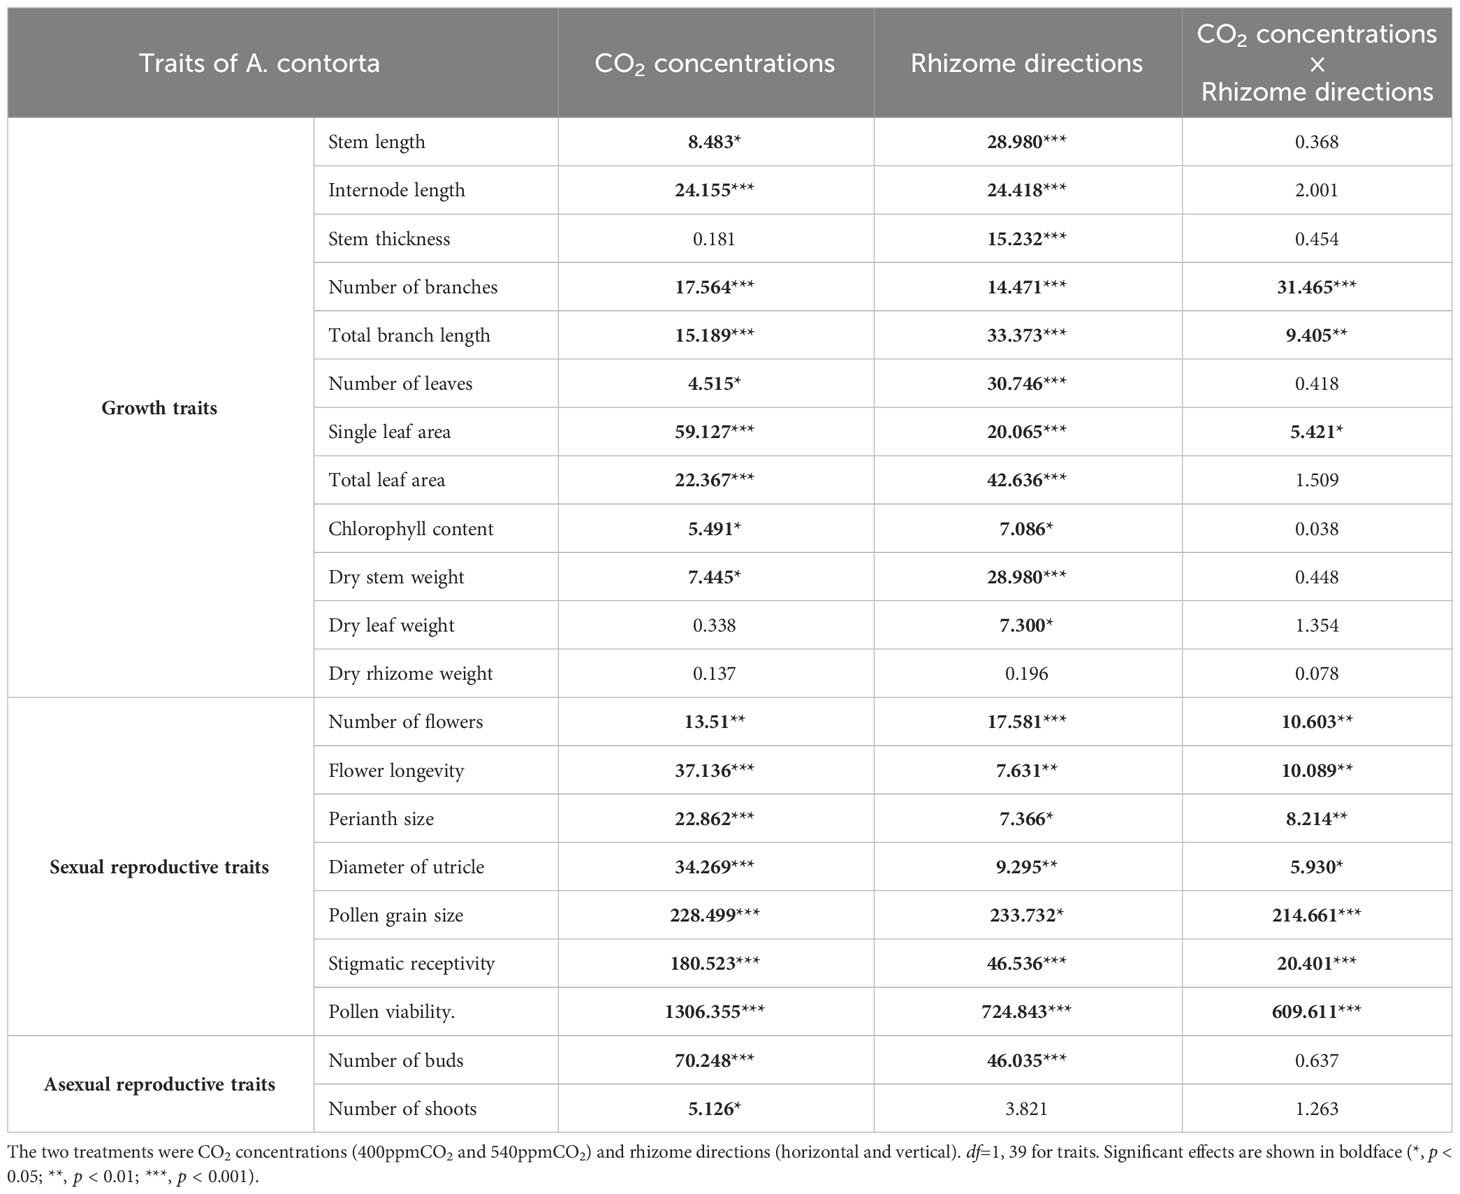
Table 3 Two-way analysis of variance results for traits of A. contorta in the greenhouse experiments; F statistics are shown.
Growth traits at 400ppmCO2 exhibited strong correlations with reproductive characteristics, including the number of flowers, flower longevity, perianth size, diameter of the utricle, pollen grain size, stigmatic receptivity, and pollen viability (Figure 11). Growth traits at 540ppmCO2 displayed strong correlations with the number of buds and shoots. Axes 1 and 2 accounted for 55.1% and 59.7% of the explained variance, respectively.

Figure 11 Canonical correlation analysis (CCA) plots to determine the relationships between growth and reproductive traits. The percentage (%) of each axis represents the explained variance. The dotted curves indicate the groups of individuals in the treatment groups, which are represented by the blue triangles. The arrows are strongly correlated with the axis.
4 Discussion
4.1 Environmental factors and growth traits in A. contorta
We specifically focused on environmental factors and established a standard for assessing their significant influence on optimal flowering in mature A. contorta. During the reproductive phase, RLI was significantly lower (approximately 40%) than that during the vegetative phase, and the soil water content was notably higher than that during the vegetative phase (Figures 1A, B). Appropriate light intensity has been recognized as a significant driver of growth in mature A. contorta. Adequate light during the vegetative phase can enhance photosynthesis and establish a resource base for future reproductive efforts (Wimalasekera, 2019). However, excessive light such as RLI 100% can disrupt growing and flowering of mature A. contorta (Park et al., 2019; Wimalasekera, 2019). This inhibition can be attributed to various factors based on prior research, including photoinhibition, altered hormone regulation, and increased oxidative stress in plants exposed to excessively intense light conditions (Huang et al., 2019; Maai et al., 2020; Bassi and Dall'Osto, 2021; Roeber et al., 2021).
There was a negative correlation between RLI and soil water content (-0.512, p < 0.05) in both the vegetative and reproductive phase, with high light intensity identified as a factor contributing to a decrease in soil water content. Due to the higher RLI, A. contorta grown in arid soil conditions of the vegetative phase group exhibited inferior growth compared to the reproductive phase group and did not flower sufficiently. Adequate soil water is essential for nutrient uptake, photosynthesis, and overall plant health (Zainul et al., 2020; Chtouki et al., 2022). Without sufficient water, plants struggle to maintain their physiological processes and reach the reproductive phase, which is vital for successful flowering and reproductive success (Jomo et al., 2015; Chauhan et al., 2019).
The field survey also explored the role of soil nutrients, specifically aiming to identify the precise soil nutrient levels that are essential for optimal growth. While no significant differences in soil nutrient levels were observed between the vegetative and reproductive phase during the field survey (Figure 1), this suggests that the soil may contain an appropriate abundance of the necessary nutrients to support sufficient growth and flowering (Uchida, 2000; Pestana et al., 2005; Fathi, 2022). Prior research has consistently demonstrated that insufficient or excessive soil nutrient levels can significantly hinder growth and flowering processes (Uchida, 2000), highlighting the profound influence of nutrient availability on plant reproduction. While these vegetative and reproductive phases contain similar soil nutrient contents, the discrepancy in flowering can be attributed to differences in RLI and soil water content. These environmental factors were found to have a strong correlation with the growth characteristics and number of flowers of A. contorta (Figure 4). This implies that under suitable environmental conditions, A. contorta exhibits optimal growth, which is essential for flowering.
In addition to environmental factors from the field surveys, the results of the greenhouse experiment also demonstrated that elevated CO2 concentrations had a hindering effect on the growth of mature A. contorta. There was a significant decrease in stem length, internode length, leaf size, and branch development under 540ppmCO2 compared to 400ppmCO2 (Figure 6). Some plant responses, such as increased leaf thickness and mesophyll size, may enhance photosynthesis and growth (Prior et al., 2011; Zhang et al., 2013; Broughton et al., 2016; Choi et al., 2017; Chavan et al., 2019; Thruppoyil and Ksiksi, 2020). However, in other plants, specific changes in stomatal conductance and biochemical composition can counteract these positive effects, resulting in variable outcomes for growth and photosynthesis under elevated CO2 conditions (Poorter and Perez-Soba, 2002; Wang et al., 2012; Zheng et al., 2019). Elevated CO2 levels reduce stomatal conductance. This reduction decreases water loss but also limits CO2 diffusion into the leaf, affecting photosynthesis (Poorter and Perez-Soba, 2002; Wang et al., 2012). This reduction can affect the overall photosynthetic efficiency and, subsequently, growth. Interestingly, in our experiment at 540ppmCO2, even though there was a higher leaf chlorophyll content, the aboveground growth was not as favorable. This is because it is speculated that this additional resource allocation is directed towards other parts, such as rhizomes, root buds, and shoots. Such resource allocation can indicate trade-offs between biological growth and reproductive structures (Ziska et al., 2004; McPeek and Wang, 2007; Qin et al., 2022). Over time, plants exposed to elevated CO2 may undergo photosynthetic acclimation, where the initial increase in photosynthetic rate plateaus or decreases due to downregulation of Rubisco activity and other photosynthetic enzymes (Zhang et al., 2013; Broughton et al., 2016). This acclimation can limit growth benefits from increased CO2.
It exhibited higher C/N ratios in stem, rhizome, flower and ovary parts except for the leaves at the 400ppmCO2 condition (Figure 10). The different C/N ratios in leaves compared to other plant parts result from their influence on carbon and nitrogen levels. Carbon levels are regulated through leaves by affecting photosynthetic capabilities and carbohydrate export, while nitrogen quantities are modulated by their transport from stems to reproductive tissues (Yasumura, 2009). Plants possess the ability to independently govern carbon and nitrogen, a crucial trait in natural environments where external factors can readily disrupt the delicate carbon-nitrogen balance (Yasumura, 2009). In addition, elevated CO2 can affect nitrogen assimilation and utilization, leading to lower nitrogen content in tissues (Choi et al., 2017; Chavan et al., 2019). Since nitrogen is vital for chlorophyll and protein synthesis, its reduced availability can limit growth despite the increased photosynthetic potential.
Our study also revealed a noticeable difference in potassium absorption under elevated CO2 conditions (Figure 5D). Potassium serves as a catalyst for a range of enzymes and plays a crucial role in regulating the intracellular osmotic balance and facilitating the transport of membrane proteins (Ye et al., 2019). Additionally, it has a significant impact on carbohydrate transportation in plants, contributing to their overall metabolism and resilience to stress factors (Wang and Wu, 2013; Nieves-Cordones et al., 2019). At 540ppmCO2, the enhanced potassium absorption, likely attributable to its involvement in photosynthesis, may not have been the predominant factor affecting the flowering of A. contorta. These results underscore the intricate interplay between CO2 concentrations and various physiological and morphological traits in A. contorta.
4.2 Growth traits and their impact on reproductive traits in A. contorta
Our study revealed variations in the growth traits of A. contorta, such as thicker stems, longer internodes, increased leaf area, and more flowers in the reproductive phase (Figure 2). Before plants reach the flowering and reproduction stages, most plants go through a period of vegetative growth (Sola and Ehrlen, 2007). Vegetative and reproductive phases can be viewed as developmental phases where new organs continuously develop, each exhibiting distinct morphological traits such as internode length, leaf area, and cell size (Poethig, 2003; Huijser and Schmid, 2011; Wang et al., 2011). During this period, plants typically experience a rapid increase in their ability to perform photosynthesis and their overall size and mass (Sola and Ehrlen, 2007). Generally, plants develop reproductive organs only during the adult vegetative phase (Araki, 2001). This also aligns with the findings of Park et al. (2019), indicating that when an appropriate level of RLI is provided, A. contorta growth becomes more vigorous and has flowers. These observations underscore the importance of achieving a minimum level of growth during the transition from the vegetative to the reproductive phase, which is essential for successful flowering (Araki, 2001). Furthermore, the observed higher C/N ratio in the reproductive phase compared to the vegetative phase (Figure 3) carries substantial implications for nutrient availability and allocation (Uchida, 2000). As documented in earlier research (Zhang et al., 2022), plants may allocate resources toward nitrogen uptake when soil nitrogen levels exceed optimal ranges, potentially delaying or inhibiting the initiation of the flowering process. This phenomenon is often observed when plants adapt their resource allocation strategies to optimize their survival and reproduction under varying environmental conditions (Körner, 2015). Resource allocation in A. contorta refers to the distribution of limited resources among different physiological processes, including growth and reproduction (Hartmann et al., 2020). When an appropriate level of resources is available, as indicated by factors such as proper RLI and soil nutrient levels, plants allocate more resources to growth (Tandon et al., 2020). This allocation leads to thicker stems, longer internodes, and increased leaf areas, all of which are associated with a more vigorous growth phase (Tandon et al., 2020).
In greenhouse experiments, as in the field survey, plant growth in response to CO2 concentration contributed to the transition from the vegetative to the reproductive phase. Adequate vegetative growth, as observed at 400ppmCO2, characterized by long and thick stems and abundant leaves, was associated with a higher number of flowers (Figures 6, 10). On the other side, at 540ppmCO2, insufficient growth was observed, which hindered flowering (Figures 6, 10). In addition, at 400ppmCO2, flowering occurred earlier than under other conditions, while at 540ppmCO2, flowering was hindered. This may be associated with a greater allocation of resources to aboveground structures rather than belowground structures (Figure 7D). Elevated CO2 concentration also had an additional effect on plant flowering. These findings are in agreement with those of previous research (Jablonski et al., 2002), which also highlighted the influence of CO2 concentration on the reproductive traits of various plant species.
Our study also revealed significant reductions in flower longevity, decreased flower abundance, and smaller flower size under 540ppmCO2 (Figure 9). In the same context, several plant species (Trifolium pratense, Capsicum annuum, and Cucurbita pepo) exhibited a reduced number of flowers and shortened flower longevity under elevated CO2 conditions (Rusterholz and Erhardt, 1998; López-Cubillos and Hughes, 2016). Conversely, different plant species (Phalaenopsis Queen Beer, Lotus corniculatus, Gerbera jamesonii, and Vitis vinifera L.) produce a greater number of larger flowers and experience extended flower longevity in response to elevated CO2 conditions (Rusterholz and Erhardt, 1998; López-Cubillos and Hughes, 2016; Arrizabalaga-Arriazu et al., 2020). This highlights the divergent responses of plant species to elevated CO2, indicating that the impact varies depending on the specific plant type. Remarkably, traits like stigma receptivity and pollen viability also demonstrated increased vitality at the 400ppmCO2 condition, which may contribute to the reproductive success of A. contorta. This parallels a study on maize crop production, where elevated CO2 concentrations were found to have adverse effects not only on stigma receptivity and pollen viability but also on reproductive processes and yield (Prasad et al., 2006; Bokshi et al., 2021).
Moreover, it’s important to highlight that 540ppmCO2 appeared to be less favorable for overall growth, thereby promoting asexual reproduction which were the number of underground buds and shoots (Figures 9E, F). In the elevated CO2, the absence of flowering suggests that plants may have adopted an asexual reproduction strategy due to the challenging conditions for sexual reproduction. This trade-off highlights the flexibility of the reproductive strategies of mature A. contorta, suggesting dynamic resource allocation in response to different environmental cues to maximize overall reproductive fitness. This phenomenon aligns with observations in other plant species, such as Cirsium arvense and Taraxacum officinale (Ziska et al., 2004; McPeek and Wang, 2007). This shift towards increased asexual reproduction at 540ppmCO2 could potentially lead to reduced genetic diversity. Such a change in reproductive strategy has implications for genetic variation, since it may limit the introduction of new genetic variations typically associated with sexual reproduction (Nakonechnaya et al., 2012; Nam et al., 2020; Yu et al., 2021).
Therefore, based on vigorous growth, mature A. contorta (e.g. 400ppm/V) may strategically allocate resources to maximize its sexual reproductive success; otherwise, it (eg. 540ppm/H) may invest in asexual reproduction (Figure 11). In response to elevated CO2 concentrations, these findings suggest potential shifts in growth dynamics and reproductive patterns, while also shedding light on the broader ecological and evolutionary implications of resource allocation strategies in plant reproduction under the global environmental changes.
4.3 Interactive effects of elevated CO2 and rhizome direction on A. contorta
All morphological differences were influenced by either CO2 concentrations or the direction of the rhizomes (Table 3). A direct influence of CO2 concentration on the number of shoots was observed, indicating that the production of new shoots from the rhizome system was stimulated by elevated CO2 concentration. This finding aligns with previous research highlighting the impact of elevated CO2 on increased asexual reproduction (Ziska et al., 2004; McPeek and Wang, 2007).
Rhizome direction also has emerged as a key determinant influencing various aspects of plant morphology, particularly stem thickness and the weight of dry leaves (Table 3). This suggests that the rhizome direction plays a pivotal role in shaping the structural characteristics of the aboveground parts of the plant, potentially by affecting water, nutrient uptake and resource allocation (Silva et al., 2019). In situations where environmental conditions undergo rapid and unpredictable changes, the adaptability conferred by horizontal rhizomes becomes particularly advantageous (Berntson and Woodward, 1992). They are well-suited for scenarios where securing water resources swiftly is crucial, especially in arid regions. The distribution of rhizomes is recognized as critical for a plant’s ability to acquire essential water and nutrients (Miao et al., 1992).
In contrast, vertical rhizomes, which had more flowers than horizontal rhizome (Figure 7), can contribute to genetic stability and the promotion of evolutionary processes by facilitating the reliable transfer of genetic information from one generation to the next (Kobayashi, 2019). This is achieved through sexual reproduction, making them potentially more suited for stable and consistent environments (Liu et al., 2021). In the context of evolution, the adaptability of rhizome direction becomes a crucial factor (Berntson and Woodward, 1992). The documented enhancements in reproductive success associated with rhizome systems further support the idea that belowground factors play a significant role in influencing aboveground reproductive traits.
The influence of hormonal signaling pathways, such as auxin in the case of vertical rhizomes (Scott, 1972), in regulating growth responses to environmental cues further underscores the complex interplay between rhizome direction and environmental adaptability. Conversely, horizontal rhizomes may obstruct hormonal movement, leading to suboptimal growth conditions (Mellor et al., 2020). Therefore, under the same CO2 concentration, horizontal rhizomes had a more detrimental effect on growth and development than vertical rhizomes.
The most remarkable outcomes stemmed from the interaction between CO2 concentrations and rhizome directions (Table 3). This interaction led to substantial variations in a range of morphological and reproductive traits, such as branch number, total branch length, single leaf area, and total leaf area (Figure 11, Table 3). These changes signify an impact in the plant’s growth and structural characteristics when these factors are considered simultaneously. Furthermore, the interaction of CO2 concentrations and rhizome direction significantly influenced sexual reproductive traits (Table 3; the number of flowers, flower longevity, perianth size, diameter of utricle, pollen grain size, stigmatic receptivity, and pollen viability). These changes in reproductive traits have important implications for the plant’s overall reproductive success, suggesting that environmental variations can have far-reaching effects on its life cycle and ecological role. Therefore, our findings emphasize the intricate nature of plant responses to changes in CO2 concentrations and rhizome directions, providing valuable insights into the adaptability of A. contorta. Moreover, understanding the ecological implications of these responses is crucial, especially in the context of ongoing global environmental changes.
4.4 Limitations and challenges
Our research provides valuable insights into how environmental factors affect A. contorta’s growth and reproduction, yet it’s conducted in controlled settings that may not fully reflect natural ecosystem complexities. The study’s duration may also fall short of capturing A. contorta’s long-term adaptations to increased CO2, indicating the necessity for longer observation in future research. The variability in plant responses to elevated CO2 across different species, genotypes, and individuals highlights the challenge of generalizing findings and necessitates a broader spectrum of studies. Interactions with other environmental factors such as temperature, water availability, and nutrient levels further complicate the isolation of CO2 effects. Additionally, the detailed physiological and molecular mechanisms underlying CO2’s influence on plant growth remain partially understood, emphasizing the need for advanced, interdisciplinary approaches to unravel these complexities.
5 Conclusion
Our study provided a comprehensive understanding of the various factors that influence the probability of flowering in mature A. contorta (Figure 12). The research encompassed field surveys and greenhouse treatments, revealing the intricate interplay of environmental and physiological elements in shaping plant reproductive patterns. Field surveys have underscored the pivotal roles of light intensity, soil water content, and rhizome direction in influencing growth and flowering. Greenhouse experiments have revealed the interactive effects of CO2 concentration and rhizome conditions on flowering. CO2 concentration and rhizome direction also influenced growth traits, emphasizing the significance of substantial vegetative growth for successful flowering. Additionally, elevated CO2 concentrations exhibited diverse negative effects on the mature A. contorta’s reproductive traits, impacting flower size, longevity, stigma receptivity, and pollen viability, showing the complex interplay between environmental conditions and reproductive outcomes. Remarkably, our findings highlighted how environmental factors can inhibit growth and, in turn, hinder the sexual reproduction of mature A. contorta. Moreover, it triggers a shift towards increased asexual reproduction at elevated CO2 concentrations, potentially leading to reduced genetic diversity. These findings provide valuable insights into the adaptability and resource allocation strategies of mature A. contorta in response to ever-changing environmental cues. Moreover, our study sheds light on the broader ecological and evolutionary implications of these interactions, emphasizing the crucial role of environmental influences in shaping the reproductive patterns of mature A. contorta.
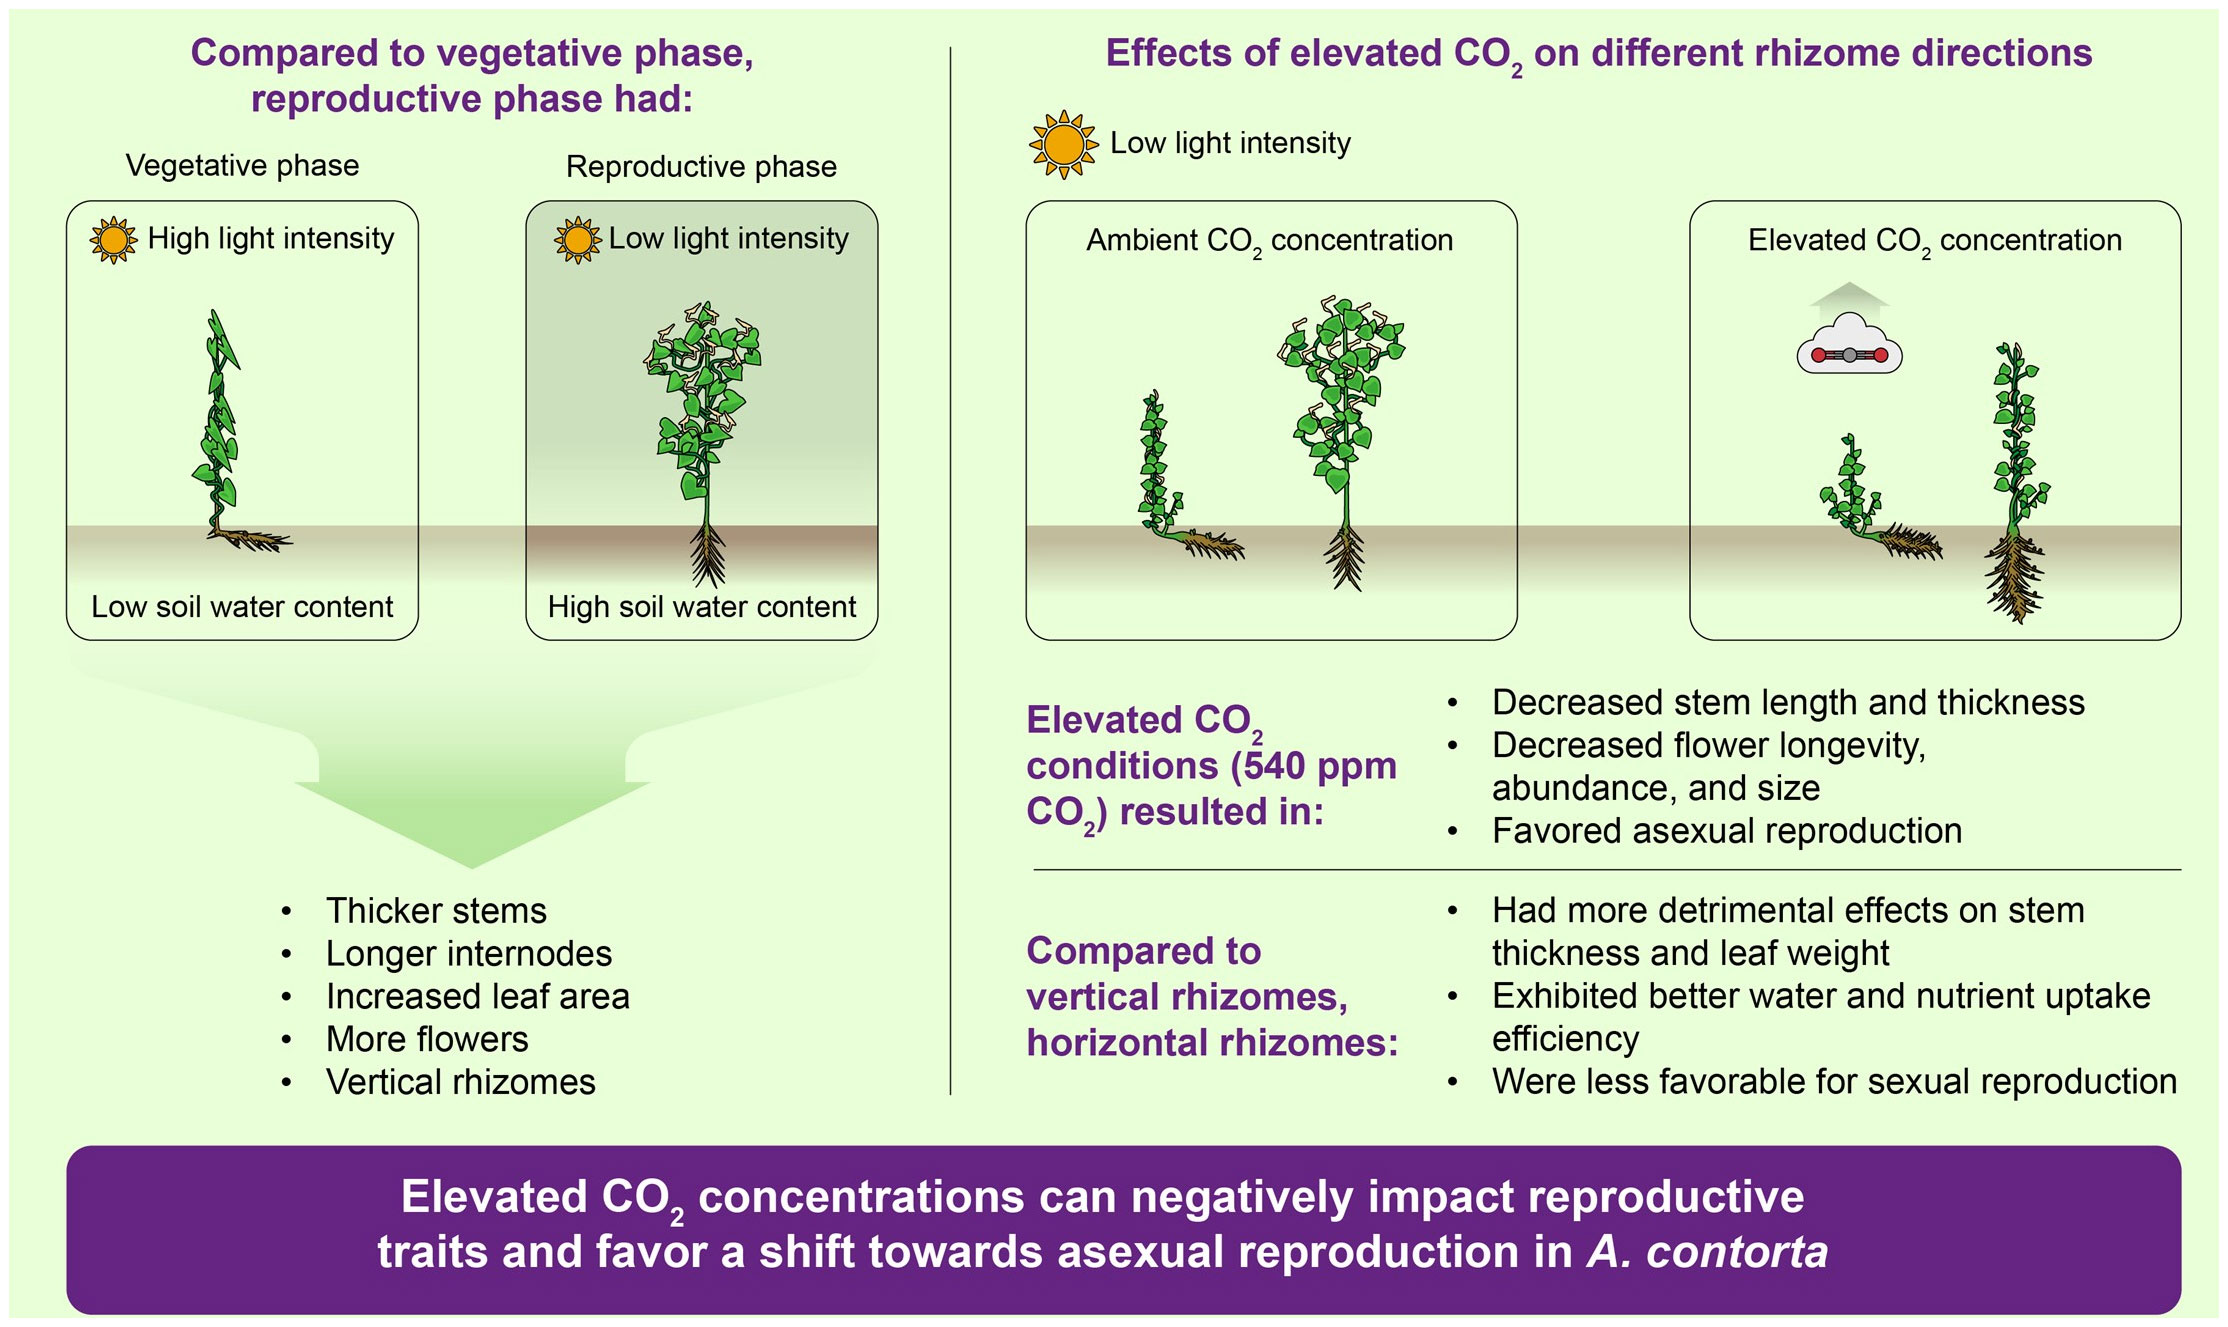
Figure 12 Comprehensive understanding of various factors that influence the asexual and sexual reproductions in mature A. contorta.
Data availability statement
The original contributions presented in the study are included in the article/supplementary material. Further inquiries can be directed to the corresponding author.
Author contributions
S-HP: Conceptualization, Data curation, Formal analysis, Investigation, Methodology, Visualization, Writing – original draft. JK: Conceptualization, Funding acquisition, Methodology, Project administration, Supervision, Writing – review & editing.
Funding
The author(s) declare financial support was received for the research, authorship, and/or publication of this article. This work was supported by Basic Science Research Program through the National Research Foundation of Korea (NRF) funded by the Ministry of Education (NRF-2021R1I1A2041895) and by Korea Environment Industry & Technology Institute (KEITI) through ‘Wetland Ecosystem Value Evaluation and Carbon Absorption Value Promotion Technology Development Project’, funded by Korea Ministry of Environment (MOE)(RS-2022-KE002025).
Conflict of interest
The authors declare that the research was conducted in the absence of any commercial or financial relationships that could be construed as a potential conflict of interest.
The author(s) declared that they were an editorial board member of Frontiers, at the time of submission. This had no impact on the peer review process and the final decision.
Publisher’s note
All claims expressed in this article are solely those of the authors and do not necessarily represent those of their affiliated organizations, or those of the publisher, the editors and the reviewers. Any product that may be evaluated in this article, or claim that may be made by its manufacturer, is not guaranteed or endorsed by the publisher.
References
Araki, T. (2001). Transition from vegetative to reproductive phase. Curr. Opin. Plant Biol. 4, 63–68. doi: 10.1016/S1369-5266(00)00137-0
Arrizabalaga-Arriazu, M., Gomès, E., Morales, F., Irigoyen, J. J., Pascual, I., Hilbert, G. (2020). High temperature and elevated carbon dioxide modify berry composition of different clones of grapevine (Vitis vinifera L.) cv. Tempranillo. Front. Plant Sci. 11, 603687. doi: 10.3389/fpls.2020.603687
Bassi, R., Dall'Osto, L. (2021). Dissipation of light energy absorbed in excess: the molecular mechanisms. Annu. Rev. Plant Biol. 72, 47–76. doi: 10.1146/annurev-arplant-071720-015522
Berntson, G. M., Woodward, F. I. (1992). The root system architecture and development of Senecio vulgaris in elevated CO2 and drought. Funct. Ecol. 6, 324–333. doi: 10.2307/2389524
Bokshi, A. I., Tan, D. K., Thistlethwaite, R. J., Trethowan, R., Kunz, K. (2021). Impact of elevated CO2 and heat stress on wheat pollen viability and grain production. Funct. Plant Biol. 48, 503–514. doi: 10.1071/FP20187
Boyle, W. A., Bronstein, J. L. (2012). Phenology of tropical understory trees: patterns and correlates. Rev. Biología Trop. 60, 1415–1430. doi: 10.15517/rbt.v60i4.2050
Broughton, K. J., Smith, R. A., Duursma, R. A., Tan, D. K., Payton, P., Bange, M. P., et al. (2016). Warming alters the positive impact of elevated CO2 concentration on cotton growth and physiology during soil water deficit. Funct. Plant Biol. 44, 267–278. doi: 10.1071/FP16189
CaraDonna, P. J., Iler, A. M., Inouye, D. W. (2014). Shifts in flowering phenology reshape a subalpine plant community. Proc. Natl. Acad. Sci. 111, 4916–4921. doi: 10.1073/pnas.1323073111
Chaudhry, S., Sidhu, G. P. S. (2022). Climate change regulated abiotic stress mechanisms in plants: A comprehensive review. Plant Cell Rep. 41, 1–31. doi: 10.1007/s00299-021-02759-5
Chauhan, Y. S., Ryan, M., Chandra, S., Sadras, V. O. (2019). Accounting for soil moisture improves prediction of flowering time in chickpea and wheat. Sci. Rep. 9, 7510. doi: 10.1038/s41598-019-43848-6
Chavan, S. G., Duursma, R. A., Tausz, M., Ghannoum, O. (2019). Elevated CO2 alleviates the negative impact of heat stress on wheat physiology but not on grain yield. J. Exp. Bot. 70, 6447–6459. doi: 10.1093/jxb/erz386
Cheung, T. P., Xue, C., Leung, K., Chan, K., Li, C. G. (2006). Aristolochic acids detected in some raw Chinese medicinal herbs and manufactured herbal products–a consequence of inappropriate nomenclature and imprecise labelling? Clin. Toxicol. 44, 371–378. doi: 10.1080/15563650600671712
Choi, D., Watanabe, Y., Guy, R. D., Sugai, T., Toda, H., Koike, T. (2017). Photosynthetic characteristics and nitrogen allocation in the black locust (Robinia pseudoacacia L.) grown in a FACE system. Acta Physiologiae Plantarum 39, 1–12. doi: 10.1007/s11738-017-2366-0
Chtouki, M., Laaziz, F., Naciri, R., Garré, S., Nguyen, F., Oukarroum, A. (2022). Interactive effect of soil moisture content and phosphorus fertilizer form on chickpea growth, photosynthesis, and nutrient uptake. Sci. Rep. 12, 6671. doi: 10.1038/s41598-022-10703-0
Chuine, I. (2010). Why does phenology drive species distribution? Philos. Trans. R. Soc. B: Biol. Sci. 365, 3149–3160. doi: 10.1098/rstb.2010.0142
Cleland, E. E., Chuine, I., Menzel, A., Mooney, H. A., Schwartz, M. D. (2007). Shifting plant phenology in response to global change. Trends Ecol. Evol. 22, 357–365. doi: 10.1016/j.tree.2007.04.003
Cortés-Flores, J., Hernández-Esquivel, K. B., González-Rodríguez, A., Ibarra-Manríquez, G. (2017). Flowering phenology, growth forms, and pollination syndromes in tropical dry forest species: Influence of phylogeny and abiotic factors. Am. J. Bot. 104, 39–49. doi: 10.3732/ajb.1600305
Dafni, A., Maués, M. M. (1998). A rapid and simple procedure to determine stigma receptivity. Sexual Plant Reproduction. 11, 177–180. doi: 10.1007/s004970050138
Davies, T. J., Wolkovich, E. M., Kraft, N. J., Salamin, N., Allen, J. M., Ault, T. R., et al. (2013). Phylogenetic conservatism in plant phenology. J. Ecol. 101, 1520–1530. doi: 10.1111/1365-2745.12154
Elzinga, J. A., Atlan, A., Biere, A., Gigord, L., Weis, A. E., Bernasconi, G. (2007). Time after time: flowering phenology and biotic interactions. Trends Ecol. Evol. 22, 432–439. doi: 10.1016/j.tree.2007.05.006
Fathi, A. (2022). Role of nitrogen (N) in plant growth, photosynthesis pigments, and N use efficiency: A. review. Agrisost 28, 1–8. doi: 10.5281/zenodo.7143588
Faust, M. N., Iler, A. M. (2022). Pollinator-mediated reproductive consequences of altered co-flowering under climate change conditions depend on abiotic context. Climate Change Ecol. 3, 100043. doi: 10.1016/j.ecochg.2021.100043
Georgieva, I. D., Kruleva, M. M. (1993). Cytochemical investigation of long-term stored maize pollen. Euphytica 72, 87–94. doi: 10.1007/BF00023776
Hartmann, H., Bahn, M., Carbone, M., Richardson, A. D. (2020). Plant carbon allocation in a changing world–challenges and progress: introduction to a Virtual Issue on carbon allocation. New Phytol. 227, 981–988. doi: 10.1111/nph.16757
Hashimoto, K., Higuchi, M., Makino, B., Sakakibara, I., Kubo, M., Komatsu, Y., et al. (1999). Quantitative analysis of aristolochic acids, toxic compounds, contained in some medicinal plants. J. Ethnopharmacology 64, 185–189. doi: 10.1016/S0378-8741(98)00123-8
Heinrich, M., Chan, J., Wanke, S., Neinhuis, C., Simmonds, M. S. (2009). Local uses of Aristolochia species and content of nephrotoxic aristolochic acid 1 and 2—A global assessment based on bibliographic sources. J. Ethnopharmacology 125, 108–144. doi: 10.1016/j.jep.2009.05.028
Huang, J., Zhao, X., Chory, J. (2019). The Arabidopsis transcriptome responds specifically and dynamically to high light stress. Cell Rep. 29, 4186–4199. doi: 10.1016/j.celrep.2019.11.051
Huang, W., Ding, Y., Wang, S., Song, C., Wang, F. (2022). Growth and development responses of the rhizome-root system in Pleioblastus pygmaeus to light intensity. Plants 11, 2204. doi: 10.3390/plants11172204
Huijser, P., Schmid, M. (2011). The control of developmental phase transitions in plants. Development 138, 4117–4129. doi: 10.1242/dev.063511
Inouye, D. W. (2020). Effects of climate change on alpine plants and their pollinators. Ann. New York Acad. Sci. 1469, 26–37. doi: 10.1111/nyas.14104
Jablonski, L. M., Wang, X., Curtis, P. S. (2002). Plant reproduction under elevated CO2 conditions: a meta-analysis of reports on 79 crop and wild species. New Phytol. 156, 9–26. doi: 10.1046/j.1469-8137.2002.00494.x
John, B. (2004). A comparison of two methods for estimating the organic matter content of sediments. J. Paleolimnology 31, 125–127. doi: 10.1023/B:JOPL.0000013354.67645.df
Jomo, M. O., Netondo, G. W., Musyim, D. M. (2015). Growth changes of seven Amaranthus (spp) during the vegetative and reproductive stages of development as influenced by variations in soil water deficit. Intl. J. Res. Innov. Earth. Sci. 2(6), 2394–1375. Available at: https://repository.maseno.ac.ke/handle/123456789/331.
Kamphake, L. J., Hannah, S. A., Cohen, J. M. (1967). Automated analysis for nitrate by hydrazine reduction. Water Res. 1, 205–216. doi: 10.1016/0043-1354(67)90011-5
Karlova, R., Boer, D., Hayes, S., Testerink, C. (2021). Root plasticity under abiotic stress. Plant Physiol. 187, 1057–1070. doi: 10.1093/plphys/kiab392
Kim, J. G., Park, J. H., Choi, B. J., Sim, J. H., Kwon, G. J., Lee, B. A., et al. (2004). Method in ecology (Seoul (in Korean: Bomoondang).
Kobayashi, K. (2019). Sexual reproduction and diversity: Connection between sexual selection and biological communities via population dynamics. Population Ecol. 61, 135–140. doi: 10.1002/1438-390X.1029
König, C., Weigelt, P., Kreft, H. (2017). Dissecting global turnover in vascular plants. Global Ecol. Biogeography 26, 228–242. doi: 10.1111/geb.12536
Korea Meteorological Administration (2023) Open MET Data Portal. Available online at: https://data.kma.go.kr/.
Körner, C. (2015). Paradigm shift in plant growth control. Curr. Opin. Plant Biol. 25, 107–114. doi: 10.1016/j.pbi.2015.05.003
Kumar, L., Jayasinghe, S., Gopalakrishnan, T., Nunn, P. D. (2020). Climate change and the pacific islands. In: Kumar, L. (eds) Climate Change and Impacts in the Pacific, 1–31. (Cham, Switzerland: Springer Climate. Springer). doi: 10.1007/978-3-030-32878-8_1
Lee, S. P. (2012). Red Data Book of Endangered Insects in Korea Ⅰ Vol. 7) (Seoul: Nature & Ecology).
Lee, K. S., Cho, D. S. (2000). Relationships between the spatial distribution of vegetation and microenviromnent in a temperate hardwood forest in Mt. Jrnbong biosphere reserve area, Korea. Korean J. Ecol. 23, 241–253.
Liu, M., Korpelainen, H., Li, C. (2021). Sexual differences and sex ratios of dioecious plants under stressful environments. J. Plant Ecol. 14, 920–933. doi: 10.1093/jpe/rtab038
López-Cubillos, S., Hughes, L. (2016). Effects of elevated carbon dioxide (CO2) on flowering traits of three horticultural plant species. Aust. J. Crop Sci. 10, 1523–1528. doi: 10.21475/ajcs
Maai, E., Nishimura, K., Takisawa, R., Nakazaki, T. (2020). Light stress-induced chloroplast movement and midday depression of photosynthesis in sorghum leaves. Plant Production Sci. 23, 172–181. doi: 10.1080/1343943X.2019.1673666
Martins, A. E., Camargo, M. G. G., Morellato, L. P. C. (2021). Flowering phenology and the influence of seasonality in flower conspicuousness for bees. Front. Plant Sci. 11, 594538. doi: 10.3389/fpls.2020.594538
McPeek, T. M., Wang, X. (2007). Reproduction of dandelion (Taraxacum officinale) in a higher CO2 environment. Weed Sci. 55, 334–340. doi: 10.1614/WS-07-021
Mellor, N. L., Voß, U., Janes, G., Bennett, M. J., Wells, D. M., Band, L. R. (2020). Auxin fluxes through plasmodesmata modify root-tip auxin distribution. Development 147, dev181669. doi: 10.1242/dev.181669
Miao, S. L., Wayne, P. M., Bazzaz, F. A. (1992). Elevated CO 2 differentially alters the responses of cooccurring birch and maple seedlings to a moisture gradient. Oecologia 90, 300–304. doi: 10.1007/BF00317191
Murphy, J. A. M. E. S., Riley, J. P. (1962). A modified single solution method for the determination of phosphate in natural waters. Analytica Chimica Acta 27, 31–36. doi: 10.1016/S0003-2670(00)88444-5
Nakonechnaya, O. V., Gorpenchenko, T. Y., Voronkova, N. M., Kholina, A. B., Zhuravlev, Y. N. (2013). Embryo structure, seed traits, and productivity of relict vine Aristolochia contorta (Aristolochiaceae). Flora 208, 293–297. doi: 10.1016/j.flora.2013.03.010
Nakonechnaya, O. V., Kholina, A. B., Koren, O. G., Zhuravlev, Y. N. (2012). Genetic diversity of a rare species Aristolochia contorta Bunge (Aristolochiaceae) in Primorsky Krai. Russian J. Genet. 48, 152–162. doi: 10.1134/S1022795411120088
Nam, B. E., Park, H. J., Son, G. Y., Kim, J. G. (2020). An analysis of the genetic diversity of a riparian marginal species. Aristolochia contorta. J. Wetlands Res. 22, 100–105. doi: 10.17663/JWR.2020.22.2.100
Nieves-Cordones, M., Ródenas, R., Lara, A., Martínez, V., Rubio, F. (2019). The combination of K+ deficiency with other environmental stresses: what is the outcome? Physiologia Plantarum 165, 264–276. doi: 10.1111/ppl.12827
Pareek, A., Dhankher, O. P., Foyer, C. H. (2020). Mitigating the impact of climate change on plant productivity and ecosystem sustainability. J. Exp. Bot. 71, 451–456. doi: 10.1093/jxb/erz518
Park, S. H., Kim, J. G. (2023). Mechanistic understanding of perianth traits hindering pollination in Aristolochia contorta Bunge. Front. Plant Sci. 14, 1226331. doi: 10.3389/fpls.2023.1226331
Park, S. H., Kim, J. H., Kim, J. G. (2023). Effects of human activities on Sericinus montela and its host plant Aristolochia contorta. Sci. Rep. 13, 8289. doi: 10.1038/s41598-023-35607-5
Park, S. H., Nam, B. E., Kim, J. G. (2019). Shade and physical support are necessary for conserving the Aristolochia contorta population. Ecol. Eng. 135, 108–115. doi: 10.1016/j.ecoleng.2019.05.019
Park, H. J., Nam, B. E., Lee, G., Kim, S. G., Joo, Y., Kim, J. G. (2022). Ontogeny-dependent effects of elevated CO2 and watering frequency on interaction between Aristolochia contorta and its herbivores. Sci. Total Environ. 838, 156065. doi: 10.1016/j.scitotenv.2022.156065
Park, H. J., Nam, B. E., Moon, S. Y., Kim, S. G., Joo, Y., Kim, J. G. (2021). Reduced host plant growth and increased tyrosine-derived secondary metabolites under climate change and negative consequences on its specialist herbivore. Sci. Total Environ. 759, 143507. doi: 10.1016/j.scitotenv.2020.143507
Pesendorfer, M. B., Ascoli, D., Bogdziewicz, M., Hacket-Pain, A., Pearse, I. S., Vacchiano, G. (2021). The ecology and evolution of synchronized reproduction in long-lived plants. Philos. Trans. R. Soc. B 376, 20200369. doi: 10.1098/rstb.2020.0369
Pestana, M., Beja, P., Correia, P. J., De Varennes, A., Faria, E. A. (2005). Relationships between nutrient composition of flowers and fruit quality in orange trees grown in calcareous soil. Tree Physiol. 25, 761–767. doi: 10.1093/treephys/25.6.761
Piao, S., Liu, Q., Chen, A., Janssens, I. A., Fu, Y., Dai, J., et al. (2019). Plant phenology and global climate change: Current progresses and challenges. Global Change Biol. 25, 1922–1940. doi: 10.1111/gcb.14619
Poethig, R. S. (2003). Phase change and the regulation of developmental timing in plants. Science 301, 334–336. doi: 10.1126/science.1085328
Poorter, H., Perez-Soba, M. (2002). Plant growth at elevated CO2. Encyclopedia Global Environ. Change 2, 489–496.
Prasad, P. V., Boote, K. J., Allen, L. H., Jr. (2006). Adverse high temperature effects on pollen viability, seed-set, seed yield and harvest index of grain-sorghum [Sorghum bicolor (L.) Moench] are more severe at elevated carbon dioxide due to higher tissue temperatures. Agric. For. Meteorology 139, 237–251. doi: 10.1016/j.agrformet.2006.07.003
Prior, S. A., Runion, G. B., Marble, S. C., Rogers, H. H., Gilliam, C. H., Torbert, H. A. (2011). A review of elevated atmospheric CO2 effects on plant growth and water relations: implications for horticulture. HortScience 46, 158–162. doi: 10.21273/HORTSCI.46.2.158
Qin, H., Jiao, L., Li, F., Zhou, Y. (2022). Ecological adaptation strategies of the clonal plant Phragmites australis at the Dunhuang Yangguan wetland in the arid zone of northwest China. Ecol. Indic. 141, 109109. doi: 10.1016/j.ecolind.2022.109109
Rafferty, N. E., Diez, J. M., Bertelsen, C. D. (2020). Changing climate drives divergent and nonlinear shifts in flowering phenology across elevations. Curr. Biol. 30, 432–441. doi: 10.1016/j.cub.2019.11.071
Raza, A., Ashraf, F., Zou, X., Zhang, X., Tosif, H. (2020). Plant adaptation and tolerance to environmental stresses: mechanisms and perspectives. In: Hasanuzzaman, M. (eds) Plant Ecophysiology and Adaptation under Climate Change: Mechanisms and Perspectives I: General Consequences and Plant Responses (Singapore: Springer), 117–145. doi: 10.1007/978-981-15-2156-0_5
Rodriguez, I. R., Miller, G. L. (2000). Using a chlorophyll meter to determine the chlorophyll concentration, nitrogen concentration, and visual quality of St. Augustinegrass. HortScience 35, 751–754. doi: 10.21273/HORTSCI.35.4.751
Roeber, V. M., Bajaj, I., Rohde, M., Schmülling, T., Cortleven, A. (2021). Light acts as a stressor and influences abiotic and biotic stress responses in plants. Plant Cell Environ. 44, 645–664. doi: 10.1111/pce.13948
Rosbakh, S., Hartig, F., Sandanov, D. V., Bukharova, E. V., Miller, T. K., Primack, R. B. (2021). Siberian plants shift their phenology in response to climate change. Global Change Biol. 27, 4435–4448. doi: 10.1111/gcb.15744
Rusterholz, H. P., Erhardt, A. (1998). Effects of elevated CO 2 on flowering phenology and nectar production of nectar plants important for butterflies of calcareous grasslands. Oecologia 113, 341–349. doi: 10.1007/s004420050385
Schneider, C. A., Rasband, W. S., Eliceiri, K. W. (2012). NIH Image to ImageJ: 25 years of image analysis. Nat. Methods 9, 671–675. doi: 10.1038/nmeth.2089
Schwartz, M. D. (Ed.) (2003). Phenology: An Integrative Environmental Science Vol. 132 (Dordrecht: Kluwer Academic Publishers).
Scott, T. K. (1972). Auxins and roots. Annu. Rev. Plant Physiol. 23, 235–258. doi: 10.1146/annurev.pp.23.060172.001315
Serrano, I., Olmedilla, A. (2012). Histochemical location of key enzyme activities involved in receptivity and self-incompatibility in the olive tree (Olea europaea L.). Plant Sci. 197, 40–49. doi: 10.1016/j.plantsci.2012.07.007
Shen, M., Wang, S., Jiang, N., Sun, J., Cao, R., Ling, X., et al. (2022). Plant phenology changes and drivers on the Qinghai–Tibetan Plateau. Nat. Rev. Earth Environ. 3, 633–651. doi: 10.1038/s43017-022-00317-5
Silva, J. L. S. E., Cruz-Neto, O., Peres, C. A., Tabarelli, M., Lopes, A. V. (2019). Climate change will reduce suitable Caatinga dry forest habitat for endemic plants with disproportionate impacts on specialized reproductive strategies. PLoS One 14, e0217028. doi: 10.1371/journal.pone.0217028
Sola, A. J., Ehrlen, J. (2007). Vegetative phenology constrains the onset of flowering in the perennial herb Lathyrus vernus. J. Ecol. 95, 208–216. doi: 10.1111/j.1365-2745.2006.01191.x
Solorzano, L. (1969). Determination of ammonia in natural waters by the phenolhypochlorite method 1 1 This research was fully supported by US Atomic Energy Commission Contract No. ATS (11-1) GEN 10, PA 20. Limnology Oceanography 14, 799–801. doi: 10.4319/lo.1969.14.5.0799
Sun, S., Frelich, L. E. (2011). Flowering phenology and height growth pattern are associated with maximum plant height, relative growth rate and stem tissue mass density in herbaceous grassland species. J. Ecol. 99, 991–1000. doi: 10.1111/jec.2011.99.issue-4
Tandon, R., Shivanna, K. R., Koul, M. (Eds.) (2020). Reproductive Ecology of Flowering Plants: patterns and processes. (Berlin/Heidelberg, Germany: Springer). doi: 10.1007/978-981-15-4210-7
Thomson, A. M., Calvin, K. V., Smith, S. J., Kyle, G. P., Volke, A., Patel, P., et al. (2011). RCP4. 5: a pathway for stabilization of radiative forcing by 2100. Climatic Change 109, 77–94. doi: 10.1007/s10584-011-0151-4
Thruppoyil, S. B., Ksiksi, T. (2020). Time-dependent stomatal conductance and growth responses of Tabernaemontana divaricata to short-term elevated CO2 and water stress at higher than optimal growing temperature. Curr. Plant Biol. 22, 100127. doi: 10.1016/j.cpb.2019.100127
Uchida, R. (2000). Essential nutrients for plant growth: nutrient functions and deficiency symptoms. Plant Nutrient Manage. Hawaii’s Soils 4, 31–55.
Wang, D., Heckathorn, S. A., Wang, X., Philpott, S. M. (2012). A meta-analysis of plant physiological and growth responses to temperature and elevated CO 2. Oecologia 169, 1–13. doi: 10.1007/s00442-011-2172-0
Wang, J. W., Park, M. Y., Wang, L. J., Koo, Y., Chen, X. Y., Weigel, D., et al. (2011). miRNA control of vegetative phase change in trees. PLoS Genet. 7, e1002012. doi: 10.1371/journal.pgen.1002012
Wang, Y., Wu, W. H. (2013). Potassium transport and signaling in higher plants. Annu. Rev. Plant Biol. 64, 451–476. doi: 10.1146/annurev-arplant-050312-120153
Wimalasekera, R. (2019). Effect of light intensity on photosynthesis. In: :Ahmad, P., Ahanger, M. A., Alyemeni, M. N., Alam, P. (eds) Photosynthesis, Productivity and Environmental Stress (Hoboken, New Jersey: Wiley), 65–73.
Yasumura, Y. (2009). The effect of altered sink-source relations on photosynthetic traits and matter transport during the phase of reproductive growth in the annual herb Chenopodium album. Photosynthetica 47, 263–270. doi: 10.1007/s11099-009-0041-4
Ye, T., Li, Y., Zhang, J., Hou, W., Zhou, W., Lu, J., et al. (2019). Nitrogen, phosphorus, and potassium fertilization affects the flowering time of rice (Oryza sativa L.). Global Ecol. Conserv. 20, e00753. doi: 10.1016/j.gecco.2019.e00753
Yu, Y. L., Wang, H. C., Yu, Z. X., Schinnerl, J., Tang, R., Geng, Y. P., et al. (2021). Genetic diversity and structure of the endemic and endangered species Aristolochia delavayi growing along the Jinsha River. Plant Diversity 43, 225–233. doi: 10.1016/j.pld.2020.12.007
Zainul, A., Koyro, H. W., Huchzermeyer, B., Bilquees, G., Khan, M. A. (2020). Impact of a biochar or a biochar-compost mixture on water relation, nutrient uptake and photosynthesis of Phragmites karka. Pedosphere 30, 466–477. doi: 10.1016/S1002-0160(17)60362-X
Zhang, S., Liu, Y., Du, M., Shou, G., Wang, Z., Xu, G. (2022). Nitrogen as a regulator for flowering time in plant. Plant Soil 480, 1–29. doi: 10.1007/s11104-022-05608-w
Zhang, X. C., Yu, X. F., Ma, Y. F. (2013). Effect of nitrogen application and elevated CO2 on photosynthetic gas exchange and electron transport in wheat leaves. Photosynthetica 51, 593–602. doi: 10.1007/s11099-013-0059-5
Zheng, Y., Li, F., Hao, L., Yu, J., Guo, L., Zhou, H., et al. (2019). Elevated CO2 concentration induces photosynthetic down-regulation with changes in leaf structure, non-structural carbohydrates and nitrogen content of soybean. BMC Plant Biol. 19, 1–18. doi: 10.1186/s12870-018-1600-2
Keywords: climate change, CO2 concentration, growth inhibition, phenology, reproduction, rhizome direction
Citation: Park S-H and Kim JG (2024) The reduced growth due to elevated CO2 concentration hinders the sexual reproduction of mature Northern pipevine (Aristolochia contorta Bunge). Front. Plant Sci. 15:1359783. doi: 10.3389/fpls.2024.1359783
Received: 22 December 2023; Accepted: 04 March 2024;
Published: 20 March 2024.
Edited by:
Huanjiong Wang, Institute of Geographic Sciences and Natural Resources Research (CAS), ChinaReviewed by:
Yachen Liu, Xi’an University, ChinaXiangjin Shen, Chinese Academy of Sciences (CAS), China
Copyright © 2024 Park and Kim. This is an open-access article distributed under the terms of the Creative Commons Attribution License (CC BY). The use, distribution or reproduction in other forums is permitted, provided the original author(s) and the copyright owner(s) are credited and that the original publication in this journal is cited, in accordance with accepted academic practice. No use, distribution or reproduction is permitted which does not comply with these terms.
*Correspondence: Jae Geun Kim, jaegkim@snu.ac.kr
†ORCID: Si-Hyun Park, orcid.org/0000-0002-4342-8408
Jae Geun Kim, orcid.org/0000-0002-9181-8830