-
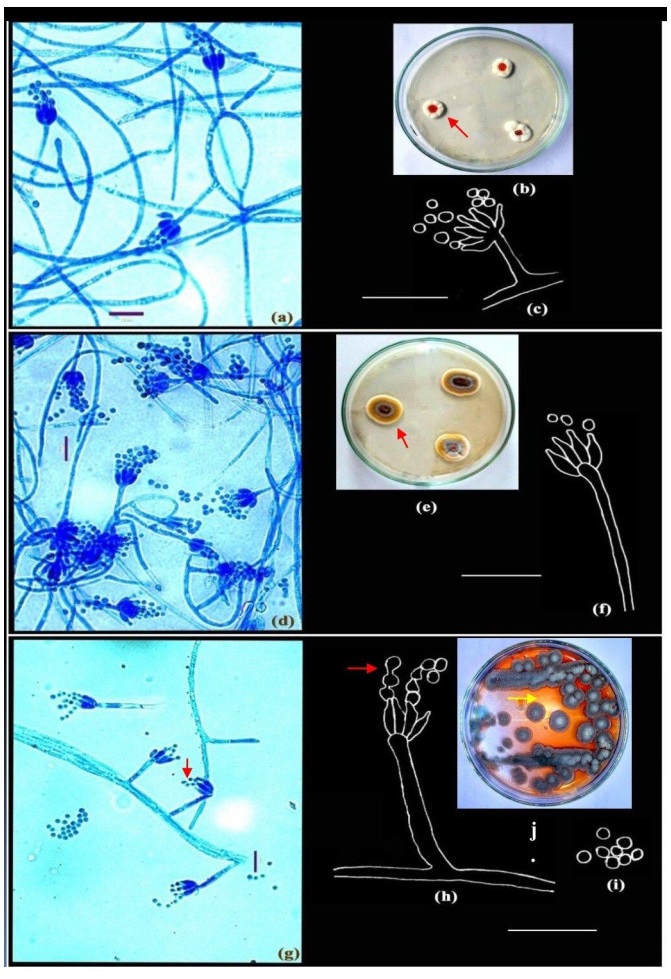
Figure 1. a-c Penicillium roseopurpureum Dierckx. d-f Penicillium sclerotiorum Beyma. g-j Penicillium vinaceum Gilman & Abbott. Colonies growing on CYA (b, e, j); Microphotographs (a, d, g); Camera lucida drawings (c, f, h-i). Scale bars: a, d, g = 10µm, c, f, h-i = 14µm.
-
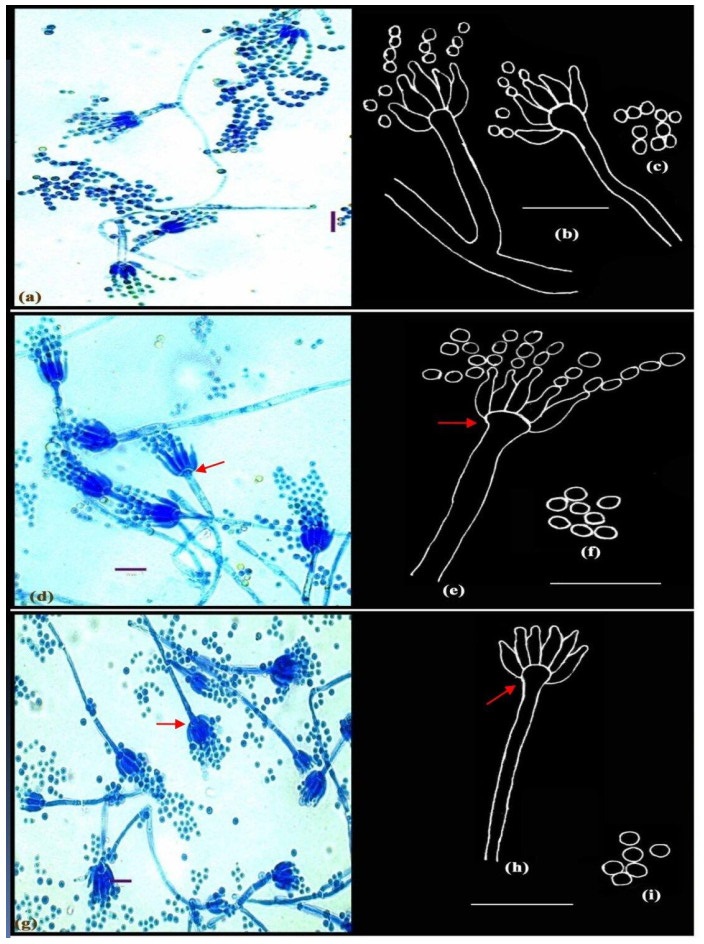
Figure 2. a-c Penicillium adametzii Zaleski. d-f Penicillium bilaiae Chalabuda. g-i Penicillium implicatum McLennan & Ducker; Microphotographs (a, d, g); Camera lucida drawings (b-c, e-f, h-i). Scale bars: a, d, g = 10µm, b-c, e-f, h-i = 14µm.
-
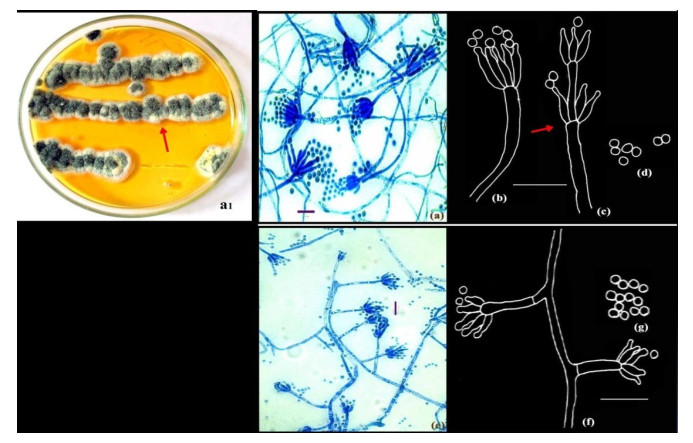
Figure 3. a1-d Penicillium resedanum McLennan & Ducker. Colonies growing on CYA (a1). e-f Penicillium restrictum Gilman and Abbott.); Microphotographs (a, e); Camera lucida drawings (b-d, f-g). Scale bars: a, e = 10µm, b-d, f-g = 14µm.
-
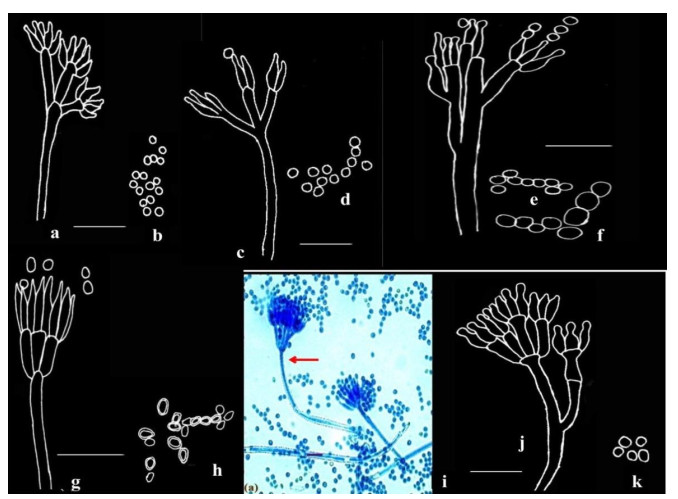
Figure 4. a-b Penicillium citrinum Thom. c-d Penicillium miczynskii Zaleski. e-f Penicillium italicum Wehmer. g-h Penicillium herquei Bainer & Sartory. I-k Penicillium verrucosum Dierckx; Microphotograph (i); Camera lucida drawings (a-h, j-k). Scale bars: a-h, j-k = 14µm, i = 10µm.
-
$\mathrm{CF}(\%)=\frac{\text { Number } \quad \text { of soil samples colonized by a specific fungus }}{\text { Total number of samples studied }} \mathrm{x} 100$ A/F ratio = Abundance/Colonization frequency Where: abundance = $\frac{{{\rm{\; number\; of\; colonies\; of\; a\; specific\; fungus}}}}{{{\rm{Number\; of\; soil\; samples\; colonized\; by\; a\; specific fungus}}}}$ A/F ratios describe the distribution pattern of each fungal species into one of the following three categories: A/F ratio of < 0.025 depicts that the fungal species has regular distribution A/F ratio between 0.025 - 0.05 depicts that fungal species has random distribution A/F ratio of > 0.05 depicts that the fungal species has contagious distribution $\mathrm{c} \mathrm{FU} / \mathrm{g}=\mathrm{a} \times \mathrm{d} / \mathrm{s}$ Where: a = average number of colonies on the petriplate; d = dilution factor (10, 000), s = dry weight of the soil sample Table 1. Formulae used
-
Penicilliumspecies Type of penicilli Number of soil samples analysed = 25 Number of samples recovered detected positive CF (%) Abundance A/F ratio cfu/g Penicillium adametzi Monoverticillate 14 56 1.14 0.020 1.6 × 10³ P. bilaiae Monoverticillate 4 16 1.50 0.093 0.6 × 10³ P. citrinum Monoverticillate 8 32 1.50 0.046 1.2 × 10³ P. herquei Biverticillate 12 48 1.91 0.039 2.3 × 10³ P. implicatum Monoverticillate 3 12 1.66 0.138 0.5 × 10³ P. italicum Terverticillate 5 20 1.00 0.050 0.5 × 10³ P. miczynskii Biverticillate 7 28 1.14 0.040 0.8 × 10³ P. restrictum Monoverticillate 9 36 1.55 0.043 1.4 × 10³ P. resendanum Monoverticillate 8 32 1.37 0.042 1.1 × 10³ P. sclerotiorum Monoverticillate 12 48 1.16 0.024 1.4 × 10³ P. roseopurpureum Monoverticillate 14 56 1.14 0.020 1.6 × 10³ P. vinaceum Monoverticillate 15 60 2.06 0.034 3.1 × 10³ P. verrucosum Terverticillate 3 12 2.00 0.166 0.6 × 10³ Table 2. Penicillium species recovered from the soil samples of Drass valley
Figures
(4)
Tables
(2)