VA In Depth

What is Function Analysis System Technique (FAST)?
A technique to develop a graphical representation showing the logical relationships between the functions of a project, product, process or service based on the questions “How” and “Why”.

Why is the Function Analysis System Technique important?
The Function Analysis System Technique aids in thinking about the problem objectively and in identifying the scope of the project by showing the logical relationships between functions. The organization of the functions into a function-logic diagram, such as a FAST diagram enables participants to identify of all the required functions. The FAST diagram can be used to verify if, and illustrate how, a proposed solution achieves the needs of the project, and to identify unnecessary, duplicated or missing functions.
Benefits of the Function Analysis System Technique:
The development of a FAST diagram is a creative thought process which supports communication between team members.
The development of a FAST diagram helps teams to:
- Develop a shared understanding of the project
- Identify missing functions.
- Define, simplify and clarify the problem.
- Organize and understand the relationships between functions.
- Identify the basic function of the project, process or product.
- Improve communication and consensus.
- Stimulate creativity.
How To Create a FAST Diagram
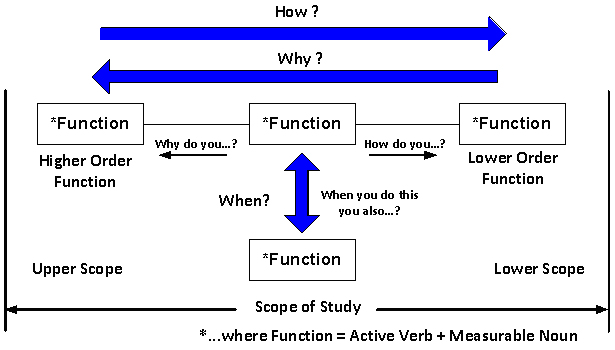
Three key questions are addressed in a FAST Diagram:
- How do you achieve this function?
- Why do you do this function?
- When you do this function, what other functions must you do?
The following diagram illustrates how a function is expanded in "How" and "Why" directions in a FAST diagram.
Steps in constructing the FAST Diagram
Start with the Functions as identified using Function Analysis:
- Expand the functions in the "How" and "Why" directions:
- Build along the "How" path by asking 'how is the function achieved'? Place the answer to the right in terms of an active verb and measurable noun.
- Test the logic in the direction of the "Why" path (right to left) by asking 'why is this function undertaken?'
- When the logic does not work, identify any missing or redundant functions or adjust the order.
- To identify functions that happen at the same time, ask "when this function is done, what else is done or caused by the function?"
- The higher order functions (functions towards the left on the FAST Diagram) describe what is being accomplished and lower order functions (functions towards the right on the FAST Diagram) describe how they are being accomplished.
- "When" does not refer to time as measured by a clock, but functions that occur together with or as a result of each other.
Example Fast Diagram: Mouse Trap
Consider the following FAST diagram for a mouse trap using the how and why logic as described above.
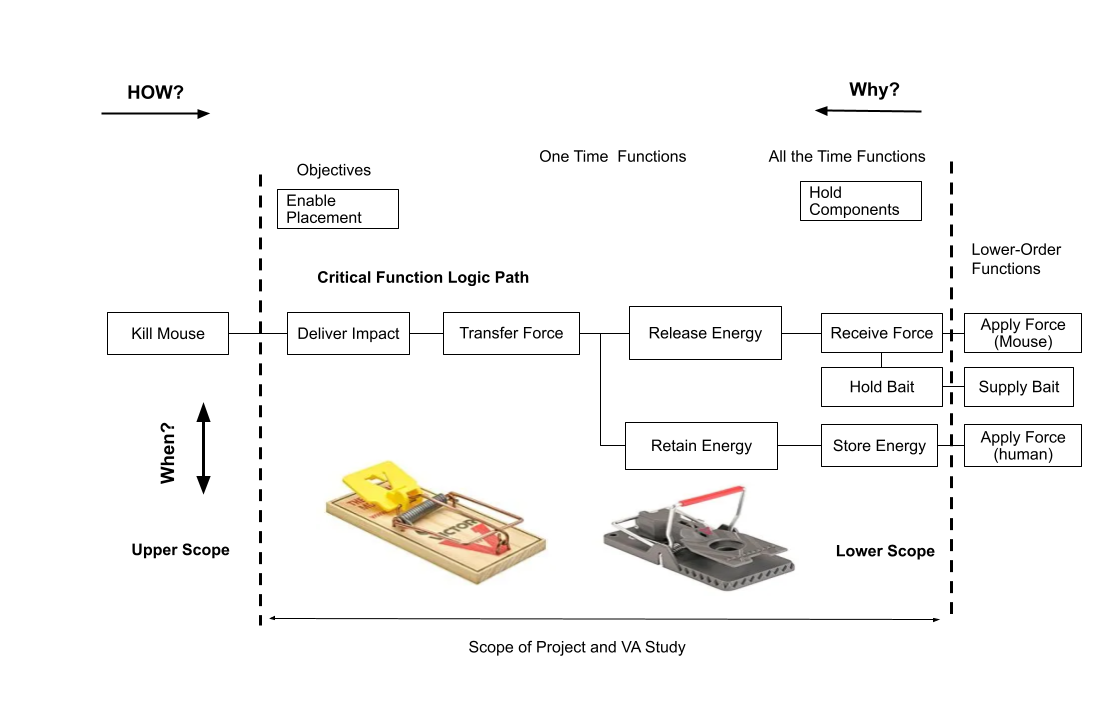
Can you think of other ways to achieve the basic function of kill mouse or the higher order function to eliminate mice.
Who is involved?
The Function Analysis System Technique (FAST) diagram is usually prepared in a workshop setting and led by someone with experience in preparing FAST diagrams. Input for the diagram is received from workshop participants.
Is there a "correct" FAST Diagram?
There is no 'correct' FAST diagram but there is a valid method of representing the logic in a diagram. The validity of a FAST model for a given situation is dependent on knowledge and scope of the workshop participants. The FAST diagram aids the team in reaching consensus on their understanding of the project