Final Report - National Energy Technology Laboratory - U.S. ...
Final Report - National Energy Technology Laboratory - U.S. ...
Final Report - National Energy Technology Laboratory - U.S. ...

You also want an ePaper? Increase the reach of your titles
YUMPU automatically turns print PDFs into web optimized ePapers that Google loves.
Central<br />
Alaska<br />
Colville/<br />
North Slope<br />
Puget Sound<br />
/West flank<br />
Cascade Mtns<br />
Modoc<br />
(Hornbrook)<br />
Sacramento<br />
Monterey Fm<br />
Santa Maria<br />
San Joaquin<br />
Los Angeles<br />
(deep)<br />
Cook Inlet<br />
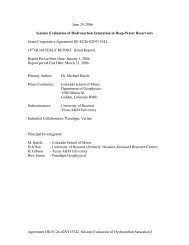
U. S. Department of the Interior<br />
Geological Survey<br />
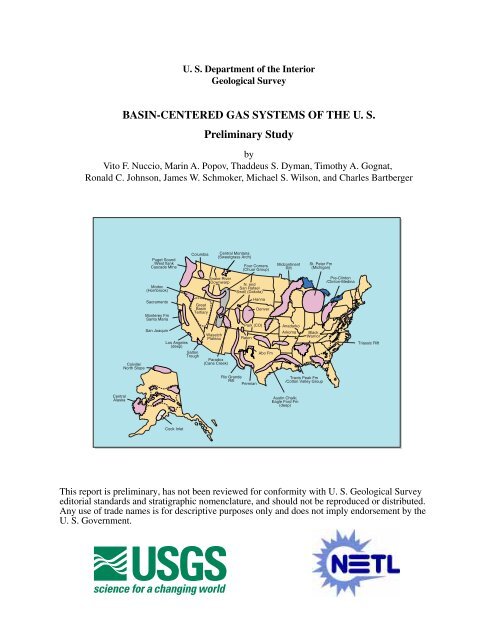
BASIN-CENTERED GAS SYSTEMS OF THE U. S.<br />
Columbia<br />
Great<br />
Basin<br />
Tertiary<br />
Salton<br />
Trough<br />
Preliminary Study<br />
by<br />
Vito F. Nuccio, Marin A. Popov, Thaddeus S. Dyman, Timothy A. Gognat,<br />
Ronald C. Johnson, James W. Schmoker, Michael S. Wilson, and Charles Bartberger<br />
Snake River<br />
Downwarp<br />
Wasatch<br />
Plateau<br />
Paradox<br />
(Cane Creek)<br />
Central Montana<br />
(Sweetgrass Arch)<br />
Four Corners<br />
(Chuar Group)<br />
N. end<br />
San Rafael<br />
Swell (Dakota)<br />
Park (CO)<br />
Raton<br />
Rio Grande<br />
Rift<br />
Permian<br />
Hanna<br />
Denver<br />
Abo Fm<br />
Midcontinent<br />
Rift<br />
Anadarko<br />
Arkoma<br />
Austin Chalk;<br />
Eagle Ford Fm<br />
(deep)<br />
St. Peter Fm<br />
(Michigan)<br />
Black<br />
Warrior<br />
Travis Peak Fm<br />
/Cotton Valley Group<br />
Pre-Clinton<br />
/Clinton-Medina<br />
Triassic Rift<br />
This report is preliminary, has not been reviewed for conformity with U. S. Geological Survey<br />
editorial standards and stratigraphic nomenclature, and should not be reproduced or distributed.<br />
Any use of trade names is for descriptive purposes only and does not imply endorsement by the<br />
U. S. Government.
BASIN-CENTERED GAS SYSTEMS OF THE U.S. PROJECT<br />
DE-AT26-98FT40031<br />
U.S. Department of <strong>Energy</strong>, <strong>National</strong> <strong>Energy</strong> <strong>Technology</strong> <strong>Laboratory</strong><br />
Contractor: U.S. Geological Survey Central Region <strong>Energy</strong> Team<br />
DOE Project Chief: Bill Gwilliam<br />
USGS Project Chief: V.F. Nuccio<br />
Contract Period: April, 1998-November, 2000<br />
<strong>Final</strong> <strong>Report</strong>
TABLE OF CONTENTS<br />
Scope of Assessment............................................................. 5<br />
Objective........................................................................... 5<br />
Introduction........................................................................ 5<br />
Project Organization............................................................. 6<br />
Basin-Centered Accumulation .................................................. 7<br />
PHASE I<br />
Anadarko Basin................................................................... 14<br />
Appalachian Basin, Clinton/Medina Groups................................ 21<br />
Arkoma Basin .................................................................... 29<br />
Black Warrior Basin............................................................. 37<br />
Central Alaska Basins .......................................................... 45<br />
Chuar Group (Precambrian Paradox Basin).................................. 53<br />
Columbia Basin.................................................................. 58<br />
Cook Inlet, Alaska.............................................................. 64<br />
Denver Basin ..................................................................... 72<br />
Great Basin (Tertiary)........................................................... 82<br />
Gulf Coast (Austin Chalk)..................................................... 91<br />
Gulf Coast (Eagle Ford Formation).......................................... 98<br />
Gulf Coast (Travis Peak/Cotton Valley Formation) .................... 104<br />
Hanna Basin .................................................................... 111<br />
Los Angeles Basin............................................................. 119<br />
Michigan Basin, St. Peter Sandstone...................................... 126<br />
Mid-Continent Rift............................................................ 132<br />
Modoc Plateau, Hornbrook Formation..................................... 139<br />
Paradox Basin (Pennsylvanian).............................................. 147<br />
Park Basins, Colorado........................................................ 157<br />
Permian Basin, Abo Formation............................................. 165<br />
Raton Basin..................................................................... 173<br />
Rio Grande Rift................................................................ 181<br />
Sacramento Basin.............................................................. 188<br />
Salton Trough.................................................................. 195<br />
San Rafael Swell .............................................................. 203<br />
Santa Maria Basin............................................................. 211<br />
Snake River Downwarp, Idaho .............................................. 218<br />
Sweetgrass Arch, Montana, Alberta Basin................................ 226<br />
Triassic Rift Basins (Eastern U.S.)........................................ 233<br />
Wasatch Plateau, Utah........................................................ 240<br />
Western Washington .......................................................... 247<br />
Western North Slope, Alaska, Colville Basin............................ 254<br />
References Cited............................................................... 267<br />
Selected Bibliography......................................................... 284
PHASE II<br />
Albuquerque Basin............................................................. 288<br />
Anadarko Basin................................................................. 314<br />
Cotton Valley.................................................................. 341<br />
Michigan Basin ................................................................ 388<br />
Pasco Basin..................................................................... 401<br />
Raton Basin..................................................................... 416<br />
Sacramento Basin.............................................................. 430<br />
Travis Peak..................................................................... 457<br />
PROJECT ABSTRACT ............................................................ 502
SCOPE OF THE ASSESSMENT<br />
The scope of this project was to identify and characterize the geologic and geographic distribution of<br />
potential basin-centered gas systems throughout the U.S., including Alaska. This project identifies the<br />
basin-centered gas systems, and for selected systems, estimates the location of "sweet spots" where basincentered<br />
gas resources are likely to be produced over the next 30 years. This project covered a thirty<br />
(30) month period of performance; twelve months for Phase I (April, 1998 through<br />
March, 1999) and eighteen months for Phase II (June, 1999 through November, 2000.<br />
OBJECTIVE<br />
The principal objective of this project was to perform an analysis of basin-centered gas occurrence in<br />
the U.S. and analyze its potential significance to future natural gas exploration and development. This<br />
project utilized state-of-the-art procedures and knowledge of basin-centered gas systems, including<br />
stratigraphic analysis, organic geochemistry, basin thermal dynamics, and reservoir and pressure analyses.<br />
INTRODUCTION<br />
The primary purpose of this report is to characterize thirty-three (33) potential basin-centered gas<br />
systems/accumulations throughout the U.S. The characterizations are based on data from the published<br />
literature and from internal computerized well and reservoir data files. The USGS is currently re-evaluating<br />
the resource potential of basin-centered gas accumulations in the U.S. due to changing geologic perceptions<br />
about these accumulations and the availability of new data. Newly defined basin-centered accumulations in<br />
regions of the U.S. may result in new plays based on an analysis of data available since the 1995 U.S.<br />
Geological Survey <strong>National</strong> Assessment (Gautier et al., 1996). These potential basin-centered gas<br />
accumulations vary qualitatively from low to high risk and may/may not survive rigorous geologic scrutiny<br />
leading toward a full geologic assessment based on plays<br />
For this report, we selected thirty-three potential basin-centered gas accumulations throughout the U.S.<br />
They include the: Sacramento/San Joaquin basins, Raton Basin, Rio Grande Rift, Anadarko Basin, Travis<br />
Peak/Cotton Valley, Columbia Basin/W. Flank of the Cascades, Michigan Basin/St. Peter Sandstone,<br />
Cook Inlet, Alaska, Permian Basin/Abo Formation, Hanna Basin, Paradox Basin (Pennsylvanian shales),<br />
Western North Slope of Alaska, Central Alaska, Wasatch Plateau, Puget Sound, Modoc/Northern<br />
California, Santa Maria Basin/Monterey Formation, Los Angeles Basin (deep), Salton Trough, Great Basin<br />
(Tertiary basins), Snake River downwarp, Paradox Basin (Precambrian Chuar Group), Denver Basin, Park<br />
Basins of Colorado, North end of San Rafael Swell (Dakota Formation), Central Montana (Sweetgrass<br />
Arch), Mid-continent Rift, Arkoma Basin, Austin Chalk, Eagle Ford Formation, Texas, Appalachian Basin<br />
(Clinton-Medina and older Formations), Eastern U.S. Triassic Rift Basins, and the Black Warrior Basin.<br />
For each, we summarize the geologic setting and data favoring the existence a potential basin-centered<br />
accumulation.
PROJECT ORGANIZATION<br />
TASKS:<br />
Phase I (April 1998 through March 1999)<br />
The USGS shall conduct a <strong>National</strong> inventory of known basin-centered gas systems,<br />
define new potential systems, rank them according to levels of geologic certainty, further<br />
delineate their geologic and geographic characteristics, and produce a map showing their<br />
distribution throughout the U.S.<br />
Task No. 1 April 1998 through March 1999<br />
Conduct a <strong>National</strong> inventory of known basin-centered gas systems and produce a map<br />
showing geographic location, and supporting documentation of their stratigraphic location<br />
and geologic characteristics.<br />
Task No. 2 April 1998 through March 1999<br />
Re-examine basins and other areas throughout the U.S. that were previously defined as<br />
conventional accumulations, and determine if they might have been mis-classified. If it is<br />
determined that these basins or areas exhibit characteristics that could be consistent with<br />
those of basin-centered gas systems, maps of their location and supporting geologic<br />
documentation will be provided.<br />
Task No. 3 October 1998 through March 1999<br />
Risk and rank the newly created list of basin-centered gas systems according to levels of<br />
geologic certainty.<br />
Phase II (June 1999 through November 2000)<br />
Phase II focuses on defining “sweet spots” (that portion of the basin-centered gas resource<br />
that will be available in 30 years) within the seven basin-centered gas systems determined<br />
in Phase I (Sacramento/San Joaquin Basins, Raton Basin, Rio Grande Rift, Anadarko<br />
Basin, Travis Peak/Cotton Valley, Columbia Basin/W. Flank of the Cascades, Michigan<br />
Basin/St. Peter Sandstone).<br />
Task No. 4 June 1999 through November 2000<br />
Through rigorous geologic analysis, define “sweet spots” within the selected basincentered<br />
gas systems.<br />
Task No. 5 June 1999 through November 2000<br />
For the “sweet spots”, make judgments and recommendations as to the 30-year<br />
availability of the gas resource.<br />
Task No. 6 June 1999 through November 2000<br />
Prepare a final report that documents the Phase I and Phase II activities. The final report<br />
shall include a digital map showing all defined basin-centered gas systems for the U.S.,<br />
documentation of their geologic characteristics, identification of selected potential sweet<br />
spots, and judgments and recommendations as to the social relevance of the resource<br />
(availability over a 30-year time frame).
BASIN-CENTERED/CONTINUOUS-TYPE ACCUMULATIONS<br />
Basin-centered or continuous-type accumulations are large single fields having spatial dimensions equal<br />
to or exceeding those of conventional plays. They cannot be represented in terms of discrete, countable<br />
units delineated by downdip hydrocarbon-water contacts (as are conventional fields). The definition of<br />
continuous accumulations is based on geology rather than on government regulations defining low<br />
permeability (tight) gas. Common geologic and production characteristics of continuous accumulations<br />
include their occurrence downdip from water-saturated rocks, lack of obvious trap or seal, relatively low<br />
matrix permeability, abnormal pressures, large in-place hydrocarbon volumes, and low recovery factors<br />
(Schmoker, 1995).<br />
Continuous plays were treated as a separate category in the U.S. Geological Survey 1995 <strong>National</strong><br />
Petroleum Assessment and were assessed using a specialized methodology (Schmoker, 1995). These<br />
continuous plays are geologically diverse and fall into the following categories: coal-bed gas, some biogenic<br />
gas occurrences, fractured gas shales, and basin-centered natural gas accumulations. Only continuous-type<br />
basin-centered gas plays comprise significant future undiscovered resources in deep sedimentary basins.<br />
Assessment of continuous plays is based on the concept that an accumulation can be regarded as a<br />
collection of hydrocarbon-bearing cells. In the play, cells represent spatial subdivisions defined by the<br />
drainage area of wells. Cells may be productive, nonproductive, or untested. Geologic risk, expressed as<br />
play probability, is assigned to each play. The number of untested cells in a play, and the fraction of<br />
untested cells expected to become productive (success ratio) are estimated, and a probability distribution is<br />
defined for estimated ultimate recoveries (EURs) for those cells expected to become productive cells. The<br />
combination of play probability, success ratio, number of untested cells, and EUR probability distribution<br />
yields potential undiscovered resources for each play. Refer to Schmoker (1995) for a detailed discussion of<br />
continuous-type plays and their assessment.<br />
In 1995 the USGS defined 100 continuous-type plays with oil and gas reservoirs in sandstones, shales,<br />
chalks, and coals for all depth intervals. Of the 100 identified plays, 86 were assessed, of which 73 were<br />
gas plays. Estimates of technically recoverable gas resources from continuous-type sandstones, shales, and<br />
chalks range from 219 Tcf (95th fractile) to 417 Tcf (5th fractile), with a mean estimate of 308 Tcf.<br />
Estimates of technically recoverable gas resources from coals in the lower-48 States range from 43 Tcf to<br />
58 Tcf, with a mean estimate of 50 Tcf. Continuous-type accumulations were not assessed or identified in<br />
many areas or regions of the U.S.<br />
Four categories of continuous-type accumulations can be identified with respect to new data and<br />
perceptions since the USGS 1995 <strong>National</strong> Petroleum Assessment: (1) Continuous-type plays that were<br />
correctly identified as such, assessed in 1995, but need to be updated because of new data. (2) Continuoustype<br />
plays that may have been identified incorrectly as conventional plays and assessed as such in 1995. (3)<br />
Continuous-type plays that were identified as such in 1995 but not assessed because of a lack of data. (4)<br />
New continuous-type plays that were not identified in 1995.<br />
Basin-centered gas accumulations form a special group of continuous-type gas accumulations and differ<br />
significantly in their geologic and production characteristics from conventional accumulations. They have<br />
the following characteristics:<br />
1. They are geographically large and cover from 10s to 100s of square miles in aerial extent often occupying the<br />
central deeper parts of sedimentary basins.<br />
2. They lack downdip water contacts and hydrocarbons are not held in place by the buoyancy of water.<br />
3. Reservoirs are abnormally pressured. They may be under- or overpressured.<br />
4. The pressuring phase of the reservoir is maintained by gas.<br />
5. Water production is usually low or absent, or water production is not associated with a distinct gas-water<br />
contact.<br />
6. Reservoir permeability is low—generally less than 0.1 md.
7. Reservoirs are overlain by normally pressured rocks containing gas and water.<br />
8. Reservoirs contain primarily thermogenic gas, although shallow biogenic reservoirs are similar but occur in<br />
different geologic environments.<br />
9. Source rocks are of a local nature from either interbedded or nearby lithologies.<br />
10. Structural and stratigraphic traps are secondary in importance. Compartments exist and generally forma an<br />
array of accumulation “sweet spots.”<br />
11. Multiple fluid phases contribute to seal development in reservoirs.<br />
12. The tops of basin-centered accumulations occur within a narrow range of vitrinite reflectance, usually<br />
occurring between 0.75 and 0.9 Ro.
LIST OF POTENTIAL BASIN-CENTERED GAS ACCUMULATIONS OF THE U.S.<br />
For Phase I, the following thirty-three (33) basins/areas were reviewed by the U.S. Geological Survey to<br />
characterize their potential for basin-centered gas accumulations. The basins/areas were grouped into two categories,<br />
and are listed below. Some of the considerations for our grouping included:<br />
(1) the amount of data available for an area, and our level of confidence in the data,<br />
(2) the 30-year impact of the potential accumulation,<br />
(3) the magnitude or size of the potential resource,<br />
(4) the geologic risk (e.g., depth, remoteness),<br />
(5) national distribution, and<br />
(6) the relationship to the USGS 1995 oil and gas assessment (have our perceptions about an area changed<br />
since then?).<br />
The list is divided into (1) High Potential Accumulations, or those for which we feel have high potential<br />
for development over the next 30 years, and (2) Other Potential Accumulations, those for which we feel have<br />
potential but will not be as high a priority within the next 30 years. The accumulations highlighted in bold type<br />
(within the high-potential list) are those studied in Phase II of this project.<br />
HIGH POTENTIAL ACCUMULATIONS:<br />
Sacramento/San Joaquin basins<br />
Raton Basin<br />
Rio Grande Rift<br />
Anadarko Basin<br />
Travis Peak/Cotton Valley<br />
Columbia Basin/W. Flank of the Cascades<br />
Michigan Basin/St. Peter Sandstone<br />
Cook Inlet, Alaska<br />
Permian Basin/Abo Formation<br />
Hanna Basin<br />
Paradox Basin (Pennsylvanian shales)<br />
OTHER POTENTIAL ACCUMULATIONS:<br />
Western North Slope of Alaska Denver Basin<br />
Central Alaska Park Basins of Colorado<br />
Wasatch Plateau North end of San Rafael Swell (Dakota Formation)<br />
Puget Sound Central Montana (Sweetgrass Arch)<br />
Modoc/Northern California Mid-continent Rift<br />
Santa Maria Basin/Monterey Formation Arkoma Basin<br />
Los Angeles Basin (deep) Austin Chalk<br />
Salton Trough Eagle Ford Formation, Texas<br />
Great Basin (Tertiary basins) Appalachian Basin (Clinton-Medina and older Formations)<br />
Snake River downwarp Eastern U.S. Triassic Rift Basins<br />
Paradox Basin (Precambrian Chuar Group) Black Warrior Basin
POTENTIAL BASIN-CENTERED GAS ACCUMULATIONS WITH RESPECT TO USGS 1995<br />
PETROLEUM ASSESSMENT<br />
This section briefly describes how the 33 accumulations identified for this study relate to the USGS 1995<br />
assessment. The reason we chose several of the accumulations for this study is that they were not either identified,<br />
assessed, or understood well in 1995. However, at the present time, we feel that all 33 have at least some potential<br />
for new gas resources. Shown, is the name of the accumulation, the Region of the U.S. where it is located (as<br />
defined in the 1995 assessment), the Province where the accumulation is located (as defined in the 1995 assessment),<br />
and a note about how the accumulation relates to the plays identified and assessed for that Province in 1995.<br />
Accumulation<br />
Region<br />
Province<br />
Notes<br />
Sacramento Basin 2 9 2 conventional plays assessed. No<br />
continuous plays assessed; potential for<br />
new gas resources.<br />
San Joaquin Basin 2 10 No continuous plays assessed; potential<br />
for new resources in Late Cretaceous<br />
strata.<br />
Raton Basin 4 41 No continuous plays assessed; potential<br />
in L. Tertiary and U. Cretaceous strata.<br />
Rio Grande Rift 3 23 5 conventional plays assessed. No<br />
continuous plays assessed.<br />
Anadarko Basin 7 58 5 conventional plays assessed. 1<br />
continuous play defined but not assessed.<br />
Potential for new continuous gas in<br />
Miss. and Penn. Strata.<br />
Travis Peak/Cotton Valley 6 49 2 conventional and 1 continuous Cotton<br />
Valley play assessed. Need to re-evaluate<br />
conventional to see if it is actually<br />
continuous.<br />
Columbia Basin/ 2 4 1 continuous play assessed. Need W.<br />
Flank of Cascades for further study based<br />
on new perceptions.<br />
Michigan Basin/St. Peter Ss 8 63 2 unconventional shale plays assessed.<br />
No continuous Ss plays assessed but<br />
potential new gas may be identified in<br />
Ss.<br />
Cook Inlet, Alaska 1 3 3 conventional plays assessed. No<br />
Continuous plays identified or assessed.<br />
Potential in Cretaceous and Jurassic<br />
strata.<br />
Permian Basin/Abo Formation 5 44 No continuous plays assessed. Potential<br />
in Abo Fm.
Accumulation<br />
Region<br />
Province<br />
Notes<br />
Hanna Basin 4 37 5 continuous plays assessed in the<br />
Greater Green River Basin. No<br />
continuous plays defined or assessed in<br />
the Hanna Basin.<br />
Paradox Basin (Penn. Sh) 3 21 6 conventional and 1 continuous play<br />
assessed. Potential for new gas resources<br />
in Penn. shales.<br />
Western North Slope of Alaska 1 1 11 conventional plays assessed. No<br />
continuous plays assessed, but potential<br />
in Jurassic and Cretaceous strata.<br />
Central Alaska 1 2 5 conventional plays assessed. No<br />
continuous plays assessed; little data.<br />
Wasatch Plateau 3 20 6 conventional and 15 continuous Plays<br />
assessed. No Wasatch Plateau Ss plays<br />
assessed.<br />
Puget Sound 2 4 9 conventional plays assessed. 1<br />
continuous play defined but not assessed.<br />
Modoc/Northern California 2 No plays identified or assessed.<br />
Santa Maria Basin/Monterey Fm. 2 12 4 conventional Monterey plays assessed.<br />
No continuous plays defined.<br />
Los Angeles Basin (deep) 2 14 7 conventional plays assessed. 1<br />
unconventional oil and gas play defined<br />
but not assessed.<br />
Salton Trough 2 Not addressed in the 1995 assessment.<br />
High risk/low priority.<br />
Great Basin (Tertiary basins) 3 19 6 conventional plays assessed. No<br />
continuous plays but potential in<br />
Tertiary basins.<br />
Snake River downwarp 3 17 4 conventional plays assessed. No<br />
continuous plays defined because of high<br />
risk.<br />
Paradox Basin (Precambrian) 3 21 Not addressed in the 1995 assessment.<br />
Denver Basin 4 39 6 conventional and 5 continuous oil and<br />
gas plays assessed. There is likely<br />
overlap between the two types of<br />
accumulations.
Accumulation<br />
Region<br />
Province<br />
Notes<br />
Park Basins of Colorado 4 38 2 conventional plays assessed, and 1<br />
continuous oil play identified.<br />
N. end San Rafael Swell 3 20 6 conventional and 15 continuous<br />
(Dakota Fm.) plays assessed. Potential<br />
for continuous play in Dakota Fm.<br />
Central Montana 4 28 8 conventional and 4 continuous<br />
(Sweetgrass Arch) plays assessed.<br />
Possibility that at least one conventional<br />
might be reassessed as continuous.<br />
Arkoma Basin 7 62 8 conventional plays assessed. No<br />
continuous plays identified but potential<br />
in Atokan strata.<br />
Austin Chalk/Eagle Ford Formation 6 47 3 Austin plays assessed. Potential for<br />
continuous gas play below the Austin<br />
Appalachian Basin (Clinton-Medina 8 67 18 conventional and 15<br />
and older strata) continuous plays assessed. Continuous<br />
plays require further delineation of sweet<br />
spots.<br />
Eastern U.S. Triassic Rift Basins 8 70 1 Mesozoic continuous play assessed.<br />
Black Warrior Basin 8 65 4 conventional plays and 4 continuous<br />
coalbed methane plays assessed.
ACKNOWLEDGEMENTS<br />
Various individuals contributed to project research and authoring. Alphabetically, these include C.<br />
Carothers, J.C. Fiduk, M.A. Heinrich, C. Marchand, S.K. Nodeland, A.M. Ochs, K.M. Peterson, S.S.<br />
Shapurji, R. Tauman, and R. Wells.<br />
REFERENCES<br />
Schmoker, J.W., 1995, Method for assessing continuous-type (unconventional) hydrocarbon<br />
accumulations, in Gautier, D.L., Dolton, G.L., Takahashi, K.I., and Varnes, K.L., eds., 1995<br />
<strong>National</strong> Assessment of United States oil and gas resources – Results, methodology, and<br />
supporting data: U.S. Geological Survey Digital Data Series DDS-30 [CD-ROM].<br />
U.S. Geological Survey <strong>National</strong> Oil and Gas Resource Assessment Team, 1995, 1995 <strong>National</strong><br />
Assessment of United States Oil and Gas Resources: U.S. Geological Survey Circular 1118, 20<br />
pp.
GEOLOGIC SETTING<br />
The Anadarko Basin extends from western Oklahoma to the eastern part of the Texas panhandle. Figure 1<br />
shows the geomorphic or tectonic features that border the basin: the Amarillo Uplift to the southwest, the Wichita-<br />
Criner Uplift to the south, the Arbuckle and Hunton-Pauls Valley Uplift to the southeast, the Nemaha Ridge and<br />
Central Oklahoma Platform to the east, and the Northern Oklahoma Platform to the north. The Anadarko Basin is<br />
asymmetric in profile and deepest along the steep southwestern flank near the Wichita Fault system. Displacement<br />
along this fault exceeds 30,000 feet (Al-Shaieb, et al., 1997a).<br />
One of the deepest basins in the United States, the Anadarko Basin contains over 40,000 feet of Paleozoic<br />
sediments. Figure 2 shows a generalized stratigraphic column of the basin. Hill and Clark (1980) have divided the<br />
deposits into five sequences: 1) a mid-Cambrian Arbuckle to post-Hunton-orogeny period (of mostly carbonate<br />
deposition), with hydrocarbons found mainly in structural traps; 2) Mississippian deposition of carbonates that<br />
formed stratigraphic traps for gas; 3) Pennsylvanian deposition of Morrow-Springer series clastic rocks (mostly in<br />
the northern shelf areas where the sediments were unaffected by orogenic movements in the southern parts of the<br />
basin); 4) post-Morrowan or Late Pennsylvanian deposition of segregated sand lenses; and 5) deposition of lower to<br />
middle Permian dolomitized shelf carbonates and Pennsylvanian Granite Wash sediments.<br />
Formation of the Anadarko Basin began during the collision of Gondwana with the southern continental margin<br />
of Paleozoic North America. Structural inversion of the core of the southern Oklahoma aulacogen into the Wichita<br />
thrust belt caused thrust loading of the region to the north, which subsided and became the Anadarko Basin. Late<br />
Pennsylvanian transpression formed numerous thrust-cored, en-echelon anticlines within the southeastern part of the<br />
basin that were later eroded and overlain unconformably by Permian carbonates. Subsidence of the basin continued<br />
into middle Permian time. The basin has remained quiescent since late Permian time (Perry, 1989).<br />
HYDROCARBON PRODUCTION<br />
Major hydrocarbon production from the Anadarko basin includes gas and oil from multiple Pennsylvanian<br />
reservoirs (Granite Wash, Atoka, Morrow, and Springer Formations). The largest Pennsylvanian Atoka field is the<br />
Berlin in Beckham County, Oklahoma, with an estimated ultimate recovery of 362 BCFG at 15,000 ft depth (Lyday,<br />
1990). Some deep production has occurred from Mississippian through Cambro-Ordovician strata: Washita Creek<br />
field in Hemphill County, Texas, from the Cambro-Ordovician at 24,450 ft depth (single well reserves as high as 24<br />
BCFG); and the Knox field (near the southeastern flank of the basin) from the Ordovician Bromide (Simpson) at<br />
15,310 ft depth (single well reserves as high as 6.2 BCFG).<br />
EVIDENCE FOR BASIN-CENTERED GAS<br />
Strong evidence for a basin-centered gas accumulation is present in the form of thermally mature source rocks,<br />
widespread production and shows of gas, and overpressuring (Figure 3) that cuts across stratigraphic boundaries.<br />
The Woodford shale forms the base of the pressure cell (Figure 4); the top of the cell climbs stratigraphically into<br />
the basin. Vitrinite reflectance values for the Woodford follow this same general trend. The Pennsylvanian Atokan<br />
source rocks may exhibit these same maturation trends.<br />
1
Province, Play and<br />
Accumulation Name:<br />
Geologic<br />
Characterization of<br />
Accumulation:<br />
KEY ACCUMULATION PARAMETERS<br />
Mid-Continent Province, Anadarko basin, Megacompartment Complex Play,<br />
Devonian Woodford through Pennsylvanian Oswego overpressured cell<br />
a. Source/reservoir interval includes Devonian Woodford shale through Pennsylvanian Oswego<br />
formation, overpressured Megacompartment Complex (Al-Shaieb et al.,<br />
1997b)<br />
b.Total Organic Carbons<br />
(TOCs)<br />
values for the Woodford Shale range to 9%. Atokan values unknown, but<br />
assumed to be high (Hester et al., 1990)<br />
c.Thermal maturity Ro 0.5 – 2.0 (values from Woodford shale) (Hester et al., 1990)<br />
d.Oil or gas prone gas prone<br />
e.Overall basin maturity mature<br />
f.Age and lithologies Cambrian to Permian; sands, shales, carbonates, and granite wash<br />
g. Rock extent/quality apparent basin-wide source and reservoir-rock distribution; rocks often<br />
become tight in the deeper parts of the basin<br />
h.Potential reservoirs many producing reservoirs<br />
i.Major traps/seals Woodford Shale, Atokan shales, Cambrian through Devonian shales and<br />
carbonates<br />
j.Petroleum<br />
generation/migration<br />
models<br />
both in-situ generation and long distance migration of gases and oils from<br />
shales, carbonates and coaly rocks. The Bakken Shale model of Meissner<br />
(1978) for hydrocarbon generation and expulsion applies to evaluation of the<br />
Woodford Shale<br />
k.Depth ranges productive rocks occur at depths greater than 26,000 ft. Overpressure occurs<br />
below 10,000 ft (Al-Shaieb et al., 1997)<br />
l.Pressure gradients range from about 0.28 psi/ft outside the pressure cell to 0.8 psi/ft in the<br />
Springer-Morrow section, in the deepest part of the basin (Al-Shaieb et al.,<br />
1997)
Production and Drilling<br />
Characteristics:<br />
Economic<br />
Characteristics:<br />
a. Important<br />
fields/reservoirs<br />
b.Cumulative production<br />
many fields produce from Cambrian through Permian rocks: Washita Creek<br />
field in Hemphill County, Texas, at the west end of the basin (from the<br />
Cambro-Ordovician at a depth of 24,450 ft; single well reserves as high as 24<br />
BCFG);<br />
Knox field near the southeastern flank of the basin (from Bromide (Simpson)<br />
production at 15,310 ft depth; single well reserves as high as 6.2 BCFG) (Al-<br />
Shaieb et al., 1997);<br />
Berlin field in Beckham County, Oklahoma (from the Pennsylvanian Atokan<br />
formation; estimated ultimate recovery of 362 BCFG at 15,000 ft depth<br />
(Lyday, 1990))<br />
a. High inert gas content gases are generally high in Btu content and low in total inert gases<br />
b.Recovery recoveries vary depending on permeability, porosity and depth<br />
c.Pipeline infrastructure very good<br />
d.Overmaturity overmature in the deepest parts of the basin<br />
e.Basin maturity most of the basin is mature (Ro values for the Woodford exceed 0.7%)<br />
(Hester et al., 1992)<br />
f.Sediment consolidation most rocks are well indurated<br />
g. Porosity/completion<br />
problems<br />
Shales, tightly cemented sands & other tight (low permeability rocks) have<br />
the potential to produce where naturally fractured (many deep Anadarko<br />
basin fields have permeabilities of less than 0.1 md). Water sensitive clays<br />
also cause problems.<br />
h.Permeability ranges from less than 0.08 up to 6,000 md<br />
i.Porosity highly variable
AMARILLO<br />
UPLIFT<br />
Oklahoma<br />
Texas<br />
100° 98°<br />
96°<br />
NORTHERN OKLAHOMA<br />
PLATFORM<br />
ANADARKO BASIN<br />
WICHITA-CRINER<br />
UPLIFT<br />
RED RIVER UPLIFT<br />
MUENSTER-WAURIKA ARCH<br />
CENTRAL OKLAHOMA<br />
PLATFORM<br />
HUNTON<br />
PAULS VALLEY<br />
UPLIFT<br />
ARDMORE<br />
BASIN<br />
MARIETTA BASIN<br />
ARBUCKLE<br />
UPLIFT<br />
0<br />
0 100 km<br />
OZARK<br />
UPLIFT<br />
ARKOMA BASIN<br />
OUACHITA SYSTEM<br />
Figure 1. Tectonic map showing location of the Anadarko basin and the major structural features of Oklahoma. After Al-Shaieb and<br />
Shelton (1977), Arbenz (1956).<br />
100 mi<br />
37°<br />
36°<br />
35°<br />
34°
,,<br />
,,<br />
,,<br />
,,<br />
Dolomite<br />
Limestone<br />
Chert & conglomerate<br />
, ,,,<br />
PERMIAN<br />
BROWN DOLOMITE<br />
,,, HEEBNER<br />
TONKAWA<br />
,, ,, MEDRANO<br />
MARCHAND<br />
,,<br />
OSWEGO<br />
RED FORK<br />
ATOKA<br />
CHERT- ,,, ,<br />
,<br />
CONGLOMERATE<br />
,,,<br />
MORROW<br />
WEDGE<br />
,<br />
SPRINGER<br />
PENNSYLVANIAN<br />
CHESTER<br />
,,,<br />
MISSISSIPPIAN<br />
MERAMEC<br />
OSAGE<br />
,,,<br />
, WOODFORD<br />
SILURO-DEVONIAN<br />
HUNTON<br />
,,,<br />
,,,<br />
SYLVAN<br />
VIOLA<br />
,,,<br />
ORDOVICIAN<br />
,,,<br />
SIMPSON<br />
,,,<br />
ARBUCKLE<br />
REAGAN<br />
CAMBRIAN<br />
BASEMENT<br />
, ,, ,, , ,<br />
,, ,,,<br />
, ,<br />
,, , ,,,<br />
,,, ,<br />
ARKOSIC WEDGE<br />
,,, , ,,, , ,,, ,<br />
,,,<br />
,<br />
, ,,,<br />
,<br />
,<br />
,<br />
,<br />
,,<br />
,,, , ,,, ,<br />
,,,,<br />
,,,,<br />
EXPLANATION<br />
Shale<br />
Sandstone<br />
Tuff breccia<br />
MEGA COMPARTMENT COMPLEX<br />
LOCALIZED<br />
OVERPRESSURED<br />
COMPARTMENTS<br />
,,,,<br />
,,,,<br />
Basement complex<br />
Figure 2. Generalized stratigraphic column of the Anadarko basin showing the intervals contained within<br />
the Mega Compartment Complex (MCC) and the stratigraphic position of two localized<br />
overpressured compartments outside the MCC. After Evans (1979).
Depth (feet)<br />
0<br />
5,000<br />
10,000<br />
15,000<br />
20,000<br />
25,000<br />
30,000<br />
35,000<br />
EXPLANATION<br />
,,,<br />
,,,<br />
,,,,<br />
SW NE<br />
,,,,,<br />
,,,,,<br />
PERMIAN<br />
,,,,,<br />
,,,,,<br />
VIRGILIAN<br />
,,,,,<br />
,,,,, ,,,,,,,,,,,,,,,,,,,,,,<br />
MISSOURIAN<br />
,,,,, ,,,,,,,,,,,,,,,,,,,,,,<br />
,,,,, ,,,,,,,,,,,,,,,,,,,,,,<br />
,,,,, ,,,,,,,,,,,,,,,,,,,,,,<br />
,,,,, ,,,,,,,,,,,,,,,,,,,,,,<br />
,,,,, ,,,,,,,,,,,,,,,,,,,,,,<br />
,,,,, ,,,,,,,,,,,,,,,,,,,,,,<br />
,,,,, ,,,,,,,,,,,,,,,,,,,,,,<br />
,,,,, ,,,,,,,,,,,,,,,,,,,,,,<br />
,,,,, ,,,,,,,,,,,,,,,,,,,,,,<br />
,,,,, ,,,,,,,,,,,,,,,,,,,,,,<br />
,,,,, ,,,,,,,,,,,,,,,,,,,,,,<br />
,,,,, ,,,,,,,,,,,,,,,,,,,,,,<br />
BASAL SEAL<br />
,,,,, ,,,,,,,,,,,,,,,,,,,,,,<br />
,,,,,,,,,,,,,,,,,,,,,,<br />
Limestone<br />
WICHITA<br />
MOUNTAINS<br />
,,,, Basement complex<br />
LATERAL SEAL<br />
Normal and subnormal pressure zone<br />
REYDON<br />
CHEYENNE<br />
AREA<br />
Mega Compartment Complex (overpressured)<br />
ATOKAN<br />
DESMOINESIAN<br />
,,<br />
,,,,,,<br />
,,,,,,,<br />
,,,,<br />
,,, ,,,<br />
,<br />
,,, ,,,,, ,,,, ,,,, ,, ,,, ,,<br />
,,,,,,,<br />
,,,,,,,<br />
,,,,,,<br />
,,,,,<br />
,,,,,<br />
,,,,, ,,,,<br />
,,,,,,,,,<br />
,,,,,,,,,<br />
,,,,,,,,,<br />
,,,,,,,<br />
,,,,,,,,<br />
,,,,,,, ,,,,,,<br />
,,,,,,,,,,<br />
,,,,,,,,,,,<br />
,,,,,,,,,,,<br />
,,,,,,,,,,<br />
,,,,,,,,,<br />
,,,,,,,,,<br />
,,,,,,,,<br />
,,,,,,,,,,,,,<br />
,,,,,,,,,,,,,<br />
,,,,,,,,,,,,,<br />
,,,,,,,,,,,<br />
,,,,,,,,,,,<br />
,,,,,,,,,,,<br />
,,,,,,,,,,,<br />
,,,,,,,,,,,,,,,,<br />
,,,,,,,,,,,,,,,<br />
,,,,,,,,,,,,,,,<br />
,,,,,,,,,,,,,<br />
,,,,,,,,,,,,,,<br />
,,,,,,,,,,,,,<br />
,,,,,,,,,,,,<br />
,,,,,,,,,,,,,,,,<br />
,,,,,,,,,,,,,,,,,<br />
,,,,,,,,,,,,,,,,,<br />
,,,,,,,,,,,,,,,,<br />
,,,,,,,,,,,,,,,<br />
,,,,,,,,,,,,,,,<br />
,,,,,,,,,,,,,,<br />
,,,,,,,,,,,,,,,,,,,<br />
,,,,,,,,,,,,,,,,,<br />
,,,,,,,,,,,,,,,,,<br />
,,,,,,,,,,,,,,,,,<br />
,,,,,,,,,,,,,,,,,,<br />
,,,,,,,,,,,,,,,,,,<br />
,,,,,,,,,,,,,,<br />
,,,,,,,,,,,,,,,,,,,<br />
,,,,,,,,,,,,,,,,,,<br />
,,,,,,,,,,,,,,,,,,,<br />
,,,,,,,,,,,,,,,,,,,<br />
,,,,,,,,,,,,,,,,,,<br />
,,,,,,,,,,,,,,,,,<br />
,,,,,,,,,,,,,<br />
,,,,,,,,,,,,,,,,,,<br />
,,,,,,,,,,,,,,,,,,<br />
,,,,,,,,,,,,,,,,,,<br />
,,,,,,,,,,,,,,,,,,<br />
,,,,,,,,,,,,,,,,<br />
,,,,,,,,,,,,,,,,<br />
,,,,,,,,,,,,<br />
,,,,,,,,,,,,,,,,,<br />
,,,,,,,,,,,,,,,,,<br />
,,,,,,,,,,,,,,,,<br />
,,,,,,,,,,,,,,,<br />
,,,,,,,,,,,,,,<br />
,,,,,,,,,,,,,,<br />
,,,,,,,,,<br />
,,,,,,,,,,,,,,,<br />
,,,,,,,,,,,,,,<br />
,,,,,,,,,,,,,,<br />
,,,,,,,,,,,,,<br />
,,,,,,,,,,,<br />
,,,,,,,,,,,<br />
,,,,,,,<br />
,,,,,,,,,,,,,<br />
,,,,,,,,,,,,<br />
,,,,,,,,,,,,<br />
,,,,,,,,,,,,<br />
,,,,,,,,,,<br />
,,,,,,,,,,<br />
,,,,,<br />
,,,,,,,,,,,<br />
,,,,,,,,,,<br />
,,,,,,,,,,<br />
,,,,,,,,,<br />
,,,,,,,,<br />
,,,,,,, ,,,<br />
,,,,,,,,,<br />
,,,,,,,,<br />
,,,,,,,,<br />
,,,,,,,<br />
,,,,, ,,,,,<br />
,,,,,,,<br />
,,,,,,<br />
,,,,,,<br />
,,,,, ,,,, ,,,,<br />
,,,,, ,,,, ,,,, ,,, , ,<br />
,, ,,<br />
,<br />
MORROW-SPRINGER<br />
VIOLA<br />
MISSISSIPPIAN<br />
HUNTON<br />
SIMPSON<br />
ARBUCKLE<br />
BASEMENT<br />
TOP SEAL<br />
SW NE<br />
0<br />
100 mi<br />
0 100 km<br />
100° 95°<br />
Figure 3. Generalized cross section of the Anadarko basin showing the spatial position of the Mega<br />
Compartment Complex (MCC) within the basin. Geopressures within the MCC are maintained by<br />
top, lateral, and basal seals. After Al-Shaieb et al. (1997).<br />
LEEDEY<br />
FIELD<br />
PUTNAM<br />
TREND<br />
WATONGA<br />
TREND<br />
37°<br />
34°
Depth (ft)<br />
0<br />
5,000<br />
10,000<br />
15,000<br />
20,000<br />
25,000<br />
0.465 psi/ft<br />
VIRGILIAN<br />
, ,<br />
,<br />
MISSOURIAN<br />
0 5,000 10,000<br />
DESMOINESIAN "SKINNER"<br />
LEVEL 2<br />
Pressure (psi)<br />
DESMOINESIAN "RED FORK"<br />
WOODFORD SHALE<br />
UPPER MORROWAN<br />
ORDOVICIAN-DEVONIAN<br />
"HUNTON"<br />
15,000 20,000<br />
Figure 4. Graphical representation of a pressure-depth profile lillustrating the relationship among Levels 1, 2,<br />
and 3. Note that Level 2 compartments are essentially clusters of isolated Level 3 compartments. This<br />
pressure-depth profile represents the Reydon-Cheyenne area in western Oklahoma.<br />
After Al-Shaieb et al. (1997).
GEOLOGIC SETTING<br />
The Appalachian basin extends southwestward from the Adirondack Mountains in New York to central Alabama.<br />
Figure 1 includes the area’s location . Structural boundaries include the Cincinnati arch in western Ohio, the<br />
Allegheny Front to the east, and the Blue Ridge of West Virginia. The basin is about 900 miles long and 300 miles<br />
wide and includes at least 100 million surface acres (Roth, 1964).<br />
The Appalachian basin originated as a sedimentary trough on the Precambrian surface that was later covered by<br />
Cambrian seas. Deposition of great masses of marine and continental sediments occurred throughout the Paleozoic<br />
Era. Carbonate and siliclastic tongues extended basinward from opposite margins synchronously in response to sea<br />
level drops. The interplay of eustatic sea-level drop and local tectonic uplift resulted in stratigraphic sequences<br />
bounded by widespread unconformities (Brett et al., 1990). Figure 2 shows correlation of the stratigraphy across the<br />
basin. Three major orogenic events affected the basin: the Taconic Orogeny (Late Ordovician), the Acadian Orogeny<br />
(Late Devonian), and the Allegheny Orogeny (Late Permian).<br />
1<br />
The geotectonic history of the basin includes the following stages:<br />
1) Precambrian: metamorphic and igneous rocks of the Grenville deformation form a basement under the<br />
Appalachian Foreland.<br />
2) Early and Middle Cambrian: offset of the basement surface associated with the formation of the Iapetus<br />
Ocean during Late Precambrian and Early Cambrian (Schumaker, 1996).<br />
3) Upper Cambrian-Middle Ordovician: relative crustal stability and the formation of a broad carbonate shelf.<br />
In the Middle Ordovician, a Foreland basin develops from compression of the passive, carbonate-dominated<br />
continental margin during collision with an island arc system (Taconic Orogeny). Thick turbidite sequences<br />
record the early phases of the orogeny.<br />
4) Late Ordovician (Ashgillian): waning of the main Taconic pulse, and deposition of the Bald Eagle-Oswego<br />
sandstone wedge and the Juniata-Queenston red bed sequences.<br />
5) Late Ordovician to Early Silurian: tectonic rejuvenation of the Taconic Front. In New York State, evidence<br />
for a late Taconic pulse lies in the regionally extensive, low-angle unconformity at the Ordovician-Silurian<br />
boundary (Cherokee Unconformity).<br />
6) Early Silurian (Cherokee Unconformity) and Late Silurian (Salinic Unconformity): eastward subsidence of<br />
the Appalachian Foreland Basin, which coincides with tectonic quiescence and thrust-load relaxation. A<br />
thick Early Silurian clastic wedge results from this subsidence. Westward migration in the foreland basin<br />
occurred during the Middle Silurian, depositing finer-grained strata; increased tectonism and onset of the<br />
Salinic Disturbance may have caused this migration. A small-scale unconformity at the Siluro-Devonian<br />
boundary may represent the latest Silurian tectonic activity (Brett et al., 1990).<br />
7) Devonian-Late Permian: The Acadian (Devonian) and Allegheny orogenies (Late Permian) correlate to the<br />
collision of the North American plate with other continental plates, eventually creating Pangaea at the end<br />
of the Paleozoic (Schumaker, 1996). During the Allegheny (Appalachian) Orogeny, tremendous thrust<br />
pulses from the east and southeast intensely folded and faulted the rocks in the eastern area. The deformation<br />
becomes gradually less intense westward. The Ridge and Valley province shows the greatest folding of<br />
rocks. The Allegheny Orogeny primarily determined the present day geologic pattern dividing the area into<br />
two main parts–the Plateau province, and the Ridge and Valley province (Roth, 1964).
HYDROCARBON PRODUCTION<br />
The Appalachian basin has the longest history of oil and gas production in the United States. Since Drake's<br />
Titusville discovery well in 1859, oil and gas has been continuously produced in the basin. Although opportunities<br />
for oil and gas still exist (Petzet, 1991), new field discoveries are rare, and the Appalachian basin has been considered<br />
a mature petroleum province as most of the significant plays have been already discovered and developed.<br />
2<br />
Conventional Plays: Production from Late Cambrian to Late Ordovician rocks is considered conventional:<br />
(1) The Upper Ordovician Queenston Formation produces gas from sandstones and sandy facies trapped in lowamplitude<br />
anticlines and fractures.<br />
(2) The Middle Ordovician Trenton play produces from fractured micrite in the transition zone between the<br />
Trenton limestone and the overlying Utica Shale (Ryder et al., 1995).<br />
(3) The Middle Ordovician St. Peter sandstone produces from structural traps.<br />
(4) The Late Cambrian-Late Ordovician Knox Dolomite produces from structural and stratigraphic traps.<br />
(5) The Cambrian pre-Knox Group (Conasauga Fm., Rome Fm., and Mt. Simon Sandstone) is extensive and<br />
underlies the productive "Clinton"/Medina play area. This play has had limited production and may still<br />
have potential for future gas production, including basin-centered gas. The section has been sparsely drilled,<br />
and thick untested intervals remain in parts of the Rome trough and other areas. Production from pre-Knox<br />
rocks has been limited to scattered wells in Kentucky, West Virginia, and Ontario, Canada. The area<br />
underlying the Clinton/Medina gas play is considered a low-risk area and has estimated recoverable gas<br />
resources of 460 BCF (Harris and Baranoski, 1996).<br />
Basin-centered gas plays: The Lower Silurian "Clinton" sands/Medina Group sandstones gas play is under<br />
development in New York, Pennsylvania and Ohio (Figure 1). Development of this continuous-type (or basincentered)<br />
gas play has expanded since the early 1970s. Ryder (1995) estimated the Appalachian basin to have about<br />
61 trillion (TCF) recoverable gas within Paleozoic sandstones and shales. An estimated 30 TCF may reside in basincentered<br />
gas accumulations in the Lower Silurian "Clinton"/Medina sandstones. Cumulative gas production per well<br />
is relatively low. This play appears attractive for four reasons: the overall success rate approaches 90%; the drilling<br />
and development costs remain low; there is low water production (and hence, low disposal costs); and the proximity<br />
to population centers provides a market for the gas. To maximize gas recovery, operators drill closely spaced (40<br />
acre) wells and horizontal/directional wells. Hydraulic fracturing techniques improved production success from low<br />
permeability sandstone reservoirs.<br />
Ryder (1995) defined four continuous-type gas plays (6728-6731) in the "Clinton”/Medina sandstones interval,<br />
flanked by two conventional plays that also have potential for continuous-type gas (6732 and 6727). Figure 1 shows<br />
well and play locations. Play 6728 has the best gas production potential and covers 16,901 square miles.<br />
The depositional sequence of the "Clinton"/Medina sandstones include the basal Whirlpool Sandstone and<br />
Medina Group, which unconformably overlie the Upper Ordovician Queenston Shale. These units represent<br />
transgressive shoreface deposits with a lowermost braided fluvial component. The lower part of the Grimsby<br />
Formation and "Clinton" sands are shoreface deposits. These sandstones constitute parts of progradational<br />
parasequences that successively overlap one another toward the northwest, pinch out seaward into the offshore marine<br />
shale of the Cabot Head and Power Glen Shales, and then appear to downlap across the underlying transgressive<br />
systems. Ryder et al. (1996) interprets the named sandstones in the Cabot Head Shale to be part of a progradational<br />
stacked-parasequence. The carbonate units (Reynales Limestone, Irondequoit Limestone, Dayton Limestone, and<br />
Packer Shell of drillers) appear to be offshore carbonates separated by inner shelf mudrocks (Keighin, 1998). These<br />
limestones are regionally extensive, but do have pinchouts and thickness changes in the intervening shale beds<br />
(Ryder et al., 1996).
EVIDENCE FOR BASIN-CENTERED GAS<br />
While productive Cambrian and Ordovician reservoirs apparently are conventional gas plays, basin-centered<br />
hydrocarbon accumulation may exist in the Appalachian basin "Clinton"/Medina sandstone, especially in play 6728<br />
(Ryder, 1998; Ryder et al., 1996; Wandrey et al., 1997):<br />
3<br />
(1) Regionally extensive sandstones with a thick zone of gas saturation reside in the thicker, more deeply buried<br />
part of this foreland basin. Sandstone thickness ranges from 120 to 210 ft, and average net thickness is 25<br />
ft; sandstone-to-shale ratios range from 0.6 to 1.0.<br />
(2) Gas fields are coalesced, and a high percentage of wells have production or gas shows.<br />
(3) Reservoirs have low porosity and permeability; porosity ranges from 3 to 11% (averaging 5%).<br />
Permeability ranges from 0.2 to 0.6 mD (generally averaging less than 0.01 mD).<br />
(4) Formation pressures are abnormally low with a gradient ranging from 0.25 to 0.35 psi/ft. In the Tuscarora<br />
sandstone (play 6727), there is evidence for overpressuring with a gradient ranging between 0.50-0.60 psi/ft.<br />
(5) Structural traps are few.<br />
(6) A gas-water contact is absent.<br />
(7) Sandstones with higher water saturations are updip of the gas accumulation.<br />
(8) Water yields are low; reservoir water saturation is less than 9 to 13 BW/MMCFG.<br />
(9) Reservoir temperatures are high–at least 125° F (52° C).
Province, Play and<br />
Accumulation Name:<br />
Geologic<br />
Characterization of<br />
Accumulation:<br />
KEY ACCUMULATION PARAMETERS<br />
Eastern U.S. Appalachian basin, (New York, Pennsylvania and Ohio). Play:<br />
Paleozoic Era - Late Cambrian and Ordovician sandstones and shales; Lower<br />
Silurian "Clinton" and Medina Group sandstones, and the equivalent<br />
Tuscarora Sandstone<br />
a. Source/reservoir the underlying Middle Ordovician Utica shale is the probable hydrocarbon<br />
source in the "Clinton"/Medina Group sandstones<br />
b.Total Organic Carbons<br />
(TOCs)<br />
range from 3.0%-4.0% (Middle Ordovician Utica Shale, Trenton Limestone,<br />
Black River Limestone, and Wells Creek Formation); from 0.05% to 0.59%<br />
in the pre-Knox (Harris and Baranoski, 1996)<br />
c.Thermal maturity Kerogen: 50% type II and 50% Type III; Vit Ref Equivalent (VRE): 0.75-<br />
3.0; Conodont Alteration Index (CAI): 1.5-4.0; Tmax: 440-550. The<br />
Ordovician strata in the study area is mature for both oil and gas generation<br />
(Wandrey et al., 1997; Ryder et al, 1996)<br />
d.Oil or gas prone both oil and gas prone; vitrinite reflectance suggests the majority of the area<br />
is in the window of significant gas generation<br />
e.Overall basin maturity considered mature along with adjoining basins in the eastern and southern<br />
U.S.<br />
f.Age and lithologies Cambrian-Ordovician (pre "Clinton"/Medina); Lower Silurian<br />
"Clinton"/Medina Group sandstones and the equivalent Tuscarora Sandstone<br />
g. Rock extent/quality basin-wide source and reservoir-rock distribution. Porosity reduction<br />
commonly results from secondary silica cementation; porosity often<br />
enhanced by dissolution of calcite cement, feldspars, corrosion of<br />
h.Potential reservoirs<br />
silica cement and by natural fracturing. About half the resource<br />
(approximately 30 TCF) is estimated to reside in basin-centered gas<br />
accumulations<br />
i.Major traps/seals Cabot Head Shale (Medina Group), Rochester Shale ("Clinton" sands)<br />
j.Petroleum<br />
generation/migration<br />
models<br />
Clinton/Medina" - evaluation with BASINMOD program (Platte River<br />
Assoc., Inc.). Hydrocarbon source: Utica shale (Middle Ordovician), gas<br />
migration occurred vertically (1000 ft to 1400 ft) via fractures. Organic<br />
carbon content data indicates good generative potential for the Middle<br />
Ordovician Utica shale, Trenton Limestone, Black River Limestone, and<br />
Wells Creek Formation. Each of these units may have locally sourced basin-<br />
centered gas potential; limited generative potential exists in the pre-Knox.
Production and Drilling<br />
Characteristics:<br />
County (OH)<br />
Production<br />
k.Depth ranges pre-Clinton/Medina 6000 to 11,500 ft in eastern OH; Clinton/Medina in<br />
eastern OH and NW PA from 4,000 to 6,300 ft; SW PA as much as 10,000<br />
ft; NY 1,000 to 4,000 ft; and southern OH and eastern KY 2,000 to 3,000 ft<br />
(Wandrey et al, 1997; Ryder et al, 1996)<br />
l.Pressure gradients pre-Clinton/Medina - pre-Knox Group underpressured domain: 0.174 psi/ft<br />
(Innerkip field-Ontario);<br />
a. Important<br />
fields/reservoirs<br />
"Clinton"/Medina-(1) underpressured domain: 0.25 to 0.35 psi/ft (verified<br />
throughout most of NW PA and adjoining western NY)<br />
"Clinton"/Medina-2) overpressured domain: 0.5-0.6 psi/ft, east of the<br />
underpressured domain, in the Tuscarora Sandstone, near the Allegheny<br />
structural front (in Pennsylvania)<br />
Pre-"Clinton"/Medina: Birmingham-Erie Field (Knox Group) sandstone<br />
reservoir 100 MMCFG/well; Middle Ordovician fractured carbonates-<br />
Harlem gas field 2.1 BCFG; Trenton play Granville consolidated pool 50-<br />
100 MMCFG/year<br />
a few pre-Knox wells have produced gas in the Rome Trough from the<br />
Conasauga Group (sands, shales and sandy dolomites), some wells have<br />
produced gas with up to 78% nitrogen (uncombustible gas)<br />
"Clinton"/Medina basin-centered gas: Lakeshore, Adams/Waterford/<br />
Watertown, Athens, Indian Springs Pool of Conneaut field, Kastle pool of<br />
Conneaut field, Cooperstown, Oil Creek Pool of Cooperstown field, Kantz<br />
Corners, North Jackson/Lordstown, NE Salem, Senecaville, Sharon Deep<br />
(Ryder, 1998)<br />
b.Cumulative production most of the basin-centered gas production occurs in Play 6728. Fields tend to<br />
merge together into continuous-type accumulations after additional drilling.<br />
E.g., the three or four Medina fields discovered in the 1960s in Chautauqua<br />
County, western New York, have now merged into the giant Lakeshore field,<br />
which has an ultimate recovery of 650 billion cf of gas. Assuming 40 acre<br />
spacing the median estimated ultimate recovery per well is 70 MMCFG<br />
(play 6728), 50 MMCFG (play 6729), and high risk/low success ratio for<br />
plays 6730 and 6731 (Wandrey et al., 1997). Below are some examples of<br />
production data (for the better wells) from the "Clinton" sands in Ohio.<br />
Township Operator Cumulative Gas<br />
(MMCF) per Lease<br />
Years of<br />
Production<br />
Noble....................Brookfield............Kingston Oil Corp. ...............146,835................1992-1995<br />
Noble....................Brookfield............Everflow Eastern...................206,736................1990-1995<br />
Noble....................Brookfield............Kingston Oil Corp. .................94,548................1993-1995<br />
Trumbull...............Fowler................Eastern Petroleum.................118,622................1987-1995<br />
Trumbull...............Fowler................Eastern Petroleum...................82,148................1985-1994<br />
Trumbull...............Fowler................Eastern Petroleum.................190,776................1984-1995<br />
Noble....................Center.................Kingston Oil Corp. ...............490,911................1985-1995
Economic<br />
Characteristics:<br />
a. High inert gas content in Ohio, average Clinton-Medina Nitrogen content is 5.1%, Carbon Dioxide<br />
content is 0.1% (Hugman et al., 1993). In the Rome Trough and adjacent<br />
areas, very high inerts in natural gas have been reported from pre-Knox<br />
rocks, sometimes rendering the gas non-combustible (up to 78% Nitrogen)<br />
b. Recovery Low. Continuous-type accumulations are characterized by low individual<br />
well-production rates and small well-drainage area. Directional/horizontal<br />
wells are being drilled to reduce the number of well sites.<br />
c. Pipeline infrastructure very good There are numerous gas lines in the basin.<br />
d. Overmaturity none<br />
e. Basin maturity mature<br />
f. Sediment consolidation consolidation/porosity reduction occurs with depth of burial<br />
g. Porosity/completion<br />
problems<br />
tight sands. Improved hydraulic fracturing techniques in recent years resulted<br />
in higher gas recoveries.<br />
h. Permeability pre-Knox=1.0 md (Innerkip field, Oxford Co., Ontario)<br />
i. Porosity pre-Knox=3.5 to 22% (Innerkip field, Ontario)
N<br />
Kentucky<br />
Ohio<br />
Sandstone reservoir for gas<br />
Sandstone reservoir for oil<br />
Oil and gas field<br />
Basin-centerd gas accumulation<br />
Ontario<br />
Lake Erie<br />
West Virginia<br />
Lake Ontario<br />
Approximate updip limit of basincentered<br />
gas accumulation<br />
Approximate updip limit of<br />
Tuscarora Sandstone<br />
Pennsylvania<br />
Well location with show of gas or oil<br />
New York<br />
0 50 mi<br />
Figure 1. Map showing regional hydrocarbon accumulation in Lower Silurian sandstone reservoirs of the Appalachian<br />
basin. Oil and gas shows seen in wells are from pre-Knox units. After Harris and Baranoski (1996), and<br />
Ryder (1998).
System<br />
Permian Lower Dunkard Gr<br />
Pennsylvanian<br />
Mississippian<br />
Devonian<br />
Silurian<br />
Ordovician<br />
Cambrian<br />
Precambrian<br />
Series North/West Central South<br />
Upper<br />
Middle<br />
Lower<br />
Upper<br />
Lower<br />
Upper<br />
Middle<br />
Lower<br />
Upper<br />
Lower<br />
Upper<br />
Middle<br />
Lower<br />
Upper<br />
Middle<br />
Lower<br />
Rockwell Mbr<br />
Riddleburg Sh Mbr<br />
Cussewago Ss Mbr<br />
Oswayo Mbr<br />
Dunkirk Sh<br />
Clinton Gr<br />
Ohio Sh<br />
West Falls Gr<br />
Genessee Fm<br />
Genesseo Sh Mbr<br />
Moscow Sh<br />
Ludlowville Sh<br />
Skaneateles Sh<br />
Marcellus Sh<br />
Onondaga Ls<br />
Keyser/Bass Islands<br />
Salina Gr<br />
Lockport Dol<br />
Medina Gr<br />
Queenston Fm<br />
Oswego Ss<br />
Rose Hill Ss<br />
Trempeleau Dol<br />
Kerbel Fm<br />
Price Fm<br />
Hamilton Gr<br />
Utica Fm/Antes Fm<br />
Rockwell Fm<br />
Monongahela Gr<br />
Conemaugh Gr<br />
Allegheny Gr<br />
Pottsville Gr Breathitt Fm<br />
Lee Fm<br />
Greenbrier Ls<br />
Catskill Fm<br />
Cleveland Sh Mbr<br />
Huron Sh Fm<br />
Rhinestreet Sh Fm<br />
Mahantango Fm<br />
Delaware Ls<br />
Columbus Ls<br />
Keyser Fm<br />
Tonoloway Fm<br />
Wills Creek Fm<br />
Bloomsburg Fm Williamsport Ss<br />
Mifflintown Fm McKenzie Fm<br />
Keefer Ss<br />
Shawangunk Fm Rose Hill Fm<br />
Massanutten Ss<br />
Reedsville Fm<br />
Antietam Fm<br />
Harpers Fm<br />
Weverton-Loudon Fms<br />
Juniata Fm<br />
Bald Eagle Ss<br />
Martinsburg Fm<br />
Wells Creek Dol<br />
Beekmantown Gr<br />
Newman Ls<br />
Price Fm<br />
Brallier<br />
Chemung<br />
Pennington Fm<br />
Bangor Ls<br />
Hartselle Ss<br />
Monteagle Ls<br />
St. Louis Ls<br />
Warsaw Ls<br />
Ft. Payne Fm<br />
Grainger Fm<br />
Hampshire Fm<br />
Tuscarora Fm Clinch Fm<br />
Conocheague Fm<br />
Elbrook Fm<br />
Bluestone Fm<br />
Princeton Ss<br />
Hinton Fm<br />
Maccrady<br />
Cloyd Cgl Mbr<br />
Sunbury Sh Mbr<br />
Berea Ss<br />
Harrell Sh<br />
Tully Ls<br />
Marcellus Sh<br />
Tioga Bentonite<br />
Onondaga Ls<br />
Huntersville Ch<br />
Needmore Sh<br />
Oriskany/Ridgeley Ss<br />
Helderberg Gr<br />
Black River<br />
/Trenton Ls<br />
Honaker Dol<br />
Rome Fm/Waynesboro Fm<br />
Shady Fm/Tomstown Dol<br />
Millboro Sh<br />
Liberty Hall Mbr<br />
Sevier/Blockhouse Sh<br />
Pond Spring Fm<br />
Copper Ridge Dol<br />
Maynardville Dol<br />
Nolichuchy Sh<br />
Sequatchie Fm<br />
Stone River<br />
/Nashville Gr<br />
Maryville Ls<br />
Rogersville Sh<br />
Rutledge Sh<br />
Pumpkin Valley Sh<br />
Mascot Dol<br />
Kingsport Fm<br />
Chepultepec Dol<br />
Erwin Fm<br />
Hampton Fm<br />
Unicoi Fm<br />
Walden Creek Gr<br />
Cades Ss<br />
Snowbird Gr<br />
Mount Rogers Fm<br />
Figure 2. Stratigraphic nomenclature and correlation chart for the Appalachian basin. After Milici (1996).<br />
Chilhowee Gr<br />
Borden<br />
Fm<br />
Chattanooga<br />
Sh<br />
Chickamauga<br />
Gr<br />
Knox Gr<br />
Conasauga Gr<br />
Conasauga Sh<br />
Ocoee<br />
Supergroup<br />
Sequence<br />
Alleghenian Flysch<br />
Lower Carboniferous<br />
Flysch Molasse<br />
Stable Shelf<br />
Acadian Flysch<br />
Post Taconic<br />
Molasse and<br />
Carbonate Shelf<br />
Taconic Flysch<br />
Iapetan Rift<br />
and<br />
Passive Margin
GEOLOGIC SETTING<br />
The Arkoma Basin follows an east-west trend from northern Arkansas into east-central Oklahoma.<br />
Figure 1 shows the structural features that border the area: the Ouachita Mountains to the south; the<br />
Seminole Arch and the Arbuckle Uplift to the west; and the Ozark Uplift to the north. Tertiary sediments of<br />
the Mississippi Embayment cover the eastern part of the basin. Figure 2 shows the basin is asymmetric in<br />
profile.<br />
The basin is characterized by normal faulting on the north and compressional structures on the south.<br />
Development occurred from Cambrian to early Pennsylvanian time. Prior to basin development, the area<br />
was a carbonate shelf (Horn and Curtis, 1996). Subsurface folds and thrust faults were formed during the late<br />
stages of foreland basin development. The basin was completely filled with late Pennsylvanian sediments<br />
(Horn and Curtis, 1996).<br />
Structural styles influence hydrocarbon production in the Arkoma basin. The northern Arkansas gas<br />
fairway and central basin are dominated by blind imbricate thrust faults that ramp over normal fault blocks<br />
at depths above 5000 feet. Gas reservoirs have been found below the thrust faults at depths of 5000 to<br />
10,000 feet.<br />
Seismic and well data reveal a southward thickening package of Carboniferous flysch (Figure 2)<br />
overlying thin Paleozoic shelf strata in western Arkansas (Figure 3). Total sediment thickness is estimated<br />
to be 46,000 feet in the southern Ouachita mountains. At least 39,000 feet of flysch were deposited north of<br />
the Ouachita mountain front (Lillie et al., 1983).<br />
North of the Ouachita mountains, the Cambro-Ordovician Arbuckle carbonates were deposited in a<br />
marine shelf environment (Gromer, 1981). The Devonian-Mississippian Arkansas Novaculite was deposited<br />
when rapid subsidence occurred in the Ouachita basin. The Mississippian Stanley shale Group, the<br />
Pennsylvanian Jackfork Group, the Johns Valley Formation and the Atoka Formation as the Arkoma basin<br />
continued to subside. The Atoka Fm includes 20,000 feet of shale, sandstone and coal beds. Flysch<br />
sedimentation continued until mid-Pennsylvanian time, when northward thrusting displaced the geosyncline<br />
(Gromer, 1981). The Ouachita fold belt was produced by a collision between an island arc and the North<br />
American plate (Wickham, et al., 1976).<br />
HYDROCARBON PRODUCTION<br />
Natural gas was first produced in 1901 at a depth of 2,000 feet from Pennsylvanian sandstones in<br />
Sebastian County, Arkansas. The greatest exploration activity occurred along the northern part of the basin<br />
in Arkansas and Oklahoma. Most major fields were discovered within the first 30 years of industry activity<br />
(Horn and Curtis, 1996). In 1930, gas production was established from the Atokan Spiro sandstone at a<br />
depth of 6300 feet. Wilburton field, the Arkoma basin's second largest field, was discovered in 1929 with<br />
production from Upper Atokan sandstones at 2500 feet. The Spiro sandstone was tested in 1960 and soon<br />
became the main producing zone. Except for Wilburton and Red Oak fields, very few successful wells were<br />
drilled below 10,000 feet prior to the 1970’s (Horn and Curtis, 1996).<br />
Production was established from the Spiro sandstone and Arbuckle carbonates in northern Oklahoma<br />
and Arkansas during the late 1970s, opening a new fairway for deeper exploration. Production from<br />
Arbuckle (Cambro-Ordovician), Viola (Ordovician) and Hunton (Siluro-Devonian) was established at<br />
Wilburton field at depths of 13,000 to 14,500 feet in 1988 (Horn and Curtis, 1996).<br />
Limited shallow oil production occurs from the Stanley group (Mississippian) and fractured Paleozoic<br />
cherts (Devonian Arkansas Novaculite) in the southern Ouachitas (Horn and Curtis, 1996).<br />
1
EVIDENCE FOR BASIN-CENTERED GAS<br />
The Atoka formation contains coals and shales with gas-prone kerogen. It extends over a wide area and<br />
is very thick. Middle Atokan Red Oak sands contain some of the largest gas reserves in the Oklahoma part<br />
of the Arkoma basin (Gromer, 1981).<br />
The Woodford shale, which contains type II oil prone kerogen, may have generated in excess of 22<br />
billion barrels of oil (Comer and Hinch, 1987). This oil has probably cracked to gas in the deepest parts of<br />
the Arkoma basin (Horn and Curtis, 1996). Other source rocks include the Womble (Ordovician), Polk<br />
Creek (Ordovician), Sylvan (Ordovician), Woodford (Devonian-Mississippian), Arkansas Novaculite<br />
(Devonian-Mississippian) and Caney (Mississippian) shales. Each of these has probably expelled significant<br />
hydrocarbons (Horn and Curtis, 1996). Atokan shales are estimated to have generated between 53 and 212<br />
TCFG. A large, relatively untested area in southwestern Arkansas contains thick sequences of interbedded<br />
source and reservoir rocks, and may contain large accumulations of gas (Horn and Curtis, 1996).<br />
Figure 4 illustrates profiles of depth vs. vitrinite reflectance (Ro) for undifferentiated wells in Arkansas<br />
and Oklahoma. Hendrick (1992) listed the following vitrinite reflectance values for producing zones at<br />
Wilburton Field:<br />
2<br />
Hartshorne Coal Ro < 1%<br />
Atoka Shale Ro = 2.3% at 7,500 ft<br />
Atoka Shale Ro = 2.6% at 9,400 ft<br />
Spiro Sandstone Ro = 2.7% at 10,000 ft<br />
Spiro Sandstone Ro = 3.0% at 11,500 ft<br />
Arbuckle Dolomite Ro = 3.8%<br />
These unusually high vitrinite values at moderate depths indicate a potentially overmature basin.<br />
Several thousand feet of sediment may have been eroded from the surface.<br />
The extensive source rocks and high thermal maturity levels in the Arkoma basin indicate that basincentered<br />
gas accumulations may exist which have not yet been identified. Thick Atoka shales probably<br />
provide the primary barriers to gas migration. In the lower Paleozoic section, several shale intervals<br />
encasing productive carbonate and sandstone reservoirs are thought to be effective seals (Horn and Curtis,<br />
1996).
Province, Play and<br />
Accumulation Name:<br />
Geologic<br />
Characterization of<br />
Accumulation:<br />
KEY ACCUMULATION PARAMETERS<br />
Arkoma Basin Province, Play, Ordovician through Pennsylvanian<br />
Desmoinesian<br />
a. Source/reservoir Ordovician Womble shale through Pennsylvanian Desmoinesian shales and<br />
coals (Horn and Curtis, 1996)<br />
b.Total Organic Carbons<br />
(TOCs)<br />
range up to 19.6% in Woodford Shale (Comer and Hinch, 1987) and average<br />
1.1% in Atokan shales (Horn and Curtis, 1996)<br />
c.Thermal maturity Ro ranges from
Production and Drilling<br />
Characteristics:<br />
Economic<br />
Characteristics:<br />
a. Important<br />
fields/reservoirs<br />
Red Oak field produces from Pennyslvanian sandstones at depths ranging<br />
from 1400 ft to 13,000 ft; Wilburton field produces from Cambro-Ordovician<br />
Arbuckle at depths from 13,000 to 14,500 ft<br />
b. Cumulative production Red Oak field has produced 55 Bcfg from the Hartshorne, 700 Bcfg from the<br />
Red Oak, and 200 Bcfg from the Spiro sandstones as of 1987<br />
a. High inert gas content gases have high btu content and low total inert gas content<br />
b. Recovery recoveries depend upon permeability, porosity and depth<br />
c. Pipeline infrastructure very good<br />
d. Overmaturity probably overmature in the southern and eastern parts of the basin.<br />
Production exists where apparent overmaturity occurs<br />
e. Basin maturity most of the basin is mature to overmature<br />
f. Sediment consolidation most rocks are well indurated<br />
g. Porosity/completion<br />
problems<br />
h. Permeability 0.1-200 md<br />
i. Porosity 5-23%<br />
shales, tightly cemented sands & other tight (low permeable rocks) have<br />
potential to produce where they are naturally fractured (many deep Anadarko<br />
basin ields have permeabilities of less than 0.1 md). Water sensitive clays<br />
also cause problems. Diagenetic permeability barriers are poorly understood.
35°<br />
34°<br />
Atoka<br />
96° 95° 94° 93°<br />
0 50 mi<br />
McAlester<br />
Tertiary<br />
Rocks<br />
Arbuckle<br />
Mountains<br />
A r k o m a<br />
Valley Fault<br />
Octavia<br />
Boktufola<br />
Choctaw Fault<br />
Frontal Margin of Oklahoma Structural Salien t<br />
COAL<br />
Eubanks<br />
Cretaceous<br />
Rocks<br />
PITTSBURG<br />
Willburton<br />
Fault<br />
Potato<br />
Hills<br />
Windingstair Fault<br />
Hartshorne ss<br />
and younger rocks<br />
(Desmoinesian,<br />
Virgillian)<br />
Red Oak<br />
1.0<br />
HASKELL<br />
LATIMER<br />
Fault<br />
Oklahoma<br />
Arkansas<br />
Fort Smith<br />
Valley<br />
B a s i n<br />
Waldron<br />
Boles<br />
Ouachita Mountains<br />
Fault<br />
Mount Ida<br />
Broken Bow — Benton Uplift<br />
Broken Bow Murfreesboro<br />
Atoka fm<br />
(Pennsylvanian)<br />
(including some<br />
older rocks)<br />
Oklahoma Arkansas<br />
LE FLORE<br />
1.5<br />
SEBASTIAN<br />
SCOTT<br />
Johns Valley sh<br />
(Pennsylvanian)<br />
Jackfork ss<br />
(Pennsylvanian)<br />
(including some<br />
younger Penn. rocks)<br />
Coastal<br />
Stanley sh<br />
and Hot Springs ss<br />
(Upper Mississippian<br />
and Pennsylvanian)<br />
Hollis<br />
Hot<br />
Springs<br />
Benton<br />
Plain<br />
Cambrian to<br />
Lower Mississippian<br />
(Arkansas novaculite<br />
and older rocks)<br />
Little Rock<br />
Igneous<br />
rocks<br />
(Cretaceous?)<br />
0 50 mi<br />
Figure 1: Geologic map of Ouachita Mountains and outline of present-day Arkoma basin. Vitrinite reflectance values derived from Hartshorne coal.<br />
After Gromer (1991), and Horn and Curtis (1996).<br />
LOGAN<br />
Ouachita Mountains Fold and Thrust Belt<br />
2.0<br />
YELL<br />
POPE<br />
CONWAY<br />
FAULKNER<br />
WHITE<br />
Mississippi<br />
Embayment<br />
2.0<br />
Well<br />
Scale<br />
Condensate Production<br />
Vitrinite Reflectance Contour
Formation Frontal Ouachitas<br />
Approximately 20 miles<br />
Central Ouachitas Formation<br />
Atoka Ss and Sh Atoka Group<br />
or<br />
Formation<br />
Wapanucka Ls<br />
Spiculite Bed<br />
Springer Sh and Ss<br />
Johns Valley Sh<br />
Caney Sh<br />
Game Refuge Ss<br />
Arkansas Novaculite<br />
Wesley siliceous sh<br />
Markham Mill<br />
Sandstone<br />
and Shale<br />
North North<br />
5000 ft<br />
4000<br />
3000<br />
2000<br />
1000<br />
0<br />
Limestone Siliceous<br />
Shale<br />
Siliceous Shale<br />
Siliceous Shale<br />
Middle Siliceous Shale<br />
Tuskahoma Siliceous Shale<br />
Lower Siliceous Shale<br />
Stanley-Arkansas NovaculiteTransitionBeds<br />
Siliceous Shale<br />
Prairie<br />
Mountain Fm<br />
Wildhorse<br />
Mountain Fm<br />
Chickasaw Creek<br />
Moyers Fm<br />
Upper<br />
Member<br />
Lower<br />
Member<br />
Tenmile Creek Fm<br />
Jackfork Group<br />
Stanley Group<br />
Morrowan Atokan<br />
Meramecan and Chesterian Series<br />
Kind B<br />
Osage<br />
Pennsylvanian System<br />
Mississippian System<br />
Arkansas Novaculite Devonian<br />
Shale Sandstone Spiculite Novaculite<br />
Figure 2. Diagrammatic cross section showing facies changes and correlations of the Late Mississippian and Early Pennsylvanian formations from the<br />
frontal Ouachitas to the central Ouachitas, southeastern Oklahoma, with thrust faults eliminated. After Gromer (1991) and Cline (1968).
System<br />
Pennsylvanian<br />
Mississippian<br />
Devonian<br />
Silurian<br />
Ordovician<br />
Cambrian<br />
Series<br />
Desmoinesian<br />
Atokan<br />
Morrowan<br />
Chesterian<br />
Meramecian<br />
Osagean<br />
Kinderhookian<br />
Upper<br />
and<br />
Middle<br />
Lower<br />
Niagaran<br />
Alexandrian<br />
Cincinnatian<br />
Champlainian<br />
Canadian<br />
Precambrian<br />
Arkoma Foreland Basin Facies<br />
Arkansas<br />
Boggy<br />
Savanna<br />
McAlester<br />
Hartshorne Ss<br />
Alma Series, Carpenter<br />
Basham<br />
Upper Hartford<br />
Nichols<br />
Middle Hartford,Turner<br />
Lower Hartford, Morris<br />
Tackett<br />
Cecil Series<br />
Spiro<br />
Orr<br />
Barton A, Barton B, Barton C<br />
Wapanucka Limestone<br />
Kessler<br />
Bloyd<br />
Brentwood<br />
Hale<br />
Pitkin Limestone<br />
Fayetteville Shale<br />
Hindsville Limestone<br />
Moorefield Formation<br />
Boone Formation<br />
Chattanooga Shale<br />
Sylamore Sandstone<br />
Penters Chert<br />
Lafferty Limestone<br />
St. Clair Limestone<br />
Brassfield Limestone<br />
Sylvan<br />
Cason Shale<br />
Fernvale Limestone<br />
Kimmswick Limestone, Plattin Limestone,<br />
Joachim Dolomite<br />
St. Peter Sandstone<br />
Tyner Formation<br />
Jasper Limestone<br />
King River Ss, Burgen Ss<br />
Powell Dolomite<br />
Cotter Dolomite<br />
Jefferson City Dolomite<br />
Roubidoux Formation<br />
Gasconade-Van Buren Formation<br />
Eminence Dolomite<br />
Polosi Dolomite<br />
Derby-Doerun-Davis Formation<br />
Bonneterre Dolomite<br />
Lamontte Sandstone<br />
Hunton Group<br />
Everton<br />
Formation<br />
Arbuckle<br />
Group<br />
Marmaton<br />
Cabaniss<br />
Krebs Group<br />
Oklahoma<br />
Salisaw Formation<br />
Frisco Formation<br />
Henryhouse Formation<br />
Chimneyhill Subgroup<br />
Petite Oolite<br />
Welling Formation<br />
Viola Springs Formation<br />
Bromide<br />
Tulip Creek<br />
Mclish<br />
Oil Creek<br />
Joins<br />
West Spring Creek<br />
Kinblade<br />
Cool Creek<br />
McKenzie Hill<br />
Butterfly Dolomite<br />
Singal Mountain Limestone<br />
Royer Dolomite<br />
Fort Sill Limestone<br />
Honey Creek Limestone<br />
Reagen Sandstone<br />
Boggy<br />
Savanna<br />
McAlester<br />
Hartshorne Ss<br />
Dirty Creek, Fanshawe<br />
Diamond, Red Oak<br />
Panola<br />
Brazil-Smallwood, Shay<br />
Spiro<br />
Wapanucka Limestone<br />
Union Valley<br />
Cromwell<br />
Goddard Shale<br />
Caney Shale<br />
Welden Limestone<br />
Woodford Shale<br />
Misener Sandstone<br />
Sylvan Shale<br />
Calvin<br />
Senora<br />
II<br />
III<br />
Relative Stratigraphic Position (ft)*<br />
15000<br />
10000<br />
5000<br />
0<br />
-5000<br />
-10000<br />
1 2 3 4 5 6 7 8 9 10<br />
*<br />
Mean Vitrinite Reflectance (% R o )*<br />
Estimated Woodford-Chattanooga top<br />
Estimated Arbuckle top<br />
Latimer County, OK<br />
Sebastian County, OK<br />
Yell County, AR<br />
Logan County, AR<br />
Faulkner County, AR<br />
White County, AR<br />
Stratigraphic position relative to top of basal Atokan (Spiro/Orr) sandstone<br />
Figure 4. Depth vs. vitrinite reflectance profile for wells in Arkansas and Oklahoma. These profiles use the Spiro<br />
sandstone as a stratigraphic datum and indicate that thermal maturity of eastern Arkansas wells does not<br />
follow the inferred west-to-east increase in maturity across the basin. After Horn and Curtis (1996) and<br />
Houseknecht et al. (1992).
GEOLOGIC SETTING<br />
The Black Warrior basin of Alabama and Mississippi is a foreland basin located in the major structural reentrant<br />
between the Appalachian fold-and-thrust belt to the southeast and the Ouachita fold-and-thrust belt to the southwest.<br />
Figure 1 shows the basin location and its major structural features. The northern margin of the basin is bounded by<br />
the Nashville dome. The basin is shaped like a kite with its tail facing south, and has a surface area of about 35,000<br />
square miles. North to south, the basin extends about 190 miles, and the east-west width is about 220 miles. The<br />
overall sedimentary section in the province includes rocks of Paleozoic, Mesozoic and Cenozoic age that range in<br />
thickness from about 7,000 ft along the northern margin to about 31,000 ft in the depocenter located in eastern<br />
Mississippi (Ryder, 1994).<br />
The geotectonic history of the basin includes 5 stages:<br />
1) Late Precambrian-Early Cambrian rift with associated deposition of coarse clastics.<br />
2) Middle Cambrian-Mississippian period of stable shelf deposition (7000 ft of shallow water carbonates)<br />
occurring on a passive continental margin.<br />
3) Late Mississippian (Chester) transitional episode; early stages of continental collision, marine deltaic<br />
sedimentation and several major regressive-transgressive cycles.<br />
4) Early-Late (?) Pennsylvanian time of maximum basin subsidence and synorogenic deposition related to<br />
maturation of the Appalachian-Ouachita thrust belts. Following a brief period of barrier bar development,<br />
thick clastic wedges prograded from source areas along the south margin. Abundant coal bed development in<br />
north-central portion of the basin.<br />
5) Permian-Cretaceous erosion/non-deposition ending with Late Cretaceous marine incursion and deposition<br />
into Early Tertiary shallow marine sediments (Mississippi Embayment).<br />
Figure 2 shows a regional cross section of Mississippian strata across northwestern Alabama. The Black Warrior<br />
basin was first downwarped in the Late Mississippian-Early Pennsylvanian and then subsequently filled by<br />
Pennsylvanian shallow marine and terrestrial clastic material shed from rising highlands along its southern margin.<br />
No Permian or early Mesozoic deposits exist in the basin. Indications are that the Black Warrior was uplifted above<br />
sea level in Latest Pennsylvanian-Early Mesozoic time (Petroleum Information Corp, 1986). Continental break-up<br />
during the Mesozoic resulted in the basin becoming downwarped to the southwest and eventually covered by the<br />
Mississippi Embayment marine transgressive episode (Mancini et al., 1983). Most of the basin and its thrust faulted<br />
margins are concealed beneath Tertiary and Cretaceous rocks of the Gulf coastal plain and the Mississippi<br />
embayment.<br />
1
HYDROCARBON PRODUCTION<br />
The Black Warrior Basin is very prolific; the Lewis and Carter sandstones (Mississippian Chester Group) are the<br />
most productive. The depth to productive horizons ranges from 2,500 to 5,000 ft. Target intervals are generally<br />
shallower in Alabama than in Mississippi. The Carter Sandstone and other Mississippian productive intervals extend<br />
into deeper basin regions (Bearden and Mancini, 1985). Remarkably high wildcat success rates (50% and more) and<br />
the shallow depths of the primary Late Paleozoic reservoir targets (less than 5,000 ft) keep exploration interest high.<br />
There are over 90 individual fields producing oil and gas from two principal productive trends. The northerly<br />
trend produces principally from stratigraphic traps. The southern trend produces from structural and combination<br />
traps. One of most prolific fields is the unitized North Blowhorn Creek oil field (Lamar County, Alabama),<br />
completed in the Carter Sandstone which accounts for nearly 80% of the total oil produced in the entire basin<br />
(Petroleum Information Corp., 1986).<br />
There are multiple gas and gas-condensate reservoirs within the Late Paleozoic clastic units. Eleven individual<br />
reservoirs exist in the Mississippian Chester Group. At least 4 clastic units within the Lower Pennsylvanian<br />
Pottsville Formation produce gas (Figure 3). The clastic units consist of a series of prograding deltaic environments–<br />
delta front, bar finger, and distributary channel sands–separated by transgressive shales. Considerable lateral<br />
variability occurs in the reservoirs, and porosities range from 5% to 17%; permeabilities range from .01 to 100 md.<br />
Thickness of individual reservoirs range from less than 10 ft to about 50 ft. The total sandstone thickness is less<br />
than 1,000 ft.<br />
In addition, the deeper Cambro-Ordovician to Devonian carbonate units also produce in certain locations. To date<br />
there have been over 40 deep structural tests (deeper than 10,000 feet) drilled on the Mississippi side of the basin.<br />
Many of these tests encountered significant gas shows from Mississippian and Pennsylvanian sandstone sections and<br />
from deeper Cambro-Ordovician, Silurian and Devonian rocks (Ericksen, 1993; Henderson, 1991). The lower<br />
sections need further exploration, as correlative zones to the west (Hunton and Ellenburger groups) are highly<br />
productive (Petroleum Information Corp., 1986; Duchscherer, 1972; Devery, 1983).<br />
Also, the Alabama part of the Black Warrior basin is one of the main centers of coalbed degasification in the<br />
U.S. Lower Pottsville rocks yield gas from depths of less than 2,700 ft, and estimated resources range from 20 to 35<br />
Tcf. To date the Oak Grove, Pleasant Grove, Brookwood, and Cedar Cove fields combined have yielded 0.9 Tcf.<br />
EVIDENCE FOR BASIN-CENTERED GAS<br />
Basin center gas potential exists in:<br />
a. thick clastic wedges off the carbonate platform, in western Alabama and eastern Mississippi, including the<br />
least-explored deeper depocenters in Mississippi.<br />
b. micritic and finely crystaline limestones and shale/siltstone intervals within Cambro-Ordovician formations.<br />
The basin covers about 1500 square miles. Gas shows are numerous and widespread throughout the basin. Major<br />
source rocks are fairly organic, amorphous and herbceous-prone pro-delta shales with interbedded sandstone. Available<br />
geochemical data (including total organic carbon (TOC) thermal alteration index) suggest the basin is mature and the<br />
Late Paleozoic shales should be mainly gas prone (Bearden and Mancini, 1985). Henderson (1991) considers the<br />
TOCs of the black shales within the Stone River Limestone (Ordovician) favorable for hydrocarbon generation.<br />
Pennsylvanian sands in southern Pickens County, Alabama, contain large volumes of in-situ gas; low gas recoveries<br />
indicate relatively low permeabilities (Ericksen, 1999) and low porosities (Champlin, 1999) of the rocks. Pressure<br />
gradients recorded to date are normal (Ericksen, 1999; Champlin, 1999).<br />
2
Province, Play and<br />
Accumulation Name:<br />
Geologic<br />
Characterization of<br />
Accumulation:<br />
KEY ACCUMULATION PARAMETERS<br />
Eastern U.S., Black Warrior Basin, Cambrian through Pennsylvanian<br />
a. Source/reservoir interval includes Mississippian Floyd shale to top of Pennsylvanian Pottsville<br />
Formation. Eleven reservoirs within the Chester group and at least 4 clastic<br />
units within the Lower Pennsylvanian Pottsville Group. Carter<br />
b. Total Organic Carbons<br />
(TOCs)<br />
sandstone and other Mississippian productive intervals have been extended<br />
into deeper basin regions.<br />
0.07%-2.36% (Upper Mississippian shales); 2.2% Stone River Limestone<br />
shales.<br />
c. Thermal maturity mixed including amorphous, herbaceous, woody and coaly material.<br />
Alteration state of the kerogen indicates the thermal history is favorable for<br />
hydrocarbon generation. Thermal Alteration Index ranging from 2 to 3+<br />
suggest the Upper Mississippian is primarily gas prone.<br />
d. Oil or gas prone both oil and gas prone<br />
e. Overall basin maturity considered mature along with adjoining basins in the southern U.S.<br />
f. Age and lithologies Cambrian through Lower Pennsylvanian: black shales of the Stone River<br />
Limestone (Ordovician); dark shales of the Conasauga Limestone<br />
(Cambrian); Chattanooga (Devonian/Mississippian), Floyd shale including<br />
Lewis sandstone; Packwood Formation including Carter sandstone and<br />
Pottsville Formation.<br />
g. Rock extent/quality basin wide source and reservoir rock distribution<br />
h. Potential reservoirs<br />
i. Major traps/seals interbedded Cambro-Ordovician shales; Floyd Shales and interbedded shales<br />
of the Packwood and Pottsville Formations<br />
j. Petroleum<br />
generation/migration<br />
models<br />
k. Depth ranges from 2500 ft in Alabama to over 10,000 ft in the deeper basin regions in<br />
Mississippi<br />
l. Pressure gradients
Production and Drilling<br />
Characteristics:<br />
Economic<br />
Characteristics:<br />
a. Important<br />
fields/reservoirs<br />
The Lewis and Carter intervals are the most highly productive, especially in<br />
the north-central part of the basin (Lamar and Fayette counties, Alabama and<br />
Monroe, Clay, and Lownders counties in Mississippi)<br />
Grove field Carter sandstone-67 Bcf; Coal Fire Creek Carter Sandstone-19<br />
Bcf, Lewis sandstone 6.9 Bcf, Fayette sandstone 2.5 Bcf; North Blowhorn<br />
Creek oil field Carter sandstone accounts for nearly 80% of the total oil<br />
produced in the entire basin (Petroleum Information, 1986), Carter sandstone<br />
11.4 Bcf, Millerella 10.5 Bcf; Sanders Ss one well (10,130-10,164 ft)-over<br />
12 Bcf in 10 years. Yellow Creek Devonian chert production;<br />
Fairview field Ordovician (Knox) dolomite-one well-1.8 MMcf monthly.<br />
b.Cumulative production cumulative production for Star field (Lamar county, Alabama) producing<br />
from a combination trap and numerous horizons:<br />
Producing Formation<br />
(gas sands) (10/98)<br />
a. High inert gas content<br />
Cumulative Oil<br />
(10/98)<br />
b.Recovery low in south Pickens County, Alabama<br />
c.Pipeline infrastructure very good There are numerous gas lines in the basin.<br />
d.Overmaturity none<br />
Cumulative Gas<br />
(10/98)<br />
Producing Wells<br />
Carter (Miss)...................... ............99,799............. .........19,218,189 .......... ................7<br />
Chandler (Penn)................... ............27,543............. .............226,233 .......... ................0<br />
Fayette (Penn)..................... ....................0............. ...............10,400 .......... ................1<br />
Lewis (Miss)...................... ............14,248............. .........13,146,529 .......... ................7<br />
Lower Nason (Penn)............. ................372............. .............757,692 .......... ................1<br />
Lower Millerella (Miss)........ ................797............. ..........1,264,601 .......... ................0<br />
Upper Nason (Penn)............. ................128............. .............187,983 .......... ................0<br />
Carter Oil (Miss)................. ............78,955............. .................6838.......... ................1<br />
Chandler Oil (Penn)............. ................865............. ......................0.......... ................0<br />
Total Cumulative Production...........222,707............. .........34,818,492 .......... ...............17
e.Basin maturity mature<br />
f.Sediment consolidation consolidation/porosity reduction occurs with depth of burial<br />
g. Porosity/completion<br />
problems<br />
h.Permeability 0.01 to 100 md<br />
i.Porosity 5-17%<br />
most wells are shallow and problem-free. Low porosity in south Pickens<br />
County, Alabama (Champlin,1999; Ericksen, 1999).
35°<br />
34°<br />
33°<br />
32°<br />
31°<br />
30°<br />
91°<br />
Arkansas<br />
Mississippi<br />
Louisiana<br />
Ouachita Fold and<br />
Thrust Belt<br />
Boundary of<br />
Black Warrior Basin<br />
90° 89° 88° 87° 86°<br />
Jackson<br />
Memphis<br />
Pennsylvanian rocks<br />
Area of basin-centered<br />
gas potential<br />
Thrust fault, teeth in<br />
upper plate<br />
Subcrop limit of<br />
Pennsylvanian<br />
strata<br />
Nashville Dome<br />
Outcrop limit of<br />
Pennsylvanian strata<br />
Appalachian Fold and Thrust Belt<br />
Birmingham<br />
Alabama<br />
Florida<br />
Tennessee<br />
Eastern limit of Tertiary and Cretaceous<br />
rocks of the Gulf coastal plain and<br />
Mississippi embayment<br />
0 100 mi<br />
Figure 1. Location map of Black Warrior Basin, Mississippi and Alabama. After Ryder (1994).
A A'<br />
Clastic rocks<br />
Carbonate rocks<br />
Undifferentiated<br />
sedimentary rocks<br />
Southwestern Floyd/Parkwood<br />
clastic facies<br />
Northeastern Pennington<br />
clastic facies<br />
Central Bangor/Monteagle facies<br />
Pre-Chesterian carbonate platform facies<br />
A<br />
East Warrior platform<br />
A'<br />
Black Warrior basin<br />
0 100 mi<br />
Figure 2. Regional cross section of northwestern Alabama showing lithofacies of Mississippian strata across East<br />
Warrior platform into Black Warrior basin. After Thomas (1972), and Bearden and Manconi (1985).
Era System Series Geologic Unit Lithology<br />
Paleozoic<br />
Pennsylvanian<br />
Lower<br />
? ? ? ?<br />
Mississippian<br />
Devonian<br />
Silurian<br />
Ordovician<br />
Cambrian<br />
Precambrian<br />
Upper<br />
Lower<br />
Upper &<br />
Middle<br />
? ? ?<br />
Middle<br />
Lower<br />
Upper<br />
Middle<br />
Lower<br />
Pottsville Formation<br />
Parkwood Formation<br />
Floyd Shale<br />
Coal gas<br />
"Nason sandstone"<br />
"Fayette sandstone"<br />
"Benton sandstone"<br />
"Robinson sandstone"<br />
"Chandler sandstone"<br />
"Coats sandstone"<br />
"Gilmer sandstone"<br />
"Millerella limestone"<br />
"Millerella sandstone"<br />
"Carter sandstone"<br />
Bangor Limestone<br />
Hartselle Sandstone<br />
"Evans sandstone"<br />
"Lewis limestone"<br />
"Lewis sandstone"<br />
Tuscumbia Limestone<br />
Fort Payne Chert<br />
Chattanooga Shale<br />
Unnamed<br />
cherty limestone<br />
Undifferentiated<br />
rocks<br />
Undifferentiated<br />
rocks<br />
Stones River<br />
Group<br />
Knox<br />
Group<br />
Ketona Dolomite<br />
Conasauga Formation<br />
Rome Formation<br />
Basement Complex<br />
West East<br />
Source<br />
Explanation<br />
Coal<br />
Shale or claystone<br />
Siltstone<br />
Shaly sandstone<br />
Sandstone<br />
Conglomeratic<br />
sandstone<br />
Limestone<br />
Oolitic limestone<br />
Cherty limestone<br />
Argillaceous limestone<br />
Dolomitic limestone<br />
Dolomite<br />
Undifferentiated<br />
igneous rocks<br />
Gas<br />
Oil and gas<br />
Figure 3. Generalized stratigraphic column for the Black Warrior basin, Alabama. After Geological Survey of<br />
Alabama (1986).
GEOLOGIC SETTING<br />
The interior basins of Alaska cover a broad area extending from the Canadian border on the east to the<br />
Bering Sea on the west. These basins occupy three geological provinces in central Alaska–Kandik, Alaska<br />
Interior, and Interior Lowlands–which collectively comprise the geographically defined Central Alaska<br />
Province (Figure 1). The Central Alaska Province covers about 300,000 square miles between the Brooks<br />
Range on the north and the Alaska Range on the south (Stanley, 1996).<br />
Central Alaskan geology is complex and varied, characterized by fold and thrust belts. Diverse crustal<br />
terranes formed along the ancestral North American cratonic margin, and structural deformation in this<br />
region is often severe (Magoon, 1993). Much of central Alaska experienced deformation in late Cretaceous<br />
to early Tertiary time (Stanley, 1996). The basins include areas of complexly deformed and locally<br />
metamorphosed flysch deposits underlying thick Cenozoic nonmarine sediments (Kirschner, 1988).<br />
1<br />
Three types of basins occur within the Central Alaska province(Magoon and Kirschner, 1990):<br />
1. segments of the Cordilleran fold and thrust belt. The Kandik province represents such a segment,<br />
and is characterized by thrust-faulted anticlines that largely affected clastic and carbonate reservoirs<br />
of Paleozoic to Tertiary age. The right-lateral Tintina fault truncates the province on the southwest<br />
(Magoon, 1993).<br />
2. Mesozoic flysch basins. The flysch belts and flysch terranes represent volcanic-plutonic arc-basin<br />
deposits (Magoon and Kirschner, 1990). The flysch belts of the Yukon-Koyukuk, Kuskokwim,<br />
and Bethel basins consist of deep marine turbidite sandstones and shales, shallow marine alluvial<br />
fans, and coal bearing deltaic and fluvial facies (Stanley, 1996).<br />
3. Cenozoic basins. These consist of undeformed to moderately deformed strata reflecting a distinctive<br />
gravity low (Magoon and Kirschner, 1990). They include a thick sequence of Tertiary and<br />
Quaternary rocks overlying Precambrian to Mesozoic igneous and metamorphic rocks (Stanley,<br />
1996).<br />
The stratigraphic section consists of a sequence of Precambrian rocks overlain by a succession of<br />
Paleozoic to Cenozoic sediments. Figure 2 illustrates the generalized stratigraphic nomenclature common<br />
across the Central Alaska province. The Kandik province contains the thickest stratigraphic section, with<br />
Proterozoic to Cenozoic rocks having a cumulative thickness greater than 40,000 feet (Hite, 1997). The<br />
Paleozoic section is approximately 15,000 feet thick. An unconformity at the top of the McCann Hill chert<br />
separates the Lower Paleozoic continental margin sediments from the overlying Upper Devonian to Permian<br />
foreland basin sequence (Hite, 1997). The Nenana and Middle Tenana basins of the Interior Lowlands<br />
province contain an assemblage of sedimentary rocks from the Middle and Lower Miocene to Pliocene<br />
Usibelli group, which nonconformably overlie Precambrian and Paleozoic rocks (Stanley et al., 1990). The<br />
Bethel and Yukon-Koyukuk basins of the Alaska Interior province contain thick, widely distributed<br />
Cretaceous strata, including a large volume of volcanic rocks. Basal andesitic rocks are overlain by about<br />
10,000 feet of graywacke and mudstones of lower Cretaceous Albian age (Patton, 1971).
HYDROCARBON POTENTIAL<br />
There is no known hydrocarbon production in the basins of central Alaska. Drilling is very sparse, but<br />
the few wells drilled have encountered numerous shows of oil and gas. Other similar regions in Alaska are<br />
richly productive. Exploration efforts began in the Central Alaska basins as a result of hydrocarbon<br />
discoveries on the North Slope. Cretaceous strata similar to those on the North Slope exist beneath alluvial<br />
lowlands. Operators drilled a 12,000 foot well near Nulato on the Yukon River, and a 15,000 foot hole in<br />
the Yukon-Kuskokwim basin. Neither wells had commercial shows (Patton, 1971).<br />
The sedimentary sequences in central Alaskan basins may provide favorable settings for basin-centered<br />
hydrocarbon accumulations. Reservoir rocks in the Tertiary basins of central Alaska may be similar to the<br />
reservoirs in the producing fields of the Cook Inlet-Beluga-Sterling play (Magoon and Kirschner, 1990).<br />
The Kandik and Middle Tanana basins appear to have the greatest hydrocarbon potential (Grether and<br />
Morgan, 1988). The Kandik and Yukon Flats basins may contain significant reserves of oil and gas within<br />
a 40,000 feet thick sedimentary package.<br />
Three exploratory wells have been drilled in the Kandik province. These wells encountered some<br />
porosity and bitumen in Devonian carbonates (DiBona and Kirschner, 1984). The Triassic Glenn Shale in<br />
the Kandik province is an organic equivalent to the Shublik Formation of the North Slope and may have<br />
generated as much as 1.5 billion barrels of oil per cubic mile of sediment (Hite, 1997). In the Middle<br />
Tanana basin, only two exploratory wells have been drilled–the Unocal Nanana No. 1, and the ARCO Totek<br />
Hills No. 1. Both wells penetrated a thick Tertiary coal-bearing section of the Usibelli Group and terminated<br />
in metamorphic basement (Smith, 1995). The ARCO Totek Hills well was drilled on the basin flank and<br />
passed through 3,015 feet of Tertiary rocks. The sandstones averaged 17% porosity and 11 md permeability.<br />
The claystones contained Type II kerogen and indicate some oil potential (Grether and Morgan, 1988).<br />
Smith (1995) suggests that Tertiary coals of the Yukon Flats, Nenana, and Middle Tanana basins provide<br />
opportunities for commercial gas production.<br />
2<br />
Three hypothetical petroleum systems occur in central Alaska (Stanley, 1996):<br />
1. Cenozoic gas play. This play includes organically rich source rocks and have a potential for<br />
nonassociated gas in undeformed to moderately deformed strata.<br />
2. Mesozoic gas play. This play lies within sequences of flysch deposits, particularly in the Yukon-<br />
Koyukuk and Kuskokwim basins where various authors have reported lateral facies changes from<br />
deep marine turbidites to deltaic and shallow marine sediments (Patton, 1971; Milson, 1989; and<br />
Box and Elder, 1992). These facies changes indicate possible stratigraphic traps and may contain a<br />
basin-centered gas accumulation. The Benedum Nulato Unit No. 1 well drilled in the Koyukuk<br />
basin penetrated gas-prone kerogens in the Cretaceous section (Stanley, 1996).<br />
3. Paleozoic oil play. This includes Ordovician, Silurian and Devonian graptolitic shales similar to<br />
ones found in basins elsewhere in North America, the Middle East and North Africa that contain<br />
oil-prone kerogen (Klemme and Ulmishek, 1991). These rocks may be potential sources for oil,<br />
and if heated sufficiently, a source for natural gas as well.
EVIDENCE FOR BASIN-CENTERED GAS<br />
In the Central Alaska basins, basin-centered hydrocarbon accumulations potentially exist within thick<br />
fluvial and lacustrine units: sandstones, conglomeratic sandstones, turbidites shales, siltstones and coals.<br />
Available source and maturation data (TOC, TAI, Ro, and Tmax) indicate that the basins are marginally<br />
mature to overmature. Available vitrinite reflectance and Tmax data indicate that late Cretaceous and Tertiary<br />
source rocks are thermally immature (Stanley, 1996).<br />
The Kandik and Middle Tanana basins appear to have the most potential for basin-centered gas<br />
accumulation potential. In the Middle Tanana basin, Stanley et al. 1990 estimate the top of the oil window<br />
(Ro = 0.6) occurs at depths exceeding 4,500 ft. Vitrinite reflectance values in the Kandik basin fall within<br />
the gas generation window (Figure 3). In the Middle Tanana basin, data from the ARCO Totek Hills No. 1<br />
well indicates the presence of Types II and III kerogen, indicating the Usibelli Group strata may be oil and<br />
gas-prone. Based on present information regarding thermal maturity, wells drilled in the deeper parts of the<br />
central Alaska basins may encounter strata buried below the top of the oil window, and therefore,<br />
potentially encounter basin-centered hydrocarbon accumulations.<br />
3
Province, Play and<br />
Accumulation Name:<br />
Geologic<br />
Characterization of<br />
Accumulation:<br />
KEY ACCUMULATION PARAMETERS<br />
Central Alaska, Interior basins, Paleozoic, Upper Triassic, and Tertiary<br />
potential basin-centered gas accumulation<br />
a. Source/reservoir Ford Lake shale, Calico Bluff, Glenn Shale (Devonian to Jurassic), Usibelli<br />
Group (Tertiary); Kerogen types: II, III, and IV. Reservoir: Nation River,<br />
Calico Bluff, shallow marine limestones of the Permian Tahkandit<br />
b.Total Organic Carbons<br />
(TOCs)<br />
Formation, unnamed sandstones of Cretaceous and Tertiary ages.<br />
Kandik basin: 7% (Glenn Shale); Holitna basin: 0.61 to 1.59% (Cretaceous<br />
Kuskokwim group); Middle Tanana basin: 3.6% (Sanctuary formation of<br />
Tertiary Usibelli group), outcrop: 0.5 to 3.5%.<br />
c.Thermal maturity Kandik basin: Tmax = 427-579°C, Ro = 0.8% (mean); Middle Tanana basin:<br />
Tmax = 414 to 434° C, Ro = 0.6% (below 4500 ft depth)<br />
d.Oil or gas prone primarily oil prone; however, level of maturity probably reaches the "gas<br />
window"<br />
e.Overall basin maturity marginally mature to overmature (similar to North Slope)<br />
f.Age and lithologies Early Cambrian to late Permian (sandstones, shales and carbonates), Upper<br />
Cretaceous to Tertiary (sandstones, conglomeratic sandstones, shales, coals<br />
and siltstones)<br />
g. Rock extent/quality basin wide source and reservoir rock distribution; highly variable rock<br />
quality is anticipated as exists on the North Slope, including problems with<br />
silica cementation, siderite cementation, calcite cementation, and swelling<br />
and moveable clays.<br />
h.Potential reservoirs no production exists; however, potential reservoirs include Proterozoic<br />
Tindir group; Paleozoic carbonates (including Devonian Nation River,<br />
Mississippian and Pennsylvanian Calico Bluff formation); shallow marine<br />
limestones of the Permian Tahkandit formation; Cretaceous Kandik group;<br />
Tertiary Usibelli group; and other unnamed sandstones of Cretaceous and<br />
Tertiary ages.<br />
i.Major traps/seals structural and stratigraphic, Devonian and Pennsylvanian argillites, shales,<br />
siltstones and mudstones of Cretaceous and Tertiary ages<br />
j.Petroleum<br />
generation/migration<br />
models<br />
Weimer's (1996) "Cooking Pot" model with current hydrocarbon generation<br />
and relatively short distance migration and Meissner's (1978) Bakken shale<br />
expulsion model<br />
k.Depth ranges surface to 40,000 ft, in some tertiary basins, top of the oil generation window<br />
may range from 5,000 to 10,000 ft, depending upon thermal gradients and<br />
vitrinite reflectance values<br />
l.Pressure gradients
Production and Drilling<br />
Characteristics:<br />
Economic<br />
Characteristics:<br />
a. Important<br />
fields/reservoirs<br />
b. Cumulative production<br />
a. High inert gas content<br />
b. Recovery<br />
c. Pipeline infrastructure non-existent, except for the trans-Alaska oil pipeline<br />
d. Overmaturity probably in the deep parts of the basins and in shallower areas near high<br />
heatflow pathways<br />
e. Basin maturity marginally immature on the flanks of basins where burial depths have been<br />
limited<br />
f. Sediment consolidation moderate or better consolidation<br />
g. Porosity/completion<br />
problems<br />
h. Permeability<br />
i. Porosity<br />
unknown due to no known completions
68°<br />
66°<br />
64°<br />
62°<br />
60°<br />
58°<br />
166° 162° 158° 154° 150° 146° 142°<br />
Seward Peninsula<br />
Nome<br />
Norton Sound<br />
Kuskokwim Bay<br />
3-mile<br />
limit<br />
Bethel<br />
basin<br />
Bethel<br />
Togiak<br />
Bristol Bay<br />
Yukon River<br />
Kobuk basin<br />
Galena<br />
Innoko basin<br />
Galena basin<br />
Kuskokwim<br />
River<br />
Kuskokwim Mountains<br />
Interior<br />
Lowlands<br />
Province<br />
Dillingham<br />
McGrath<br />
Alaska<br />
Interior<br />
Province<br />
Ruby-Rampart<br />
trough<br />
Minchumina<br />
basin<br />
Figure 1. Map showing various provinces and basins in central Alaska. After Magoon (1989).<br />
Cook<br />
Inlet<br />
Yukon River<br />
Yukon Flats<br />
basin<br />
Tanana River<br />
Nenana basin<br />
Susitna<br />
River<br />
Kandik<br />
Province<br />
Fairbanks<br />
Glenallen<br />
Anchorage<br />
Copper<br />
River<br />
Chitina River<br />
Copper River<br />
Basin<br />
Province<br />
Porcupine River<br />
Klondike River<br />
Northway<br />
lowlands<br />
Yukon Territory<br />
Copper<br />
River basin<br />
0 100 mi<br />
Alaska
System<br />
Tertiary Sandstone, mudstone,<br />
and conglomerate<br />
Cretaceous<br />
Jurassic<br />
Triassic<br />
Permian<br />
Pennsylvanian<br />
Mississippian<br />
Devonian<br />
Silurian<br />
Ordovician<br />
Cambrian<br />
Precambrian<br />
Kandik Province<br />
Glenn Shale<br />
Tahkandit Limestone<br />
Calico Bluff Formation<br />
Ford Lake Shale<br />
Nation River Formation<br />
McCann Hill Chert<br />
Road River Formation<br />
Hillard Limestone<br />
Adams Argillite<br />
Funnel Creek Limestone<br />
Tindir Group<br />
Interior Lowlands<br />
Province<br />
Nenana Gravel<br />
Usibelli Group<br />
Non-deposition or<br />
removal by erosion<br />
Birch Creek Schist<br />
Figure 2. Generalized stratigraphic column for Kandik and Interior Lowlands provinces, central Alaska. After Stanley,<br />
McLean, and Pawlewicz (1990), and Magoon (1993).
65° 30'<br />
65° 00'<br />
143° 142° 141°<br />
4.2<br />
Mardow Creek fault<br />
3.6<br />
3.3<br />
3.7<br />
Tintina fault<br />
1.9<br />
2.7, 3.5<br />
Kandik terrane<br />
1.9, 1.6<br />
2.1<br />
3.3, 3.5<br />
2.8<br />
Glenn Creek fault zone<br />
0.6, 0.9<br />
1.6<br />
1.7<br />
2.5, 2.9<br />
2.1<br />
0.7<br />
2.2, 1.8<br />
Step<br />
Mountain<br />
Tatonduk<br />
terrane<br />
0.7<br />
0.9<br />
Alaska<br />
0.8<br />
2.2 1.7<br />
Yukon Territory<br />
1.0<br />
2.1, 1.8<br />
1.2<br />
1.7, 1.8<br />
2.0<br />
Undifferentiated nonmarine<br />
cover sequences of Tertiary<br />
and Cretaceous age (TKs)<br />
Kathul graywacke (Kka),<br />
Cretaceous<br />
Undifferentiated rocks of<br />
Step Mountain outcrop<br />
Fault<br />
Anticline<br />
Syncline<br />
Sample location and vitrinite<br />
reflectance percentage<br />
0 10 mi<br />
Figure 3. Map of the Kandik province showing sample locations for and values of vitrinite reflectance (%Ro) relative to major geologic structures<br />
(Kathul Mountain syncline and Step Mountain anticline). After ?<br />
1.2
GEOLOGIC SETTING<br />
The Late Proterozoic Chuar Group extends north-south from southwestern Wyoming into northern Arizona.<br />
Figure 1 depicts a map of the regional extent and outcrop locations of the Chuar rocks. Exposures in the Grand<br />
Canyon reach a thickness of approximately 5,370 ft, and the rocks consist of organic-rich gray-black shale and<br />
siltstone interbedded with sandstones and cryptalgal and stromatolitic carbonates (Reynolds et al., 1988; Palacas,<br />
1992). The Chuar Group contains the lower Galeros Formation and the overlying Kwagunt Formation (Figure 2).<br />
The lithologies indicate various cyclical depositional environments, including a sediment-starved basin rich in<br />
organic material, coastal and alluvial plains, paludal swamp, and nearshore aqueous. Deposition of the Chuar Group<br />
occurred on a marine embayment on the passive edge of a continent (Reynolds et al., 1988).<br />
HYDROCARBON PRODUCTION<br />
There have been some exploratory penetrations in the Chuar, but no production. Shows and tests of this section<br />
are rare. Geochemical analyses of outcrop samples from the Walcott Member of the Kwagunt Formation indicate<br />
good to excellent source-rock potential and thermal maturity for oil generation. Tmax values range from 424 to 452<br />
°C. Total organic carbon values (TOCs) average ~ 3.0 %, with highs ranging from 8.0 to 10.0 %. Samples from the<br />
upper part of the Walcott yielded higher values than those from the lower part (Palacas, 1992). The underlying<br />
Galeros Formation shows lower TOC values and appears thermally overmature, but still might be within the<br />
window for gas generation.<br />
EVIDENCE FOR BASIN-CENTERED GAS<br />
The Walcott Member demonstrates good source-rock potential and may contain sandstones with good reservoir<br />
quality. Stratigraphic and conventional structural prospects may exist if the source rock is continuous.<br />
1
Province, Play and<br />
Accumulation Name:<br />
Geologic<br />
Characterization of<br />
Accumulation:<br />
KEY ACCUMULATION PARAMETERS<br />
Grand Canyon area, Late Proterozoic, Chuar Group, Kwagunt and Galeros<br />
Formations<br />
a. Source/reservoir the Walcott Member may be a source rock; interbedded sandstones may be<br />
reservoirs.<br />
b. Total Organic Carbons<br />
(TOCs)<br />
range from 1.0 % to 10.0% (average ~ 3.0%) in outcrop samples of the<br />
Kwagunt Formation. The values for the Galeros Formation are not<br />
available.<br />
c. Thermal maturity Tmax values in the Walcott Member of the Kwagunt Formation range from<br />
424 to 452° C<br />
d. Oil or gas prone the Walcott Member is oil prone. The lower portions of<br />
the Kwagunt Formation and the Galeros Formation are gas-prone.<br />
e. Overall basin maturity because of the virtually untested<br />
nature of the deposit, it is immature<br />
f. Age and lithologies<br />
g. Rock extent/quality<br />
h. Potential reservoirs<br />
i. Major traps/seals<br />
j. Petroleum<br />
generation/migration<br />
models<br />
k. Depth ranges<br />
l. Pressure gradients
Production and Drilling<br />
Characteristics:<br />
Economic<br />
Characteristics:<br />
a. Important<br />
fields/reservoirs<br />
b. Cumulative production<br />
a. High inert gas content<br />
b. Recovery<br />
c. Pipeline infrastructure<br />
d. Overmaturity<br />
e. Basin maturity<br />
f. Sediment consolidation<br />
g. Porosity/completion<br />
problems<br />
h. Permeability<br />
i. Porosity
36° 30'<br />
36° 00'<br />
Arizona<br />
Extent of Chuar Group<br />
or equivalent<br />
Outcrop of Chuar Group<br />
or equivalent<br />
Well penetrating<br />
Chuar Group or equivalent<br />
Grand Canyon<br />
Kaibab Plateau<br />
0 10 mi<br />
Chuar outcrop<br />
Colorado Rive r<br />
112° 30' 112° 00'<br />
Utah<br />
Arizona<br />
Figure 1. Map showing regional extent and outcrops of Chuar Group rocks in Utah and Arizona. After Palacas (1992).
GEOLOGIC SETTING<br />
The Columbia Basin is located in south-central to southwestern Washington, northeastern Oregon, and<br />
western Idaho (Figure 1). Johnson et al. (1993) defined the basin as a broad low-lying area between the<br />
Cascade Range to the west, the Rocky Mountains to the east, the Okanogan highlands to the north, the<br />
Blue Mountains to the south, the western end of the Yakima fold belt, and the eastern limit of the Palouse<br />
slope.<br />
Within the Columbia Basin, Johnson et al. (1997) postulated a basin-centered gas deposit bounded by<br />
the Chumstick basin and Swauk basin to the northwest, the easterly apron of the Cascade Range and a<br />
projection of the Straight Creek fault zone on the west and southwest, on the south by the Columbia River<br />
and margins of the Blue Mountains, on the east and northeast by the projection of the Entiat fault (Figure<br />
2).<br />
The sedimentary rocks in the basin are covered by up to 20,000 ft of Miocene basalt that originated<br />
from dike systems near the Washington-Oregon-Idaho border area approximately 6.5 to 16.5 ma (Figure 3)<br />
(Johnson et al., 1997). Mesozoic sediments underlie the basalts. Rocks associated with subduction<br />
complexes, volcanic island arcs, and ophiolites and other sedimentary packages indicate a complex history<br />
of accretion of allochthonous terranes and arc tectonism. Sediments crop out along the northern, eastern, and<br />
southern margins of the basalt plateau and probably underlie the entire plateau.<br />
Development of the Idaho Batholith in Cretaceous time and unconformable deposition of marine<br />
sediments marked the end of accretionary deposition. This was followed by deposition of early Tertiary<br />
nonmarine sedimentary and volcanic rocks. Tectonic activity included volcanism and transtension in<br />
northeastern Washington, strike-slip faulting and folding in central and western Washington, and prolific<br />
volcanism in central Oregon. Paleocene to Eocene arkoses, mudstones and coals were deposited, varying in<br />
thickness from a few hundred feet to more than 20,000 ft Sparse exploratory drilling and magnetotelluric<br />
data suggest that an average 5,000 to 10,000 ft of sedimentary rocks exist below the basalts in central<br />
Washington (Tennyson, 1996).<br />
The western margin of the Columbia plateau contains Oligocene to Quaternary volcanic rocks of the<br />
Cascade arc complex. Deformation of the basalts occurred with folding and reverse faulting in the western<br />
part of the plateau (Tennyson, 1996).<br />
HYDROCARBON PRODUCTION<br />
The Rattlesnake Hills field is the only commercial gas field producing in the Columbia Basin. The<br />
field was discovered in 1913 and developed in 1930, and produced approximately 1.3 BCFG through 1941<br />
from depths ranging between 700 ft and 1300 ft. The gas was mostly methane and 10% carbon dioxide. A<br />
faulted anticlinal structure trapped the gas in a vesicular basaltic zone thought to be clay sealed. Johnson et<br />
al. (1993) believe the gas migrated from Eocene coals buried below the basalts.<br />
EVIDENCE FOR BASIN-CENTERED GAS<br />
Tests in deep wells in the Yakima-Pasco area yielded gas at depths ranging from 8,300 to 12,700 ft.<br />
Lingley (1995) estimated pressure gradients of 0.42 psi/ft to 0.45 psi/ft at 5,000 to 10,000 feet and 0.62<br />
psi/ft at 14,000 ft depth, indicating moderate overpressures in the deep part of the basin. Johnson et al.<br />
(1997) note most drill-stem tests recovered water-free gas, but some did recover water.<br />
Source rocks for this accumulation may be Eocene coals and carbonaceous shales interbedded with<br />
arkosic fluvial sandstones. Eocene sediments may reach a depth of 17,000 ft in the center of the basin.
Province, Play and<br />
Accumulation Name:<br />
Geologic<br />
Characterization of<br />
Accumulation:<br />
KEY ACCUMULATION PARAMETERS<br />
Eastern Oregon-Washington Province, Columbia Plateau/Basin, basincentered<br />
gas play<br />
a. Source/reservoir Eocene Swauk, Chumstick, Roslyn, and Manatash formations<br />
b.Total Organic Carbons<br />
(TOCs)<br />
c.Thermal maturity Ro 0.5 – 1.43<br />
values range from 0 to 17%<br />
d.Oil or gas prone gas prone; mostly type III kerogens with limited type II kerogen<br />
e.Overall basin maturity maturation levels are moderate, maturation levels increase west of the basin<br />
toward the crest of the Cascade mountains<br />
f.Age and lithologies Eocene, arkosic sands, coals, and shales<br />
g. Rock extent/quality wide source and reservoir rock distribution, rock quality is unknown except<br />
around basin margins and in the few wells that have been drilled. Expected<br />
reservoir quality is variable depending upon clay content, zeolite alteration<br />
and interbedded shales and coals.<br />
h.Potential reservoirs none presently; Rattlesnake Hills gas field produced 1.3 BCFG from 1930 to<br />
1941 from the Miocene age Columbia River Basalt Group. Vertical<br />
migration of gas from Eocene source rocks buried below the basalt flows.<br />
i.Major traps/seals interbedded Eocene age shales and coals<br />
j.Petroleum<br />
generation/migration<br />
models<br />
both in-situ generation and long distance migration of gases shales and coals.<br />
Hydrocarbon generation is probably ongoing at depths below 12,000 feet.<br />
Geothermal gradients range from 28 to 58 degrees centigrade per kilometer<br />
(Lingley, 1995). Weimer’s (1996) Denver basin cooking pot model might<br />
apply.<br />
k.Depth ranges accumulation depths are thought to range from 8300 feet to 17,000 feet<br />
l.Pressure gradients range from estimated 0.42 psi/ft at 5,000 ft depth to 0.45 psi/ft at 10,000 ft to<br />
0.62 psi/ft at 14,000 ft. This conflicts with Johnson et al. (1997) which<br />
reported overpressuring occurring at depths of 8,300 ft to 12,700 ft.
Production and Drilling<br />
Characteristics:<br />
Economic<br />
Characteristics:<br />
a. Important<br />
fields/reservoirs<br />
Rattlesnake Hills gas field<br />
b.Cumulative production only production to date was from 1930-1941. Rattlesnake Hills field<br />
produced 1.3 BCFG from Miocene age basalts<br />
a. High inert gas content gases from the Rattlesnake Hills field were reported to contain 10% nitrogen<br />
by Wagner (1966); Hammer (1934) reported 2.45% nitrogen and 0.15%<br />
carbon dioxide<br />
b.Recovery recoveries may vary depending upon permeability, porosity and depth;<br />
diagenetic alteration may increase with depth<br />
c.Pipeline infrastructure poor<br />
d.Overmaturity possibly overmature in the deepest parts of the basin<br />
e.Basin maturity most of the basin is mature (Ro range from 0.5 to 1.43)<br />
f.Sediment consolidation most rocks are well indurated<br />
g. Porosity/completion<br />
problems<br />
shales, clay and mica rich arcosic sands have high alteration potential, may<br />
have swelling clays and will produce migrating fines problems, average<br />
porosities range from 6 to 15 percent. Shales and coals are interbedded with<br />
sands. Zeolite and chlorite alteration has been reported.<br />
h.Permeability outcrop measurements range from 0.02 to 0.8 md<br />
i.Porosity
123° 120° 117°<br />
Western Washington-<br />
Bellingham Basin play<br />
Western Washington-<br />
Western Cascade Mountains play<br />
Western Washington-<br />
Southern Puget Lowlands play<br />
Figure 1. Map of Washington showing locations of unconventional petroleum plays. After Johnson et al. (1997)<br />
Columbia Basin-<br />
Basin-Centered Gas play<br />
0 50 mi<br />
49°<br />
47°
47°<br />
46°<br />
121° 120° 119°<br />
BN 23-35<br />
12,584<br />
YM 1-33<br />
16,199<br />
Quaternary deposits<br />
Columbia River<br />
Basalt Group<br />
Yakima River<br />
Oligocene and Miocene<br />
volcanic and plutonic rocks<br />
Eocene volcanic rocks<br />
Eocene sedimentary rocks<br />
Pre-Tertiary rocks<br />
1-29 Bissa<br />
14,965<br />
Colu mbia River<br />
RSH-1<br />
10,655<br />
Quincy<br />
13,190<br />
BN 1-9<br />
17,518<br />
RHGF<br />
Columbia River<br />
0 25 mi<br />
RSH-1<br />
10,655<br />
Fold<br />
Monocline<br />
Fault<br />
Darcell 1-10<br />
8,556<br />
Snake Rive r<br />
Play Boundary<br />
Exploration well,<br />
with name and depth<br />
Figure 2. Geologic map of Columbia Basin, showing locations of basin-centered gas play and exloration wells.<br />
After Johnson et al. (1997).
Years Ma (millions ago)<br />
0<br />
10<br />
20<br />
30<br />
40<br />
50<br />
60<br />
Epoch<br />
Pleistocene<br />
Pliocene<br />
Miocene<br />
Oligocene<br />
Eocene<br />
Paleocene<br />
Northwest Columbia Plateau<br />
local non-marine deposits<br />
Columbia River<br />
Basalt Group<br />
Roslyn<br />
Formation<br />
Teanaway Fm<br />
Swauk<br />
Formation<br />
?<br />
Wenatchee Formation<br />
Ellensburg<br />
Formation<br />
Chumstick<br />
Formation<br />
Figure 3. Stratigraphic column for Columbia Basin petroleum-play area. Shaded intervals indicate occurances of<br />
erosion or no deposition. After Tabor et al (1982, 1984), Taylor et al (1988), Evans and Johnson (1989),<br />
and Johnson et al (1997).<br />
?<br />
?
GEOLOGIC SETTING<br />
The Cook Inlet basin is a narrow elongate trough of Mesozoic and Tertiary sediments, covering<br />
approximately 11,000 square miles in south-central Alaska (Figure 1). The basin trends NNE-SSW and is<br />
bounded on the northwest by granitic batholiths of the Alaska-Aleutian range and the Talkeetna mountains,<br />
and on the southeast by the Chugach terrane that makes up the Kenai Mountains (Magoon, 1994). The<br />
Kenai mountains, Castle mountain, and the Bruin Bay fault zones are the major boundary features (Boss et<br />
al., 1975). The Outer Continent Shelf area lies between these faults and contains anticlinal structures and<br />
faults that may be potential traps for hydrocarbons (Magoon, 1976).<br />
Dickinson (1971) described the basin as a trench-arc gap type: a Cenozoic residual forearc basin in a<br />
convergent continental margin along the northwest Pacific Rim. Cook Inlet basin development began as a<br />
backarc basin during the Jurassic, evolving to a forearc basin in the Cenozoic (Magoon, 1994). Numerous<br />
high angle reverse faults indicate compression throughout the Mesozoic and Cenozoic.<br />
Kelly and Halbouty (1966) estimated the maximum sediment thickness in the deepest part of the basin<br />
to be 40,000 ft. Cook Inlet sediments range in age from Upper Triassic to Recent, but consist mostly of<br />
Upper Jurassic and Tertiary rocks (Figure 2). The Middle and Upper Jurassic units are thick, but a<br />
significant mid-Cretaceous unconformity has removed the Lower Cretaceous section. Boss et al. (1975)<br />
considered the Lower Jurassic volcanic rocks to be the economic "basement.”<br />
During the Tertiary uplift and erosion occurred continuously until termination by a widespread Late<br />
Pliocene-Pleistocene orogeny. The Tertiary section is part of the Kenai Group, which is separated from the<br />
West Foreland Formation (Eocene) by a thin but widespread unconformity marked by a basal conglomerate.<br />
The Kenai Group consists of three formations: Tyonek, Beluga, and Sterling. The Tyonek Formation<br />
includes the Hemlock Sandstone Member.<br />
HYDROCARBON PRODUCTION<br />
The most significant hydrocarbon production in the Cook Inlet basin occurs in Tertiary rocks which<br />
reach a maximum thickness of 25,000 ft in the deepest part of the basin (Smith, 1995). These rocks consist<br />
of a thick sequence of alluvial deposits. Of the total oil produced to 1994, Magoon (1994) noted that 80%<br />
originated from the Hemlock Conglomerate, 20% from the Lower Tyonek, and minor amounts from the<br />
West Foreland Formation. Discovered resources exceed 1.2 BBO. Unassociated natural gas occurs in<br />
shallower younger reservoirs and accounts for most of the Cook Inlet gas production (Magoon and Kirchner,<br />
1990). This gas is found in the Beluga and Sterling formations, may be biogenic, and primarily originates<br />
from Tertiary coals (Molenaar, 1996). Only minor amounts of oil have been produced from Mesozoic rocks.<br />
The Middle Chuitna Formation in the upper Cook Inlet and the Upper Triassic-Middle Jurassic rocks in the<br />
lower Cook Inlet are the source rocks for oil. Siltstones and claystones associated with coals compose the<br />
seals.<br />
1<br />
Bird (1996) identified three petroleum systems in the Cook Inlet<br />
1. Hemlock-Tyonek oil play.<br />
2. Beluga-Sterling gas play.<br />
3. Late Mesozoic oil plays. This play includes Lower Jurassic to Upper Cretaceous rocks. This<br />
interval appears to be the only stratigraphic section capable of supporting a basin-centered gas play<br />
in the Cook Inlet basin.
To date, production in the Late Mesozoic play has been marginal because of poor reservoir-quality<br />
rocks. Limited production has occurred from marine and turbidite sandstones within the Upper Cretaceous<br />
Matanuska and Kaguyak Formations, Lower Cretaceous sandstones, and the Upper Jurassic Naknek<br />
Formation. Lateral permeability barriers within siltstones seal these reservoirs and the reservoirs in the<br />
unconformably overlying Lower Tertiary West Foreland Formation. However, most of these fields are<br />
faulted anticlinal structures truncated by overlying Tertiary rocks. Oil was generated during Eocene and<br />
Pliocene periods (Magoon et al., 1996).<br />
The Tertiary section (Beluga-Sterling gas play and Tyonek/Paleocene Chickaloon coals) in the upper<br />
Cook Inlet include coals as source rocks within an area described by Molenaar (1996) as thermally<br />
immature. This area contains gas fields having localized sources. In contrast, Smith (1995) reported carbon<br />
isotope analyses of gas from coals in the Tyonek Formation that indicated both biogenic and thermogenic<br />
origins. The reported gas volumes from coals ranged from 63 scf/ton at 521 ft in depth to 245 scf/ton at<br />
1,236 ft in depth.<br />
EVIDENCE FOR BASIN-CENTERED GAS<br />
Although few holes were drilled in the central trough of the Cook Inlet, limited data (mostly from the<br />
COST No. 1 well shown in Figure 1) indicates a significant increase in thermal maturity to Ro = 0.87 in<br />
the lower part of the Middle Jurassic Naknek Formation. Thermal maturity of Middle Jurassic source rocks<br />
ranges from immature to mature on the flanks of the basin and postmature in the deepest part of the basin<br />
(Magoon, 1994). However, conflicting interpretations place the oil window (Ro = 0.6) at disparate depths:<br />
Magoon (1994) projects the depth at 21,000 ft in the vicinity of the Swanson River oil field (Figure 3),<br />
whereas Johnsson et al. (1993) place the oil window at about 16,400 ft depth (Figure 4). This difference<br />
dramatically changes the basin area that may be thermally mature.<br />
Frequent hydrocarbon shows occur within the Middle Jurassic interval. Significant variations in<br />
pressure gradients occur within the current oil and gas producing fields and flank the area of the potential<br />
basin-centered accumulation. Although this does not directly indicate pressure seals occur in the central<br />
trough of the Cook Inlet, the data suggests that lateral permeability barriers do exist within the<br />
conventionally trapped hydrocarbon accumulations. Source rocks within the Middle Jurassic Tuxedni Group<br />
indicate adequate but somewhat limited source potential (TOC content of 0.8 to 2.1 weight %). A normal<br />
geothermal gradient of 12.5 °F per 1000 ft (in the COST No. 1 well) also appears to lessen the possibility<br />
of a basin-centered accumulation at shallow depths.<br />
Depending on the oil generation window interpretation, basin-centered gas accumulations in the Cook<br />
Inlet may potentially range in depth from less than 3,280-19,685 ft for the upper limit, to 41,891 ft for the<br />
floor.<br />
2
Province, Play and<br />
Accumulation Name:<br />
Geologic<br />
Characterization of<br />
Accumulation:<br />
KEY ACCUMULATION PARAMETERS<br />
Southern Alaska, Cook Inlet basin, lower Jurassic to upper Cretaceous<br />
overpressure<br />
a. Source/reservoir Middle Jurassic Tuxedni group, Reservoirs - Lower Jurassic Talkeetna fm,<br />
Middle Jurassic Tuxedni group, Upper Jurassic Naknek formation, and<br />
Upper Cretaceous Matanuska formation<br />
b. Total Organic Carbons<br />
(TOCs)<br />
0.8-2.1 weight% (Middle Jurassic Tuxedni group)<br />
c. Thermal maturity Tmax from lower part of Naknek formation in the Cost #1 well is<br />
approximately 483° C; Ro maximum is approximately 0.87%<br />
d. Oil or gas prone both oil and gas prone<br />
e. Overall basin maturity immature to mature, anticipated to be postmature in the deepest part of the<br />
basin<br />
f. Age and lithologies Lower Jurassic Talkeetna formation (massive volcanic conglomerates, tuffs<br />
and sandstones), Middle Jurassic Tuxedni group (marine sandstone,<br />
conglomerates, siltstones and shales), Upper Jurassic Naknek formation<br />
(shallow marine fine grained, cross-bedded sandstone) Upper Cretaceous<br />
Matanuska formation (shallow marine turbidite sandstones).<br />
g. Rock extent/quality marginal basin wide source and variable reservoir rock distribution<br />
h. Potential reservoirs Talkeetna formation, Tuxedni group, Naknek formation and Matanuska<br />
formation<br />
i. Major traps/seals Tuxedni group<br />
j. Petroleum<br />
generation/migration<br />
models<br />
Weimer's "Cooking Pot" model with current hydrocarbon generation and<br />
relatively short distance migration<br />
k. Depth ranges 3,280 to 41,900 ft (6 to11 km)<br />
l. Pressure gradients Granite Point field (Tyonek formation) 0.476 to 0.503 psi; McArthur River<br />
field (Hemlock formation) 0.399 to 0.454 psi; Middle Ground Shoal field<br />
(Tyonek formation) 0.263 psi, (Hemlock formation) 0.488 psi; Swanson<br />
River field (Hemlock formation) 0.504 to 0.518 psi; Trading Bay field<br />
(Tyonek formation) 0.487 psi, (Hemlock formation) 0.261 psi.
Production and Drilling<br />
Characteristics:<br />
Economic<br />
Characteristics:<br />
a. Important<br />
fields/reservoirs<br />
b. Cumulative production<br />
a. High inert gas content<br />
b. Recovery<br />
c. Pipeline infrastructure good<br />
only marginal production occurs within the Upper Jurassic Naknek to Upper<br />
Cretaceous Matanuska formations.<br />
d. Overmaturity probably in the deep part of the basin<br />
e. Basin maturity immature on flanks of the basin<br />
f. Sediment consolidation good to moderate consolidation<br />
g. Porosity/completion<br />
problems<br />
low porosity because of probable clays and migrating fines<br />
h. Permeability not available, but expected to be highly variable<br />
i. Porosity highly variable
62°<br />
60°<br />
58°<br />
Bruin Bay Fault<br />
Aleutian Range<br />
Alaskan Peninsula<br />
Mt. Douglas<br />
Mt. Iliamno<br />
Mt. Augustine<br />
Augustine<br />
Island<br />
Cape<br />
Douglas<br />
Shelikof Strait<br />
Mt. Redoubt<br />
Iniskin<br />
Peninsula<br />
Cost #1<br />
Barren<br />
Island<br />
Mt. Spurr<br />
A<br />
Basin-centered<br />
Gas Accumulation<br />
Afognak<br />
Island<br />
Homer<br />
Tyonek<br />
C<br />
D<br />
6<br />
E B<br />
F<br />
Kenai<br />
Kenai<br />
1<br />
7<br />
Peninsula<br />
Castle Mountain Fault<br />
Border Ranges Fault<br />
Gulf of Alaska<br />
Girdwood<br />
Seward<br />
Cook Inlet<br />
154° 152° 150° 148°<br />
Oil field Volcano<br />
Gas field<br />
Well<br />
12<br />
2<br />
4<br />
8<br />
5<br />
9<br />
11<br />
10<br />
A<br />
3<br />
A'<br />
Anchorage<br />
Fault, dashed where approximate,<br />
dotted where inferred or hidden<br />
Anticline, dashed where approximate<br />
Figure 1. Location map of Cook Inlet, Alaska. Modified from Magoon (1976, 1994).<br />
0 50 mi
System<br />
Quaternary<br />
Tertiary<br />
Cretaceous<br />
Jurassic<br />
Series<br />
Recent<br />
Pleistocene<br />
Pliocene<br />
Miocene<br />
Oligocene<br />
Eocene<br />
Upper<br />
Lower<br />
Upper<br />
Middle<br />
Lower<br />
Coal<br />
Formation<br />
(thickness)<br />
Alluvium<br />
Glacial<br />
Chuitna Member<br />
(1300-2600 ft)<br />
Middle Ground<br />
Shoal Member<br />
(2600-4900 ft)<br />
Shale or claystone<br />
Siltstone<br />
Sterling Formation<br />
(0-11,150 ft)<br />
Beluga Formation<br />
(0-5900 ft)<br />
Unnamed<br />
(0-1800 ft)<br />
Tuxedni Group<br />
(0-9800 ft)<br />
Tyonek Formation<br />
Hemlock Cgl (330-1000 ft)<br />
West Forland Formation<br />
(300-1300 ft)<br />
Mantanuska Formation<br />
(0-8500 ft)<br />
Naknek Formation<br />
(0-6900 ft)<br />
Chinitna Fm (0-2300 ft)<br />
Talkeetna Formation<br />
(0-8500 ft)<br />
Lithology<br />
Production<br />
Field Source Rock<br />
Depositional<br />
Environment<br />
Oil Gas Oil Gas<br />
B, D, E,<br />
F<br />
A, B, C,<br />
D, E, F<br />
E<br />
Sandstone<br />
Conglomerate<br />
Volcanic rock<br />
1, 2, 3,<br />
5, 7, 8,<br />
9<br />
1, 2, 8,<br />
9<br />
11<br />
4, 6,<br />
10, 12<br />
Nonmarine<br />
Figure 2. Generalized stratigraphic column for Cook Inlet, Alaska, showing producing intervals, oil and gas fields<br />
(noted on location map), source rock intervals, and depositional environment. After Magoon (1994).<br />
Marine<br />
Gas<br />
Oil
Sea Level<br />
Depth (in feet)<br />
1<br />
2<br />
3<br />
4<br />
5<br />
6<br />
7<br />
A A'<br />
Geographic Extent<br />
Trading Bay Field<br />
(projected)<br />
McArthur<br />
Swanson<br />
River Field Middle Ground<br />
River Field<br />
Coast Line Shoal Field<br />
Coast Line Kenai Lowlands<br />
Oil accumulation<br />
Beluga and Sterling<br />
Formations<br />
Hemlock Conglomerate<br />
and Tyonek Formation<br />
Stratigraphic Extent<br />
Matanuska Formation<br />
Naknek Formation<br />
and unnamed rocks<br />
Tuxedni Group<br />
Source Rock<br />
Talkeetna Formation<br />
Mesozoic intrusive rocks<br />
Oil field location<br />
0 20 mi<br />
Fault<br />
Top oil window<br />
(0.6% R o)<br />
Top gas window<br />
(1.3% R o)<br />
Figure 3. Cross section A-A' of Cook Inlet, Alaska, showing the geographic (horizontal) and stratigraphic (vertical) extent of the Tuxedni-Hemlock<br />
petroleum system. After Boss et al. (1976), Plafker et al. (1982), and Magoon (1994).
62°<br />
60°<br />
58°<br />
B r u i n Bay fault<br />
Mt. Iliamna<br />
Augustine<br />
Island<br />
Mt.<br />
Redoubt<br />
Mt. Spurr<br />
A<br />
L a k e Clark - C astle M ountain fau lt<br />
Seldovia arch<br />
Border Ran ges fault<br />
Matanuska Valley<br />
154° 152° 150° 148°<br />
Volcano<br />
Well<br />
1000 2000<br />
3000<br />
4000<br />
4000<br />
Contour interval = 1000 feet<br />
5000<br />
Figure 4. Contour map of the top of the paleo-oil generation window (%Ro = 0.6) in the Cook Inlet basin, Alaska.<br />
Elevation contours in feet below mean sea level. After Johnson, Howell and Bird (1993).<br />
3000<br />
4000<br />
3000<br />
A'<br />
2000<br />
Anchorage<br />
0 50 mi<br />
Anticline Contour,<br />
dashed where<br />
approximate<br />
Fault
GEOLOGIC SETTING<br />
The Denver basin is an asymmetric crustal downwarp located mainly in eastern Colorado, western<br />
Nebraska and southeastern Wyoming. It is surrounded by the Rocky Mountain Front Range on the west,<br />
the Laramie Range to the northwest, the Hartville Uplift to the north, the Chadron Arch and Cambridge<br />
Arch to the northeast, the Yuma Uplift to the east, the Los Animas Arch to the southeast, the Apishapa<br />
Uplift to the south and the Wet Mountains Uplift to the southwest (Bookout, 1980). The basin axis runs<br />
roughly north-southfrom Cheyenne, Wyoming to Denver, Colorado (about 320 miles), and the basin width<br />
extends about 180 miles (Figure 1).<br />
The basin’s sedimentary section reaches a maximum thickness of 13,000 ft along the axial trend<br />
(Clayton and Swetland, 1977), and consists mostly of Cretaceous, Permian and Pennsylvanian rocks<br />
(Figure 3).<br />
With the onset of the Laramide Orogeny in the Late Cretaceous, the ancestral Denver basin accumulated<br />
sediments that thickened westward (Figure 4). Deposition began with the Upper Cretaceous Fox Hills<br />
sandstone and continued through the Miocene (McCoy, 1953).<br />
The present-day Denver basin has undergone a full cycle of tectonic evolution since the Cambrian:<br />
Early Paleozoic troughs became Late Paleozoic mountain ranges, and Early Paleozoic highs subsided into<br />
lows. Late Paleozoic troughs were uplifted into post-Cretaceous mountain ranges, and Late Paleozoic<br />
mountain ranges subsided into Tertiary and Recent plateaus and low relief basins (McCoy, 1953).<br />
HYDROCARBON PRODUCTION<br />
Cretaceous rocks are the primary strata producing petroleum (Figure 3). This interval consists mostly<br />
of deltaic and marine detrital rocks. Although oil and gas originate from a number of Cretaceous reservoirs,<br />
the Lower Cretaceous "D" and "J" sandstones account for more then 90% of the total oil and gas production<br />
of the basin" (Clayton and Swetland, 1977).<br />
The most significant hydrocarbon production in the Denver basin occurs in the Wattenberg field, where<br />
the "J" Sandstone is the dominant producing horizon (Figure 1). As of June 1998, cumulative production<br />
from the Wattenberg field was 1.5 trillion cubic feet of gas (TCFG), 67 million barrels of oil (MMBO), and<br />
13.3 million barrels of water (MMBW) at average depths of 7,600 ft for the "J" Sandstone and 5,100 ft for<br />
the Hygiene Sandstone (Petroleum Information Corp., 1998).<br />
Limited oil production occurs above the "D" and "J" in the Graneros Shale, the Greenhorn Limestone,<br />
and the Codell Sandstone. Two members of the overlying Niobrara Formation yield oil–the Fort Hays and<br />
the Smoky Hill members. The fractured Niobrara strata produced significant quantities of hydrocarbons from<br />
the Berthoud field (765 MBO and 1.85 BCFG; 4.3 MBW) and the Silo field in southeastern Wyoming (8.5<br />
MMBO and 6.8 BCFG; 3.7 MMBW) (Petroleum Information Corp., 1998).<br />
Figure 2 shows the locations of Niobrara gas fields. Beecher Island field (1,700 ft deep, cumulative<br />
production 39.6 BCFG between 1974 and 1998) and Goodland field (900 ft deep) represent shallow Niobrara<br />
biogenic gas fields in eastern Colorado and western Kansas (Figure 2). Oil production from the Niobrara is<br />
limited to the west flank of the basin along the Colorado and Wyoming eastern mountain front (Clayton<br />
and Swetland, 1977).<br />
1
EVIDENCE FOR BASIN-CENTERED GAS<br />
Field data supports the existence of a basin-centered hydrocarbon accumulation in the Denver basin.<br />
Widespread hydrocarbon shows occur within the interval below the Hygiene sandstone. In the area of the<br />
Wattenberg field, Weimer (1996) reported overpressuring from the top of the Hygiene sandstone to the top<br />
of the Muddy sandstone (Figure 5). These depths conform to a vitrinite reflectance anomaly that Smagala et<br />
al. (1984) plotted at and below the Terry-Hygiene boundary (Figure 6). Geothermal gradients as high as<br />
30°F per 1,000 ft of burial–nearly double the norm for this basin–also occur in the vicinity of the<br />
Wattenberg field (Bookout, 1980). Well data indicate that the overpressure in the Denver basin has an upper<br />
window depth of approximately 4,500 ft. This overpressured zone eventually pinches out east of the<br />
Wattenberg field.<br />
Figure 2 shows biogenic gas fields exists east of the limit of thermally-mature Niobrara source rocks.<br />
Significant underpressuring occurs in this area with reported pressure gradients as low as 0.21 psi/ft at the<br />
Beecher Island field. Lockridge and Scholle (1978) note that Niobrara gas accumulations here are associated<br />
with low-relief anticlinal closures; thus this area has a low potential for continuous-type accumulations.<br />
2
Province, Play and<br />
Accumulation Name:<br />
Geologic<br />
Characterization of<br />
Accumulation:<br />
KEY ACCUMULATION PARAMETERS<br />
Rocky Mountain, Denver Basin, early to late Cretaceous overpressure<br />
a. Source/reservoir includes Pierre Shale through Mowry Shale. "J" (Muddy) Sandstone<br />
(underpressured) is a probable target at base of overpressure zone.<br />
b. Total Organic Carbons<br />
(TOCs)<br />
0.3-10.6% (Sharon Springs member of Pierre); 1.3-2.4% (Mowry and Skull<br />
Creek shales); 5.8% maximum (Smokey Hill chalk member of Niobrara)<br />
c. Thermal maturity Tmax 464 to 401° C, Ro 1.5 to Ro
Production and Drilling<br />
Characteristics:<br />
Economic<br />
Characteristics:<br />
a. Important<br />
fields/reservoirs<br />
Wattenberg (J Sandstone), Berthoud (Niobrara Chalk), Silo (Niobrara<br />
Chalk), Beecher Island (Niobrara Chalk)<br />
b.Cumulative production Wattenberg-"J" Sandstone, 67 MMBO, 1.5 TCFG, 13.37 MMBW; Silo field,<br />
8.45 MMBO, 6.8 BCFG, 3.7 MMBW; Beecher Island, 0 BO, 39.6 BCFG,<br />
37.9 MMBW; Berthoud field, 765 MBO, 1.86 BCFG, 4.3 MMBW.<br />
a. High inert gas content no high inert gas content<br />
b.Recovery highly variable<br />
c.Pipeline infrastructure good<br />
d.Overmaturity none<br />
e.Basin maturity east flank is immature<br />
f.Sediment consolidation consolidation/porosity reduction occurs with depth of burial, especially in the<br />
Niobrara Chalk (Pollastro and Martinez, 1985)<br />
g. Porosity/completion<br />
problems<br />
chalks & other tight (low permeable rocks) produce where they are naturally<br />
fractured (Berthoud)<br />
h.Permeability deep basin (Wattenberg area), Niobrara chalk, approx. 0.001 to 0.01 md<br />
(Nydegger, 1999); eastern flank (Beecher Island field), Niobrara = 1 to 6 md<br />
i.Porosity deep basin (Wattenberg area), Niobrara chalk = 6.3%; eastern flank (Beecher<br />
Island area), Niobrara chalk = 39-42%
42°<br />
41°<br />
40°<br />
39°<br />
| | | | | |<br />
105° 104° 103° 102°<br />
Hartville uplift<br />
DB-1<br />
| |<br />
Cheyenne<br />
Denver<br />
DB-5<br />
DB-2<br />
DB-4<br />
| | | | | | | | | | | | | | | | | | | | | | | | | | | | |<br />
DB-3<br />
Chadron arch<br />
Wyoming Nebraska<br />
Colorado Springs<br />
0 50 kilometers<br />
Colorado<br />
Denver Basin<br />
30 miles<br />
DB-1. Sussex (Terry) and Shannon DB-3 Niobrara Chalk Biogenic<br />
(Hygiene) Sandstone play Gas play<br />
DB-2 Codell Sandstone and Niobrara DB-4 D Sand play<br />
Formation (Wattenberg Area) play DB-5 Muddy (J) Sand play<br />
Kansas<br />
Figure 1. Index map of Denver basin showing boundaries of major (> 5 BCF) gas reservoirs. Modified from<br />
Shurr, 1980; Rice, 1984; and Hemborg, 1993.<br />
0
42°<br />
41°<br />
40°<br />
39°<br />
| | | | | |<br />
105° 104° 103° 102°<br />
Hartville uplift<br />
| |<br />
Cheyenne<br />
2500<br />
2000<br />
Denver<br />
Area of Niobrara<br />
oil production<br />
1500<br />
Area of Niobrara<br />
and/or Codell wet<br />
gas condensate<br />
and/or oil production<br />
500<br />
Limit of thermally-mature<br />
Niobrara source rocks<br />
(After Tainter, 1982)<br />
1000<br />
Area of shallow<br />
Niobrara biogenic<br />
gas fields<br />
| | | | | | | | | | | | | | | | | | | | | | | | | | | | |<br />
Chadron arch<br />
Wyoming Nebraska<br />
Colorado Springs<br />
0 50 kilometers<br />
Colorado<br />
Denver Basin<br />
Figure 2. Index map of Denver basin showing Niobrara Formation gas reservoirs. Isopachs represent<br />
depth to top of Niobrara Formation. Contour values are in meters. Modified from Shurr, 1980;<br />
Rice, 1984; and Hemborg, 1993.<br />
0<br />
30 miles<br />
500<br />
Kansas
Era<br />
Cenozoic<br />
Mesozoic<br />
Paleozoic<br />
Tertiary<br />
Cretaceous<br />
Period<br />
Oligocene<br />
Eocene<br />
Paleocene<br />
Upper<br />
Lower<br />
Jurassic<br />
Triassic<br />
Permian<br />
Pennsylvanian<br />
Mississippian<br />
Subsurface<br />
Denver Basin<br />
White River Fm<br />
Denver-Dawson Fm<br />
Pierre<br />
Shale<br />
Niobrara<br />
Fm<br />
Carlile<br />
Shale<br />
Arapahoe Fm<br />
Laramie Fm<br />
Fox Hills Fm<br />
Greenhorn Ls<br />
Graneros Sh<br />
Mowry Sh Dakota Ss<br />
Muddy (J) Ss<br />
Skull Creek Sh<br />
Plainview Ss<br />
Lytle Ss<br />
Morrison Fm<br />
Ralston Creek Fm<br />
Entrada Fm<br />
Jelm Ss<br />
Lykins Ss<br />
Lyons Ss<br />
Fountain<br />
Fm<br />
Smoky Hill<br />
Fort Hayes Ls<br />
Codell Ss<br />
Blue Hill Sh<br />
Fairport Ch<br />
Ingleside Fm<br />
Virgilian<br />
Figure 3. Geologic Column of Denver basin. After Hemborg, 1993.<br />
Source<br />
Rock<br />
Interval<br />
Producing<br />
Units
Cody Sh<br />
Frontier Fm<br />
Mowry Sh<br />
Shell Creek<br />
Muddy<br />
A<br />
NW<br />
CENTRAL WYOMING<br />
Wall Cr Mbr<br />
Belle Fourche Mbr<br />
Thermopolis<br />
sec. 26-27<br />
T39N R83W<br />
sec. 32<br />
T34N R81W<br />
VIII<br />
VII<br />
IV<br />
Formation or member contact<br />
Unconformity<br />
Time surface<br />
(Subsurface marker bed of faunal zone boundary)<br />
III<br />
II<br />
I<br />
?<br />
?<br />
?<br />
DOUGLAS SW CORNER<br />
NEBRASKA<br />
?<br />
Benton Sh<br />
Niobrara Fm<br />
Graneros Fm<br />
NW CORNER<br />
KANSAS<br />
sec. 31<br />
T31N R71W T12N R59W T1S R42W<br />
Marine &<br />
Non-marine<br />
EXPLANATION<br />
Marine<br />
DENVER BASIN<br />
400 mi (645 km)<br />
D Sand<br />
Huntsman Sh<br />
Muddy (J)<br />
Skull Creek<br />
Mbr<br />
Shale<br />
Chalk or<br />
& Siltstone<br />
Calcareous Shale<br />
30 m 100 ft<br />
SHELF SLOPE BASIN<br />
Sea Level<br />
0<br />
30 mi<br />
50 km<br />
RUSSELL CO.<br />
KANSAS<br />
Mbrs<br />
Fort<br />
Hays<br />
Codell<br />
Blue<br />
Hill<br />
Fairport<br />
A'<br />
SE<br />
Jetmore & Pfeifer<br />
Heartland<br />
Lincoln<br />
Powder River<br />
Basin<br />
A<br />
WYOMING<br />
Laramie Basin<br />
Fms<br />
Niobrara<br />
Carlile<br />
Greenhorn<br />
Graneros<br />
Dakota<br />
Kiowa<br />
CENOMANIAN TURONIAN<br />
ALBIAN<br />
LOCATION MAP<br />
Denver Basin<br />
COLORADO<br />
NEBRASKA<br />
Figure 4. Restored stratigraphic cross section for D Sandstone and associated units from central Wyoming to central Kansas. After Weimer, 1983.<br />
KANSAS<br />
A'
Depth (ft)<br />
0<br />
1,000<br />
2,000<br />
3,000<br />
4,000<br />
5,000<br />
6,000<br />
7,000<br />
8,000<br />
9,000<br />
10,000<br />
Hydrostatic Gradient (0.43 PSI/ft)<br />
Underpressured<br />
0 1000 2000 3000 4000 5000 6000 7000<br />
Pressure (psi)<br />
Overpressured<br />
Migration<br />
Points<br />
Pierre Shale<br />
Sharon Ss Mbr<br />
Niobrara Fm<br />
Figure 5. Pressure plot for township T 3 N, R 65 and 66 W, and T 5 N, R 65 W. Dots indicate the<br />
stratigraphic level in wells for which pressure data are available. After Weimer, 1996.<br />
Terry Ss<br />
Hygiene Ss<br />
Codell Ss<br />
Benton Fm<br />
Muddy (J) Ss<br />
Source<br />
Rock<br />
Interval
Depth (ft)<br />
0<br />
1,000<br />
2,000<br />
3,000<br />
4,000<br />
5,000<br />
6,000<br />
7,000<br />
8,000<br />
9,000<br />
Vitrinite Reflectance (% R0)<br />
.1 .2 .3 .4 .5 .6 .7.8.91 2 3 4<br />
Surface Coals<br />
Terry-Hygiene<br />
Interval<br />
Skull<br />
Creek<br />
Figure 6. Plot of vitrinite reflectance versus depth from well and surface coal data (Wattenberg field<br />
area), showing dogleg maturation profile. After Smagala et al., 1984.
GEOLOGIC SETTING<br />
The Great Basin is part of the Basin and Range geologic province, which makes up most of Nevada. Figure 1<br />
shows the grabens (valleys) in the province. The state has undergone complex geological and structural development.<br />
At least four major orogenies affected the area prior to the initiation of Basin and Range extension during the<br />
Miocene (Montgomery, 1988). Uplift during the Antler orogeny (Late Devonian to Early Mississippian) created a<br />
north-south trending barrier, isolating a foreland basin to the east. Next, the Sonoma Orogeny (Late Permian through<br />
Early Triassic) emplaced the Golconda Allochthon in central Nevada. The Jurassic Nevadan Orogeny involved<br />
thrusting and folding in the central part of the state and ended the marine sedimentation. The Sevier/Laramide episode<br />
(Late Jurassic through the Eocene) resulted in extensive volcanism throughout much of western and central portion<br />
Nevada, and creation of the Rocky Mountain Thrust Belt. Another period of extensive volcanism began in the<br />
Oligocene.<br />
During the Paleozoic era and ending in the Permian, up to 50,000 feet of shallow water carbonate and clastic<br />
rocks were deposited (Peterson, 1988). From the Cretaceous through the Eocene, large lakes formed in the Black<br />
Rock Desert area and in the Carson Sink (Figure 1) and organic-rich rocks were deposited, including the Sheep Pass<br />
Formation (Late Cretaceous–Eocene), the Newark Canyon Formation (Late Cretaceous), and the Elko Formation<br />
(Eocene–Oligocene). In southeast and northwest Nevada, large lakes formed during Miocene and Pliocene time<br />
(Barker, 1996; Hastings, 1979). These lakes contain organic rich source rocks. Figure 2 shows stratigraphic columns<br />
for two areas in eastern Nevada.<br />
Crustal extension began in the Miocene, forming characteristic Basin and Range structures: alternating horsts<br />
and grabens (Peterson, 1988). Extensional faulting continues to the present. Block faulting broke up the Sheep Pass,<br />
Newark Canyon and Elko Basins. Their lacustrine and clastic fluvial deposits subsided into deep grabens. Figure 3<br />
shows a cross section across Railroad Valley in east-central Nevada. Several present day valleys contain over 10,000<br />
feet of late Tertiary and Pleistocene fluvial, lacustrine and volcanic valley fill (Peterson, 1988). These Tertiary<br />
lacustrine deposits provided the source rock for several oil fields in Nevada. The Sheep Pass Formation provided both<br />
source and reservoir strata for Eagle Springs Field and source rocks for Trap Springs Fields in Railroad Valley<br />
(Figure 2).<br />
HYDROCARBON PRODUCTION<br />
There are 12 producing oil fields in Nevada at present. Reservoirs include the Garrett Ranch Volcanics, which<br />
produce at Trap Springs Field, and the Sheep Pass Formation, which produces at Eagle Springs Field. Most<br />
exploration has been along the faulted valley margins.<br />
All deep Tertiary basins will probably have at least one good source rock either in the basin, or subcropping<br />
against the basin fill. Barker (1996) states that Tertiary lacustrine shales and marls from six wells in the Carson Sink<br />
have a TOC range from 0.1 to 3.0%. The rocks have a hydrogen index over 400 mg/gram organic carbon and are oil<br />
prone. There is unusually high heat flow in the area. Strata buried only 3,300 to 6.600 ft deep during the Pliocene<br />
may now be in the oil generation window.
EVIDENCE FOR BASIN-CENTERED GAS<br />
Gas shows have occurred in many exploration wells, indicating some of these basins have generated gas. Deep<br />
source rocks in the grabens probably lie on the gas-only generation window, because of high geothermal gradients.<br />
The Tertiary Sheep Pass, Newark Canyon and Elko Formations are considered the most prospective for<br />
hydrocarbon generation, migration and trapping (Figure 2). There are other hydrocarbon source rocks in Nevada,<br />
including the Mississippian Chainman Shale, which in Railroad Valley is a partial source for the Eagle Springs<br />
Field and the main source for the Grant Canyon Field. These pre-Tertiary source rocks may have helped charge<br />
possible basin-centered gas accumulations within the Tertiary graben valley fill.<br />
Regional gravity data show several basins that contain thick Tertiary fill. The valley fill is less dense than the<br />
older Paleozoic and Mesozoic strata that crop out in the bordering mountain ranges and form the basement in the<br />
grabens. Jachens and Moring (1990) published gravity maps that show the thickness of Tertiary strata. Figure 4<br />
shows areas with pronounced residual gravity minima that may indicate thick Tertiary strata.<br />
Several valleys in east-central Nevada have anomalously low gravity (Jachens and Moring, 1990). Tertiary<br />
lacustrine valleys are the most prospective for basin-centered gas. Their basin configurations are better known from<br />
seismic data than are other Basin and Range valleys. Some valleys fall within a gravity low, but are not in eastern<br />
Nevada and so remain speculative for basin-centered gas.<br />
The Carson Sink in Western Nevada does not fall within a gravity low, but seismic data indicates 11,000 ft of<br />
Tertiary fill, including organic-rich lacustrine source rocks (Barker, 1996), and several exploration wells have gas<br />
shows.
Province, Play and<br />
Accumulation Name:<br />
Geologic<br />
Characterization of<br />
Accumulation:<br />
KEY ACCUMULATION PARAMETERS<br />
Basin and Range Province; Cenozoic Speculative Basin Centered Gas<br />
Accumulation<br />
a. Source/reservoir Organic-rich Tertiary lacustrine shales: Sheep Pass Fm (Paleocene-Eocene),<br />
Elko Fm (Paleocene), and Neward Canyon Fm (Cretaceous); several<br />
Paleozoic source rocks may also contribute hydrocarbons to this play<br />
b.Total Organic Carbons<br />
(TOCs)<br />
(Peterson, 1988): Chainman Shale (Mississippian), Pilot Shale (Upper Dev. -<br />
Lower Miss.), Carbon Ridge Fm (Permian); Webb Fm (Miss.), Woodruff Fm<br />
(Devonian), Slaven Chert (Devonian), and Vinini Fm (Ordovician)<br />
All deep Tertiary basins will probably have at least one good source rock<br />
either in the basin, or subcropping against the basin fill. Barker (1996) states<br />
that Tertiary lacustrine shales and marls from 6 wells in the Carson<br />
Sink have a TOC range from 0.1 – 3.0%. The rocks have a hydrogen index<br />
over 400 mg/gram organic Carbon and are oil prone. There is unusually high<br />
heat flow in the area. Strata buried only 1 to 2 km deep during the<br />
Pliocene may now be in the oil generation window.<br />
Poole and Claypool (1984) report the following TOC values:<br />
Source System or Series Total Organic Carbon<br />
(TOC) (%)<br />
Sheep Pass Fm..............................Paleocene - Eocene................ ........ 3 - 4 avg, to 9.5 max<br />
Elko Fm ......................................Eocene - Oligocene (?)........... ........ 33.5 - 38.8 (oil shale)<br />
Newark Canyon Fm.......................Cretaceous........................... ........ to 5.66<br />
Chainman Shale............................Mississippian....................... ........ 2.3 - 3.84 avg, to 10.6 max<br />
Pilot Shale ...................................Upper Dev. - Lower Miss....... ........<br />
Carbon Ridge Fm..........................Permian.............................. ........<br />
Webb Fm.....................................Mississippian....................... ........ to 6.12<br />
Woodruff Fm................................Devonian............................. ........ 5.7 avg to 13.9 max<br />
Slaven Chert.................................Devonian............................. ........<br />
Vinini Fm ....................................Ordovician........................... ........ 1 - 25<br />
Carson Sink..................................Tertiary............................... ........ 0.1 - 3<br />
c.Thermal maturity The discovery of 12 producing oil and gas fields in Nevada, indicates that<br />
there are source rocks at depth which have generated hydrocarbons. In<br />
Railroad Valley, Poole and Claypool (1984) interpret thermally mature<br />
conditions below 6,800 feet – extending from Eocene Sheep Pass Fm<br />
downward into the Mississippian Chainman Shale.<br />
d.Oil or gas prone Most exploration has been along the faulted valley margins. These areas<br />
have produced primarily oil. No drilling has been attempted to evaluate into<br />
the deepest parts of these Tertiary Basins, which may be gas prone, because<br />
of higher temperatures. The oil prone source rocks (Sheep Pass, Chainman<br />
Shale) may be buried within the dry gas window. Previously generated oil<br />
may be cracked into gas, creating possible basin-centered accumulations.
Production and Drilling<br />
Characteristics:<br />
Economic<br />
Characteristics:<br />
e.Overall basin maturity Although there are presently 12 producing oil fields in Nevada, the state is<br />
still a high-risk, under-drilled immature exploration area.<br />
f.Age and lithologies In the Railroad and White River Valley areas, the most likely exploration<br />
targets are the Garrett Ranch Volcanics, which produce at Trap Springs<br />
Field, and the Sheep Pass Fm. (Paleocene – Eocene) which produces at Eagle<br />
g. Rock extent/quality<br />
Springs Field. Paleozoic formations which subcrop against the Tertiary<br />
formations may provide additional reservoirs.<br />
h.Potential reservoirs Garrett Ranch Volcanics, Sheep Pass Formation<br />
i.Major traps/seals Traps may be of all types: structural, stratigraphic, or a combination of both.<br />
For a Basin Centered Gas accumulation, the trap/reservoir may cross<br />
formation boundaries.<br />
j.Petroleum<br />
generation/migration<br />
models<br />
The Tissot and Welte “Cooking Pot” model, where generated hydrocarbons<br />
are expelled into surrounding reservoir rocks (Tissot and Welte, 1984).<br />
k.Depth ranges Depth will vary, because hydrocarbon generation depends on both time and<br />
temperature. Subsurface temperatures where high will positively influence<br />
hydrocarbon generation in some areas. Variability of temperature and source<br />
rock richness will make predicting depth and location difficult.<br />
l.Pressure gradients Eagle Springs Field has a “normal” pressure gradient of 0.4347 psi/ft (Bortz<br />
and Murray, 1979)<br />
a. Important<br />
fields/reservoirs<br />
b.Cumulative production<br />
a. High inert gas content possible, but unknown<br />
b.Recovery unknown<br />
Eagle Springs, Trap Springs, Grant Canyon, and Blackburn Fields. Only<br />
Grant Canyon Field has no production from a Tertiary reservoir.<br />
c.Pipeline infrastructure There are no gas pipelines through the Eastern play area. A 16-inch natural<br />
gas pipeline enters Nevada just east of the Oregon border end runs southwest<br />
through Winnemucca and then along Interstate Highway I-80, through the<br />
northern part of the Carson Sink Basin to Reno. The pipeline continues<br />
through Carson City, then exits Nevada into California. An 8-inch trunk line<br />
runs east to Elko from Winnemucca, and a second 8-inch trunk line runs east<br />
east from north of Reno, along Highway US 50 to Frenchman.
d.Overmaturity Overmature source rocks are most likely to be a problem in the deepest parts<br />
of this play which may require a Paleozoic source rock. For Eagle Springs<br />
Field, the initial BHT (Bottom Hole Temperature) was 200° F (93° C), at<br />
6400 feet. The temperature gradient is 20 deg/1000 ft for the depth interval<br />
6000 – 10,000 ft (Bortz and Murray, 1979). The Carson Sink has a<br />
geothermal gradient of 25 deg/ 1000 ft (Hastings, 1979).<br />
e.Basin maturity Immature source rocks may be a problem only in the shallower basins which<br />
have not achieved deep enough burial to begin generation.<br />
f.Sediment consolidation Unknown, but poor consolidation has not been a serious problem in wells<br />
drilled through the Tertiary section.<br />
g. Porosity/completion<br />
problems<br />
h.Permeability<br />
Unknown, low porosity and fracture production are expected in this play,<br />
both of which may cause drilling and completion problems.<br />
i.Porosity pre-Knox=3.5 to 22% (Innerkip field, Ontario)
120° 118° 116° 114°<br />
North Black<br />
Rock Valley<br />
Humboldt<br />
River Valley<br />
Carson Sink<br />
Smith Creek<br />
Valley<br />
Grass Valley<br />
Black Rock<br />
Desert Valley<br />
Buena<br />
Vista<br />
Valley<br />
Dixie Valley<br />
Reese Valley<br />
Independence<br />
Valley<br />
Pleasant<br />
Valley<br />
Big Smoky<br />
Valley<br />
Monitor<br />
Valley<br />
Little Fish<br />
Creek Valley<br />
Little<br />
Smoky<br />
Valley<br />
Railroad<br />
Valley<br />
Tickaboo Valley<br />
North<br />
Goshute<br />
Valley<br />
Figure 1. Map of Nevada showing grabens/valleys of the Basin and Range Province. Derived from Peterson (1988).<br />
0<br />
50 mi<br />
White<br />
River<br />
Valley<br />
Tiptoe<br />
Valley<br />
Spring<br />
Valley<br />
42°<br />
41°<br />
40°<br />
39°<br />
38°<br />
37°<br />
36°<br />
35°
Penn<br />
Mississippian<br />
Devonian<br />
Sil<br />
Ordovician<br />
Cambrian<br />
White Pine Range Railroad Valley<br />
Ely Limestone 1600'<br />
Dramond Peak Fm 600'<br />
Chainman Shale 1900'<br />
Joana Limestone 200'<br />
Pilot Shale 200'<br />
Guilmette Formation 1600'<br />
Simonson Dolomite 900'<br />
Sevy Dolomite 300'<br />
Laketown Dolomite 800'<br />
Fish Haven Dolomite 700'<br />
Eureka Quartzite 400'<br />
Pogonip Formation 2200'<br />
Windfall Formation 2100'<br />
Dunderberg Shale 450'<br />
Lincoln Peak Formation 2000'<br />
Pole Canyon Limestone 675'<br />
Pioche Shale 300'<br />
Prospect Mountain<br />
Quartzite<br />
Alluvium<br />
Shale<br />
Sandstone<br />
4500'<br />
Quaternary<br />
Tertiary<br />
Penn<br />
Mississippian<br />
Devonian<br />
Figure 2. Stratigraphic columns for White Pine Range and Railroad Valley, eastern Nevada, indicating primary source<br />
and reservoir units. After Peterson (1988).<br />
Pleistocene<br />
Miocene-Pliocene<br />
Oligocene<br />
Paleocene<br />
-Eocene<br />
Alluvium<br />
1500'<br />
Horsecamp Formation 2000'<br />
Garrett Ranch<br />
Volcanic Group<br />
1900'<br />
Sheep Pass Formation 1000'<br />
Ely Limestone 900'<br />
Scotty Wash Quartzite 160'<br />
Chainman Shale 2000'<br />
Joana Limestone 400'<br />
Guilmette Limestone 2000'<br />
Simonson Dolomite 1000'<br />
Limestone Volcanic rocks<br />
Dolomite<br />
Quartzite<br />
1900'<br />
Reservoir<br />
Source &<br />
Reservoir<br />
Source<br />
Reservoir<br />
Thickness of strata,<br />
in feet
Approximate Elevation (feet)<br />
5000<br />
Sea<br />
Level<br />
-5000<br />
-10000<br />
A A'<br />
Alluvium<br />
Shale<br />
Trap Spring Field Eagle Springs Field<br />
Interbedded shale and<br />
limestone<br />
Limestone<br />
Quartzite<br />
Undifferentiated<br />
Paleozoic rocks<br />
Fault, dashed where<br />
inferred<br />
Unconformity<br />
200° F isotherm<br />
Volcanic rocks Oil-water contact<br />
0 2 mi<br />
Figure 3. Cross section across Railroad Valley, Nevada, showing trap types and possible location of basin-centered<br />
gas below 200° F isotherm. After Poole and Claypool (1984).<br />
0.0<br />
0.5<br />
1.0<br />
1.5<br />
2.0<br />
2.5<br />
3.0<br />
3.5<br />
Two-way Reflection Time (seconds)
120° 118° 116° 114°<br />
0<br />
20<br />
North Black<br />
Rock Valley<br />
20<br />
0<br />
0<br />
20<br />
20<br />
Humboldt<br />
River Valley<br />
Carson Sink<br />
Smith Creek<br />
Valley<br />
Gravity anomaly<br />
contour in mGal<br />
5 mGal gravity anomaly<br />
0 mGal gravity anomaly<br />
0<br />
Dixie Valley<br />
-5 mGal gravity anomaly<br />
Grass Valley<br />
-15 mGal gravity anomaly<br />
16-inch gas pipeline<br />
8-inch gas pipeline<br />
0<br />
Black Rock<br />
Desert Valley<br />
Buena<br />
Vista<br />
Valley<br />
0<br />
0<br />
0<br />
20<br />
Reese Valley<br />
Independence<br />
Valley<br />
Pleasant<br />
Valley<br />
0<br />
0<br />
0<br />
0<br />
20<br />
0<br />
20<br />
Big Smoky<br />
Valley<br />
Monitor<br />
Valley<br />
Little Fish<br />
Creek Valley<br />
0<br />
0<br />
Little<br />
Smoky<br />
Valley<br />
0<br />
0<br />
White<br />
River<br />
Valley<br />
A A'<br />
20<br />
0<br />
0<br />
20<br />
0<br />
Railroad<br />
Valley<br />
0<br />
0<br />
15<br />
Tickaboo Valley<br />
North<br />
Goshute<br />
Valley<br />
Figure 4. Gravity minima ("lows") indicating possible thick Tertiary valley fill where gravity low coincides with a<br />
graben/valley. Map shows locations of cross section A-A' and existing pipelines. After Peterson (1988).<br />
0<br />
50 mi<br />
Tiptoe<br />
Valley<br />
20<br />
0<br />
Spring<br />
Valley<br />
0<br />
0<br />
42°<br />
41°<br />
40°<br />
39°<br />
38°<br />
37°<br />
36°<br />
35°
GEOLOGIC SETTING<br />
The Late Cretaceous Austin Chalk was deposited in shallow water on the stable, gently dipping shelf of the<br />
Gulf Basin. The limits of deposition were from the present outcrop belt to the sharp break of the shelf edge (Figure<br />
1). The Chalk overlies the shales of the Eagle Ford formation and is unconformably overlain by the Taylor Group<br />
(Figure 2) The dominant lithology is carbonate skeletal debris with some bands of clay, shale and organic-rich marl.<br />
The Chalk becomes increasingly shaley basinward and grades into the shales of the underlying Eagle Ford. Thickness<br />
increases downdip from less than 100 ft near the outcrop to over 650 ft at depths of 9,500 ft. Thickness also varies<br />
along strike reflecting variations in the shelf. In the Maverick Basin (Rio Grande Embayment), the Chalk exceeds<br />
1,000 ft thickness, thins at comparable depth across the San Marcos Arch, and thickens again in the East Texas<br />
Basin.<br />
Most structure observed in the Chalk reflects an extensional structural style related to opening of the Gulf Basin.<br />
Locally, structure may be complex, influenced by salt flow, anticlinal growth or drape related to differential<br />
compaction in underlying sediments.<br />
HYDROCARBON PRODUCTION<br />
The Austin Chalk has yielded oil and gas in both Texas and Louisiana for over 70 years. Development in Texas<br />
occurs in a 30 mile wide band that stretches from the Rio Grande in south Texas to the Louisiana state line. Until<br />
recently, production in Louisiana was incidental to deeper exploration.<br />
Austin Chalk production in Louisiana had been limited to the central part of the state and was incidental to<br />
deeper exploration. The successful application of horizontal drilling at Brookeland field in Sabine County, east<br />
Texas, led to the first successful drilling for the Chalk in western Louisiana. At the same time, operators in existing<br />
fields of Avoyelles Parish began to apply horizontal drilling to exploit Austin Chalk reserves.<br />
The Chalk in Louisiana generally produces from greater depths than in Texas. At Moncrief and North Bayou<br />
Jack fields, the Chalk produces high-GOR oil (oil ranging from 39° to 42.7° API gravity) from depths of about<br />
14,500 ft. Farther west at Masters Creek field, the Chalk produces condensate and gas from 14,800 ft. These depths<br />
yield dry gas at Giddings. This change in hydrocarbon charge may be related to a southeast to northwest shift in<br />
geothermal gradient (Pollastro, 1999, personal communication). Work on the geographic distribution of geothermal<br />
gradients in the Chalk remains incomplete, but will add substantially to understanding hydrocarbon generation<br />
beyond the models proposed in the Texas fairway.<br />
The Chalk produces from intraformational fractures. Consequently, most of the production is associated with<br />
known fault zones or other structural features responsible for fracture development (Stapp, 1977). Locally, high fluid<br />
pore pressure may have contributed to fracturing (Corbett et al., 1987). Gas expansion is the principal driving<br />
mechanism in the reservoirs. Gas to oil ratios generally show an inverse relationship to structural position; that is,<br />
gas rich reservoirs tend to be structurally lower while oil rich reservoirs are shallower. This reflects increased<br />
generation of gas at greater depth (Figure 3) Reservoirs are directly related to the amount of fracturing; this prevents<br />
extensive migration and most hydrocarbons stay near the depths at which they were generated. Thin bentonite or<br />
shale beds limit vertical fracture growth. Different horizons are productive in different geographical areas. Upper<br />
benches of the Chalk are productive at Pearsall field in the western area; the lowermost Bench is the pay at the<br />
Giddings Area. Farther east at Brookeland field and in Louisiana, the clay/shale interbeds are absent and the Chalk<br />
may be fractured for its entire height. The source for Austin Chalk reservoirs may be the underlying Eagle Ford<br />
shales or by carbonaceous beds within the Chalk itself (Stapp, 1977; Grabowski, 1981, 1984; Ewing, 1983; Hinds<br />
and Berg, 1990).<br />
Fracture production is characterized by high initial rates of production as open fracture systems are drained.<br />
Production declines are very rapid and are followed by extended periods of low volume production, as microfractures<br />
and/or matrix permeability produce fluid to the open fractures penetrated by the wellbore.<br />
1
EVIDENCE FOR BASIN-CENTERED GAS<br />
The discovery of dry (non-associated) gas at the Giddings Deep field in Texas is of particular importance for<br />
exploration for other dry gas accumulations in the Austin Chalk. The Austin Chalk has generally been regarded as an<br />
oil play and certainly the drilling cycles of the 1970s and 1990s were driven by higher oil prices as well as technical<br />
advances. With an abundance of conventional and non-conventional gas plays in Texas, there has been little incentive<br />
for operators to drill the deeper, increasingly shaley Chalk in search of gas reserves, especially since the chalk was<br />
assumed to shale out at depths suitable for gas generation. Gas/oil ratios are relatively constant within most fields<br />
but at Giddings are known to increase about 10 fold across the field. Deep drilling was a deliberate effort to establish<br />
gas reserves. The deeper drilling also identified chalk lithology at greater depths than had previously been expected<br />
(Pollastro, 1999, personal communication).<br />
The Austin Chalk apparently can produce commercial gas at Giddings field in Texas. Local drilling at Giddings<br />
has extended the Chalk play downdip past its previously assumed limits. The extension of Chalk exploration into<br />
Louisiana has identified areas of gas and condensate production. Areas including east Texas, and western and southern<br />
Louisiana may be the best area for future gas development. Potential exists for westward extension of the play<br />
downdip of the oil producing trend. The presence of clean chalk beyond its currently assumed limits at the Cretaceous<br />
shelf edge will be a determining factor. Also necessary are fracturing mechanisms to produce reservoirs. The presence<br />
of source beds within the Chalk and the underlying Eagle Ford shale insure gas generation at sufficient depth and<br />
temperature. Salt flow, regional dip change, and faulting associated with flexure of the Cretaceous shelf edge could<br />
all contribute to fracture development.<br />
1) The Austin Chalk and the underlying Eagle Ford shale are sufficiently mature for gas and gas-condensate<br />
generation throughout the known extent of the play. The Chalk appears to be gas-prone at shallower depths<br />
in the western portion of the play in Texas.<br />
2) Clean, brittle chalk suitable for fracturing is present at depths of gas generation in east Texas and eastward<br />
into Louisiana. The downdip limits at which the chalk grades to shale in this area are not yet fully<br />
established.<br />
3) Fractures within the Chalk constitute the reservoir; therefore, reservoirs become limited to areas of<br />
fracturing. In this respect the Austin Chalk differs from a typical continuous gas accumulation. Although<br />
gas may be present in the chalk matrix, fracture permeability is necessary for production. Thus, the extent<br />
of fracturing will restrict formation of gas-producing reservoirs. Salt flow, faulting, differential compaction,<br />
and other structural or stratigraphic events can create fracturing throughout the known extent of the play.<br />
Fracture trends may be identified regionally, but fracturing suitable for reservoir development will be limited<br />
locally.<br />
4) Temperatures in the deep Chalk play reach 350 °F at Giddings field in Texas. The geothermal gradient<br />
apparently changes in Louisiana from northwest to southeast and appears to match the shift from gas-prone<br />
reservoirs to high-GOR oil reservoirs. The nature and extent of this change is not understood. A better<br />
understanding of this phenomenon might help identify gas-prone Austin Chalk in the eastern part of the<br />
play.<br />
5) The only significant water production in the deep Chalk play is at Masters Creek field in Louisiana, where<br />
the Chalk is in fracture communication with the underlying geopressured Eagle Ford Formation.<br />
2
Province, Play and<br />
Accumulation Name:<br />
Geologic<br />
Characterization of<br />
Accumulation:<br />
KEY ACCUMULATION PARAMETERS<br />
West Gulf Coast, Texas and Louisiana, Deep Austin Chalk (Cretaceous)<br />
a. Source/reservoir underlying Eagle Ford shale and self-sourced from interbedded organic<br />
material (Grabowski, 1981, 1984; Stapp, 1977); intraformational fractures<br />
are the reservoir (Stapp, 1977; Corbett et al., 1987)<br />
b.Total Organic Carbons<br />
(TOCs)<br />
Eagle Ford = 1.5-8% (Montgomery, 1990); Austin Chalk = 0.3-2.5%<br />
(Grabowski, 1981)<br />
c.Thermal maturity thermal alteration index ranges from 1+, 2 at 2000 ft to 3-, 3 at 9000 ft.<br />
Ratios of Extractable Organic Matter (EOM) to Total Organic Content<br />
(TOC) range from less than 10% in the immature zone to 45% in the oil<br />
generation zone. Ratios decrease with greater depth reflecting the expulsion<br />
of generated hydrocarbons (Grabowski, 1981, 1984; Ewing, 1983; Hinds and<br />
Berg, 1990). Temperature gradient changes from south-central Louisiana to<br />
the Louisiana - Texas state line suggest lower temperatures to east and higher<br />
temperatures to west (Pollastro, 1999, personal communication)<br />
d.Oil or gas prone oil and gas productive from south Texas to central Louisiana; non-associated<br />
gas produced in the deep Giddings area below 10,000 ft.<br />
e.Overall basin maturity Gulf Coast Basin normally mature regionally<br />
f.Age and lithologies Late Cretaceous, coccolith- and formanifera-rich chalk with thin interbedded<br />
shales and bentonites<br />
g. Rock extent/quality extends from Maverick Basin of south Texas to central Louisiana; rock<br />
quality varies locally from east to west, but chalk grades to shale basinward<br />
(Stapp, 1977; Montgomery 1995)<br />
h.Potential reservoirs<br />
i.Major traps/seals interbedded shale and bentonite beds terminate vertical fracture<br />
development; fracture development occurs in areas of extensional or<br />
halokinetic (salt flow) faulting, or structural drape over underlying sediments<br />
j.Petroleum<br />
generation/migration<br />
models<br />
thermogenic generation related to depth of burial (Ewing, 1983; Hinds and<br />
Berg, 1990; Grabowski, 1981, 1984); limited migration due to fracture<br />
compartmentalization<br />
k.Depth ranges oil and gas productive at depths of 6000 ft to 14,000; dry gas productive at<br />
10,000 to 14,000+ ft at Giddings field<br />
l.Pressure gradients
Production and Drilling<br />
Characteristics:<br />
Economic<br />
Characteristics:<br />
a. Important<br />
fields/reservoirs<br />
Giddings, Giddings Deep, Pearsall, Masters Creek, Brookeland, Moncrief<br />
b.Cumulative production Giddings (all)--2.8 TCFG, 414,800,000 BO; Pearsall--92 BCFG,<br />
142,000,000 BO; Masters Creek 17 BCFG, 4,630,000 BO; Moncrief 5.4<br />
BCFG, 447,000 BO<br />
a. High inert gas content up to 6.5% CO2 and unspecified amount of H2S at Giddings Deep (Moritis,<br />
1995)<br />
b.Recovery highly variable recoveries typical of fractured reservoirs<br />
c.Pipeline infrastructure good to excellent for most of play; fair in west-central Louisiana<br />
d.Overmaturity uncertain due to lack of deeper drilling in the Giddings Deep area<br />
e.Basin maturity the Chalk itself is generally immature above 6000 ft; the underlying Eagle<br />
Ford is also immature at shallower depths<br />
f.Sediment consolidation consolidation/porosity reduction occur with depth of burial<br />
g. Porosity/completion<br />
problems<br />
h.Permeability<br />
i.Porosity<br />
high temperatures (350°)at Giddings Deep, require special mud systems and<br />
“hostile environment” downhole tools. Plugging of the fracture systems by<br />
drilling mud is a particular problem in Louisiana. Unlined laterals are more<br />
likely to collapse at the gas prone depths, (>10,000 ft) than in the shallower<br />
(6000-9000 ft) oil play. The underlying Eagle Ford shales are known to be<br />
geopressured in portions of the Louisiana play; fracture communication with<br />
the geopressured zones creates drilling hazards and increases water<br />
production. Greater weight of overburden may result in more rapid closure<br />
of fractures with withdrawal of fluid.
33°<br />
31°<br />
29°<br />
27°<br />
100°<br />
Austin Chalk<br />
Outcrop Belt<br />
Pearsall<br />
98° 96° 94° 92° 90° 88°<br />
Area of horizontal drilling<br />
Petroleum field<br />
Giddings<br />
Brookeland<br />
Kurten<br />
Burr Ferry<br />
Masters<br />
Creek<br />
Approximate Position<br />
of Cretaceous Shelf Edge<br />
North<br />
Hadden<br />
North<br />
Bayou<br />
Jack<br />
Moncrief<br />
0 50 100 mi<br />
Figure 1. Regional map showing productive trend of horizontal drilling in the Austin Chalk, Texas and Louisiana.<br />
Scale
Stage<br />
Danian Tertiary<br />
Maastrichtian<br />
Campanian<br />
Santonian<br />
Coniacian<br />
Turonian<br />
Cenomanian<br />
Albian<br />
Aptian<br />
Barremian<br />
Hauterivian<br />
Valanginian<br />
Berriasian<br />
Tithonian<br />
Kimmeridgian<br />
Oxfordian<br />
Callovian<br />
Bathonian<br />
Neocomian<br />
Upper<br />
Middle Upper<br />
Lower<br />
Period<br />
Cretaceous<br />
Jurassic<br />
Gulf<br />
Coast<br />
Usage<br />
Upper<br />
Middle<br />
Lower<br />
Gulfian<br />
Comanchean<br />
Coahuilan<br />
Circum-<br />
Gulf<br />
Mid-Cret.<br />
("MCU")<br />
Top Salt<br />
Base Salt<br />
Regional<br />
Seismic<br />
Reflectors<br />
East<br />
Texas<br />
Navarro<br />
Austin<br />
Buda<br />
James<br />
Top Salt<br />
Base Salt<br />
East Texas and West Louisiana<br />
N S<br />
Midway<br />
Navarro<br />
Austin<br />
Eagleford<br />
Woodbine<br />
Washita<br />
Fredericksburg<br />
Trinity<br />
Taylor<br />
Hosston<br />
Knowles<br />
Cotton Valley<br />
Gilmer<br />
Buckner<br />
Smackover<br />
Norphet<br />
Louann<br />
Georgetown<br />
Figure 2. Stratigraphic column and cross section for East Texas and Western Louisiana. After Winker and Bufler (1988).<br />
Kiamichi<br />
Edwards<br />
Paluxy<br />
Glen<br />
Rose<br />
Ferry<br />
Lake<br />
Pearsall<br />
Lower<br />
Glen<br />
Rose<br />
Shelf Margin<br />
Upper<br />
Glen Rose<br />
Sligo<br />
Stuart City<br />
Shelf<br />
Margin<br />
Bossier<br />
Sligo<br />
Shelf<br />
Margin<br />
Tuscaloosa<br />
Clastic wedge<br />
(mostly shale)
NW SE<br />
Outcrop<br />
Balcones<br />
Fault Zone<br />
Updip Fields<br />
(Luling, Salt Flat, etc.)<br />
Luling<br />
Fault Zone<br />
Austin<br />
Chalk<br />
Mexia-Fashing<br />
Fault Zone<br />
Midtrend-Giddings<br />
Immature<br />
Mature<br />
Shelf<br />
Margin<br />
Reef<br />
6000 ft<br />
9000 ft<br />
NW SE<br />
Outcrop<br />
Balcones<br />
Fault Zone<br />
Fractures<br />
(fault-related)<br />
Microfractures<br />
Oil well<br />
Pearsall Field<br />
Charlotte<br />
Fault Zone<br />
Well with oil<br />
or gas shows<br />
Gas well Dry well<br />
Gas<br />
Immature<br />
Mature<br />
Gas<br />
Shelf<br />
Margin<br />
Reef<br />
6000 ft<br />
9000 ft<br />
0 10 mi<br />
Figure 3. Generalized cross sections showing down-dip progression of hydrocarbon maturity levels and trap types in<br />
the Austin Chalk of southern Texas. After Ewing (1983).
GEOLOGIC SETTING<br />
The Eagle Ford Formation was deposited on the gently sloping shelf of the Gulf Coast. The formation<br />
unconformably overlies the Woodbine Group, which includes the Woodbine sands of east Texas and southwest<br />
Louisiana, the Tuscaloosa sands of central Louisiana, and the Buda limestone of Texas. The Austin Chalk<br />
unconformably overlies the Eagle Ford (Figure 1). The lower Eagle Ford is a transgressive unit composed of dark<br />
shales, while the upper unit is a highstand/regressive facies with thin limestones, shales, siltstones, and bentonites,<br />
and thin dolomites locally (Dawson et al., 1993; Stapp, 1977). Regionally, the formation ranges in thickness from a<br />
feather edge in Arkansas to 100-150 ft across much of Texas and Louisiana. In response to underlying structure, the<br />
formation thickens to 300 to 400 ft in the South Louisiana Salt Basin. Maximum thickness is about 800 ft in the<br />
East Texas Basin. Deposition occurred from the current outcrop band downdip to beyond the Cretaceous shelf margin<br />
(Figure 2). Dark shales in the upper Eagle Ford are absent in parts of east Texas, with the Austin Chalk overlying<br />
fine grained clastics mapped as Woodbine. Montgomery (1995) suggests this “missing” Eagle Ford may be due to<br />
changes in local terminology, but also states that the literature does not formally recognize this distinction.<br />
Structure in the Eagle Ford generally reflects down to the basin extensional faulting, but locally, salt flow,<br />
anticlinal growth, or differential compaction in the underlying Woodbine/Tuscaloosa may also influence structure .<br />
HYDROCARBON PRODUCTION<br />
Production from the Eagle Ford is difficult to verify. Stapp (1977) noted completions of oil wells in the<br />
formation in Frio County, Texas (presumably in the Pearsall field area), but since these were in conjunction with<br />
Austin and/or Buda completions, there are no separate records of Eagle Ford production. Stapp further stated that the<br />
formation itself could not be considered a primary target because of its thinness and lack of permeability. More<br />
recently, Dawson (1997) found that low matrix permeabilities and low volumetric parameters of the formation<br />
preclude reservoir potential. The ductility of the shale interval hinders development of fractured reservoirs found in<br />
the more brittle overlying Austin Chalk and underlying Buda limestones, although carbonate and siliclastic beds in<br />
the upper interval may fracture.<br />
Values of total organic content (TOC) in the Eagle Ford range from 1.0 to almost 10.0 %wt and thus suggest a<br />
high quality source rock. Formation samples yield total hydrocarbon generation potential (THGP) values from about<br />
1 to over 50 mg HC/g rock. Plots of Hydrogen Index versus Oxygen Index suggest the Eagle Ford contains both<br />
type II and type III kerogens and is prone to both oil and gas generation (Robison, 1997). Maturation studies on<br />
Eagle Ford samples indicate onset of hydrocarbon generation at 7,500 ft original depth (Noble et al., 1997),<br />
matching the variation in maturity from deeper oil-prone Louisiana fields to shallower gas-prone fields in Texas.<br />
This generation depth corresponds to the results of maturation studies in the Austin Chalk (Grabowski, 1984;<br />
Ewing, 1983; Hinds and Berg, 1990 (Figure 3).<br />
EVIDENCE OF BASIN-CENTERED GAS<br />
The lack of verifiable production history and reported lack of reservoir make the Eagle Ford a poor candidate for<br />
significant gas accumulations. The similarity to maturity in the Austin Chalk allows extrapolation from Austin or<br />
Tuscaloosa gas production to likely areas and depths of gas generation in the Eagle Ford. As a regionally extensive<br />
organic rich source rock, the Eagle Ford could generate gas over a large area downdip from the traditional Austin<br />
Chalk oil trend and in the vicinity of deep dry-gas and gas-condensate production in the Giddings area of Texas and<br />
southwest Louisiana. Production of such gas will require the development of fracture reservoirs in the Chalk or the<br />
underlying Buda formation. The Woodbine sands of eastern Texas grade basinward to shale; the Tuscaloosa sands of<br />
southern Louisiana probably grade likewise. The Tuscaloosa-Eagle Ford transition occurs at depths greater than<br />
18,000 ft, a depth suitable for gas generation. The migration of such gas to conventional reservoirs would require<br />
faulting or fracturing (Montgomery, 1995). A widespread accumulation of gas in tight, silty Tuscaloosa sands in the<br />
transition zone is possible but speculative. Any such accumulation would be within the area of geopressuring in the<br />
Tuscaloosa, which would create drilling and completion problems.<br />
1
Province, Play and<br />
Accumulation Name:<br />
Geologic<br />
Characterization of<br />
Accumulation:<br />
KEY ACCUMULATION PARAMETERS<br />
West Gulf Coast, Texas and Louisiana, Eagle Ford Shale (Cretaceous)<br />
a. Source/reservoir Eagle Ford shale is self-sourced (Noble et al., 1997; Robison, 1997; Stapp,<br />
1977); reservoir not developed (Stapp, 1977; Dawson, 1997)<br />
b.Total Organic Carbons<br />
(TOCs)<br />
c.Thermal maturity<br />
Eagle Ford = 1.0 to almost 10% (Robison, 1997)<br />
d.Oil or gas prone oil and gas prone based on kerogen types (Robison, 1997)<br />
e.Overall basin maturity Gulf Coast Basin normally mature regionally<br />
f.Age and lithologies Late Cretaceous, lower section dominated by dark shales, upper section<br />
includes thin limestones, dolomites and bentonites in addition to shale<br />
(Stapp, 1977; Dawson, 1997)<br />
g. Rock extent/quality regionally extensive shale (see Figure 2); poor reservoir quality<br />
h.Potential reservoirs<br />
i.Major traps/seals<br />
j.Petroleum<br />
generation/migration<br />
models<br />
Thermogenic generation related to depth of burial (Ewing, 1983; Hinds and<br />
Berg, 1990; Grabowski, 1981, 1984; Noble et al., 1997); migration by faults<br />
and fractures to Austin Chalk and Buda Lime, lateral migration to<br />
Woodbine sands (Stapp, 1977; Ewing, 1983; Wescott and Hood, 1993)<br />
k.Depth ranges oil and gas generative at current depths of 6000 ft to 14,000 ft<br />
l.Pressure gradients
Production and Drilling<br />
Characteristics:<br />
Economic<br />
Characteristics:<br />
a. Important<br />
fields/reservoirs<br />
b. Cumulative production<br />
a. High inert gas content<br />
b. Recovery<br />
c. Pipeline infrastructure<br />
d. Overmaturity<br />
e. Basin maturity<br />
f. Sediment consolidation<br />
g. Porosity/completion<br />
problems<br />
h. Permeability<br />
i. Porosity<br />
Not applicable<br />
Not applicable; source rock only
33°<br />
31°<br />
29°<br />
27°<br />
100°<br />
Pearsall<br />
Area of "missing" Eagle Ford<br />
Giddings<br />
Austin Chalk Productive<br />
Trend<br />
Petroleum field<br />
98° 96° 94° 92° 90° 88°<br />
Probable area of gas<br />
generation in Eagle Ford<br />
Approximate position<br />
of Cretaceous shelf edge<br />
Masters<br />
Creek<br />
Area of "missing"<br />
Eagle Ford<br />
Figure 1. Regional map showing gas generation from Eagle Ford Formation, Texas and Louisiana.<br />
North<br />
Bayou<br />
Jack<br />
Moncrief<br />
0 50 100 mi<br />
Scale
System Series Stage Central Texas<br />
Cretaceous<br />
Upper<br />
Maastrichtian<br />
Campanian<br />
Santonian<br />
Coniacian<br />
Turonian<br />
Cenomanian<br />
Escondido<br />
Olmos<br />
San Miguel<br />
Anscacho<br />
Upson<br />
Chalk interval Eagle Ford Formation<br />
Washita<br />
East Texas<br />
Basin<br />
Navarro Navarro<br />
Taylor<br />
Taylor<br />
Austin Chalk Austin Chalk<br />
Eagle Ford Eagle Ford<br />
Southeast Texas<br />
SW Louisiana<br />
Navarro<br />
Taylor<br />
Austin Chalk<br />
South Louisiana<br />
and Offshore<br />
Austin Chalk<br />
Navarro<br />
Taylor<br />
Ector<br />
Eagle Ford Eagle Ford<br />
Woodbine<br />
Woodbine Woodbine Tuscaloosa<br />
Buds Buds Buds Buds<br />
Del Rio Del Rio - Grayson<br />
Washita<br />
Grayson<br />
Figure 2. Stratigraphic column and correlation in the Upper Cretaceous interval, U. S. Gulf Coast. After Salvador and Muneton (1989).<br />
Washita<br />
Grayson<br />
Selma
NW SE<br />
Outcrop<br />
Balcones<br />
Fault Zone<br />
Fractures<br />
(fault-related)<br />
Microfractures<br />
Updip Fields<br />
(Luling, Salt Flat, etc.)<br />
Luling<br />
Fault Zone<br />
Midtrend-Giddings<br />
Austin Chalk Shelf<br />
Oil well<br />
Eagle<br />
Ford<br />
Mexia-Fashing<br />
Fault Zone<br />
Well with oil<br />
or gas shows<br />
Gas well Dry well<br />
Immature<br />
Figure 3. Generalized cross section showing down-dip progression of hydrocarbon maturity levels and trap types in the Eagle Ford Formation of southern<br />
Texas. After Ewing (1983).<br />
Mature<br />
Gas<br />
Margin<br />
Reef<br />
6000 ft<br />
9000 ft<br />
0 10 mi
GEOLOGIC SETTING<br />
The Lower Cretaceous Travis Peak Formation and Upper Jurassic Cotton Valley Group contain FERCdesignated<br />
tight gas sands that were widely deposited across eastern Texas, northern Louisiana and into the<br />
Mississippi Salt Basin (Figure 1). The lower part of the Cotton Valley also contains both reef-forming<br />
carbonates and oolitic shoals. Sandstone distribution in the Cotton Valley generally is more consistent than<br />
that in the Travis Peak.<br />
In east Texas, Travis Peak deposition occurred in a fluvial-deltaic environment that prograded from the<br />
northwest (Bushaw, 1968; Saucier, 1985; and Tye, 1989). Underlying Cotton Valley sands may be barrierisland<br />
type deposits. Interpretations of stratigraphic sequence have defined a number of depositional subenvironments<br />
(Figure 2) in east Texas and western Louisiana that consist of:<br />
1<br />
1. a braided to meandering fluvial system;<br />
2. interbedded deltaic/fluvial deposits–fluvial deposits distally become encased in deltaic rocks;<br />
3. paralic deposits that interfinger with the above two systems near the top of the Travis Peak; and<br />
4. shelf deposits near the downdip edge of the Travis Peak; these sediments interfinger with and onlap<br />
deltaic and paralic deposits (Dutton et al., 1993).<br />
Thickness of the Travis Peak Formation ranges from 500 to 2,500 ft, and generally increases to the<br />
southeast (Figure 2). The upper 200 ft of the formation holds the most potential for basin-centered gas<br />
development. Most productive intervals occur at depths of 3,100 to 10,900 ft. Cotton Valley low<br />
permeability sands range in thickness from 1,000 to 1,400 ft thick and occur at depths of 5,000 to 11,000<br />
ft; Schenk and Vigers (1996) suggest that Cotton Valley reservoirs may extend to depths as much as 20,000<br />
ft. Reservoir continuity is often interrupted by small-scale sedimentary disturbances that include bedforms,<br />
biogenic features, clay drapes, and scour surfaces (Gas Research Institute, 1991).<br />
Recent activity targeting the Cotton Valley involves the development of a pinnacle reef play since<br />
1980. This play is developing along the western shelf of the East Texas basin (Montgomery, 1996) and<br />
may extend into the Sabine Platform trend into Louisiana (Figure 1). Reef development appears to coincide<br />
with localized salt-tectonic positive features that provided a shoaling environment. These carbonate buildups<br />
ranged in thickness from 200 to 400 feet more than the surrounding interreef sediments and had an areal<br />
extent of 200 to 800 acres (Montgomery, 1996).<br />
Growth faulting throughout the area of the Cotton Valley and Travis Peak trends may play an<br />
important part in the upward migration of hydrocarbons. Jurassic rocks contain the greatest number of<br />
faults, probably related to salt tectonism (Montgomery, 1996). Salt structure formation provided shoaling<br />
environments for deposition of oolites and other high energy sediments. From the Jurassic to the Tertiary,<br />
salt tectonism generated local fracturing that enhanced reservoir permeability (Coleman and Coleman, 1981;<br />
Saucier, 1984).<br />
The East Texas and North Louisiana salt basins may have formed by graben development that resulted<br />
from continental rifting and the opening of the Gulf of Mexico basin (Figure 1). These grabens are bounded<br />
by down-to-the-basin faults, which include the Mexia-Talco and the South Arkansas fault zones (Kehle,<br />
1971; Wood and Walper, 1974; and Finley, 1986). Other dominant structural features in the play area<br />
include the Sabine uplift and the Monroe uplift in northeastern Louisiana. Development of the Sabine uplift<br />
is speculative; however, evidence points to a compressional origin (Jackson and Laubach, 1988).
HYDROCARBON PRODUCTION<br />
As of 1993, 860 wells were completed within the Travis Peak Formation. Cumulative production from<br />
1970 to 1988 amounted to 508-plus BCFG, with an estimated ultimate recovery of 1,269 BCFG. Average<br />
recoveries per well varied from 1.8 BCFG in East Texas to 1.4 BCFG in North Louisiana. Initial<br />
production rates increased from 0 to 765 MCFGPD prior to stimulation to 500 to 1500 MCFGPD after<br />
fracturing. Production rates declined up to 65% in the first 1 to 2 years. Dutton et al. (1993) estimated the<br />
resource base to be 6.4 TCFG.<br />
Cotton Valley wells totaled 2,870 "tight completions" as of 1993. Cumulative production was 2,665.5<br />
BCFG, with an estimated ultimate recovery of 4,999 BCFG. Average recoveries per well varied from 1.8<br />
BCFG in East Texas to 2.4 BCFG in North Louisiana. Initial production rates increased from 50 MCFGPD<br />
prior to stimulation to 500 to 1,500 MCFGPD after fracturing. Decline rates were somewhat less than<br />
those of the Travis Peak, with an estimated 46% decline in the first 1 to 2 years of production. The rate of<br />
water production decreased to a 50 barrel per day average in the same time period. The presence of a<br />
gas/water contact in any part of the play remains unknown. Cluff (1999) believes multiple gas/water<br />
contacts exist. Dutton et al. (1993) estimated the resource base for Cotton Valley tight reservoirs to be 24.2<br />
TCFG.<br />
The early stages of development of the Cotton Valley play included easily identifiable "blanket"-type<br />
sands originating from well-developed strands, barrier islands, and tidal bars. Finley (1986) noted a newer,<br />
tight-gas sandstone play located generally downdip from the more permeable sands noted above. Distal to<br />
proximal delta-front deposits dominate this hypothetical play, which may extend from northwestern<br />
Louisiana into the eastern and central parts of the East Texas basin.<br />
EVIDENCE FOR BASIN-CENTERED GAS<br />
Widespread production , gas shows, and the occurrence of overpressuring and underpressuring indicate a<br />
potential for basin-centered gas accumulations. Most Travis Peak and Cotton Valley fields are<br />
overpressured, but some data indicates underpressuring in the Cotton Valley interval of the Oak Hill field,<br />
and in the Travis Peak lower zone of the Waskom field; the Cotton Valley limestone at Teague field reaches<br />
a pressure gradient of 0.66 psi per ft (Kosters et al., 1989). Pressure gradients are highest in the underlying<br />
Cotton Valley carbonates. Pressure gradients appear slightly higher in Cotton Valley sandstone reservoirs<br />
than in Travis Peak sandstone reservoirs. This may result from their proximity to source rocks, with some<br />
leakage from the Travis Peak. Pressure communication between the Travis Peak and Cotton Valley<br />
reservoirs may exist in East Texas.<br />
In-situ generation of hydrocarbons does not appear likely for Travis Peak reservoirs. Thermal maturity<br />
data indicates that Travis Peak strata are well within the "oil window" (Ro values range from 1.0 to 1.8%);<br />
however, TOC values for interbedded Travis Peak shales generally are less than 0.5% (Dutton et al., 1993).<br />
Cotton Valley strata have a higher likelihood for in-situ hydrocarbon generation. Beneath the Cotton<br />
Valley sands is the Bossier shale (Figure 3). Montgomery (1996) calls the Bossier "a dark, somewhat<br />
organic-rich interval," and local thickness changes of 400 feet occur on the western shelf of the East Texas<br />
basin (Forgotson and Forgotson, 1976; Montgomery, 1996). The Bossier may have generated and expelled<br />
hydrocarbons in Late Cretaceous time (Wescott and Hood, 1991; and Montgomery, 1996). Schenk and<br />
Viger (1996) believe some sources of hydrocarbons for this play may have originated in mudstones in the<br />
lower part of the underlying Jurassic Smackover Formation (Figure 3).<br />
2
Province, Play and<br />
Accumulation Name:<br />
Geologic<br />
Characterization of<br />
Accumulation:<br />
KEY ACCUMULATION PARAMETERS<br />
Eastern U.S. Appalachian basin, (New York, Pennsylvania and Ohio). Play:<br />
Paleozoic Era - Late Cambrian and Ordovician sandstones and shales; Lower<br />
Silurian "Clinton" and Medina Group sandstones, and the equivalent<br />
Tuscarora Sandstone<br />
a. Source/reservoir Source rocks include: Bossier shale (Upper Jurassic Cotton Valley group),<br />
and mudstones and carbonates of the Upper Jurassic Smackover formation.<br />
Reservoir rocks include: Sandstones and carbonates of the Upper Jurassic<br />
b.Total Organic Carbons<br />
(TOCs)<br />
Cotton Valley group and Lower Cretaceous Travis Peak formation.<br />
values for the interbedded Travis Peak shales range to less than 0.5%;<br />
content of the underlying Jurassic Bossier shale and Smackover shales and<br />
carbonates is unavailable.<br />
c.Thermal maturity Ro 1.0 – 1.8% (values from Travis Peak interbedded shales)<br />
d.Oil or gas prone both oil and gas prone; however, source rocks referred to are specifically<br />
noted by Wescott and Hood (1991) to have generated oil.<br />
e.Overall basin maturity maturation levels are moderate<br />
f.Age and lithologies Upper Jurassic to Lower Cretaceous sandstones<br />
g. Rock extent/quality apparent basin-wide source (Jurassic only) and reservoir rock<br />
distribution,;rocks are highly variable in reservoir quality because of quartz<br />
overgrowths and calcite cement, and minor amounts of clay and dolomite<br />
h.Potential reservoirs many producing reservoirs<br />
i.Major traps/seals carbonates and evaporites of the overlying Sligo and Pettet formations and<br />
mudstones within the Travis Peak<br />
j.Petroleum<br />
generation/migration<br />
models<br />
little chance of in-situ generation within the Travis Peak; however, Cotton<br />
Valley reservoirs may be self-sourced as in Weimer’s Denver basin "cooking<br />
pot" model (Weimer, 1996). Migration of gases along fracture and fault<br />
systems from the Upper Jurassic into Travis Peak reservoirs probably occurs,<br />
but may not be necessary if the Bossier shale generated sufficient<br />
hydrocarbons to charge both the Cotton Valley sands and Travis Peak sands,<br />
provided the two units are in pressure communication with one another.<br />
k.Depth ranges Travis Peak reservoirs range from 3100 to 10,900 ft; potential reservoir<br />
depths may exceed 15,000 ft. Cotton Valley reservoirs range from 5,000 to<br />
11,000 ft and may go as deep as 20,000 ft.<br />
l.Pressure gradients Travis Peak - 0.38 to 0.52 psi/foot; Cotton Valley sands - 0.32 to 0.55 psi/ft;<br />
Cotton Valley carbonate (oolitic shoal reservoirs) - 0.50 to 0.66 psi/ft.
Production and Drilling<br />
Characteristics:<br />
Economic<br />
Characteristics:<br />
a. Important<br />
fields/reservoirs<br />
Bethany (Travis Peak), Carthage (Travis Peak, Cotton Valley), Waskom<br />
(Travis Peak, Cotton Valley), Trawick (Travis Peak), Opelinka (Travis Peak,<br />
Rosewood (Cotton Valley), Henderson North (Travis Peak, Cotton Valley),<br />
Blocker (Cotton Valley).<br />
b. Cumulative production Travis Peak - 508.3 BCFG (1970-1988); Cotton Valley - 2,665.5 BCFG<br />
(1970-1988)<br />
a. High inert gas content<br />
b. Recovery Recoveries vary depending on permeability (degree of cementation and<br />
fracturing), and porosity.<br />
c. Pipeline infrastructure very good.<br />
d. Overmaturity possibly overmature in the deepest parts of the basins<br />
e. Basin maturity Most of the basin is mature (Ro values for the Travis Peak range from 1.0 to<br />
1.8%)<br />
f. Sediment consolidation most rocks are well indurated<br />
g. Porosity/completion<br />
problems<br />
iron oxide precipitates common in some Cotton Valley sandstone reservoirs,<br />
calcite and silica cementation restrict porosity, minor clay problems<br />
h. Permeability Travis Peak - 0.0004 to 0.8 md; Cotton Valley - 0.015 to 0.043 md<br />
i. Porosity Travis Peak - 5-17%; Cotton Valley - 6 to 11%
97°<br />
34°<br />
33°<br />
32°<br />
31°<br />
30°<br />
29°<br />
A<br />
A'<br />
96° 95° 94° 93° 92° 91° 90° 89°<br />
Mexia-Talco Fault Zone<br />
Potential Basin-centered gas Trend<br />
Area of uplift<br />
Anticline<br />
Ginger Fault Zone<br />
East Texas<br />
Salt Basin<br />
Rodessa Fault<br />
Mt. Enterprise Fault Zone<br />
Sabine<br />
Arch<br />
Sou t h Arkansas Fault Zone<br />
Comanchean Shelf Edge<br />
Texas Louisiana<br />
Normal fault; hachures<br />
on downthrown side<br />
Basin-centered gas trend<br />
North Louisiana Fault Zone<br />
North Louisiana<br />
Salt Basin<br />
Arkansas<br />
Monroe<br />
Uplift<br />
Pickens Fault Zon e<br />
Mississippi<br />
Salt Basin<br />
Mississippi<br />
0 50 mi<br />
Figure 1. Regional tectonic map of the central Gulf coastal province showing potential basin-centered gas trend. Location of cross section A-A' is<br />
approximate. After Gulf Coast Association of Geologic Societies (1972) and Dutton et al. (1993).
A A'<br />
North Hopkins<br />
Wood<br />
South<br />
Feet<br />
7000<br />
1000<br />
500<br />
0<br />
0<br />
Miles<br />
Braided-stream fluvial facies:<br />
very fine- to fine-grained sandstone and fineto<br />
medium-grained conglomerate sandstone<br />
?<br />
?<br />
Delta-front facies:<br />
interbedded very fine to fine-grained sandstone,<br />
siltstone, and mudstone<br />
Pro-delta facies:<br />
mudstone containing thin beds of very finegrained<br />
sandstone, siltstone, and limestone<br />
5<br />
8000<br />
10000<br />
8000<br />
10000<br />
Limestone<br />
10000<br />
Shallow-shelf and shallow-shelf transitional facies:<br />
interbedded very fine to fine-grained fossiliferous<br />
sandstone, siltstone, mudstone, and limestone<br />
10000<br />
10000<br />
10000<br />
10000<br />
10000<br />
Pettet Formation<br />
Hosston Formation<br />
(Travis Peak Formation)<br />
Cotton Valley Group<br />
Delta-front facies<br />
Pro-delta facies<br />
Gilmer Limestone<br />
Buckner Formation<br />
Smackover Formation<br />
Figure 2. North-south dip-oriented cross section showing Travis Peak and Cotton Valley sandstone facies in East Texas Basin, Hopkins and Wood Counties,<br />
Texas. After McGowen and Harris (1984), and Kosters et al. (1989).
System<br />
Cretaceous<br />
Jurassic Upper<br />
Series Group Formation<br />
Coahuilan Nuevo Leon<br />
Cotton Valley<br />
Louark<br />
Sligo/Pettet<br />
Travis Peak/Hosston<br />
Cotton Valley Sandstone<br />
(Upper Cotton Valley/Schuler)<br />
Bossier Shale<br />
Cotton Valley Limestone<br />
(Gilmer/Haynesville)<br />
Buckner<br />
Smackover<br />
Figure 3. Stratigraphic column of parts of the Jurassic and Cretaceous systems in east Texas and northern Louisiana.<br />
After Finley (1986).
GEOLOGIC SETTING<br />
The Hanna Basin is an intermontane basin in the Rocky Mountain foreland province in southeast Wyoming<br />
(Figure 1). The basin covers about 1,000 square miles and contains almost 38,000 ft of Cretaceous and Tertiary<br />
sediments (Figure 2). At least 18,000 ft of Late Cretaceous and early Tertiary sediments were deposited within 15<br />
my, creating thermally mature hydrocarbon source rocks in the basin center (Beirei, 1986, 1987). The Upper<br />
Cretaceous Medicine Bow, Lewis and Mesaverde Formations consist of up to 15,000 ft of dark marine organic-rich<br />
shales (Figure 3). The Eocene-Paleocene Hanna and Ferris Formations include almost 14,000 ft of organically rich<br />
lacustrine shales, coals and fluviatile sandstones (Perry, 1992; Beirei, 1987; Matson, 1984). This excessive<br />
sedimentation resulted from abrupt basin subsidence associated with Laramide tectonism (Lillegraven, 1995; Beirei<br />
and Surdham, 1986; Shelton, 1968). The basin is asymmetric and is surrounded by numerous Laramide thrust faults<br />
(Figures 1 and 2).<br />
The high subsidence rates that occurred in the Hanna basin are typical of wrench basins with strike-slip faulting<br />
(Perry, 1992).<br />
HYDROCARBON PRODUCTION<br />
The Hanna basin has several fields that produce both oil and gas (Kaplan and Skeen, 1985; Matson, 1984;<br />
Porter, 1979; McCaslin, 1978) (Figure 3). Table 1 lists the cumulative production for various fields. To date, natural<br />
gas has been found only in sandstone reservoirs (Mitchell, 1968). The nonmarine rocks are currently being explored<br />
for coal and coal gas (Perry, 1992). There is no current production of coal gas in the basin.<br />
EVIDENCE FOR BASIN-CENTERED GAS<br />
Sparse exploratory drilling and lack of data make comparisons difficult. The Hanna basin has similar rock<br />
sequences to the Greater Green River basin, where Law and others (1984; 1989) have described basin-center gas<br />
systems. Pontolillo and Stanton (1994) measured vitrinite reflectance values greater than 1% below 11,000 ft in the<br />
Champlin and Brinkerhoff wells; these values exceed the 0.8% threshold that generally indicates the top of abnormal<br />
pressures and possible thermogenic gas generation (Johnson and Finn, 1998; Law, 1984) (Figure 4).<br />
Late Cretaceous marine rocks in the basin show total organic carbon (TOCs) values greater than 0.5%. The<br />
Hanna, Ferris, Medicine Bow, and Mesaverde Formations have coal beds and carbonaceous shales with variable TOC<br />
values (0.5 to 35.6 wt% avg, 3.2 wt% TOC). Marine sediments of the Lewis, Steele, Niobrara, and Frontier<br />
Formations have TOC range of 0.4 to 4.3 and average of 1.5 wt% TOC (Beirei, 1987).<br />
Most of the known traps are structural closures around the edges of the basin (Matson, 1984). Several<br />
structural/stratigraphic traps are also present (Porter, 1979, McCaslin, 1978). Stratigraphic traps may occur in the<br />
deeper part of the basin, in low permeability and possibly overpressured Eocene, Paleocene and Upper Cretaceous<br />
rocks (Matson, 1984). Major seals include the black/dark shales of the Cretaceous Mowry, Steele, Thermopolis, and<br />
Mesaverde Formations, and Paleocene and Eocene rocks.<br />
Time-temperature calculations locate the oil generation window (O.G.W.) at 7,200 to 11,480 ft depth in the<br />
basin center. Apparently, hydrocarbon generation began about 80 Ma at the base of the Late Cretaceous section in<br />
the Hanna basin. Transformation models show that source rocks generated and expelled hydrocarbons very quickly.<br />
At present, the Hanna basin is not generating any significant amounts of hydrocarbons.<br />
1
Province, Play and<br />
Accumulation Name:<br />
Geologic<br />
Characterization of<br />
Accumulation:<br />
KEY ACCUMULATION PARAMETERS<br />
Rocky Mountain Foreland Province; Upper Cretaceous and Paleocene Ferris<br />
and Hanna Formations<br />
a. Source/reservoir At least 5.5 km (18,000 ft) of Late Cretaceous and early Tertiary sediments<br />
were deposited within 15 m.y., creating thermally mature hydrocarbon<br />
source rocks in the basin center (Beirei and Surdham, 1986; Beirei, 1987).<br />
The<br />
Upper Cretaceous Medicine Bow, Lewis and Mesaverde formations consist<br />
of up to 4572 m (15,000 ft) of marine dark, organic rich shales. The Eocene-<br />
Paleocene Hanna and Ferris formations consist of up to 4270 m (14,000 ft)<br />
b.Total Organic Carbons<br />
(TOCs)<br />
of organically richlacustrine shales, coals and fluviatile sandstones (Perry,<br />
1992; Beirei, 1987; Matson, 1984).<br />
Moderate to good late Cretaceous marine source rocks with TOCs greater<br />
than 0.5% (Figure 4). The Hanna, Ferris, Medicine Bow, and Mesaverde<br />
formations have coal beds and carbonaceous shales with variable TOC<br />
values<br />
(0.5 to 35.6 wt% avg, 3.2 wt% TOC). Marine sediments of the Lewis, Steele,<br />
Niobrara, and Frontier formations have TOC range of 0.4 to 4.3 and average<br />
of 1.5 wt% TOC (Beirei, 1987).<br />
c.Thermal maturity Ro >1% below 11,000 ft in the Champlin and Brinkerhoff wells; greater than<br />
the 0.8% threshold generally indicating the top of abnormal pressures<br />
(Johnson and Finn, 1998; Law, 1984). Ro < 0.7% to 10,000 ft depth in #1<br />
Hanna well; below 10,000 ft, Ro increase to 1.23% near bottom of hole,<br />
suggesting thermogenic gas generation and possible abnormal pressures<br />
below 10,000 ft (Perry, 1992; Spencer, 1987). Ro for Hanna and Ferris coals<br />
ranged from 0.45% to 0.6% (Pontolillo and Stanton, 1994). Pyrolysis profiles<br />
combined with Kerogen elemental analysis also suggest generation of gas and<br />
possible overpressuring in low permeability<br />
rocks within the deeper part of the basin (Beirei, 1987). Temperature-depth<br />
plots, time-temperature profiles, and the bottom hole temperature in the<br />
Forgoston, Amoco, and Humble wells ranging from 204 to 240° F, all<br />
suggest that overpressuring is present (Johnson and Finn, 1998; Spencer,<br />
1987).<br />
d.Oil or gas prone prone to both oil and gas. Several fields produce both oil and gas (Kaplan,<br />
1985; Matson, 1984; Porter, 1979; McCaslin, 1978). To date, natural gas has<br />
been found only in sandstone reservoirs (Mitchell, 1968)<br />
e.Overall basin maturity kinky vitrinite reflectance present in the basin: interpreted as evidence of<br />
abnormal pressures in low permeability gas bearing reservoirs (Law, et al.,<br />
1989)<br />
f.Age and lithologies The Upper Cretaceous Medicine Bow, Lewis and Mesaverde formation<br />
consist of marine dark, organic rich shales. The Eocene-Paleocene Hanna<br />
and Ferris formations consist of organically rich lacustrine shale, coals and<br />
fluviatile sandstones.<br />
g. Rock extent/quality source and reservoir rocks extend throughout the basin. Rock quality<br />
unknown
Production and Drilling<br />
Characteristics:<br />
h.Potential reservoirs dark, organic-rich marine shales of the Upper Cretaceous Medicine Bow,<br />
Lewis and Mesaverde formations, and organic-rich lacustrine shale, coals<br />
and fluviatile sandstones of the Eocene-Paleocene Hanna and Ferris<br />
formations<br />
i.Major traps/seals Most of the known traps are structural closures around the edges of the basin<br />
(Matson, 1984). Several structural/stratigraphic traps are also present (Porter,<br />
1979, McCaslin, 1978). Stratigraphic traps may be present in the deeper part<br />
j.Petroleum<br />
generation/migration<br />
models<br />
of the basin, in low permeability possibly overpressured Eocene, Paleocene<br />
and Upper Cretaceous rocks (Matson, 1984). Major seals are the black/dark<br />
shales of the Cretaceous (Mowry, Steele, Themopolis Mesaverde), Eocene<br />
and Paleocene.<br />
The oil generation window determined from time-temperatures index<br />
calculations is at 7216 ft to 11,480 ft in the basin center. Hydrocarbon<br />
generation began near 80 Ma at the base of the Late Cretaceous section in<br />
the Hanna basin. Transformation models show that the source rocks<br />
generated and expelled hydrocarbons very quickly. The Hanna basin is not<br />
generating any significant amounts of hydrocarbons at present. The zone of<br />
maximum source rock expulsion is modeled at 8200 ft in the center of the<br />
basin.<br />
k.Depth ranges In the Hanna #1 well from 11,000 ft to 17,000 ft; Ro increased to 1.23 Ro<br />
near the bottom of the hole suggesting thermogenic gas generation and<br />
overpressuring below 10,000 ft (Perry, 1992). The bottom hole temperature<br />
l.Pressure gradients<br />
a. Important<br />
fields/reservoirs<br />
in the Forgoston, Amoco, and Humble wells ranged from 204 to 240° F,<br />
suggesting that overpressuring may be present.<br />
Rock River (discovered 1918): structural trap/asymmetric anticline.<br />
Cumulative production past 40 million bbl. Oil was produced from the<br />
Cretaceous Muddy, Dakota, Lakota, and Jurassic Sundance Formations.<br />
Allen Lake (discovered 1918): Muddy Clovely, Sundance. Big Medicine<br />
Bow (Steele, Muddy, Sundance, Tensleep fm.) Coper Cove, Diamond<br />
Ranch, Epsy, Ferris, Hatfield. Cedar Ridge (discovered 1980): Steele fm.<br />
Chapman Draw (discovered 1982): Morrison fm. oil and gas. Simpson Ridge<br />
(discovered 1923) Steele fm. Frontier and Clovely (1967) oil and gas.
Economic<br />
Characteristics:<br />
Field Name<br />
b. Cumulative production<br />
a. High inert gas content<br />
b. Recovery<br />
c. Pipeline infrastructure Major gas pipelines run west and south of the Hanna basin to transport gas<br />
from the Greater Green River basin and other gas fields in the Rocky<br />
Mountain Region.<br />
d. Overmaturity mature<br />
e. Basin maturity mature<br />
f. Sediment consolidation<br />
g. Porosity/completion<br />
problems<br />
h. Permeability<br />
i. Porosity<br />
Cumulative Oil<br />
(bbl) (6/98)<br />
Cumulative Gas<br />
(MCF) (6/98)<br />
Cumulative Water<br />
(bbl) (6/98)<br />
Rock River ...................... ..........43,550,000 ........................ 9,838,602 ........... ......... 28,596,423<br />
Allen Lake....................... .................................................. 1,768,000 ........... .........................<br />
Big Medicine Bow............. ........... 8,796,976 .......................13,712,086 ........... ......... 50,432,248<br />
Cedar Ridge...................... ................. 7,743 .................................................. .........................<br />
Chapman Draw................. ................. 8,095 ...........................816,544 ........... ............... 17,288<br />
Simpson Ridge ................. ..............277,074 ........................ 2,523,981 ........... ............... 17,288
Seminoe<br />
R85W R80W<br />
U<br />
D<br />
Hanna<br />
Basin<br />
Wyoming<br />
St. Mary's<br />
6<br />
Walcott<br />
Mountains<br />
Anticline<br />
Syncline<br />
1<br />
Pass Creek Ridge<br />
Fault; U, upthrown side<br />
U<br />
D<br />
Thrust fault; teeth, upper plate<br />
Well<br />
Seismic<br />
Line<br />
5<br />
Bennett Hills<br />
2<br />
Hanna<br />
7<br />
Hanna Basin Axis<br />
4<br />
Elmo<br />
Saddeback Hills<br />
S w e t w a t e r A r c h<br />
3<br />
Explanation<br />
Elk Mtn.<br />
Freezeout Hills<br />
Simpson Ridge<br />
U<br />
D<br />
1. Forgaston<br />
2. Brinkerhoff<br />
3. Hanna #1<br />
4. Champlin<br />
5. unknown<br />
6. Amoco<br />
7. Humble #1<br />
Carbon<br />
Basin<br />
80<br />
U<br />
D<br />
BHT = 204<br />
Ro = 0.98<br />
Ro = 1.23<br />
Ro = 0.92<br />
gas show<br />
BHT = 217<br />
BHT = 240<br />
R77W<br />
30<br />
Medicine Bow<br />
Well Name Parameter Total Depth (ft)<br />
15,322<br />
10,485<br />
14,855<br />
16,800<br />
Figure 1: Index map of the Hanna Basin, showing well locations and relevant gas data. After Kaplan (1985).<br />
T<br />
24<br />
N<br />
T<br />
20<br />
N
Aproximate Depth (ft)<br />
0<br />
10,000<br />
20,000<br />
30,000<br />
40,000<br />
Th<br />
TKf<br />
Kmb<br />
Kle<br />
Humble Oil No. 1 (Pass Creek Ridge unit)<br />
Kmv<br />
Kn<br />
Pt<br />
pC<br />
Hanna Formation<br />
Ferris Formation<br />
Medicine Bow Formation<br />
Lewis Shale<br />
Th<br />
TKf<br />
Kmb<br />
Kle<br />
Kmv<br />
Kn<br />
Pt<br />
pC<br />
Explanation<br />
Mesaverde Formation<br />
Niobrara Formation<br />
Tensleep Formation<br />
Precambrian rocks, undifferentiated<br />
Figure 2. Geologic cross section across Hanna Basin. After Kaplan and Skeen (1985).<br />
Kmv<br />
Kn<br />
Pt<br />
pC<br />
Kn<br />
Kmv<br />
Kle<br />
0<br />
Kmv<br />
Scale (miles)<br />
Kmv<br />
pC<br />
N<br />
Coarser near-shore facies<br />
pC<br />
5
Age Unit Lithology Thickness<br />
Tertiary<br />
Upper<br />
Cretaceous<br />
Lower<br />
Cretaceous<br />
Jurassic<br />
Triassic<br />
Permian<br />
Pennsylvanian<br />
Mississippian<br />
Cambrian<br />
Precambrian<br />
Hanna<br />
Ferris<br />
Medicine Bow<br />
Lewis<br />
Mesaverde<br />
Steele<br />
Niobrara<br />
Frontier<br />
Mowry<br />
Muddy<br />
Thermopolis<br />
Cloverly<br />
Morrison<br />
Sundance<br />
Chugwater<br />
Goose Egg<br />
Tensleep (Casper)<br />
Amsden<br />
Madison<br />
Flathead<br />
siltstone, silty sandstone, and<br />
shale; carbonaceous shale<br />
underlying coal beds<br />
continental silty sandstone, and<br />
shale; with carbonaceous shale<br />
and coal; minor conglomerate<br />
dark gray marine shale<br />
upper: nearshore silty sandstone,<br />
shale, carbonaceous shale, coal<br />
lower: marine shale, sitly<br />
sandstone<br />
dark gray siltstone, shale; some<br />
limited silty sandstone<br />
chalky shale and non-calcareous<br />
shale; limited siltstone<br />
marine shale and siltstone<br />
black, siliceous shale<br />
sandstone and silty sandstone;<br />
shale<br />
dark gray shale; bentonite<br />
fine-grained silty sandstone;<br />
siltstone and shale<br />
silty sandstone, shale; occasional<br />
carbonaceous shale<br />
silty sandstone, shale; and<br />
infrequent oolitic limestone<br />
red siltstone, silty sandstone, and<br />
shale<br />
interbedded red shale, siltstone,<br />
limestone, and gypsum<br />
silty sandstone; large cross-beds<br />
in places; shale, dolomite, anhydrite<br />
shale, silty sandstone, minor<br />
limestone, siltstone<br />
limestone and dolomite thoughout;<br />
limited shale; siltstone at base<br />
transgressive silty sandstone,<br />
siltstone, and shale<br />
schists, gneisses, and migmatites<br />
of Archean Age; intrusive granites<br />
19,800 ft<br />
6,000 ft<br />
2,100 ft<br />
2,600 ft<br />
3,000 ft<br />
1,200 ft<br />
800 ft<br />
200 ft<br />
63 ft<br />
80 ft<br />
200 ft<br />
375 ft<br />
300 ft<br />
700 ft<br />
400 ft<br />
400 ft<br />
300 ft<br />
500 ft<br />
65 ft<br />
Hydrocarbon<br />
Potential<br />
Figure3: Stratigraphic chart of units present in the Hanna Basin, Wyoming, showing hydrocarbon<br />
potential. After Kaplan (1985).
Depth (ft)<br />
0<br />
1,000<br />
2,000<br />
3,000<br />
4,000<br />
5,000<br />
6,000<br />
7,000<br />
8,000<br />
9,000<br />
10,000<br />
11,000<br />
Champlin Well<br />
r = 0.92<br />
0.4 0.6 0.8 1.0 2.0<br />
Vitrinite Reflectance (R0 %)<br />
Depth (ft)<br />
0<br />
1,000<br />
2,000<br />
3,000<br />
4,000<br />
5,000<br />
6,000<br />
7,000<br />
8,000<br />
9,000<br />
10,000<br />
11,000<br />
12,000<br />
13,000<br />
Brinkerhoff Well<br />
r = 0.56<br />
r = 0.98<br />
0.4 0.6 0.8 1.0 2.0<br />
Vitrinite Reflectance (R0 %)<br />
Figure 4. Down-hole vitrinite reflectance profiles from the Champlin and Brinkerhoff wells (see Figure 1 for borehole locations). After Bierei (1987).
GEOLOGIC SETTING<br />
The present day Los Angeles Basin is a deep structural depression about 50 miles long and 20 miles wide located<br />
on the west coast of southern California (Figure 1). The Santa Monica and San Gabriel Mountains form the northern<br />
boundary and the Santa Ana Mountains mark the eastern edge. The Pacific Ocean limits the basin on the west and<br />
the south. The basin contains at least 24,000 ft of Late to Middle Miocene and younger marine clastic rocks<br />
overlying older Cenozoic sedimentary rocks and Mesozoic basement rocks (Figure 2). There are four large structural<br />
blocks in Los Angeles basin–the southwestern, northwestern, central, and northeastern–separated by faults or flexures<br />
in the basement rocks (Figure 1). Figure 3 shows the different stratigraphic units in the four blocks (Yerkes et al.,<br />
1965; Beyer, 1996; Brown, 1966). A potential basin center gas accumulation may be present in the central block.<br />
Sedimentary rocks range in age from latest Cretaceous to Holocene and divide into two groups: a "pre-basinal"<br />
suite of Upper Cretaceous to Lower Miocene rocks, and "basinal" marine sediments deposited in a rapidly subsiding<br />
trough since Middle Miocene time (Yerkes et al., 1965).<br />
The geotectonic history of the Los Angeles Basin can be explained by the constant-motion plate tectonic model,<br />
which links movements of the San Andreas fault to the Cenozoic sea floor spreading in the northeastern Pacific<br />
(Campbell and Yerkes, 1976). The Santa Maria basin formed by Middle Miocene to Early Pliocene extension,<br />
strike-slip faulting and block rotation, and Late Pliocene to Recent north-south compression (Beyer, 1996).<br />
Extensive igneous flows, intrusive rocks, and tephra were emplaced within and around the basin during Late<br />
Miocene.<br />
HYDROCARBON PRODUCTION<br />
Oil production from the basin has occurred since the 1890s (Table 1). The Los Angeles basin ranks first worldwide<br />
in total discovered oil-in-place per unit volume. The hydrocarbon richness of the basin results from a favorable<br />
sequence of events including:<br />
1<br />
1) the deposition of oil-prone organic matter in low oxygen environments,<br />
2) rapid burial which preserved the organic matter,<br />
3) maturation and expulsion of oil coinciding with trap formation, and<br />
4) production of hydrocarbons before uplift and erosion could destroy a significant portion of the reservoirs.<br />
Fifteen of the sixteen largest oil fields, which account for 91% of the basin’s total, were discovered before 1933.<br />
Significant discoveries include the Beverly Hills, La Cienega, Riviera, and San Vicente fields–all found during the<br />
1960s. Urbanization has constrained exploration. Drilling activity during the last 40 years has averaged just two<br />
wells per year. Cumulative production and estimated reserves exceed 9.6 BBO and 8.7 TCFG (Beyer, 1996). All<br />
significant gas reserves in the basin have been associated with oil accumulations (Gardett, 1970). Most of the<br />
discovered accumulations have been structural/stratigraphic traps in Miocene and Pliocene turbidite sandstones,<br />
ranging from distal turbidite sandstones to proximal conglomeratic sandstones. Several minor reservoirs have been<br />
discovered in Pleistocene, Pliocene and middle Miocene sandstones. Reservoir depths range from 900 to 11,900 ft,<br />
and thicknesses range from 15 to 1,200 ft. Structure has been the dominant trapping mechanism for discovered<br />
hydrocarbons. Traps north and south of the basin center include faulted anticlines, faulted noses, homoclines, domes,<br />
and various stratigraphic traps. To date, the basin center area remains undrilled, except for the American Petrofina<br />
Core Hole well in the basin center (Stark, 1972; Beyer, 1988).
EVIDENCE FOR BASIN-CENTERED GAS<br />
The American Petrofina Core Hole well bottomed at a depth of 21,215 ft in Delmontian rocks in the basin<br />
center syncline. Unfortunately, the well did not reach the Mohnian section, which may be the equivalent of the<br />
organic-rich "nodule shale" found elsewhere in the basin. Therefore, drilling has not yet confirmed the presence of<br />
source and reservoir rocks in the basin center. Shallower wells on the east flank of the Newport-Inglewood zone<br />
penetrated interbedded sandstone and shale containing type II kerogen in the lower Mohnian section. The Mohnian<br />
rocks may be fractured because of fluid overpressuring during maturation of kerogen in the organic-rich shale. The<br />
play, if present, will be in the upper Miocene lower Mohnian section (Figure 1). Favorable conditions for basin<br />
center gas accumulations are present in the Los Angeles basin for the following reasons:<br />
2<br />
1) Thermally mature source rocks (Ro values > than 1.2% and TOC's of 1-9%) are present in the basin center;<br />
2) Abnormally high formation pressures were measured both in the American Petrofina Core Hole in the basin<br />
center syncline, and in the Standard Oil of California well (0.72 psi/ft) located northeast of the basin center<br />
(Bostick et al., 1978);<br />
3) High reservoir temperatures ranging from 205 to 304° F were measured in the central basin syncline (8,900<br />
to 15,500 ft);<br />
4) Hydrocarbons are present in the basin center–the American Petrofina Core Hole well yielded 43° API gravity<br />
oil, with a high gas-oil ratio at 21,215 ft depth; and<br />
5) A thick section of Upper Miocene (Mohnian) rocks ranging in thickness from 3,000 to 7,000 ft may be<br />
present in the basin center.
Province, Play and<br />
Accumulation Name:<br />
Geologic<br />
Characterization of<br />
Accumulation:<br />
KEY ACCUMULATION PARAMETERS<br />
Pacific Coast- Los Angeles Basin, California. Middle to Late Miocene and<br />
Early Pliocene age rocks (upper Mohnian, Delmontian and "Repettian"<br />
stages).<br />
a. Source/reservoir southwestern shelf: the organic-rich basal "nodular shale" of late Middle<br />
Miocene Modelo Formation, sourcing the underlying schist conglomerate<br />
and the overlying marine sandstone reservoirs (Bostick et al., 1978);<br />
b.Total Organic Carbons<br />
(TOCs)<br />
central syncline: source rocks may occur in the lower Mohnian section,<br />
analogous to the "nodular shale" (Schmoker et al., 1995).<br />
1.0% - 9.0%<br />
c.Thermal maturity type II; Ro = 0.24-0.89 (Bostick et. al., 1978); greater than 1.2% in the<br />
American Petrofina Core Hole well at 21,215 ft. (Hydrocarbon rich shales<br />
found in the basin may retard/suppress vitrinite reflectance values)<br />
d.Oil or gas prone both oil and gas prone<br />
e.Overall basin maturity considered mature along with adjoining basins in the Pacific Coast<br />
f.Age and lithologies Middle to Late Miocene and Early Pliocene age rocks (upper Mohnian,<br />
Delmontian and "Repettian" stages). Lithologies are primarily turbidite<br />
sandstones, siltstones and shales.<br />
g. Rock extent/quality basin-wide source and reservoir-rock distribution.<br />
h.Potential reservoirs<br />
i.Major traps/seals structural in producing fields; basin center traps-unknown but postulated as<br />
(1) deep continuous volume reservoirs without clear boundaries, (2)<br />
localized reservoirs where fracturing is a function of lithofacies, (3)<br />
structurally<br />
bounded reservoirs because of faulting or folding. Basin center seals: shales.<br />
Also, the presence of laumontite that was reported at depth in the American<br />
Petrofina Core Hole well may degrade the quality of the reservoir rocks and<br />
j.Petroleum<br />
generation/migration<br />
models<br />
help form seals (Beyer, 1996).<br />
migration began during early Pliocene or earlier and probably continues<br />
today. Migration is not necessary for postulated self sourcing reservoirs.<br />
k.Depth ranges 900 to 11,900 ft (producing fields); 21,000 to 24,000 ft in the basin center.<br />
l.Pressure gradients overpressured aqueous pore fluids of 0.72 psi/ft were reported in the<br />
Standard Oil of California "Houghton Comm. One" No. 1 well, located<br />
northeast of the central synclinal trough. This 14,000 ft deep well was drilled<br />
on the<br />
Santa Fe Spring fold (Bostick et al., 1978).
Production and Drilling<br />
Characteristics:<br />
Economic<br />
Characteristics:<br />
a. Important<br />
fields/reservoirs<br />
Wilmington-Belmont (discovered 1932, >2.857 BBO and 1.235 TCFG);<br />
Huntington Beach (discovered 1920, >1.138 BBO and 861 TCFG); Long<br />
Beach (discovered 1921, >945 MMBO and1.088 TCFG); Santa Fe Springs<br />
(discovered1919, >634 MMBO and 839 BCFG); Brea-Olinda (discovered<br />
1880, >430 MMBO and 482 BCFG); Inglewood (discovered1924, >400<br />
MMBO and 285 BCFG); Beverly Hills (discovered 1966, >135.5 MMBO<br />
and 202 BCFG); Torrance (discovered 1922 >246 MMBO and 158 BCFG);<br />
Richfield (discovered 1919, 203 MMBO and173 BCFG); Coyote East<br />
(discovered 1911, 122 MMBO and 61 BCFG).<br />
b. Cumulative production see Important fields/reservoirs above<br />
a. High inert gas content<br />
b. Recovery good<br />
c. Pipeline infrastructure very good There are numerous gas lines in the basin.<br />
d. Overmaturity none<br />
e. Basin maturity mature<br />
f. Sediment consolidation consolidation/porosity reduction occurs with depth of burial<br />
g. Porosity/completion<br />
problems<br />
h. Permeability<br />
i. Porosity<br />
no expected completion problems based on existing field information
36°<br />
34°<br />
32°<br />
Northwestern Block<br />
120° 118° 116°<br />
Santa<br />
Barbara<br />
California<br />
Point Dume<br />
Los Angeles<br />
Basin<br />
San Diego<br />
Potential basin-centered<br />
gas accumulation<br />
Boundary of structural<br />
block<br />
Santa Monica Mountains<br />
Santa Monica Bay<br />
San Fernando Valley<br />
Santa Monica Fault<br />
Santa<br />
Monica<br />
A<br />
Pacific Ocean<br />
Beverly<br />
Hills<br />
Baldwin<br />
Hills<br />
Palos Verdes<br />
Hills<br />
Anticline, showing<br />
plunge direction<br />
Syncline, showing<br />
plunge direction<br />
Fault, dashed where<br />
approximate<br />
Verdugo<br />
Hills<br />
Elysian<br />
Hills<br />
Dominguez<br />
Hills<br />
San Rafael<br />
Hills<br />
Los<br />
Angeles<br />
Long<br />
Beach<br />
Palos Verdes Hills Fault<br />
San Gabriel Mountains<br />
Repetto Hills<br />
Signal<br />
Hill<br />
Sierra Madre<br />
Raymond Hill Fault<br />
Whittier<br />
Hills<br />
Newport-Inglewood Fault<br />
Huntington<br />
Beach<br />
Mesa<br />
San Gabriel Valley<br />
Whittier Fault<br />
La Habra Fault<br />
La Habra<br />
Valley<br />
Coyote Hills Uplift<br />
Anaheim Nose<br />
0 10 mi<br />
Newport<br />
Mesa<br />
A'<br />
El Modeno Fault<br />
Shady Canyon Fault<br />
Cucamonga Fault<br />
San Jose Hills<br />
Pelican Hill Fault<br />
Puente<br />
Hills<br />
Central Block<br />
Northeastern<br />
Block<br />
Santa Ana Mountains<br />
Figure 1. Index map of the Los Angeles basin, California, showing major structural features on the basement surface and four informal structural blocks.<br />
After Yerkes et al (1965) and Beyer (1988).<br />
San Joaquin<br />
Hills<br />
Dana Point<br />
Elsinore Fault<br />
Corona
Sea<br />
Level<br />
Depth in Miles<br />
10<br />
20<br />
A A'<br />
Palos Verde<br />
Hills<br />
Post-Late Pliocene<br />
Torrance Dominguez<br />
Central Basin Montebello<br />
San Gabriel<br />
Hills<br />
West East<br />
Valley<br />
?<br />
?<br />
Late Pliocene and Upper Miocene<br />
Middle Miocene and older<br />
Western basement complex<br />
(Catalina Schist)<br />
(Eastern) basement complex<br />
Oil field<br />
Figure 2. Generalized cross-section A-A' of the Los Angeles basin, California, showing selected oil fields. After Beyer (1988).<br />
Fault, dashed where<br />
inferred
System<br />
Quaternary<br />
Tertiary<br />
Late<br />
Cretaceous<br />
Pre-Turonian<br />
Mesozoic<br />
Series/Stage Age<br />
(mya) Santa Monica Mountains "Catalina Block"<br />
Santa Ana Mountains<br />
Pliocene<br />
Upper Miocene<br />
Middle<br />
Miocene<br />
Lower Miocene<br />
Oligocene<br />
? ?<br />
Eocene<br />
? ?<br />
Paleocene<br />
Maastrichtian<br />
Campanian<br />
Santonian<br />
Coniacian<br />
Turonian<br />
Shale, cherty shale,<br />
and sandstone<br />
Sandy shale, siltstone,<br />
sandstone, and/or<br />
conglomerate<br />
10<br />
20<br />
30<br />
40<br />
50<br />
60<br />
70<br />
80<br />
90<br />
100<br />
Pico Fm<br />
Repetto Fm<br />
Modelo Fm<br />
Upper Topanga Fm<br />
Undifferentiated volcanic<br />
rocks/Topanga Fm<br />
Vaqueros Fm<br />
Sespe Fm<br />
Llajas Fm (?)<br />
Unconformity<br />
Martinez Fm<br />
Unconformity<br />
Chico Fm<br />
San Pedro Fm<br />
Pico Fm<br />
Repetto Fm<br />
Monterey Fm<br />
"B" sedimentary rocks/<br />
"B" volcanic rocks<br />
Disconformity<br />
Upper San Fernando Fm<br />
Lower San Fernando Fm<br />
Puente Fm<br />
Undiff volcanic rocks<br />
Topanga Fm<br />
Undifferentiated<br />
marine<br />
sedimentary rocks<br />
Vaqueros<br />
and Sespe Fms<br />
Santiago Fm<br />
Silverado Fm<br />
Ladd Fm<br />
Williams Fm<br />
Trabuco Fm Trabuco Fm<br />
Santa Monica Slate/<br />
Undifferentiated<br />
granitic rocks<br />
Shale<br />
Siltstone<br />
Marine<br />
sandstone<br />
Non-marine<br />
sandstone<br />
Catalina Schist<br />
Conglomerate<br />
Breccia<br />
Malibu Coast Fault<br />
Unconformity<br />
Unconformity<br />
Holz<br />
Shale<br />
Member<br />
Baker<br />
Canyon<br />
Sandstone<br />
Member<br />
Santiago Peak volcanic<br />
rocks/<br />
Bedford Canyon Fm/<br />
Undifferentiated<br />
granitic rocks of the<br />
Southern California<br />
Batholith<br />
Undifferentiated<br />
volcanic rocks<br />
Undifferentiated<br />
metamorphic rocks<br />
Newport-Inglewood<br />
Fault Zone<br />
Schist or slate<br />
Undifferentiated<br />
igneous rocks<br />
Figure 3. Generalized stratigraphic columns for the Los Angeles basin, California. After Yerkes et al. (1965), and Campbell and Yerkes (1971).
GEOLOGIC SETTING<br />
The Michigan Basin is a circular-shaped intracratonic basin covering about 80,000 square miles (Catacosinos and<br />
Daniels, 1991). Structural boundaries of the basin include the Canadian Shield on the north, the Algonquin Arch on<br />
the east, the Findlay Arch on the south and east, and the Kankakee and Wisconsin Arches on the south and west<br />
(Figure 1). The basin contains Paleozoic marine sediments overlying Precambrian basement (Figures 1 and 2).<br />
The Middle Ordovician St. Peter Sandstone consists of massive sandstones interbedded with thinner dolomites<br />
(Figure 2). Deposition of this transgressive marine succession occurred in peritidal to storm-dominated outer-shelf<br />
environments (Catacosinos and Daniels, 1991). In the center of the Michigan Basin, the St. Peter conforms to and<br />
interfingers with the Trempeleau and Prairie du Chien Formations; however, at the basin margins, the sandstone lies<br />
unconformably over underlying units (Figure 2). Similarly, at the basin center the St. Peter grades to the overlying<br />
Glenwood Formation, but rests unconformably over underlying units at the basin margins. The St. Peter thickens to<br />
almost 1,100 ft in the basin center (Figure 3).<br />
The quartzose sandstones are fine- to medium-grained and cemented with silica and dolomite. Diagenesis has<br />
generally reduced porosities to less than 3%, but locally they may reach 10 to 15%. Porosity reduction occurred early<br />
in the burial history of the St. Peter (Drzewiecki et al., 1991). The formation contains several repetitive sequences<br />
that reflect the transgressive and highstand cycles resulting from major subsidence and structural movement within<br />
the basin. The sequences appear in wireline log signatures and corresponding lithologies (Figure 4) (Dott and Nadon,<br />
1992). The repetition of sandstone, claystone, and dolomite has not only influenced the diagenetic banding of the<br />
sandstone reservoirs, but also has compartmentalized the reservoir pressures.<br />
1<br />
Sandstone permeability ranges from 1.0 to >100 md (Figure 5).<br />
HYDROCARBON PRODUCTION<br />
The St. Peter has historically had some exploration, but well penetration and testing occurred only in the usually<br />
tight upper part. Over 36 gas fields have been discovered in the Glenwood-St. Peter “Deep Play” since the late 1980s<br />
(Barnes et al., 1992). Production depths vary from about 5,000 to 11,500 ft. Falmouth field produced 5.1 BCF from<br />
1987 to 1990, and some estimates place the per-well reserves at 2.0 to 14-plus BCF per 640 acre spacing. Test<br />
within the St. Peter Sandstone indicate overpressure exceeds 300 psi (Figure 5). Dott and Nadon (1992) believe<br />
overpressuring in the formation resulted from hydraulic head created during Wisconsinan glaciation. Figure 3 shows<br />
the mapped area of overpressure.<br />
Most traps are structural , and consist of several-mile long anticlines having closures of 20 to 80 ft west of the<br />
Mid-continent Rift and 100 to 200 ft east of the rift (Figure 3). Stratigraphic traps potentially exist. The reservoir<br />
“megacompartment” divides into smaller compartments within the St. Peter that correspond to repetitive depositional<br />
sequences (Figure 4). Fracture systems may also be present.<br />
Organic-rich shales in the Ordovician Foster Formation probably source the St. Peter Sandstone.<br />
EVIDENCE FOR BASIN-CENTERED GAS<br />
Vitrinite reflectance data suggests the Michigan Basin Ordovician section is thermally mature. Cercone and<br />
Pollack (1991) noted that the present-day geothermal gradient and overburden depth could not account for the<br />
maturation and concluded that a steeper gradient with an overburden composed of fluvial-deltaic sediments would<br />
create a tighter seal to cook the organic material.<br />
Although structure controls most gas production from the St. Peter, mapping the internal depositional and<br />
diagenetic sequences could identify stratigraphically controlled reserves (Dott and Nadon, 1992; Winter et al., 1995).<br />
If a seal exists, the erosional limit of the St. Peter Sandstone may hold a regional stratigraphic pinch-out play.
Province, Play and<br />
Accumulation Name:<br />
Geologic<br />
Characterization of<br />
Accumulation:<br />
Production and Drilling<br />
Characteristics:<br />
KEY ACCUMULATION PARAMETERS<br />
Michigan Basin, Ordovician, St. Peter Sandstone, overpressured.<br />
a. Source/reservoir The St. Peter Sandstone is probably sourced from organic-rich shales in the<br />
Ordovician Foster Fm. Production associated with anticlinal structures<br />
suggests the presence of fracture systems. Overpressuring is the result of the<br />
b. Total Organic Carbons<br />
(TOCs)<br />
hydraulic head created during the last glacial event.<br />
c. Thermal maturity Vitrinite reflectance values vary from .50 to 1.5 for the Ordovician.<br />
d. Oil or gas prone gas prone<br />
e. Overall basin maturity mature basin based on later Paleozoic exploration and production.<br />
f. Age and lithologies Middle Ordovician sandstones, dolomites, and shales.<br />
g. Rock extent/quality basin-wide source and reservoir-rock distribution. Currently 36 fields<br />
produce from this interval.<br />
h. Potential reservoirs<br />
i. Major traps/seals Most production occurs in anticlinal features with 20 ft to 200 ft closures<br />
associated with structural deformation occurring along the Midcontinent Rift<br />
System. Potential exists for stratigraphic traps as well.<br />
j. Petroleum<br />
generation/migration<br />
models<br />
k. Depth ranges 1.5 km to 3.5 km<br />
l. Pressure gradients Pressures reported to be 300 psi in excess of expected formation pressures.<br />
a. Important<br />
fields/reservoirs<br />
Falmouth field plus 35 other fields produce from the St. Peter Sandstone.
Economic<br />
Characteristics:<br />
b. Cumulative production Falmouth field has produced in excess of 5.1 bcf from 1987 to 1990.<br />
a. High inert gas content none<br />
b. Recovery good to moderate<br />
c. Pipeline infrastructure good<br />
d. Overmaturity none<br />
e. Basin maturity mature<br />
f. Sediment consolidation good to moderate consolidation<br />
g. Porosity/completion<br />
problems<br />
h. Permeability 0.01 to 100 md<br />
i. Porosity 3 to 10%<br />
low porosities and variable permeabilities may require stimulation of the<br />
reservoir
Michigan<br />
Michigan<br />
Basin<br />
Wisconsin<br />
Illinois<br />
Wisconsin Arch<br />
Lake Superior<br />
Lake<br />
Michigan<br />
cipi<br />
o T<br />
Indiana<br />
Kankakee<br />
Arch<br />
Ohio<br />
Jurassic sandstone and shale<br />
Lake Superior<br />
Syncline<br />
Pennsylvanian shale and sandstone<br />
Mississippian shale and sandstone<br />
Devonian evaporites and carbonates<br />
Silurian evaporites and carbonates<br />
Al<br />
bio<br />
n-S<br />
re<br />
n<br />
d<br />
H<br />
ow<br />
ell<br />
Bowling Green Fault<br />
Ant<br />
ic<br />
li<br />
n<br />
e<br />
Ontario<br />
Lake<br />
Huron<br />
Figure 1. Geologic map of the Michigan Basin. After Catacosinos and Daniels (1991).<br />
Grenville Front<br />
Findlay Arch<br />
Lake Erie<br />
Waverly Arch<br />
Algonquin Arch<br />
Chatham<br />
Sag<br />
0 50 mi<br />
Ordovician evaporites and<br />
carbonates<br />
Anticline<br />
Syncline<br />
Normal fault, hachures on<br />
downthrown side
Era System Sequence West East<br />
Mesozoic<br />
Paleozoic<br />
Precambrian<br />
Cambrian Ordovician<br />
Silurian<br />
Devonian<br />
Carboniferous Jurassic<br />
Zuni I<br />
Absaroka I<br />
Kaskaskia II<br />
Kaskaskia I<br />
Tippecanoe II<br />
Tippecanoe I<br />
Sauk<br />
III<br />
Sauk<br />
II<br />
Traverse<br />
Detroit River<br />
Bass Islands<br />
Salina<br />
Niagara<br />
Cataract<br />
Richmond<br />
Trenton<br />
Black River<br />
St. Peter Sandstone<br />
Prairie du Chien<br />
Lake Superior<br />
Keweenawan ?<br />
"Red Beds"<br />
Grand River<br />
Saginaw<br />
Bayport<br />
Michigan<br />
Marshall<br />
Coldwater<br />
Ellsworth<br />
Bell<br />
Sylvania<br />
Bois Blanc<br />
Garden Island<br />
Cabot Head<br />
Manitoulin<br />
Utica<br />
Trempeleau<br />
Munising<br />
Jacobsville<br />
Figure 2. Stratigraphic column of the Michigan Basin. After Dott and Nadon (1992).<br />
Immature clastic rocks derived<br />
from Appalachian and<br />
Ouachita sources<br />
Shale<br />
Shale, derived from east<br />
Sandstone, derived from<br />
orogen<br />
Sandstone, derived from<br />
northern and western<br />
basin margin outcrops<br />
Turbidite, derived from<br />
east (Appalachian Basin)<br />
Limestone<br />
Dolomite<br />
Karst topography<br />
Salt (halite)<br />
Igneous rock
Lake Michigan<br />
500<br />
Michigan<br />
Indiana<br />
700<br />
A<br />
Area of Midcontinent<br />
Rift System<br />
Area of gas production<br />
900<br />
300<br />
500<br />
1100<br />
900<br />
700<br />
700<br />
Ohio<br />
500<br />
900<br />
300<br />
100<br />
Lake Huron<br />
Lake Erie<br />
Figure 3. Isopach map of the St. Peter Sandstone overlain by the Midcontinent Rift system, gas production from<br />
the Glenwood Formation and St. Peter Sandstone, and pressure compartment outline. Cross section<br />
A-A' shown on Figure 4. After Catacosinos and Daniels (1991).<br />
A'<br />
Outline of pressure<br />
compartment (> 490 ft<br />
above mean sea level)<br />
50 mi<br />
1000<br />
Isopach of St. Peter<br />
Sandstone (in feet)
GEOLOGIC SETTING<br />
The Mid-Continent Rift is a 57,000 square mile horst and graben system located in the Superior<br />
Province of the north-central U.S. It follows an 800-mile long north-northeasterly trend from south-central<br />
Kansas to northeastern Minnesota, northwestern Wisconsin and to the western part of the Upper Peninsula<br />
of Michigan (Figure 1) (Palacas, 1995). Precambrian (Keweenawan) in age, this feature represents a failed<br />
continental rift characterized by broad horst blocks composed of layered basalts and flanked by high-angle<br />
normal faults that form the boundaries of adjacent sediment-filled half-grabens (Palacas, 1995).<br />
Development of the rift occurred approximately 1.1 billion years before present (Dickas, 1986). An adjacent<br />
structural depression related to the rift trends from Lake Superior southeastward into southern Michigan.<br />
Other provinces overlapping with or adjacent to the Mid-Continent rift trend include the Iowa Shelf, Forest<br />
City basin, Nemaha uplift, Salina basin, Sedgewick basin, and Cambridge Arch-Central Kansas uplift<br />
(Figure 1). Dickas (1986) mapped rift extent by recognizing significant gravity and magnetic anomalies<br />
throughout the trend. Newell et al. (1993) noted rejuvenation of some structural features by steeply dipping<br />
reverse faults, where the central horst has thrust over the basin margin.<br />
Stratigraphy appears generally similar along the rift complex, based on outcrop descriptions and logs<br />
for wells that have penetrated rift sediments (Figure 2). Sedimentary rocks in the Mid-Continent rift include<br />
arkosic and feldspathic sandstones, conglomerates, siltstones, and micaceous red, green and gray shales<br />
deposited in marine (Scott, 1966), alluvial plain (Dickas, 1986), and alluvial fan and lacustrine<br />
environments (Daniels, 1982; White and Wright, 1960; Tryhorn and Ojakangas, 1972; Kalliokoski, 1982;<br />
Catacosinos, 1973; and Fowler and Kuenzi, 1978). Layered basalts are common within the rift and compose<br />
a central horst block.<br />
The Defiance basin in Iowa is one of the deepest in the rift system. Geophysical modeling indicates<br />
32,800 ft of sediments (Anderson and Black, 1982). An exploratory well drilled in Iowa penetrated 1,355 ft<br />
of Keweenawan clastics, 55% of which were red-brown shales (Dickas, 1986). Two other exploratory wells<br />
penetrated significant thicknesses of Mid-Continent rift strata (Figure 1): the Texaco No. 1 Poersch<br />
(11,301 ft total depth/8,455 ft of rift strata penetrated) in northeastern Kansas; and the Amoco No. 1<br />
Eischeid (17,851 ft total depth/14,898 ft of rift strata penetrated) in west-central Iowa (Newell et al., 1993).<br />
Five wells have penetrated the Precambrian Nonesuch Shale and equivalents within the rift.<br />
Major traps or seals include interbedded shales, siltstones, layered basalts and fault gouge within the<br />
Nonesuch Formation, and tight horizons in the overlying Freda Sandstone and the Bayfield Group.<br />
HYDROCARBON PRODUCTION<br />
There is no significant hydrocarbon production within the rift. In 1933, operators produced small<br />
amounts of oil from fractured Precambrian quartzites in central Kansas, at the southern end of the rift trend.<br />
Paleozoic source rocks probably expelled this oil, which then migrated laterally into the Precambrian rocks<br />
along structural highs (Walters, 1953).<br />
1
EVIDENCE FOR BASIN-CENTERED GAS<br />
The Texaco No. 1-31 Poersch encountered several shows of oil and gas during drilling and testing (Paul<br />
et al., 1985). Total organic carbon values (TOCs) from the Amoco No. 1 Eischeid in Iowa ranged up to<br />
1.4%, but the section is overmature (average Tmax = 503° C). In southeastern Minnesota, the Lonsdale No.<br />
65-1 well encountered dark gray mudstone of the Solor Church (Nonesuch) Formation, and TOC values<br />
varied from 0.13% to 1.77% (Palacas, 1995); the average Tmax was 494° C (Hatch and Morey, 1984;<br />
1985). In 1929, a cable-tool rig drilled 822 ft of Precambrian carbonaceous shales and sandstones and had<br />
some oil and gas shows (Newell et al., 1988). This well was 21 miles northeast of the Texaco No. 1<br />
Poersch well.<br />
The Precambrian Nonesuch Fm and equivalents evidently have hydrocarbon generative potential<br />
throughout the rift system. The interval contains 250 to 700 ft of interbedded, laminated, dark gray to black<br />
siltstone, silty shale and sandstone. The silty shale contains TOC values averaging 0.6% and reaching a<br />
maximum of 3% (Imbus et al., 1990; Pratt et al., 1991). The greatest TOC values in the Nonesuch and<br />
equivalents occur near the middle of the unit and toward the eastern end of the rift system.<br />
Palacas (1995) reported that the Nonesuch generated oil and gas from type I and type II kerogens in the<br />
deeper parts of several rift basins. Thermal maturity was sufficient to crack oils into gaseous hydrocarbons<br />
in the Iowa and Minnesota segments of the rift. He concluded that two phases of hydrocarbon generation<br />
occurred, one during the early phase of rift extension, and the second during a compressional phase after the<br />
deposition of Paleozoic sediments. Remigration of hydrocarbons probably occurred during the second stage.<br />
Newell et al. (1993) measured a present day geothermal gradient of 15.6 °F per 1,000 ft in the 1-4 Finn<br />
well in northeastern Kansas (Figure 3); the bottom-hole temperature at 3,974 ft was 116 °F. Thus, bottomhole<br />
temperatures in deeply buried rift sediments should have sufficed for hydrocarbon generation. No<br />
pressure data is known to exist for wells drilled into the Nonesuch or equivalent rocks (Newell, 1999,<br />
personal communication).<br />
2
Province, Play and<br />
Accumulation Name:<br />
Geologic<br />
Characterization of<br />
Accumulation:<br />
KEY ACCUMULATION PARAMETERS<br />
Superior Province, Mid-Continent rift, potential basin-centered gas play.<br />
a. Source/reservoir Oronto Group (Wisconsin), Nonesuch Formation (Michigan and Wisconsin),<br />
Solor Church Formation (Minnesota), Lower Red Clastics (Iowa), Red<br />
Clastics (Nebraska), and Rice formation (Kansas).<br />
b.Total Organic Carbons<br />
(TOCs)<br />
range from 0 to 3%<br />
c.Thermal maturity Tmax 423 – 503° C<br />
d.Oil or gas prone oil prone; mostly type I and II kerogen<br />
e.Overall basin maturity maturation levels are moderate to high. Highest thermal maturity is in Iowa<br />
and Minnesota and with depth and proximity to central horst.<br />
f.Age and lithologies Precambrian (Keweenawan) age, Nonesuch (and equivalent) arkosic sands,<br />
silts and silty shales<br />
g. Rock extent/quality wide source and reservoir rock distribution. Reservoir quality is unknown<br />
because of few outcrops and few wells drilled. Expected reservoir quality<br />
varies depending on clay content, interbedded shales and silts and the degree<br />
of fracturing.<br />
h.Potential reservoirs No production. Precambrian Nonesuch and equivalents.<br />
i.Major traps/seals interbedded shales, siltstones, layered basalts and fault gouge within the<br />
Nonesuch formation, tight horizons have also been identified in the overlying<br />
Freda sandstone and in the Bayfield group.<br />
j.Petroleum<br />
generation/migration<br />
models<br />
in-situ generation and short distance migration. Hydrocarbon generation may<br />
be ongoing in deeper basins. Present day geothermal gradient is 15.6° F per<br />
1000 ft. The Bakken shale model of Meissner (1978) may apply in the rft<br />
for hydrocarbon generation and explulsion directly into adjacent beds.<br />
k.Depth ranges accumulation depths are thought to range from 3000 ft to 25,000 ft<br />
l.Pressure gradients
Production and Drilling<br />
Characteristics:<br />
Economic<br />
Characteristics:<br />
a. Important<br />
fields/reservoirs<br />
b. Cumulative production none<br />
a. High inert gas content unknown<br />
entire rift trend virtually untested; no production to date.<br />
b. Recovery Recoveries vary depending on permeability, porosity and depth; diagenetic<br />
alteration may increase with depth.<br />
c. Pipeline infrastructure poor<br />
d. Overmaturity probably overmature in the deepest parts of the basins<br />
e. Basin maturity most basins are mature (Ro ranges from 0.5 to 1.43)<br />
f. Sediment consolidation most rocks are well indurated<br />
g. Porosity/completion<br />
problems<br />
h. Permeability<br />
Silty shales, clay, and arcosic/feldspathic sands have high alteration<br />
potential; also may have swelling clays and will produce migrating fines<br />
problems. Silty shales and siltstones are interbedded with sands.<br />
i. Porosity average porosities range from 4% to 18% percent
49°<br />
45°<br />
40°<br />
North Dakota<br />
South Dakota<br />
Nebraska<br />
Kansas<br />
Rice Basin<br />
Oklahoma<br />
Mineola graben<br />
1 Poersch<br />
Manitoba<br />
1 Koutney<br />
Nemaha uplift<br />
Minnesota<br />
Northern<br />
boundary<br />
zone<br />
Defiance Basin<br />
1 Eischied<br />
1-4 Finn<br />
Wilson 1<br />
Iowa<br />
horst<br />
Iowa<br />
Ontario<br />
Lonsdale 65-1<br />
Stratford<br />
Basin<br />
Shenandoah<br />
Basin<br />
Missouri<br />
Arkansas<br />
Lake<br />
Superior<br />
Michigan<br />
Illinois<br />
X<br />
White Pine<br />
Mine<br />
Wisconsin<br />
Thurman/Redfield<br />
zone<br />
100° 95° 90°<br />
Keweenawan clastic rocks<br />
Mafic rocks<br />
0 50 mi<br />
Figure 1. Location map of the Mid-Continent rift system in the central United States. After Dickas (1986),<br />
Berendsen et al (1990), and Newell et al (1993).<br />
Well<br />
Fault, dashed where inferred,<br />
hatchure on downthrown side
Era Series Kansas<br />
Proterozoic<br />
Upper<br />
Keweenawan<br />
Middle<br />
Keweenawan<br />
Rice<br />
Formation<br />
Nebraska Iowa Minnesota Wisconsin<br />
"red clastics"<br />
horst flank horst flank horst flank<br />
* "upper<br />
red clastic<br />
sequence"<br />
* "lower<br />
red clastic<br />
sequence"<br />
Hinkley<br />
Sandstone<br />
Fond du Lac<br />
Formation<br />
Solor Church<br />
Formation<br />
Oronto<br />
Group<br />
Bayfield Group<br />
Chengwatana<br />
Volcanic<br />
Group<br />
Michigan<br />
Upper Peninsula<br />
Chequamegon<br />
Sandstone<br />
Devils Island<br />
Sandstone<br />
Orienta<br />
Sandstone<br />
Freda<br />
Sandstone<br />
Nonesuch<br />
Shale<br />
Copper Harbor<br />
Conglomerate<br />
Portage Lake<br />
Volcanics<br />
Volcanic rocks Tentative correlations (per Newell et al, 1993)<br />
*<br />
Figure 2. Stratigraphic correlation of units along the Mid-Continent rift system, central United States. After White (1972), Dickas (1986), Mudrey and<br />
Ostrom (1986), Witzke (1990), and Newell et al (1993).<br />
Jacobsville Sandstone
Depth (feet)<br />
0<br />
1000<br />
2000<br />
3000<br />
4000<br />
5000<br />
6000<br />
7000<br />
8000<br />
9000<br />
Time (Ma)<br />
1200 1100 1000 900 800 700 600 500 400 300 200 100 0<br />
?<br />
Precambrian<br />
Top is TTI = 15<br />
Base of gray<br />
siltstone<br />
1<br />
Original top of<br />
gray siltstone<br />
Paleozoic<br />
110° - 115° C (230° - 239° F)<br />
2<br />
Thermally immature<br />
Phanerozoic section<br />
3<br />
Mesozoic<br />
4<br />
1<br />
2<br />
3<br />
4<br />
Events<br />
Deposition of Arbuckle<br />
Group; uplift of southeast<br />
Nebraska arch<br />
Formation of Nemaha<br />
uplift<br />
Pennsylvanian and<br />
Permian deposition;<br />
post-Permian erosion<br />
Cretaceous deposition;<br />
subsequent erosion<br />
Oil window<br />
Rifting period<br />
Figure 3. Time-temperature index (TTI) model of the 1-4 Finn well. The graph depicts a 40° C/km (2.19° F/100 ft.) geothermal gradient following a heat<br />
pulse during rifting. The relationship of subsidence and thermal decline during rifting is speculative. After Newell et al (1993).
GEOLOGIC SETTING<br />
The Hornbrook Basin is located in the northeast corner of California and south-central Oregon, and is bounded on the west<br />
by the Klamath Mountains (Figure 1). The Cascade Mountains and the central Oregon volcanic plateaus form the basin’s<br />
northern boundary. The province becomes progressively more block-faulted eastward, eventually converging with the Basin and<br />
Range province. The southern boundary stretches across part of the Basin and Range, the northern end of the Sierra Nevada, the<br />
Sacramento Valley, and the Klamath Mountains. The Cascades overlap part of the province, dividing the Shasta Valley on the<br />
west from the Modoc Plateau to the east.<br />
Potential source and reservoir strata in the basin include the Upper Cretaceous Hornbrook Formation and the overlying<br />
Upper Cretaceous-Eocene Montgomery Creek Formation (Figures 2 and 3). Deposition of the Hornbrook occurred in a large,<br />
relatively undeformed successor basin called the “Hornbrook Basin.” This basin probably extended beyond the present Shasta<br />
Valley-Yreka Valley-Modoc Plateau limits, and probably connected with the Sacramento/Great Valley basins to the south and<br />
to the Ochoco Basin northeast in central Oregon. Some Hornbrook strata may have continuity with the Great Valley Sequence.<br />
The Hornbrook Formation derives mostly from debris shed from the Klamaths Mountains and rests unconformably on pre-<br />
Cretaceous metamorphic and igneous basement (Figure 3). The basal unit is a marine to marginal-marine conglomerate. The<br />
formation includes several fining-upwards marine sequences, and the last unit is a 2,600 ft-thick marine shale. At the type<br />
section, the Hornbrook thickens to 4,200 ft (Nilsen, 1984b).<br />
The Montgomery Creek Formation also contains much organic shale and siltstone, although deposition occurred mostly in<br />
a braided stream, non-marine environment (Higinbotham, 1986).<br />
Erskine et al. (1984) measured the integrated potential of the basin and deduced that non-magnetic strata (principally<br />
Hornbrook and lower Montgomery Creek rocks) thicken eastward under the Cascade Range volcanics and the basalts of the<br />
Modoc Plateau (Figure 2). They projected a thickness of 16,000 ft for this sequence of sedimentary strata. Erskine’s findings<br />
suggest the Hornbrook “basin” formed by uplift of the Klamaths during the Nevadan orogeny, and that it may be as relatively<br />
undeformed beneath the Modoc basalts as is the Upper Cretaceous Great Valley Sequence to the south. The basin continued to<br />
fill without significant tectonic interruption until the onset of Basin and Range deformation in the middle Miocene. Thereafter,<br />
horst-and-graben structures developed in the eastern Modoc Plateau. Thick plateau basalts covered the basin in the middle<br />
Miocene and early Pliocene. Cascade volcanism affected the west-central part of the original basin from the late Pliocene to the<br />
present.<br />
HYDROCARBON PRODUCTION<br />
Most wells drilled to a depth of 500 ft or greater generally have had gas shows, including those for water or geothermal.<br />
One operator drilled three wells to 1.200 ft near the north end of Honey Lake and found flow rates of 200 to 450 MCFD,<br />
probably originating from a Pliocene lacustrine sand. The wells never produced commercially. Montgomery (1988) noted that<br />
the Klamath 1 Kuck well in northeastern Siskiyou County had oil shows from two Upper Cretaceous sands, but ultimately<br />
produced only salt water (Figure 1).
EVIDENCE FOR BASIN-CENTERED GAS<br />
Several lines of evidence possibly indicate basin-centered gas in the Hornbrook Basin:<br />
1) gas seeps and a non-commercial gas field;<br />
2) source rocks capable of generating gas; and<br />
3) a possible 16,000-ft thick section of “non-magnetic sedimentary rock.”<br />
Total organic carbon (TOC) values for the Hornbrook Formation range from 0.1 to 1.2 wt%, and average 0.52 wt%<br />
(Figure 4) (Law et al., 1984). Figure 4 shows vitrinite reflectance of samples taken along the Interstate 5 corridor ranges from<br />
0.40 to 0.83.<br />
Potential source rocks include coal and coal-bearing shales within the Blue Gulch Mudstone and Dutch Creek Siltstone<br />
members of the Hornbrook Formation (Keighin and Law, 1984), and coal-bearing flood-plain and marsh mudstones and<br />
lacustrine deposits of the upper Cretaceous to Eocene Montgomery Creek Formation (Higinbotham, 1986). Some of these<br />
sediments crop out in the Shasta Valley and in other parts of the western basin. The units dip generally eastward to a depth of<br />
15,000 ft in the central Modoc Plateau. Thus, most of the source rocks probably lie at depths from 15,000 to 31,000 ft in<br />
much of the basin. At these depths the most likely hydrocarbons would be thermally generated natural gas. Law et al. (1984)<br />
noted the kerogen is Type III and would probably produce gas and little or no oil.
Province, Play and<br />
Accumulation Name:<br />
Geologic<br />
Characterization of<br />
Accumulation:<br />
KEY ACCUMULATION PARAMETERS<br />
Shasta - Yreka Valley and Modoc Plateau, Northeastern California, Central<br />
Southern Oregon. Possible Cretaceous to Upper Tertiary Overpressured Gas<br />
Play.<br />
a. Source/reservoir Potential Source Rocks: Slope shales of the Hornbrook Fm. Coal and coal<br />
bearing shales within the Blue Gulch Mudstone Member, and the Dutch<br />
Creek Siltstone Member of the Hornbrook Fm (Keighin and Law, 1984)<br />
b.Total Organic Carbons<br />
(TOCs)<br />
Coal-bearing flood plain, marsh mudstones and lacustrine deposits within the<br />
upper Cretaceous to Eocene Montgomery Creek Fm (Higinbotham, 1986).<br />
Possible, poorly-known Mid-Mesozoic dark brown to black shales<br />
underlying the Klamath Mountains.<br />
Late Cretaceous Hornbrook Fm. = 0.1 to 1.2 Wt % organic Carbon,<br />
averaging .52% TOC. These are surface samples that may have been strongly<br />
oxidized, so TOC may be conservative. (Law et. al. 1984)<br />
c.Thermal maturity Surface samples are generally marginally mature to mature (Law, et. al.<br />
1984).<br />
d.Oil or gas prone gas prone; kerogen is generally Type III; will probably produce gas and little<br />
or no oil (Law et. al. 1984).<br />
e.Overall basin maturity immature; this is a frontier exploration basin<br />
f.Age and lithologies Primary exploration target strata range in age from Late Cretaceous through<br />
the Miocene<br />
g. Rock extent/quality<br />
h.Potential reservoirs Potential Reservoir Rocks: Montgomery Creek Fm, Fluvial, Eocene,<br />
(Higinbotham, 1986). Hornbrook Fm., Late Cretaceous, (Nilsen, 1984a;<br />
1984b). Interbedded Mid to late Cenozoic volcanic and lacustrine rocks,<br />
rocks, similar to Rattle Snake Hills Gas Field (abandoned), South Central<br />
Eastern Washington (Hammer, 1934)<br />
i.Major traps/seals Traps may be of all types (structural and/or stratigraphic).<br />
j.Petroleum<br />
generation/migration<br />
models<br />
Weimer (1996) “cooking pot model”<br />
k.Depth ranges Potential reservoir rocks occur from the surface in the Shasta Valley and<br />
Ashland, Oregon area, to an approximate depth of 9 km. Also in the eastern<br />
Modoc Plateau, near the transition with the Basin and Range Province.<br />
l.Pressure gradients<br />
(Fuis et al., 1984); (Erskine et al. , 1984)
Production and Drilling<br />
Characteristics:<br />
Economic<br />
Characteristics:<br />
a. Important<br />
fields/reservoirs<br />
none<br />
b.Cumulative production none<br />
a. High inert gas content Unknown though possible; other basins with a high volcanic and intrusive<br />
content often contain higher than normal CO2, helium, and other inert<br />
components.<br />
b.Recovery<br />
c.Pipeline infrastructure P G & E has a 36-in gas transmission line through the area. Additional lines<br />
are being built or are planned through the area to transport Canadian gas to<br />
the major Central and Southern California markets.<br />
d.Overmaturity Unknown; deeper parts of basin in the central and eastern Modoc Plateau<br />
may be mature to overmature. Those areas directly overlain by the Cascade<br />
Volcanic Range and the Plateau Volcanics surrounding the Medicine Lake<br />
Caldera to the east may be overmature.<br />
e.Basin maturity Shallow parts of basin are probably immature.<br />
f.Sediment consolidation Target formations are very competent<br />
g. Porosity/completion<br />
problems<br />
h.Permeability<br />
i.Porosity<br />
Hornbrook Fm permeability measured from surface samples is low,<br />
generally less than 1.2 md. However, this is an active tectonic area, and may<br />
have well developed fracture porosity (Keighin and Law, 1984).
40°<br />
Trinity<br />
1 Kuck<br />
Klamath Expl.<br />
Redding<br />
Mt. Shasta<br />
Siskiyou<br />
Valley<br />
Klamath<br />
Mountains<br />
PG&E 12"<br />
Pipeline<br />
122°<br />
Pleasant<br />
Valley<br />
Sacramento Valley<br />
California<br />
Lower Klamath<br />
Lake Refuge<br />
Tule Lake<br />
Refuge<br />
Mt. Lassen<br />
Big<br />
Valley<br />
Goose Lake<br />
Valley<br />
Sierra Nevada<br />
(Mostly Accreted Terrane)<br />
Surprise<br />
Valley<br />
Siskiyou Modoc<br />
Shasta Lassen<br />
PG&E 36" Pipeline<br />
Plumas<br />
121°<br />
120°<br />
42°<br />
Susanville<br />
Well or Drill Hole<br />
Anschutz<br />
Madiline<br />
Plains<br />
Anschutz<br />
Anschutz<br />
Webber<br />
Honey Lake<br />
Valley<br />
41°<br />
40°<br />
120°<br />
Figure 1. Generalized geologic map showing natural gas pipelines and oil and gas exploration wells in the Modoc<br />
Plateau area, northeastern California. After Montgomery (1988).
Elevation in Feet<br />
10,000<br />
Sea<br />
Level<br />
10,000<br />
20,000<br />
123° 122° 45" 122° 30" 122° 15" 122° 121°45"<br />
Round<br />
Mountain<br />
Condrey Mountain Terrane<br />
(Non-magnetic metasediments)<br />
Dense and highly magnetic unit<br />
(ophiolite)<br />
Cottonwood<br />
Peak<br />
Klamath<br />
River<br />
Triassic amphibolite<br />
and serpentinite Landslide<br />
Volcanic landslide<br />
debris<br />
Sp<br />
Mica schist of unknown age and correlation<br />
Ql<br />
Qvb<br />
Tvb<br />
Twc<br />
Kh<br />
Depositional contact<br />
Fault<br />
Sp Serpentinite<br />
Quaternary lake deposits<br />
Quaternary basaltic volcanic rocks<br />
Tertiary basaltic volcanic rocks<br />
Eastern Paleozoic and Triassic Belt<br />
(Salmon River Terrane)<br />
Triassic amphibolite<br />
Tertiary (Oligocene-Eocene) Western Cascades sequence<br />
Cretaceous Hornbrook Formation<br />
Tertiary basaltic<br />
volcanics (Tvb)<br />
Eagle<br />
Rock<br />
Twc<br />
Tvb<br />
Ql<br />
Butte<br />
Valley<br />
Quaternary basaltic<br />
volcanics (Qvb)<br />
Twc<br />
Ql<br />
Western Cascades volcaniclastics<br />
Eocene to mid-Miocene<br />
Twc<br />
Kh<br />
Hornbrook Formation (Kh)<br />
(Cretaceous)<br />
Figure 2. Cross section derived from integrated potential field model of the western part of the Hornbrook Basin-Modoc Plateau region of Northeastern<br />
California. West-east section located approximately at latitude 41° 55" north. After Erskine et al. (1984).<br />
Ql<br />
Mahogany<br />
Mountain<br />
Qvb<br />
Twc<br />
Ash<br />
Creek<br />
Ql<br />
Qvb
System Series<br />
Lithology<br />
Quaternary Holocene Basalt; Lacustrine and Fluvial Sediments<br />
Tertiary<br />
Upper<br />
Cretaceous<br />
Pre-Cretaceous<br />
Pleistocene<br />
Pliocene<br />
Miocene<br />
Upper<br />
Oligocene<br />
Lower<br />
Oligocene<br />
Upper-Middle<br />
Eocene<br />
Maestrichtian<br />
Campanian<br />
Santonian<br />
Coniacian<br />
Turonian<br />
Cenomanian<br />
? ? ?<br />
Alturas Formation<br />
(Basalt, Lacustrine Sediments)<br />
Cedarville Series<br />
(Basalt, minor Rhyolite,<br />
Lacustrine Sediments)<br />
Weaverville Formation (Trinity County)<br />
(Non-marine Sandstones and Shales)<br />
Upper Montgomery Creek Formation<br />
(and equivalent)<br />
(Non-marine, Fluvial Sandstones and Shales)<br />
Lower Montgomery Ck.<br />
Hornbrook Formation<br />
(Marine)<br />
? ? ?<br />
Redding Formation<br />
(Marine)<br />
Klamath-Sierra Nevada<br />
Metamorphic and Intrusive Rocks<br />
Figure 3. Stratigraphic column of the Hornbrook Basin, Upper Cretaceous to Recent. After Montgomery (1988).
T36S<br />
T37S<br />
T38S<br />
T39S<br />
T40S<br />
T41S<br />
T48N<br />
T47N<br />
T46N<br />
T45N<br />
T44N<br />
R4W R3W R2W R1W R1E R2E R3E<br />
Rogue<br />
Jacksonville<br />
River<br />
13-16<br />
17-19<br />
Oregon<br />
California<br />
Klamath River<br />
Medford<br />
Ashland<br />
8-11<br />
38-40<br />
41-52<br />
53, 55-60<br />
Yreka<br />
61-62<br />
23-37<br />
20-22<br />
12<br />
Hornbrook<br />
Shasta River<br />
R11W R10W R9W R8W R7W R6W R5W<br />
Sample Location<br />
Scale<br />
N<br />
0 5 10 miles<br />
1-7<br />
Location<br />
1-7<br />
8-11<br />
12<br />
13-16<br />
17-19<br />
20,21<br />
22<br />
23-37<br />
38-40<br />
41-52<br />
53<br />
54<br />
55-60<br />
61,62<br />
54<br />
R0 .60<br />
.60<br />
.64<br />
.83<br />
.67<br />
.67<br />
.40-.52<br />
.67<br />
.52-.58<br />
.51<br />
.59<br />
TOC (%)<br />
0.9<br />
.33-.55<br />
.10-.76<br />
1.13<br />
1.14<br />
.34-.80<br />
Figure 4. Location of Hornbrook Formation source rock samples showing vitrinite (R0) and total organic carbon<br />
(TOC) values. After Law et al. (1984).<br />
23.6
GEOLOGIC SETTING<br />
The Paradox Basin extends across southeastern Utah and southwestern Colorado along a roughly<br />
northwest-southeast trend. Several structures form its boundaries and contributed sediments: the ancestral<br />
Uncompahgre Uplift to the northeast, the Monument Uplift to the southwest, and the Emery Uplift to the<br />
northwest (Figure 1) (Baars and Stevenson, 1981). Figure 2 shows a partial stratigraphy of the basin.<br />
During the Pennsylvanian (Desmoinesian) period, the basin accumulated deposits of algal carbonates<br />
and evaporites (halite, gypsum, and potash) which interfingered with clastic deposits shed from surrounding<br />
higher regions (mostly the ancestral Uncompahgre Uplift; the present Uncompahgre Plateau formed during<br />
the early Tertiary Laramide orogeny). Toward the basin depocenter, evaporite deposits interfinger with<br />
siltstones, organic-rich dolomites and black shales. Deposition of Uncompahgre alluvium deformed the<br />
underlying salts, which created northwest- to southeast-trending anticlines parallel to basement faults<br />
(Figure 3) (Hite and Buckner, 1981).<br />
The Cane Creek interval is the 22nd of 29 carbonate cycles identified within the Paradox Member of the<br />
Hermosa Formation (Figures 2 and 4) (Hite et al., 1984). Three units make up the Cane Creek interval: the<br />
uppermost "A" unit of interbedded red siltstone and anhydrite; the "B" unit of black, organic-rich shales and<br />
dolomites; and the lowermost "C" unit of interbedded red siltstone and anhydrite. The "B" unit represents the<br />
source and reservoir rock and varies in thickness from less than 10 ft to almost 30 ft. Combined, the three<br />
clastic units are almost 150 ft thick near the basin depocenter, but pinch out against the ancestral<br />
Uncompahgre flank (Morgan, 1992). The interval thins in synclines and thickens on anticlines; this<br />
occurrence may result from (1) original deposition associated with fault movement, (2) structural thickening<br />
from small-scale folding and faulting (i.e., repeat sections), and/or (3) flowage within anhydrite layers<br />
(Montgomery, 1992).<br />
HYDROCARBON PRODUCTION:<br />
Most production in the Paradox originates from Ismay and Desert Creek carbonates in the southern part<br />
of the basin. Some structures in the Mississippian Redwall and Leadville limestones also produce<br />
hydrocarbons. To date, Cane Creek production has occurred only in the northern part of the basin, and<br />
mostly from fractures and fracture intersections on the flanks of anticlines that parallel the ancestral<br />
Uncompahgre Uplift. The nature of the fracturing makes production very sensitive to drilling mud weights<br />
and completion techniques (Montgomery, 1992). As a result, recoveries vary greatly.<br />
Cane Creek wells show significant reservoir overpressuring, at least 6,000 to 6,500 psi at depths of<br />
7,200 to 7,500 ft. The overpressuring may result from salt flowage (Montgomery, 1992). Oil is typically<br />
sweet, having API gravities from 43 to 46. Gas associated with oil production is usually flared, because of<br />
the lack of pipelines in the area. The gas is sweet, containing between 1 and 2% nitrogen and/or carbon<br />
dioxide.<br />
The # 1 Long Canyon well drilled by Southern Natural Gas has yielded over 1 MBO since 1962. In<br />
1991, Columbia Gas completed Kane Creek 27-1 in the Cane Creek interval using horizontal drilling;<br />
cumulative production to 1992 exceeded 100,000 bbls of oil.<br />
1
EVIDENCE FOR BASIN CENTERED-GAS<br />
The play is mature in the northern part of the Paradox Basin, while the southern portion of the basin is<br />
immature and may have gas potential in subtle structures. Traps within the Cane Creek interval appear to<br />
be small tightly folded salt structures; stratigraphic traps are possible. Data from the Gibson Dome well<br />
(GD-1; Figures 3 and 4) shows total organic carbon (TOC) content in the interval to be 3.96 wt%; vitrinite<br />
reflectance (Ro) averaged 0.54, and Tmax reached 438 C (Hite et al., 1984). This data indicates the Cane<br />
Creek may be self-sourcing. The reservoir/source may communicate with other organic-rich reservoir/<br />
source rocks.<br />
2
Province, Play and<br />
Accumulation Name:<br />
Geologic<br />
Characterization of<br />
Accumulation:<br />
KEY ACCUMULATION PARAMETERS<br />
Rocky Mountain, Paradox Basin, Pennsylvanian, Hermosa Formation,<br />
Paradox Member, Cane Creek interval, overpressured.<br />
a. Source/reservoir The Cane Creek interval is self-sourcing, and current production indicates<br />
fracturing of the reservoir is required to produce economic quantities of oil<br />
and gas. Overpressuring largely occurs from salt deformation which may<br />
b. Total Organic Carbons<br />
(TOCs)<br />
result from salt flowage in conjunction with basement structures.<br />
Cane Creek interval in the Gibson Dome #1 core hole = 3.96 wt%<br />
c. Thermal maturity Cane Creek interval in the Gibson Dome #1 core hole Ro = 0.54; Tmax =<br />
438° C<br />
d. Oil or gas prone both oil and gas prone<br />
e. Overall basin maturity considered to be among top Rocky Mtn basins in terms of maturity<br />
f. Age and lithologies Pennsylvnian aged black shales and dolomites<br />
g. Rock extent/quality basin-wide source and reservoir-rock distribution (although substantially less<br />
than the halite deposition limit typically used to define the limits of the<br />
Paradox Basin). About 486 wells (basin-wide) may have penetrated this<br />
interval<br />
h. Potential reservoirs Cane Creek interval is sporadically productive and other organic-rich<br />
intervals, such as the Chimney Rock and Gothic intervals along with many<br />
other unnamed units may deserve closer attention.<br />
i. Major traps/seals may be discrete tightly folded salt structures associated with basement fault<br />
blocks. Possible stratigraphic traps may result from lateral facies changes to<br />
continentally derived red-beds.<br />
j. Petroleum<br />
generation/migration<br />
models<br />
k. Depth ranges 2000 ft; on some structures to 7500 ft<br />
l. Pressure gradients average formation pressure is approximately 0.85 psi/ft
Production and Drilling<br />
Characteristics:<br />
Economic<br />
Characteristics:<br />
a. Important<br />
fields/reservoirs<br />
Bartlett Flat, Cane Creek, Gold Bar, Long Canyon, Shafer Canyon, Wilson<br />
Canyon.<br />
b. Cumulative production The Long Canyon well has produced in excess of 1 MMBO since 1962, and<br />
the Kane Creek Federal #27-1 has produced in excess of 100 MBO as of<br />
1992.<br />
a. High inert gas content no; from 1.0 % to 3.0 %<br />
b. Recovery highly variable<br />
c. Pipeline infrastructure poor<br />
d. Overmaturity none<br />
e. Basin maturity For the Cane Creek interval the southern portion of the basin is immature.<br />
f. Sediment consolidation The producing interval is well inurated due to depth of burial.<br />
g. Porosity/completion<br />
problems<br />
h. Permeability<br />
i. Porosity<br />
The reservoir/source rock is fractured and overpressured resulting in the use<br />
of heavy drilling mud weights, which may result in formation damage and<br />
difficult and costly completions. Production of hypersaline formation waters<br />
has often caused plugging of production tubing and equipment which may in<br />
turn give erroneous flow rates and production declines.
Olympic - Wichita<br />
Salt Lake City<br />
Cordilleran Hingeline<br />
Kaibab<br />
Mogollon Hingeline<br />
Colorado Plateau<br />
Structural feature<br />
Lineament<br />
Circle<br />
Cliffs<br />
Utah<br />
Lineament<br />
Colorado<br />
Flagstaff<br />
Uinta Uplift<br />
Emery<br />
Monument<br />
C o l orado<br />
Arizona<br />
Grand<br />
Junction<br />
Paradox<br />
Basin<br />
Defiance<br />
Basin<br />
Eagle<br />
Basin<br />
Uncompahgre Uplift<br />
San Juan<br />
Basin<br />
Zuni<br />
P lateau<br />
New Mexico<br />
Fault, dashed where<br />
approximate<br />
Thrust fault, teeth on<br />
upper plate<br />
Front Range Uplift<br />
Albuquerque<br />
Lineament<br />
Denver<br />
Colorado<br />
0 100 mi<br />
Figure 1. Location map of Paradox basin, showing the Colorado Plateau, other local basins, structural features, and<br />
their relationship to the major orthogonal set of lineaments. Northwest-trending lineaments are right lateral.<br />
Northeast-trending lineaments are left lateral. The stress ellipsoid indicates that maximum compression<br />
occurs in a north-south direction. After Baars and Stevenson (1981).
System<br />
Pennsylvanian<br />
Series Formation Member<br />
Virgilian<br />
Missourian<br />
Desmoinesian<br />
?<br />
Atokan<br />
?<br />
Morrowan<br />
Hermosa<br />
Molas<br />
Upper<br />
(Honaker<br />
Trail)<br />
Paradox<br />
Lower<br />
(Pinkerton<br />
Trail)<br />
Evaporite<br />
Facies Cycle<br />
1<br />
2<br />
3<br />
4<br />
5<br />
6<br />
7<br />
8<br />
9<br />
10<br />
11<br />
12 - 13<br />
14<br />
15<br />
16<br />
17<br />
18<br />
19<br />
20<br />
21<br />
23<br />
24<br />
25<br />
26<br />
27<br />
28<br />
29<br />
Production<br />
Interval<br />
Ismay<br />
Desert Creek<br />
Akah<br />
Barker Creek<br />
Alkali Gulch<br />
"Gothic"<br />
"Chimney<br />
Rock"<br />
"Cane Creek"<br />
Figure 2. Stratigraphic column for Pennsylvanian rocks in the Paradox basin. After Hite, Anders, and Ging (1984).
Emery<br />
Garfield<br />
Utah<br />
Arizona<br />
Green River<br />
San Juan<br />
Wayne<br />
Colorado River<br />
Uncompahgre Uplift<br />
SV-3<br />
A'<br />
A<br />
ER-1<br />
GD-1<br />
Moab<br />
SD-1<br />
Gibson Dome<br />
Monticello<br />
Grand<br />
Dolores<br />
Montezuma<br />
Cortez<br />
Mesa<br />
Montrose<br />
San Miguel<br />
San Juan River 020 mi<br />
Paradox basin Anticline Core hole<br />
Silverton Delta<br />
Colorado<br />
New Mexico<br />
Figure 3. Map of the Paradox basin showing core hole locations and basin boundary as determined by the limit of<br />
halite occurence in the Paradox Member. After Hite et al (1984).
A A'<br />
Hermosa<br />
Formation<br />
Upper<br />
Member<br />
Paradox<br />
Member<br />
Lower<br />
Molas Formation<br />
Shaffer Dome No. 1<br />
Sec 15 T27S R20E<br />
1<br />
TD =<br />
4160 ft<br />
29<br />
28<br />
2<br />
"Chimney Rock"<br />
"Cane Creek"<br />
?<br />
?<br />
27<br />
Gibson Dome No. 1<br />
Sec 21 T30S R21E<br />
3<br />
TD =<br />
6384 ft<br />
26<br />
4 5<br />
25<br />
Molas Formation<br />
Figure 4. Diagrammatic north-south cross section showing Pennsylvanian rocks and the carbonate cycles in three U. S. Department of <strong>Energy</strong> (DOE) core<br />
holes (SD-1, GD-1, and ER-1). Only the GD-1 core hole penetrated the Cane Creek interval. After Hite et al (1984).<br />
24<br />
23<br />
22<br />
21<br />
20<br />
"Gothic"<br />
19<br />
18<br />
Feet<br />
Elk Ridge No. 1<br />
Sec 30 T37S R19E<br />
17<br />
TD =<br />
3842 ft<br />
2000<br />
1500<br />
1000<br />
500<br />
0<br />
Upper<br />
Member<br />
Paradox<br />
Member<br />
Lower<br />
Member<br />
Hermosa<br />
Formation<br />
0 5 10 15 20<br />
Miles
Black River<br />
Formation<br />
Glenwood<br />
Formation<br />
St. Peter<br />
Sandstone<br />
Brazos<br />
Shale<br />
Prairie du<br />
Chien Group<br />
Upper St. Peter<br />
Lower St. Peter<br />
Sequence 7<br />
Sequence 6<br />
Sequence 5<br />
Sequence 4<br />
Sequence 3<br />
Sequence 2<br />
Sequence 1<br />
Transgressive sequence<br />
Early highstand sequence<br />
Late highstand sequence<br />
A A'<br />
39.1 mi 22.4 mi 2.5 mi 23.6 mi 30.4 mi<br />
Boyce Weingartz<br />
Ballentine Hunt-Martin<br />
Limestone or other carbonate rock<br />
Sandstone<br />
Shale<br />
Whyte<br />
Dolomite<br />
Well and well name<br />
Principal producing interval<br />
South Almer<br />
Figure 4. West-east cross section through central Michigan basin showing internal depositional, highstand and transgressive sequences within the St. Peter<br />
Sandstone and the Glenwood Formation. After Dott and Nadon (1992)
Elevation (ft. msl)<br />
Elevation (ft. msl)<br />
-3300<br />
-3400<br />
-3500<br />
-3600<br />
0.001 0.01 0.1<br />
-3300<br />
-3400<br />
-3500<br />
ρ = 1.16 g/cm 3<br />
-3600<br />
35,000 40,000 45,000<br />
Glenwood Formation (transition zone)<br />
Permeability (md)<br />
St. Peter Sandstone<br />
Prairie du Chien Group<br />
Glenwood Formation (transition zone)<br />
Pressure (kPa)<br />
Data point from drill stem test<br />
1 10 100<br />
St. Peter Sandstone<br />
Prairie du Chien Group<br />
Data point from repeat formation test<br />
50,000 55,000<br />
Figure 5. Permeability distribution and pressure variation within the St. Peter Sandstone, derived from drill stem tests<br />
and repeat formation tests in the Kielpinski well, Bay County, Michigan.
GEOLOGIC SETTING<br />
The Park Basins province is located 50 miles west of Denver, in central Colorado. Four mountain<br />
regions define the basin limits: the Front Range to the east; Medicine Bow Mountains to the north; Park,<br />
Gore, and Mosquito Ranges on the west; and the Thirty-nine Mile Volcanic Range to the south (Figure 1).<br />
Structural or stratigraphic differences separate the Park Basin into three intermontane basins–North, Middle,<br />
and South Park. Tertiary volcanics of the Rabbit Ears Range physically divide the otherwise structurally<br />
similar North and Middle Parks. Thirty miles to the south lies South Park Basin, which has undergone a<br />
more complex structural and stratigraphic history. Precambrian rocks and Tertiary intrusives of the<br />
Williams Fork and Vasquez Mountains isolate this basin from North and Middle Parks.<br />
The 50-by 180-mile Park Basin complex is predominantly a north-south trending, asymmetrical<br />
syncline. The complex was an uplifted feature of the ancestral Front Range throughout most of the<br />
Paleozoic. The narrow syncline formed during the Late Cretaceous to Early Tertiary Laramide orogeny.<br />
Tectonism progressed from Late Cretaceous thrust faulting and folding to later episodes of intrusion,<br />
volcanism, and reverse and normal faulting. Major thrusts occur along the northern and eastern margins of<br />
the basin and show as much as 20 miles of movement (Maughan, 1988). Superimposed within the syncline<br />
are high-angle reverse faults (up to 10,000 ft of displacement), normal faults, tight folds, and volcanic rocks<br />
(Figure 1).<br />
The basins preserve from 10,000 to 20,000 ft of sediments (sometimes stacked in thrust plates) (Savant<br />
Resources, 1999). Figure 2 shows stratigraphic columns for each park basin. Sediments of North and<br />
Middle Park Basins are largely Mesozoic sands, shales, and marls (Figure 3). Southwestern South Park<br />
exhibits a thick Paleozoic sequence of carbonates, shales, and arkosic sandstones (Figure 4). The Laramide<br />
orogeny caused a period of basin-wide non-deposition, so Tertiary sediments unconformably overlie<br />
Cretaceous rocks. The Tertiary section generally consists of non-marine clastics interspersed with coals and<br />
volcanics. Quaternary alluvium reflects the present quiescent phase of the basin.<br />
HYDROCARBON PRODUCTION<br />
Exploration has found hydrocarbons in anticlinal folds associated with thrusting in the Upper Jurassic-<br />
Lower Cretaceous shoreline sands of the North Park Basin (Figure 3). The Colorado Oil and Gas<br />
Commission (1997) recorded16.5 MMBO and 12.3 BCF from Battleship, Lone Pine, and North and South<br />
McCallum fields.<br />
Target basin-centered gas intervals are in the Upper Cretaceous: the Apache Creek Sandstone of the<br />
Pierre Shale and the brittle, calcareous shales of the Niobrara (Figure 2). There are numerous hydrocarbon<br />
shows but no recorded production from the Apache Creek. The Pierre B sand is probably an equivalent<br />
sandstone and has produced approximately 1.4 MMCFG and 10.5 MBO (Maughan 1988). Fractured shales<br />
of the Niobrara Formation have produced about 278,000 BO and 156 MMCFG from the Delaney Butte,<br />
Michigan River, Canadian River, Coalmont, Johnny Moore Mountain, and Carlstrom fields (Colorado Oil<br />
and Gas Commission, 1997). Mallory (1977) provides details of this fracture play.<br />
1
EVIDENCE FOR BASIN-CENTERED GAS<br />
The Apache Creek Formation in South Park has had significant hydrocarbon shows. In 1999 Savant<br />
Resources LLC evaluated the basin and obtained gas data for the Hunt Tarryall Federal 1-17 well (Figure 4).<br />
The company found a 24-ft section of the Apache Creek yielded 195 MCFD of pipeline-quality gas. Testing<br />
revealed 0.3 md matrix permeability, 8.3% average porosity, and 0.52 psi/ft pressure gradient, which<br />
indicated formation damage. Savant recalculated open flow for the entire section and found 1,500 to 2,945<br />
MCFD without hydraulic fracturing and 7,344 MCFD with induced fracturing. Based on the encouraging<br />
results, Savant expects to reenter and retest this well in 2000.<br />
The Federal 1-17 well data demonstrates Spencer’s (1987) and Surdham’s (1995) characteristics for<br />
accumulation of basin-centered gas:<br />
2<br />
1. Overpressuring of the formation occurs below 10,000 ft. The Apache Creek Sandstone at 11,150<br />
feet displayed a pressure gradient of 0.52 psi/ft.<br />
2. Dry hydrocarbons are the fluid-pressuring phase and rarely produce water. The pressure test<br />
recovered dry gas of pipeline grade (1021 Btu).<br />
3. Temperature of the overpressured rock is 180-230 0 F or greater. The temperature of the Apache<br />
Creek Sandstone was 230 0 F.<br />
4. Source beds can generate hydrocarbons at rates exceeding loss. Minimum vitrinite reflectance (Ro)<br />
is 0.6% in oil-producing source beds and greater that 0.7% in gas-producing source beds. Pierre and<br />
Upper Niobrara shales exhibit Ro values between 1.3 and 1.4% Ro. With TOC values around<br />
1.3% and S1 + S2 values up to 2.6 mg/gm, these rocks demonstrate additional generation<br />
potential.<br />
5. Overpressuring is in tight strata. Permeabilities ranging from 0.18 to 0.4 md typify the tight strata<br />
and suffice for production, after induced fracturing.<br />
Based on available information (such as a net pay of 100 ft and extensive reservoirs in the South Park<br />
thrust sheet), Savant Resources (1999) calculated gas reserves of 1.4-2.3 TCF in the Apache Creek play.<br />
Depth to the Apache Creek is 11,150 feet in the Hunt well and varies widely (Figure 4) (Wellborn, 1977).<br />
Similar thrusts containing the prospective horizon at the required depth could create additional prospects.<br />
Notable secondary targets include the Fox Hills Sandstone, the Upper Transition Member of the Pierre<br />
Shale, the Niobrara Formation, the Frontier Sandstone, the Dakota Group, and the Garo (Entrada) Sandstone<br />
(Figure 2). Although South Park has had no production to date, a blow-out in the Pierre Shale and<br />
hydrocarbon seeps (Elkhorn Thrust, Three Mile Seep, and Willow Creek Pass) indicate a potential for an<br />
unconventional deep gas play. Total organic carbon (C) content for the Pierre Shale ranged from 0.1 to<br />
1.5% (Barker et al., 1996; Savant Resources, 1999), and 1.4 to 2.1% for the Mowry Shale (Aldy, 1994).<br />
Since the Apache Creek Formation also exists in North and Middle Park, basin-centered gas plays may<br />
potentially occur in those basins as well.
Province, Play and<br />
Accumulation Name:<br />
Geologic<br />
Characterization of<br />
Accumulation:<br />
KEY ACCUMULATION PARAMETERS<br />
Rocky Mountains and Northern Great Plains Province, Colorado Park<br />
Basins; unconventional basin-centered gas play, Upper Cretaceous Pierre<br />
Shale (Apache Creek Sandstone) through Jurassic Entrada.<br />
a. Source/reservoir Source Rocks: organic-rich layers of the Niobrara (Maughan, 1989) and the<br />
Sharon Springs Member of the Pierre Shale. (Gautier et al., 1984). Primary<br />
reservoirs: Upper Cretaceous Apache Creek Sandstone and<br />
b.Total Organic Carbons<br />
(TOCs)<br />
calcareous shales of the Niobrara. Secondary reservoirs: Cretaceous Fox<br />
Hills Sandstone, Upper Transition Member of the Pierre Shale, Niobrara Fm,<br />
Frontier Sandstone, Dakota Group, and Jurassic Entrada Sandstone.<br />
Pierre Shale 0.1 to 1.5% (Barker, 1996) and 1.3% (Savant Resources, 1999);<br />
Mowry Shale 1.4-2.1% (Aldy, 1994).<br />
c.Thermal maturity Ro of Pierre and Niobrara ranges from 1.3 to 1.4.<br />
d.Oil or gas prone gas prone<br />
e.Overall basin maturity Source mature; basin is sparsely drilled.<br />
f.Age and lithologies North Park contains Permian through Tertiary sands, shales, and<br />
volcaniclastics, with lesser amounts of carbonates and marls. South Park<br />
contains a thick sequence of Paleozoic arkosic sandstones, carbonates, and<br />
shales.<br />
g. Rock extent/quality The shoreline sands of the Apache Creek appear throughout the 27 wells in<br />
South Park and have yet to be studied in North Park. Niobrara is present<br />
throughout the Park Basins; both are of tight reservoir quality. Niobrara and<br />
Pierre source rocks also occur basin wide and have adequate TOC and<br />
vitrinite reflectance values.<br />
h.Potential reservoirs Minor production in North Park Basin (Maughan 1988) in both the Pierre<br />
and Niobrara.<br />
i.Major traps/seals Pierre and Niobrara shales or any of the numerous thrust faults such as the<br />
Elkhorn or the South Park serve as physical seals. Pressure seals occur<br />
around a depth of 10,000 ft.<br />
j.Petroleum<br />
generation/migration<br />
models<br />
In-situ generation is the accepted model.<br />
k.Depth ranges Minimum depth of 10,000-20,000 ft.<br />
l.Pressure gradients 0.52 psi/foot (Savant Resources, 1999)
Production and Drilling<br />
Characteristics:<br />
Economic<br />
Characteristics:<br />
a. Important<br />
fields/reservoirs<br />
The only production is in North Park Basin. Niobrara fractured shale<br />
production occurs at Canadian River, Coalmont, Carlstrom, Grizzly Creek,<br />
Johnny Moore Mountain, North and South McCallum, Michigan River, and<br />
Delaney Butte fields. Pierre sand production is small and limited to North<br />
and South McCallum fields.<br />
b.Cumulative production 277.9 MBO and 156 MMCFG from the Niobrara (Colo. Oil and Gas Comm.,<br />
1997) and 1.4 MMCFG and 10.5 MBO in the Pierre (Maughan, 1988)<br />
a. High inert gas content Gas at North & South McCallum fields measures 95% CO2 (Carpen, 1957).<br />
This may be a local phenomenon where igneous intrusions have carried CO2<br />
through the normal faults associated with these fields (Biggs, 1957).<br />
Savant Resources (1999) has sampled pipeline-grade gas (1021 Btu) in the<br />
Apache Creek Sandstone. There is very little test data of the Niobrara but<br />
one test at Delaney Butte shows a low Btu of 212 (Wellborn, 1983).<br />
b.Recovery Recoveries around 2 TCF are only hypothetical at this point and will be a<br />
function of permeability and porosity combined with natural and induced<br />
fracturing.<br />
c.Pipeline infrastructure Public Service of Colorado and Colorado Natural Gas pipelines are currently<br />
in the basin.<br />
d.Overmaturity Because of several periods of Laramide volcanism, certain areas of the basins<br />
such as Cameron Pass may be overmature; but this is generally not a problem<br />
(Maughan, 1988).<br />
e.Basin maturity most of the basin is mature<br />
f.Sediment consolidation most rocks are well indurated<br />
g. Porosity/completion<br />
problems<br />
h.Permeability<br />
i.Porosity<br />
Natural fractures and overpressuring enhance flow for tight sandstones and<br />
calcareous shales. Hydraulic fracturing is probably essential to develop this<br />
play.
41°<br />
40°<br />
107° Jackson<br />
106°<br />
N<br />
Sierra Madre<br />
Explanation<br />
Oil and gas field<br />
Precambrian rocks<br />
Extrusive igneous rocks<br />
Intrusive igneous rocks<br />
Fault<br />
Thrust fault<br />
Park Range<br />
Gore Range<br />
thrust fault<br />
Sheep Mountain<br />
Lone<br />
Pine<br />
Summit<br />
County<br />
0 10<br />
Scale<br />
20 mi<br />
Independence Mtn thrust fault<br />
Butler<br />
Creek<br />
Delaney<br />
Butte<br />
Coalmont<br />
Rabbit Ears Range<br />
Grand<br />
G<br />
o<br />
r<br />
e<br />
Michigan<br />
River<br />
Williams F ork<br />
R<br />
Battleship<br />
Carlstrom<br />
North<br />
McCallum<br />
McCallum<br />
South<br />
Grizzly<br />
Creek<br />
Blue Ri ver Valley<br />
a<br />
n<br />
g<br />
Mosquito<br />
e<br />
Spring Creek fault<br />
Medicine Bow Mountains<br />
North Park<br />
Middle Park<br />
Williams Range thrust fault<br />
Craig<br />
Steamboat<br />
Springs<br />
Glenwood<br />
Springs<br />
Grand<br />
Junction<br />
Park Basins<br />
Figure 1. Generalized geologic map of the Colorado Park basin province. After Tweto et al. (1978), Scott<br />
et al. (1978), Bryant et al. (1981), and Maughan (1989).<br />
Canadian<br />
River<br />
Johnny Moore<br />
Mountain<br />
Mountain s<br />
Range<br />
Never Summer<br />
Mtns.<br />
Vasquez Mountains<br />
South<br />
Park<br />
Vasqu ez<br />
thrust<br />
Elkhorn thrust fault<br />
B B'<br />
South Park fau lt<br />
Fort<br />
Collins<br />
Denver<br />
Colorado<br />
Springs<br />
Cañon City<br />
Location Map<br />
Gilpin<br />
Clear Creek<br />
Park<br />
Colorado<br />
41°<br />
40°<br />
39°
System<br />
Tertiary<br />
Cretaceous<br />
Jurassic<br />
Triassic<br />
Permian<br />
Pennsylvanian<br />
Mississippian<br />
Precambrian<br />
Northwestern<br />
Colorado<br />
Browns Park<br />
Formation<br />
Bridger, Green<br />
River, Wasatch, and<br />
Fort Union Fms<br />
Lance<br />
Formation<br />
Fox Hills Ss<br />
Mesaverde<br />
Formation<br />
Mancos<br />
Shale<br />
Frontier<br />
Formation<br />
Mowry Shale<br />
Dakota<br />
Sandstone<br />
Morrison<br />
Formation<br />
Curtis Formation<br />
Entrada<br />
Sandstone<br />
State Bridge<br />
Formation<br />
S. Canyon Creek Dolo<br />
Schoolhouse Ss<br />
Maroon<br />
Formation<br />
Eagle Valley<br />
Evaporite<br />
Minturn<br />
Fm<br />
Maroon<br />
Fm<br />
South Park<br />
Formation<br />
Niobrara<br />
Formation<br />
Dakota<br />
Sandstone<br />
Morrison<br />
Formation<br />
Garo<br />
Sandstone<br />
Minturn<br />
Formation<br />
Belden Shale Belden<br />
Sh<br />
Leadville Ls<br />
Leadville Limestone<br />
Gilman Ss<br />
lower Paleozoic<br />
rocks<br />
South Park Middle Park North Park<br />
Wagontongue Fm<br />
Antero Fm<br />
Balfour Fm<br />
Laramie<br />
Formation<br />
Fox Hills Ss<br />
Pierre<br />
Shale Pierre<br />
Shale<br />
Apache Creek<br />
Sandstone<br />
Rabbit Ears<br />
Volcanics<br />
Middle Park<br />
Formation<br />
Niobrara<br />
Formation<br />
Benton Shale Benton Shale<br />
Dakota<br />
Sandstone<br />
Morrison<br />
Formation<br />
North Park Fm<br />
White River Fm<br />
Sundance<br />
Formation<br />
Morrison<br />
Formation<br />
Upper<br />
Member<br />
Lower<br />
Member<br />
Sundance<br />
Formation<br />
Morrison<br />
Formation<br />
Chugwater<br />
Formation Red Peak<br />
Formation<br />
Forelle Limestone<br />
Glendo Member<br />
Entrada<br />
Sandstone<br />
Lyons Minnekahta<br />
Ss Opeche<br />
Owl Canyon Fm<br />
Ingleside<br />
Formation<br />
Fountain<br />
Formation<br />
Oil Gas Possible source rock in Park basins<br />
Figure 2. Stratigraphic column of Colorado Park basins showing source rock and reservoir potential. After<br />
U. S. Geological Survey (1995).<br />
Niobrara<br />
Fm<br />
Benton<br />
Shale<br />
Dakota<br />
Sandstone<br />
Coalmont<br />
Formation<br />
Pierre<br />
Shale<br />
Smoky Hill<br />
Shale Member<br />
Codell Ss Mbr<br />
Middle Shaly Mbr<br />
Mowry Shale Mbr<br />
Lykins Shale<br />
NE Colorado<br />
SE Wyoming<br />
Dawson Arkose<br />
Pierre<br />
Shale<br />
Smoky Hill<br />
Shale Member<br />
Niobrara<br />
Fm<br />
Ft. Hayes Ls Mbr Ft. Hayes Ls Mbr<br />
Upper Member<br />
Lower Member<br />
Benton<br />
Group<br />
Dakota<br />
Group<br />
Denver<br />
Formation<br />
Arapahoe and<br />
Laramie Fms<br />
Fox Hills Ss<br />
Codell Sandstone<br />
Carlile Shale<br />
Mowry Shale<br />
Muddy Sandstone<br />
Skull Creek Shale<br />
Fall River Ss<br />
Lakota Ss<br />
Goose Egg Fm<br />
Madison<br />
Ls
A A'<br />
SW NE<br />
0 2 mi<br />
Scale<br />
Tc<br />
Ku<br />
Kn<br />
Kl & J<br />
TR<br />
pC<br />
Lone Pine Butler Creek North McCallum Battleship<br />
Possible<br />
fracture<br />
Coalmont Formation<br />
Alluvial / fluvial sandstone and shales<br />
Pierre Shale<br />
Marine sandstones and shales<br />
Niobrara Formation<br />
Chalk and shale<br />
Dakota Grp, Morrison Fm & Entrada Fm<br />
Marine and nearshore sandstone and shale<br />
Chugwater Formation<br />
Red shales<br />
Precambrian rocks<br />
Crystalline basement<br />
Explanation<br />
Fault<br />
showing relative movement<br />
Contact<br />
Unconformity<br />
Well<br />
Oil and gas<br />
Producing zone<br />
Figure 3. Generalized cross section of North Park basin, Colorado. After Lange and Wellborn (1985).<br />
Park Range<br />
Lone<br />
Pine<br />
5000<br />
5000 A<br />
Coalmont<br />
0<br />
?<br />
0<br />
Walden syncline<br />
0<br />
Battleship<br />
Spring Creek fault zone<br />
(-5000)<br />
5000<br />
Medicine Bow Mountains<br />
0<br />
A' (Seismic Line)<br />
5000<br />
North Park syncline<br />
Location of Section<br />
0 20 mi<br />
Syncline<br />
Scale<br />
Coalmont<br />
Canadian River<br />
North McCallum<br />
Front Range<br />
Thrust fault Oil or gas field
B<br />
W<br />
T<br />
K<br />
K<br />
K & J<br />
Amoco<br />
State of Colorado<br />
#1<br />
Approximate top of<br />
overpressured<br />
basin-centered gas<br />
South Park Formation<br />
Pierre Shale<br />
Apache Creek Sandstone<br />
Dakota Ss & Entrada Ss<br />
Amoco<br />
Reinicker Ridge<br />
#1 (projection)<br />
South Park Thrust<br />
San Isabel Thrust<br />
Reinicker Ridge Thrust-Hayden Lineament<br />
Explanation<br />
Precambrian crystalline basement<br />
Figure 4. Generalized cross section B-B' of South Park basin, Colorado. After Savant Resources (1999).<br />
Pz<br />
pC<br />
Hunt Tarryall<br />
Federal #1-17<br />
NE NE 17-10S-75W<br />
Undifferentiated Paleozoic rocks<br />
Fault, showing<br />
relative movement<br />
Gas-charged unit<br />
Elkhorn Thrust<br />
Upper Thrust Sheet<br />
probable gas charge<br />
(hanging wall of the<br />
San Isabel Thrust)<br />
Middle Thrust Sheet<br />
known gas charge<br />
(hangingwall of the<br />
South Park Thrust)<br />
0 2 mi<br />
Scale<br />
B'<br />
E<br />
Well<br />
12,000<br />
8,000<br />
4,000<br />
Sea Level<br />
-4,000<br />
-8,000<br />
-12,000<br />
-16,000<br />
-20,000<br />
Gas production<br />
Elevation in Feet
GEOLOGIC SETTING<br />
The Permian Basin of west Texas and eastern New Mexico covers about 76,250 square miles of the southwest<br />
part of the North American mid-continent craton (Frenzel et al., 1988). Figure 1 shows the location and generalized<br />
structure of the area. This part of the craton remained exposed until Late Cambrian, when marine transgression<br />
formed the Tobosa Basin and filled it mainly with carbonate and fine-grained clastic sediments. The Tobosa Basin<br />
was relatively stable until the Late Mississippian, when structural deformation began forming the Pecos Arch and<br />
Matador, Central Basin and Diablo Uplifts. By the Early Pennsylvanian, the Tobosa Basin had broken up into the<br />
main elements making up the present day Permian Basin: Northwest Shelf, Delaware Basin, Central Basin Platform,<br />
Midland Basin, Val Verde Basin, and Eastern Shelf (Frenzel et al., 1988). Pennsylvanian strata of the basin consists<br />
of marine and paralic sandstones, shales, and carbonates.<br />
A final structural pulse deformed the Central Basin and Diablo Platforms in the Early Permian (Wolfcampian).<br />
Permian sedimentation filled the Delaware and Midland Basins with deep-water carbonates and shales, basin-margin<br />
reef carbonates, evaporites, and red-bed sequences. Permian strata contain most of the hydrocarbon reserves within<br />
the basin. Since the Triassic, the Permian Basin has remained tectonically stable.<br />
HYDROCARBON PRODUCTION<br />
Figure 2 shows stratigraphic columns for various basins and platforms in the area. Originally assigned to a<br />
Permian (lower Leonardian) red-bed sequence in the Northwest Shelf, the Abo Formation now includes dolomitized<br />
carbonates along the northern margins of the Delaware Basin and the Central Basin Platform. The age-equivalent<br />
Wichita-Albany strata in the Central Basin Platform and in the Delaware and Midland Basins has produced<br />
hydrocarbons historically. In the Midland Basin, the age-equivalent and mature Spraberry Trend covers hundreds of<br />
square miles and has produced over 1,388 BCF of gas plus associated condensate (Bebout and Garret, 1989).<br />
Abo Formation production derives from two plays: platform carbonates and fluvial/deltaic sandstones. Most<br />
platform-carbonate production comes from the Abo reef trend (Figure 1). The reef reservoirs are stratigraphic traps<br />
with clean, white-tan-gray, fine to coarsely crystalline dolostones. Porosity is secondary, consisting of vugs, vertical<br />
fractures and intercrystalline pores. Cumulative production from the reef reservoirs was 456 BCF as of December<br />
31, 1990. A smaller shelf sub-play also exists, and consists of dolomitized back-reef sediments having irregularly<br />
distributed porosity and permeability. Traps are low-relief anticlines that have produced 227 BCF through 1990. The<br />
Abo fluvial/deltaic sandstone is a tight gas play on the Northwest Shelf. Production comes from lenticular, red, very<br />
fine to fine grained, silty, arkosic arenites (Broadhead, 1993). A clay-hematite matrix has reduced the primary<br />
porosity. Deep-seated faults that tap into older Paleozoic source beds have charged these reservoirs. The three main<br />
fields have produced 273 BCF from stratigraphic traps as of December 31, 1990.<br />
1
EVIDENCE FOR BASIN-CENTERED GAS<br />
Neither of the two Abo plays are basin-centered. The carbonate play rings the Permian basin margin, and the<br />
sandstone play is confined to the northern Northwest Shelf area (Figure 3). However, both plays have anomalous<br />
pressure gradients associated with them. The fluvial/deltaic sandstones show a significant underpressure to<br />
producing fields. The single shelf-carbonate sub-play field has a normal pressure gradient. Abo reef carbonates<br />
display a trend: near-normal pressure gradients exist in the south and become underpressured northward. Similar<br />
south-to-north underpressure gradients are visible in data from the underlying Wolfcamp Formation, overlying Yeso<br />
Formation, and basinal-equivalent Bone Spring Formation.<br />
2<br />
Unit or Lithology Depth (ft) Pressure Gradient (psi/ft) Temperature (°F)<br />
Yeso Fm..................................5,000 – 7,030.................. 0.263 – 0.495..........................105 – 122<br />
Bone Spring Fm........................5,480 – 9,700.................. 0.343 – 0.428..........................128 – 180<br />
Abo sandstones.........................2,830 – 4,180.................. 0.295 – 0.387..........................101 – 114<br />
Abo reef carbonates...................6,020 – 8,650.................. 0.286 – 0.430..........................109 – 140<br />
Wolfcamp Fm ......................... 8,020 – 13,250................. 0.354 – 0.843..........................129 – 193
Province, Play and<br />
Accumulation Name:<br />
Geologic<br />
Characterization of<br />
Accumulation:<br />
KEY ACCUMULATION PARAMETERS<br />
Southwestern U.S., west Texas and eastern New Mexico. Lower Permian<br />
Abo Formation<br />
a. Source/reservoir Source intervals: poorly documented and appear to be largely speculative in<br />
the literature. Major sources are thought to occur in Permian basinal shales<br />
and carbonates (Wolfcamp and Bone Springs), Permian shelf shales<br />
b.Total Organic Carbons<br />
(TOCs)<br />
and low energy carbonates (Wolfcamp and Abo/Wichita-Albany),<br />
Pennsylvanian limestones and shales, and Upper Devonian<br />
(Woodford)–Mississippian (Barnett) shales (Broadhead, 1993; Hanson et al.,<br />
1991).<br />
Reservoir intervals: Abo platform carbonates are mainly dolomite, Abo<br />
fluvial/deltaics are mainly red-bed sandstones.<br />
1-3% for Midland Basin Spraberry black shales (Ramondetta, 1982)<br />
c.Thermal maturity Kerogen Type: algal and amorphous for Midland Basin Spraberry black<br />
shales (Ramondetta, 1982)<br />
d.Oil or gas prone both oil and gas prone<br />
e.Overall basin maturity considered mature along with adjoining basins in the southern U.S.<br />
f.Age and lithologies Permian Abo platform carbonates-lower Leonardian, Permian Abo<br />
fluvial/deltaic sandstones-lower Leonardian (Broadhead, 1993).<br />
g. Rock extent/quality Source rock occurs basin wide, Abo platform carbonate reservoir rock has a<br />
distribution which follows the margin of the Delaware and Midland Basins<br />
and the Central Basin Platform, Abo fluvial/deltaic sandstones are found<br />
h.Potential reservoirs<br />
north of the barrier reef trend on the Northwest Shelf.<br />
i.Major traps/seals Abo platform carbonates: anticline/dome and lateral changes in porosity<br />
and/or permeability because of changes in depositional environment; Abo<br />
fluvial/deltaic sandstones: stratigraphic trap, but poorly understood<br />
j.Petroleum<br />
generation/migration<br />
models<br />
(Broadhead, 1993).<br />
Barber (1979)<br />
k.Depth ranges Abo platform carbonates, 6020-8650 ft; Abo fluvial/deltaic sandstones, 2830-<br />
4180 ft (Broadhead, 1993)<br />
l.Pressure gradients
Production and Drilling<br />
Characteristics:<br />
Economic<br />
Characteristics:<br />
Fields/<br />
Reserves<br />
a. Important<br />
fields/reservoirs<br />
b.Cumulative production<br />
Cumulative<br />
Gas (BCF)<br />
Abo platform carbonates: Brunson South, Corbin, Empire, Lovington,<br />
Skaggs, Vacuum, Vacuum North, Wantz, and Kingdom<br />
Abo fluvial deltaic sandstones: Pecos Slope West, Pecos Slope South, and<br />
Pecos Slope<br />
a. High inert gas content Abo fluvial/deltaic sandstones: CH4-86.6%, C2H6-4.8%, all other CxHx-<br />
3.4% N2-5.22%, CO2-0.03% (Petroleum Information, 1983).<br />
Composite Abo data: CH4-84.0%, C2H6-4.7, all other CxHx-3.9%, CO2-<br />
0.2%, N2-6.6%, He-0.2% (Hogman et al., 1993)<br />
b.Recovery<br />
c.Pipeline infrastructure very good There are numerous gas lines in the basin.<br />
d.Overmaturity none<br />
e.Basin maturity mature<br />
Number of<br />
Wells<br />
Abandoned<br />
Wells<br />
Spacing<br />
(acre)<br />
Brunson South..........................129.1......................165............ .............12........... .............40<br />
Corbin.....................................20.2.......................33............ .............10........... .............40<br />
Empire....................................293.6......................391............ .............47........... .............40<br />
Lovington.................................13.0.......................26............ .............43........... .............40<br />
Skaggs.......................................7.0.........................6............ ...............2........... .............40<br />
Vacuum...................................129.2......................134............ .............45........... .............40<br />
Vacuum North...........................40.8......................284............ ............115........... .............80<br />
Wantz......................................50.5......................144............ ............112........... .............40<br />
Kingdom..................................51.0......................184............ ............................ .............40<br />
Pecos Slope West.......................21.4......................170............ .............18........... ...........160<br />
Pecos Slope South .....................20.5......................107............ ...............4........... ...........320<br />
Pecos Slope.............................230.8......................603............ .............11........... ...........160
f.Sediment consolidation good to moderate consolidation<br />
g. Porosity/completion<br />
problems<br />
h.Permeability 0.0067 md<br />
i.Porosity 12 to 14%<br />
Abo fluvial/deltaic sandstones are classified as tight gas. These reservoirs<br />
require acidization and artificial fracturing. Average in-situ permeability is<br />
0.0067 md; average porosity is 12-14% with 9% necessary for economic<br />
production. Production operates on a pressure depletion/gas expansion drive.<br />
Abo platform carbonates have an irregular distribution of secondary porosity,<br />
averaging 6-14% but ranging from 1.5-18.3%. Permeability also has an<br />
an irregular distribution resulting in poor fluid communication within the<br />
reservoir. Permeability averages 1.5-25 md but ranges from 0.1-1,970 md.<br />
This play operates on a primary gas-cap expansion drive augmented by<br />
secondary gas-cap growth due to pressure dissolution (Broadhead, 1993). In<br />
the Empire field some component of water drive may be operating (LeMay,<br />
1972).
New Mexico<br />
Texas<br />
Huapache<br />
Flexure<br />
Van Horn<br />
Dome<br />
Back Reef<br />
Chaves<br />
Eddy<br />
Fore Reef<br />
Delaware Basin<br />
Marathon<br />
Roosevelt<br />
Lea<br />
Thrust Belt<br />
Northern<br />
Platform<br />
Central Basin Platfo r m<br />
Russell<br />
Brown<br />
West<br />
Seminole<br />
Matador Uplift<br />
Horseshoe Reef<br />
Midland<br />
Basin<br />
Fore Reef<br />
Reagan<br />
Uplift<br />
Midland Basin Eastern Shelf<br />
Basin<br />
Basin<br />
Fore reef<br />
Diablo<br />
Platform<br />
Empire<br />
Fore Reef<br />
Loco<br />
Hills<br />
Northwest Shelf<br />
Ropes<br />
Corbin<br />
Lovington<br />
Vacuum<br />
Reef<br />
Back Reef<br />
Jones<br />
Ranch<br />
Brumley<br />
(Abo)<br />
West Anton<br />
Fore<br />
Ownby<br />
Wasson<br />
Reef<br />
Prentice<br />
Reef, with trend and<br />
dip direction; dashed<br />
where approximate<br />
Petroleum field,<br />
with field name<br />
Ropes<br />
West<br />
Lubbock<br />
(Abo)<br />
Southeast<br />
Garden City<br />
Interbedded sandstone,<br />
shaly limestone, and<br />
shale<br />
Interbedded shaly<br />
limestone, dolomite,<br />
and sandstone<br />
Fore<br />
Reef<br />
Back Reef<br />
Back Reef<br />
Back Reef<br />
Marvin<br />
(Abo)<br />
Eastern Shelf<br />
0 50 mi<br />
Massive dolomite<br />
and some limestone<br />
Interbedded shelf<br />
dolomite, anhydrite,<br />
and green & gray shale<br />
Anticline<br />
Monocline, with<br />
direction of dip<br />
Figure 1. Location map and generalized cross section of Permian Basin, west Texas and southeast New Mexico. Map<br />
shows Abo-Wichita-Albany Reef trend in the Permian Lower Leonard series. From Wright (1979).
System<br />
Quaternary<br />
Tertiary<br />
Cretaceous<br />
Triassic<br />
Permian<br />
Pennsylvanian<br />
Mississippian<br />
Devonian<br />
Silurian<br />
Ordovician<br />
Cambrian<br />
Series or Stage Delaware Basin<br />
Precambrian<br />
Recent<br />
Pleistocene<br />
Pliocene<br />
to<br />
Eocene<br />
Dockum<br />
Dockum<br />
Gulfian<br />
Comanchean Fredericksburg Ls Fredericksburg Ls<br />
Washita<br />
Fredericksburg Ls<br />
Trinity Paluxy ss Trinity Paluxy ss Trinity Paluxy ss<br />
Upper<br />
Santa Rosa<br />
Chinle<br />
Santa Rosa<br />
Tecovas<br />
Chinle<br />
Santa Rosa<br />
Tecovas<br />
Chinle<br />
Santa Rosa<br />
Tecovas<br />
Dewey Lake Dewey Lake Dewey Lake Dewey Lake<br />
Ochoan<br />
Rustler<br />
Salado<br />
Castile<br />
Rustler<br />
Salado<br />
Rustler<br />
Salado<br />
Rustler<br />
Salado<br />
Lamar<br />
Tansill<br />
Tansill<br />
Tansill<br />
Bell Canyon<br />
Yates<br />
Yates<br />
Yates<br />
Seven Rivers Seven Rivers<br />
Seven Rivers<br />
Guadalupean<br />
Cherry<br />
Canyon<br />
Queen<br />
Grayburg<br />
Queen<br />
Grayburg<br />
Queen<br />
Grayburg<br />
Brushy<br />
San Andres<br />
San Andres<br />
San Andres<br />
Canyon<br />
Glorieta<br />
Glorieta<br />
San Angelo<br />
Cutoff Member<br />
1st B. Spg. Sand<br />
U. Clear Fork<br />
Tubb Sand<br />
L. Clear Fork<br />
Paddock<br />
Blinebry<br />
Tubb<br />
Drinkard<br />
Upper<br />
Leonard<br />
Leonardian<br />
U. Spraberry<br />
2nd B. Spg. Sand<br />
Wichita Abo<br />
L. Spraberry<br />
3rd B. Spg. Sand<br />
Dean<br />
Wolfcampian<br />
Virgilian<br />
Missourian<br />
Desmoinesian<br />
Atokan<br />
Morrowian<br />
Chesterian<br />
Meramecian-<br />
Osagean<br />
Kinderhookian<br />
Upper<br />
Middle<br />
Lower<br />
Upper Niagaran<br />
Lower Niagaran<br />
Alexandrian<br />
Cincinnatian<br />
Mohawkian<br />
Chazyan<br />
Canadian<br />
Ozarkian<br />
Upper<br />
Delaware<br />
Mountain Group<br />
Bone Spring<br />
Simpson<br />
Alluvium Alluvium<br />
Wolfcamp<br />
Cisco<br />
Canyon<br />
Strawn<br />
Atoka<br />
Morrow<br />
Central Basin<br />
Platform<br />
Word Whitehorse<br />
Dockum<br />
Clear<br />
Fork<br />
Ogallala Ogallala Ogallala<br />
Husco<br />
Wolfcamp Wolfcamp Wolfcamp<br />
Bursum<br />
Cisco<br />
Canyon<br />
Strawn<br />
Atoka<br />
Whitehorse<br />
Word<br />
Yeso<br />
Northwest<br />
Shelf<br />
Alluvium Alluvium<br />
Cisco<br />
Canyon<br />
Strawn<br />
Atoka<br />
Morrow<br />
Capitan<br />
Goat<br />
Seep<br />
Midland Basin<br />
Whitehorse<br />
Word<br />
Clear<br />
Fork<br />
Wichita<br />
Cisco<br />
Canyon<br />
Strawn<br />
Atoka<br />
Barnett Shale Barnett Shale Barnett Shale U. Mississippian Ls<br />
Mississippian Ls<br />
Mississippian Ls<br />
Kinderhook Kinderhook<br />
Woodford<br />
Woodford<br />
U. Silurian Shale<br />
Fusselman<br />
Montoya<br />
Bromide<br />
Tulip Creek<br />
McLish<br />
Oil Creek<br />
Joins<br />
Ellenburger<br />
Simpson<br />
Mississippian Ls<br />
L. Mississippian Ls<br />
Kinderhook Kinderhook<br />
Woodford<br />
Woodford<br />
U. Silurian Shale U. Silurian Shale U. Silurian Shale<br />
Fusselman Fusselman Fusselman<br />
Montoya<br />
Bromide<br />
Tulip Creek<br />
McLish<br />
Oil Creek<br />
Joins<br />
Ellenburger<br />
Simpson<br />
Montoya<br />
Bromide<br />
Tulip Creek<br />
McLish<br />
Oil Creek<br />
Joins<br />
Ellenburger<br />
Figure 2. Stratigraphic column for west Texas-southeast New Mexico area basins.<br />
Sylvan Sh<br />
Montoya<br />
Bromide<br />
Tulip Creek<br />
McLish<br />
Oil Creek<br />
Joins<br />
Simpson<br />
Ellenburger<br />
Wilberns<br />
Hickory
34°<br />
33°<br />
32°<br />
New Mexico<br />
Texas<br />
0.430<br />
105° 104° 103° 15'<br />
Chaves<br />
Eddy<br />
Petroleum field, with<br />
value indicating<br />
pressure gradient<br />
0.367<br />
0.387<br />
0.295<br />
Northwest Shelf<br />
0.398<br />
Delaware<br />
Basin<br />
0.375<br />
0.422<br />
0.369<br />
0.286<br />
Roosevelt<br />
Lea<br />
0.389<br />
0.430<br />
0 20 mi<br />
Figure 3. Map showing pressure gradients by field for the Abo platform-carbonate and fluvial/deltaic sandstone plays,<br />
southeast New Mexico. Modified from New Mexico Bureau of Mines and Mineral Resources (1993).
GEOLOGIC SETTING<br />
The Raton basin straddles the Colorado-New Mexico state line in southeastern Colorado and<br />
northeastern New Mexico (Figure 1). The Apishapa Uplift and the Wet Mountains separate the Raton from<br />
the Denver basin to the north. The Sangre de Cristo Mountains form the western boundary, and the Las<br />
Animas Arch and Sierra Grande Uplift limit the east and southeast sides (Larsen, 1985). The Cimarron Arch<br />
separates the Las Vegas subbasin from the main part of the basin. The Raton displays an arcuate shape and<br />
asymmetric profile–its western flank dips steeply and is highly faulted. Figure 2 shows the post-Paleozoic<br />
stratigraphy for the basin; most rocks with hydrocarbon content are Cretaceous in age.<br />
The Raton is the southernmost basin formed during the Laramide orogeny of late Cretaceous to early<br />
Tertiary time. Initial Laramide uplift added coarse-grained siltstones, sands and sandy shales to the upper<br />
Pierre Shale and lower Trinidad Sandstone stratigraphy (Figures 2 and 3) (Stevens et al., 1992). The<br />
stratigraphic succession includes rocks from Precambrian to Miocene and Quaternary ages, but Cambrian<br />
through Silurian rocks are absent (Figure 2). A thin Devonian through Mississippian section rests directly<br />
on basement rocks. Gromer (1982) notes Raton sediments probably thicken to 25,000 ft at the western edge<br />
of the basin. The southern part of the basin does not contain late Cretaceous or Tertiary coal bearing strata.<br />
Intrusive activity began during the Eocene and continued throughout the Oligocene. In the immediate<br />
Spanish Peaks area, two stocks and radial dike swarms intruded the country rock. East-northeasterly trending<br />
dikes intruded an area east of the Spanish Peaks (Larsen, 1985). Other igneous bodies include late Tertiary<br />
and Quaternary basalt and andesite flows derived from the Raton volcanic field on the southeastern margin of<br />
the basin (Larsen, 1985). The plutonic and volcanic activity all contributed to thermal maturation of<br />
hydrocarbon source rocks.<br />
HYDROCARBON PRODUCTION<br />
Aside from coalbed methane produced from the Vermejo and Raton coals within the past few years, no<br />
other commercial hydrocarbon production has occurred. Dolly and Meissner (1977) estimated these coal beds<br />
alone generated more than 20 trillion ft 3 of gas.<br />
Zones that have oil and gas shows include the Trinidad Sandstone, Pierre Shale, Niobrara chalks and<br />
shales, Benton Group (Graneros Shale, Greenhorn Limestone, Carlile Shale and Codell Sandstone), and<br />
lower Cretaceous Dakota Sandstone (Figure 2)<br />
EVIDENCE FOR BASIN-CENTERED GAS<br />
Evidence that a basin-centered gas accumulation might exist within the Raton Basin includes the<br />
following:<br />
1<br />
1) a widespread resistivity anomaly pattern in the Trinidad Sandstone (Figure 4). Maximum resistivities<br />
in the Raton Sandstone increase with burial depth and near volcanic centers;<br />
2) extensive underpressuring (Dolly and Meissner, 1977);<br />
3) abundant gas shows found in wells drilled throughout the basin; and<br />
4) vitrinite reflectance (Ro) reaches a maximum of 1.5, indicating thermal maturity. Figure 5 shows<br />
Ro isopleths for the Raton Basin.
Province, Play and<br />
Accumulation Name:<br />
Geologic<br />
Characterization of<br />
Accumulation:<br />
KEY ACCUMULATION PARAMETERS<br />
Rocky Mountain, Raton Basin, early to late Cretaceous<br />
a. Source/reservoir Cretaceous Dakota Sandstone and Pierre Shale through lower Paleocene<br />
Raton formation<br />
b.Total Organic Carbons<br />
(TOCs)<br />
2.95% in the Trinidad area, 1.34-2.43% in the Raton area, 0.3 and 5.37% at<br />
Huerfano Park, west of Walsenberg (Sharon Springs member of the Pierre<br />
Shale) (Gautier et al., 1984)<br />
c.Thermal maturity Ro = 1.5% near the center of the basin to 0.7% near the southern, eastern<br />
and northern basin margins, along the Trinidad Sandstone outcrop (vitrinite<br />
values from Vermejo coals)<br />
d.Oil or gas prone gas prone<br />
e.Overall basin maturity thermally mature; immature stage of exploration<br />
f.Age and lithologies early to late Cretaceous and early Paleocene; Graneros Sh, Greenhorn Ls,<br />
Carlile Sh, Niobrara Chalk/Shale/Marl, Pierre Sh, Trinidad SS, Vermejo and<br />
Raton shales, sands and coals<br />
g. Rock extent/quality apparent basin-wide source and reservoir-rock distribution<br />
h.Potential reservoirs Trinidad SS, Pierre Sh, Niobrara Chalk/Sh/ Marl, Codell Sh<br />
i.Major traps/seals Pierre Shale, Vermejo Fm<br />
j.Petroleum<br />
generation/migration<br />
models<br />
in situ generation of gases from intermixed source rock (coals, shales and<br />
chalks)/reservoir rock facies. Weimer’s Denver basin “cooking pot” model<br />
may be applied in this basin as well (Weimer, 1996)<br />
k.Depth ranges 5000+ ft Trinidad sandstone in the center of the basin to 1500 ft on the<br />
eastern flank. Dakota Sandstone is ±15,000 ft in the center<br />
l.Pressure gradients underpressured at shallow levels, Trinidad and upper Pierre = 0.33 psi/ft;<br />
Raton Formation (1630-1760 ft) = 0.25 psi/ft in the northern part of the<br />
basin. Possible deep overpressure in Dakota-Niobrara?
Production and Drilling<br />
Characteristics:<br />
Economic<br />
Characteristics:<br />
a. Important<br />
fields/reservoirs<br />
b.Cumulative production none<br />
no producing fields except for shallow Raton & Vermejo coal-bed methane<br />
development<br />
a. High inert gas content the chemical content of the coal gases should approximate that expected<br />
from nearby underlying rocks. Heating value of the Raton & Vermejo coal<br />
gases range from 997-1272 btu/cu ft, with nitrogen ranging from 0.1 – 0.8%.<br />
Carbon dioxide content ranges from 0 – 1.1% (Scott, 1993)<br />
b.Recovery No current commercial gas production exists except from coal seams<br />
c.Pipeline infrastructure Currently poor, but will be developed with increasing coalbed methane<br />
drilling<br />
d.Overmaturity Probably none, based on Vermejo vitrinite reflectance data<br />
e.Basin maturity Most of the basin is mature. The outcrop of the Trinidad sandstone appears<br />
to fall within the 0.7-0.8 Ro (Vermejo coals) range.<br />
f.Sediment consolidation consolidation/porosity reduction occurs with depth of burial, especially in the<br />
Niobrara Chalk (Pollastro and Martinez, 1985)<br />
g. Porosity/completion<br />
problems<br />
Chalks & other tight (low permeable rocks) have potential to produce where<br />
they are naturally fractured (Florence-Canon City Field to the north in the<br />
Canon City Embayment). Low pressures and water sensitive clays may<br />
cause additional evaluation problems (Dolly and Meissner, 1977).<br />
h.Permeability Trinidad sandstone=less than 0.1 to 344 md, shales and chalks=less than 1.0<br />
md<br />
i.Porosity Trinidad sandstone=12%; shales and chalks highly variable
R 71 W R 69 W R 67 W R 65 W R 63 W R 61 W<br />
Cuchara<br />
Costillo Co.<br />
Las Animas Co.<br />
Colfax Co.<br />
Taos Co.<br />
100<br />
125<br />
75<br />
Stonewall<br />
100<br />
125<br />
North Pontil Creek<br />
Huerfano River<br />
La Veta<br />
100<br />
|<br />
|<br />
125<br />
| | | |<br />
| | | | |<br />
100<br />
CIMARRON<br />
75<br />
125<br />
150<br />
150<br />
125<br />
125<br />
100<br />
|<br />
100<br />
200 175<br />
150<br />
Casa Grande<br />
200<br />
200<br />
200<br />
150<br />
150<br />
175<br />
150<br />
Cucharas<br />
150<br />
150 125<br />
125<br />
125<br />
Vermejo River<br />
100<br />
CO<br />
NM<br />
0 5<br />
Data point<br />
Scale<br />
N<br />
10 mi<br />
Explanation<br />
Isopach (in feet); dashed where<br />
approximated<br />
Contour interval = 25 feet<br />
Figure 1. Isopach of Trinidad Sandstone in Raton Basin (using gamma ray cut-off value of<br />
70-80 API units). After Advanced Resources International, 1992.<br />
River<br />
WALSENBURG<br />
Colfax<br />
Lyon<br />
Ludlow<br />
Koehler<br />
Huerfano Co.<br />
Las Animas Co.<br />
Apishapa<br />
Canadian River<br />
150<br />
Purgatoire<br />
TRINIDAD<br />
RATON<br />
River<br />
Vermejo/Trinidad Contact<br />
COLORADO<br />
NEW MEXICO<br />
River<br />
Barela<br />
T 27 S<br />
T 29 S<br />
T 31 S<br />
T 33 S<br />
T 35 S<br />
T 32 N<br />
T 30 N<br />
T 28 N
ERA AGE STRATIGRAPHY LITHOLOGY THICKNESS RESERVOIR SOURCE<br />
CENOZOIC<br />
MESOZOIC<br />
Anhydrite<br />
Marlstone<br />
Limestone<br />
RECENT<br />
PLEISTOCENE<br />
PLIOCENE<br />
MIOCENE<br />
OLIGOCENE (?)<br />
EOCENE<br />
PALEOCENE<br />
CRETACEOUS<br />
JURASSIC<br />
TRIASSIC<br />
Niobrara<br />
Fm<br />
Benton<br />
Fm<br />
Alluvium, Dunes<br />
Landslide Deposits,<br />
Soil Zones<br />
Ogallala Fm<br />
Devil's Hole Fm<br />
Volcanic Intrusions,<br />
Plugs, Dikes, Sills<br />
Farasita Fm<br />
Huerfano Fm<br />
Cuchara Fm<br />
Poison Canyon Fm<br />
Raton Fm<br />
Vermejo Fm<br />
Trinidad Ss<br />
Pierre Sh<br />
Smokey Hill Marl<br />
Fort Hayes Ls<br />
Codell Ss<br />
Carlile Sh<br />
Greenhorn Ls<br />
Graneros Sh<br />
Dakota Ss<br />
Purgatoire Fm<br />
Morrison Fm<br />
Wanakah Fm<br />
Entrada Ss<br />
Dockum Group<br />
PALEOZOIC UNDIVIDED<br />
5,000 - 10,000 ft<br />
EXPLANATION<br />
Shale<br />
Sandy Shale<br />
Pebbly Mudstone<br />
200-500<br />
Shaly Sandstone<br />
Sandstone<br />
Pebbly Sandstone<br />
Figure 2. Columnar section of post-Paleozoic rocks in the Raton basin. After Rose et al. (1986), and<br />
Dolly and Meissner (1977).<br />
0-200<br />
0-1500<br />
0-1200<br />
0-2000<br />
0-5000<br />
0-2500<br />
0-2075<br />
0-360<br />
0-255<br />
1300-2900<br />
900<br />
0-55<br />
0-30<br />
165-225<br />
20-70<br />
175-400<br />
140-200<br />
100-150<br />
150-400<br />
30-100<br />
40-100<br />
0-1200<br />
PRIMARY SECONDARY<br />
Gas<br />
Oil
R 71 W R 69 W R 67 W R 65 W R 63 W R 61 W<br />
Cuchara<br />
Costillo Co.<br />
Las Animas Co.<br />
Colfax Co.<br />
Taos Co.<br />
Stonewall<br />
0.7<br />
0.8<br />
| | |<br />
|<br />
| | |<br />
|<br />
1.2<br />
North Pontil Creek<br />
Huerfano River<br />
La Veta<br />
CIMARRON<br />
1.1<br />
0.8<br />
0.7<br />
0.8<br />
1.0<br />
0.9<br />
0.9<br />
1.4<br />
1.5<br />
Casa Grande<br />
1.4<br />
1.3<br />
1.2<br />
1.1<br />
1.0<br />
Cucharas<br />
1.2<br />
1.1<br />
0.9<br />
1.0<br />
Vermejo River<br />
Apishapa<br />
1.0<br />
0.9<br />
0.8<br />
CO<br />
NM<br />
0 5<br />
Scale<br />
N<br />
10 mi<br />
Explanation<br />
Measured R0, corrected to Basal Kv<br />
Measured R0, uncorrected<br />
Calculated R0 (R0 vs. Vm), corrected<br />
T 27 S<br />
T 29 S<br />
T 31 S<br />
T 33 S<br />
T 35 S<br />
T 32 N<br />
T 30 N<br />
T 28 N<br />
Calculated R0 (R0 vs. Vm), uncorrected<br />
Isopleth; dashed where<br />
approximated<br />
Contour interval = 0.1% R0<br />
Figure 5. Isopleth of vitrinite reflectance in Raton Basin, adjusted to basal Vermejo<br />
Formation. After Advanced Resources International, 1992.<br />
River<br />
WALSENBURG<br />
Colfax<br />
Lyon<br />
Ludlow<br />
Koehler<br />
Huerfano Co.<br />
Las Animas Co.<br />
Canadian River<br />
1.2<br />
Purgatoire<br />
TRINIDAD<br />
RATON<br />
River<br />
Vermejo/Trinidad Contact<br />
COLORADO<br />
NEW MEXICO<br />
River<br />
Barela
SW NE<br />
Vermejo<br />
Fm.<br />
Trinidad<br />
Sandstone<br />
Pierre<br />
Shale<br />
"High <strong>Energy</strong>" Sandstone<br />
Deltaic Sediments<br />
Siltstone<br />
Shale<br />
Delta No. 1<br />
Sea Level 1<br />
Coastal Swamps<br />
Distal Silty Zone<br />
Pro-delta Shales<br />
Delta No. 2<br />
Sea Level 2<br />
Figure 3. Cross section showing Trinidad Sandstone depositional environments in the Raton basin. After Rose et al. (1986).<br />
Vermejo<br />
Fm.<br />
Trinidad<br />
Sandstone<br />
Pierre<br />
Shale<br />
200 ft.<br />
100 ft.<br />
Datum: Interpreted sea level during deposition of Delta No. 1<br />
0
R69W R68W R67W R66W R65W<br />
Huerfano Co.<br />
Las Animas Co.<br />
40 Ω<br />
50 Ω<br />
50 Ω<br />
Trinidad Wet<br />
40 Ω<br />
30 Ω<br />
Postulated Gas Accumulation<br />
in Low Clay-High <strong>Energy</strong><br />
Trinidad Sands<br />
Transitional Zone of<br />
Higher Water Saturation<br />
and Higher Clay Content<br />
Trinidad Wet<br />
Outcrop Boundary of Trinidad Sandstone Isopleth of Average Resistivity in<br />
Trinidad Sandstone, in ohms<br />
Outcrop of Tertiary Intrusive Rocks<br />
Figure 4. Delineation of postulated basin-centered gas accumulation in Trinidad Sandstone. After Rose<br />
et al. (1986).<br />
30 Ω<br />
30 Ω<br />
Huerfano Co.<br />
Las Animas Co.<br />
T27S<br />
T28S<br />
T29S<br />
T30S<br />
T31S<br />
T32S<br />
T33S
GEOLOGIC SETTING<br />
The late Cenozoic Rio Grande Rift extends from the upper Arkansas Valley near Leadville, Colorado, south<br />
through central New Mexico and the Big Bend area of Texas into the state of Chihuahua, Mexico (Figure 1)<br />
(Molenaar, 1996). The rift separates the North American Craton from the Colorado Plateau. Opening of the rift may<br />
have resulted from clockwise rotation of the Colorado Plateau about an Euler pole located in northeast Utah.<br />
The rift system developed in terrain elevated during Laramide time because of crustal thickening (Keller and<br />
Cather, 1994). Initial sedimentation commenced in late Oligocene to early Miocene, with rapid extension beginning<br />
in middle to late Miocene. Miocene extension in the north-central part of the rift was left-oblique. The amount of<br />
extension decreases in the southern half of the rift, which expands in width and becomes a series of parallel basins<br />
with intrarift uplifts and tilted fault blocks.<br />
The rift contains over thirty named basins (Figure 1), most of which are first-order half grabens; basin<br />
asymmetry shifts across accommodation zones (Chapin and Cather, 1994). Drilling and geophysical exploration<br />
continue to reveal and delimit new sub-basins. To date, tentative exploration has focused on two major basins, the<br />
San Luis in southern Colorado, and the Albuquerque basin in northwestern New Mexico.<br />
The deepest part of the rift occurs along the east side of the San Luis basin northwest of the Great Sand Dunes<br />
of southern Colorado. The San Luis basin consists of two half-grabens (the western Monte Vista graben and the<br />
eastern Baca) with a central horst between them.<br />
The Albuquerque basin lies between the Sandia and Manzano Mountains to the east and the Ladron and Lucero<br />
uplifts to the west. The basin contains two half-grabens separated by the northeast-southwest trending Tijeras fault<br />
zone (Figure 2). The west-dipping northern graben contains a listric fault system (Figure 3); the east-dipping<br />
southern graben exhibits high-angle normal faults (Figure 4). Pre-existing Precambrian basement structures may<br />
have controlled Tertiary structures (Russel and Snelson, 1994).<br />
Basin fill consists of poorly indurated alluvial fans, axial river sands and gravels, playa deposits, eolian dune<br />
sands, and pyroclastic volcanics of the Santa Fe Group. The San Luis basin contains at least 7,000 ft of fill;<br />
Mesozoic sediments lie beneath the Tertiary valley deposits. Over 14,000 ft of sediment fills the Albuquerque basin.<br />
Brister and Gries (1994) reported coal occurrence within the Santa Fe Group in the San Luis basin.<br />
HYDROCARBON PRODUCTION<br />
Most exploration has concentrated on the San Luis and Albuquerque basins. In 1993 Lexam Exploration drilled<br />
42 gold exploration holes into the east side of the Baca graben at the base of the Sangre de Cristo Mountains; 27<br />
wells showed oil at depths between 300 and 800 ft.. Several test wells had gas shows within the Santa Fe Group,<br />
and one well reportedly intercepted coal within the Santa Fe Group. Six of the exploration wells penetrated a<br />
previously unknown Cretaceous section. Drilling in the Albuquerque basin has taken place in both grabens (Figures<br />
3 and 4). Of the 60 or so exploratory wells drilled, only two have penetrated the Mesozoic section (Black, 1998).<br />
Total organic carbon (TOC) content for the Cretaceous shales of the eastern San Luis basin ranges from 1.63 to<br />
7.31% (Morel and Watkins, 1997). For the Albuquerque basin’s north graben, Broadhead (1998) reported TOC values<br />
of about 1.4 to 10.1% in the Mancos Shale and 22.3 to 28.9% in the upper Mesaverde coals.<br />
EVIDENCE FOR BASIN-CENTERED GAS<br />
Possible basin-centered gas might occur within the Cretaceous section of the Baca Graben in the San Luis Basin<br />
and in the Cretaceous and Jurassic sections of the Albuquerque basin. The areal extent of any potential accumulation<br />
within the Mesozoic sediments remains unknown. Other basins within the Rockies with a similar Cretaceous<br />
section such as the Piceance Basin do host basin-centered gas accumulations.<br />
1
Province, Play and<br />
Accumulation Name:<br />
Geologic<br />
Characterization of<br />
Accumulation:<br />
KEY ACCUMULATION PARAMETERS<br />
Rio Grande Rift (Albuquerque-Santa Fe Rift, Province 023–Molenaar,<br />
1996), basin-centered gas play in Cretaceous sandstones of San Luis and<br />
Albuquerque Basins<br />
a. Source/reservoir Cretaceous shales (Mancos) of San Luis Valley and Albuquerque basins,<br />
Todilto Limestone additional source in Albuquerque Basin/Dakota in both<br />
basins with Morrison in Albuquerque Basin.<br />
b.Total Organic Carbons<br />
(TOCs)<br />
San Luis Basin: Cretaceous shales of eastern basin, 1.63 to 7.31% (Morel<br />
and Watkins, 1997). Some coal had been found within the Santa Fe Group<br />
in the San Luis Basin (Brister and Gries, 1994).<br />
Albuquerque basin: Mancos shale (north graben) – 1.39 to10.1%, upper<br />
Mesaverde coals (also north graben) – 22.25-28.85% (Broadhead, 1998).<br />
c.Thermal maturity San Luis Basin: Modeling by Morel and Watkins (1997) indicated source<br />
rocks entered oil and gas window 10 to 15 Ma.<br />
Albuquerque basin: Levels of maturity (LOM) for on basin flanks from 9.0<br />
to 2.0 (oil window), Cretaceous section of Humble SFP #1 (sec. 18, T6N,<br />
R1W) from 12.0 to 14.0 (condensate and wet gas). Values from Black<br />
(1982).<br />
d.Oil or gas prone both oil and gas prone; type III kerogens limited; type II kerogen found in<br />
San Luis Basin<br />
e.Overall basin maturity San Luis Basin: moderate to mature. Albuquerque Basin: mature to<br />
overmature. Anthraxalite reported in Cretaceous sediments in Humble SFP<br />
#1 (Black, 1982). Play confined to shallower and less mature basin flanks.<br />
f.Age and lithologies Cretaceous shales, sandstone for both basins. Albuquerque Basin has<br />
Pennsylvanian Todilto limestones in addition to Jurassic Morrison and<br />
Entrada sandstones.<br />
g. Rock extent/quality Cretaceous section in eastern portion of San Luis Basin (identified primarily<br />
by geophysical methods (Morel and Watkins, 1997)) is up to 45 mi in length,<br />
18 mi wide and 3,000 ft thick. The section in the Albuquerque Basin<br />
appears to be similar to the San Juan Basin. The area where the Cretaceous is<br />
present extends from T2-3N and 2W-4E (Black, 1982). The section is<br />
composed of marine shales, marginal marine and fluvial channel sandstones.<br />
h.Potential reservoirs At the present time there is no hydrocarbon production within either the San<br />
Luis or Albuquerque Basins.<br />
i.Major traps/seals Stratigraphic traps within the sandstones are possible. The overlying<br />
Cretaceous marine shales and thinner shales within the sandstones provide<br />
seals. Jurassic shales are potential seals within the Albuquerque Basin.<br />
j.Petroleum<br />
generation/migration<br />
models<br />
Structural traps may exist.<br />
both in-situ and long distance migration<br />
k.Depth ranges San Luis Basin: 7,000 ft to 17,000 ft; Albuquerque Basin: 5,000 ft to<br />
12,000 ft
Production and Drilling<br />
Characteristics:<br />
Economic<br />
Characteristics:<br />
l. Pressure gradients Albuquerque Basin – 5,000 ft to 12,000 ft<br />
a. Important<br />
fields/reservoirs<br />
b. Cumulative production<br />
a. High inert gas content unknown at present<br />
b. Recovery<br />
The Santa Fe Group of the San Luis Basin supports substantial artesian water<br />
flows. Insufficient pressure data is available for the Mesozoic section.<br />
c. Pipeline infrastructure gas pipeline infrastructure is non-existent to limited<br />
d. Overmaturity The deep, central portion of the Albuquerque Basin is overmature.<br />
Prospective areas will be on the less mature flanks of the basin. The risk of<br />
overmaturation in the San Luis Basin is unknown.<br />
e. Basin maturity mature<br />
f. Sediment consolidation The Santa Fe Group is unconsolidated. The Mesozoic and Paleozoic<br />
sections are well indurated.<br />
g. Porosity/completion<br />
problems<br />
h. Permeability unknown<br />
i. Porosity 8-24%<br />
There may be parts of the Albuquerque basin which are tightly cemented in<br />
the Cretaceous. Both basins are likely to have swelling clays within the<br />
Cretaceous sandstones that will need to be drilled and treated with<br />
appropriate<br />
fluids. Fracture stimulation will likely be needed to obtain commercial<br />
production.
SA<br />
W<br />
Mt<br />
LA<br />
108°<br />
Colorado<br />
Plateau<br />
UA<br />
Neogene basin-fill<br />
deposits<br />
Cenozoic volcanic<br />
fields<br />
E<br />
MDVF<br />
AS LJ<br />
Sc<br />
Socorro<br />
O<br />
MG<br />
SM<br />
P<br />
JM<br />
Mb<br />
SJVF<br />
JVF<br />
LM<br />
M<br />
SD<br />
T<br />
106° 104°<br />
An<br />
Alamosa<br />
SL<br />
TMVF<br />
PV<br />
LVF<br />
Mo<br />
Santa Fe<br />
Albuquerque<br />
Las Cruces<br />
El Paso<br />
H<br />
SBVF<br />
S<br />
EC<br />
Colorado<br />
Great<br />
Plains<br />
New Mexico<br />
TPVF<br />
BG<br />
Pr<br />
R<br />
Chihuahua<br />
Coahuilla<br />
0 50 100 mi<br />
0 100 200 km<br />
Scale<br />
Texas<br />
Figure 1. Map of southern Colorado, New Mexico, and western Texas showing Cenozoic volcanic fields and<br />
basins of the Rio Grande rift. After Keller and Cather (1994).<br />
Okla<br />
38°<br />
36°<br />
34°<br />
32°<br />
30°<br />
UA<br />
An<br />
PV<br />
SL<br />
Mo<br />
E<br />
SD<br />
A<br />
Sc<br />
LJ<br />
AS<br />
SA<br />
O<br />
MG<br />
SM<br />
Mt<br />
W<br />
LA<br />
P<br />
T<br />
JM<br />
Mb<br />
M<br />
LM<br />
H<br />
S<br />
EC<br />
Pr<br />
BG<br />
R<br />
TMVF<br />
SJVF<br />
LVF<br />
JVF<br />
MDVF<br />
SBVF<br />
TPVF<br />
Basins<br />
Upper Arkansas<br />
Antero<br />
Pleasant Valley<br />
San Luis<br />
Moreno<br />
Española<br />
Santo Domingo<br />
Albuquerque<br />
Socorro*<br />
La Jencia*<br />
Abbe Springs**<br />
San Agustin<br />
Oscura<br />
Milligan Gulch<br />
San Marcial<br />
Monticello<br />
Winston<br />
Las Animas<br />
Palomas<br />
Tularosa<br />
Jornada del Muerto<br />
Mimbres<br />
Mesilla<br />
Los Muertos<br />
Hueco<br />
Salt<br />
El Cuervo<br />
Presidio<br />
Black Gap<br />
Redford<br />
Volcanic Fields<br />
Thirtynine Mile<br />
San Juan<br />
Latir<br />
Jemez<br />
Mogollon-Datil<br />
Sierra Blanca<br />
Trans-Pecos<br />
* The Socorro and La Jencia basins and<br />
the intervening Lemitar Mountains<br />
comprise the early rift Popotosa basin<br />
** Also termed northern Milligan Gulch basin
D<br />
U<br />
N<br />
Ladron<br />
Uplift<br />
Lucero<br />
Uplift<br />
Fault scarp<br />
Rio Grande<br />
Master Fault<br />
Normal fault; U indicates upthrown block, D indicates downthrown block<br />
Fault; arrows indicate direction of displacement<br />
Intersection of Rio Grande fault with the north face of the block diagram<br />
Anticline, showing direction of axis<br />
Strike and dip direction<br />
Explanation<br />
Figure 2. Generalized structure model of the Albuquerque Basin showing opposing structural asymmetry of the<br />
north and south halves of the basin and the controlling master normal faults. After Russell and<br />
Snelson (1990); Rowley (ARCO, unpublished isostatic residual gravity map); and May and Russell<br />
(1994).<br />
D<br />
U<br />
Joyita<br />
Uplift<br />
Sandia<br />
Uplift<br />
Manzano Uplift<br />
Jeter — Santa Fe — Coyote Master Fault<br />
Tijeras<br />
"Transfer" Fault
Feet<br />
10,000<br />
5,000<br />
Sea Level<br />
-5,000<br />
-10,000<br />
-15,000<br />
-20,000<br />
-25,000<br />
-30,000<br />
-35,000<br />
W E<br />
Colorado<br />
Plateau<br />
Santa Fe<br />
Fault<br />
Laguna<br />
Bench<br />
Shell<br />
Laguna<br />
Cenozoic rift fill*<br />
North Graben Block Albuquerque<br />
Eastern Stable<br />
Bench<br />
Block<br />
Shell<br />
Rio Grande<br />
Fault<br />
Transocean<br />
Rio Puerco West Mesa<br />
Fault<br />
Isleta-2<br />
Rio Grande<br />
Isleta-1<br />
Hubbell Springs<br />
Fault<br />
Manzanita<br />
Mountains<br />
0 5 10 mi<br />
Mesozoic sedimentary rocks Oil or gas well<br />
Paleozoic sedimentary rocks<br />
Precambrian crystalline rocks<br />
LT<br />
Scale<br />
* Pre-rift lower Tertiary section<br />
(LT) indicated where discernible<br />
in wells or from seismic data.<br />
Figure 3. West-east cross section of the North Graben Block, Rio Grande Rift zone, New Mexico. After Russell and Snelson (1994).<br />
Feet<br />
10,000<br />
5,000<br />
Sea Level<br />
-5,000<br />
-10,000<br />
-15,000<br />
-20,000<br />
-25,000<br />
-30,000<br />
-35,000
Feet<br />
10,000<br />
5,000<br />
Sea Level<br />
-5,000<br />
-10,000<br />
-15,000<br />
-20,000<br />
-25,000<br />
-30,000<br />
-35,000<br />
W E<br />
Colorado<br />
Plateau<br />
Lucero Uplift<br />
?<br />
Comanche<br />
Fault<br />
⊕<br />
Cenozoic rift fill*<br />
Rio Puerco<br />
Block<br />
Cat Mesa<br />
Fault<br />
Santa Fe<br />
Fault<br />
Mesozoic sedimentary rocks<br />
Paleozoic sedimentary rocks<br />
Precambrian crystalline rocks<br />
South Graben Block Albuquerque<br />
Eastern Stable Block<br />
Bench<br />
Humble Santa Fe &<br />
Pacific-1<br />
Rio Puerco<br />
Rio Grande<br />
Hubbell Springs<br />
Fault<br />
Manzano Mountains<br />
0 5 10 mi<br />
Figure 4. West-east cross section of the South Graben Block, Rio Grande Rift zone, New Mexico. After Russell and Snelson (1994).<br />
⊕<br />
Montosa<br />
Fault<br />
Scale<br />
Oil or gas well<br />
⊕<br />
Estancia<br />
Basin<br />
Fault motion into plane of section<br />
Fault motion out of plane of section<br />
* Pre-rift lower Tertiary section<br />
indicated where discernible<br />
in wells or from seismic data.<br />
Feet<br />
10,000<br />
5,000<br />
Sea Level<br />
-5,000<br />
-10,000<br />
-15,000<br />
-20,000<br />
-25,000<br />
-30,000<br />
-35,000
GEOLOGIC SETTING<br />
The present day Sacramento and San Joaquin Basins lie within California’s northwest-southeast trending Great<br />
Valley, between the Sierra Nevada Range on the east, the Coast Ranges on the west, the Klamath Mountains to the<br />
north, and the Tehachapi and San Emigdio Mountains on the south (Figure 1). The Stockton Arch separates the<br />
Sacramento from the adjoining San Joaquin basin to the south.<br />
Structural development began in late Jurassic time as a forearc basin formed between the Sierra highlands on the<br />
east and a wedge of Franciscan rock to the west. In early Cretaceous time, the basin began to fill with deep water<br />
sands and shales. By the late Cretaceous, delta-slope and turbidite fan systems dominated sedimentation, and the basin<br />
developed its characteristic asymmetry. The basin deep developed below the break in slope of the forearc’s shelf.<br />
Structural styles differ across the basin. The eastern flank exhibits high angle normal faults typical of<br />
extensional faulting of a stable shelf into an adjoining basin. Complex folding and faulting characterize the<br />
tectonically active western side. The Stockton Arch Fault developed at the close of the Cretaceous period and divided<br />
the forearc basin into the two present-day subbasins. Continued subsidence during the early Tertiary led to several<br />
cycles of marine deposits overlain by non-marine sediments. Structural deformation continued throughout the<br />
Tertiary, especially on the west sides of both basins (Callaway and Rennie, 1991; Montgomery, 1988).<br />
The Forbes Formation is a mud-rich turbidite fan system that prograded southward along the Sacramento Basin<br />
axis (Imperato et al., 1990), and has historically had significant oil and gas development. This formation<br />
unconformably lies over the late Cretaceous Dobbins Shale, and in turn underlies the late Cretaceous Kione Delta<br />
units and Sacramento Shale (Figure 2).<br />
HYDROCARBON PRODUCTION<br />
Hydrocarbons in the Forbes usually occur in discreet, lenticular stratigraphic traps or in combination structuralstratigraphic<br />
traps, where structure has concentrated gas. Traps often involve multiple fault blocks with sealing faults<br />
and can be quite complex. Productive sands have porosities of 30% and permeabilities of 100 md (millidarcies), and<br />
are usually 15 to 30 ft thick. Stacked sands often allow multiple completions in each well bore. In the northern<br />
Sacramento Basin, the Forbes generally produces to a depth of 9,000 ft. Permeability decreases with depth, so few<br />
wells have penetrated the Forbes in the deeper southern half of the basin. One now-abandoned well exceeded 11,000 ft<br />
depth, but produced only a non-commercial 0.12 BCFG (Callaway and Rennie, 1991; Montgomery, 1988; Weagant,<br />
1972, 1986; and Zeiglar and Spotts, 1978).<br />
Overpressure often occurs in the Forbes Fm, and pressure gradients rise as high as 0.8 to 9 psi/ft below 6,000 ft<br />
depth (Lico and Kharaka, 1983). In some cases, changes in pressure gradients may correlate with hydrodynamic<br />
gradients or the post-depositional emplacement of magmatic stocks. Overpressure along the west flank of the<br />
Sacramento and San Joaquin basins may have some relation to structural compression associated with Mesozoic<br />
subduction and more recent plate movements (Montgomery, 1988; and Weagant, 1972, 1986)<br />
Shales of the Dobbins, the Sacramento and the Forbes Formation are likely gas sources. Cretaceous shales of<br />
the Sacramento and northern San Joaquin basins generally contain less than 1.0% total organic content (TOC). The<br />
organic material is largely humic or non-sapropelic and therefore gas prone. Gas generation in Cretaceous rocks<br />
probably began at burial depths of 13,000 to 15,000 ft (Figure 3). The “Delta depocenter” in the southern<br />
Sacramento Basin was probably the major source for gas in this basin and for the gas fields in the northern San<br />
Joaquin (Zieglar and Spotts, 1978, Callaway and Rennie, 1991).<br />
1
EVIDENCE FOR BASIN-CENTERED GAS<br />
The northern Sacramento Basin is a dry-gas province, and the Forbes is a major conventional producer in the<br />
basin. While the overlying Cretaceous Kione and Tertiary sands are also important producers, the Forbes will most<br />
likely host a basin-centered accumulation. Evidence for such accumulations in the basin include the following:<br />
2<br />
1) Cretaceous shales of the Dobbins Forbes Formations are mature in the deepest parts of the Sacramento<br />
Basin, especially in the Delta depocenter (Zeiglar and Spotts, 1978).<br />
2) The turbidite fan nature of the Forbes ensures reservoirs encasement within the source shales (Weagant,<br />
1972, 1986; Montgomery, 1988).<br />
3) Overpressuring occurs in the Forbes, although hydrodynamics and post-depositional structural movement<br />
complicate pressure distribution in the formation. A better understanding of pressure distribution in the<br />
Forbes, especially in the deeper Sacramento Basin would aid in evaluating the potential for the preservation<br />
of reservoir permeability at depth. (Weagant, 1972, 1986; Montgomery, 1988).
Province, Play and<br />
Accumulation Name:<br />
Geologic<br />
Characterization of<br />
Accumulation:<br />
KEY ACCUMULATION PARAMETERS<br />
Pacific Coast, Sacramento and San Joaquin Basins, Forbes formation<br />
a. Source/reservoir Dobbins and Sacramento shales and shales of the Forbes formation.<br />
Reservoirs are turbidite sands of the Forbes. Callaway and Rennie, 1991;<br />
Zeiglar and Spotts, 1978; Magoon et al., 1996; Weagant, 1972, 1986)<br />
b.Total Organic Carbons<br />
(TOCs)<br />
less than 1.0% (Zeiglar and Spotts, 1978)<br />
c.Thermal maturity Cretaceous shales are gas mature below 13,000 ft. (Zeilar and Spotts, 1978)<br />
d.Oil or gas prone gas prone (Zeiglar and Spotts, 1978)<br />
e.Overall basin maturity basin normally mature<br />
f.Age and lithologies Late Cretaceous shales and sands<br />
g. Rock extent/quality Forbes present throughout Sacramento Basin; Forbes present in northern half<br />
of San Joaquin. Reservoir rocks are discontinuous and are distributed<br />
vertically throughout formation.<br />
h.Potential reservoirs Conventional production from Forbes; non-conventional, basin centered<br />
production not established.<br />
i.Major traps/seals Stratigraphic and combination structural-stratigraphic traps are common.<br />
Seals include encasing shales and sealing faults.<br />
j.Petroleum<br />
generation/migration<br />
models<br />
Onset of gas generation at burial depths of 13,000 ft.; migration to<br />
conventional traps over distances of 60-100 miles. (Zeiglar and Spotts, 1978;<br />
Magoon et al., 1996)<br />
k.Depth ranges production from conventional reservoirs at depths of 4000 to 9000 ft.;<br />
deepest completion 11,064-11,144 ft (California Division of Oil, Gas and<br />
Geothermal Resources, 1997).<br />
l.Pressure gradients
Production and Drilling<br />
Characteristics:<br />
Economic<br />
Characteristics:<br />
a. Important<br />
fields/reservoirs<br />
Rice Creek, Tisdale, Grimes, Arbuckle, (California Division of Oil, Gas and<br />
Geothermal Resources, 1997)<br />
b.Cumulative production Rice Creek, 35 BCFG; Tisdale, 45 BCFG; Grimes, 619 BCFG; Arbuckle, 78<br />
BCFG (California Division of Oil, Gas and Geothermal Resources, 1997)<br />
a. High inert gas content Nitrogen is common in the Sacramento Basin; gases are blended to reach<br />
commercial BTU levels.<br />
b.Recovery Forbes is currently regarded as a conventional play and operators are<br />
reluctant to compete zones that appear to have low deliverability/recovery.<br />
c.Pipeline infrastructure good to excellent<br />
d.Overmaturity normally mature<br />
e.Basin maturity normally mature, Tertiary of Sacramento Basin generally not mature<br />
f.Sediment consolidation normal consolidation with depth<br />
g. Porosity/completion<br />
problems<br />
h.Permeability<br />
i.Porosity<br />
Forbes is currently regarded as a conventional play, and operators complete<br />
sands with 10% or greater porosities. Overpressure conditions occur<br />
throughout the play, but are often related to local structural conditions<br />
(Weagant, 1972, 1986; Montgomery, 1988).
Map<br />
Area<br />
Coast Ranges<br />
38°<br />
123°<br />
Sacramento basin<br />
Delta depocenter<br />
Clear Lake<br />
San Francisco<br />
Red Bluff<br />
40°<br />
122°<br />
38°<br />
122°<br />
Woodland<br />
Potential basin-centered accumulation Oil or gas field<br />
Sacramento Basin<br />
Northern<br />
Sacramento<br />
Sierra Nevada<br />
Sacramento<br />
Delta<br />
Stockton<br />
Arch<br />
0 20 mi<br />
Figure 1. Index map of the Sacramento basin and inclusive oil and gas fields, California. After California Division of<br />
Oil, Gas, and Geothermal Resources W6-1, 2 (1999).
Series Unit<br />
Upper<br />
Cretaceous<br />
Tracy Fm<br />
Winters<br />
Formation<br />
Guinda Fm<br />
Sites Fm<br />
HT Shale<br />
Dobbins Fm<br />
Funks Fm<br />
Yolo Fm<br />
Mokelumne River Formation<br />
Sacramento Shale<br />
Kione Formation<br />
Forbes Formation<br />
Figure 2. Stratigraphic column for the Sacramento basin, California. After Goudkoff (1945).<br />
Starkey<br />
Formation
Depth in Feet<br />
0<br />
5000<br />
10000<br />
15000<br />
20000<br />
25000<br />
30000<br />
Cretaceous<br />
80 60 40 20 0<br />
Time in MYA<br />
Eocene<br />
Paleocene<br />
Miocene<br />
Oil generation window Gas generation window<br />
Figure 3. Lopatin diagram showing stratigraphic reconstructions and oil and gas generation windows for the thickest<br />
part of the Delta depocenter, Sacramento basin, California. After Zieglar and Spotts (1978).<br />
100<br />
200<br />
300<br />
400<br />
500<br />
Temperature in °F
GEOLOGIC SETTING<br />
The Salton Trough is an active rift basin lying within the Imperial Valley at the northern end of the<br />
Gulf of California (Figure 1). The basin extends about 115 miles in length and 45 miles in width, and<br />
encompasses an area of 4,500 square miles (Barker, 1995). The rift apparently contains metamorphosed<br />
sediments, igneous intrusions and rising upper mantle material (Figure 2). The transfer zones between the<br />
major strike-slip faults may have active rhombic-shaped spreading centers, especially at the southern end of<br />
the Salton Sea and at Cerro Prieto (Figure 1) (Lonsdale, 1989; and Mueller and Rockwell, 1991).<br />
Paleogeographic reconstructions show that the Gulf of California opened during middle Miocene time<br />
and reached its maximum northward extent in the early Pliocene (Smith, 1991). Deltaic and lacustrine<br />
sediments from the Colorado River filled the northern end of the Gulf of California beginning 5.5 Ma,<br />
eventually cutting it off from the marine seaway by 4 Ma (Schmidt, 1990). The basin now contains 16,000<br />
to 20,000 ft of sediments and metasediments, including Miocene to Pliocene-age evaporites, marine and<br />
continental deposits, and a thick section of Pleistocene to Recent deltaic and lacustrine sediments (Helgeson,<br />
1968; Muffler and Doe, 1968). Figure 3 shows a general stratigraphic column for the Salton Trough<br />
(Muffler and Doe, 1968; Lucchitta, 1972). Dibblee (1984), Gibson et al. (1984), and Kerr and Kidwell<br />
(1991) have described the sedimentary formations exposed in outcrops along the western and eastern flanks<br />
of the Salton Trough. Mesozoic igneous and metamorphic rocks form the base of the exposed section.<br />
Above this crystalline basement are alluvial fans and breccias of the Miocene Anza and Split Mountain<br />
Formations. Interfingered with the Split Mountain is the Fish Creek Gypsum, a formation of gypsum and<br />
anhydrite that indicates rift basin development began in middle Miocene time. Breccias and marine turbidites<br />
overlie the evaporite beds and indicate rapid subsidence. The turbidites grade upward and laterally into<br />
shallow marine shoreline deposits of the Pliocene Imperial and Bouse Formations. These are overlain by<br />
deltaic and lacustrine sediments deposited by the Colorado River. This basin has continued to subside, and<br />
recent erosion has not removed any sediments.<br />
Active strike-slip motion complicates the rift basin geology within the San Andreas, Imperial and<br />
Cerro Prieto fault zones. Calculated slip rates for the various strike-slip faults in the Salton Trough range<br />
from 1.7 to 5.4 cm/year (Duffield, 1976; Suarez-Vidal et al., 1991). According to Elders (1979), the Salton<br />
Trough is one of the most earthquake-prone areas in North America. The basin undergoes active<br />
deformation, as indicated by movements observed from tiltmeter and survey data. Lippmann and Manon<br />
(1987) described recent earthquake activity along the Imperial and Cerro Prieto fault zones near Cerro Prieto<br />
geothermal field. Such seismic activity can potentially disrupt or breach hydrocarbon traps and pressure<br />
seals, preventing accumulation of hydrocarbons.<br />
HYDROCARBON PRODUCTION<br />
To date, the Salton Trough has no recorded hydrocarbon production.
EVIDENCE FOR BASIN-CENTERED GAS<br />
According to gas sample data from geothermal wells and fumaroles, the main gas expelled in the basin<br />
is CO 2. Most samples show 80 to 90 wt % CO 2 and only 3 to 5 wt% of hydrocarbon gases. For many<br />
years a dry-ice factory produced CO 2 from shallow wells near the Salton Sea.<br />
Thermal gradients and maturity levels vary throughout the basin. In cooler areas, conditions may favor<br />
generation and expulsion of natural gas. However, Colorado River sediments apparently lack hydrocarbon<br />
source material. Analyses of deep-well cuttings show small amounts (< 0.5 wt%) of total organic carbon<br />
(TOC). The only potential source rocks noted in the geologic literature have been minute coal fragments:<br />
Nehring and D’Amore (1981, 1984) reported dispersed lignite particles in deltaic sediments from a deep well<br />
(Prian #1) near Cerro Pietro. This coaly material may possibly generate the small amounts of hydrocarbon<br />
gases found in Cerro Pietro geothermal wells. Published lithology logs and formation descriptions include<br />
no coal beds or swamp environments in the sedimentary section, so the origin, extent and depositional trend<br />
of the carbonaceous units remain unknown. The lignite fragments in the Prian #1 well may represent<br />
allocthonous deposition of Cretaceous coal eroded from the Colorado Plateau.<br />
Vitrinite reflectance (R o) measurements for several areas in the Salton Trough indicate high thermal<br />
maturation. Barker (1995) reported an R o of 3% at 13,400 ft in the Chevron Wilson #1 well. Drilled within<br />
a relatively cool part of the basin, this well had a temperature gradient of only 60 ° C/km.<br />
Figure 4 shows a plot of vitrinite reflectance versus depth for several wells at the Cerro Prieto<br />
geothermal field (Barker and Elders, 1981). The graph displays considerable variability in vitrinite gradients<br />
that probably depends on proximity to a “hot spot.” Some wells show R o ranges from 0.7 to 1.0% at<br />
depths as shallow as 800 to 3,300 ft. In borehole M-84, vitrinite reflectance ranges from 0.12% at 790 ft<br />
to 4.1% at 5,580 ft (Barker and Elders, 1981). These data indicate that thermal maturation levels have<br />
reached or exceeded the wet-gas floor and dry-gas preservation limit (Dow, 1977) at very shallow depths in<br />
the hot spots.<br />
Although under-explored parts of the basin may contain undiscovered coal seams or lacustrine shale<br />
beds with high organic content, the data apparently indicate “normal” pressures at depth throughout the<br />
section, and observations conclude water has entirely saturated potential reservoir rocks. Thus, all the data<br />
indicate the Salton Trough probably contains no basin-centered gas accumulation.
Province, Play and<br />
Accumulation Name:<br />
Geologic<br />
Characterization of<br />
Accumulation:<br />
KEY ACCUMULATION PARAMETERS<br />
Pacific Coast Province, Salton Trough, Imperial Valley, normally pressured,<br />
hydrogeothermal basin.<br />
a. Source/reservoir emote possibilities in the lacustrine shale beds (Miocene through Recent) and<br />
dispersed coally beds (Colorado River Recent sediments)<br />
b. Total Organic Carbons<br />
(TOCs)<br />
0.09% (Palm Spring formation (Plio-Pleistocene)), 0.2% (Pliocene lacustrine<br />
and deltaic sediments), and 15 samples from the SSSDP well ranged from<br />
0.12% to 0.37% (Tmax ranged from 472 to 600)<br />
c. Thermal maturity Ro = 0.7 to 4.1 at depths from 3280-5576 ft.<br />
d. Oil or gas prone gas (CO2 is common; very minor concentrations of hydrocarbon gases)<br />
e. Overall basin maturity very high level of maturation due to post-Miocene hydrogeothermal activity<br />
f. Age and lithologies Miocene to Recent breccias, turbidites, deltaic and lacustrine deposits<br />
g. Rock extent/quality source rocks generally lacking, highly variable levels of induration<br />
throughout the stratigraphic section due to hydrothermal activity<br />
h. Potential reservoirs Colorado River deltaic and lacustrine (Recent) sediments<br />
i. Major traps/seals if not compromised by faulting, hydrothermal mineralization throughout the<br />
stratigraphic section, Pliocene lacustrine deposits, and Miocene Fish Creek<br />
Gypsum and Anhydrites.<br />
j. Petroleum<br />
generation/migration<br />
models<br />
in-situ generation of dispersed coally material within the Colorado River<br />
deltaic sediments is a remote possibility; other source rocks are lacking<br />
k. Depth ranges sediment fill of up to 20,000 ft<br />
l. Pressure gradients wells drilled at the Salton Sea and Cerro Prieto geothermal fields had<br />
gradients that ranged from 0.40 to 0.42 psi per ft
Production and Drilling<br />
Characteristics:<br />
Economic<br />
Characteristics:<br />
a. Important<br />
fields/reservoirs<br />
none<br />
b. Cumulative production none<br />
a. High inert gas content High CO2 (80 to 90 wt%)<br />
b. Recovery<br />
c. Pipeline infrastructure poor<br />
d. Overmaturity possible; Ro values range 0.7% to 4.1%<br />
e. Basin maturity mature to overmature but with low present day geothermal gradient<br />
f. Sediment consolidation poorly consolidated sediments, except in the vicinity of geothermal<br />
anomalies where hydrothermal fluids have effectively cemented thousands of<br />
feet of section<br />
g. Porosity/completion<br />
problems<br />
h. Permeability<br />
i. Porosity<br />
sediments deposited are mineralogically complex with a variety of clays;<br />
also problematic are well indurated rocks in geothermal areas
116° W<br />
Coachella<br />
Valley<br />
Elsinore Fault<br />
San Andreas Fault<br />
Borrego<br />
Basin<br />
Salton Sea<br />
A<br />
?<br />
San Jacinto Fault Zone<br />
Fish Creek<br />
Basin<br />
115° W<br />
Salton Buttes<br />
Brawley<br />
Fault Zone<br />
West<br />
Mesa<br />
33° N 116° W<br />
Primary transform fault<br />
Seismically active extension<br />
of transform fault<br />
Inactive fracture zone or<br />
fossil transform fault<br />
Explanation<br />
Figure 1. Geologic map of Salton Trough in southern California. After Lonsdale (1989).<br />
A'<br />
Sand Hills Fault<br />
California<br />
Mexico<br />
Cucapa Fault<br />
Spreading center<br />
33° N<br />
Imperial Fault<br />
Laguna Salada<br />
Fault<br />
Dip-slip extensional faults<br />
on rifted margin<br />
Cerro Prieto<br />
Volcano<br />
Laguna Salada<br />
Basin<br />
Col o r ado R iver<br />
Arizona<br />
Mexico<br />
Colorado Delta<br />
0 20 km<br />
Scale<br />
N<br />
Cerro<br />
Prieto Fault<br />
Basement rock (outcrop)<br />
Possible extent of<br />
continental basement<br />
115° W
Depth in Kilometers<br />
0<br />
10<br />
20<br />
A A'<br />
Thinned Continental Margin Newly Accreted "Basement"<br />
Continental Basement<br />
(Peninsular Ranges)<br />
2.9<br />
2.75<br />
Alluvial fill with minor<br />
igneous Intrusions<br />
Sedimentary fill with minor<br />
igneous intrusions<br />
Metamorphosed sediments<br />
with igneous intrusions<br />
Elsinore Fault<br />
3.1<br />
West Mesa<br />
Brawley Fault<br />
Zone<br />
2.3<br />
3.32<br />
2.55<br />
2.65<br />
Sand Hills Fault<br />
"Subbasement"<br />
(igneous crust or modified upper mantle)<br />
Explanation<br />
Continental Basement<br />
Normal Upper Mantle<br />
Figure 2. Cross section of Salton Trough in southern California. Dashed boundaries are controlled by gravity modeling only. After Fuis et al. (1982)<br />
and Lonsdale (1989).<br />
2.75<br />
Igneous crust or<br />
modified upper mantle<br />
Basement rocks<br />
Estimated density (g/cm 3)<br />
2.75<br />
Scale<br />
0 20 km
System<br />
Quaternary<br />
?<br />
Tertiary<br />
Pre-Tertiary<br />
Series<br />
Holocene<br />
Pleistocene<br />
?<br />
Pliocene<br />
?<br />
Miocene<br />
N S<br />
Ocotillo Conglomerate<br />
Canebrake<br />
Conglomerate<br />
Mecca Formation<br />
Sand and gravel<br />
Subaerial sand, silt, and clay<br />
Conglomerate<br />
Lacustrine sediments<br />
Marine sediments<br />
Explanation<br />
Breccia and conglomerate<br />
Formation<br />
Brawley Formation<br />
Borrego Formation<br />
Palm Spring Formation<br />
Imperial Formation<br />
Basement<br />
Igneous and metamorphic rocks<br />
Fish Creek Gypsum<br />
Split Mountain Formation<br />
Anza Formation<br />
Figure 3. Generalized stratigraphy of the Salton trough. After Muffler and Doe (1968), and Lucchitta (1972).
Depth in Feet<br />
0<br />
2,000<br />
4,000<br />
6,000<br />
8,000<br />
0.0<br />
0.5<br />
x<br />
x<br />
x<br />
x<br />
x x<br />
x<br />
x<br />
x xx<br />
M-84<br />
M-93<br />
x<br />
1.0<br />
1.5<br />
% Ro (Vitrinite Reflectance)<br />
x<br />
x<br />
2.0<br />
x x<br />
xx<br />
x<br />
x<br />
x xx<br />
x<br />
x<br />
x<br />
x<br />
x M-94<br />
Circled data points are from core samples.<br />
M-105<br />
All other data points are from cuttings samples.<br />
Figure 4. Average vitrinite reflectance as a function of sample depth in boreholes M-84, M-93, M-94, and M-105. Third-order polynomial regression curves<br />
plotted for M-84, M-93, and M-105 indicate the rank profile. After Barker and Elders (1981).<br />
x<br />
x<br />
x<br />
x<br />
2.5<br />
x x<br />
x<br />
x<br />
x<br />
3.0<br />
x<br />
x<br />
x<br />
x<br />
3.5<br />
4.0<br />
4.5<br />
0.0<br />
0.5<br />
1.0<br />
1.5<br />
2.0<br />
2.5<br />
3.0<br />
Depth in km
GEOLOGIC SETTING<br />
The San Rafael Swell is an uplift located on the northwest side of the Paradox Basin in north-central Utah<br />
(Figure 1). Two sub-parallel rows of southward-facing cliffs, the Book Cliffs and the Roan Cliffs, rim the Swell on<br />
the northeast, and the Richfield high-plateau volcanic area forms the southeast border. Rocks in the San Rafael Swell<br />
range in age from Permian through Cretaceous, with Eocene strata exposed to the north as the Swell merges with the<br />
south limb of the Uinta Basin (Figure 2). Maximum thickness of Phanerozoic sediments on the Swell ranges from<br />
5,000 to 8,000 feet.<br />
The Lower Cretaceous in this area includes the Cedar Mountain Formation (Albian), unconformably overlain by<br />
the Dakota Sandstone (Cenomanian), which is in turn unconformably overlain by the Tununk Member of the<br />
Mancos Shale (Turonian) (Young, 1960). The Dakota Sandstone, Cedar Mountain Formation, and the underlying<br />
Buckhorn Member together comprise the Dakota Group. Spieker (1946) designated the entire Cretaceous interval as<br />
the Indianola Group (Figure 3).<br />
The Dakota Group rocks derive from formations uplifted and thrusted eastward during the Sevier orogeny<br />
(Lawton, 1983, 1985; Peterson, 1994). Deposition occurred along the western shore of a Cretaceous seaway that<br />
traversed the continent from Mexico to the Arctic. Dakota sediments uncomformably onlap the Morrison Formation<br />
on the west and grade eastward into a marine shale (Figure 3) (McGookey et al., 1972). The Dakota Group represents<br />
four major stratigraphic sequences which reflect regional base-level fluctuations caused by both tectonics and eustatic<br />
sea level changes. Multiple unconformities and smaller-scale sequences occur within each megasequence, in response<br />
to variations in sediment supply, climatic fluctuations and local structural developments (Dolson and Muller, 1994).<br />
Elder and Kirkland (1964) present a relative sea-level curve and ammonite zonation for the Cenomanian of central<br />
Utah.<br />
Peterson (1969) subdivided the Dakota Formation into three lithic units: a lower conglomeratic sandstone and<br />
shale unit from 0 to 65 ft thick; a middle carbonaceous shale, coal and sandstone unit from 0 to 80 ft thick; and an<br />
upper marine sandstone unit from 0 to 85 ft thick. The upper unit contains a large and diverse marine molluscan<br />
faunal assemblage, consisting mostly of bivalves and ammonites (Eaton et al., 1990). Sandstones in the Dakota<br />
generally thicken and coarsen westward.<br />
The San Rafael Swell resulted from basement uplift and thin-skinned deformation, where the eastward-verging<br />
Sevier thrust belt impinged on the nearly horizontal strata of the Colorado Plateau. Exposures on the west flank of<br />
the Swell show detachment folds occur above a décollement in the Jurassic Carmel Formation, where a fold train lies<br />
above a thin gypsum layer. These folds developed in response to regional horizontal compression on the west limb<br />
of the Swell during Paleocene time (Royse, 1996). This décollement represents part of a stratigraphically-controlled<br />
regional detachment that occupies the east flank of the Jurassic evaporite basin.<br />
The Swell first became active as a region of reduced subsidence before it developed topographic relief. It began to<br />
grow in mid-Cretaceous time (about 90 Ma) as a low-relief structural welt in the Rocky Mountain foreland (Perry<br />
and Flores, 1997). Giuseppe and Heller (1998) compared sections of the Price River Formation (Campanian) to the<br />
laterally equivalent Farrer Formation and found variations across the swell crest, demonstrating tectonic uplift in Late<br />
Cretaceous time.<br />
1
HYDROCARBON POTENTIAL<br />
In central Utah very little exploration has occurred for Permian, Triassic and Cretaceous reservoirs. The flanks<br />
of the San Rafael Swell and the Circle Cliffs uplift represent prospective areas for both structural and stratigraphic<br />
traps (Sprinkel et al., 1997). Known petroleum resources of the area include gas in the Triassic Moenkopi<br />
Formation, the Cretaceous Ferron and Dakota Sandstones, and the Eocene Wasatch and Green River Formations<br />
(Figure 4). The Dakota Sandstone and Moenkopi Formation also contain small quantities of oil. Tar sands are<br />
common in the Moenkopi, and oil shale occurs in the Green River Formation. Weiss et al. (1990), and Bishop and<br />
Tripp (1993) reported extraction of some tar sands for local use, but the oil shale remains unexploited.<br />
Dakota Group rocks have yielded more than 2.0 BBOE of hydrocarbons, mostly from stratigraphic traps<br />
controlled by paleotopography (Dolson and Muller, 1994). The Moenkopi has produced significant quantities of oil<br />
from the Grassy Trail Creek field in the Swell.<br />
Nine gas fields exist in the area, in addition to Farnham Dome (carbon dioxide production) and Woodside Dome<br />
(helium reserves) (Table 1). Two fields, the Flat Canyon and Joe’s Valley, have produced natural gas from Dakota<br />
Formation reservoirs in the Wasatch Plateau adjacent to the San Rafael Swell. Dakota production may also have<br />
occurred from the abandoned Miller Creek field near Price, Utah; this field is located on the northwest plunge of the<br />
Swell.<br />
EVIDENCE FOR BASIN-CENTERED GAS<br />
Indirect evidence exists for basin-centered hydrocarbons in the giant Altamont-Bluebell field in Uinta basin,<br />
about 70 mi northeast of Price. Altamont-Bluebell represents an atypical stratigraphic oil field; it contains source<br />
rock in which conversion of kerogen to oil actively continues at depth in the Green River oil shale. The reservoir<br />
consists of oil accumulations occurring in naturally fractured, low-porosity Tertiary lacustrine sandstones. Reservoir<br />
overpressure is high enough to approach lithostatic (Bredehoeft et al., 1994). Lucas and Drexler (1976) believe the<br />
field may exemplify deep-basin, organic-shale-related, overpressured accumulations. Entrapment is entirely<br />
stratigraphic on the monoclinal basin flank. Fractures are essential for achieving commercial flow rates.<br />
Other hydrocarbon evidence includes gilsonite veins exposed in several Cretaceous and Tertiary formations and<br />
the Moenkopi tar sands (Fouch et al., 1992).<br />
2
Province, Play and<br />
Accumulation Name:<br />
Geologic<br />
Characterization of<br />
Accumulation:<br />
KEY ACCUMULATION PARAMETERS<br />
Provinces: Paradox Basin, and Uinta-Piceance Basin. Plays: Cretaceous<br />
Dakota to Jurassic; Uinta Tertiary Oil and Gas; Wasatch Plateau-Emery<br />
(unconventional-coal bed gas); Permo-Triassic Unconformity; and<br />
Cretaceous<br />
Sandstones; Accumulation: North end, San Rafael Swell<br />
a. Source/reservoir Organic-rich mudstones in the Mancos Shale and Cretaceous-age coals<br />
(Dakota Group, Ferron and Mesaverde formations) are the source rocks. The<br />
Ferron and Dakota sandstones are reservoirs for gas. Organic-rich shale of<br />
the<br />
the Permian Phosphoria and/or Park City formations may be a source of oil<br />
(Meissner and Clayton, 1984).<br />
b.Total Organic Carbons<br />
(TOCs)<br />
c.Thermal maturity Type III Kerogen. Mean Ro ranged from 0.50 to 0.65 for Dakota Sandstone<br />
coal and shale samples in the region (Nuccio and Johnson, 1988).<br />
d.Oil or gas prone<br />
e.Overall basin maturity<br />
f.Age and lithologies Permian through Cretaceous in the basin area; Eocene strata exposed to north<br />
where San Rafael Swell merges with south limb of Uinta Basin.<br />
Conglomeratic sandstone, shale, carbonaceous shales, coal, and fossiliferous<br />
marine sandstones.<br />
g. Rock extent/quality possibly basin-wide source and reservoir-rock distribution; flanks of San<br />
Rafael Swell and Circle Cliffs uplift are prospective areas for structural and<br />
stratigraphic traps (Sprinkel et al., 1997)<br />
h.Potential reservoirs Triassic Moenkopi Formation, Cretaceous Ferron and Dakota Sandstones,<br />
and Eocene Wasatch and Green River Formations.<br />
i.Major traps/seals Structurally controlled (simple doubly-plunging folds and complexly faulted<br />
anticlines); probably stratigraphic, with discontinous sandstones in the<br />
Dakota and Ferron units.<br />
j.Petroleum<br />
generation/migration<br />
models<br />
k.Depth ranges<br />
l.Pressure gradients<br />
Fractures in Entrada Sandstone on the Swell acted as conduits for<br />
hydrocarbon migration, and both solid bitumen and live oil droplets occur in<br />
lamproite dikes and secondary calcite veins which now fill the fractures; a<br />
discontinuous corridor of sub-parallel faults extends updip from these dikes<br />
towards a large tar sand deposit southeast (Hulen et al., 1998).
Production and Drilling<br />
Characteristics:<br />
Economic<br />
Characteristics:<br />
a. Important<br />
fields/reservoirs<br />
b. Cumulative production<br />
Field County Area<br />
a. High inert gas content<br />
b. Recovery<br />
c. Pipeline infrastructure<br />
d. Overmaturity mature to overmature<br />
e. Basin maturity<br />
f. Sediment consolidation<br />
g. Porosity/completion<br />
problems<br />
h. Permeability<br />
i. Porosity<br />
Farnham Dome, Gordon Creek, Grassy Trail Creek, South Last Chance,<br />
Woodside Dome, Flat Canyon, Joe's Valley, Drunkards Wash, Miller Creek,<br />
Peters Point, and Stone Cabin<br />
Producing<br />
Formation<br />
Cumulative<br />
Oil (bbl)<br />
Production-1963<br />
Gas (mmcf)<br />
Farnham Dome. Carbon San Rafael Swell Navajo Ss 0 2.5<br />
Drunkards Wash Carbon San Rafael Swell Ferron coals - 66 BCF<br />
Miller Creek Carbon San Rafael Swell Ferron Ss -<br />
Gordon Creek Carbon Wasatch Plateau Permo-Triassic 0 0<br />
Peters Point Carbon Uinta Basin Wasatch Fm 142,852 5<br />
Stone Cabin Carbon, Duschesne Uinta Basin Wasatch Fm 23 715.3<br />
Grassy Trail Cr. Carbon, Emery San Rafael Swell Moenkopi Fm 540,000 145<br />
Woodside Dome Emery San Rafael Swell Permian Kaibab 0 0<br />
Last Chance, So. Emery Wasatch Plateau Permo-Triassic 0 0<br />
Flat Canyon Emery Wasatch Plateau Dakota Ss 317 1,441<br />
Joe’s Valley Sanpete Wasatch Plateau Ferron Ss 0 2,566<br />
“ “ “ Dakota Grp 0 1,646
39°<br />
70<br />
Tertiary rocks (T)<br />
111° 110°<br />
Castle Valley<br />
Mesaverde Group (Kmv)<br />
Mancos Shale (Kms)<br />
Price<br />
6<br />
San Rafael Swell<br />
Lower Cretaceous<br />
rocks (Kl)<br />
Jurassic rocks (J)<br />
Navajo Sandstone (Jn)<br />
Green River<br />
Green River<br />
Utah<br />
Map area<br />
0 20 mi<br />
Triassic and Upper<br />
Paleozoic (T R Pz)<br />
Figure 1. Generalized geologic map of the San Rafael Swell area, central Utah. The Mesaverde Group (Kms) includes<br />
the Dakota Sandstone. After Lawton (1983).
Cenozoic<br />
Mesozoic<br />
Tertiary<br />
Cretaceous<br />
Jurassic<br />
Triassic<br />
Age<br />
Eocene<br />
Paleocene<br />
Middle<br />
(part)<br />
Early<br />
Late<br />
Early<br />
Maestrichtian<br />
Campanian<br />
Santonian<br />
Coniacian<br />
Turonian<br />
Cenomanian<br />
Albian<br />
Aptian<br />
Neocomian<br />
Portlandian<br />
Kimmeridgian<br />
Oxfordian<br />
Callovian<br />
Bathonian<br />
Bajocian<br />
Aalenian<br />
Toarcian<br />
Pliensbachian<br />
Sinemurian<br />
Hettangian<br />
Upper<br />
Middle<br />
Lower<br />
East Wasatch<br />
Canyon<br />
Flagstaff<br />
Limestone<br />
North Horn<br />
Formation<br />
Castlegate Sandstone<br />
Star Point Ss<br />
Emery Sandstone Member<br />
Dakota Sandstone<br />
Price<br />
Canyon<br />
Price River Formation<br />
Curtis Formation<br />
Sunnyside<br />
Green River Fm<br />
Colton<br />
Formation<br />
Flagstaff Mbr of Green River Fm<br />
Blackhawk Formation<br />
Tununk Member<br />
Bluecastle Tongue<br />
Green<br />
River<br />
Blue Gate Member<br />
Ferron Ss Mbr<br />
Cedar Mountain Formation<br />
Morrison Formation<br />
Summerville Formation<br />
Entrada Sandstone<br />
Carmel Formation<br />
Navajo Sandstone<br />
Wingate Sandstone<br />
Chinle Formation<br />
Moenkopi Formation<br />
Sego<br />
Canyon<br />
Wasatch<br />
Formation<br />
Neslen Fm<br />
Westwater<br />
Canyon<br />
Dark Canyon<br />
sequence of Wasatch Fm<br />
Buck Tongue of Mancos Shale<br />
Blue Gate Member<br />
Green River Fm<br />
Tuscher and Farrer Formations<br />
Mancos Shale<br />
Castlegate Sandstone<br />
UT-CO<br />
State Line<br />
Figure 2. Generalized stratigraphic column for the Mesozoic and Cenozoic eras on the north end of the San Rafael<br />
Swell, Utah. After from A. A. P. G. (1967), McGookey et al. (1972), Berman et al. (1980), Eaton et al.<br />
(1990), and Fouch et al. (1992).<br />
Sego Ss<br />
Age<br />
(10 6 yr)<br />
50<br />
60<br />
70<br />
80<br />
90<br />
100<br />
110<br />
120<br />
130<br />
140<br />
150<br />
160<br />
170<br />
180<br />
190<br />
200<br />
210<br />
220
Sevier Orogenic Belt<br />
Paleozoic North Horn Fm<br />
Paleocene<br />
Nugget-Navajo Ss<br />
Indianola Grp<br />
Arapien Fm - Twist Gulch Fm<br />
Jurassic<br />
South Flat Fm<br />
Shale<br />
Sandstone with<br />
interbedded shale<br />
Sandstone<br />
Dakota Grp<br />
Morrison Fm<br />
Price River Fm<br />
Ferron Ss<br />
Emery Ss<br />
Aspen Shale<br />
Castlegate Ss<br />
Blackhawk Fm<br />
Lower Cretaceous<br />
Sandstone and<br />
conglomerate<br />
Limestone<br />
Dolomite<br />
Mesaverde Grp<br />
Mancos Shale<br />
Figure 3. Diagrammatic cross section across the Rocky Mountain Geosyncline in central Utah. After Armstrong (1968).<br />
Fox Hills Ss<br />
Lewis Shale<br />
Fault<br />
Pierre Shale<br />
Niobrara Ls
40°<br />
39°<br />
⊥ ⊥<br />
⊥<br />
Duchesne<br />
Carbon<br />
⊥ ⊥ ⊥ ⊥ ⊥ ⊥ ⊥<br />
Emery<br />
⊥<br />
110° 109° 108°<br />
⊥<br />
⊥ ⊥ ⊥ ⊥ ⊥<br />
Uintah<br />
Grand<br />
Paradox<br />
Basin<br />
⊥<br />
Uinta<br />
Basin<br />
Greater Cisco Area<br />
⊥<br />
Crescent<br />
Junction<br />
Cisco<br />
Dome<br />
⊥<br />
Fence<br />
Canyon<br />
Westwater<br />
Cisco<br />
Springs<br />
East<br />
Canyon<br />
Bryson<br />
Canyon<br />
⊥ ⊥<br />
Hells Hole<br />
Canyon<br />
Harley Dome<br />
(Helium)<br />
⊥ ⊥ ⊥<br />
Cisco<br />
Wash<br />
Utah<br />
San<br />
Arroyo<br />
Colorado<br />
⊥<br />
Baxter<br />
Pass<br />
Rangely<br />
⊥ ⊥<br />
South<br />
Canyon<br />
Bridle<br />
Stateline Bar-X<br />
Winter Valley<br />
⊥<br />
⊥ ⊥<br />
Douglas<br />
Creek<br />
⊥<br />
Trail<br />
Canyon<br />
⊥<br />
⊥ ⊥ ⊥<br />
Precambrian outcrop ≥ 5 BCF Dakota-Morrison field<br />
Axial basin uplift<br />
⊥<br />
Grand<br />
Junction<br />
⊥<br />
⊥<br />
Piceance<br />
Basin<br />
⊥<br />
⊥ ⊥<br />
Debeque<br />
Maybell<br />
Meeker<br />
Shire Gulch<br />
Wilson Creek<br />
White River uplift<br />
⊥ ⊥ ⊥ ⊥ ⊥ ⊥ ⊥<br />
⊥ ⊥ ⊥ ⊥ ⊥<br />
Anticline, showing<br />
direction of plunge<br />
Moffat<br />
Rio Blanco<br />
Garfield<br />
Mesa Pitkin<br />
⊥ ⊥<br />
⊥<br />
Delta Gunnison<br />
Glenwood<br />
Springs<br />
0 20 mi<br />
Figure 4. Map of eastern Utah and western Colorado, showing fields that have produced 5 billion cubic feet (BCF) of natural gas from Dakota, Cedar<br />
Mountain, and Morrison reservoirs. After Noe (1993).
GEOLOGIC SETTING<br />
The Santa Maria basin is a triangular depression in the California coastal belt northwest of Los Angeles (Figure<br />
1). The basin is 150 miles long and 10-50 miles wide and covers an area of 3000 square miles. The basin boundaries<br />
include the Santa Lucia and San Rafael Mountains on the north and northeast, respectively, the Santa Ynez<br />
Mountains on the south, and the Pacific Ocean on the west (Crawford, 1970; Dunham et al., 1991).<br />
The basin’s origin began with Andean-type subduction of North America’s western margin during the late<br />
Mesozoic and middle Tertiary. Subduction progressed until the margin reached the East Pacific Rise at 30 Ma, after<br />
which the relative motion changed to right-slip displacement. The Neogene basins of western California developed in<br />
response to right-lateral shearing of the continental margin (Dunham et al., 1991).<br />
1<br />
The geotectonic history of the Santa Maria basin includes the following stages:<br />
1) Late Cretaceous to early Miocene: right-slip movement along the Santa Maria River-Little Pine fault<br />
system and the Santa Ynez River fault to the south triggered initial subsidence and rifting of the basin<br />
(Dunham et al., 1991). Tectonic spreading may have formed pull-apart structures as the Mendocino triple<br />
junction migrated past the San Luis Obispo area about 20-28 Ma (Hall, 1981). The initial rifting and basin<br />
subsidence deposited the coarse alluvial conglomerates of the Late Oligocene-Early Miocene Lopse<br />
Formation.<br />
2) Miocene to Pliocene: continued wrench faulting resulted in rapid subsidence and development of a deep<br />
marine basin. Climatic and oceanographic changes produced favorable conditions for high plankton<br />
productivity in surface waters above the deep basin. The basin filled with organic-rich pelagic and<br />
hemipelagic sediments of the Monterey and Sisquoc Formations (Figure 2). Uplift of the Santa Ynez and<br />
San Rafael Mountains began during late Pliocene and contributed non-marine sediments.<br />
3) Post-Miocene: tectonic style changed from right-slip motion to northeast-southwest-directed compression<br />
and resulted in thrust faulting. Reverse faults border or cut nearly every field in the Santa Maria Basin<br />
(Figure 3). These compressional structures formed some of the major oil-producing anticlines in the region<br />
(Dunham et al., 1991). The thickness of the deformed basin fill probably approaches 15,000 ft in the<br />
footwalls of reverse fault systems (Figure 3).<br />
HYDROCARBON PRODUCTION<br />
The Santa Maria basin is one of the oldest oil-producing regions in California. Exploratory drilling began in the<br />
late 1890s near several oil seeps in the area. By 1908, major oil discoveries included the Orcutt, Lompoc, and Cat<br />
Canyon fields (Figure 1). The offshore Santa Maria basin has seen exploration since the 1950s; major offshore<br />
discoveries occurred in the 1980s and include the Point Pedernales, San Miguel, Bonito, and Sword fields. In 1981<br />
Chevron discovered the Point Arguello field, the largest U.S. oil find since Alaska’s Prudhoe Bay; Point Arguello<br />
EUR has exceeded 300 MMBO.<br />
Offshore fields produce heavy oil, with gravities ranging from less than 5 to as light as 40° API (Dunham et al.,<br />
1991). Onshore basin oils have low gravities ranging from 16 to 27° API, and high sulfur and nitrogen content.<br />
Natural gas comprises only a small portion of the hydrocarbons. The gas occurs as solution gas or, rarely, as gas<br />
caps (Dryden et al., 1965; Dunham et al., 1991).<br />
Net reservoir thickness averages 1000 ft and ranges from 50 to 3,000 ft. Porosities range from 15 to 20%, and<br />
permeabilities reach 1 darcy (Milton et al., 1996). Anticlines that formed above major reverse faults have trapped<br />
most oil and gas accumulation within the basin. To date, only one significant nonstructural field has a trap formed<br />
by a stratigraphic pinchout.
Several formations within the basin have yielded oil, but the naturally fractured siliceous shales and cherts of the<br />
Monterey Formation (Figure 2) have accounted for the greatest production. The Monterey ranges from 0 to 3000 ft<br />
thick and averages 1,000 ft (Figure 3) (Milton et al., 1996). The formation constitutes both a source rock and a<br />
reservoir. Organic-rich zones occur as 1.5 to 6.5 ft thick shale layers, interbedded with thin dolomite beds in the<br />
lower and middle members of the formation. Kerogen content commonly exceeds 5% and locally exceeds 18% within<br />
some shale beds. However, though interbedded with fractured reservoir rocks, those same shales may not have<br />
generated the oil. Instead, oil may have migrated a considerable distance up dip along fractures before becoming<br />
structurally trapped.<br />
Monterey organic matter is mostly amorphous algal material which matures at a significantly faster rate than<br />
structured organic debris such as vitrinite. Thus, vitrinite reflectance has proven unreliable as a maturity indicator.<br />
Monterey oils may have originated at unusually low temperatures because of the unusual formation chemistry. Rapid<br />
basin subsidence may have accelerated the entry of Monterey source rocks into the oil generation zone. In many areas<br />
of the basin, the Monterey Formation lies at depths where temperatures exceed 120 °C which is within the classic oil<br />
window (Dunham et al., 1991).<br />
EVIDENCE FOR BASIN-CENTERED GAS<br />
Santa Maria basin source rocks contain mostly Type II oil-prone organic matter. To generate significant gas<br />
from Type II kerogens, the oil requires thermal cracking through deep burial. The window for oil-to-gas conversion<br />
occurs at a Tmax of 460 °F, and vitrinite reflectance (Ro) must exceed 1.2%. Unfortunately, vitrinite reflectance is<br />
not a reliable indicator for the Monterey Formation.<br />
Extrapolation of French's geothermal gradient for three fields in the Santa Maria basin indicates the deepest part<br />
of the basin (12,000-15,000 ft) has sufficient temperature and burial depth for gas generation and/or conversion from<br />
Type II kerogen (Magoon and Isaacs, 1983). This analysis assumes removal of 3000 ft of overburden. As the<br />
thickness of fill approaches 15,000 ft (Magoon and Isaacs, 1983; Tennyson, 1996), only the deepest part of the basin<br />
may be mature enough for basin-centered gas accumulation.<br />
2
Province, Play and<br />
Accumulation Name:<br />
Geologic<br />
Characterization of<br />
Accumulation:<br />
KEY ACCUMULATION PARAMETERS<br />
Pacific Coast- Santa Maria basin, southern California. fractured chert and<br />
dolomite and cherty shale of middle to late Miocene Monterey formation<br />
a. Source/reservoir Monterey formation; source-organic rich shales; reservoir-fractured brittled<br />
rocks (chert and carbonate)<br />
b. Total Organic Carbons<br />
(TOCs)<br />
17% (avg. 5%)<br />
c. Thermal maturity type II Kerogen; Ro is an unreliable indicator here; maturity established by<br />
depth of burial plots<br />
d. Oil or gas prone both heavy oil (12 to 35 degrees API) and gas prone (associated gas only)<br />
e. Overall basin maturity considered marginally mature to mature along with adjoining basins in the<br />
Pacific Coast<br />
f. Age and lithologies fractured chert and cherty shale of middle to late Miocene Monterey<br />
Formation<br />
g. Rock extent/quality basin-wide source and reservoir-rock distribution<br />
h. Potential reservoirs<br />
i. Major traps/seals producing fields-structural (nearly every field in the basin is bounded or cut<br />
by reverse faults); stratigraphic pinchouts<br />
j. Petroleum<br />
generation/migration<br />
models<br />
migration began in the late Miocene and likely continues to the present in<br />
tectonically subsiding regions of the basin where immature Monterey shales<br />
are only now being carried into the oil window<br />
k. Depth ranges 1,300 to 10,000 ft (producing fields); 12,000-15,000 ft in the basin center<br />
l. Pressure gradients
Production and Drilling<br />
Characteristics:<br />
Economic<br />
Characteristics:<br />
a. Important<br />
fields/reservoirs<br />
Orcutt, Lompoc, Casmalia, Cat Canyon, Santa Maria Valley Field, Point<br />
Arguello, Point Pedernales, and San Miguel<br />
b.Cumulative production Orcutt (disc. 1901, >180 MMBO); Lompoc (>47 MMBO); Casmalia (50<br />
MMBO); Cat Canyon (298 MMBO, 178 BCFG); Santa Maria Valley Field<br />
(184 MMBO); Point Arguello (disc 1981, 123 MMBO); Point Pedernales<br />
(disc. 1983, 20,000 BBO/day); San Miguel (disc. 1983, 3780 BBO/day)<br />
a. High inert gas content CO2: 20%-25% (Dryden et al., 1965); sulfur; nitrogen<br />
b.Recovery Low. Continuous-type accumulations are characterized by low individual<br />
well-production rates and small well-drainage area. Directional/horizontal<br />
wells are being drilled to reduce the number of well sites.<br />
c.Pipeline infrastructure very good There are numerous gas lines in the basin.<br />
d.Overmaturity none<br />
e.Basin maturity immature in some places<br />
f.Sediment consolidation consolidation/porosity reduction occurs with depth of burial<br />
g. Porosity/completion<br />
problems<br />
h.Permeability<br />
i.Porosity<br />
no problems; fractured reservoirs; porosity = 15-20%
San Andreas<br />
Fault<br />
Nacimiento<br />
Fault<br />
Offshore<br />
Santa Maria basin<br />
120° 30' 120° 20'<br />
Onshore<br />
Santa Maria<br />
basin<br />
Santa Maria Valley<br />
Santa Maria Valley Syncline<br />
San Antonio Valley Syncline<br />
Casmalia<br />
Oil field and field name<br />
Potential basin-centered<br />
gas accumulation<br />
Lompoc<br />
San Andreas<br />
Fault<br />
Orcutt<br />
A'<br />
A<br />
Anticline<br />
Cat<br />
Canyon<br />
Los Alamos Valley Syncline<br />
Purisima<br />
anticline<br />
0 5 mi<br />
Figure 1. Index map of the Santa Maria basin, California, showing locations of major structural features, oil fields,<br />
potential basin-centered gas accumulation, and cross section A-A'. After Magoon and Isaacs (1983).<br />
Fault<br />
Syncline Unconformity<br />
35° 00'<br />
34° 50'<br />
34° 40'
System<br />
Quaternary<br />
Tertiary<br />
Cretaceous<br />
Jurassic<br />
Series Unit Lithology Description<br />
Pleistocene<br />
Pliocene<br />
Upper<br />
Miocene<br />
Middle<br />
Miocene<br />
Lower<br />
Miocene<br />
Paso Robles Formation<br />
Careaga Sandstone<br />
Foxen Mudstone<br />
Repettian equivalent<br />
Mudstone<br />
Sisquoc Formation<br />
Upper Monterey<br />
Formation<br />
Middle Monterey<br />
Formation<br />
Lower Monterey<br />
Formation<br />
Point Sal Formation<br />
Tranquillon Volcanics<br />
Lospe Conglomerate<br />
Espada (?) Formation<br />
Point Sal Ophiolite<br />
Franciscan Complex<br />
Conglomerate<br />
Sandstone<br />
Shale and siltstone<br />
Diatomaceous mudstone<br />
Siliceous mudstone<br />
Interbedded siliceous<br />
shale and dolomite<br />
Interbedded siliceous<br />
shale and chert<br />
Phosphatic shale<br />
Interbedded siliceous<br />
shale and dolomite<br />
Shale and sandstone<br />
Sheared and compacted<br />
shale and siltstone<br />
Chert-basalt-gabbro<br />
and/or melange<br />
Figure 2. Stratigraphic column of the onshore Santa Maria basin, California. The facies change to deeper-water clastic<br />
rocks takes place in the Plio-Pleistocene interval of the offshore basin. After Dunham et al (1991).
South North<br />
Formations<br />
Alluvium (Quaternary)<br />
Orcutt (Pliocene to north)<br />
Paso Robles (Pliocene-<br />
Pleistocene to south)<br />
Careaga (Pliocene)<br />
Foxen (Upper Pliocene)<br />
Sisquoc (Lower Pliocene)<br />
Monterey (Middle-Upper Miocene)<br />
Point Sal (Middle Miocene)<br />
Lospe (Lower Miocene)<br />
Franciscan<br />
Complex<br />
Lompoc<br />
Oil Field<br />
Rincon (pre-Miocene)<br />
Orcutt<br />
Oil Field<br />
Franciscan<br />
Complex<br />
Vaqueros (pre-Miocene)<br />
Cozy Dell (Upper Eocene)<br />
Matilija (Upper Eocene)<br />
Alama (Cretaceous or older)<br />
Santa Maria Valley<br />
Oil Field<br />
0 12000<br />
0<br />
165° F Isotherm<br />
Geologic contact<br />
Figure 3. North-south cross section through the Santa Maria basin. After CA Division of Oil and Gas (1974); Magoon and Isaacs (1983). The depth to presentday<br />
temperature of 165° F (74° C) comes from the geothermal gradients for Lompoc, Orcutt, and Santa Maria Valley oil fields. After French (1940).<br />
1000<br />
2000<br />
3000<br />
Scale<br />
(in feet)<br />
Explanation<br />
Fault
GEOLOGIC SETTING<br />
The Snake River Downwarp is a generally east- to west-trending arcuate depression in southern Idaho and east-central Oregon<br />
(Figure 1). The Snake River traverses the entire length of the province. The area’s boundaries include the Columbia Plateau to the<br />
northwest, the Idaho Batholith to the north, the Montana thrust belt to the northeast, and the Yellowstone Plateau to the east. The<br />
Wyoming Overthrust Belt forms the southeastern border, while the Basin and Range province marks the southern to western limits.<br />
Until the Miocene, the downwarp existed as a relatively stable part of the Cordilleran miogeoclinal continental shelf. Onset of<br />
rifting during the Miocene created the present interior rift basin (Warner, 1977), and included normal block-faulting and left-lateral<br />
strike-slip faulting. At this time ancient Lake Bruneau formed and covered much of southern Idaho and adjacent parts of Oregon and<br />
Washington. Lake Bruneau shrank in size as rifting progressed, and by Pliocene time, a smaller remnant–Lake Idaho–occupied only the<br />
down-dropped central rift graben (Warner, 1977; 1980). The deepest part of Lake Bruneau was in the southwest part of the present<br />
basin, immediately north of the Owyhee Mountains (Figure 2). During the Pliocene, rifting shifted the axis of Lake Bruneau’s<br />
structural basin 12 miles northward, and lowered the basin’s northern flank relative to the southern. This became the primary<br />
depositional axis for Pliocene Lake Idaho, which expanded eastward almost to Wyoming (Figure 3).<br />
Paleozoic rocks vary from 0 to 45,000 ft thick in the downwarp, and thicken to over 15,000 ft in the surrounding area. Mesozoic<br />
strata thickness may reach 50,000 ft, but generally ranges from 15,000 to 30,000 ft in the downwarp area (Warner, 1980). The<br />
Miocene Sucker Creek Formation includes up to 3,500 ft of Lake Bruneau sediments (Figure 4). Lake Idaho deposits range to 9,000 ft<br />
in thickness and comprise the Poison Creek, Chalk Hills and Glenns Ferry Formations of the Idaho Group (Peterson, 1996). The<br />
thickest strata for both lakes occur in the western parts of their depositional basins (Figure 5).<br />
The downwarp area shows a high present-day geothermal gradient, probably resulting from emplacement of the Cretaceous Idaho<br />
Batholith (Figure 5). Various events have subjected the area to high-heat flows: the Miocene rifting and related extrusion of the<br />
Columbia Plateau Basalt and Owyhee Volcanics; and Pliocene to Recent extrusion of the Snake River Basalt.<br />
HYDROCARBON PRODUCTION<br />
There is no existing or historical production in the area. Potential reservoirs include interbedded sands in the Idaho Group and the<br />
Sucker Creek Formation. Fracture production is possible from nearly any rock type containing an overpressured basin-centered<br />
accumulation.<br />
EVIDENCE FOR BASIN-CENTERED GAS<br />
Factors that may indicate a basin-centered gas accumulation include abundant gas shows, and some oil shows from both water<br />
wells and hydrocarbon exploration wells. Warner (1980) and Peterson (1996) speculate that the Cenozoic section in the Snake River<br />
Downwarp may total 30,000 ft thick. To date, some drilling has occurred in horizons above 5,000 ft depth, but very little in the strata<br />
between 5,000 and 14,000 ft depth (Figure 2). Sediments at all depths appear to contain some hydrocarbons, although Miocene to<br />
Pliocene lacustrine sediments are most favorable for basin-centered accumulations. Because of the probable great depth and high<br />
thermal gradient in the basin, the deeper areas will only generate gas and may actually be at the peak to past-peak generation stage,<br />
depending on depth and location.<br />
1
Province, Play and<br />
Accumulation Name:<br />
Geologic<br />
Characterization of<br />
Accumulation:<br />
KEY ACCUMULATION PARAMETERS<br />
Rocky Mountain Province; Snake River Downwarp in Southern Idaho.<br />
Possible Cenozoic Basin Centered Gas.<br />
a. Source/reservoir Lacustrine rocks, shale and mudstone of the Tertiary Pliocene Idaho Group<br />
and the Miocene Sucker Creek Fm. (Wood, 1994)<br />
b.Total Organic Carbons<br />
(TOCs)<br />
in the Halbouty 1 J. N. James exploratory well, the 10 highest TOC samples<br />
ranged from 0.43 to 1.95% (Wood, 1994)<br />
c.Thermal maturity Pliocene Idaho Group: immature for the depth range 1000 to 2100 ft; Ro<br />
ranges from 0.2 to 0.7 (estimated from reported vitrinite colors) (Senftle and<br />
Landis, 1991); Rocks of probable Miocene age, below the seismic "Miocene<br />
Volcanics acoustic basement," are mature and range from Ro 0.7 - 1.3 at<br />
3840 ft to 2.0 at 8700 ft depth (estimated from an orange-brown to dark<br />
brown vitrinite color) (Senftle and Landis, 1991). This is in the wet gas to<br />
dry gas zone. Untested strata, between 2100 ft and 3840 ft, may be within the<br />
oil generating window (Wood, 1994). Kerogen is primarily woody, with<br />
secondary amounts of herbaceous spores, pollen and inertinite. This strata<br />
will be a good gas source and a poor oil source. Geothermal gradients in the<br />
Western Snake River Downwarp are high, ranging from 16.5 to 22° F per<br />
1000 ft (30 - 40° C) (Wood, 1994).<br />
d.Oil or gas prone Probably gas prone with associated gas liquids. Gas from a depth of 1979 ft<br />
in Oroco Oil and Gas 1 Virgil Johnson (c se 27, T8N, R4W) indicated 93%<br />
methane, 3% ethane, and 4 % unknown; Btu was 1102 per cu ft (Dwights,<br />
1999)<br />
e.Overall basin maturity probably mature<br />
f.Age and lithologies clastic and lacustrine strata of the Pliocene Idaho Group and Miocene Sucker<br />
Creek Formation<br />
g. Rock extent/quality potentially large extent of possible interbedded lacustrine source and clastic<br />
reservoir strata<br />
h.Potential reservoirs interbedded sands in the Idaho Group and Sucker Creek Formation<br />
i.Major traps/seals possibility of both structural and stratigraphic types<br />
j.Petroleum<br />
generation/migration<br />
models<br />
Tissot and Welte “Cooking Pot” model, where generated hydrocarbons are<br />
expelled into the surrounding reservoir rocks<br />
k.Depth ranges Biogenic gas to 5000 ft depth. Speculative basin-centered gas from 5000 to<br />
25,000-plus ft (Warner, 1980)
Production and Drilling<br />
Characteristics:<br />
Economic<br />
Characteristics:<br />
l. Pressure gradients 0.45 psi/ ft (±0.06 psi/ft) for shallow objectives. Deeper objectives are<br />
possibly overpressured.<br />
a. Important<br />
fields/reservoirs<br />
none<br />
b. Cumulative production none<br />
a. High inert gas content less than 5%<br />
b. Recovery<br />
c. Pipeline infrastructure A single 24-inch pipeline passes through the area paralleling Interstate 84.<br />
Several small lateral lines serve the towns surrounding Boise, Idaho. A major<br />
trunk line runs from the southwest corner of Idaho to Reno, Nevada.<br />
d. Overmaturity unknown, but may occur in Paleozoic strata at great depth. Mid-depth<br />
Mesozoic and early Cenozoic strata could possibly be overmature.<br />
e. Basin maturity Shallow parts of the basin are probably immature.<br />
f. Sediment consolidation Poorly consolidated rocks may exist in the shallower parts of the basin.<br />
g. Porosity/completion<br />
problems<br />
h. Permeability<br />
i. Porosity<br />
low porosity and permeability may be a problem, at least in underpressured<br />
or normally pressured areas
46°<br />
42°<br />
120° 116°<br />
112°<br />
Lake Idaho basin (Pliocene-Pleistocene)<br />
Lake Bruneau basin (Miocene)<br />
Idaho batholith<br />
Figure 1. Map of Snake River downwarp area in southwest Idaho, showing Cenozoic lake basins and Idaho batholith.<br />
After Warner (1981).
U D<br />
A<br />
13000<br />
10000<br />
12000<br />
15000<br />
A'<br />
14000<br />
8000<br />
8000<br />
Igneous rock<br />
9000<br />
13000<br />
0 12 mi<br />
11000<br />
Idaho Batholith<br />
Fault; U is upthrown side, D is downthrown side<br />
U D<br />
Snake River<br />
Halbouty-Chevron 1 J. N. James<br />
Hydrocarbon exploration well; drilled in 1976. SE 27, T4N R1W. Total depth = 14,000 ft.<br />
Total Organic Carbon range 0.43 to 1.95%.<br />
Oroco-Simplot 1 Virgil Johnson<br />
Hydrocarbon exploration well; drilled in 1955. SE 27, T8N R4W. Total depth = 4,040 ft.<br />
Well suffered gas blowout at 1,979 ft depth.<br />
Gas analysis: 1102 Btu/ft 3 , 93% methane, 3% ethane, 4% unknown.<br />
Figure 2. Isopachs showing total thickness of Pliocene and Sucker Creek strata, Snake River downwarp, Southwest<br />
Idaho. Contour interval is 1000 ft. Possible basin-centered gas at 200° F. The peak hydrocarbon generation<br />
isotherm occurs at 9,400 ft. approximately and greater depth. After Warner (1977).
A<br />
A'<br />
9000<br />
Igneous rock<br />
8000<br />
Idaho Batholith<br />
7000<br />
Halbouty-Chevron 1 J. N. James<br />
Oroco-Simplot 1 Virgil Johnson<br />
Snake River<br />
4000<br />
5000<br />
6000<br />
2000<br />
1000<br />
0<br />
4000<br />
3000<br />
3000<br />
2000<br />
0 12 mi<br />
Figure 3. Isopach of post-Sucker Creek Cenozoic strata, Snake River downwarp, Southwest Idaho. Contour interval is 1000 ft. After Warner (1977).
Series Depth Lith. Description Thickness<br />
Pleistocene<br />
Pliocene<br />
Miocene<br />
0<br />
1,000<br />
2,000<br />
3,000<br />
4,000<br />
5,000<br />
6,000<br />
7,000<br />
8,000<br />
9,000<br />
10,000<br />
11,000<br />
Glenns Ferry Formation<br />
This formation consists of a homogeneous mixture of light gray silty clay, containing beds of light<br />
siliceous volcanic ash and some sandstone. In some areas it contains considerable basalt.<br />
The formation represents the last stage of ancient Lake Idaho and the beginning of the Snake River<br />
Basalts.<br />
The sandstones of this formation are best developed in the central portion of the far western end of<br />
the Snake River Plain. Many shallow wells drilled in this formation have shown gas.<br />
Chalk Hills Formation<br />
Oolitic limestone 30-100 feet thick caps this formation. It consists of interbedded silty ashy clay,<br />
sandstone, and pure vitric ash. Also contains some basalts and tuffs. At least one algal reef is present<br />
in the upper portion. This is a lacustrine deposit containing beds rich in mollusc, diatom, ostracod, and<br />
fish fossils. The color of the entire formation is light gray, with the exception of a few ferruginous sands<br />
and some basalts. A white porcellanite bed forms the base of this formation.<br />
Poison Creek Formation<br />
A bright red crystalline volcanic ash (the Cherokee Ash) caps this formation. This formation is<br />
primarily volcanic, consisting of interbedded tuffs, ashes, volcanic sands, and a few basalts. The color<br />
is yellowish brown to greenish brown, and darker overall than the younger units above. Fossils are<br />
sparse.<br />
Owyhee Rhyolite<br />
This unit consists of a mix of rhyolite, dacite, latite, andesite, and a few basalt stringers. Rhyolite<br />
dominates, and it is brownish red to pink in the upper section, becoming more gray with depth. A few<br />
tuffs and ash beds are interbedded with the extrusive rocks.<br />
Columbia River Basalts<br />
(North and northwest part of downwarp)<br />
Sucker Creek Formation<br />
A mix of lacustrine, deltaic, and volcanic deposits. The upper part consists largely of ashy, silty,<br />
carbonaceous shale and siltstone. It contains much diatomite and many giant fossils, and it is highly<br />
lignitic. The formation is very finely laminated.<br />
Interbedded with the carbonaceous section are some very thick (50-100 feet) and extensive<br />
quartzitic sandstones. Ashes, tuffs, and porcellanite are common, and a few black organic shale beds<br />
are present.<br />
Distinct marker beds occur at the following depths:<br />
A green chloritic ash bed (Green Hornet Ash) at 7300 feet.<br />
A white porcellanite bed (Snowbird Shale) at 7750 feet.<br />
A bluish gray perlitic tuff at 8900 feet.<br />
The lower half of the section is similar to the upper half, but contains more volcanic rocks.<br />
Deep wells and drill stem tests have indicated good gas shows.<br />
Jarbidge Rhyolite<br />
A light to dark gray rhyolite with pink and greenish gray zones. It contains some porcellanite, ash,<br />
and tuff beds, and is locally rich in pyrite. The lower part is highly altered in spots, becoming<br />
porphyritic.<br />
Meta-Rhyolite<br />
Coarse porphyritic rhyolite with large quartz and feldspar phenocrysts. It resembles plutonic rock.<br />
Figure 4. Cenozoic stratigraphic column of the western Snake River Downwarp, Idaho. After Warner (1981) and Wood (1994).<br />
3000± ft<br />
300± ft<br />
400± ft<br />
0-3000+ ft<br />
0-9000+ ft<br />
0-2300+ ft
Depth in Feet<br />
0<br />
1,000<br />
2,000<br />
3,000<br />
4,000<br />
5,000<br />
6,000<br />
7,000<br />
8,000<br />
9,000<br />
10,000<br />
11,000<br />
12,000<br />
13,000<br />
14,000<br />
A A'<br />
Standard-<br />
Highland L & L #1<br />
Elevation 2631 ft.<br />
Total Depth = 10,682 ft.<br />
Sea level<br />
200° F<br />
(9400 ft)<br />
Glenns Ferry Fm<br />
Chalk Hills Fm<br />
Poison Creek Fm<br />
Columbia River<br />
Basalt Section<br />
Sucker Creek Fm<br />
Halbouty-<br />
Chevron J. N. James #1<br />
Elevation 2500 ft.<br />
Total Depth = 14,003 ft.<br />
Silty clay to ashy siltstone<br />
Carbonaceous shale<br />
Sandstone<br />
Columbia River<br />
Basalt Section<br />
Fractures<br />
Recent<br />
Glenns<br />
Ferry Fm<br />
Chalk<br />
Hills Fm<br />
Poison<br />
Creek Fm<br />
Sucker<br />
Creek Fm<br />
Idaho<br />
Rift<br />
Poison Creek Fm<br />
Jarbidge Rhyolite<br />
Sucker Creek Fm<br />
Section on<br />
Sucker Creek<br />
Elevation 4500 ft.<br />
Owyhee Rhyolite<br />
Ash, tuff, or porcellanite bed<br />
Rhyolite, dacite or andesite; locally<br />
interbedded with ash or tuff<br />
Basalt flow<br />
0 10 mi<br />
Paleozoic<br />
Rocks<br />
Figure 5. North-south cross section A-A', western Snake River Downwarp. Section shows the relationship between<br />
the stratigraphy and the estimated 200° F isotherm (derived by assuming an average annual surface<br />
temperature of 50° F. The 200° isotherm represents a possible present day top-of-the-peak hydrocarbon<br />
generation window. After Warner (1977).
GEOLOGIC SETTING<br />
As one of the largest foreland basins of the Rocky Mountains, the Alberta Basin extends from southern Alberta<br />
into northern Montana and terminates against the Sweetgrass Arch to the east (Figure 1). The Little Belt Mountains<br />
form the southern border, and the Montana Disturbed Belt close off the basin to the west.<br />
The Basin contains Paleozoic and Mesozoic sediments, but Ordovician, Silurian, Pennsylvanian and Permian<br />
strata are absent because of erosion or non-deposition (Figures 2 and 3). An unconformity separates Mississippian<br />
from Jurassic rocks in the area (Figure 2). Cretaceous rocks dominate the remaining sedimentary section (Figure 3)<br />
(Peterson, 1966).<br />
The late Cretaceous to early Tertiary Laramide orogeny gave the basin its present configuration.<br />
HYDROCARBON PRODUCTION<br />
Figure 1 shows a map of oil and gas fields in the Alberta Basin-Sweetgrass Arch area. The Cut Bank field is the<br />
largest and represents a stratigraphic trap in the Cretaceous Cut Bank Sandstone. Cumulative production to date<br />
exceeded 168 MBO and 322 BCFG. Blackleaf Canyon field produces from the Mississippian Sun River Dolomite<br />
within a Disturbed Belt thrust sheet; to date the field has produced over 33,000 BO and more than 7 BCFG. The Two<br />
Medicine Field has produced more than 25,000 BO from the Cone Member fractured shales in the Upper Cretaceous<br />
Marias River Formation, and more than 11,000 BO and 274 BCFG from the Sun River Dolomite.<br />
The source rock for the most fields in the area is the Devonian-Mississippian Bakken Shale. Although Bakken<br />
oil and gas generation occurred deep in the Alberta Basin, fracturing in the Sun River Dolomite and across the<br />
Mississippian-Jurassic unconformity allowed extensive gas migration updip (Dolson et al., 1993).<br />
EVIDENCE FOR BASIN-CENTERED GAS<br />
Studies of potential source rocks in the Disturbed Belt indicate the Cone Member of the Marias River<br />
Formation, and the Bakken Shale show the greatest potential for hydrocarbon generation (Clayton et al., 1982).<br />
These rocks are generally immature east of the Disturbed Belt (Figure 4), although the Bakken may be mature to<br />
post-mature where buried by thrust sheets (Clayton et al., 1982; Dolson et al., 1993). Vitrinite reflectance (Ro) for<br />
the Bakken ranges from less than 0.5 to 1.5% (Figure 4). Potential reservoirs include Devonian Nisku and Three<br />
Forks Formations, Jurassic Swift and Sawtooth Formations, and sandstones in the Cretaceous Blackleaf and<br />
Kootenai Formations.<br />
The southwest Alberta Basin and the Sweetgrass Arch have little apparent potential for continuous basincentered<br />
gas accumulations. Conventional accumulations in the area have produced large volumes of oil and gas, but<br />
the gas migrated from deeper zones along the Disturbed Belt.
Province, Play and<br />
Accumulation Name:<br />
Geologic<br />
Characterization of<br />
Accumulation:<br />
KEY ACCUMULATION PARAMETERS<br />
Rocky Mountain, Alberta Basin, no accumulation<br />
a. Source/reservoir Potential sources: Bakken Shale and Cone Member, Marias River formation;<br />
potential reservoirs: Devonian Nisku and Three Forks formations, Jurassic<br />
Swift and Sawtooth Formations, and sandstones in the Cretaceous Blackleaf<br />
and Kootenai Formations.<br />
b. Total Organic Carbons<br />
(TOCs)<br />
Devonian Three Forks/Bakken avg = 0.975%; Cretaceous Cone Member,<br />
Marias River Formation avg = 2.40%<br />
c. Thermal maturity Bakken Shale Ro =
Production and Drilling<br />
Characteristics:<br />
Economic<br />
Characteristics:<br />
a. Important<br />
fields/reservoirs<br />
no basin-centered accumulation<br />
b. Cumulative production no basin-centered accumulation<br />
a. High inert gas content no basin-centered accumulation<br />
b. Recovery no basin-centered accumulation<br />
c. Pipeline infrastructure good near conventional fields<br />
d. Overmaturity none<br />
e. Basin maturity mature<br />
f. Sediment consolidation no basin-centered accumulation<br />
g. Porosity/completion<br />
problems<br />
h. Permeability<br />
i. Porosity<br />
no basin-centered accumulation
49°<br />
48<br />
1<br />
2<br />
3<br />
4<br />
5<br />
6<br />
7<br />
8<br />
9<br />
10<br />
11<br />
12<br />
13<br />
14<br />
15<br />
16<br />
17<br />
18<br />
19<br />
20<br />
21<br />
22<br />
23<br />
24<br />
48°<br />
48<br />
Kevin<br />
Sunburst-Shelby<br />
Devon<br />
"B" Square<br />
Rattlesnake Coulee<br />
Marias<br />
Cut Bank Gas<br />
Cut Bank Oil<br />
Dahlquist North<br />
Dahlquist South<br />
Lander<br />
McGuiness<br />
North Cut Bank<br />
Bradley<br />
Blackfoot<br />
Reagan<br />
South Darling<br />
Red Creek &<br />
Graben Coulee<br />
Darling<br />
Moulton Pools<br />
Border-Red Coulee<br />
Cobb<br />
Gypsy Basin<br />
Pondera<br />
Bannatyne<br />
Field Index<br />
25<br />
26<br />
27<br />
28<br />
29<br />
30<br />
31<br />
32<br />
33<br />
34<br />
35<br />
36<br />
37<br />
38<br />
39<br />
40<br />
41<br />
42<br />
43<br />
44<br />
45<br />
46<br />
47<br />
48<br />
49<br />
Glacier County<br />
Teton County<br />
Brady<br />
South Conrad<br />
Midway<br />
Whitlash<br />
Flat Coulee<br />
Laird Creek<br />
Blackjack<br />
Bears Den<br />
Keith<br />
East Keith<br />
Grandview<br />
Utopia<br />
Middle Butte<br />
Arch Apex<br />
Gold Butte<br />
Berthelote<br />
Miners Coulee<br />
Fred & George Creek<br />
Prichard<br />
West Butte<br />
Kicking Horse<br />
Bow & Arrow<br />
Hay Lake<br />
Two Medicine<br />
Blackleaf<br />
Approximate East Limit of Montana Disturbed Belt<br />
49<br />
15<br />
10<br />
14<br />
8<br />
13<br />
12<br />
23<br />
17<br />
17<br />
16<br />
11<br />
7<br />
47<br />
22 23<br />
23<br />
9<br />
18 19<br />
9<br />
21<br />
23<br />
20<br />
23<br />
5<br />
Alberta<br />
Montana<br />
Pondera County<br />
Toole County<br />
Sweetgrass Hills<br />
Figure 1. Location map of Alberta Basin-Sweetgrass Arch identifying oil and gas fields. From Montana Oil and Gas Conservation Commission (19__).<br />
112°<br />
112°<br />
1<br />
6<br />
26<br />
25<br />
2<br />
27<br />
West Butte<br />
46<br />
24<br />
45<br />
44<br />
41<br />
40<br />
4<br />
3<br />
43<br />
42<br />
39<br />
28<br />
38<br />
Middle<br />
Butte<br />
37<br />
28<br />
Liberty County<br />
28<br />
35<br />
35<br />
36<br />
29<br />
31<br />
32<br />
30<br />
East Butte<br />
EXPLANATION<br />
Oil field<br />
Gas field<br />
33<br />
Tertiary intrusive rocks<br />
0 5 10 15 mi<br />
34
Kootenai Fm<br />
Morrison Fm<br />
Swift Sandstone<br />
Rierdon<br />
Sawtooth/Piper<br />
Major Hiatus<br />
(Jurassic-Mississippian)<br />
Sun River Member<br />
Castle Reef Dolomite/<br />
Mission Canyon Limestone<br />
Allen Mountain Limestone<br />
Lodgepole Formation<br />
Bakken Formation<br />
Three Forks Formation<br />
Potlatch Evaporites<br />
Jefferson<br />
Nisku (Birdbear)<br />
Duperow<br />
Souris River<br />
Dawson Boy<br />
Major Hiatus<br />
(Upper Devonian-Ordovician)<br />
(Upper Cambrian)<br />
Deadwood Formation<br />
(Middle Cambrian)<br />
Flathead Sandstone<br />
Gravelly<br />
Sandstone<br />
W E<br />
Flood Sandstone<br />
Belt Rocks<br />
(Precambrian)<br />
Sandstone Undifferentiated<br />
Rocks<br />
Major Hiatus<br />
(Precambrian)<br />
Major Hiatus<br />
(Jurassic-Mississippian)<br />
Major Hiatus<br />
(Upper Devonian-Middle Silurian)<br />
Fall River or Dakota Sandstone<br />
400 ft<br />
0 0 25 miles<br />
Limestone Dolomite Shale Conglomerate Undifferentiated<br />
Evaporites<br />
Green Shale,<br />
Limestone,<br />
& Sandstone<br />
Cretaceous<br />
Jurassic-Mississippian<br />
Mississippian<br />
Lower Devonian-Upper<br />
& Middle Silurian<br />
Lower Silurian<br />
Upper Ordovician<br />
Upper Cambrian<br />
Cambrian-Precambrian<br />
Undifferentiated<br />
Metamorphic<br />
Rocks<br />
Figure 2. West-to-east cross section across Sweetgrass arch in northern Montana, showing major depositional units and intervening major<br />
depositional interruptions. After Dolson et al. (1993).
Cretaceous<br />
Jurassic<br />
System<br />
Triassic<br />
Permian<br />
Pennsylvanian<br />
Mississippian<br />
Devonian<br />
Cambrian<br />
Precambrian<br />
Upper<br />
Lower<br />
Upper<br />
Middle<br />
Lower<br />
Colorado<br />
Kootenai Formation<br />
Ellis Group<br />
Madison Group<br />
Marias<br />
River Shale<br />
Blackleaf<br />
Sweetgrass Area<br />
Northwest Montana<br />
Bear Paw<br />
Judith River<br />
Claggett<br />
Eagle<br />
Niobrara-<br />
Carlile<br />
Greenhorn<br />
Mowry Shale<br />
Bow Island Newcastle<br />
Skull Creek Shale<br />
Dakota Silt<br />
Dakota Sandstone<br />
(1st Cat Creek/Flood Member)<br />
Red Lion<br />
Pilgrim<br />
Belt<br />
Cutbank<br />
Morrison<br />
Swift<br />
Rierdon<br />
Sawtooth<br />
Sun River<br />
Fuson<br />
calcareous<br />
Bakken<br />
Three Forks Formation<br />
Potlatch Formation<br />
Cambrian Shale<br />
Undivided<br />
Mission Canyon<br />
Lodgepole<br />
Nisku<br />
Duperow<br />
Souris River<br />
Flathead<br />
Moulton<br />
Sunburst<br />
Upper<br />
Colorado<br />
Lower<br />
Colorado<br />
Mannville (Blairmore)<br />
Ellis Group<br />
Rundle<br />
Group<br />
Turner<br />
Valley<br />
Southern Plains<br />
Alberta<br />
1st white specks<br />
2nd white specks<br />
base of fish scales zone<br />
Bow Island Viking<br />
basal Colorado<br />
glauconitic sandstone<br />
ostracod zone calcareous<br />
basal Blairmore<br />
Swift<br />
Moulton<br />
Sunburst<br />
Taber<br />
Rierdon<br />
Sawtooth<br />
Piper<br />
Upper<br />
Middle<br />
Elkton<br />
Shunda<br />
Pekisko<br />
Banff<br />
Exshaw<br />
Palliser<br />
Alexo Formation<br />
Birdbear<br />
Fairholme Group<br />
Purcell Group<br />
medial<br />
Cutbank<br />
Locally<br />
Undiff.<br />
Upper<br />
Colorado<br />
Lower<br />
Colorado<br />
Mannville<br />
Upper<br />
Lower<br />
Vanguard<br />
Shaunavon<br />
Southwest<br />
Saskatchewan<br />
J-1<br />
1st white specks<br />
2nd white specks<br />
base of fish scales zone<br />
Viking<br />
Joli Fou<br />
Lower<br />
Upper<br />
J-2<br />
Lower<br />
Gravelbourg J-3<br />
Watrous J-4<br />
Mission Canyon<br />
Devonian<br />
Undivided<br />
Cambrian<br />
Undivided<br />
Basement Basement Basement<br />
Figure 3. Geologic column for Sweetgrass arch vicinity. After Dolson et al. (1993).<br />
Lodgepole<br />
Bakken
50° 00'<br />
49° 00'<br />
1<br />
R o = 1.5%<br />
7<br />
2<br />
8<br />
R o = 0.75%<br />
12<br />
13<br />
14<br />
9<br />
4<br />
3<br />
Early Oil Generation<br />
Alberta, Canada<br />
Montana, USA<br />
47° 00'<br />
113° 49' 58" 111° 12'<br />
5<br />
R o = 0.5%<br />
11<br />
15<br />
6<br />
10<br />
Well<br />
1<br />
2<br />
3<br />
4<br />
5<br />
6<br />
7<br />
8<br />
9<br />
10<br />
11<br />
12<br />
13<br />
14<br />
15<br />
TOC H % Ro 1.7 213 1.4<br />
7.9 530 0.4<br />
8.2 520 0.4<br />
9.5 516 0.4<br />
11.8 494 0.4<br />
9.9 523 0.4<br />
6.2 400 1.1<br />
7.7 300 0.6<br />
7.1 370 0.6<br />
3.0 234 0.45<br />
7.3 - 14.1<br />
2.5 - 7.2<br />
8.7<br />
2.8<br />
700 - 800 0.5<br />
12.9 335 0.60<br />
Explanation<br />
0<br />
0<br />
Precambrian<br />
thrusted Belt<br />
metasediments<br />
Thrust fault,<br />
dashed where<br />
approximately<br />
located<br />
Vitrinite<br />
reflectance<br />
isopach<br />
Figure 4. Map of Bakken Formation total organic carbon (TOC) and maturation levels (hydrogen, H, and % vitrinite<br />
reflectance, % Ro). Thermally mature source strata are located on the extreme western margin of the<br />
Sweetgrass arch and within the footwall to the thrust belt in Montana and Alberta. After Dolson et al (1993).<br />
30 km<br />
18 mi
GEOLOGIC SETTING<br />
The Mesozoic rift basins of eastern North America formed in response to the break-up and separation of Pangaea<br />
in late Paleozoic to early Mesozoic time. Rift basins formed simultaneously on both the North Atlantic and Euro-<br />
African plates (Pyron, 1998). These basins consist of elongate, asymmetric, half-graben structures which contain<br />
thick Triassic through lower Jurassic clastic, evaporite and volcanic rocks. The basin fill rests unconformably on<br />
crystalline basement formed during the Acadian and Alleghenian orogenies. Sedimentary rock types include reddishbrown<br />
mudstones, course-grained "border" conglomerates, arkosic sandstones, siltstones, gray-black lacustrine shales,<br />
evaporites, and coal. Tholeiitic basalt flows, sills and dikes are also common. On-shore basins, both exposed<br />
(Piedmont and Blue Ridge Provinces) and inferred (Coastal Plain), extend from Georgia to Massachusetts and cover<br />
about 42,700 square miles (Figure 1). Individual basins range from 24 square miles (Taylorsville basin) to over<br />
3,100 square miles (Newark basin) in area. Offshore basins extend from Nova Scotia to the Florida Panhandle<br />
(Figure 1). The rift basins generally trend northeast, approximately perpendicular to the initial rifting of North<br />
America and Africa (Klitgord and Behrendt, 1977).<br />
The tectonic history of the basins includes 5 stages:<br />
1) Permian through Triassic: crustal thinning along the eastern margin of the North American continent. This<br />
is the earliest stage of Pangaea breakup.<br />
2) Middle Triassic: rifting and crustal extension. Late Triassic clastic deposition into subsiding basins.<br />
3) Early Jurassic: extension and clastic deposition in basins along tholeiitic basalt flows and intrusions.<br />
4) Middle Jurassic: sea-floor spreading and development of the Mid-Atlantic ridge system.<br />
5) Late Jurassic to present: lithospheric cooling, plate subsidence, and marine transgression with development<br />
of a passive continental margin (Schultz, 1988).<br />
The depositional history of a typical onshore Mesozoic rift basin of eastern North America includes four phases:<br />
1) Formation of a rift graben along a listric boundary fault. Alluvial fans form along the upthrown walls and<br />
coalesce into laterally extensive deposits of fanglomerate, and finer-grained sediments near the basin center.<br />
Conglomerates interfinger with sandstones and siltstones. Internal basin drainage produces intermittent<br />
playas with evaporite deposits.<br />
2) Tectonic subsidence of the basin ends. Alluvial fans become reworked; coarse to fine sediments enter from<br />
outside the rift structure. Internal drainage results in the formation of a lake in the basin center. Vegetation<br />
flourishes along the lake margins and provides organic material for sedimentation. Feeder streams deposit<br />
coarse sands and fanglomerates interfingered with lacustrine sediments.<br />
3) Fluvial and lacustrine sands become reworked and re-deposited parallel to the long axis of the basin. Diabase<br />
dikes, sills and sheets intrude along zones of weakness. The magma causes regional heating of the basin and<br />
consequent thermal maturation of organic sediments.<br />
4) Recent uplifting, tilting, and regional erosion created the present day geology. In many offshore basins,<br />
evaporite deposition followed continental deposition. During Cretaceous and Tertiary time, marine<br />
sediments covered the continental rocks (Pyron, 1998).
HYDROCARBON PRODUCTION<br />
There is no hydrocarbon production from any Mesozoic rift basin in the eastern U.S. Seventy years of<br />
exploratory drilling in the rift system has yielded numerous shows of oil and gas but no commercial hydrocarbons.<br />
EVIDENCE FOR BASIN-CENTERED GAS<br />
Other Mesozoic rift basins are productive, including the Ghadames basin in Algeria (Northeast Africa), the Cuyo<br />
basin in Argentina (South America), the North Sea (Europe), and the Jeanne d'Arc basin (Canada). Rift basins offer<br />
attractive exploration targets because the cycle of rifting, sedimentary fill and igneous activity provides reservoirs,<br />
source rocks and thermal maturity.<br />
Significant potential exists for basin-centered gas accumulations within thick lacustrine mudstones, black<br />
shales, siltstones, and sandstones in the deep parts of the eastern U.S. rift basins. Geochemical data, including total<br />
organic carbon (TOC), thermal alteration index (TAI), vitrinite reflectance (Ro), and Tmax measurements, indicate<br />
the basins are thermally mature.<br />
The Newark basin in central New Jersey and southeastern Pennsylvania may contain significant gas reserves.<br />
Figure 2 includes maps depicting the geology and structure of this basin; Figure 3 shows basin stratigraphyin three<br />
locations. The Newark forms a part of a larger rift system that also incorporates the Gettysburg and Culpeper basins<br />
and extends from New Jersey southwest to Virginia. The exposed sedimentary section along this system is over<br />
25,000 ft thick and appears gas prone. The Newark has had only three exploratory wells drilled. One well reached a<br />
depth of 10,500 ft and encountered gas shows within a 3,000-ft section of fractured lacustrine shale.<br />
The Danville basin (Virginia-North Carolina) is also gas prone with a 9840 ft thick sedimentary section. The<br />
Hartford basin appears to be oil prone (Hubert et al., 1992; Schultz, 1988; Kotra et al., 1988).<br />
Exploration may identify productive basins where suitable reservoir rocks occur. Basins with thin sedimentary<br />
sections, such as the Richmond and Taylorsville, would be less attractive exploration targets.
Province, Play and<br />
Accumulation Name:<br />
Geologic<br />
Characterization of<br />
Accumulation:<br />
KEY ACCUMULATION PARAMETERS<br />
Eastern U.S. onshore Mesozoic basins; upper Triassic through lower Jurassic<br />
continental clastic and carbonate rocks.<br />
a. Source/reservoir late Triassic early Jurassic thick sequences of organic black and gray shales<br />
and black siltstones deposited along the centers of the basins<br />
b. Total Organic Carbons<br />
(TOCs)<br />
Newark: 0.5-6.0% (lacustrine black shales); Hartford: 0.4-3.5% (lacustrine<br />
black shales); Culpeper: 0.4-8.0% (lacustrine black shales); Danville: 0.1-<br />
2.4% (black shale/coal); Deep River: up to 35% (black shale/coal);<br />
Richmond: up to 40% (black shale/coal)<br />
c. Thermal maturity Kerogen Type: Hartford and Richmond basins: lacustrine algae (Type 1) and<br />
mixed lacustrine algae/terrestrial plant debris (Type 2); Newark, Culpeper<br />
and Dan River basins: mixed (Type 2). Thermal alteration index (TAI):<br />
Newark<br />
(3+) and Danville basins (4.0); Hartford, Deep River and Richmond basins<br />
(2.5-to 3.0); Vitrinite reflectance (Ro): Hartford basin 0.5-1.0; Danville basin<br />
2.15. Tmax (°C): Newark basin 426-443; Danville basin 400+;<br />
Hartford, Deep River, Richmond, Taylorsville basins 441-455.<br />
d. Oil or gas prone both oil and gas prone: Newark and Danville basins-gas prone. Hartford,<br />
Deep River, Richmond basins-oil prone.<br />
e. Overall basin maturity highly variable. Extensive igneous activity and high heat flow cooked many<br />
of the lacustrine shales and coals in the southern basins.<br />
f. Age and lithologies upper Triassic through lower Jurassic<br />
g. Rock extent/quality basin-wide source and reservoir-rock distribution.<br />
h. Potential reservoirs<br />
i. Major traps/seals interbedded shales, siltstones and sandstones of alluvial fans and lacustrine<br />
sediments<br />
j. Petroleum<br />
generation/migration<br />
models<br />
k. Depth ranges 10,000-20,000 ft<br />
l. Pressure gradients
Production and Drilling<br />
Characteristics:<br />
Economic<br />
Characteristics:<br />
a. Important<br />
fields/reservoirs<br />
b. Cumulative production<br />
a. High inert gas content<br />
b. Recovery<br />
c. Pipeline infrastructure very good<br />
potential unknown: Newark, Culpeper, Richmond, Taylorsville, Dan River,<br />
Farmville<br />
d. Overmaturity overmature in some areas within basins due to high heat flow (eg. Hartford<br />
Basin)<br />
e. Basin maturity immature in some areas (Hartford basin)<br />
f. Sediment consolidation consolidation/porosity reduction occurs with depth of burial<br />
g. Porosity/completion<br />
problems<br />
h. Permeability<br />
i. Porosity
N<br />
Newark basin<br />
Exposed basin<br />
Inferred basin<br />
Coastal Plain-Piedmont<br />
boundary<br />
0 500 mi<br />
Figure 1. Index map of exposed and inferred Mesozoic basins of eastern North America and the Coastal Plain-<br />
Piedmont boundary. After Manspeizer and Olsen (1981), and Froelich and Olsen (1985).
N<br />
Geologic Map<br />
Structure Map<br />
Thermal<br />
Maturation Map<br />
Basalt and diabase<br />
Triassic Stockton Formation<br />
Triassic Lockatong Formation<br />
Jurassic-Triassic Passaic<br />
Formation<br />
Jurassic undifferentiated<br />
rocks<br />
σ 2<br />
Extension<br />
460<br />
Extension<br />
435<br />
481<br />
(3.2)<br />
(4.8)<br />
428<br />
(0.7)<br />
440<br />
422<br />
434<br />
444<br />
(2.6)<br />
476<br />
(0.7)<br />
(1.7)<br />
Basin boundary<br />
Normal fault, with hachures<br />
on downthrown side<br />
Strike-slip fault, with some<br />
vertical displacement<br />
Strike and dip direction of<br />
bedding<br />
428<br />
421<br />
446<br />
435<br />
(0.4)<br />
435<br />
Anticline<br />
Syncline<br />
Isotherm<br />
460<br />
σ 2<br />
0 10 mi<br />
Shale sample location;<br />
temperature in F° and<br />
R o in percent (%)<br />
Figure 2. Maps of the Newark basin, showing geology, generalized structural features, direction of inferred extension and<br />
intermediate principal stress σ 2, and maximum pyrolitic yield and mean vitrinite reflectance Ro. After Manspeizer<br />
(1981), Ratcliffe and Burton (1985), Turner-Peterson and Smoot (1985), Pratt et al (1988), and Schultz (1988).
Series Stage<br />
Lower<br />
Jurassic<br />
Upper<br />
Triassic<br />
Toarcian<br />
Pliensbachian<br />
Sinemurian<br />
Hettangian<br />
Upper Norian<br />
Middle Norian<br />
Lower Norian<br />
Upper Carnian<br />
Middle Carnian<br />
Lower Carnian<br />
Narrow Neck<br />
of the Newark basin,<br />
Pennsylvania<br />
Hammer Creek Formation<br />
Stockton Formation<br />
Brunswick<br />
Group<br />
Newark basin,<br />
Pennsylvania<br />
upper part Brunswick Group<br />
Jacksonwald Basalt<br />
lower part<br />
Brunswick Group<br />
Perkasie Member<br />
Graters Member<br />
Lockatong Formation<br />
Newark basin,<br />
New Jersey-New York<br />
Brunswick<br />
Group<br />
Stockton Formation<br />
Figure 3. Stratigraphic columns for the Newark basin in Pennsylvania, NewJersey, and New York. After Froehlich and Robinson (1988).<br />
Boonton Formation<br />
Hook Mountain Basalt<br />
Towaco Formation<br />
Preakness Basalt<br />
Feltville Formation<br />
Orange Mountain Basalt<br />
Passaic Formation<br />
Perkasie Member<br />
Graters Member
GEOLOGIC SETTING<br />
The Wasatch Plateau is an 80 mi long by 25 mi wide uplift west of the San Rafael Swell in east-central Utah,<br />
within parts of Sanpete, Sevier, Emery and Carbon Counties, and lies sandwiched between Sanpete Valley to the<br />
west and Castle Valley to the east (Figure 1). Structural features west of the Plateau include the Gunnison Plateau<br />
and Wasatch Monocline (Figure 2). The Wasatch Plateau forms part of the Central Utah Transition zone, between<br />
the Colorado Plateau to the east and the Basin and Range province to the west.<br />
The Plateau’s history begins with Cretaceous synorogenic deposition of clastic sediments in a foreland basin<br />
east of the Cordillera. On the western periphery of the basin, local deposits of deltaic and paludal sediments alternated<br />
with deepwater mudstones deposited during several transgressive cycles (Figure 3). Eastward thrusting and uplift<br />
probably began during the late Jurassic-early Eocene Sevier Orogeny (Neuhauser, 1988). Diapiric movements and<br />
extensional faulting occurred during the Cenozoic era. Figure 2 shows fault structure for the area.<br />
Exposures of Quaternary alluvium, Tertiary sandstones and limestones, and Upper Cretaceous Mesaverde Group<br />
sandstones, shales and coalbeds occur atop the Plateau. Figures 3 and 4 show the area’s stratigraphy.<br />
HYDROCARBON PRODUCTION<br />
Oil and gas production in the Wasatch Plateau occurs mostly from Cretaceous Ferron sandstones east of the<br />
Joe’s Valley Graben and west of the Ferron outcrop. The Cretaceous Dakota Group and Permian Kaibab Formation<br />
have had some minor production as well. The fields along the Plateau have produced over 158 BCFG and 132 MBO<br />
since 1951.<br />
On the eastern margin of the plateau, recent coalbed methane production from Ferron coals in Drunkards Wash<br />
Field (discovered in 1992) has sparked renewed interest in the area. To date, cumulative production including coalbed<br />
methane exceeds 224 BCFG.<br />
Production on the Wasatch Plateau has generally been from structural traps, probably enhanced by tectonic<br />
fracturing (Tripp, 1990).<br />
EVIDENCE FOR BASIN-CENTERED GAS<br />
Not enough evidence exists to determine if an overpressure cell encompassing the Cretaceous rocks occurs at<br />
deeper drilling depths within the plateau. Production does occur from gas fields along the eastern plateau margin, but<br />
pressure gradients only range from 0.21 to 0.27 psi/ft. Also, the Ferron field shows downdip water flows, which<br />
indicates underpressuring and a probable gas-water contact at depth. Additionally, drillstem tests in much of the<br />
plateau area recovered water, indicating normal to underpressuring in the lower Cretaceous sediments. Most wells<br />
showing water are in close proximity to known mapped faults (Tripp, 1989). The high degree of tectonism and<br />
associated fracturing of the rocks may allow water to flow upward from the Paleozoic section or downward from<br />
Tertiary and Cretaceous rocks along the fault zones. If a “gas kitchen” once existed in this area, faulting may have<br />
breached it.<br />
Exploration the central part of the Plateau has been rare and many townships remain untested. However, in 1996<br />
Cimarron <strong>Energy</strong> Corporation re-entered a 20,505 ft deep test well; Cimarron completed two sidetracks within<br />
Tununk Shale at depths of 11,772 and 11,840 ft. Production through June of 1998 was 313 BO and 425 MCF. This<br />
significant show indicates a fractured shale play probably occurs on the Plateau.
Province, Play and<br />
Accumulation Name:<br />
Geologic<br />
Characterization of<br />
Accumulation:<br />
KEY ACCUMULATION PARAMETERS<br />
Great Basin/Colorado Plateau, basin-centered gas play in deeper Cretaceous<br />
Rocks<br />
a. Source/reservoir Tununk and Bluegate Shale members of Mancos Shale/Dakota Group,<br />
Ferron and Emery Sandstone Members of Mancos Shale, Morrison<br />
Sandstones<br />
b.Total Organic Carbons<br />
(TOCs)<br />
c.Thermal maturity Ro values for Ferron coals at Drunkards Wash Field (T14-15S, R9-10E)<br />
reportedly average 0.69% (Lamarre and Burns, 1997). Blackhawk coals<br />
sampled from mines in the Wasatch Plateau (Bodily et al., 1991)) are HVBc<br />
in rank; this would correlatewith an Ro of 0.60 – 0.78%. Vitrinite reflectance<br />
data for coals within the sandstone member in the Emery Coal Field (T14S-<br />
22S, R6-9E) range from 0.52 to 0.63%. Other coals within the<br />
field have measured values up to 0.74% (Hucka et al., 1997); these values<br />
are probably too low for a basin-centered gas accumulation.<br />
d.Oil or gas prone primarily gas prone, type III and type II kerogens<br />
e.Overall basin maturity fair to moderate<br />
f.Age and lithologies Cretaceous shales, coals, delta plain and alluvial sandstones. Dakota<br />
sandstone is conglomeratic.<br />
g. Rock extent/quality The Ferron and Emory extend over plateau. Sparse drilling of Dakota and<br />
Morrison tests render the regional extent unknown. Tununk and Bluegate<br />
Shales are regionally extensive. Individual Ferron coals are laterally<br />
discontinuous.<br />
h.Potential reservoirs Best reservoir rock occurs within channel facies.<br />
i.Major traps/seals Mostly structural with some stratigraphic. The Cretaceous Tununk Shale<br />
separating the Ferron and Dakota Sandstones and the Bluegate Shale above<br />
and below the Emery and Ferron are seal rocks. Interbedded shales within<br />
the<br />
sandstones may form seals.<br />
j.Petroleum<br />
generation/migration<br />
models<br />
k.Depth ranges 8,500 to 12,000 ft<br />
In-situ generation and long distance migration. Geothermal gradient ranges<br />
from 23 to 29° C per km.
Production and Drilling<br />
Characteristics:<br />
Economic<br />
Characteristics:<br />
l.Pressure gradients Subnormal pressure gradients range from .21 to .27 psi/ft. Some drillstem<br />
tests recovered water, indicating normal to underpressure in western portions<br />
of the plateau. Insufficient data exists to determine if an overpressure cell<br />
a. Important<br />
fields/reservoirs<br />
b.Cumulative production<br />
the Cretaceous rocks exists at deeper drilling depths within the plateau.<br />
a. High inert gas content not a problem. The Ferron gas is 90-98% methane with a Btu range from 990-<br />
1129. Flat Canyon Field Dakota gas is 1107 Btu with a methane content of<br />
91% (Tripp, 1991). Ferron coalbed methane had a Btu of<br />
987-1000 with methane concentrations from 95.8-98.3% and carbon dioxide<br />
contents of 0.7-0.30% (Lamarre and Burns, 1997). Tests of Paleozoic rocks<br />
on the Gordon Anticline, located east of the Plateau, have encountered CO2<br />
from the Moenkopi Formation and the Coconino sandstone (Tripp, 1990).<br />
b.Recovery low<br />
c.Pipeline infrastructure limited<br />
d.Overmaturity none<br />
e.Basin maturity the extreme western edge of the plateau may be immature<br />
f.Sediment consolidation well indurated<br />
g. Porosity/completion<br />
problems<br />
Formation damage due to swelling clays may reduce or prevent production if<br />
appropriate drilling and completion fluids are not utilized.<br />
h.Permeability Ferron permeability ranges from .05 to .14 md. Permeability for the Dakota,<br />
Morrison and Emery are unknown.<br />
i.Porosity Ferron porosity ranges from 8 to 17%; Dakota porosity at Flat Canyon Field<br />
averages 4% (Tripp, 1989; 1991; 1993).
112° 00'<br />
40° 00'<br />
39° 30'<br />
39° 00'<br />
28<br />
15<br />
Wasatch<br />
Range<br />
Nephi<br />
Gunnison Plateau<br />
89<br />
Gunnison<br />
Salina<br />
111° 30' 111° 00' 110° 30' 110° 00'<br />
Sanpete Valley<br />
89<br />
Ephraim<br />
Utah<br />
6<br />
Wasatch<br />
Plateau<br />
Emery<br />
Price Canyon<br />
Castle Valley<br />
Price<br />
Huntington<br />
San Rafael<br />
Swell<br />
Figure 1. Location map of Wasatch Plateau, Utah. After Franczyk and Pitman (1991).<br />
70<br />
Roan Cliffs<br />
Book Cliffs<br />
6<br />
Green<br />
River<br />
Green River<br />
0 20 mi
T. 12 S.<br />
T. 13 S.<br />
T. 14 S.<br />
T. 15 S.<br />
T. 16 S.<br />
T. 17 S.<br />
T. 18 S.<br />
T. 19 S.<br />
T. 20 S.<br />
T. 21 S.<br />
T. 22 S.<br />
T. 23 S.<br />
T. 24 S.<br />
T. 25 S.<br />
R. 1 E. R. 2 E. R. 3 E. R. 4 E. R. 5 E. R. 6 E. R. 7 E. R. 8 E. R. 9 E. R. 10 E. R. 11 E.<br />
Juab County<br />
Gunnison Plateau<br />
Wasatch monocline<br />
Sevier County<br />
Fault<br />
Sanpete County<br />
Musina Graben<br />
of top of Ferron Sandstone<br />
3000 Contour showing elevation<br />
Wasatch Plateau<br />
5500<br />
3000<br />
4000<br />
4500<br />
5000<br />
Paradise fault zone<br />
Fish Creek Graben<br />
Joe's Valley Graben<br />
3500<br />
5000<br />
4000<br />
3500<br />
3500<br />
3000<br />
4500<br />
4000<br />
4500<br />
4000<br />
Straight Canyon syncline<br />
Anticline, showing<br />
plunge direction<br />
Syncline, showing<br />
plunge direction<br />
3500<br />
Carbon County<br />
4000<br />
4500<br />
3000<br />
Book Cliffs<br />
5000<br />
Emery County<br />
Ferron Sandstone outcrop edge<br />
San Rafael Swell<br />
0 10 mi<br />
Contours in feet;<br />
500 foot interval<br />
Figure 2. Structure map of the Wasatch Plateau area, showing the elevation of the top of the Ferron Sandstone.<br />
After Tripp (1989).
System Unit<br />
Upper<br />
Cretaceous<br />
Mancos<br />
Shale<br />
Ferron<br />
Sandstone<br />
Member<br />
Blue Gate<br />
Member<br />
Tununk<br />
Member<br />
Upper<br />
Lower<br />
Natural<br />
Gamma<br />
Resistivity Depth Lithology<br />
1900<br />
2000<br />
2100<br />
2200<br />
2300<br />
2400<br />
2500<br />
2600<br />
2700<br />
2800<br />
Depositional<br />
Environment<br />
Offshore Marine<br />
Undivided<br />
alluvial plain<br />
and<br />
delta plain<br />
Delta front<br />
Alluvial/delta<br />
Delta front<br />
Offshore Marine<br />
Delta front<br />
Offshore Marine<br />
Figure 3. Reference log for the Ferron Sandstone Member from the Willard Pease State of Utah No. 1-Q well. After<br />
Ryer and McPhillips (1983).
Cenozoic<br />
Mesozoic<br />
Tertiary<br />
Cretaceous<br />
Eocene<br />
Paleocene<br />
Age<br />
Middle<br />
(part)<br />
Early<br />
Late<br />
Early<br />
Maestrichtian<br />
Campanian<br />
Santonian<br />
Coniacian<br />
Turonian<br />
Cenomanian<br />
Albian (part)<br />
W Wasatch Plateau Area<br />
E<br />
Gunnison<br />
Plateau<br />
Green River<br />
Formation<br />
?<br />
Colton Fm<br />
Upper part of<br />
North Horn Fm<br />
Tongue of<br />
Flagstaff Ls<br />
Lower<br />
part of<br />
North<br />
Horn<br />
Fm<br />
conglomerate<br />
(Indianola Grp?)<br />
Indianola<br />
Group<br />
?<br />
Sanpete<br />
Valley<br />
Indianola<br />
Group<br />
Funk<br />
Valley<br />
Fm<br />
East<br />
Wasatch<br />
Canyon<br />
Flagstaff<br />
Limestone<br />
North Horn<br />
Formation<br />
Castlegate Sandstone<br />
Six Mile<br />
Canyon<br />
Fm<br />
Sanpete<br />
Fm<br />
Allen<br />
Valley<br />
Sh<br />
Star Point Ss<br />
Price<br />
Canyon Sunnyside<br />
Green Sego<br />
River Canyon Westwater UT-CO Age<br />
Canyon State Line (106 yr)<br />
Green River Fm<br />
Colton<br />
Formation<br />
Flagstaff Mbr of Green River Fm<br />
Price River Formation<br />
Emery Sandstone Member<br />
Dakota Sandstone<br />
Blackhawk Formation<br />
Tununk Member<br />
Bluecastle Tongue<br />
Cedar Mountain Formation<br />
Blue Gate Member<br />
Ferron Ss Mbr<br />
Wasatch<br />
Formation<br />
Dark Canyon<br />
sequence of Wasatch Fm<br />
Tuscher and Farrer Formations<br />
Neslen Fm<br />
Sego Ss<br />
Buck Tongue of Mancos Shale<br />
Castlegate Sandstone<br />
Blue Gate Member<br />
Green River Fm<br />
Figure 4. Stratigraphic column and cross section for Wasatch Plateau and vicinity, northeastern Utah. After Franczyk and Pitman (1991).<br />
Mancos Shale<br />
50<br />
60<br />
70<br />
80<br />
90
GEOLOGIC SETTING<br />
The Willamette-Puget Sound trough extends south from Vancouver Island in British Columbia 490 mi<br />
to the Klamath Mountains in southwestern Oregon (Figure 1) (Johnson et al., 1997; Tennyson, 1995). In<br />
northern Washington, the Olympic Mountains interrupt this general trend . The Cascade Range forms the<br />
eastern boundary. The trough extends 50 to 140 mi offshore to an approximate depth of 3,300 ft on the<br />
continental shelf (Armentrout and Suek, 1985). The southern part of the trough includes the Tyee, South<br />
Willamette, North Willamette, Nehelem, and Seattle basins. The northern trough includes four subbasins:<br />
Coos Bay, Newport, Astoria, and Willapa basins (Armentrout and Suek, 1985; Johnson et al., 1997; and<br />
Tennyson, 1995).<br />
Around the northern, northeastern and southern margins, accreted terranes of Mesozoic sedimentary,<br />
volcanic and metamorphic rocks crop out and may underlie the eastern part of the trough (Johnson et al.,<br />
1997; Tennyson, 1995). Up to 20,000 feet of Cenozoic forearc sediments overlie pre-Tertiary igneous and<br />
metamorphic basement. Figure 2 shows the stratigraphy for various play areas in western Washington.<br />
Depositional environments included fluvial, fan-delta, delta, shallow-marine, continental-slope and<br />
submarine fan (Johnson et al., 1997; Tennyson, 1995).<br />
Oligocene to Pliocene uplift occurred simultaneously with subsidence of local depositional areas. Late<br />
Miocene basalt flows flooded the Columbia River and northern Willamette Valleys, and associated intrusive<br />
activity occurred concurrently. The Columbia River deposited deltaic and shallow-marine sediments in<br />
southwestern Washington and northwestern Oregon (Astoria and Montesano Formations) during Pliocene<br />
time (Figure 2). Subduction along the continental margin during the Eocene caused extensive folding,<br />
faulting, uplift and subsidence (Johnson et al., 1997; Tennyson, 1995).<br />
Conventional sandstone reservoir candidates include the shallow marine Spencer and Cowlitz<br />
Formations, the deltaic Coaledo Formation, the deltaic to submarine fan Tye Formation, the fluvial<br />
Chuckanut Formation, and the deltaic Puget Group.<br />
HYDROCARBON PRODUCTION<br />
Many oil and gas seeps occur along the Washington coast, and hydrocarbon exploration began in 1881.<br />
More than 500 wells have been drilled in the Pacific Northwest, but most are less than 5,000 feet deep. The<br />
only commercially productive hydrocarbon reservoir in the Willamette-Puget Sound trough is Mist gas<br />
field, a faulted, structural trap located northwest of Portland, Oregon. Since its discovery in 1979, Mist field<br />
has produced over 70 BCFG from sandstones in the Eocene Cowlitz Formation.<br />
Before discovery of the Mist gas field, the only hydrocarbon production in the region came from the<br />
Bellingham-Watcom County coal fields, the Rattlesnake Hills field near Yakima in the Columbia Plateau,<br />
and the Grays Harbor Ocean City field, which to date has produced about 12,000 BO plus some associated<br />
gas.
EVIDENCE FOR BASIN-CENTERED GAS<br />
In the northern Willamette basin, the lower Cowlitz Formation strata entered the oil-generating window<br />
about 33 Ma (Armentrout and Suek, 1985). Upper Cowlitz rocks entered the generation window at 3 Ma.<br />
Present-day geothermal gradients average 15 °F per 1,000 ft; thus, present-day reservoir temperatures should<br />
support gas generation at depths exceeding 7,000 ft. This depth is slightly shallower than the 8,000 ft depth<br />
of the overpressured envelope. Favorable parameters exist elsewhere in the trough that suggest in-situ gas<br />
generation is taking place.<br />
Eocene coals and carbonaceous shales are potential gas-prone source rocks. Total organic carbon (TOC)<br />
content in the Willamette basin varies from 0.65% to 7.22% for marine shales and siltstones of the Cowlitz<br />
Formation; interbedded coals have up to 55% TOC. Vitrinite reflectance values range from 0.24 to 4.01<br />
across the basin (Figure 3). High values result from contact metamorphism near igneous intrusions along<br />
the Cascades. Projected temperatures within the hydrocarbon generation window range from 90 to 140 °C<br />
(Armentrout and Suek, 1985).<br />
The shales encasing the Mist field reservoir are thermally immature, with Ro values less than 0.4%<br />
(Armentrout and Suek, 1985). The gas within the reservoir probably generated deep in the basin and<br />
migrated updip into the shallow structural trap.
Province, Play and<br />
Accumulation Name:<br />
Geologic<br />
Characterization of<br />
Accumulation:<br />
KEY ACCUMULATION PARAMETERS<br />
Western Washington Province, Willamette-Puget Sound Trough, basincentered<br />
gas play<br />
a. Source/reservoir interval includes Eocene Cowlitz, Puget Group, Raging River, Crescent<br />
formations and equivalents<br />
b.Total Organic Carbons<br />
(TOCs)<br />
c.Thermal maturity Ro 0.24 - 4.01<br />
range from 0.5 to 7.22% in the middle to upper Eocene marine mudstones in<br />
the conventional Cowlitz-Spencer gas play area of the Southern Puget<br />
lowlands. Coals show up to 55% TOCs in the play area.<br />
d.Oil or gas prone gas prone; almost exclusively type III kerogens<br />
e.Overall basin maturity maturation levels are moderate and increase east of the trough toward the<br />
crest of the Cascades<br />
f.Age and lithologies Eocene arkosic sands, coals, siltstones and shales<br />
g. Rock extent/quality probable basin-wide source and reservoir-rock distribution. Rock quality is<br />
unknown except from a few wells and from outcrops around basin margins.<br />
Expected reservoir quality varies depending on clay content, zeolite<br />
alteration<br />
and interbedded shales and coals.<br />
h.Potential reservoirs none presently; very few conventional reservoirs exist; structurally trapped<br />
Mist field in northern Oregon has produced more than 70 BCFG.<br />
i.Major traps/seals interbedded Eocene age shales, siltstones and coals; diagenetic barriers<br />
might also be expected within micaceous and arkosic sands.<br />
j.Petroleum<br />
generation/migration<br />
models<br />
primarily in-situ generation, but fracture zones offer the possibility of long<br />
distance migration of gases from shales and coals. Hydrocarbon generation<br />
is probablyongoing at depths below 7,000 ft. Low current day geothermal<br />
gradients occur with an estimated 12.5° F exist per 1000 ft (Armentrout and<br />
Suek, 1985).<br />
k.Depth ranges 8,000to 13,000 ft plus<br />
l.Pressure gradients overpressured intervals are referenced in Walsh and Lingley (1991) and<br />
Johnson et al. (1997)
Production and Drilling<br />
Characteristics:<br />
Economic<br />
Characteristics:<br />
a. Important<br />
fields/reservoirs<br />
unknown<br />
b.Cumulative production the only existing production comes from a conventional structural trap at the<br />
Mist field (discovered in 1979) that has produced 70 BCFG from Eocene<br />
Cowlitz Fm<br />
a. High inert gas content gases from the Mist field contain from 2.7 to 5.3% nitrogen (Armentrout and<br />
Suek, 1985), with traces of CO2. Hydrocarbon composition exceeded 99.9%<br />
methane. Higher Btu and lower inerts content are expected for gases<br />
thermally generated within the continuous accumulation.<br />
b.Recovery Recoveries may vary depending upon permeability, porosity and depth;<br />
diagenetic alteration may increase with depth.<br />
c.Pipeline infrastructure poor<br />
d.Overmaturity Overmature in the deepest parts of the basin and on the eastern flanks of the<br />
Cascade Range<br />
e.Basin maturity A large part of the basin is mature (Ro ranges from 0.24 to 4.01) with a rapid<br />
rise in maturity on the flanks of the Cascade Range.<br />
f.Sediment consolidation probably moderate to good<br />
g. Porosity/completion<br />
problems<br />
Shales, clay and mica rich arcosic sands have high alteration potential and<br />
possible swelling clays. Migrating fines may be a problem and average<br />
porosities are expected to be highly variable. Shales, siltstones and coals are<br />
interbedded with sands.<br />
h.Permeability Permeability declines with depth (Walsh and Lingley, 1991)<br />
i.Porosity Cowlitz reservoir strata in the Mist field area show porosities from 16 to<br />
41%. Porosity declines with depth (Walsh and Lingley, 1991)
Willapa<br />
Basin<br />
Astoria<br />
Basin<br />
Newport<br />
Basin<br />
Coos Bay<br />
Basin<br />
Vancouver Island<br />
10<br />
10<br />
10<br />
15<br />
15<br />
15<br />
15<br />
10<br />
10<br />
Eugene<br />
10<br />
Klamath<br />
Mountains<br />
124°<br />
10<br />
15<br />
10<br />
Late Cenozoic volcanic rocks<br />
and basalt flows<br />
Eocene volcanic rocks<br />
10<br />
15<br />
15<br />
Seattle<br />
Portland<br />
Paleozoic and Mesozoic<br />
metamorphic and ultramafic rocks<br />
Cascade Range<br />
British Columbia<br />
Washington<br />
Puget<br />
Basin<br />
Willamette<br />
Basin<br />
Oregon<br />
0 50 mi<br />
Figure 1. Location map of Cenozoic basins of western Washington and Oregon. Isopach contours are in thousands of<br />
feet. After Braislin et al (1971), Snavely et al (1977), and Armentrout and Suek (1985).<br />
49°<br />
42°
Years Ma (millions ago)<br />
0<br />
10<br />
20<br />
30<br />
40<br />
50<br />
60<br />
Epoch<br />
Pleistocene<br />
Pliocene<br />
Miocene<br />
Oligocene<br />
Eocene<br />
Paleocene<br />
Bellingham<br />
Basin<br />
local non-marine<br />
and marine<br />
deposits<br />
Boundary Bay<br />
Formation<br />
(of Mustard<br />
and Rouse 1994)<br />
?<br />
Huntingdon<br />
Formation<br />
Chuckanut<br />
Formation<br />
?<br />
Central Puget Lowland-<br />
Western Cascade Range<br />
local non-marine deposits<br />
Blakely<br />
Harbor<br />
Formation<br />
?<br />
Blakeley<br />
Formation<br />
Renton<br />
Formation<br />
Tukwila<br />
Fm<br />
Tiger Mtn.<br />
Formation<br />
ss<br />
of<br />
Scow<br />
Bay<br />
?<br />
Ohanapecosh<br />
Formation<br />
Puget<br />
Group<br />
Spiketon<br />
Fm<br />
Northcraft<br />
Fm<br />
Carbonado<br />
Fm<br />
Raging River<br />
Formation<br />
?<br />
Southern<br />
Puget Lowland<br />
local<br />
non-marine<br />
deposits<br />
Astoria<br />
Formation<br />
Lincoln Creek<br />
Formation<br />
Skookumchuck<br />
Fm Cowlitz<br />
Fm<br />
McIntosh<br />
Formation<br />
Crescent<br />
Formation<br />
Southwest Washington<br />
Coast Range<br />
upper structural plate<br />
McIntosh<br />
Fm<br />
local marine<br />
to deltaic<br />
deposits<br />
Montesano<br />
Formation<br />
Astoria<br />
Formation<br />
Lincoln Creek<br />
Formation<br />
Crescent<br />
Formation<br />
Humptulips<br />
Fm<br />
Coastal Washington<br />
lower structural<br />
plate<br />
local marine<br />
deposits<br />
Montesano<br />
Formation<br />
Tofino-Fuca<br />
basin<br />
? ? ? ?<br />
?<br />
Hoh<br />
rock assemblage<br />
?<br />
Ozette<br />
terrane<br />
Clallam<br />
Formation<br />
Twin River<br />
Group<br />
Lyre<br />
Formation<br />
Aldwell<br />
Formation<br />
Crescent<br />
Formation<br />
Figure 2. Stratigraphic column for western Washington petroleum-play areas. Shaded intervals indicate occurances of erosion or no deposition. After<br />
Snavely et al (1958, 1993), Rau (1973, 1986), Frizzell et al (1983), Frizzell and Easterbrook (1983), Rau et al (1983), Rau and Armentrout (1983),<br />
Snavely and Lander (1983), Johnson (1984a), Palmer and Lingley (1989), Moothart (1992), Johnson et al (1994), Mustard and Rouse (1994), and<br />
Johnson et al (1997).
6000<br />
0<br />
0<br />
3000<br />
3000<br />
6000<br />
123° 120°<br />
9000<br />
0<br />
0<br />
9000<br />
6000<br />
0<br />
3000<br />
6000<br />
0 50 mi<br />
Figure 3. Isopach map of depth (in feet) to vitrinite reflectance Ro = 0.5%. The hatchured contours indicate Ro > 1.4%<br />
(the "oil deadline," or end of oil generation, for this map). After Brown and Ruth (1984), Walsh (1984),<br />
Evans (1988), Snavely and Kvenvolden (1989), and Walsh and Lingley (1991).<br />
49°<br />
47°
GEOLOGIC SETTING<br />
The western Colville Basin covers about 64,000 square miles of the western half of Alaska’s North Slope. The Herald Arch<br />
and the Chukchi Platform form the basin’s western boundary and, west of Icy Cape and Point Barrow, “bend” the offshore part of<br />
the Colville trough axis northward into the Hanna Trough (Figure 1). The Barrow Arch borders the Colville’s northern flank<br />
eastward from the Chukchi Sea, and parallels the present Arctic Ocean coastline almost to the Canadian border. The Brooks Range<br />
thrust belt defines the basin’s eastern and southern limits, and partly overrides the Colville’s south flank along the Southern<br />
Foothills (Figure 2).<br />
The North Slope is primarily a composite basin whose northern edge includes late Paleozoic and Mesozoic south-facing<br />
continental-margin deposits overlain by Cretaceous and Tertiary north-facing foreland-basin sediments (Figure 3) (Bird, 1991); the<br />
margin rocks also form the southern flank of the present-day Canadian Basin. The Colville Basin itself appears generally<br />
asymmetrical, with the strata thickest along the Southern Foothills belt and generally thinning northward over the Barrow Arch<br />
(Figure 4).<br />
Uplift of the Brooks Range fold and thrust belt began during the Late Jurassic and shed sediments northward into the foredeep<br />
Colville Basin. Termed the Brookian Sequence, these deposits are mostly clastic and unconformably overlie older Ellesmerian rocks<br />
along the Barrow Arch (Figure 5). The Ellesmerian Sequence includes sandstones, shales, and up to 25% carbonates. Both<br />
sequences contain substantial amounts of good to excellent quality source rocks in close physical and stratigraphic proximity to<br />
porous reservoir units (Figure 4). Colville Basin stratigraphy includes all of the Brookian Sequence and most of the Ellesmerian<br />
Sequence rocks. At the basin axis, the total combined thickness of the Ellesmerian and Brookian strata may exceed 32,000 ft (Bird,<br />
1991).<br />
HYDROCARBON PRODUCTION<br />
Outside the Prudhoe Bay complex near the northeast end of the Colville Basin, there is little production on the North Slope.<br />
The Prudhoe Bay Field contains recoverable petroleum reserves exceeding 13 BBO; oil production generally comes from the Ivishak<br />
Sand member of the Upper Ellesmerian Sadlerochit Group, and from the Lisburne Group of carbonates in the Lower Ellesmerian.<br />
1<br />
The South Barrow gas field presently supplies domestic gas only to the town of Barrow.<br />
EVIDENCE FOR BASIN-CENTERED GAS<br />
To date, exploration outfits have drilled 41 wells deeper than 4,000 ft in and around the Colville Basin. Many wells had gas or<br />
oil shows, and consequently identified 13 fields potentially capable of generating gas. Several wells produced gas at rates above 2<br />
MMCFD.<br />
Equivalent rocks in Colville strata have already sourced fields along the Barrow Arch, including Prudhoe Bay. Bird (1991) and<br />
Sedivy et al. (1987) reported total organic carbon (TOC) content for Colville source rocks generally ranged from 1.5 to 3.0 wt%,<br />
with some oil shales in the Endicott Group reaching 16%. Some of those same source rocks have created overpressure conditions in<br />
the Prudhoe Bay field and could have charged a basin-centered accumulation in the Colville Basin (Gognat, 1999, personal<br />
communication).
Province, Play and<br />
Accumulation Name:<br />
Geologic<br />
Characterization of<br />
Accumulation:<br />
KEY ACCUMULATION PARAMETERS<br />
Northern Alaska, Western Colville Basin, possible basin-centered<br />
accumulation<br />
a. Source/reservoir Sources: Upper Triassic and Neocomian rocks. Reservoirs: Ivishak Sand,<br />
Kuparuk River/Kemik Sands, Sag River Sand, sands within the Kingak<br />
Shale, plus sands within the Nanushuk Group, Colville Group, and<br />
Sagavanirktok Formation (Figures 4 and 6).<br />
b. Total Organic Carbons<br />
(TOCs)<br />
range from 1.5 to 3.0%; some highly organic "paper shales"/oil shale range<br />
up to 16%<br />
c. Thermal maturity Maturity over much of the area falls within the peak-oil to peak-gas<br />
generation stage, with Ro ±2.0 (Figure 4, Figure 6, and Figure 7). The<br />
deepest parts of the basin may be cracking previously generated oil into gas.<br />
d. Oil or gas prone both oil and gas prone<br />
e. Overall basin maturity immature<br />
f. Age and lithologies Triassic and younger sands; Mississippian Endicott Group clastics<br />
g. Rock extent/quality potential 30,000 sq mi source and reservoir-rock distribution. Sandstones in<br />
the Triassic and younger strata often exceed 20% porosity.<br />
h. Potential reservoirs Ivishak Sand, Kuparuk River/Kemik Sands, Sag River Sand, sands within the<br />
Kingak Shale, plus sands within the Nanushuk Group, Colville Group, and<br />
Sagavanirktok Formation (Figures 4 and 6).<br />
i. Major traps/seals all traditional hydrocarbon traps<br />
j. Petroleum<br />
generation/migration<br />
models<br />
The Tissot and Welte (1984) “Cooking Pot” model, where generated<br />
hydrocarbons are expelled into the surrounding reservoir rocks.<br />
k. Depth ranges 4,000 through 21,000 ft. Some gas production from depths shallower than<br />
4.000 ft, but occurring from smaller structural and stratigraphic traps<br />
unrepresentative of basin-centered accumulations (Figure 8).<br />
l. Pressure gradients Unknown, but many Prudhoe Bay wells intercept overpressured strata and<br />
some Brooks Range foothills belt wells may have shown occrurence of<br />
overpressuring.
Production and Drilling<br />
Characteristics:<br />
Economic<br />
Characteristics:<br />
a. Important<br />
fields/reservoirs<br />
South Barrow, Fish Creek, Umiat, Meade, Simpson, Wolf Creek, Gubik,<br />
Square Lake, East Umiat, East Barrow, East Kurupa, Eagle Creek, Walakpa,<br />
and Sikulik (Figure 9).<br />
b. Cumulative production see Figure 10. Outside the Prudhoe Bay producing complex, there is little<br />
production on the North Slope. South Barrow Gas field presently supplies<br />
only domestic gas to the town of Barrow.<br />
a. High inert gas content possible, but unknown<br />
b. Recovery unknown<br />
c. Pipeline infrastructure poor to non-existent<br />
d. Overmaturity the base of the dry gas zone in the central Colville Basin area probably<br />
occurs below a depth of 19,500 ft (after Johnsson et al., 1993)<br />
e. Basin maturity mature<br />
f. Sediment consolidation moderate to good<br />
g. Porosity/completion<br />
problems<br />
unknown<br />
h. Permeability probably high, but variable<br />
i. Porosity highly variable, but porosity in reservoirs exceeds 20%
Russia<br />
USA<br />
Herald<br />
Arch<br />
Chukchi Platform<br />
Hanna<br />
Chukchi Sea<br />
Axis<br />
Trough<br />
Brooks<br />
Oil field<br />
Well<br />
Well projected onto<br />
cross-section A-A'<br />
Figure 1. Map of the North Slope, Alaska.<br />
Southern<br />
Barrow<br />
Northern Foothills<br />
of Colville Basin<br />
Coastal Plain<br />
A<br />
NPRA<br />
A'<br />
Foothills<br />
Range<br />
(Passive Margin)<br />
Arch<br />
Beaufort Sea<br />
Kuparuk River Field<br />
Prudhoe Bay Field<br />
0 100 mi<br />
0 160 km<br />
Scale<br />
Arctic <strong>National</strong><br />
Wildlife Refuge<br />
(ANWR)
Russia<br />
USA<br />
Herald<br />
Arch<br />
Chukchi Platform<br />
-4<br />
-6<br />
-2<br />
North<br />
Chukchi Basin<br />
-8<br />
Thrust fault<br />
Brooks<br />
Normal fault, hachures<br />
on downthrown side<br />
Contour, in km<br />
below sea level<br />
Figure 2. Structure map of the North Slope, Alaska.<br />
-6<br />
-10<br />
Hanna<br />
Axis<br />
-8<br />
Trough<br />
-10<br />
of<br />
-10<br />
-8<br />
-6<br />
-2<br />
Southern<br />
Barrow<br />
B<br />
-4<br />
Colville Basin<br />
-10<br />
-2<br />
-4<br />
-6<br />
-8<br />
Coastal Plain<br />
Northern Foothills<br />
-10<br />
-10<br />
-6<br />
-6<br />
IB<br />
-8<br />
Foothills<br />
Range<br />
Arch<br />
UB<br />
-8<br />
Beaufort Sea<br />
-6<br />
-6<br />
-8<br />
-4<br />
-8<br />
-6<br />
-10<br />
B'<br />
-10<br />
0 100 mi<br />
0 160 km<br />
Scale
Chukchi<br />
Sea<br />
UTm<br />
Upper Tertiary marine<br />
UKm Upper Cretaceous marine<br />
UKc<br />
LKm<br />
Axis<br />
LKm<br />
Lower Cretaceous marine<br />
Figure 3. Geologic map of the North Slope, Alaska.<br />
of<br />
Brooks<br />
UKc<br />
LKc<br />
Foothills<br />
Colville Basin<br />
LTc<br />
LKc<br />
LKm<br />
Coastal Plain<br />
UKm<br />
Range<br />
Lower Tertiary continental<br />
UKc<br />
Upper Cretaceous continental<br />
Lower Cretaceous continental<br />
LTc<br />
UTm<br />
Kuparuk River Field<br />
Prudhoe Bay Field<br />
0 100 mi<br />
0 160 km<br />
Scale<br />
Oil field
Elevation in feet<br />
5000<br />
0<br />
5000<br />
10000<br />
15000<br />
20000<br />
25000<br />
30000<br />
South North<br />
A<br />
Brooks<br />
Range Foothills<br />
LSB<br />
Endicott Grp<br />
1.3<br />
Colville Basin<br />
Oil well<br />
Gas well<br />
Fault, showing direction<br />
of movement<br />
Colville River Teshekpuk Lake<br />
Figure 4. Cross-section A-A' of North Slope, Alaska. After Bird (1991).<br />
2.0<br />
Mean vitrinite reflectance % Ro<br />
Petroleum field<br />
Coastal Plain Coastline Continental Shelf<br />
EKP WFC3 SQL IGK NIK ETK DLT<br />
2.0<br />
0.6<br />
Torok Formation<br />
Pre-Mississippian<br />
Kingak Shale<br />
Nanushuk Group<br />
Sadlerochit Grp-Shublik Fm-Sag River Ss<br />
Endicott<br />
Group<br />
Umiat Basin<br />
Lisburne Group<br />
Colville Group<br />
Pre-Mississippian<br />
Barrow Arch<br />
0 20 mi<br />
Scale<br />
No vertical exaggeration<br />
Nuwok Basin<br />
A'
Eon or<br />
Period<br />
Quaternary<br />
and<br />
Neogene<br />
Paleogene<br />
Cretaceous<br />
Jurassic<br />
Triassic<br />
Permian<br />
Pennsylvanian<br />
Mississippian<br />
Devonian<br />
Silurian<br />
Ordovician<br />
Cambrian<br />
Proterozoic<br />
Age<br />
(Ma)<br />
2<br />
24<br />
50<br />
66<br />
98<br />
144<br />
oup<br />
208<br />
245<br />
286<br />
320<br />
360<br />
408<br />
438<br />
505<br />
570<br />
Main potential reservoirs<br />
Main source rocks<br />
South and west North and east South North<br />
No Data<br />
Etivluk Gr<br />
No Data<br />
Lisburne<br />
Peninsula<br />
Stratigraphy Tectonic Events<br />
Colville<br />
Group<br />
Nanushuk<br />
Group<br />
Fortress Mtn<br />
Formation<br />
?<br />
Iviagik<br />
Group<br />
Pebble shale unit<br />
?<br />
?<br />
Kingak<br />
Shale<br />
Fire Creek Siltstone<br />
Member<br />
Kavik Member<br />
?<br />
Echooka<br />
Formation<br />
No Data<br />
Romanzof<br />
Mountains<br />
Sagavanirktok<br />
Formation<br />
Torok<br />
Formation<br />
Canning<br />
Formation<br />
Hue Shale<br />
Shublik Formation<br />
Lodge Sandstone<br />
Member<br />
Gubik Formation<br />
Gamma-ray zone<br />
Lower Cretaceous unconformity<br />
Kemik Sandstone<br />
Kuparuk Formation<br />
Simpson Sandstone<br />
Barrow Sandstone<br />
Sag River and Karen Creek<br />
sandstones, undivided<br />
Ivishak<br />
Formation<br />
Itkilyariak<br />
Formation<br />
Kayak Shale Kekiktuk<br />
Conglomerate<br />
?<br />
?<br />
?<br />
?<br />
Lisburne Group<br />
Neruokpuk<br />
Quartzite<br />
Mount Copleston<br />
Limestone<br />
? Nanook Limestone<br />
?<br />
Sadlerochit and<br />
Shublik Mountains<br />
Katakturuk Dolomite<br />
Sadlerochit<br />
Group<br />
Condensed basinal deposits<br />
Hiatus or erosional deposits<br />
Figure 5. Generalized stratigraphic column of North Slope subterrane (Arctic Alaska terrane). Ordovician and<br />
Silurian Iviagik Group is that of Martin (1970). Jurassic Simpson and Barrow sandstones are of local<br />
usage. Brookian sequence depicts North Slope units only; less well-known Brookian rocks in Lisburne<br />
Peninsula and northeastern Brooks Range are not shown. Absolute time scale (Palmer (1983) is<br />
variable. After Moore et al (1994) and Bird (1991).<br />
Endicott<br />
Group<br />
Brookian<br />
Sequence<br />
Ellesmerian<br />
Sequence<br />
Pre-Mississippian<br />
Rocks<br />
(Sediment Provenance)<br />
(Transport SW to NE)<br />
Brooks Range Orogeny<br />
Colville Basin Subsiding<br />
Chert<br />
Marine shale<br />
Marine calcareous shale<br />
Marine clastic rocks<br />
Coarse-grained non-marine<br />
clastic rocks<br />
Conglomerate<br />
Limestone<br />
Dolomite<br />
(Sediment Provenance)<br />
(Transport N to S)<br />
Volcanic rocks<br />
Beaufort Sea<br />
Basin Subsiding<br />
Rifting<br />
Orogeny<br />
Sandy limestone
Elevation in Miles<br />
Elevation in Miles<br />
2<br />
1<br />
0<br />
-1<br />
-2<br />
-3<br />
-4<br />
-5<br />
-6<br />
0<br />
-1<br />
-2<br />
-3<br />
-4<br />
-5<br />
-6<br />
0.25<br />
0.6<br />
0.13<br />
2.0<br />
Post-Cenomanian<br />
rocks<br />
1 2 3 4 5 6 7 8 9 10 11 12 13 14<br />
AWV OUM ECM KLU IGK NIK WFC FHC<br />
eroded section<br />
Present Day<br />
Late Cretaceous<br />
≈ 75 Ma<br />
Torok Formation and<br />
pebble shale unit,<br />
undivided<br />
Ikpikpuk-<br />
Umiat Basin<br />
Sadlerochit, Lisburne,<br />
and Endicott Groups,<br />
undivided<br />
Nanushuk Group<br />
Kingak Sh, Sag River<br />
Ss, and Shublik Fm,<br />
undivided<br />
Basement rocks<br />
Vitrinite Reflectance (%R o)<br />
Figure 6. Present-day and Late Cretaceous cross-sections B-B' of North Slope, Alaska, showing down-hole vitrinite reflectance values (%R o)<br />
1<br />
Well<br />
Oil field<br />
Barrow Arch<br />
0 50 mi<br />
0 100 km<br />
Vertical Exaggeration ≈ 15x<br />
coastline<br />
sea level<br />
0.25<br />
0.6<br />
1.3<br />
2.0<br />
4<br />
2<br />
0<br />
-2<br />
-4<br />
-6<br />
-8<br />
0<br />
-2<br />
-4<br />
-6<br />
-8<br />
-10<br />
Elevation in Kilometers<br />
Elevation in Kilometers
Russia<br />
USA<br />
Herald<br />
Arch<br />
Chukchi Sea<br />
Axis<br />
Immature<br />
Oil window<br />
Gas window<br />
Brooks<br />
Southern<br />
Northern Foothills<br />
of Colville Basin<br />
Coastal Plain<br />
NPRA<br />
Foothills<br />
Beaufort Sea<br />
Figure 7. Thermal maturity of subsurface Shublik Formation and Kingak Shale, North Slope, Alaska. After Bird (1991).<br />
Range<br />
0 100 mi<br />
0 160 km<br />
Scale<br />
Arctic <strong>National</strong><br />
Wildlife Refuge<br />
(ANWR)
-3550<br />
Axis of<br />
Well<br />
-8476<br />
Depth to top of<br />
overpressure (ft)<br />
Chukchi Sea<br />
-4200 to -6200<br />
-2682<br />
Colville<br />
Brooks<br />
-8015<br />
-475 ?<br />
Northern Foothills<br />
Southern<br />
Coastal Plain<br />
0 100 mi<br />
0 160 km<br />
Figure 8. Approximate subsea depth to top of overpressure, North Slope, Alaska. Data from some US Navy wells (1944-53) is suspect.<br />
-5071<br />
Basin<br />
> -5094<br />
-2596<br />
-4371<br />
Range<br />
-1382 ?<br />
-5131<br />
-3775<br />
KNF<br />
-100 ?<br />
Foothills<br />
-11,000<br />
-388 ?<br />
-650 ?<br />
-4298<br />
Scale<br />
Beaufort Sea<br />
-2342<br />
-3550<br />
-1344<br />
-1187
Axis of<br />
Meade (4)<br />
AKK<br />
Eagle Creek (12)<br />
Field<br />
Well<br />
Chukchi Sea<br />
EGC<br />
Brooks<br />
Figure 9. Location map of wells and fields in North Slope, Alaska.<br />
TKC<br />
Colville<br />
TUN<br />
KAO<br />
PRD<br />
Northern Foothills<br />
KUG<br />
Southern<br />
AWU<br />
South Barrow (1)<br />
Sikulik (14)<br />
Walakpa (13)<br />
Meade (4)<br />
Basin<br />
Coastal Plain<br />
MDE<br />
SBW3<br />
WKP1<br />
WKP2<br />
BTS<br />
SMD<br />
Range<br />
SBW1<br />
AVK<br />
KUY<br />
OUM<br />
LSB<br />
WDS<br />
TUP<br />
East Barrow (10)<br />
TUL<br />
SMP<br />
EOM<br />
ETP<br />
WKP<br />
NSM<br />
SSM<br />
ESP2<br />
FLU<br />
TIT<br />
KNF<br />
ESP1<br />
KLK<br />
IPK<br />
Simpson (5)<br />
DWP<br />
Foothills<br />
DLT<br />
ETK<br />
NIK<br />
IGK<br />
SQL<br />
EKP<br />
0 100 mi<br />
0 160 km<br />
Scale<br />
Beaufort Sea<br />
CPH<br />
Square Lake (8)<br />
Wolf Creek (6)<br />
East Kurupa (11)<br />
WFC3 UMT1<br />
FRN<br />
NKP<br />
WFC<br />
SBE<br />
UMT2<br />
ABB<br />
ATP<br />
FHC<br />
UMT11<br />
UMT5<br />
GRD<br />
SHB<br />
Fish Creek (2)<br />
Umiat (3)<br />
GBK1<br />
Gubik (7)<br />
GBK2<br />
East Umiat (9)
Axis of<br />
AKK<br />
AKK<br />
0.57 psi/ft 11080' Ft Mtn<br />
1.435 mmcfd 10470-11080'<br />
Torok/Ft Mtn<br />
OP 6200' - 12049' (TD)<br />
Well<br />
0.59 psi/ft 10810' Ft Mtn<br />
Tool plugged, no recovery<br />
OP 8500' - 17030' (TD)<br />
Chukchi Sea<br />
EGC<br />
TKC<br />
0.64 psi/ft<br />
32.0 mcfd<br />
5.1 mcfd<br />
Colville<br />
4655' Nanushuk<br />
2760' Nanushuk<br />
4655' Nanushuk<br />
+ 120 bbl water-<br />
<strong>Final</strong> rate 75 bwpd, no gas<br />
24.0 mcfd 7634' Torok<br />
OP 2800' - 8212' (TD)<br />
Brooks<br />
Range<br />
Southern<br />
Northern Foothills<br />
Basin<br />
Figure 10. Oil and gas production data from selected wells in North Slope, Alaska.<br />
AWU<br />
0.87 psi/ft<br />
2057 bwpd<br />
Coastal Plain<br />
8243' Ft Mtn<br />
8243' Ft Mtn<br />
OP 6200' - 11200' (TD)<br />
0.53 psi/ft<br />
213 mcfd<br />
61 bbl water<br />
LSB<br />
11841' Lisburne<br />
7010' Shublik<br />
7662' Lisburne<br />
OP 6230' - 8040' (TD)<br />
0.47 psi/ft<br />
5 mcfd<br />
decrease to zero<br />
+ 33 bbl water<br />
+ mud<br />
10 mcfd<br />
+ 14 bbl water<br />
+ 4 bbl mud<br />
WKP<br />
"Tight hole"<br />
10190' Ft Mtn<br />
7070' Torok<br />
7950' Torok<br />
OP 6500' - 11060' (TD) 0.82 psi/ft<br />
3.8 mmcfd<br />
KLK<br />
EKP<br />
Foothills<br />
0 100 mi<br />
0 160 km<br />
Scale<br />
Beaufort Sea<br />
No tests<br />
OP 3600' - 10737' (TD)<br />
ABB<br />
400 mcfd<br />
Recovered<br />
47 bbl water<br />
10780' Ft Mtn<br />
7190' Torok<br />
12148' Ft Mtn<br />
OP 5900' - 12695' (TD)
REFERENCES<br />
Al-Shaieb, Z., Puckette, J.O., Abdalla, A.A. and Ely, P.B., 1997, Megacompartment complex in the<br />
Anadarko Basin–a completely sealed overpressured phenomenon, in Gas Research Institute Workshop,<br />
Compartmentalization of Overpressured Reservoirs in the Anadarko Basin–Implications for<br />
Exploration and Development: Gas Research Institute, Oklahoma City, p. 1-14.<br />
Al-Shaieb, Z., Puckette, J.O., Abdalla, A.A. and Ely, P.B., 1997, Three levels of compartmentation within<br />
the overpressured interval of the Anadarko Basin, in Gas Research Institute Workshop:<br />
Compartmentaliztion of Overpressured Reservoirs in the Anadarko Basin–Implications for Exploration<br />
and Development: Gas Research Institute, Oklahoma City, p. 15-29.<br />
Al-Shaieb, Z., Puckette, J.O., Abdalla, A.A., Tigert, V. and Ortoleva, P.J., 1997, The banded character of<br />
pressure seals, in Gas Research Institute Workshop, Compartmentaliztion of Overpressured Reservoirs<br />
in the Anadarko Basin–Implications for Exploration and Development: Gas Research Institute,<br />
Oklahoma City, p. 30-46.<br />
Aldy, W., 1994, Well log determination of the organic richness of the Mowry Shale in the North Park and<br />
Denver Basins and the Niobrara Chalk in the Denver Basin: Colorado School of Mines, Master of<br />
Science thesis, 86 pp.<br />
Anderson, R.R., and Black, R.A., 1982, Geological interpretations from geophysical models of the<br />
Midcontinent geophysical anomaly in southwest Iowa, in Regional tectonics and seismicity of<br />
southwestern Iowa: Annual <strong>Report</strong> of U.S. Nuclear Regulatory Commission NUREG/CR-2548, p.<br />
27-41.<br />
Armentrout, J.M., and Suek, D.H., 1985, Hydrocarbon Exploration in Western Oregon and Washington:<br />
American Association of Petroleum Geologists Bulletin, v. 69, no. 4, p. 627-643.<br />
Asreen, R.C., Jr., 1990, Kingdom (Abo Reef), in Vanderhill, A. L., C.B. Godfrey, and F. Heard eds., Oil<br />
and Gas Fields in West Texas Symposium Volume V: Midland, Texas, West Texas Geological<br />
Society, Pub. # 90-86, p. 117-120.<br />
Baars, D.L., and Stevenson, G.M., 1981, Tectonic evolution of the Paradox Basin, Utah and Colorado, in<br />
Geology of the Paradox Basin: Rocky Mountain Associationof Geologists, p. 23-31.<br />
Bailey, E.H., ed., 1966, Geology of Northern California: California Division of Mines and Geology Bulletin<br />
190, 508 pp.<br />
Banet, A. C., Jr., 1991, Oil and gas development on Alaska’s North Slope–past results and future prospects:<br />
U.S.D.I. Bureau of Land Management, Alaska, Open-File <strong>Report</strong> 34, 42 pp.<br />
Barber, C., 1979. Generation, migration, trapping and alteration of petroleum–an introduction for<br />
exploration geologists: Rocky Mountain Association of Geologists, Continuing Education Short<br />
Course Notes, 50 pp.<br />
Barker, C.E., 1996, Resource assessment of the Bureau of Land Management’s Winnemucca District and<br />
Surprise Resource Area, Northwest Nevada and Northeast California–geochemical analysis and<br />
thermochronologic modeling to evaluate conceptual petroleum plays: U.S. Geological Survey Open-<br />
File <strong>Report</strong> 96-051.<br />
Barker, C.E., Pollastro, R.M., and Wandrey, C.J., 1996, Park Basins Province (038), in Gautier, D.L. et<br />
al., eds., 1995 <strong>National</strong> Assessment of United States Oil and Gas Resources–Results, Methodology,<br />
and Supporting Data.<br />
Barker, C.E. and Elders, W.A., 1981, Vitrinite reflectance geothermometry and apparent heating duration in<br />
the Cerro Prieto Geothermal Field: Geothermics, v. 10, p. 207-223.<br />
Barnes, D.A., JP. J.P., and Aronson, J.L., 1992, K-Ar dating of illite diagenesis in the Middle Ordovician<br />
St. Peter Sandstone, Central Michigan Basin, USA–implications for thermal history, in Houseknecht,<br />
D.W., and Pittman, E.D., eds., Origin, diagenesis, and petrophysics of clay minerals in sandstones:<br />
Society of Economic Paleontologists and Mineralogists Special Publication 47. p. 35-48.<br />
Bearden, B.L., and Mancini, E.A., 1985, Petroleum geology of Carter Sandstone (Upper Mississippian),<br />
Black Warrior Basin, Alabama: American Association of Petroleum Geologists Bulletin, v. 69, no. 3,<br />
p. 361-377.<br />
Bebout, D.G., and Garret, C.M., Jr., 1989, PM-2. Spraberry and Dean Sandstone, Midland Basin–Atlas of<br />
Major Texas Gas Reservoirs: Gas Research Institute and Bureau of Economic Geology, Austin,<br />
Texas, p.121-122.
Beirei, M.A., 1987, Hydrocarbon maturation, source rock potential, and thermal evolution of Late<br />
Cretaceous and Early Tertiary rocks of Hanna basin, southeastern Wyoming: University of Wyoming,<br />
Laramie, Masterof Science thesis, 130 pp.<br />
Beirei, M.A., and Surdham, R.C., 1986, Hydrocarbon maturation, source rock potential, and thermal<br />
evolution of Late Cretaceous and Early Tertiary rocks of Hanna basin, southeastern Wyoming:<br />
American Association of Petroleum Geologists Bulletin, v. 70, no. 8, p. 1031.<br />
Beyer, L.A., 1996, Pacific Coast Province, in Gautier, D.L., Dolton, G.L., Takahashi, K.I., and Varnes,<br />
K.L., eds., 1995 <strong>National</strong> Assessment of United States Oil and Gas Resources–Results,<br />
Methodology, and Supporting Data: U.S. Geological Survey Digital Data Series DDS-30, 144 pp.,<br />
28 figs.<br />
Beyer, L.A., 1988, Summary of geology and petroleum plays used to assess undiscovered recoverable<br />
petroleum resources of Los Angeles Basin province, California: U.S. Geological Survey Open-File<br />
<strong>Report</strong> 88-450L.<br />
Biggs, P., 1957, CO 2 at North and South McCallum, in Finch, W.C., ed., Guidebook to the geology of<br />
North and Middle Parks Basin, Colorado: Rocky Mountain Association of Geologists, 9th Annual<br />
Field Conference, p. 115-118.<br />
Bird, K.J., 1996, Region 1, Alaska–Geologic Framework, in Gauthier, D.L., Dolton, G.L., Takahashi, K.I.,<br />
and Varnes, K.L., eds., 1995 <strong>National</strong> Assessment of United States Oil and Gas Resources–Results,<br />
Methodology, and Supporting Data, U.S. Geological Survey Digital Data Series DDS-30, Release 2,<br />
p. 1-2.<br />
Bird, K.J., 1991, Geology, play descriptions, and petroleum resources of the Alaskan North Slope<br />
(Petroleum Provinces 58-60), U. S. Geolgical Survey Open-File <strong>Report</strong> 88-450Y, 52 pp.<br />
Bishop, C.E. and Tripp, B.T., 1993, An overview of the tar sand resources of Utah: American Association<br />
of Petroleum Geologists Bulletin v. 77, p. 1445 (Abstract).<br />
Black, B., 1998, Exploring the Rio Grande Rift–frontier and underexplored basins of New Mexico:<br />
Petroleum <strong>Technology</strong> Transfer Council, Southwest Regional Lead Organization, 1 pp.<br />
Black, B., 1982, Oil and gas exploration in the Albuquerque Basin–Albuquerque Country II: New Mexico<br />
Geological Society Guidebook, 33rd Field Conference, p. 313-323.<br />
Bodily, D.M., Hucka, V.J. and Huang, H., 1991, Correlation of chemical structure of coals in the Book<br />
Cliffs and Wasatch Plateau Fields with methane formation and retention, east-central Utah, in<br />
Geology of East-Central Utah: Utah Geological Association Publication 19, p. 211-222.<br />
Bookout, J.F., ed., 1980, Denver Basin, Lower Cretaceous J-Sandstone tight reservoir gas potential:<br />
<strong>National</strong> Petroleum Council, Committee on Unconventional Gas Sources, Chapter 15, Tight Gas<br />
Reservoirs, Part II, Unconventional Gas Sources, p. 15-1 through 15-33.<br />
Bortz, L.C., and Murray, D.K., 1979, Eagle Springs Oil Field, Nye County, Nevada, in Newman, G.W.,<br />
and Goode, H.D., eds, Guidebook, 1979 Basin and Range Symposium: Rocky Mountain Association<br />
of Geologists and Utah Geological Society.<br />
Boss, R.F., Lennon, R.B., and Wilson, B.W., 1975, Middle Ground Shoal Oil Field, Alaska: American<br />
Association of Petroleum Geologists Memoir 24, p. 1-22.<br />
Bostick, N.H., Cashman, S.M., McCulloh T.H., and Waddell, C.T., 1978, Gradients of vitrinite reflectance<br />
and present temperatures in the Los Angeles and Ventura Basins, California, in Oltz, D.F., ed., Low<br />
temperature metamorphism of kerogen and clay minerals: Symposium in Geochemistry: Society of<br />
Economic Paleontologists and Mineralogists, Los Angeles, p. 65-96.<br />
Box, S.E., and Elder, W.P., 1992, Depositional and biostratigraphic framework of the Upper Cretaceous<br />
Kuskokwim Group, southwestern Alaska, in Bradley, D.C., and Ford, A.D., eds., Geologic studies in<br />
Alaska by the U.S. Geological Survey, 1990: U.S. Geological Survey Bulletin 1999, p. 8-16.<br />
Braislin, D.B., Hastings, D.D., and Snavely, P.D., Jr., 1971, Petroleum potential of Western Oregon and<br />
Washington and adjacent continental margin, in Future Petroleum Provinces of the United States–<br />
Their Geology and Potential: American Association of Petroleum Geologists Memoir 15, v. 1, p.<br />
229-238.<br />
Bredehoeft, J.D., Wesley, J.B., and Fouch, T.D., 1994, Simulations of the origin of fluid pressure, fracture<br />
generation and the movement of fluids in the Uinta Basin, Utah: American Association of Petroleum<br />
Geologists Bulletin v. 78, p. 1729-1747.
Brett, C.E., Goodman, W.M., and LaDucha S.T., 1990, Sequences cycles, and basin dynamics in the<br />
Silurian of the Appalachian Foreland Basin: Sedimentary Geology, v. 69, p. 191-244.<br />
Brister, B.S. and Gries, R.R., 1994,Tertiary stratigraphy and tectonic development of the Alamosa Basin<br />
(northern San Luis Basin), Rio Grande Rift, south-central Colorado: Geological Society of America<br />
Special Paper 291,p. 39-58.<br />
Broadhead, R.F., Wilks, M., Morgan, M., and Johnson, R.E., 1998, New Mexico Petroleum Source Rock<br />
Database, CD-ROM Digital Data Series.<br />
Broadhead, R.F., 1993, Permian Basin Permian Plays, in Atlas of Major Rocky Mountain Gas Reservoirs:<br />
New Mexico Bureau of Mines and Mineral Resources, University of New Mexico Press, Socorro, p.<br />
138-152.<br />
Brown, J.B., 1966, Gas in Los Angeles Basin, California, in Beebe, B.W., and Curtis, B.F., eds., 1968:<br />
Natural Gases of North America, V. 1: American Association of Petroleum Geologists Memoir 9, p.<br />
1149-163.<br />
Bushaw, D.J., 1968, Environmental synthesis of the east Texas Lower Cretaceous: Gulf Coast Association<br />
of Geological Societies Transactions, v. 18, p. 416-438.<br />
Callaway, D.C., and Rennie, E.W., Jr., 1991, San Joaquin Basin, in The Geology of North America:<br />
Economic Geology, v. P-2, p. 417-430.<br />
Campbell, R.H., and Yerkes, R.F., 1976, Cenozoic evolution of the Los Angeles basin area–relation to<br />
plate tectonics, in Aspects of the geologic history of the California continental borderland: American<br />
Association of Petroleum Geologists, Miscellaneous Publication No. 24, p. 365-382.<br />
Carpen, T.R., 1957, North McCallum Field, Jackson County, Colorado, in Finch, W.C., ed., Guidebook to<br />
the Geology of North and Middle Parks Basin, Colorado: Rocky Mountain Association of Geologists,<br />
9th Annual Field Conference, p. 109-112.<br />
Catacosinos, P.A., and P.A. Daniels Jr., 1991, Stratigraphy of Middle Proterozoic to Middle Ordovician<br />
formations in the Michigan Basin, in Catacosinos, P.A. and Daniels, P.A., Jr., eds., Early<br />
sedimentary evolution of the Michigan Basin: Geological Society of America Special Paper 256. p.<br />
53-71.<br />
Catacosinos, P.A., 1973, Cambrian lithostratigraphy of Michigan Basin: American Association of<br />
Petroleum Geologists Bulletin, v. 57, p. 2404-2418.<br />
Cercone, K.R., and Pollack, H.N., 1991, Thermal maturity of the Michigan Basin, in Catacosinos, P.A.,<br />
and Daniels, P.A., Jr., eds., Early sedimentary evolution of the Michigan Basin: Geological Society<br />
of America Special Paper 256. p. 1-11.<br />
Champlin, S. D., 1999, Personal communication: Office of Geology, Jackson, Mississippi.<br />
Chapin, C.E. and Cather, S.M., 1994, Tectonic setting of the axial basins of the northern and central Rio<br />
Grande Rift: Geological Society of America Special Paper 291, p. 5-25.<br />
Cherven, V.B., 1983, A delta slope submarine fan model for Maestrichtian part of the Great Valley<br />
Sequence: American Association of Petroleum Geologists Bulletin v. 62, no. 5, p. 772-816.<br />
Clayton, J.L., Mudge, M.R., Lubeck, C.M., and Daws, T.A., 1982, Hydrocarbon source-rock evaluation of<br />
the Disturbed Belt, northwestern Montana, in Powers, R.B., ed., Geologic Studies of the Cordilleran<br />
Thrust Belt: Rocky Mountain Association of Geologists, p. 777-804.<br />
Clayton, J.L., and Swetland, P.J., 1977, Preliminary <strong>Report</strong>–Petroleum Geochemistry of the Denver Basin,<br />
in Veal, H.K., ed., Exploration Frontiers of the Central and Southern Rockies: Rocky Mountain<br />
Association of Geologists, p. 223-233.<br />
Cluff, R.M., 1999, Personal Communication: The Discovery Group, Inc.<br />
Coleman, J.L., Jr., and Coleman, C.J., 1981, Stratigraphic, sedimentologic, and diagenetic framework for<br />
the Jurassic Cotton Valley Terryville massive sandstone complex, northern Louisiana: Gulf Coast<br />
Association of Geological Societies Transactions, v. 31, p. 71-79.<br />
Colorado Oil and Gas Conservation Commission, 1997, Oil and gas statistics for the State of Colorado:<br />
Colorado Oil and Gas Conservation Commission.<br />
Comer, J.B., and Hinch, H.H., 1987, Recognizing and quantifying expulsion of oil from the Woodford<br />
Formation and age-equivalent rocks in Oklahoma and Arkansas: American Association of Petroleum<br />
Geologists Bulletin, v. 71, no. 7, p. 844-858.
Corbett, K.P., Friedman, M., and Spang, J., 1987, Fracture development and mechanical statigraphy of<br />
Austin Chalk, Texas: American Association of Petroleum Geologists Bulletin, v. 71, no. 1, p. 17-<br />
28.<br />
Crawford, F.D., 1970, Petroleum potential of Santa Maria Province, California, in Cram I.H., ed., Future<br />
Petroleum Provinces of the United States, Vol. 1: American Association of Petroleum Geologists<br />
Memoir 15, p. 316-329.<br />
Daniels, P.A., 1982, Upper Precambrian sedimentary rocks, Oronto Group, Michigan-Wisconsin, in<br />
Geology and Tectonics of the Lake Superior Basin: Geological Society of American Memoir 156, p.<br />
5-14.<br />
Dawson, W.C., 1997, Limestone microfacies and sequence stratigraphy, Eagle Ford Group, north-central<br />
Texas outcrops: American Association of Petroleum Geologists Bulletin, v. 81, no. 9, p. 1573<br />
(abstract).<br />
Dawson, W.C., Katz, B.J., Liro, L.M., and Robison, V.D., 1993, Stratigraphic and geochemical variability,<br />
Eagle Ford Group, east-central Texas: Proceedings, 14th Annual Society of Economic Paleontologists<br />
and Mineralogists Gulf Coast Research Conference.<br />
DeVoto, R.H., 1995, Geologic history of South Park, Colorado: Colorado School of Mines Quarterly, v.<br />
95, no. 1, p. 25-42.<br />
Devery, D.M., 1983, An overview of oil and gas potential in Mississippi: Oil and Gas Journal, v. 81, no.<br />
15, p. 129-134.<br />
Dibblee, T.W., 1984, Stratigraphy and tectonics of the San Felipe Hills, Borrego Badlands, Superstition<br />
Hills, and Vicinity, in Rigsby, C.A., ed., The Imperial Basin–Tectonics, Sedimentation and Thermal<br />
Aspects: Society of Economic Paleontologists and Mineralogists, Pacific section , v. 40, p. 31-44.<br />
DiBona, P.A., and Kirschner, C.E., 1984, Geological bibliography for selected onshore sedimentary basins<br />
of central and southern Alaska, stressing basin analysis and including an index of available well and<br />
subsurface data: U.S. Geological Survey Open-File <strong>Report</strong> OF 84-99, 70 pp.<br />
Dickas, A.B., 1986, Comparative Precambrian stratigraphy and structure along the Mid-Continent Rift:<br />
American Association of Petroleum Geologists Bulletin, v. 70, p. 225-238.<br />
Dickinson, W.R., 1971, Clastic sedimentary sequences deposited in shelf, slope, and trough settings between<br />
magmatic arcs and associated trenches: Pacific Geology, v. 3, p. 15-30.<br />
Dolly, E.D. and Meissner, F.F., 1977, Geology and gas exploration potential, Upper Cretaceous and Lower<br />
Tertiary strata, northern Raton Basin, in Veal, H.K., ed., Exploration Frontiers of the Central and<br />
Southern Rockies: Rocky Mountain Association of Geologists, p. 247-270.<br />
Dolson, J.C., and Muller, D.S., 1994, Stratigraphic evolution of the Lower Cretaceous Dakota Group,<br />
Western Interior, U.S.A., in Mesozoic Systems of the Rocky Mountain Region, U.S.A.: Society of<br />
Economic Paleontologists and Mineralogists, Rocky Mountain Section, Denver, p. 441-458.<br />
Dolson, J.C., Piombino, J., Franklin, M., and Harwood, R., 1993, Devonian oil in Mississippian and<br />
Mesozoic reservoirs–unconformity controls on migration and accumulation, Sweetgrass Arch,<br />
Montana: The Mountain Geologist, v. 30, p. 125-146.<br />
Dott, R.H., Jr., and Nadon, G., 1992, Modeling of pressure compartments in the St. Peter Sandstone gas<br />
reservoir in the Michigan Basin, <strong>Final</strong> <strong>Report</strong>: Gas Research Institute, 59 pp.<br />
Dow, W.G., 1977, Kerogen studies and geological interpretations: Journal of Geochemical Exploration, v.<br />
7, p. 79-99.<br />
Drzewiecki, P.A., Simo, A., Brown, P., Castrogiovanni, E., Nadon, G.C., Shepard, L.D., Valley, J.W.,<br />
Vandrey, M.R., and Winter, B.L., 1994, Diagenesis, diagenetic banding, and porosity evolution of the<br />
Middle Ordovician St. Peter Sandstone and Glenwood Formation of the Michigan Basin, in Orteleva,<br />
P., ed., Basin Compartments and Seals: American Association of Petroleum Geologists Memoir 61,<br />
p. 179-200.<br />
Dryden, R.C., Erickson, R.C., Off, T., and Yost, S.W., 1965, Gas in Los Angeles Basin, California, in<br />
Beebe, B.W., and Curtis, B.F., eds., 1968, Natural Gases of North America, Vol. 1: American<br />
Association of Petroleum Geologists Memoir 9, p. 135-149.<br />
Duchscherer, W., Jr., 1972, Look deeper in the Black Warrior: Oil and Gas Journal, v. 70, no. 31, p. 146-<br />
151.<br />
Duffield, C., 1976, Geothermal technology systems and water cycles in arid lands: University of Arizona<br />
Arid Lands Resource Information Paper no. 8, ch. V, p. 80-90.
Dunham, J.B., Bromley, B.W., and Rosato, V.J., 1991, Geologic controls on hydrocarbon occupance within<br />
the Santa Maria Basin of western California, in Gluskoter, H.J., Rice, D.D., and Taylor, R.B., eds,<br />
Economic Geology, U.S.: Geological Society of America, v. P-2, p. 431-446.<br />
Dutton, S.P., Clift, S.J., Hamilton, D.S., Hamlin, H.S., Hentz, T.F., Howard, W.E., Akhter, M.S., and<br />
Laubach, S.E., 1993, Major low-permeability sandstone gas reservoirs in the continental United<br />
States–<strong>Report</strong> of Investigations No. 211: University of Texas at Austin, Bureau of Economic<br />
Geology, contract report prepared for Gas Research Institute, 221 pp.<br />
Dutton, S.P., 1980, Petroleum source rock potential and thermal maturity, Palo Duro Basin, Texas: Texas<br />
Bureau of Economic Geology Geological Circular 80-10, 48 pp.<br />
Eaton, J.G., Kirkland, J.J., and Kauffman, E.G., 1990, Evidence and dating of Mid-Cretaceous tectonic<br />
activity in the San Rafael Swell, Emery County, Utah: Mountain Geology, v. 27, p. 39-45.<br />
Elder, W.P. and Kirkland, J.I., 1964, Cretaceous paleogeography of the southern Western Interior Region in<br />
Mesozoic Systems of the Rocky Mountain Region, U.S.A.: Society of Economic Paleontologists<br />
and Mineralogists, Rocky Mountain Section, Denver, p. 415-440.<br />
Elders, W.A., 1979, The geological background of the geothermal fields of the Salton Trough, in Elders,<br />
W.A., ed., Geology and Geothermics of the Salton Trough: Geological Society of America Field Trip<br />
Guidebook, UCR/IGPP-79/23, p. 1-19.<br />
Ericksen, R.L., 1999, Personal Communication: Office of Geology, Jackson Mississippi.<br />
Ericksen, R.L., 1993, ARCO-Davis wildcat seeks answers to Black Warrior's deep mysteries: Oil and Gas<br />
Journal, v. 91, no. 35, p. 101-103.<br />
Erskine, M.C. Jr., Wolleben, J.A., and Lawler, D.L., 1984, A potential field interpretation of the structural<br />
edge of the Cretaceous Hornbrook Basin in northern California, in Nilsen, T.H., ed. Geology of the<br />
Upper Cretaceous Hornbrook Formation, Oregon and California: Society of Economic<br />
Paleontologists and Mineralogists, Pacific Section, v. 42, p. 211-219.<br />
Ewing, T.E., 1983, Austin/Buda Fractured Chalk, in Galloway, W.E., Ewing, T.E., Garrett, C.M., and<br />
Tyler, N., Atlas of Major Texas Oil Reservoirs: University of Texas Bureau of Economic Geology, p.<br />
41-42.<br />
Finley, R.J., 1986, An overview of selected blanket-geometry, low permeability gas sandstones in Texas, in<br />
Spencer, C.W., and Mast, R.F., eds., Geology of Tight Gas Reservoirs, AAPG Studies in Geology<br />
24: American Association of Petroleum Geologists, p. 69-85.<br />
Ford, T.D., 1990, Grand Canyon Supergroup–Nankoweap Formation, Chuar Group, and Sixtymile<br />
Formation, in Beus, S. and Morales, M., eds., Grand Canyon Geology, p. 49-70.<br />
Forgotson, J.M., and Forgotson, J.M., Jr., 1976, Definition of Gilmer limestone, Upper Jurassic formation,<br />
northeastern Texas: American Association of Geologists Bulletin, v. 60, no. 7, p. 1119-1123.<br />
Fouch, T.D., Wandrey, C.J., Pittman, J.W., Nuccio, V.F., Schmoker, J.W., Rice, D.D., Johnson, R.C.,<br />
and Dolton, G.L., 1992, Natural gas accumulations in low permeability Cretaceous and Tertiary<br />
rocks, Uinta Basin, Utah: U.S. Department of <strong>Energy</strong>, DOE/MC/20422-3051.<br />
Fowler, J.H., and Kuenzi, W.D., 1978, Keweenawan turbidites in Michigan (deep borehole red beds)–a<br />
foundered basin sequence developed during evolution of a protoceanic rift system: Journal of<br />
Geophysical Research, v. 83, p. 5833-5843.<br />
Franczyk, K.J. and Pitman, J.K., 1991, Latest Cretaceous nonmarine depositional systems in the Wasatch<br />
Plateau area–reflection of foreland to intermontane basin transition: Geology of East-Central Utah,<br />
Utah Geological Association Publication 19, p.77-93.<br />
Frank, J.R., Jr., 1996, Kingdom (Abo Reef) Field, in Dull, D., and Garber, R., eds., Oil and Gas Fields in<br />
West Texas Symposium Volume VII: West Texas Geological Society, Midland, Texas, p. 79-84.<br />
Frenzel, H.N., Bloomer, R.R., Cline, R.B., Cys, J.M., Galley, J.E., Gibson, W.R., Hills, J.M., King,<br />
W.E., Seager, W.R., Kottlowski, F.E., Thompson, S., III, Luff, G.C., Pearson, B.T., and Van<br />
Siclen, D.C., 1988, The Permian Basin region, in Sloss, L.L., ed., The Geology of North America,<br />
Vol. D-2: Sedimentary Cover of the North American Craton: United States: Geological Society of<br />
America, p. 261-306.<br />
Frez, J., and Gonzalez, J.J., 1991, Crustal structure and seismotectonics of northern Baja California, in<br />
Dauphin, J.P., and Simoneit, B.R. eds., American Association of Petroleum Geologists Memoir 47,<br />
p. 261-283.
Fuis, G.S., and Zucca, J.J., 1984, A geologic cross section of northeastern California from seismic<br />
refraction results, in Nilsen, T.H., ed. Geology of the Upper Cretaceous Hornbrook Formation,<br />
Oregon and California: Society of Economic Paleontologists and Mineralogists, Pacific Section, v.<br />
42, p. 203-209.<br />
Gardett, P.H., 1970, Petroleum potential of Los Angeles Basin, California, in Cram I. H., ed., Future<br />
Petroleum Provinces of the United States, V. 1: American Association of Petroleum Geologists<br />
Memoir 15, p. 298-308.<br />
Gas Research Institute, 1991, Executive summary of SFE No. 3–Application of advanced technologies in<br />
tight gas sandstones-Travis Peak and Cotton Valley Formations: In Focus-Tight Gas Sands, v. 7, no.<br />
1, 73 pp.<br />
Gautier, D.L., Dolton, G.L., Takahashi, K.I., and Varnes, K.L., eds., 1996, 1995 <strong>National</strong> Assessment of<br />
United States Oil and Gas Resources–Results, Methodology, and Supporting Data: U.S. Geological<br />
Survey Digital Data Series 30, version 2 [CD-ROM].<br />
Gautier, D.L, Clayton, J.L., Leventhal, J.S. and Reddin, N.J., 1984, Origin and source-rock potential of the<br />
Pierre Shale, Colorado and Kansas, in Woodward, J., Meissner, F.F. and Clayton, J.L., eds.,<br />
Hydrocarbon source rocks of the greater Rocky Mountain region: Rocky Mountain Association of<br />
Geologists, p. 369-385.<br />
Gibson, L.M., Malinconico, L.L., Downs, T., and Johnson, N.M., 1984, Structural implications of gravity<br />
data from the Vallencito-Fish Creek Basin, western Imperial Valley, California, in Rigsby, C.A., ed.,<br />
The Imperial Basin–Tectonics, Sedimentation and Thermal Aspects: Society of Economic<br />
Paleontologists and Mineralogists, Pacific Section v. 40, p. 15-29.<br />
Giuseppe, A.C., and Heller, P.L., 1996, Long-term river response to regional doming in the Price River<br />
Formation, Central Utah: Geology, v. 26, no. 3, p. 239-242.<br />
Gognat, T.A., 1999, Personal communication: Global GeoData, LLC.<br />
Grabowski, G.J. Jr., 1984, Generation and migration of hydrocarbons in Upper Cretaceous Austin Chalk,<br />
south-central Texas, in Source Rock Potential of Carbonate Rocks–AAPG Studies in Geology 18:<br />
American Association of Petroleum Geologists, p. 97-115.<br />
Grabowski, G.J. Jr., 1981, Source rock potential of the Austin Chalk, Upper Cretaceous, southeastern<br />
Texas: Gulf Coast Association of Geological Societies Transactions, v. 31, p. 105-113.<br />
Grether, W.J., and Morgan, K.A., 1988, Exploration and hydrocarbon potential of interior basins, Alaska<br />
(abstract): American Association of Petroleum Geologists Bulletin, v. 72, no. 2, p. 191-192.<br />
Gromer, J.M., 1982, A geologic study of the Raton Basin: Gas Research Institute Topical <strong>Report</strong> #GRI-<br />
5011-321-0130, 47 pp.<br />
Gromer, J.M., 1981, A geologic study of the Arkoma Basin and Ouachita Mountains: GRI Contract No. 01-<br />
321-0130, CER Corporation, 66 pp.<br />
Hall, C.A., 1981, San Luis Obispo transform fault and Miocene rotation of the western Transverse Ranges,<br />
California: Journal Geophysical Research, v. 86, no. B2, p. 1015-1031.<br />
Hammer, A.A., 1934, Rattlesnake Hills gas field, Benton County, Washington: American Association of<br />
Petroleum Geologists Bulletin, v. 18, p. 847-859.<br />
Hanson, B.M., Powers, B.K., Garret, C.M., Jr., McGookey, D.E., McGlasson, E.H., Horak, R.L.,<br />
Mazzullo, S.J., Reid, A.M., Calhoun, G.G., Clendening, J., and Claxton, B., 1991, The Permian<br />
Basin, in Gluskoter, H.J., Rice, D.D., and Taylor, R.B., eds., Economic Geology, United States, The<br />
Geology of North America, Vol. P-2: Geological Society of America, p. 339-356.<br />
Harris, D.C., and Baranoski, M.T., 1996, Precambrian pre-Knox Group play, in Roen J.B., and Walker B.J.,<br />
The atlas of major Appalachian gas plays: West Virginia Geological and Economical Survey<br />
Publication V-25, p. 188-192.<br />
Hastings, D.D., 1979, Results of exploratory drilling, northern Fallon Basin, western Nevada, in Newman,<br />
G.W., and Goode, H.D., eds., Guidebook, 1979 Basin and Range Symposium: Rocky Mountain<br />
Assnociation of Geologists and Utah Geological Society.<br />
Hatch, J.R., and Morey, G.B., 1985, Hydrocarbon source rock evaluation of Middle Proterozoic Solor<br />
Church Formation, North American Mid-Continent rift system, Rice County, Minnesota: American<br />
Association of Petroleum Geologists Bulletin, v. 69, p. 1208-1216.
Hatch, J.R., and Morey, G.B., 1984, Hydrocarbon source rock evaluation, Solor Church Formation (Middle<br />
Proterozoic, Keweenawan Supergroup) southeastern Minnesota: U.S. Geological Survey Open-File<br />
<strong>Report</strong> 84-554, 17 pp.<br />
Helgeson, H.G., 1968, Geologic and thermodynamic characteristics of the Salton Sea geothermal system:<br />
American Journal of Science, v. 266, p. 129-166.<br />
Henderson K.S., 1991, Cambro-Ordovician subsurface stratigraphy of the Black Warrior Basin in<br />
Mississippi: <strong>Report</strong> of Investigations 2, Mississippi Department of Environmental Quality, Office of<br />
Geology, Jackson, Mississippi. 51 pp.<br />
Hendrick, S.J., 1992, Vitrinite reflectance and deep Arbuckle maturation at Wilburton Field, Latimer<br />
County, Oklahoma, in Johnson, K.S., and Cardott, B.J., eds., Source Rocks in the Midcontinent,<br />
1990 Symposium: Oklahoma Geological Society Circular 93, p. 176-184.<br />
Hester, T.C., Schmoker, J.W., and Sahl, H.L., 1990, Log-derived regional source-rock characteristics of the<br />
Woodford Shale, Anadarko Basin, Oklahoma: U.S. Geological Survey Bulletin 1866-D.<br />
Higinbotham, L., 1986, Stratigraphy, depositional history and petrology of the Upper Cretaceous-Eocene,<br />
Montgomery Creek Formation, Northern California: Master of Science Thesis, Oregon State<br />
University, Corvallis.<br />
Hill, G.W., Jr., and Clark, R.H., 1980, The Anadarko Basin, a regional petroleum accumulation–a model for<br />
future exploration and development, in Young, R.C., ed., The Shale Shaker, Oklahoma City<br />
Geological Society, v. 31, no. 3, p. 238-251.<br />
Hinds, G.S., and Berg, R. R., 1990, Estimating organic maturity from well logs, Upper Cretaceous Austin<br />
Chalk, Texas Gulf Coast: Gulf Coast Association of Geological Societies Transactions, v. 40, p.<br />
295-300.<br />
Hite, D.M., 1997, A native corporation evaluates potential of Alaska's Kandik area: Oil and Gas Journal, v.<br />
95, no. 46, p. 89-93.<br />
Hite, R.J., Anders, D.E., and Ging, T.G., 1984, Organic-rich source rocks of Pennsylvanian age in the<br />
Paradox Basin of Utah and Colorado, in Hydrocarbon source rocks of the Greater Rocky Mountain<br />
Region, p.255 -274.<br />
Hite, R.J., and Buckner, D.H., 1981, Stratigraphic correlations, facies concepts, and cyclicity in<br />
Pennsylvanian rocks of the Paradox Basin, in Geology of the Paradox Basin: Rocky Mountain<br />
Association of Geologists, p. 147-159.<br />
Horn, B.W., and Curtis, J.B., 1996, Geological and engineering study of the natural gas potential of the<br />
Arkoma-Ouachita Basin, <strong>Final</strong> <strong>Report</strong>: GRI Contract No. 5092-800-2416, 60 pp.<br />
Houseknecht, D.W., and McGilvery, T.A., 1990, Red Oak Field, in Beaumont, E.A., and Foster, N.H.,<br />
Treatise of Petroleum Geology, Atlas of Oil & Gas Fields, Structural Traps II, Traps associated with<br />
tectonic faulting, p. 201-225.<br />
Hubert, J.F., Feshbach-Meriney, P.E., and Smith, M.A., 1992, The Triassic-Jurassic Hartford Rift Basin,<br />
Connecticut, and Massachusetts–evolution, sandstone diagenesis, and hydrocarbon history: American<br />
Association of Petroleum Geologists Bulletin, v. 76, no. 11, p. 1710-1734.<br />
Hucka, B.P., Sommer, S.N., and Tabet, D.E., 1997, Petrographic and physical characteristics of Utah coals:<br />
Utah Geological Survey Circular 94, p.53-58.<br />
Hogman, R.H., Springer, P.S. and Vidas, E.H., 1993, Chemical composition of discovered and<br />
undiscovered natural gas in the United States–1993 Update, Volume 2, Non-Associated Gas Data: Gas<br />
Research Institute, Topical <strong>Report</strong> 93-0456.2, December 1993.<br />
Hulen, J.B., Cloister, J.A., Dahdah, N.F., Wannamaker, P.E., and Quick, J.C., 1998, Hydrocarbons in<br />
Miocene lamproite dikes of the San Rafael desert, Utah–implications for fault-controlled oil migration<br />
and accumulation in the western Colorado Plateau: American Association of Petroleum Geologists<br />
Annual Convention, Salt Lake City.<br />
Imbus, S.W., Engel, M.H., and Elmore, R.D., 1990, Organic geochemistry and sedimentology of Middle<br />
Proterozoic Nonesuch Formation–hydrocarbon assessment of a lacustrine rift deposit, in B.J. Katz,<br />
ed., Lacustrine basin exploration: American Association of Petroleum Geologists Memoir 50, p. 197-<br />
208.
Imperato, D.P., Nilsen, T.H., and Moore, D.W., 1990, Regional stratigraphy of the mud-rich turbidite<br />
system of the Forbes Formation, Sacramento Basin, California, in Ingersoll, R.V., and Nilsen, T.H.,<br />
eds., Sacramento Valley Symposium and Guidebook: Societyof Economic Paleontologists and<br />
Mineralogists Book 65, p. 69-79.<br />
Jachens, R.C., and Moring, B.C., 1990, Maps of the thickness of Cenozoic deposits and the isostatic<br />
residual gravity over basement for Nevada: U.S. Geological Survey Open-File <strong>Report</strong> 90-404, 15 pp.<br />
Jackson, M.P.A., and Laubach, S.E., 1988, Cretaceous and Tertiary compressional tectonics as the cause of<br />
the Sabine Arch, east Texas and northwest Louisiana: Gulf Coast Association of Geological Societies<br />
Transactions, v. 38, p. 245-256.<br />
Johnson, R.C., and Finn, T.M., 1998, Is there a basin-centered gas accumulation in Upper Cretaceous rocks<br />
in the Big Horn basin? in Wyoming Geological Association 49th Field Conference Guidebook, p.<br />
257-273.<br />
Johnson, R.C., and Nuccio, V.F., 1993, Surface vitrinite reflectance study of the Uinta and Piceance basins<br />
and adjacent areas, eastern Utah and western Colorado–implications for the development of Laramide<br />
basins and uplifts: U.S. Geological Survey Bulletin 1787 DD.<br />
Johnson, V.G., Graham, D.L., and Reidel, S.P., 1993, Methane in Columbia River Basalt aquifers–isotopic<br />
and geohydrologic evidence for a deep coalbed gas source in the Columbia Basin, Washington:<br />
American Association of Petroleum Geologists Bulletin, v. 77, p. 1192-1207.<br />
Johnson, S.Y., Tennyson, M.E., Lingley, W.S., Jr., and Law, B.E., 1997, Petroleum Geology of the State<br />
of Washington: U.S. Geological Survey Professional Paper 1582, 40 pp.<br />
Johnsson, M.J., Howell, D.G., and Bird, K.J., 1993, Thermal maturity patterns in Alaska–implications for<br />
tectonic evolution and hydrocarbon potential: American Association of Petroleum Geologists<br />
Bulletin, v. 77, no. 11, p. 1874-1903.<br />
Kaiser, W.R., 1993, Abnormal pressure in coal basins of the western United States, in Proceedings of the<br />
1993 International Coalbed Methane Symposium: University of Alabama/Tuscaloosa, May 17-21,<br />
1993, p. 173-186.<br />
Kalliokoski, J., 1982, Jacobsville Sandstone, in Geology and Tectonics of the Lake Superior Basin:<br />
Geological Society of America Memoir 156, p. 147-155.<br />
Kaplan, S.S., and Skeen, R.C., 1985, North-south regional seismic profile of the Hanna Basin, Wyoming,<br />
in Gries, R.R., and Dyer, R.C., 1985, eds., Seismic Exploration of the Rocky Mountain region:<br />
Rocky Mountain Association of Geologists and Denver Geophysical Society, Denver, p. 219-224.<br />
Kehle, R.O., 1971, Origin of the Gulf of Mexico: University of Texas, Austin, Geological Library,<br />
unpublished manuscript, unpaged.<br />
Keighin, C.W., 1998, Depositional dip-oriented cross section through the Lower Silurian "Clinton" sands<br />
and Medina Group, northeast Ohio and western Pennsylvania: U.S. Geological Survey Open File<br />
<strong>Report</strong> 98-500.<br />
Keighin, C.W., and Law, B.E., 1984, Porosity, permeability, and diagenesis of surface samples of sandstone<br />
from the Hornbrook Formation, in Nilsen, T.H., ed., Geology of the Upper Cretaceous Hornbrook<br />
Formation, Oregon and California: Society of Economic Paleontologists and Mineralogists, Pacific<br />
Section, v. 42, p. 129-132.<br />
Keller, G.R., and Cather, S.M., 1994, Introduction–Basin of the Rio Grande Rift-Structure–Stratigraphy,<br />
and Tectonic Setting: Geological Society of America Special Paper 291, p. 1-3.<br />
Kelly, T.E., and Halbouty, M.T., 1966, Geological Characteristics in Cook Inlet Area, Alaska: Society of<br />
Petroleum Engineers Paper 1588, 11 pp.<br />
Kerr, D.K., and Kidwell, S.M., 1991, Late Cenozoic sedimentation and tectonics, western Salton Trough,<br />
California, in Walawender, M.J., and Hanan, B.B., eds., Geological Excursions in Southern<br />
California and Mexico: 1991 Geological Society of America Guidebook, p. 397-417.<br />
Kirschner, C.E., 1988, Sedimentary basins of onshore and continental shelf areas, Alaska: U.S. Geological<br />
Survey Miscellaneous Investigations Series Map I-1873, scale 1:2,500,000.<br />
Klemme, H.D., and Ulmishek, G.F., 1991, Effective petroleum source rocks of the world–stratigraphic<br />
distribution and controlling depositional factors: American Association of Petroleum Geologists<br />
Bulletin, v. 75, no. 12, p. 1809-1851.
Klitgord, K.D., and Behrendt, J.C., 1977, Mesozoic basin distribution along United States eastern<br />
continental margin: American Association of Petroleum Geologists Bulletin, v. 61, no. 5, p. 803-<br />
804.<br />
Kornbrath, R.W., Myers, M.D, and Krouskop, D.L, Meyer, J.F., Houle, J.A., Ryherd, T.J., and Richter,<br />
K.N., 1997, Petroleum Potential of the Eastern <strong>National</strong> Petroleum Reserve–Alaska: Alaska<br />
Department of Natural Resources, Division of Oil and Gas, 30 pp.<br />
Kosters, E.C., Bebout, D.G., Seni, S.G., Garrett, C.M., Jr., Brown, L.F., Jr., Hamlin, H.S., Dutton, S.P.,<br />
Ruppel, S.C., Finley, R.J., and Tyler, N., 1989, Atlas of major Texas gas reservoirs: Gas Research<br />
Institute and Bureau of Economic Geology, University of Texas, Austin, 161 pp.<br />
Kotra, R.K., Gottfried, R.M., Spiker, E.C., Romankiw, L.A. and Hatcher, P.G., 1988, Chemical<br />
composition and thermal maturity of kerogen and phytoclasts in the Hartford Basin of the Newark<br />
Supergroup, in Froelich, A.E., and Robinson, G.R., 1988, Studies of the early Mesozoic basins of<br />
eastern United States: United States Geological Survey Bulletin 1776, p. 68-74.<br />
Lamarre, R.A. and Burns, T.D., 1997, Drunkard’s Wash Unit–coalbed methane production from Ferron coals<br />
in east-central Utah, in Innovative Application of Petroleum <strong>Technology</strong> Guidebook 1997: Rocky<br />
Mountain Association of Geologists, p. 47-59.<br />
Lange, J.K., and Wellborn, R. E., 1985, Seismic profile, North Park Basin, in Gries, R.R., and Dyer, R.C.,<br />
eds., Seismic Exploration of the Rocky Mountain Region, p 240-245.<br />
Larsen, V.E., 1985, Geology and overview of coalbed methane resources and activity in the Raton Basin,<br />
Colorado and New Mexico, in Brandenburg, C.F., Schwochow, S.D., and Wicks, D.E., eds.,<br />
Quarterly Review of Methane from Coal Seams <strong>Technology</strong>: Gas Research Institute, v. 3, nos. 3 and<br />
4 (July-December 1985), p. 1-12.<br />
Law, B.E., Nuccio, V.F., and Barker, C.E., 1989, Kinky vitrinite reflectance well profiles–evidence of<br />
paleopore pressure in low-permeability, gas-bearing sequences in Rocky Mountain foreland basins:<br />
American Association of Petroleum Geologists Bulletin, v. 73, no. 8, p. 999-1010.<br />
Law, B.E., 1984, Relationships of source rock, thermal maturity, and overpressuring to gas generation and<br />
occurrence of low permeability Upper Cretaceous and Lower Tertiary rocks, greater Green River Basin,<br />
Wyoming, Colorado, and Utah, in Woodward, J., Meissner, F.F., Clayton, J.L., eds., Hydrocarbon<br />
source rocks of the Greater Rocky Mountain Region: Rocky Mountain Association of Geologists,<br />
Denver, p. 401-433.<br />
Law, B.E., Anders, D.E., & Nilsen, T.H., 1984, The petroleum source-rockpotential of the Upper<br />
Cretaceous Hornbrook Formation, north-central California and southwestern Oregon, in Nilsen, T.H.,<br />
ed., Geology of the Upper Cretaceous Hornbrook Formation, Oregon and California: Society of<br />
Economic Paleontologists and Mineralogists, Pacific Section, V. 42, p. 133-140.<br />
Lawton, T.E., 1985, Style and timing of frontal structures, Thrust Belt, central Utah: American Association<br />
of Petroleum Geologists Bulletin, v. 69, p. 1145-1159.<br />
Lawton, T.E., 1983, Late Cretaceous fluvial systems and the age of foreland uplifts in central Utah, in J.D.<br />
Lowell, ed., Rocky Mountain Foreland Basins and Uplifts: Rocky Mountain Association of<br />
Geologists, Denver.<br />
LeMay, W.J., 1972, Empire-Abo Field, southeast New Mexico, in King, R.E., ed., Stratigraphic Oil and<br />
Gas Fields–Classification, Exploration Methods, and Case Histories: American Association of<br />
Petroleum Geologists Memoir 16, p. 472-480.<br />
Lico, M.S. and Kharaka, Y.K., 1983, Subsurface Pressure and Temperature Distributions in Sacramento<br />
Basin, California in Hester, R.L. and Hallinger, D.E., eds., 1983, Selected Papers of the Pacific<br />
Section AAPG 1983 Annual Meeting, Sacramento, California, p. 57-75.<br />
Lillegraven, J.A., 1995, Nature, timing and paleogeographic consequences of Laramide deformation in the<br />
northeastern Hanna basin, Wyoming: American Association of Petroleum Geologists Bulletin, v. 79,<br />
no 6, p. 921.<br />
Lillie, R.J., Nelson, K.D., De Voogd, B., Brewer, J.A., Oliver, J.E., Brown, L.D., Kaufman, S., and Viele,<br />
G.W., 1983, Crustal structure of Ouachita Mountains, Arkansas–a model based on integration of<br />
COCORP reflection profiles and regional geophysical data: American Association of Petroleum<br />
Geologists Bulletin, v. 67, no. 6, p. 907-931.
Lingley, W.S., Jr., 1995, Petroleum potential and probability of renewed mineral-rights leasing in the<br />
Columbia Basin, Washington: Division of Geology and Earth Resources, Washington State<br />
Department of Natural Resources, August 22, 1995.<br />
Lippman, M.J. and Manon, A., 1987, The Cerro Prieto Geothermal Field: Geothermal Science and<br />
<strong>Technology</strong>, v. 1, p. 1-38.<br />
Lockridge, J.P., and Scholle, P.A., 1978, Niobrara gas in eastern Colorado and northwestern Kansas, in<br />
Pruett, J.D., and Coffin, P.E., eds., <strong>Energy</strong> Resources of the Denver Basin: Rocky Mountain<br />
Association of Geologists, p. 35-49.<br />
Lonsdale, P., 1989, Geology and tectonic history of the Gulf of California, in Winterer. E.L., Hussong,<br />
D.M., and Decker, R.W., eds., The Geology of North America, vol. N–The Eastern Pacific and<br />
Hawaii, p. 499-522.<br />
Lucas, P.T., and Drexler, J.M., 1976, Altamont-Bluebell, a major, naturally fractured stratigraphic trap,<br />
Uinta Basin, Utah, in North American Oil and Gas Fields: American Association of Petroleum<br />
Geologists Memoir 24, p. 121-135.<br />
Lucchitta, I., 1972, Early History of the Colorado River in the Basin and Range Province: Geological<br />
Society of America Bulletin, v. 83, p. 1933-1948.<br />
Lyday, J.R., 1990, Berlin Field, Anadarko Basin, Oklahoma, in Beaumont, E.A., and Foster, N.H., eds.,<br />
Treatise of Petroleum Geology, Atlas of Oil and Gas Fields: American Association of Petroleum<br />
Geologists, p. 39-68.<br />
Magoon, L.B., Valin, Z.C., and Reid, R.A., 1996, Characterization of gas fields by petroleum system,<br />
Sacramento Basin, California: American Association of Petroleum Geologists Annual Conference<br />
(San Diego, 5/19-22/96) Paper Abstracts, p. A88.<br />
Magoon, L.B., Molenaar, C.M, Bruns, T.R., Fisher, M.A., and Valin, C.Z., 1996, Region 1, Alaska,<br />
Geologic Framework, in Gauthier, D.L., Dolton, G.L., Takahashi, K.I., and Varnes, K.L., eds., 1995<br />
<strong>National</strong> Assessment of United States Oil and Gas Resources–Results, Methodology, and Supporting<br />
Data, U.S. Geological Survey Digital Data Series DDS-30, Release 2, p. 1-14.<br />
Magoon, L.B., 1994, Tuxedni-Hemlock Petroleum System in Cook Inlet, Alaska, United States: American<br />
Association of Petroleum Geologists Memoir 60, p. 359-370<br />
Magoon, L.B., 1993, Alaska Interior (062), Kandik (Part) (061), Interior Lowlands (063), and Copper River<br />
basin (066) provinces, in Powers, R.B., ed., U.S. Geological Survey Bulletin 2034-A, p. 38-45.<br />
Magoon, L.B., and Kirschner, C.E., 1990, Alaska Onshore <strong>National</strong> Assessment Program–Geology and<br />
Petroleum Resource Potential of Six Onshore Alaska Provinces: U.S. Geological Survey Open-File<br />
<strong>Report</strong> 88-450T, 47 pp.<br />
Magoon, L.B., and Isaacs, C.M., 1983, Chemical characteristics of some crude oils from the Santa Maria<br />
basin in California, in Isaacs, C.M., and Garrison, R.E., eds, Petroleum generation and occupance in<br />
the Miocene Monterey Formation, California: Society of Economic Paleontologists and<br />
Mineralogists, Pacific Section, Special Publication, p. 201-211.<br />
Magoon, L.B., 1976, Hydrocarbon potential, geological hazards and infrastructure for exploration and<br />
development of lower Cook Inlet: U. S. Geological Survey Open-File <strong>Report</strong> 76-449.<br />
Mallory, W.E., 1977, Fractured shale hydrocarbon reservoirs in southern Rocky Mountain basins, in Veal,<br />
H.K., ed., Exploration Frontiers of the Central and Southern Rockies: Rocky Mountain Association<br />
of Geologists 1977 Symposium, p. 89-94.<br />
Mancini, E.A., Bearden, B.L., Holmes, J.W., and Shepard, B.K., 1983, Geology of Alabama's Black<br />
Warrior Basin: Oil and Gas Journal, v.81, no. 3, p. 147-154.<br />
Matson, R.M., 1984a, Geology and petroleum potential of Hanna Basin, Carbon County, Wyoming:<br />
American Association of Petroleum Geologists Bulletin, v. 68, no. 4, p. 504.<br />
Matson, R.M., 1984b, Geology and petroleum potential of Hanna Basin, Carbon County, Wyoming: Earth<br />
Science Bulletin, v. 17, p.105.<br />
Maughan, E.K., 1989, Hydrocarbon exploration plays in the Colorado Park Basin Province, in Lorenz, J.C.,<br />
and Lucas, S.G., eds., <strong>Energy</strong> Frontiers in the Rockies, p. 79-83.<br />
Maughan, E.K., 1988, Geology and petroleum potential, Colorado Park Basin Province, north-central<br />
Colorado: U.S. Geological Survey Open-File <strong>Report</strong> 88-450E, 46 pp.<br />
McCaslin, J.C., 1978, Quiet Wyoming basin hosts new wildcatting: Oil and Gas Journal, v. 76, no. 16, p.<br />
153.
McCoy, A.W., 1953, Tectonic History of Denver Basin: American Association of Petroleum Geologists<br />
Bulletin, v. 37, no. 8, p. 1873-1893.<br />
McGookey, D.P., Haun, J.D., Hale, L.A., Goodell, H.G., McCubbin, D.G., Weimer, R.J., and Wulf,<br />
G.R., 1972, Cretaceous System, in Geologic Atlas of the Rocky Mountain Region, United States of<br />
America: Rocky Mountain Association of Geologists, p. 190-228.<br />
Meissner, F.F., 1978, Petroleum geology of the Bakken Formation, Williston Basin, North Dakota and<br />
Montana, in Estelle, D., and Miller, R., The Economic Geology of the Williston Basin, 1978<br />
Williston Basin Symposium: Montana Geological Society, 24th Annual Conference, p. 207-227.<br />
Meissner, J.W., and Clayton, J.L., 1984, Stratigraphic relationships and distribution of source rocks in the<br />
greater Rocky Mountain region, in Woodward, J., Meissner, F.F. and Clayton, J.L., eds.,<br />
Hydrocarbon Source Rocks of the Greater Rocky Mountain Region: Rocky Mountain Association of<br />
Geologists, p. 1-34.<br />
Milton, J.D., Edwards, E.B., Heck, R.G., Ogle, B.A., Shareghi, E.A., 1996, Geology of the undeveloped<br />
oil and gas fields of central offshore Santa Maria Basin, California: American Association of<br />
Petroleum Geologists, San Diego, Abstracts p. A99.<br />
Mitchell, S.D., 1968, Geology and occurrence of natural gas in Laramie and Hanna basins, Wyoming: in<br />
Natural Gases of North America, Part 2: American Association of Petroleum Geologists Memoir 1,<br />
p. 828-839.<br />
Molenaar, C.M., 1996, Albuquerque-Santa Fe Rift, in Gautier, D.L., Dolton, G.L., Takahashi, K.I., and<br />
Varnes, K.L., eds., 1995 <strong>National</strong> Assessment of United States Oil and Gas Resources–Results,<br />
Methodology, and Supporting Data: U.S. Geological Survey Digital Data Series 30 [CD-ROM], p. 1-<br />
19.<br />
Montgomery, S., 1992, Paradox Basin, Cane Creek Play: Petroleum Frontiers, v. 9, no. 1. 66 pp.<br />
Montgomery, S.L., 1996, Cotton Valley Pinnacle Reef Play, Branton Field–E & P Notes: American<br />
Association of Petroleum Geologists Bulletin, v. 80, no. 5, p. 617-629.<br />
Montgomery, S.L., 1995, Louisiana Austin Chalk: Petroleum Frontiers, v. 12, no. 3, 67 pp.<br />
Montgomery, S.L., 1990a, Horizontal drilling in the Austin Chalk, Part 1–geology, drilling history, and<br />
field rules: Petroleum Frontiers, v. 7, no. 3, 44 pp.<br />
Montgomery, S.L., 1990b, Horizontal Drilling in the Austin Chalk, Part 2–Patterns of Production:<br />
Petroleum Frontiers, v. 7, no.4, 58 pp.<br />
Montgomery, S.L., 1988, Modoc Plateau–a question of origins, in Cheney, T.W., ed., Petroleum Frontiers:<br />
Petroleum Information Corp., v. 5, no. 4, 41 pp.<br />
Montgomery, S.L., 1988, Nevada, the next great awakening? Part 1–comprehending the complexities, in<br />
Leonard, A. E., ed., Petroleum Frontiers: Petroleum Information Corp., v. 5, no. 1, 74 pp.<br />
Montgomery, S.L., 1988, Sacramento Basin, a second look: Petroleum Information Corp., Petroleum<br />
Frontiers, v.5, n. 3, 60 pp.<br />
Morel, J. and Watkins, T., 1997, More Data Point to Potential in Southern Colorado Sub-Basin: Oil and<br />
Gas Journal, v. 95, no. 35, p. 78-80.<br />
Morgan, C.D., 1992, "Cane Creek " Exploration Play Area, Emery, Grand, and San JuanCounties: Utah<br />
Geological Survey Open-File <strong>Report</strong> 232.<br />
Moritis, G., 1995, Giddings Austin Chalk Enters Lean Gas Phase: Oil and Gas Journal, v. 93, no. 52, p.<br />
87-88.<br />
Mueller, K.J. and Rockwell, T.K., 1991, Late Quaternary dtructural rvolution of the western margin of the<br />
Sierra Cucapa, northern Baja California, in Dauphin, J.P., and Simoneit, B.R., eds., American<br />
Association of Petroleum Geologists Memoir 47, p. 249-260.<br />
Muffler, L.J. and Doe, B.R., 1968, Composition and Mean Age of Detritus of the Colorado River Delta in<br />
the Salton Trough, Southeastern California: Journal of Sedimentary Petrology, v. 38, no. 2, p. 384-<br />
399.<br />
Mull, C.G., and Harris, E.E., 1999, Western Arctic <strong>Energy</strong> Project (Tingmerkpuk): Alaska Geological<br />
Survey, Information flyer for the 1999 AAPG annual meeting, 2 pp.<br />
Nehring, N.L. and D’Amore, F., 1981, Gas chemistry and thermometry of the Cerro Prieto geothermal field:<br />
in Proceedings, Third Symposium on the Cerro Prieto Geothermal Field, Baja California, Mexico,<br />
LBL-11967, p. 178-184.
Neuhauser, K.R., 1988, Sevier-age ramp-style thrust faults at Cedar Mountain, northwestern San Rafael<br />
swell (Colorado Plateau), Emery County, Utah: Geology, v. 16, p. 299-302.<br />
Newell, K.D., 1999, Personal communication.<br />
Newell, K.D., Burruss, R.C., and Palacas, J.G., 1993, Thermal maturation and organic richness of potential<br />
petroleum source rocks in Proterozoic Rice Formation, North American Mid-Continent Rift System,<br />
northeastern Kansas: American Association of Petroleum Geologists Bulletin, v. 77, no. 11, p. 1922-<br />
1941.<br />
Newell, K.D., Lambert, M., and Berendsen, P., 1988, Oil and gas shows in the Salina basin: Kansas<br />
Geological Survey Subsurface Geology 10, 36 pp.<br />
Nilsen, T.H., 1984a, Introduction to Field Trip, in Nilsen, T.H., ed., 1984, Geology of the Upper<br />
Cretaceous Hornbrook Formation, Oregon and California: Society of Economic Paleontologists and<br />
Mineralogists, Pacific Section, v. 42, p. 1-7.<br />
Nilsen, T.H., 1984b, Stratigraphy, sedimentology and tectonic framework of the Upper Cretaceous<br />
Hornbrook Formation, Oregon and California, in Nilsen, T.H., ed., 1984, Geology of the Upper<br />
Cretaceous Hornbrook Formation, Oregon and California: Society of Economic Paleontologists and<br />
Mineralogists, Pacific Section, v. 42, p. 51-88.<br />
Noble, R.A., Kaldi, J.G., and Atkinson, C.D., 1997, Oil saturation in shales–applications in seal<br />
evaluation: American Association of Petroleum Geologists Memoir, no. 67, p. 13-29.<br />
Noe, D.C., 1993, Dakota Sandstone, Cedar Mountain Formation and Morrison Formation, in Atlas of<br />
Major Rocky Mountain Gas Reservoirs: New Mexico Bureau of Mines and Mineral Resources,<br />
Socorro, p. 101-102.<br />
Nuccio, V.F., and Johnson, R.C., 1988, Surface vitrinite reflectance map of the Uinta, Piceance and Eagle<br />
Basins area, Utah and Colorado: U.S. Geological Survey Miscellaneous Field Studies, Map MF 2008-<br />
B.<br />
Nydegger, G.L., 1999, Personal communication, Gary L. Nydegger and Associates.<br />
Palacas, J.G., 1995, Superior Province (051), in Gautier, D.L., Dolton, G.L., Takahashi, K.I., and Varnes,<br />
K.L., eds., 1995 <strong>National</strong> Assessment of United States Oil and Gas Resources–Results,<br />
Methodology, and Supporting Data: U.S. Geological Survey Digital Data Series 30, Release 2, CD-<br />
ROM.<br />
Palacas, J.G., 1992, Source-rock potential of Precambrian rocks in selected basinsof the U.S., in, Dyman,<br />
T.S., ed., Geologic controls and resource potential of naturalgas in deep sedimentary basins in the<br />
United States, p. 161 - 172.<br />
Patton, W.W., 1971, Petroleum possibilities of Yukon-Koyukuk province, Alaska, in Cram, I.H., ed.,<br />
Future petroleum provinces of the United States–their geology and potential: American Association of<br />
Petroleum Geologists Memoir 15, p. 100-104.<br />
Paul, S.E., Netzler, B.W., Woltz, D., Coubrough, R., Peters, R., Gordon, D.L., and Mosler, J.M., 1985,<br />
Oil, and gas developments in north Mid-Continent in 1984: American Association of Petroleum<br />
Geologists Bulletin, v. 69, p. 1548-1558.<br />
Perry, W.J., Jr., and Flores, R.M., 1997, Sequential Laramide deformation and Paleocene depositional<br />
patterns in deep gas-prone basins of the Rocky Mountain region, in Geologic controls of deep natural<br />
gas resources in the United States: U.S. Geological Survey Bulletin 2146, p. 49-59.<br />
Perry, W.J. Jr., 1992, Deep gas prone basins of the Rocky Mountain Region, in Dyman, T.D., ed., Deep<br />
gas prone basins of the Rocky Mountain Region: U.S Geological Survey Open-File <strong>Report</strong> 92-052,<br />
p. 148-160.<br />
Perry, W.J., 1989, Tectonic Evolution of the Anadarko Basin Region, Oklahoma: U.S. Geological Survey<br />
Bulletin 1866-A.<br />
Peterson, F., 1969, Cretaceous sedimentation and tectonism in the southeastern Kaiparowits region, Utah:<br />
U.S. Geological Survey Open-File <strong>Report</strong>, 259 pp.<br />
Peterson, J.A., 1996, Idaho-Snake River Downwarp Province (017), in Gautier, D.L., Dolton, G.L.,<br />
Takahashi, K.I., and Varnes, K.L., eds, 1995 <strong>National</strong> Assessment of United States Oil and Gas<br />
Resources–Results, Methodology, and Supporting Data: U. S. Geological Survey Digital Data Series<br />
DDS-30.
Peterson, J.A., 1994, Regional paleogeologic and paleogeographic maps of the Mesozoic Systems, Rocky<br />
Mountain Region, U.S., in Mesozoic Systems of the Rocky Mountain Region, U.S.A.: Society of<br />
Economic Paleontologists and Mineralogists, Rocky Mountain Section, Denver, p. 65-72.<br />
Peterson, J.A., 1989, Geology and petroleum resources , Paradox Basin Province: U.S. Geological Survey<br />
Open-File <strong>Report</strong>, 8-450U, 69 pp.<br />
Peterson, J.A., 1988, Eastern Great Basin and Snake River Downwarp, geology and petroleum resources:<br />
U.S. Geological Survey Open-File <strong>Report</strong> 88-450-H, 57 pp.<br />
Peterson, J.A., 1966, Sedimentary history of the Sweetgrass Arch, in Cox, J.E., ed., Jurassic and Cretaceous<br />
Stratigraphic Traps Sweetgrass Arch: Billings Geological Society 7th Annual Field Conference<br />
Guidebook, p. 112-133.<br />
Petroleum Information Corp., 1998, Production <strong>Report</strong>, June 1998.<br />
Petroleum Information Corp., 1986, The Black Warrior Basin proving the potential of the Southeast:<br />
Petroleum Frontiers , Petroleum Information Corporation Quarterly, v. 3, no. 3, 62 pp.<br />
Petroleum Information Corp., 1983, Pecos Slope Abo Red Beds–shallow target for New Mexico Gas:<br />
Petroleum Frontiers, v. 1, p 35-59.<br />
Petzet, A.G., 1991, Ohio operators setting sights on objectives in Cambrian, Ordovician: Oil and Gas<br />
Journal, v. 89, no. 5, p. 58-59.<br />
Pollastro, R.M., 1999, Personal communication, U. S. Geological Survey, Lakewood, Colorado.<br />
Pollastro, R.M., and Martinez, C.J., 1985, Mineral, chemical, and textural relationships in rhythmic-bedded,<br />
hydrocarbon-productive chalk of the Niobrara Formation, Denver Basin, Colorado: The Mountain<br />
Geologist, v. 22, no. 2 (April, 1985), p. 55-63.<br />
Pontolillo, J., and Stanton, R.W., 1994, Vitrinite reflectance variation in Paleocene and Eocenecoals of the<br />
Powder River, Williston, Hanna , Bighorn, and Bull Mountain basins, U.S.A., in Pontolillo, J., ed.,<br />
Eleventh Annual Meeting of the Society for Organic Petrology, Abstracts and Programs, Jackson,<br />
Wyoming. v. 11, p 82-84.<br />
Poole, F.G., and Claypool, G.E., 1984, Petroleum source-rock potential and crude-oil correlation in the<br />
Great Basin, in Woodward, J., Meissner, F.F. and Clayton, J.L., eds., Hydrocarbon Source Rocks of<br />
the Greater Rocky Mountain Region: Rocky Mountain Association of Geologists.<br />
Porter, L.A., 1979a, Laramie-Hanna-Shirley basins–future petroleum potential: American Association of<br />
Petroleum Geologists Bulletin, v. 63, no. 5, p. 838.<br />
Porter, L.A., 1979b, State of the art techniques used in Laramie, Hanna, and Shirley basins: Oil and Gas<br />
Journal, v. 77, no. 40, p. 118-126.<br />
Pratt, L.M., Summons, R.E., and Hieshima, G.B., 1991, Sterane and triterpane biomarkers in the<br />
Precambrian Nonesuch Formation, North American Mid-Continent Rift: Geochimica et<br />
Cosmochimica Acta, v. 55, p. 911-916.<br />
Pyron, A.J., 1998, Mesozoic basins of eastern North America–exploration target whose time has come: Oil<br />
and Gas Journal, v. 96, no. 29, p. 94-98.<br />
Ramondetta, P.J., 1982, Genesis and emplacement of oil in the San Andres Formation, northern shelf of the<br />
Midland Basin, Texas: University of Texas, Austin, Bureau of Economic Geology, <strong>Report</strong> of<br />
Investigations 116, 39 pp.<br />
Reynolds, M.W., Palacas, J.G., and Elston, D.P., 1988, Potential petroleum source rocks in the Late<br />
Proterozoic Chuar Group, Grand Canyon, Arizona (abstract), in Carter, L.M.H., ed., V.E. McKelvey<br />
Forum on Mineral and <strong>Energy</strong> Resources: U.S. Geological Survey Circular 1025, p. 49-50.<br />
Rice, D.D., 1984, Relation of hydrocarbon occurrence to thermal maturity of organic matter in the Upper<br />
Cretaceous Niobrara Formation, Eastern Denver Basin–evidence of biogenic versus thermogenic origin<br />
of hydrocarbons, in Woodward, Meissner, F.F. and Clayton, J.L., eds., Hydrocarbon Source Rocks of<br />
the Greater Rocky Mountain Region: Rocky Mountain Association of Geologists, 1984, p. 365-368.<br />
Robison, C.R., 1997, Hydrocarbon source rock variablity within the Austin Chalk and Eagle Ford Shale<br />
(Upper Cretaceous), east Texas, U.S.A.: International Journal of Coal Geology, v. 34, no. 3-4, p.<br />
287-305.<br />
Roth, E.E., 1964, Natural gases of Appalachian Basin, in Beebe, B.W., and Curtis, B.F., 1968, Natural<br />
Gases of North America Part 3, Vol. 2–Natural Gases and Rocks of Paleozoic Age: American<br />
Association of Petroleum Geologists Memoir 9, p. 1702-1715.
Royse, F., 1996, Detachment fold trains, Reed Wash area, west flank San Rafael Swell, Utah: Mountain<br />
Geology, v. 33, p. 45-64.<br />
Russel, L.R., and Snelson, S., 1994, Structure and tectonics of the Albuquerque Basin segment of the Rio<br />
Grande Rift–insights from reflection seismic data: Geological Society of America Special Paper 291,<br />
p. 83-111.<br />
Ryder, R.T., Burruss R.C., and Hatch J.R., 1998, Black shale source eocks and oil generation in the<br />
Cambrian and Ordovician of the central Appalachian Basin, U.S.A.: American Association of<br />
Petroleum Geologists Bulletin, v. 82, no. 3., p. 412-439.<br />
Ryder, R.T., 1998, Characteristic of discrete and basin-centered parts of the Lower Silurian regional oil and<br />
gas accumulation, Appalachian Basin: U.S. Geological Survey Open-File report 98-216, 71 pp.<br />
Ryder, R.T., Kerry, A.L., Hettinger, R.D., Law, B.E., Miller, J.J., Nuccio, V.T., Perry, W.J., Prensky,<br />
S.E., SanFilipo, J.R., and Wandrey, C.J., 1996, Possible continuous-type (unconventional) gas<br />
accumulation in the Lower Silurian "Clinton" sands, Medina Group, and Tuscarora Sandstone in the<br />
Appalachian Basin–a progress report of 1995 project activities: U.S. Geological Survey Open-File<br />
<strong>Report</strong> 96-42, 82 pp.<br />
Ryder, R.T., SanFilipo, J.R., Hettinger, R.D., Keighin, C.W., Law, B.E., Nuccio, V.T., Perry, .J., and<br />
Wandrey, C.J., 1995, Continuous-type (basin-centered) gas accumulation in the Lower Silurian<br />
"Clinton" sands, Medina Group, and Tuscarora Sandstone in the Appalachian Basin: American<br />
Association of Petroleum Geologists Bulletin, v. 80, no. 9, p. 531.<br />
Ryder, R.T., 1995 Appalachian basin province (067), in Gautier, D.L., Dolton, G.L., Takahashi, K.I., and<br />
Varnes, K.L., eds., 1995 <strong>National</strong> Assessment of United States Oil and Gas Resources–Results,<br />
Methodology, and Supporting Data: U.S. Geological Survey Digital Data Series DDS-30, 144 pp.,<br />
28 figs.<br />
Ryder, R.T., 1994, Black Warrior Basin, in Powers, R.B., ed., Petroleum exploration plays and resource<br />
estimates, 1989, onshore United States–Region 8, Eastern Interior; Region 9, Atlantic Coast: U.S.<br />
Geological Survey Open-File <strong>Report</strong> 94-211, p. 62-66.<br />
Ryer, T.A. and McPhillips, M., 1983, Early Cretaceous paleogeography of east-central Utah, Mesozoic<br />
paleogeography of the west-central United States: Rocky Mountain Paleography Symposium 2:<br />
Society of Economic Paleontologists and Mineralogists, Rocky Mountain Section, p. 253-272.<br />
Saucier, A.E., 1985, Geologic framework of the Travis Peak (Hosston) Formation of east Texas and north<br />
Louisiana, in Finley, R.J., et al., The Travis Peak (Hosston) Formation–geologic framework, core<br />
studies, and engineering field analysis: University of Texas, Austin, <strong>Report</strong> to the Gas Research<br />
Institute by the Bureau of Economic Geology, Contract No. 5082-211-0708, 230 pages.<br />
Saucier, A.E., 1984, The Gibsland salt stock family in northwestern Louisiana: Gulf Coast Association of<br />
Geological Societies Transactions, v. 34, p. 401-410.<br />
Savant Resources, LLC., 1999, South Park prospect–reentry of the Hunt Tarryall Federal #1-17, 56 p.<br />
Schenk, C.J., and Viger, R.J., 1996, East Texas basin and Mississippi-Louisiana salt basins provinces,<br />
Region 6–Gulf Coast geologic framework, in Gauthier, D.L., Dolton, G.L., Takahashi, K.I., and<br />
Varnes, K.L., eds., 1995 <strong>National</strong> Assessment of United States Oil and Gas Resources–Results,<br />
Methodology, and Supporting Data: U.S. Geological Survey Digital Data Series DDS-30, Release 2,<br />
p. 1-95.<br />
Schmidt, N., 1990, Plate tectonics and the Gulf of California region: Arizona Geology, v. 20, no. 2, p. 1-4.<br />
Schmoker, J.W., 1995, Method for assessing continuous-type (unconventional) hydrocarbon accumulations,<br />
in Gautier, D.L., Dolton, G.L., Takahashi, K.I., and Varnes, K.L., eds., 1995 <strong>National</strong> Assessment<br />
of United States Oil and Gas Resources–Results, Methodology, and Supporting Data: U.S.<br />
Geological Survey Digital Data Series DDS-30 [CD-ROM].<br />
Schmoker, J.W., and Oscarson, S.A., 1995, Descriptions of continuous-type (unconventional) plays of the<br />
U.S. Geological Survey 1995 <strong>National</strong> Assessment of United States Oil and Gas Resources: U.S.<br />
Geological Survey Open File <strong>Report</strong> 95-75B, p. 14.<br />
Schultz, A.P., 1988, Hydrocarbon potential of eastern Mesozoic basins: U.S. Geological Survey Open-File<br />
<strong>Report</strong> 88-299, 15 pp.<br />
Schumaker, R.C. 1996., Structural history of the Appalachian Basin, in Roen J.B., and Walker B.J., Atlas<br />
of Major Appalachian Gas Plays: West Virginia Geological and Economical Survey Publication v.<br />
25, p. 8-23.
Scott, R.W., 1966, New Precambrian(?) formation in Kansas: American Association of Petroleum<br />
Geologists Bulletin, v. 50, p. 380-384.<br />
Sedivy, R.A., Penfield, I.E., and Halpern, H.I., 1987, Investigation of source rock-crude oil relationships in<br />
the northern Alaska hydrocarbon habitat; in Tailleur, I., and Weimer, P., eds., Alaska North Slope<br />
Geology, Vol. 1: Society of Economic Paleontologists and Mineralogists, Pacific Section, p. 169 –<br />
179.<br />
Senftle, J.T., and Landis, C.R., 1991, Vitrinite reflectance as a tool to assess thermal maturity, in Merrill,<br />
R.K., ed., Source and Migration Processes and Evaluation Techniques, Treatise of Petroleum<br />
Geology, Handbook of Petroleum Geology: American Association Petroleum Geologists, p. 119-125.<br />
Shelton, J.W., 1968, Role of contemporaneous faulting during basin subsidence: American Association of<br />
Petroleum Geologists Bulletin, v. 52, no 3, p. 399-413.<br />
Smagala, T.M., Brown, C.A., and Nydegger, G.L., 1984, Log-derived indicator of thermal maturity,<br />
Niobrara Formation, Denver Basin, Colorado, Nebraska, Wyoming, in Woodward, J., Meissner, F.F.<br />
and Clayton, J.L., eds., Hydrocarbon Source Rocks of the Greater Rocky Mountain Region: Rocky<br />
Mountain Association of Geologists, p. 355-363.<br />
Smith, J.T., 1991, Cenozoic marine mollusks and paleogeography of the Gulf of California, in Dauphin,<br />
J.P. and Simoneit, B.R. eds., American Association of Petroleum Geologists Memoir 47, p. 637-<br />
666.<br />
Smith, T.N., 1995, Coalbed methane potential for Alaska and drilling results for the upper Cook Inlet<br />
Basin, in The International Unconventional Gas Symposium, May 14-20, 1995: University of<br />
Alabama, Tuscaloosa, p. 1-21.<br />
Spieker, E.M., 1946, Late Mesozoic and early Cenozoic history of central Utah: U.S. Geological Survey<br />
Professional Paper 205-D, p. 117-161.<br />
Spencer, C.W., 1996, Uinta-Piceance Basin Province (020), in <strong>National</strong> Assessment of the United States Oil<br />
and Gas Resources, Digital Data Series DDS-30, U.S.G.S.<br />
Spencer, C.W., 1987, Hydrocarbon generation as a mechanism for overpressuring in Rocky Mountain<br />
region: American Association of Petroleum Geologists Bulletin, v. 71, no 4, p. 368-388.<br />
Sprinkel, D.A., Castano, J.R., and Roth, G.W., 1997, Emerging plays in central Utah based on a regional<br />
geochemical, structural and stratigraphic evaluation (abstract): American Association of Petroleum<br />
Geologists Annual Convention, Dallas, p. A-110.<br />
Stanley, R.G., 1996, Region 1–Central Alaska Province (002), in Gauthier, D.L., Dolton, G.L., Takahashi,<br />
K.I., and Varnes, K.L., eds., 1995 <strong>National</strong> Assessment of United States Oil and Gas Resources–<br />
Results, Methodology, and Supporting Data: U.S. Geological Survey Digital Data Series DDS-30,<br />
Release 2, p. 1-31.<br />
Stanley, R.G., McLean, H., and Pawlewicz, M.J., 1990, Petroleum source potential and thermal maturity of<br />
the Tertiary Usibelli group of Suntrana, central Alaska: U.S. Geological Survey Bulletin 1946, p. 65-<br />
76.<br />
Stapp, W.L., 1977, The geology of fractured Austin and Buda Formations in the subsurface of south Texas:<br />
Gulf Coast Association of Geological Societies Transactions, v. 27, p. 208-229.<br />
Stark, H.W., 1972, Future petroleum possibilities of the Los Angeles Basin, in Pacific Coast Geology<br />
Basis for New Exploration: American Association of Petroleum Geologists, Society of Exploration<br />
Geophysicists, Society of Economic Paleontologists and Mineralogists, Technical Program Reprints,<br />
47th Annual Meeting, March 1972, Bakersfield, 7 pp.<br />
Suarez-V.F., Armijo, R., Morgan, G., Bodin, P., and Gastil, R.G., 1991, Framework of recent and active<br />
faulting in northern Baja California, in Dauphin, J.P. and Simoneit, B.R. eds., American Association<br />
of Petroleum Geologists Memoir 47, p. 285-300.<br />
Surdham, R.C., 1995, Gas reservoir sweet-spot detection and delineation in Rocky Mountain Laramide<br />
Basins: Gas Research Institute GRI-95/0443.<br />
Tennyson, M.E., 1996, Santa Maria Basin province, in Gautier, D.L., Dolton, G.L., Takahashi, K.I., and<br />
Varnes, K.L., eds., 1995 <strong>National</strong> Assessment of United States Oil and Gas Resources–Results,<br />
Methodology, and Supporting Data: U.S. Geological Survey Digital Data Series DDS-30, 144 p., 28<br />
figs.
Tennyson, M.E., 1995, Eastern Washington-Oregon Province, in Gautier, D.L., Dolton, G.L., Takahashi,<br />
K.I., and Varnes, K.L., eds., 1995 <strong>National</strong> Assessment of United States Oil and Gas Resources–<br />
Results, Methodology, and Supporting Data: U.S. Geological Survey Digital Data Series 30, Release<br />
2, CD-ROM.<br />
Tissot, B.P. and Welte, D.H., 1984, Petroleum Formation and Occurrence–A New Approach to Oil and Gas<br />
Exploration: Springer-Verlag, Berlin, 538 pp.<br />
Tripp, C.N., 1993, Clear Creek Oil and Gas Field of Utah: Utah Geological Association Publication 22, 5<br />
pp.<br />
Tripp, C.N., 1993, Ferron Oil and Gas Field of Utah: Utah Geological Association Publication 22, 6 pp.<br />
Tripp, C.N., 1993, Flat Canyon Oil and Gas Field of Utah: Utah Geological Association Publication 22, 2<br />
pp.<br />
Tripp, C.N., 1991, Ferron Oil and Gas Field, Emery County, Utah–Geology of East-Central Utah: Utah<br />
Geological Association Publication 19, p. 265-272.<br />
Tripp, C.N., 1991, Wasatch Plateau Oil and Gas Fields, Carbon, Emery, and Sanpete Counties, Utah–<br />
Geology of East-Central Utah: Utah Geological Association Publication 19, p. 255-272.<br />
Tripp, C.N., 1990, Wasatch Plateau Oil and Gas Fields: Utah Geological and Mineral Survey Open-File<br />
<strong>Report</strong> 192, 33 pp.<br />
Tripp, C.N., 1989, A hydrocarbon exploration model for the Cretaceous Ferron Sandstone Member of the<br />
Mancos Shale, and the Dakota Group in the Wasatch Plateau and Castle Valley of east-central Utah,<br />
with emphasis on Post-1980 subsurface data: Utah Geological and Mineral Survey Open-File <strong>Report</strong><br />
160, 81 pp.<br />
Tryhorn, A.D., and Ojakangas, R.W., 1972, Sedimentation and petrology of the Upper Precambrian<br />
Hinckley Sandstone of east-central Minnesota–a centennial volume: Minnesota Geological Survey, p.<br />
431-435.<br />
Tye, R.S., 1989, Stratigraphy and depositional systems of the Lower Cretaceous Travis Peak formation,<br />
East Texas basin: University of Texas, Austin, Bureau of Economic Geology, report prepared for Gas<br />
Research Institute under Contract No. 5082-211-0708.<br />
United States Geological Survey, 1996, <strong>National</strong> Assessment of United States Oil and Gas Resources,<br />
Digital Data Series DDS-30, Gautier, D.L., Dolton, G.L., Takahashi, K.I., and Varnes, K.L., editors.<br />
United States Geological Survey <strong>National</strong> Oil and Gas Resource Assessment Team, 1995, 1995 <strong>National</strong><br />
Assessment of United States Oil and Gas Resources: U.S. Geological Survey Circular 1118, 20 pp.<br />
Wagner, H.C., 1966, Petroleum and natural gas, in Mineral and Water Resources of Washington: U.S.<br />
Geological Survey, Washington Department of Conservation Division of Mines and Geology, and<br />
U.S. Bueau of Reclamation, [report prepared for United States Senate Committee on Interior and<br />
Insular Affairs], p. 287-308.<br />
Walsh, T.J., and Lingley, W.S., Jr., 1991, Coal Maturation and The Natural Gas Potential of Western and<br />
Central Washington: Washington Division of Geology and Earth Resources, Open-File <strong>Report</strong> 91-2,<br />
26 pp.<br />
Walters, R.F., 1953, Oil production from fractured Pre-Cambrian basement rocks in central Kansas:<br />
American Association of Petroleum Geologists Bulletin, v. 37, p. 300-313.<br />
Wandrey, C.J., Ryder, R.T., Nuccio, V.T., and Aggen, K.L., 1997, The areal extent of continuous type gas<br />
accumulations in Lower Silurian Clinton sands and Medina Group sandstones of the Appalachian<br />
Basin and the environments affected by their development: U.S. Geological Survey Open-File <strong>Report</strong><br />
97-272, 12 pp.<br />
Warner, M.M., 1981, Cenozoic markerbeds of southern Idaho, in Tucker, T.E., ed, Field Conference and<br />
Symposium Guidebook, Southwest Montana: Montana Geological Society, p. 121-124.<br />
Warner, M.M., 1980, Southern Idaho, northern Nevada, southeastern Oregon–prime exploration targets: Oil<br />
and Gas Journal, May 5, p. 325–341.<br />
Warner, M.M., 1977, The Cenozoic of the Snake River Plain of Idaho, in Heisey, E.L., et al, eds., Rocky<br />
Mountain Thrust Belt Geology and Resources: Wyoming Geological Association, 29th Annual Field<br />
Conference, p. 313–326.<br />
Weagant, F.E., 1986, Exploring for Forbes sands not easy, but profitable: World Oil, December, p. 53-58.<br />
Weagant, F.E., 1972, Grimes Gas Field, Sacramento Valley, California, in Stratigraphic Oil and Gas Fields:<br />
American Association of Petroleum Geologists Memoir 16, p. 428-439.
Weimer, R.J., 1996, Petroleum system of the Denver Basin and reservoir compartmentalization by wrench<br />
faulting–a symposium on reservoir characterization studies: Rocky Mountain Association of<br />
Geologists, Denver Geophysical Society, September 13, 1996.<br />
Weiss, M.P., Witkind, I.J., and Cashion, W.B., 1990, Geologic map of the Price 30’ x 60’ quadrangle,<br />
Carbon, Duchesne, Uintah, Utah, and Wasatch Counties, Utah: U.S. Geological Survey<br />
Miscellaneous Investigations Series Map I-1981.<br />
Wellborn, R.E., 1983, Delaney Butte Field, in Crouch, M.C., ed., Oil and Gas Fields of Colorado/Nebraska<br />
and Adjacent Areas , 1982, p. 148-151.<br />
Wellborn, R.E., 1977, Structural style in relation to oil and gas exploration in North Park-Middle Park<br />
Basin, Colorado, in Veal, H.K., ed., Exploration Frontiers of the Central and Southern Rockies:<br />
Rocky Mountain Association of Geologists 1977 symposium, p. 41-60.<br />
Wescott, W.A. and Hood, W. C., 1993, Hydrocarbon systems in the East Texas Basin–a basin modeling<br />
approach: Gulf Coast Association of Geological Societies Transactions, v. 43, p. 445-452.<br />
Wescott, W.A., and Hood, W.C., 1991, Hydrocarbon generation and migration routes in the East Texas<br />
Basin (abstract): Gulf Coast Association of Geological Societies Transactions, v. 41, p. 675.<br />
White, W.S., and Wright, J.C., 1960, Lithofacies of the Copper Harbor Conglomerate, northern Michigan:<br />
U.S. Geological Survey Professional Paper 400-B, p. B-5 to B-8.<br />
Wickham, J.S., Roeder, D., and Briggs, G., 1976, Plate tectonics models for the Ouachita foldbelt:<br />
Geological Society of America, Geology, v. 4, no. 3, p. 173-176.<br />
Winter, B.L., Valley, J.W., Simo, J.A., Nadon, G.C., and Johnson, C.M., 1995, Hydraulic seals and their<br />
origin–evidence from the stable isotope geochemistry of dolomites in the Middle Ordovician St. Peter<br />
Sandstone, Michigan Basin: American Association of Petroleum Geologists Bulletin. v. 79, p. 30-48.<br />
Wood, M.L., and Walper, M.L., 1974, The evolution of the Western Interior basins and the Gulf of Mexico:<br />
Gulf Coast Association of Geological Societies Transactions, v. 24, p. 31-41.<br />
Wood, S.H., 1994, Seismic expression and geological significance of a lacustrine delta in Neogene deposits<br />
of the western Snake River plain, Idaho: American Association Petroleum Geologists Bulletin. v. 78,<br />
no. 1, p. 102-121.<br />
Woodward, J., Meissner, F.F. and Clayton, J.L., 1984, eds., Hydrocarbon Source Rocks of the Greater<br />
Rocky Mountain Region: Rocky Mountain Association of Geologists, Denver, p. 365-368.<br />
Woodward, L.A., and Snyder, D.O., 1976, Structural framework of the southern Raton Basin, New Mexico,<br />
in Ewing, R.C., and Kues, B.S., eds., Guidebook of Vermejo Park, Northeastern New Mexico: New<br />
Mexico Geological Society 27th Field Conference Guidebook, p. 125-127.<br />
Yerkes, R.F., McCulloh, T.H., Schoellhame, J.E., Vedder, J.G., 1965, Geology of the Los Angeles Basin,<br />
California–an Introduction: U.S. Geological Survey Professional Paper 420-A, 57 pp.<br />
Young, R.G., 1960, Dakota Group of Colorado Plateau: American Association of Petroleum Geologists<br />
Bulletin v. 44, p. 156-194.<br />
Zeiglar, D.L. and Spotts, J.H., 1978, Reservoir and source bed history of the Great Valley, California:<br />
American Association of Petroleum Geologists Bulletin, v. 62, no. 5, p. 813-826.
SELECTED BIBLIOGRAPHY<br />
Allison, M.L. et al, 1993, Grassy Trail Oil and Gas Field of Utah: Utah Geological Association<br />
Publication 22, 4 pp.<br />
Bahr, J.M., Moline, G.R., and Nadon, G., 1994, Anomalous pressures in the deep Michigan Basin, in<br />
Orteleva, P., ed., Basin Compartments and Seals: American Association of Petroleum<br />
Geologists Memoir 61, p. 153-166.<br />
Bailey, E.H., ed., 1966, Geology of Northern California: California Division of Mines and Geology<br />
Bulletin 190, 508 pp.<br />
Bebout, D.G., White, W.A., Hentz, T.F., Grasmick, M.K., Woodward, M., Parham, K.D., Bingham,<br />
T.L., Brown, R.L., Campbell, J.A., Northcutt, R.A., Fisher, W.L., and Mendenhall, J.M.,<br />
1993, Atlas of Major Midcontinent Gas Reservoirs: Gas Research Institute Document No. GRI-<br />
93/0260.1, GRI Contract Number 5088-215-1771, University of Texas at Austin, Bureau of<br />
Economic Geology, Arkansas Geological Commission, Oklahoma Geological Survey, Kansas<br />
Geological Survey, 91 pp.<br />
Black, B.A. and Hiss, W.L., 1974, Structure and stratigraphy in the vicinity of the Shell Oil Co. Santa<br />
Fe Pacific No. 1 test well, southern Sandoval County, New Mexico, Ghost Ranch (centralnorthern<br />
New Mexico), New Mexico Geological Society Guidebook, 25th Field Conference, p.<br />
365-370.<br />
Blasko, D., Wegner, W., and Morris, J., 1972, Oil fields and crude oil characteristics, Cook Inlet<br />
Basin, Alaska: U.S. Bureau of Mines <strong>Report</strong> of Investigations No. 7688.<br />
Bostick, N.H. and Pawlewicz, M.J., 1984, Regional variation of vitrinite reflectance of the Pierre<br />
Shale (Upper Cretaceous) in mountain basins and along the eastern Rocky Mountain front,<br />
Colorado, in Woodward, J., Meissner, F.F. and Clayton, J.L., eds., Hydrocarbon Source Rocks<br />
of the Greater Rocky Mountain Region: Rocky Mountain Association of Geologists, p. 393-<br />
399.<br />
Brown, K.W., and Ritzma, H.R., 1982, Oil and Gas Fields and Pipelines of Utah: Utah Geological and<br />
Mineral Survey, Map 61, scale 1:750,000.<br />
California Division of Oil, Gas and Geothermal Resources, 1997, Production Data–Annual <strong>Report</strong> of<br />
the State Oil and Gas Supervisor: California Division of Oil, Gas and Geothermal Resources,<br />
Publication PR 06.<br />
Cardott, B.J., and Lambert, M.W., 1985, Thermal maturation by vitrinite reflectance of Woodford<br />
Shale, Anadarko Basin, Oklahoma: American Association of Petroleum Geologists Bulletin, v.<br />
69, no. 11, p. 1982-1998.<br />
Carlton, B.E., Tepper, D.H., Goodman W.M., LoDuca, S.T., and Eckert, B-Y., 1995, Revised<br />
stratigraphy and correlations of the Niagaran Provincial Series (Medina, Clinton, and Lockport<br />
Groups) in the type area of western New York: U.S. Geological Survey Bulletin 2086, 66 pp.<br />
Cherven, V.B., 1983, A delta slope submarine fan model for Maestrichtian part of the Great Valley<br />
Sequence: American Association of Petroleum Geologists Bulletin v. 62, no. 5, p. 772-816.<br />
Cobban, W.A., Erdmann, C.E., Lemke, R.W., and Maughan, E.K., 1976, Type sections and<br />
stratigraphy of the members of the Blackleaf and Marias River Formations (Cretaceous) of the<br />
Sweetgrass Arch, Montana: U.S.Geological Survey Professional Paper 974.<br />
Cramer, R.D., Gatlin, L., and Wessman, H.G., eds., 1963, Oil and Gas Fields of Oklahoma:<br />
Oklahoma City Geological Society, Reference <strong>Report</strong>, Volume 1.<br />
Davis, F.D. and Doelling, H.H., 1977, Methane content of Utah coals: Utah Geological and Mineral<br />
Survey Open-File <strong>Report</strong> 24, 13 pp.<br />
Durhnam, L.S., 1992, Horizontal action heats up in Louisiana: World Oil, v. 213, no. 6, p. 39-42.<br />
Dwights, 1999, Discover Rocky Mountain Well History Data Base (commercial).<br />
Freezon, S.E., and Finn, T.M., 1988, Map of Sedimentary Basins in the Coterminous United States:<br />
U.S. Geological Survey Map OM-223.<br />
Gardner, M.H., and Cross, T.A., 1994, Middle Cretaceous Paleogeography of Utah, in Mesozoic<br />
Systems of the Rocky Mountain Region, U.S.A.: Society of Economic Paleontologists and<br />
Mineralogists, Rocky Mountain Section, p. 471-502.
Gribi, E.A., 1959, Oil developments and prospects of the south Sweetgrass Arch area, in Hammond,<br />
C.R., and Trap, H., Jr., eds., Billings Geological Society 10th Annual Field Conference.<br />
Gross, T.L., and Keller, G.V., 1979, Geothermal energy in the Basin and Range Province, in Newman,<br />
G.W., and Goode, H.D., eds, Guidebook, 1979 Basin and Range Symposium: Rocky Mountain<br />
Association of Geologists and Utah Geological Society.<br />
Gryc, G., ed., 1988, Geology and Exploration of the <strong>National</strong> Petroleum Reserve in Alaska, 1974-<br />
1982: U. S. Geological Survey Professional Paper 1399, 940 pp.<br />
Herbaly, E.L., 1974, Petroleum geology of the Sweetgrass Arch, Alberta: American Association of<br />
Petroleum Geologists Bulletin, v. 50, p. 2118-2149.<br />
Higley, D.K., Gautier, D.L., and Pawlewicz, M.J., 1992, Influence of regional heat flow variation on<br />
thermal maturity of the Lower Cretaceous Muddy ("J") Sandstone, Denver Basin, Colorado, in<br />
Magoon, L.B., ed., The Petroleum System Status of Research and Methods: U.S. Geological<br />
Survey Bulletin 2007, p. 66-69.<br />
Horan, E.P., 1990, Natural gas distribution, entrapment, and production phenomenon within the Upper<br />
Cretaceous Forbes Formation depositional system, Northern Sacramento Basin, California:<br />
American Association of Petroleum Geologists Bulletin v.74, n. 5, p. 677 (abstract).<br />
Howell, D.G., 1996, Kandik basin, in Gauthier, D.L., Dolton, G.L., Takahashi, K.I., and Varnes,<br />
K.L., eds., 1995 <strong>National</strong> Assessment of United States Oil and Gas Resources-Results,<br />
Methodology, and Supporting Data: U.S. Geological Survey Digital Data Series DDS-30,<br />
Release 2, p. 22-37.<br />
Johnson, E., 1961, Joe’s Valley Gas Field, in Oil and Gas Fields of Utah: Intermountain Association<br />
of Petroleum Geologists Symposium, 3 pp.<br />
Joseph, R.A., 1993, Planning lessens problems, gets benefits of underbalance: Oil and Gas Journal,<br />
March 20, 1995.<br />
Katich, Jr., P.J., 1954, Cretaceous and Early Tertiary stratigraphy of central and south-central Utah<br />
with emphasis on the Wasatch Plateau area–geology of portions of the high plateaus and<br />
adjacent canyon lands, central and south-central Utah: Intermountain Association of Petroleum<br />
Geologists Fifth Annual Field Conference, p. 42-54.<br />
Kearney, M.W., 1984, Subsurface stratigraphy of Medina Group (Lower Silurian), Clinton Group<br />
(Lower to Upper Silurian), and Lockport Group (Upper Silurian) of New York: American<br />
Association of Petroleum Geologists Bulletin, v. 68, no. 12, p. 1921-1922.<br />
Kluth, C.F. and Schaftenaar, C.H., 1994, Depth and geometry of the northern Rio Grande Rift in the<br />
San Luis Basin, south-central Colorado: Geological Society of America Special Paper 291, p.<br />
27-37.<br />
Laine, M.D. and Staley, D., 1991, Summary of pil and gas exploration and production in Carbon,<br />
Emery and Sanpete Counties, east-central Utah, in Geology of East-Central Utah: Utah<br />
Geological Association Publication 19, p. 227-235.<br />
Libby-French, J., 1985, Play analysis of undiscovered oil and gas resources on onshore federal lands–<br />
Phase One, Atlantic Coastal Plain: United States Geological Survey Open-File <strong>Report</strong> 85-269,<br />
17 p.<br />
Lozinsky, R.P., 1994, Cenozoic stratigraphy, sandstone petrology, and depositional history of the<br />
Albuquerque Basin, central New Mexico: Geological Society of America Special Paper 291, p.<br />
73-81.<br />
Mantheny, J.P. and Picard, M.D., 1985, Sedimentology and depositional environments of the Emery<br />
Sandstone Member of the Mancos Shale, Emery and Sevier Counties, Utah: The Mountain<br />
Geologist, v.22, no.3, p.94-109.<br />
McCulloh, R.P., and Purcell, M. D., 1983, Hydropressure tongues within regionally geopressured<br />
Lower Tuscaloosa Sandstone, Tuscaloosa Trend, Louisiana: Gulf Coast Association of<br />
Geological Societies Transactions, v. 33, p. 153-159.<br />
Meissner, F.F., 1984, Cretaceous and Lower Tertiary coals as sources for gas accumulations in the<br />
Rocky Mountain area, in Woodward, J., Meissner, F.F. and Clayton, J.L., eds., Hydrocarbon<br />
Source Rocks of the Greater Rocky Mountain Region: Rocky Mountain Association of<br />
Geologists, p. 401-431.
Meylan, M.A., 1997, Controls on the Distribution of Oil and Gas, Mesozoic and Cenozoic of<br />
Mississippi: American Association of Petroleum Geologists Bulletin, v. 89, no. 9, p. 1583.<br />
Moore, D.W., 1991, Stratigraphy, sedimentology and provenance of the Lower Campanian Forbes and<br />
Marsh Creek Formations, southern Sacramento and northern San Joaquin Basins, California:<br />
Masters Thesis, San Jose State University, California (abstract).<br />
Nilsen, T.H., 1989, Stratigraphy and sedimentology of the Mid-Cretaceous deposits of the Yukon-<br />
Koyukuk basin, west-central Alaska: Journal of Geophysical Research, v. 94, no. B11, p.<br />
15925-15940.<br />
Ortlieb, L., 1991, Quaternary vertical movements along the coasts of Baja California and Sonora, in<br />
Dauphin, J.P. and Simoneit, B.R., eds, AAPG Memoir 47: American Association of Petroleum<br />
Geologists, p. 447-480.<br />
Palmer, S.E., 1984, Hydrocarbon source potential of organic facies of the lacustine Elko Formation<br />
(Eocene-Oligocene), northeast Nevada, in Woodward, J., Meissner, F.F., and Clayton, J.L., eds.,<br />
Hydrocarbon Source Rocks of the Greater Rocky Mountain Region: Rocky Mountain<br />
Association of Geologists.<br />
Peterson, J.A., 1987, Pre-thrusting regional stratigraphy and paleotectonics, northern Rocky<br />
Mountains and adjacent Cordilleran shelf, U.S., in Miller, W.R., ed., 1987, The Thrust Belt<br />
Revisited: Wyoming Geological Association, Casper, p. 17–26.<br />
Pollastro, R.M., 1992, Natural fractures, composition, cyclicity, and diagenesis of the Upper<br />
Cretaceous Niobrara Formation, Berthoud Field, Colorado, in Schmoker, J.W., Coalson, E.B.,<br />
Brown, C.A., eds., Geological Studies Relevant to Horizontal Drilling–Examples from Western<br />
North America: Rocky Mountain Association of Geologists, p. 243-255.<br />
Preston, D., ed., 1961, Oil and Gas Fields of Utah: Intermountain Association of Petroleum<br />
Geologists.<br />
Quigley, D., 1961, Ferron Gas Field: Intermountain Association of Petroleum Geologists<br />
Symposium, Oil and Gas Fields of Utah, 4 pp.<br />
Reid, J.W., 1954, The structural and stratigraphic history of the Carbonifeous (Mississipian and<br />
Pennsylvanian) of the Wasatch Plateau and environs–geology of portions of the high plateaus<br />
and adjacent canyon lands, central and south-central Utah: Intermountain Association of<br />
Petroleum Geologists Fifth Annual Field Conference, p. 18-20.<br />
Salyards, S.L. and Ni, J.F., 1994, Variation in paleomagnetic rotations and kinematics of the northcentral<br />
Rio Grande Rift, New Mexico: Geological Society of America Special Paper 291, p. 59-<br />
71.<br />
Shirley, K., 1995, An oil find that was good as gold: American Association of Petroleum Geologists,<br />
Explorer, v.16, No.7, p. 1,8-9.<br />
Skelton, J.H., 1992, Louisiana horizontal well taps oil in area of salt-related fracturing: Oil and Gas<br />
Journal, v. 90, no. 27, p. 88-90.<br />
Sohl, N.F., 1991, Upper Cretaceous, in Salvador, A., The Gulf of Mexico Basin, The Geology of<br />
North America, Vol. J: Geological Society of America, p. 205-244.<br />
Speiker, E.D., 1954, Structural history–geology of portions of the high plateaus and adjacent canyon<br />
lands central and south-central Utah: Intermountain Association of Petroleum Geologists Fifth<br />
Annual Field Conference, p. 9-14.<br />
Stevens, SH., Lombardi, T.E., Kelso, B.S., and Coates, J.M., 1992, A Geologic Assessment of<br />
Natural Gas from Coal Seams in the Raton and Vermejo Formations, Raton Basin: Gas<br />
Research Institute No. 92/0345, Contract No. 5091-214-2316, 84 pp.<br />
Suek, D.H., 1999, Personal communication, Black Coral, LLC, Denver, Colorado.<br />
Surdham, R.C., 1994, Detection and delineation of anomalously pressured gas accumulations in Rocky<br />
Mountain Laramide basins: Gas Research Institute, Rocky Mountain Association of Geologists,<br />
Denver, Gas Forum Notes.<br />
Tabet, D., 1996, Drunkard’s Wash oil and gas field of Utah: Utah Geological Association Publication<br />
22 (Addendum 1996), 2 pp.<br />
Thomas, M.A., 1993, Subnormal fluid pressure in the Clinton sandstone of eastern Ohio: unpublished<br />
Ph.D. thesis, Kent State University, 111 pp.
Tripp, C.N., 1996, Joe’s Valley Oil and Gas Field of Utah: Utah Geological Association Publication<br />
22 (Addendum 1996), 1 pp.<br />
Villien, A., 1986, Thrusting and synorogenic sedimentation in central Utah–paleotectonics and<br />
sedimentation in the Rocky Mountain Region, United States: American Association of<br />
Petroleum Geologists Memoir 41, p. 281-307.<br />
Walton, P.T., 1954, Wasatch Plateau Gas Fields, Utah, in Geology of portions of the high plateaus<br />
and adjacent canyon lands, central and south-central Utah: Intermountain Association of<br />
Petroleum Geologists Fifth Annual Field Conference, p. 79-85.<br />
Wang, H.F., Crowley, K.D., and Nadon, G.C., 1994, Thermal history of the Michigan Basin from<br />
apatite fission-track analysis and vitrinite reflectance, in Orteleva, P., ed., Basin Compartments<br />
and Seals: American Association of Petroleum Geologists Memoir 61, p. 167-177.<br />
White, H.G., 1986, Engineering and production characteristics of oil and gas wells located in the Black<br />
Warrior Basin of Alabama: Geological Survey of Alabama, Tuscaloosa, Oil and Gas <strong>Report</strong> no.<br />
11.<br />
Witkind, I.J. and Page, W.R., 1984, Origin and significance of the Wasatch and Valley Mountains<br />
monoclines, Sanpete-Sevier Valley area, central Utah: The Mountain Geologist, v. 21 no. 4, p.<br />
143-156.<br />
Wolf, T., 1995, Colorado’s Sangre de Cristo Mountains, University of Colorado Press, 339 pp.<br />
Woodard, G.D., 1974, Redefinition of Cenozoic stratigraphic column in Split Mountain Gorge,<br />
Imperial Valley, California: American Association of Petroleum Geologists Bulletin, v. 58, no.<br />
3, p. 521-539.<br />
Zigler, J.L., and Nilsen, T.H., 1984, Geochemistry of coal from the Dutch Creek Siltstone Member of<br />
the Hornbrook Formation, Northern California, in Nilsen, T.H., ed. Geology of the Upper<br />
Cretaceous Hornbrook Formation, Oregon and California: Society of Economic Paleontologists<br />
and Mineralogists, Pacific Section, v. 42, p. 123-127.
1<br />
POTENTIAL FOR A BASIN-CENTERED GAS ACCUMULATION IN THE<br />
ALBUQUERQUE BASIN OF NEW MEXICO<br />
INTRODUCTION<br />
By Ronald C. Johnson, Thomas M. Finn, and Vito F. Nuccio<br />
The Albuquerque Basin occupies the central portion of the Rio Grande rift system, an area of presently<br />
active extensional tectonics that extends from the Upper Arkansas Valley near Leadville, Colorado<br />
southward through New Mexico-Mexico into the state of Chihuahua, Mexico (Figure 1). The Rio Grande<br />
Rift is part of the greater Basin and Range province that has been undergoing extension since Oligocene<br />
time.<br />
For the past 24 years, the U.S. Geological Survey has been studying basin-centered gas deposits in<br />
Rocky Mountain basins under various projects funded what is now called the United States Department of<br />
<strong>Energy</strong> <strong>National</strong> <strong>Energy</strong> <strong>Technology</strong> Lab in Morgantown West Virginia. These investigations have added<br />
greatly to our understanding of these “unconventional” deposits formed. Basin-centered gas deposits cover<br />
vast areas of the deeper parts of Rocky Mountain basins formed during the Laramide orogeny (Late<br />
Cretaceous through Eocene) and appear to contain huge resources of in-place gas. These “unconventional”<br />
gas deposits are different from conventional gas deposits in that they occur in predominantly tight (< 0.1<br />
millidarcy) rocks, cut across stratigraphic units, occur downdip from water-bearing reservoirs, and have no<br />
obvious structural or stratigraphic trapping mechanism. Reservoirs within the accumulations are almost<br />
always either abnormally overpressured or abnormally underpressured indicating that they are isolated from<br />
the regional groundwater table.<br />
The Albuquerque Basin was chosen for study because its geologic history is significantly different from<br />
other Rocky Mountain basins that contain identified basin-centered gas accumulations. Like Laramide<br />
basins, the Albuquerque Basin contains a thick interval of Cretaceous-age coals, carbonaceous shales and<br />
marine shales. In Laramide basins, these Cretaceous-age source rocks are thought to be the source for gas<br />
found in basin-centered gas accumulations. Unlike the Laramide basins studied previously, the Albuquerque<br />
Basin is a currently actively subsiding. Subsidence in Laramide basins, in contrast, largely ceased near the<br />
end of the Eocene. Laramide basins have undergone significant erosion and cooling within the last 10<br />
million years as a result of regional uplift of the entire Rocky Mountain region. Rates of gas generation in<br />
Laramide basins have markedly declined since regional uplift began. In fact, gas generation has probably<br />
ceased altogether in all but the deeper areas of these basins. Thus gas is probably not being replenished to<br />
these accumulations, as fast as it is leaking out, and there is good evidence that these deposits are actively<br />
shrinking.<br />
In the Albuquerque basin, in contrast, source rocks for hydrocarbons are under near-maximum burial<br />
conditions and near maximum heating throughout the deeper areas of the basin. Gas is being generated by<br />
these source rocks today. This gas is probably migrating and accumulating in Upper Cretaceous sandstones<br />
at the present time. Whether this gas may be creating a basin-centered type gas accumulation is the subject<br />
of this report.<br />
STRUCTURE AND STRATIGRAPHY<br />
The Albuquerque Basin occupies the central portion of the Rio Grande rift, a series of generally northsouth-trending<br />
en echelon extensional basins that extend from central Colorado to at least southern New<br />
Mexico (Chapin, 1971; 1979). The basin contains a thick section of sedimentary rocks ranging in age from<br />
Mississippian to Recent (Figure 2). Rifting began about 32 to 27 million years ago in middle Oligocene<br />
time and is probably still occurring at the present time. The Albuquerque Basin covers an area of about<br />
2,160 square miles (5,600 km 2 ) and is one of the deepest basins along the Rio Grande rift (Lozinsky, 1994).<br />
In 1979, Shell drilled a well to a depth of 21,266 ft in one of the deepest parts of the basin and did not reach<br />
the base of the Oligocene and younger rift fill. Seismic data published by Russell and Snelson (1984)<br />
demonstrates that the basin generally consists a deep inner graben flanked by shallower benches (Figures 3-
6). The inner graben in the northern part of the basin is tilted eastward while in the southern part the<br />
graben is tilted westward. An east-west zone of accommodation occurs between these two opposite tilted<br />
blocks.<br />
Of importance to this investigation is a pre-Eocene unconformity which has removed varying amounts<br />
of the Cretaceous section in northern New Mexico, including the Albuquerque Basin area. The Cretaceous<br />
section contains both source and principle reservoir rocks for basin-centered gas accumulations in other<br />
Rocky Mountain basins, and had the Cretaceous section been largely removed by this unconformity there<br />
would be little chance that a basin-centered accumulation would be present in the basin. Both surface control<br />
on the flanks of the Albuquerque Basin and subsurface control within the basin indicate that much of the<br />
Cretaceous section is intact, although the Cretaceous section is completely removed in the Española Basin<br />
to the north (Molenaar, 1988). Cretaceous strata is similar to the highly gas productive Cretaceous interval<br />
in the San Juan Basin to the north, and many of the same stratigraphic names are used in both basins<br />
(Figure 2).<br />
DRILLING ACTIVITY IN THE ALBUQUERQUE BASIN<br />
The Albuquerque Basin has been sparsely explored for hydrocarbons. At the present time there is no<br />
established hydrocarbon production in the basin and no drilling for hydrocarbons since 1984. At least 46<br />
wells have been drilled for hydrocarbons in the basin with the oldest known test drilled in 1914. Drilling<br />
prior to 1953 was mainly shallow, penetrating only the Tertiary fill within the basin (Figure 18) (Black,<br />
1982). Numerous oil and gas shows were reported with these shallow tests. After 1953, the Cretaceous<br />
section beneath the Tertiary fill became the primary target for exploration (Black 1982).<br />
Between 1972 and 1976 Shell drilled five deep tests in the basin targeting Cretaceous rocks. These<br />
wells were largely targeting structures defined by seismic. The first well, the Shell no. 1 Santa Fe in sec.<br />
18, T. 13N., R. 3E. was drilled to a depth of 11,045 ft and bottomed in Precambrian basement. The second<br />
well, the Shell no. 1 Laguna Wilson Trust in sec. 8, T. 9N., R1W. was drilled to a depth of 11,115 ft and<br />
also bottomed in Precambrian. The third well, the Shell no. 2 Santa Fe in sec. 18, 13N., 1E. was drilled to<br />
a depth of 10,276 and bottomed in Triassic. All three wells encountered gas shows in the Cretaceous section<br />
but no completions were attempted. The fourth well drilled by Shell in 1974 was the no. 1 Isleta well in<br />
sec. 7, T. 7N., R. 2E. (Figure 3). The well penetrated the top of the Cretaceous section at 12,110 ft. It<br />
encountered a series of faults near the base of the nonmarine Cretaceous section, and the Dakota Sandstone,<br />
the primary objective of the test, was cut out. According to Black (1982, p. 315) the well encountered<br />
“tight” gas-saturated sandstones in the nonmarine Cretaceous interval. Several intervals were perforated in<br />
the nonmarine part of the Cretaceous between 12,209 ft and 13,246 ft, and non-commercial amounts of gas<br />
were produced. Maximum reported production was 29 MCFGPD between 13,210 and 13,226 ft. In 1976,<br />
Shell drilled the no. 3 Santa Fe well in sec. 28, T. 13N., R. 3E. to a depth of 10,276 ft and bottomed in<br />
the Triassic. Again, gas shows were encountered in the Cretaceous.<br />
In 1978, Shell farmed out part of their acreage to Trans Ocean who drilled the no. 1 Isleta well in sec.<br />
8, T. 8N., R. 3E. to a depth of 10,378 ft. The well bottomed in Precambrian and encountered gas shows in<br />
the Cretaceous. In 1979 Shell drilled the no. 2 Isleta well in sec. 16, T. 8N., R. 2E. The well was drilled to<br />
a depth of 21,266 ft and did not reach the Cretaceous. In 1980 and 1981 Shell drilled the Shell 1 West Mesa<br />
well in sec 24, T. 11N, R. 1E. to a 19,375 ft. and reportedly flared several hundred thousand cubic feet per<br />
day from the Cretaceous section (Black, 1989). The well was eventually plugged and abandoned apparently<br />
because rates of production were insufficient at these drilling depths to be economic. The last oil and gas<br />
test drilled in the Albuquerque Basin was the Utex no. 1-1J1E well in sec 1, T. 10N, R. 1E. The well<br />
apparently bottomed in the Point Lookout Sandstone at 16,665 ft. No tests or completions were reported.<br />
2
BOREHOLE TEMPERATURE DATA<br />
Previous investigations have found that there is unusually high heat flow in the vicinity of the Rio<br />
Grand Rift (Decker, 1969; Reiter and others, 1975; Edwards and others, 1978; Clarkson and Reiter, 1984),<br />
although there is some suggestion that the area of high heat flow occurs across a broad area of New Mexico<br />
and southern Colorado and is not confined to the immediate vicinity of the rift (Edwards and others, 1978;<br />
Clarkson and Reiter, 1984). Many heat flow measurements in the Albuquerque Basin area, however, have<br />
been taken at shallow depths. These heat flow measurements can be affected by local groundwater<br />
convection and hence may not be good measurements of regional heat flow patterns (Clarkson and Reiter,<br />
1984).<br />
Geothermal gradients calculated from temperatures recorded during logging runs in oil and gas tests is a<br />
less precise way to measure variations in heat flow since geothermal gradients vary between different<br />
lithologies. Nonetheless, geothermal gradients are commonly used because the data is readily available.<br />
Geothermal gradients were calculated by Grant (1982) for eight of the deepest boreholes in the basin. Grant<br />
(1982) calculated only one gradient for each hole using the temperature recorded at the bottom of the hole.<br />
Here we calculated geothermal gradients for all the temperatures recorded while these eight drill holes were<br />
being drilled. Figure 7 plots all geothermal gradients calculated for the eight drillholes. An average<br />
geothermal gradient was also calculated for each drillhole using all of the temperature readings taken. The<br />
standard AAPG correction factor was applied to all of the recorded temperatures, and a mean annual surface<br />
temperature of 45 o F was used. A correction factor is required because the rocks in the immediate vicinity of<br />
the borehole are quenched by comparatively cool mud circulated through the borehole during drilling. The<br />
time between when mud circulation stops and the temperature is recorded is seldom long enough for<br />
temperatures in the vicinity of the borehole to re-equilibrate.<br />
Geothermal gradients calculated from different logging runs in the same drillhole were surprisingly<br />
consistent. For instance, the eight individual geothermal gradients calculated for the Shell no. 1 Isleta hole<br />
varied from 1.77 o F/100 ft to 2.48 o F/100 ft. If only the six deepest temperatures are used variation is only<br />
from 1.95 o F/100 ft to 2.15 o F/100 ft. Shallower temperature readings in boreholes are generally less<br />
reliable than deeper readings largely because of the greater times required for borehole temperatures to reequilibrate<br />
once mud circulation is stopped. Average geothermal gradients for the eight drillholes varied<br />
from 1.7 o F/100 ft to 2.3 o F/100 ft (Figure 19). These values are not significantly different from geothermal<br />
gradients throughout northern New Mexico (Geothermal Gradient Map of North America, 1976).<br />
BURIAL RECONSTRUCTIONS FOR THE ALBUQUERQUE BASIN<br />
Burial reconstructions were made for three deep drillholes in the Albuquerque Basin from the time of<br />
deposition of the Cretaceous Dakota Sandstone to the present. The three wells used have picks on the tops<br />
of all three Cretaceous units used here the Dakota Sandstone, the Point Lookout Sandstone, and the<br />
Menefee Formation. These wells, the Shell no. 3 Santa Fe, the Shell no. 1 Santa Fe, and the Shell no. 1-<br />
24 West Mesa (Figure 3) were modeled using BasinMod version 7.01 developed by Platte River Associates<br />
in order to determine the timing of hydrocarbon generation. The Shell no. 3 Santa Fe and no. 1 Santa Fe are<br />
near cross section A-A’ in a comparatively shallow area in the northern part of the basin. The Shell no. 1-<br />
24 West Mesa well is in a much deeper part of the basin further to the south.<br />
Isopach maps of Tertiary rocks in the Albuquerque Basin were constructed using data from Lozinsky<br />
(1994) in order to better understand the subsidence history of the basin and to help define the deepest parts of<br />
the basin where a basin-centered gas accumulation is likely to occur. The isopach maps were constructed<br />
using only drillhole data, and no attempt was made to incorporate seismic information. The maps are thus<br />
very generalized and do not show thickness variations that occurs from the stair step faulting within the<br />
basin. The first isopach map is of the Eocene Galistero and Baca formations (Figure 9). Although these<br />
units predate the onset of subsidence in the basin, they nonetheless thicken somewhat toward the deep<br />
trough of the basin. The second isopach map (Figure 10) is of the Galistero and Baca formations and the<br />
overlying “unit of Isleta no. 2 well” defined by Lozinski (1994, p. 77). The unit is thought to be Late<br />
Eocene to Late Oligocene in age and thus spans the onset of rifting in the Albuquerque Basin. By Late<br />
Oligocene over 2,500 m of sediments and volcanic rocks (present day thickness) had accumulated along the<br />
3
developing deep basin trough west of Albuquerque (Figure 10). The last isopach map includes all Tertiary<br />
rocks and sediments to the present. More than 6,500 m of sediments and volcanic rocks have accumulated<br />
along the deep basin trough.<br />
The data used for the burial reconstruction’s is shown on the stratigraphic charts in Figure 12. The<br />
Cretaceous stratigraphy of the Albuquerque Basin is similar to that of the San Juan Basin to the north.<br />
Principle Cretaceous stratigraphic units used in the burial reconstruction’s are the Dakota Sandstone, the<br />
Point Lookout Sandstone and the top of the Menefee Formation. These units have not been placed within<br />
the standard Western Interior Cretaceous biozones in the area of the Albuquerque Basin but have been<br />
extensively studied in the San Juan Basin to the north. In the eastern part of the San Juan Basin the Dakota<br />
Sandstone in the San Juan Basin falls within the Acanthoceras amphibolum biozone (Dane, Cobban, and<br />
Kauffman, 1966) which has been dated at about 95 million years (Obradovich, 1993). The Point Lookout<br />
Sandstone falls near the top of the Scaphites hippocrepis zone (Gill and Cobban, 1966) which is dated at<br />
about 81.5 million years (Obradovich, 1993). The top of the Menefee Formation is assumed to be in the<br />
Baculites obtusus ammonite zone, which is about the age of the top of the Menefee in the easternmost part<br />
of the San Juan Basin (Gill and Cobban, 1966, Pl. 4). Age of the Baculites obtusus zone is 80.5 million<br />
years (Obradovich, 1993).<br />
Thickness of the interval from the top of the Dakota Sandstone to the top of the Point Lookout<br />
Sandstone varies from 2,071 ft in the Shell no. 1-24 West Mesa Well to 2,593 ft in the Shell no. 3 Santa<br />
Fe well. This is similar to the San Juan Basin where Law (1992) reported thicknesses of 2,020 ft and 2,200<br />
ft for the same interval (Law, 1992, figs. 6 and 7). The interval from the top of the Point Lookout to the<br />
top of the Cretaceous interval vary much more widely from 0 ft in the Shell no. 1-24 Mesa well to 2,070 ft<br />
in the Shell no. 3 Santa Fe well. This variation is due to differences in the amount of section removed<br />
beneath the Cretaceous-Tertiary unconformity. The same interval in the two wells cited by Law (1992) in<br />
the San Juan Basin varies from 2,980 ft for the well on the south flank of the basin to 4,020 ft for the well<br />
near the basin trough.<br />
As in the Albuquerque Basin, varying amounts of erosion beneath the Cretaceous-Tertiary<br />
unconformity are largely responsible for this variation. Law (1992, fig. 9) estimated that about 300 ft of<br />
section had been removed beneath the Cretaceous-Tertiary unconformity at the location near the basin<br />
trough for a total original thickness of post Point Lookout section of 4,320 ft. He (Law, 1992, fig, 10)<br />
estimated that about 750 ft of section had been removed beneath the unconformity at the location on the<br />
south flank of the basin for a total original thickness of 3,730 ft of post Point Lookout Cretaceous rocks.<br />
For the Albuquerque Basin reconstructions we will assume an original thickness of 4,000 ft of post Point<br />
Lookout Sandstone Cretaceous rocks.<br />
Figure 11 shows the sediment thicknesses and ages used in the burial reconstruction’s of the three<br />
wells. Age of the oldest rocks above the Cretaceous-Tertiary is Eocene (Lozinsky, 1994). An age of 50<br />
million years is assumed for the oldest Eocene strata at all three wells modeled. These Eocene strata are also<br />
present on the flanks of the Albuquerque Basin and predate the onset of rifting. It is assumed that<br />
downcutting of Cretaceous strata beneath the unconformity began at the end of the Cretaceous 66 million<br />
years ago and continued at an even pace until 50 million years ago. For two wells, the Shell no. 3 Santa Fe<br />
and the Shell no. 1 Santa Fe continuous deposition at a constant rate is assumed from 50 ma to the present.<br />
Somewhat more data is available for the Shell 1-24 West Mesa well. According to Lozinski (1994), 1109 ft<br />
of strata were deposited by late Eocene time, about 40 ma. An additional 7,169 ft of strata was deposited<br />
between 40 ma and the end of the Oligocene 25 ma. The remaining 8,540 ft of fill was deposited between<br />
25 ma and the present. Geothermal gradients used are 1.9 o F/100 ft for the no. 3 Santa Fe well, 2.1 o F/100<br />
ft for the Santa Fe no. 1 well, and 1.7 o F for the 1-24 West Mesa well.<br />
The burial reconstruction’s indicate that in two of the wells, the Shell no. 1 Santa Fe and the Shell<br />
no. 3 Santa Fe, potential source rocks in the Mancos Shale and overlying Cretaceous section are immature<br />
and have not generated significant hydrocarbons (Figures 13, 14). In the third well, the Shell no. 1-24 West<br />
Mesa, hydrocarbon generation began at the base of the Mancos Shale about 20 million years ago (Figures<br />
15-17). Cretaceous source rocks had not generated significant amounts of hydrocarbons prior to the onset of<br />
rifting and creation of the Albuquerque Basin in the Oligocene. The onset of significant hydrocarbon<br />
generation in the Shell no. 1-24 well corresponds to a temperature of about 212 o F (105 o C). Using an<br />
average geothermal gradient of 2.0 o F/100 ft (3.3 o C/100 m) for the basin, this temperature would occur at a<br />
4
depth of about 8,350 ft. (2,545 m). The Cretaceous section has been buried to this depth over a large area of<br />
the Albuquerque Basin (Figure 10).<br />
FORMATION PRESSURES<br />
Basin-centered accumulations are typically abnormally overpressured or abnormally underpressured,<br />
with overpressuring the result of volume increases during hydrocarbon generation and underpressured<br />
conditions developing during uplift and cooling. Because the Albuquerque Basin is currently under<br />
maximum burial and heating, it is unlikely that any basin centered accumulation there would be<br />
underpressured. If overpressured conditions exist in the basin then a basin-centered accumulation may be<br />
present. The most reliable formation pressure information is obtained from drillstem tests. Only two of the<br />
ten deepest wells in the basin had a reliable drillstem test in the Cretaceous section. The Dakota Sandstone<br />
was tested in the Shell 1 Laguna-Wilson Trust well (Figure 3) at a depth of 3,600 to 3,651 ft. The test<br />
recovered 48 barrels of water. Shut-in pressures indicate a fluid pressure gradient of 0.43 psi/ft indicating a<br />
normal pressure gradient. The Shell no. 1 Santa Fe well also tested the Dakota Sandstone but at a much<br />
greater depth of 6,720 to 6,753 ft. This test recovered 5,172 ft of water. Shut-in pressures indicate a fluid<br />
pressure gradient of 0.43 psi/ft or again normal hydrostatic pressure. The normally pressured water in the<br />
shallow test would be expected, as a basin-centered accumulation would not be expected at this depth. The<br />
deeper water test at over 6,700 ft is problematical. Active gas generation might be expected at this depth.<br />
Less reliable formation pressure information can be obtained from mud-weights measured during<br />
drilling. A continuous record of mud-weights used is typically recorded on mudlogs made while drilling.<br />
Mudlogs, however, are generally not available to the public. Spot recordings of mud-weights at the time of<br />
logging runs are listed on the header information on geophysical logs. Figure 12 plots mud-weights versus<br />
depth for nine of the deepest wells in the basin. A mud-weight of 10 lbs. corresponds to a pressure gradient<br />
of .519 psi/ft or moderate overpressuring. High mud-weights were used while drilling through the<br />
Cretaceous section in five of the deeper wells in the basin.<br />
CONCLUSIONS<br />
It appears likely that the deep central portion of the Albuquerque contains a basin-centered gas<br />
accumulation that is developing at the present time. The area contains a largely intact Cretaceous section<br />
similar to the Cretaceous interval that contains a basin-centered accumulation in the nearby San Juan Basin.<br />
High mud weights are typically used while drilling the Cretaceous interval in this area suggesting some<br />
degree of overpressuring. Gas shows have been reported while drilling through the Cretaceous interval<br />
throughout this area. Attempts to complete gas wells in the Cretaceous have resulted in sub-economic<br />
quantities of gas, primarily because of “tight rocks.” Little water has been reported. All of these<br />
characteristics are typical of basin-centered gas accumulations in other Rocky Mountain basins. Burial<br />
reconstruction’s suggest that large amounts of gas are being generated by Cretaceous source rocks at the<br />
present time. This is different from other Rocky Mountain basins were rates of gas generation have declined<br />
significantly since regional uplift and downcutting began about 10 million years ago. This regional uplift<br />
was offset in the Albuquerque Basin by rapid subsidence.<br />
The last attempt to complete a Cretaceous gas well in the Albuquerque Basin was in 1984. At that<br />
time, basin-centered gas was sub-economic throughout the Rocky Mountain region, and financial incentives<br />
by the government were required in order to entice oil and gas companies to drill these deposits. Subsequent<br />
improvements in completion technology has made basin-centered gas economic without financial incentives<br />
in many areas of the Rockies. Applying these new technologies to completing gas wells in the Albuquerque<br />
Basin should result in improved economics.<br />
5
REFERENCES CITED<br />
6<br />
Black, B. A., 1982, Oil and gas exploration in the Albuquerque Basin: in Grambling, J. A., and Wells,<br />
S. G., eds., Albuquerque Country II: New Mexico Geological Society Guidebook, 33 rd Field<br />
Conference, p. 313-324.<br />
Black, B. A., 1989, Recent oil and gas exploration in the northern part of the Albuquerque Basin: in<br />
Lorenz, J. C., and Lucas, S. G., eds., <strong>Energy</strong> Frontiers in the Rockies: Companion Volume for<br />
the 1989 Meeting of the American Association of Petroleum Geologists, Rocky Mountain<br />
Section, Hosted by the Albuquerque Geological Society Oct. 1-4, 1989, p. 13-15.<br />
Black, B. A., and Hiss, W. L., 1974, Structure and stratigraphy in the vicinity of the Shell Oil Co.<br />
Santa Fe Pacific No. 1 test well, southern Sandoval County, New Mexico: in Siemers, C. T.,<br />
Woodward, L. A., and Callender, J. F., eds., Ghost Ranch Central-Northern New Mexico: New<br />
Mexico Geological Society Twenty-Fifth Conference, p. 365-370.<br />
Chapin, C. E., 1971, the Rio Grande rift, Part I-Modifications and additions: in James, H. L., ed.,<br />
Guidebook of the San Luis Basin: New Mexico Geological Society, 22 nd Field Conference<br />
Guidebook, p. 191-201.<br />
Chapin, C. E., 1979, Evolution of the Rio Grande rift-A Summary: in Riecker, R. E., ed., Rio Grande<br />
Rift, Tectonics and Magmatism: America Geophysical Union, Washington, D. C., p. 1-5.<br />
Clarkson, G. and Reiter, M., 1984, Analysis of terrestrial heat-flow profiles across the Rio Grand Rift<br />
and southern Rocky Mountains in northern New Mexico: in Baldridge, W. S., Dickerson P. W.,<br />
Riecker, R. E., and Zidek, J., eds., Rio Grand Rift: Northern New Mexico: New Mexico<br />
Geological Society Thirty-fifth Annual Field Conference, Oct. 11-13, 1984, p.39-44.<br />
Dane, C. H., Cobban, W. A., and Kauffman, E. G., 1966, Stratigraphy and regional relationships of a<br />
reference section for the Juana Lopez member, Mancos Shale in the San Juan Basin, New<br />
Mexico: U.S. Geological Survey Bulletin 1224-H, p. 1-15.<br />
Decker, E. R., 1969, Heat flow in Colorado and New Mexico: Journal of Geophysical Research, v. 74,<br />
p. 550-559.<br />
Edwards, C. L., Reiter, M., Shearer, C., and Young, W., 1978, Terrestrial heat flow and crustal<br />
radioactivity in northeastern New Mexico and southeastern Colorado: Geological Society of<br />
America Bulletin, v. 89, p. 1341-1350.<br />
Geothermal Gradient Map of North America, 1976, American Association of Petroleum Geologists and<br />
the U.S. Geological Survey.<br />
Gill, J. R., and Cobban, W. A., 1966, The Red Bird section of the Upper Cretaceous Pierre Shale in<br />
Wyoming: U.S. Geological Survey Professional Paper 393-A, 73 p.<br />
Law, B. E., 1992, Thermal maturity patterns of Cretaceous and Tertiary rocks, San Juan Basin,<br />
Colorado and New Mexico: Geological Society of America Bulletin, vol. 104, p. 192-207.<br />
Lozinsky, R. P., 1994, Cenozoic stratigraphy, sandstone petrology, and depositional history of the<br />
Albuquerque Basin, central New Mexico: in Keller, G. R., and Cather, S. M., eds., Basins of the<br />
Rio Grand Rift: Structure, Stratigraphy, and Tectonic Setting: Geological Society of America<br />
Special Paper 291, p. 73-81.<br />
Lucas, S. G., 1984, Correlation of Eocene rocks of the northern Rio Grande Rift and adjacent areas:<br />
implications for Laramide tectonics: in Baldridge, W. S., Dickerson P. W., Riecker, R. E., and<br />
Zidek, J., eds., Rio Grand Rift: Northern New Mexico: New Mexico Geological Society Thirtyfifth<br />
Annual Field Conference, Oct. 11-13, 1984, p. 123-128.<br />
May, S. J., and Russell, L. R., 1994, Thickness of the syn-rift Santa Fe Group in the Albuquerque<br />
Basin and its relation to structural style: in Keller, G. R., and Cather, S. M., eds., Basins of the<br />
Rio Grand Rift: Structure, Stratigraphy, and Tectonic Setting: Geological Society of America<br />
Special Paper 291, p. 113-123.<br />
McDonald, R. E., 1972, Paleocene and Eocene rocks of the central and southern Rocky Mountain<br />
basins: in Mallory, W. W., ed., Geologic Atlas of the Rocky Mountain Region: Rocky<br />
Mountain Association of Geologists, p. 243-256.<br />
Molenaar, C. M., 1988, Cretaceous and Tertiary rocks of the San Juan Basin: in Sloss, L. L., ed.,<br />
Sedimentary Cover-North American Craton: U.S., Chapter 8, Basins of the Rocky Mountain
7<br />
Region: The Geological Society of America, Decade of North American Geology, The Geology<br />
of North America, Volume D-2, p. 129-134.<br />
Molenaar, C. M., 1988, Petroleum and hydrocarbon plays of the Albuquerque-San Luis rift basin, New<br />
Mexico and Colorado: U.S. Geological Survey Open-File <strong>Report</strong> 87-450-S, 26 p.<br />
Obradovich, J. D., 1993, A Cretaceous time scale: in Caldwell, W. G. E., and Kauffman, E. G., eds.,<br />
Evolution of the Western Interior Basin: Geological Association of Canada Special Paper 39, p.<br />
379-396.<br />
Reiter, M., Edwards, C. L., Hartman, H., and Weidman, C. 1975, Terrestrial heat flow along the Rio<br />
Grande rift, New Mexico and southern Colorado: Geological Society of America Bulletin, v. 86,<br />
811-818.<br />
Russell, L. R., and Snelson, S., 1994, Structure and tectonics of the Albuquerque Basin segment of the<br />
Rio Grand rift: in Keller, G. R., and Cather, S. M., eds., Basins of the Rio Grand Rift:<br />
Structure, Stratigraphy, and Tectonic Setting: insights from reflection seismic data: Geological<br />
Society of America Special Paper 291, p. 83-112.
40°<br />
37°<br />
32°<br />
108° 104°<br />
San Luis Basin<br />
San Juan Volcanic Field<br />
Brazos Uplift<br />
Chama Basin<br />
Jemez volcanic field<br />
Nacimiento Uplift<br />
Santo Domingo Basin<br />
Albuquerque - Belen<br />
Basin<br />
Lucero uplift<br />
Landron Uplift<br />
San Agustin<br />
Basin<br />
Black Range<br />
Uplift<br />
Cuchillo Negra<br />
Uplift<br />
Eagle Basin<br />
Palomas Basin<br />
Mimbres Basin<br />
Potrillo Volcanic<br />
Field<br />
COLORADO<br />
Normal Fault<br />
Thrust Fault<br />
Upper Arkansas Graben<br />
High-angle Reverse Fault<br />
Sangre De Cristo<br />
Uplift<br />
Española Basin<br />
Sandia Uplift<br />
Manzano Uplift<br />
Los Pinos Uplift<br />
Socorro Constriction<br />
San Marcial Basin<br />
Fra Cristobal Uplift<br />
Sacramento Uplift<br />
Caballo Uplift<br />
Jornada Uplift<br />
Tularosa Uplift<br />
Mesilla Basin<br />
NEW<br />
MEXICO<br />
EXPLANATION<br />
Cenozoic Sedimentary Rocks (Riftfill)<br />
Tertiary Volcanic Rocks<br />
Precambrian Crystalline Rocks<br />
Figure 1: General location map of basins and uplifts along that part of the Rio Grand Rift that occurs within<br />
the United States (modified from Russell and Snelson, 1994).
CENOZOIC<br />
MESOZOIC<br />
PALEOZOIC<br />
ERA<br />
AGE<br />
RECENT<br />
PLEISTOCENE<br />
PLIOCENE<br />
MIOCENE<br />
OLIGOCENE (?)<br />
EOCENE<br />
PALEOCENE<br />
CRETACEOUS<br />
NIOBRARA<br />
BENTON<br />
JURASSIC<br />
TRIASSSIC<br />
PERMIAN<br />
PENNSYLVANIAN<br />
MISSISSIPPIAN<br />
DEVONIAN<br />
PRE-CAMBRIAN<br />
STRATAGRAPHIC<br />
FORMATIONS<br />
ALLUVIUM, DUNES,<br />
LANDSLIDES, SOIL ZONES<br />
OGALLALA FM<br />
DEVILS HOLE FM<br />
VOLCANIC INTRUSIONS,<br />
PLUGS, DIKES, SILLS<br />
INTRUDES ENTIRE SECTION<br />
FARASITA FM<br />
HUERFANO FM<br />
CUCHARA FM<br />
POISON CANYON FM<br />
RATON FM<br />
VERMEJO FM<br />
TRINIDAD SS<br />
PIERRE SH<br />
SMOKY HILL MARL<br />
FT HAYES LS<br />
CARLILE SH<br />
GREENHORN LS<br />
GRANEROS SH<br />
DAKOTA SS PURGATOIRE FM<br />
MORRISON<br />
WANAKAH<br />
ENTRADA<br />
DOCKUM GROUP<br />
BERNAL FM<br />
SAN ANDRESS LS<br />
GLORIETA SS<br />
YESO FM<br />
SANGRE DE<br />
CRISTO FM<br />
MAGDALENA GROUP<br />
TERERRO FM<br />
ESPIRTU SANTO FM<br />
MALFIC GNEISS<br />
METAQUARTZITE GROUP<br />
GRANITE & GRANITE GNEISS<br />
LITHOLOGY<br />
0 - 200'<br />
200 - 500'<br />
0 - 1500'<br />
0 - 1200'<br />
0 - 2000'<br />
0 - 5000'<br />
0 - 2500'<br />
0 - 2075'<br />
0 - 360'<br />
0 - 255'<br />
1300 - 2900'<br />
900'<br />
0 - 55'<br />
165 -225'<br />
20 - 70'<br />
175 - 400'<br />
140 -200'<br />
100 -150'<br />
150 - 400'<br />
30 - 100'<br />
40 - 100'<br />
0 - 1200'<br />
0 - 125'<br />
10 - 20'<br />
0 -200'<br />
200 - 400'<br />
700 - 5300'<br />
4000 - 5000'<br />
40 - 50'<br />
25'<br />
7000' ?<br />
5000' ?<br />
4000' ?<br />
THICKNESS<br />
OIL AND<br />
GAS SHOWS<br />
RATON COAL<br />
(GAS)<br />
VERMEJO COAL<br />
(GAS)<br />
NIOBRARA<br />
(OIL)<br />
?<br />
GRANEROS<br />
(OIL)<br />
POTENTIAL<br />
SOURCE ROCKS<br />
INTRUSIVES<br />
MIOCENE<br />
EXTENT OF<br />
INTRUSION<br />
SHALLOW<br />
GAS<br />
OBJECTIVE<br />
SECTION<br />
Figure 2: Generalized stratigraphic chart for the Albuquerque Basin (from Molenaar, 1988).<br />
R-potential reservoir rock; SR-potential source rock.
B<br />
Lucero Uplift<br />
Ladron<br />
Mtns<br />
Nacimento<br />
Mtns<br />
10<br />
Quaternary Alluvium<br />
Tertiary-Quaternary Sedimentary Rocks<br />
Tertiary Volcanic Rocks<br />
8<br />
4<br />
A<br />
2<br />
13<br />
14<br />
9<br />
5<br />
6<br />
3<br />
1<br />
C C'<br />
Rio<br />
Puerco<br />
BERNARDO<br />
BELEN<br />
BERNALILLO<br />
7<br />
11<br />
12<br />
ALBUQUERQUE<br />
Rio Grande<br />
0 10 20 Miles<br />
Paleozoic-Mesozoic Sedimentary Rocks<br />
Precambrian Crystalline Rocks<br />
High Mudweights used in Creataceous<br />
1 Shell Santa Fe-1, 11045', (P-C)<br />
2<br />
3<br />
4<br />
5<br />
Shell Santa Fe-2, 14305', (Tr)<br />
Shell Santa Fe-3, 10285', (Tr)<br />
Shell Laguna-1, 11115', (P-C)<br />
Shell Isleta-1, 16346', (P)<br />
6 Shell Isleta-2, 21260', (Tert.)<br />
7 Transocean Isleta-1, 10322', (P-C)<br />
8 Humble Santa Fe-1, 12690', (UK)<br />
9 Carpenter Atrisco-1, 6653', (Tert.)<br />
10 Humble Santa Fe, B1, 6016', (P-C)<br />
11 Grober-1, 6300', (Tert.)<br />
12 Norrins Realty-2, 5024', (Tert.)<br />
13 Shell 1-24 West Mesa, 19375', (Tr)<br />
14 UTEX 1-1J1E, (UK)<br />
Normal Fault<br />
Reverse Fault<br />
Transcurrent Fault<br />
Fault of Multiple Displacement<br />
Figure 3: Generalized geologic map of the Albuquerque Basin showing deep drillholes and seismic lines<br />
(modified from Russell and Snelson, 1994). Wells in which high (>10 lb.) mud was used while<br />
drilling through the Cretaceous section are also shown.<br />
B'<br />
Manzano<br />
Mtns<br />
A'<br />
Los<br />
Pinos<br />
Mtns<br />
Sandia<br />
Mtns<br />
Manzanita<br />
Mtns
Km<br />
2.5<br />
0<br />
-2.5<br />
-5.0<br />
-7.5<br />
-10.0<br />
WEST<br />
COLORADO<br />
PLATEAU<br />
Humble<br />
Feet Sante Fe B-1<br />
10,000<br />
High<br />
Mudweights<br />
Shell<br />
West Mesa Sante Fe-3<br />
Fault<br />
NORTH GRABEN BLOCK<br />
Shell<br />
Sante Fe-1<br />
EAST<br />
ALBUQUERQUE<br />
BENCH EASTERN STABLE BLOCK<br />
HAGAN EMBAYMENT<br />
Rio<br />
Feet<br />
Grande<br />
Rio Grande<br />
San Francisco- Espanaso<br />
10,000<br />
Fault<br />
Placitas Fault Ridge<br />
5,000<br />
5,000<br />
Sea Level<br />
-5,000<br />
-10,000<br />
-15,000<br />
-20,000<br />
-25,000<br />
-30,000<br />
A A'<br />
Cenozoic Rift Fill* Mesozoic Sedimentary Rocks Paleozoic Sedimentary Rocks Precambrian Crystalline Rocks<br />
*Note: Pre-rift lower Tertiary section indicted<br />
where decernable on Seismic or in wells<br />
Horizontal Scale = Vertical Scale<br />
Figure 4: Interpreted east-west seismic cross section of the northern part of the Albuquerque Basin. Line of section shown on Figure 3.<br />
High mud weights were used in the Shell No. 3 Santa Fe while drilling the Cretaceous section (modified from Russell and<br />
Snelson, 1984).<br />
Sea Level<br />
-5,000<br />
-10,000<br />
-15,000<br />
-20,000<br />
-25,000<br />
-30,000
N37°<br />
SAGUACHE<br />
ALAMOSA<br />
R 72 W R 70 W R 68 W<br />
R 66 W R 64 W R 62 W R 60 W<br />
NEW<br />
MEXICO<br />
COSTILLA<br />
COLORADO<br />
0 15 Miles<br />
0 20 Km<br />
COLORADO<br />
NEW MEXICO<br />
TAOS COLFAX<br />
W105°<br />
Huerfano River<br />
1.2<br />
1.2<br />
0.8<br />
0.7<br />
PUEBLO<br />
HUERFANO<br />
1.3<br />
1.1<br />
1.0<br />
Cucharas<br />
Stonewall Trinidad<br />
North Pontilo Creek<br />
1.5<br />
1.3<br />
1.4<br />
0.9<br />
Walsenburg<br />
0.9<br />
1.1<br />
1.0<br />
0.8<br />
0.7<br />
River<br />
Vermejo River<br />
Purgatoire River<br />
LAS ANIMAS<br />
River<br />
Apishapa<br />
EXPLANATION<br />
Low-volatile bituminus<br />
Medium-volatile bituminus<br />
High-volatile A bituminus<br />
High-volatile B bituminus<br />
High-volatile C bituminus<br />
Tertiary intrusive rocks<br />
T<br />
25<br />
S<br />
T<br />
27<br />
S<br />
T<br />
29<br />
S<br />
T<br />
31<br />
S<br />
T<br />
33<br />
S<br />
T35S<br />
T32N<br />
Eagle<br />
Nest<br />
0.7<br />
ARI Inc. (1991)<br />
Close (1988)<br />
Lake<br />
Cimarron<br />
Syncline<br />
T26N<br />
R 16 E R 18 E R 20 E R 22 E R 24 E R 26 E<br />
Raton<br />
Trinidad Sandstone-<br />
Pierre Shale contact<br />
Figure 5: Interpreted east-west seismic cross section of the central part of the Albuquerque<br />
Basin. Line of section shown on Figure 3. High mud weights were used in the Transocean<br />
No. 2 Isleta while drilling the Cretaceous section (modified from Russell and<br />
Snelson, 1984).<br />
T<br />
30<br />
N<br />
T<br />
28<br />
N
N37°<br />
SAGUACHE<br />
ALAMOSA<br />
R 72 W R 70 W R 68 W<br />
R 66 W R 64 W R 62 W R 60 W<br />
COLORADO<br />
NEW<br />
MEXICO<br />
COSTILLA<br />
0 15 Miles<br />
0 20 Km<br />
COLORADO<br />
NEW MEXICO<br />
TAOS COLFAX<br />
W105°<br />
Raton Basin synclinal axis<br />
Stroud Apache<br />
Canyon area<br />
PUEBLO<br />
HUERFANO<br />
Amoco Cottontail<br />
Pass unit<br />
Stonewall Trinidad<br />
Raton<br />
Basin synclonal axis<br />
Walsenburg<br />
Lorencito<br />
Canyon area<br />
Evergreen Spanish<br />
Peak unit<br />
C.I.S. exploration<br />
project<br />
EXPLANATION<br />
Producing area<br />
Potential producing area<br />
Syncline<br />
Cimarron<br />
T26N<br />
R 16 E R 18 E R 20 E R 22 E R 24 E R 26 E<br />
Raton<br />
LAS ANIMAS<br />
Trinidad Sandstone-<br />
Pierre Shale contact<br />
Figure 6: Interpreted east-west seismic cross section of the southern part of the Albuquerque<br />
Basin. Line of section shown on Figure 3. The east part of the cross section was constructed<br />
from geologic inference and is not based on seismic data. High mud weights were used<br />
while drilling the Humble no. 1 Santa Fe and Pacific well (modified from Russell and<br />
Snelson, 1984).<br />
T<br />
25<br />
S<br />
T<br />
27<br />
S<br />
T<br />
29<br />
S<br />
T<br />
31<br />
S<br />
T<br />
33<br />
S<br />
T35S<br />
T32N<br />
T<br />
30<br />
N<br />
T<br />
28<br />
N
N37°<br />
SAGUACHE<br />
ALAMOSA<br />
R 72 W R 70 W R 68 W<br />
R 66 W R 64 W R 62 W R 60 W<br />
COLORADO<br />
NEW<br />
MEXICO<br />
COSTILLA<br />
0 15 Miles<br />
0 20 Km<br />
COLORADO<br />
NEW MEXICO<br />
TAOS COLFAX<br />
W105°<br />
PUEBLO<br />
HUERFANO<br />
Huerfano River River<br />
25<br />
35<br />
West Spanish<br />
Peak<br />
Stonewall Trinidad<br />
25 20<br />
15<br />
La Veta<br />
East Spanish<br />
Peak<br />
North Pontilo Creek<br />
15<br />
45<br />
Casa Grande<br />
10<br />
Walsenburg<br />
Cucharas<br />
Vermejo River<br />
Purgatoire River<br />
LAS ANIMAS<br />
EXPLANATION<br />
>400<br />
300 - 400<br />
200 - 300<br />
Eagle<br />
100 - 200<br />
Nest<br />
Lake<br />
Cimarron<br />
Lucero Uplift<br />
B<br />
Ladron<br />
Mtns<br />
Nacimento<br />
Mtns<br />
8<br />
4<br />
95<br />
A<br />
10<br />
200<br />
427<br />
300<br />
2<br />
122<br />
400<br />
200<br />
3<br />
338<br />
13<br />
14<br />
9<br />
5<br />
294<br />
6<br />
454<br />
100<br />
300<br />
1<br />
205<br />
7<br />
0<br />
C C'<br />
Rio<br />
Puerco<br />
Quaternary Alluvium<br />
Tertiary-Quaternary Sedimentary Rocks<br />
Tertiary Volcanic Rocks<br />
Paleozoic-Mesozoic Sedimentary Rocks<br />
BERNARDO<br />
BELEN<br />
BERNALILLO<br />
11<br />
12<br />
ALBUQUERQUE<br />
Rio Grande<br />
0 10 20 Miles<br />
0<br />
B'<br />
Manzano<br />
Mtns<br />
A'<br />
Los<br />
Pinos<br />
Mtns<br />
Sandia<br />
Mtns<br />
Precambrian Crystalline Rocks<br />
High Mudweights used in Creataceous<br />
454 Control Point<br />
400<br />
Contour interval : 100 Feet<br />
1 Shell Santa Fe-1, 11045', (P-C)<br />
2<br />
3<br />
4<br />
5<br />
Manzanita<br />
Mtns<br />
Shell Santa Fe-2, 14305', (Tr)<br />
Shell Santa Fe-3, 10285', (Tr)<br />
Shell Laguna-1, 11115', (P-C)<br />
Shell Isleta-1, 16346', (P)<br />
6 Shell Isleta-2, 21260', (Tert.)<br />
7 Transocean Isleta-1, 10322', (P-C)<br />
8 Humble Santa Fe-1, 12690', (UK)<br />
9 Carpenter Atrisco-1, 6653', (Tert.)<br />
10 Humble Santa Fe, B1, 6016', (P-C)<br />
11 Grober-1, 6300', (Tert.)<br />
12 Norrins Realty-2, 5024', (Tert.)<br />
13 Shell 1-24 West Mesa, 19375', (Tr)<br />
14 UTEX 1-1J1E, (UK)<br />
Normal Fault<br />
Reverse Fault<br />
Transcurrent Fault<br />
Fault of Multiple Displacement<br />
Figure 8: Isopach map of the Eocene Galistero and Baca formations, Albuquerque Basin, using data<br />
from Lozinsky (1994, Table 1).
Lucero Uplift<br />
B<br />
Ladron<br />
Mtns<br />
Nacimento<br />
Mtns<br />
8<br />
4<br />
A<br />
1051<br />
10<br />
1097<br />
2<br />
22<br />
1500<br />
13<br />
14<br />
9<br />
1000<br />
1000<br />
5<br />
6<br />
3<br />
2075<br />
1500<br />
2523<br />
2500<br />
2000<br />
991<br />
1<br />
7<br />
11<br />
205<br />
C C'<br />
Rio<br />
Puerco<br />
Quaternary Alluvium<br />
Tertiary-Quaternary Sedimentary Rocks<br />
Tertiary Volcanic Rocks<br />
Paleozoic-Mesozoic Sedimentary Rocks<br />
BERNARDO<br />
BELEN<br />
BERNALILLO<br />
12<br />
ALBUQUERQUE<br />
Rio Grande<br />
0 10 20 Miles<br />
0<br />
0<br />
1 Shell Santa Fe-1, 11045', (P-C)<br />
2<br />
3<br />
4<br />
5<br />
Shell Santa Fe-2, 14305', (Tr)<br />
Shell Santa Fe-3, 10285', (Tr)<br />
Shell Laguna-1, 11115', (P-C)<br />
Shell Isleta-1, 16346', (P)<br />
6 Shell Isleta-2, 21260', (Tert.)<br />
7 Transocean Isleta-1, 10322', (P-C)<br />
8 Humble Santa Fe-1, 12690', (UK)<br />
9 Carpenter Atrisco-1, 6653', (Tert.)<br />
10 Humble Santa Fe, B1, 6016', (P-C)<br />
11 Grober-1, 6300', (Tert.)<br />
12 Norrins Realty-2, 5024', (Tert.)<br />
13 Shell 1-24 West Mesa, 19375', (Tr)<br />
14 UTEX 1-1J1E, (UK)<br />
Figure 9: Isopach map of the Eocene Galistero and Baca formations and unnamed “unit of Isleta #2 well”<br />
(late Eocene to late Oligocene?) identified by Lozinsky (1994) in the Shell No. 2 Isleta well in sec. 16,<br />
T. 8N., R. 2E. All thickness data used is from Lozinsky (1994, Table 1). The approximate area where<br />
the top of the Cretaceous section had achieved a temperature of 100 °C at the end of the time period<br />
represented by the isopach interval is shown. The isotherm assumes that the average present-day<br />
geothermal gradient of 2.0 °F/100 ft (see fig. 8).<br />
B'<br />
Manzano<br />
Mtns<br />
A'<br />
Los<br />
Pinos<br />
Mtns<br />
Sandia<br />
Mtns<br />
Precambrian Crystalline Rocks<br />
High Mudweights used in Creataceous<br />
454 Control Point<br />
1000<br />
Contour interval : 500 Feet<br />
Manzanita<br />
Mtns<br />
Normal Fault<br />
Reverse Fault<br />
Transcurrent Fault<br />
Fault of Multiple Displacement
Lucero Uplift<br />
B<br />
Ladron<br />
Mtns<br />
Nacimento<br />
Mtns<br />
8<br />
4<br />
A<br />
10<br />
2591<br />
50<br />
1245<br />
30<br />
13<br />
14<br />
60<br />
9<br />
5482<br />
5<br />
20<br />
6<br />
3<br />
10<br />
20<br />
30<br />
40<br />
50<br />
3679<br />
1<br />
1110<br />
BERNALILLO<br />
7<br />
1384<br />
1236<br />
C 40<br />
C'<br />
2511<br />
2<br />
BELEN<br />
11<br />
Rio<br />
Puerco<br />
Quaternary Alluvium<br />
Tertiary-Quaternary Sedimentary Rocks<br />
Tertiary Volcanic Rocks<br />
Paleozoic-Mesozoic Sedimentary Rocks<br />
BERNARDO<br />
10<br />
12<br />
ALBUQUERQUE<br />
Rio Grande<br />
B'<br />
Manzano<br />
Mtns<br />
0 10 20 Miles<br />
A'<br />
Los<br />
Pinos<br />
Mtns<br />
Sandia<br />
Mtns<br />
1 Shell Santa Fe-1, 11045', (P-C)<br />
2<br />
3<br />
4<br />
5<br />
Precambrian Crystalline Rocks<br />
High Mudweights used in Creataceous<br />
2511 Control Point<br />
20 Contour interval : 1000 Feet<br />
Manzanita<br />
Mtns<br />
Shell Santa Fe-2, 14305', (Tr)<br />
Shell Santa Fe-3, 10285', (Tr)<br />
Shell Laguna-1, 11115', (P-C)<br />
Shell Isleta-1, 16346', (P)<br />
6 Shell Isleta-2, 21260', (Tert.)<br />
7 Transocean Isleta-1, 10322', (P-C)<br />
8 Humble Santa Fe-1, 12690', (UK)<br />
9 Carpenter Atrisco-1, 6653', (Tert.)<br />
10 Humble Santa Fe, B1, 6016', (P-C)<br />
11 Grober-1, 6300', (Tert.)<br />
12 Norrins Realty-2, 5024', (Tert.)<br />
13 Shell 1-24 West Mesa, 19375', (Tr)<br />
14 UTEX 1-1J1E, (UK)<br />
Normal Fault<br />
Reverse Fault<br />
Transcurrent Fault<br />
Fault of Multiple Displacement<br />
100 °C at top of Cretaceous 150 °C at top of Cretaceous<br />
Figure 10: Isopach map of the total present-day thickness of Tertiary rocks in the Albuquerque Basin using<br />
subsurface drillhole data of Lozinsky (1994, Table 1). Tertiary faults are ignored and hence the isopach<br />
map is generalized. The approximate areas where the top of the Cretaceous has achieved a temperature<br />
of 100 °C and 150 °C at the present are shown. The isotherms assume an average present-day<br />
geothermal gradient of 2.0 °F/100 ft (see fig. 8).
0<br />
3995'<br />
72'<br />
50 MY<br />
66 MY<br />
4000'<br />
81.5 MY<br />
2593'<br />
95 MY<br />
SHELL<br />
#3 SANTA FE<br />
DAKOTA<br />
GRADIENT<br />
1.9°/100'<br />
0<br />
2969'<br />
50 MY<br />
66 MY<br />
81.5 MY<br />
95 MY<br />
EXPLANATION<br />
673'<br />
4000'<br />
2070' REMAINING<br />
COALS ABOVE<br />
POINT LOOKOUT<br />
POINT LOOKOUT<br />
MANCOS<br />
(SOURCE)<br />
2222'<br />
SHELL<br />
#1 SANTA FE<br />
Sandstone with Shale<br />
Mainly Shale<br />
DAKOTA<br />
GRADIENT<br />
2.1°/100'<br />
Coal<br />
0<br />
8540'<br />
25 MY<br />
7169'<br />
40 MY<br />
1109'<br />
50 MY<br />
66 MY<br />
4000'<br />
736' REMAINING<br />
81.5 MY<br />
POINT LOOKOUT<br />
MANCOS<br />
(SOURCE)<br />
2071'<br />
95 MY<br />
SHELL<br />
1-24 WEST MESA<br />
Missing Interval<br />
POINT LOOKOUT<br />
MANCOS<br />
(SOURCE)<br />
DAKOTA<br />
GRADIENT<br />
1.7°/100'<br />
0' REMAINING<br />
Figure 11: Stratigraphic diagrams showing present-day thicknesses and ages of rocks in the three wells<br />
used for burial reconstructions.
Depth (feet)<br />
25000<br />
20000<br />
15000<br />
10000<br />
5000<br />
EXPLANATION<br />
Depth (feet)<br />
Linear [Depth (feet)]<br />
150 °C<br />
100 °C<br />
0 0 2 4 6 8 10 12<br />
Mudweight (pounds)<br />
Figure 12: Graph of mud weight versus depth for the nine wells listed in Table 4. Approximate depth to<br />
the 100 °C and 150 °C isotherms are shown assuming an average geothermal gradient of<br />
2.0 °F/100 ft for the entire Albuquerque Basin.
Depth Subsurface (feet)<br />
0<br />
2000<br />
4000<br />
6000<br />
8000<br />
Shell #3 Sante Fe<br />
K P E O M P R Fm<br />
100°(F)<br />
10000 150 100 50 0<br />
Age (my)<br />
200°(F)<br />
t=0<br />
Tert<br />
Sandstone<br />
Mesaverde 1<br />
Mancos<br />
Dakota<br />
Figure 13: Burial reconstruction showing thicknesses of sediments and temperatures on °F for the Shell No. 3 Santa Fe well<br />
in sec. 28, T. 13N., R. 1E. Location of well shown on Figure 3.
Depth Subsurface (feet)<br />
0<br />
2000<br />
4000<br />
6000<br />
K<br />
Shell #1 Sante Fe<br />
100°(F)<br />
8000 150 100 50 0<br />
Age (my)<br />
P E O M P R Fm<br />
200°(F)<br />
t=0<br />
Tert<br />
Sandstone<br />
Mesaverde 1<br />
Mancos<br />
Figure 14: Burial reconstruction showing thicknesses of sediments and temperatures in °F for the Shell No. 1 Santa Fe well<br />
in sec. 18, T. 13N., R. 3E. Location of weltl shown on Figure 3.<br />
Dakota
Depth Subsurface (feet)<br />
0<br />
5000<br />
10000<br />
15000<br />
Shell 1-24 West Mesa<br />
K P E O M P R Fm<br />
100°(F)<br />
20000 150 100 50 0<br />
Age (my)<br />
100(F)<br />
200°(F)<br />
300°(F)<br />
t=0<br />
Tert<br />
Tert 1<br />
Sandstone<br />
Mancos<br />
Figure 15: Burial reconstruction showing thicknesses of sediments and temperatures in °F for the Shell No. 1-24 West Mesa well<br />
in sec. 24, T. 11N., R. 1E. Location of well shown on Figure 3.<br />
Dakota
Rate of Oil Generation (mg/g TOC*my)<br />
40<br />
30<br />
20<br />
10<br />
Shell 1-24 West Mesa<br />
K P E O M P R<br />
0 Mancos<br />
150 100 50 0<br />
Age (my)<br />
Figure 16: Rate of oil generation in milligrams (mg) per gram (g) of total organic carbon (TOC) per million years (my) at the base of the<br />
Cretaceous Mancos Shale in the Shell No. 1-24 West Mesa well in sec. 24, T. 11N., R. 1E. Location of well shown on Figure 3.
Rate of Gas Generation (mg/g TOC*my)<br />
8<br />
6<br />
4<br />
2<br />
Shell 1-24 West Mesa<br />
K P E O M P R<br />
0<br />
150 100 50 0<br />
Age (my)<br />
Figure 17: Rate of gas generation in milligrams (mg) per gram (g) of total organic carbon (TOC) per million years (my) at the base of the Cretaceous<br />
Mancos Shale in the Shell No. 1-24 West Mesa well in sec. 24, T. 11N., R. 1E. The second peak, which began about 5 ma is due to the breakdown<br />
of oil to gas. Location of well shown on Figure 3.<br />
Mancos
NUMBER OF WILDCATS<br />
10<br />
9<br />
8<br />
7<br />
6<br />
5<br />
4<br />
3<br />
2<br />
1<br />
ALBUQUERQUE BASIN<br />
WILDCAT HISTORY<br />
PRIMARY<br />
TERTIARY<br />
EXPLORATION<br />
1900 1910 1920 1930 1940 1950 1960 1970 1980<br />
YEARS<br />
PRIMARY<br />
MESOZOIC<br />
EXPLORATION<br />
SHELL'S<br />
PROGRAM<br />
Figure 18: Histogram showing exploration activity in the Albuquerque Basin from 1900 to 1984 (modified from Black, 1982).
Corrected temperature, in degrees Fahrenheit<br />
0 1000 2000 3000 4000 5000 6000 7000<br />
450<br />
400<br />
350<br />
300<br />
250<br />
200<br />
150<br />
100<br />
50<br />
Albuquerque Basin, composite<br />
2438 m<br />
2591 m<br />
3139 m<br />
Depth, in meters<br />
3962 m<br />
0<br />
0 5000 10000 15000 20000 25000<br />
100 °C<br />
Depth, in feet<br />
Figure 19: Bottom-hole temperatures recorded during logging runs for selected deep tests in the Albuquerque Basin. The geothermal<br />
gradients listed are average values for the entire hole calculated from uncorrected bottom-hole temperatures assuming a mean<br />
annual surface temperature of 45 °F.
ABSTRACT<br />
IS THERE A BASIN-CENTER GAS ACCUMULATION<br />
IN THE DEEP ANADARKO BASIN ?<br />
By Michael S. Wilson, Consulting Geologist<br />
Well data, formation test results and published studies of abnormal pressures, methane isotopes and thermal<br />
maturity were reviewed to evaluate the possibility that a basin-center gas accumulation might exist within the<br />
regionally overpressured Mississippian and Pennsylvanian-age Atoka, Morrow and Springer Groups or in the<br />
Mississippian and Devonian-age Woodford Shale in the central Anadarko basin, Oklahoma.<br />
The Woodford Shale is a laterally extensive, organic-rich source rock which has passed completely through the<br />
gas generation window in the deepest parts of the basin, but it does not appear to have developed overpressures on a<br />
regional scale. A review of drilling mud weights and pressure data indicate that the Woodford-Hunton interval has<br />
generally been drilled with 9 to 10.5 ppg mud and appears to be normally to subnormally pressured throughout most<br />
of the central basin. The underlying Hunton Group contains high permeability zones which frequently produce<br />
subnormally or normally pressured salt water. Hydrocarbons expelled from the Woodford Shale may have migrated<br />
downward into the Hunton aquifer and then moved laterally into structural and stratigraphic traps. Two isolated<br />
overpressured compartments were identified where high mud weights and unusual casing designs were used for the<br />
Woodford section. These appear to be uplifted fault blocks where structural juxtaposition of the Woodford Shale and<br />
overpressured Springer shales may have locally modified the typical plumbing system. The Woodford Shale does<br />
not appear to fit the basin-center gas model on a regional scale.<br />
The Atoka-Morrow-Springer section has many characteristics of known basin-center gas accumulations,<br />
including mature, gas-prone source rocks, temperatures greater than 200 °F, severe overpressures, tight sandstone<br />
reservoirs, and extensive gas production. However, formation test data and published descriptions of known gas<br />
fields reveal numerous examples of gas-water contacts and water production within the overpressured section. Most<br />
commercial gas accumulations have been found in traditional structural and/or stratigraphic traps, but many of the<br />
known gas reservoirs are water-saturated below distinct gas-water contacts. The available porosity in the reservoirs<br />
was apparently not fully charged with gas. Perhaps the source rocks were not rich enough, or perhaps they cooled<br />
down and ceased gas expulsion too early, so that the porosity available in the numerous sandstones was not<br />
completely gas-saturated. Depending on current interpretations of just how much moveable water is allowable in a<br />
‘continuous-type’ gas accumulation, the overpressured Atoka-Morrow-Springer section appears to contains too much<br />
moveable water. It does not quite fit the basin-center gas model on a regional scale.<br />
Several reservoir zones within the deep Anadarko Basin may be completely gas-saturated on a local scale. Well<br />
data and formation tests at North Broxton Field (T. 6 N., R. 12 W., Caddo County, Oklahoma) and Elk City Field<br />
(T. 10 N., R. 20 - 21 W., Washita and Beckham Counties, Oklahoma) indicate severe overpressures, high<br />
temperatures, prolific gas production and almost no water production from the Springer section at depths of<br />
approximately 18,500 to 20,500 feet. Further study of formation test results and detailed log analyses are<br />
recommended to determine if the deep Springer section might contain a small-scale basin-center gas accumulation.<br />
INTRODUCTION<br />
Well data, formation test results and published studies of abnormal pressures, methane isotopes, source rocks<br />
and thermal maturity were evaluated to determine if a basin-center gas accumulation might exist within the<br />
Mississippian and Devonian-age Woodford Shale or in the overpressured Mississippian and Pennsylvanian-age<br />
Atoka, Morrow and Springer section within the central Anadarko basin of western Oklahoma and northern Texas.<br />
Extensive overpressuring, high reservoir temperatures, mature source rocks, tight sandstone reservoirs and prolific<br />
gas production indicate that a continuous, basin-center gas accumulation might occur within this basin. However,<br />
detailed investigations of well logs and test results from several gas fields and various exploration wells show that
eservoirs with distinct downdip gas-water contacts have been found frequently within the overpressured zone. The<br />
porosity available within the overpressured mega-compartment may be only partly saturated with gas.<br />
GEOLOGIC SETTING<br />
The Anadarko basin (fig. 1) is a Pennsylvanian and Permian-age foreland depocenter located along a Cambrianage<br />
aulacogen (rift) in central Oklahoma, southwestern Kansas and northern Texas. The tectonic history of the<br />
region has been described by Brewer and others (1983), Hill (1984), Perry (1989), and Price (1998a). The basin is<br />
bounded on the south by the Wichita Frontal Fault Zone, a complex series of strike-slip and reverse faults along the<br />
northern edge of the Amarillo-Wichita Uplift (McConnell and others, 1990; Price, 1998a). Interpretations of seismic<br />
data acquired by COCORP (Brewer and others, 1983) show that basement blocks were thrust over the southern part<br />
of the basin along several reverse faults dipping 30 to 40 degrees to the southwest (fig. 2). Basement is<br />
approximately 35,000 to 40,000 feet below the surface in the deepest part of the basin (Perry, 1989). The basin<br />
becomes shallower to the north and emerges into a broad, shallow shelf in northwestern Oklahoma and southern<br />
Kansas.<br />
STRATIGRAPHY<br />
The sedimentary section in the Anadarko basin (fig. 3) includes shallow marine carbonates and clastics ranging<br />
from Cambrian through Silurian age, truncated by a regional unconformity at the top of the Silurian Hunton Group.<br />
The unconformity is covered by several hundred feet of Devonian and Lower Mississippian-age Woodford Shale and a<br />
thick section of shallow marine carbonates. These are overlain by marine and deltaic clastic rocks of Upper<br />
Mississippian through Permian age, including numerous sandstone and conglomerate units within the Springer,<br />
Morrow and Atoka Groups. Pennsylvanian-age arkosic conglomerates (Granite Wash) interfinger with the marine<br />
and deltaic section along the flanks of the Amarillo-Wichita Uplift.<br />
SOURCE ROCKS AND THERMAL MATURITY<br />
Hydrocarbon source rocks in the Anadarko basin include oil-prone shales in the Ordovician-age Viola Group, oilprone<br />
marine shales in the Mississippian and Devonian-age Woodford Shale, and gas-prone marine and deltaic shales<br />
in the Mississippian and Pennsylvanian-age Caney Formation, Springer Group and Pennsylvanian-age Morrow<br />
Group (Wang, 1993; Wang and Philp, 1997). Powers (1994) suggested that Caney, Springer and Morrow shales<br />
have high potential for hydrocarbon generation. The Caney Formation was deposited in deep marine environments<br />
within the southern Anadarko basin, and contains black-colored, bituminous shale with occasional siderite nodules<br />
(Peace, 1994). Upper Springer and Morrow shales were deposited in prodelta and delta environments (Al-Shaieb and<br />
others, 1990) and are described as gray to black-colored with thin coal seams and dispersed lignite fragments. Burruss<br />
and Hatch (1992) noted that Pennsylvanian-age Morrow and Springer shales are one of the three major source rock<br />
sections in the Anadarko Basin, and have gas-prone, Type III kerogen and TOC values greater than 1%. Wang<br />
(1993) found average TOC values of 1.65 % in Springer shale samples and 1.0% in Morrow shale samples. Plots of<br />
Hydrogen Index versus T-Max indicate that these source rocks contain mostly Type III, gas-prone kerogen. Price and<br />
others (1981) found TOC values ranging from 0.9% to 1.7% in the Morrow-Springer-Goddard section at 18,400 to<br />
22,500 ft in the Bertha Rogers No. 1 well (Washita County, Oklahoma).<br />
Vitrinite reflectance in the Morrow group ranges from less than 0.5% in the northern shelf near the Oklahoma-<br />
Kansas border to more than 3 % in the central Anadarko basin (Al Shaieb and others, 2000). Recent thermal<br />
maturity models indicate that the Atokan, Morrow and Springer Groups have been buried within the oil and gas<br />
generation window in the central Anadarko basin since the end of Pennsylvanian time (Carter and others, 1998).
The Woodford Shale has been studied by Pawlewicz (1989), Cardott and Lambert (1986, 1987), Comer and<br />
Hinch (1987), Cardott (1989), Hester and others (1990), Roberts and Mitterer (1992), Wang (1993), Price (1997),<br />
and Gallardo and Blackwell (1999). The Woodford ranges from 100 to 300 feet thick in the deep part of the basin. It<br />
unconformably overlies limestones and dolomites of the Devonian-age Hunton Group, and is covered by the<br />
Mississippian-age Osage, St. Louis and St. Genevieve Limestones. The Woodford is a rich, oil-prone source rock<br />
containing Type I and II kerogen. Hester and others (1990) and Wang (1993) described average total organic content<br />
(TOC) of 3 to 5%. Comer and Hinch (1987) noted TOC values ranging from 5.5 to 8.1% and abundant bitumen<br />
residue.<br />
Maps of vitrinite reflectance of the Woodford Shale (Cardott and Lambert, 1986; Cardott, 1989; Gallardo and<br />
Blackwell, 1999) show values of 0.5 to 1.0 %Ro along the shallow northern shelf, and much higher values in the<br />
deep basin. A generalized vitrinite reflectance versus depth profile (fig. 4) shows that Ro exceeds 1% at depths below<br />
10,000 feet, 2% below 20,000 feet and reaches 4 % below 24,000 feet (Pawlewicz, 1989; Price, 1997; Price and<br />
others, 1981). Reflectance values as high as 4.8% have been measured in the Woodford within a deep ‘hot spot’ in<br />
Roger Mills and Beckham Counties, just north of the Wichita Frontal Fault Zone. The Woodford Shale is still<br />
within the oil window along the shallow flanks and northern shelf of the basin, but it passed completely through the<br />
gas maturity phase in the deepest part of the basin by the end of Permian time (Carter and others, 1998).<br />
McMechan and Conway (1983) noted that the Anadarko basin has some of the lowest thermal gradients in<br />
the continental United States. Kennedy (1982) presented a temperature profile for deep wells drilled in the Anadarko<br />
basin, with a shallow temperature gradient of 1.0 °F/100 ft down to the top of the Morrow, and a steeper temperature<br />
gradient of 1.2 °F/100 ft through the overpressured Morrow-Springer-Caney section. Pawlewicz (1989) calculated<br />
thermal gradients for 29 deep wells in the Anadarko Basin and found that temperatures generally increase at 1.0 to 1.3<br />
°F/100 ft. He noted that vitrinite reflectance measurements for several wells do not match the present-day<br />
temperatures, and suggested that significant cooling may have occurred in this basin. Schmoker (2000) suggested<br />
that at least 2,000 ft of sediments may have been eroded from the surface of the Anadarko basin since Cretaceous<br />
time, and may have contributed to recent cooling in the subsurface. Basin models presented by Al Shaieb and others<br />
(2000) show approximately 3,000 feet of uplift and erosion since the Laramide Orogeny.<br />
PRESSURES IN THE WOODFORD SHALE AND HUNTON GROUP<br />
Well data and drilling mud weights were reviewed to determine if abnormal pressures might occur within the<br />
Woodford Shale and underlying Hunton Group in the central Anadarko basin. Al-Shaieb and others (1994, 2000)<br />
indicate that the overpressured megacompartment complex extends down into the Woodford section. However, mud<br />
weight data for 40 deep wells scattered throughout the central basin (Table 1) indicate that the Woodford section has<br />
generally been drilled with 9 to 10.5 ppg mud at depths ranging from 11,100 to 27,500 feet. These moderate mud<br />
weights indicate near-normal pore pressures on a regional scale. The Woodford has passed completely through the<br />
gas window, but the absence of regional overpressuring indicates that hydrocarbons expelled from the Woodford may<br />
have escaped into other zones without developing overpressures. Hydrocarbon-charged overpressure has apparently<br />
not been sustained within the Woodford interval on a regional scale.<br />
The Woodford Shale section appears to be locally overpressured in two isolated compartments located in T. 10<br />
N., R. 24-25 W., and in T. 8-9 N., R. 16-17 W. High mud weights and unusual casing designs were used in two<br />
deep wells at Southwest New Liberty Field: M.R.T Sanders Unit No. 1 (Sec. 24, T. 10 N., R. 25 W.) and M. R. T.<br />
Kirtley Unit No. 1 (Sec. 19, T. 10 N., R. 24 W.). Casing was set just above the Woodford in each of these wells<br />
and the Woodford was penetrated using 15.2 and 16.5 ppg mud, indicating that overpressuring may have been a<br />
problem. Liner was set at the base of the Woodford, and the deeper Hunton section was drilled using only 9.8 and<br />
9.4 ppg mud. A bottom hole pressure of 12,000 psi was reported in a gas-productive Hunton reservoir at 23,920 -<br />
24,996 feet (0.49 psi/ft) indicating near-normal pressure (Kennedy, 1982). The reason for casing off the Woodford<br />
before drilling into the Hunton is unclear, but may involve M.R.T Company’s special drilling practices or an<br />
unusual structural geometry. Unusually high drilling mud weights were also used in two wells which penetrated the<br />
Woodford Shale in the Cordell Fold Belt (Kennedy, 1982). The Phillips Wesner A No. 1 well (Sec. 35, T. 9 N., R.
17 W., Washita County) and the Forest Oil Bobwhite No. 1 (Sec. 16, T. 8 N., R. 16 W., Washita County) used<br />
18.1 ppg and 17.5 ppg drilling mud while drilling through the Woodford-Hunton section, indicating severe<br />
overpressuring. These wells may have penetrated uplifted fault blocks where the Woodford-Hunton section in the<br />
hanging wall is juxtaposed against the regionally overpressured Springer-Caney section in the footwall. Local<br />
overpressuring of the Woodford may have been caused by high-pressure gas and/or fluids from the Springer section<br />
which migrated across the fault zone. Detailed structural analyses are recommended to confirm the source of high<br />
pressures in these specific compartments.<br />
The Hunton group appears to be regionally water saturated, with gas trapped in conventional structural and/or<br />
stratigraphic traps. Normally or sub-normally pressured gassy salt water has been recovered during many formation<br />
tests of the deep Hunton reservoirs, and distinct gas-water contacts are noted on several Hunton structure maps and<br />
field descriptions (Kennedy, 1982). The OSU-GRI online database lists seventeen pressure data points for the Hunton<br />
Group in Wheeler County, Texas. All of these formation tests found near-normal pressure gradients (0.39 to 0.47<br />
psi/ft); no overpressures were encountered. Thirteen data points are listed for deep Hunton tests in Roger Mills<br />
County, Oklahoma, and all have pressure gradients ranging from 0.36 to 0.47 psi/ft. Of four pressure data points<br />
listed for deep Hunton tests in Beckham County, Oklahoma, three indicate normal pressures (0.43 psi at 24, 950<br />
feet; 0.45 psi/ft at 24,850 ft and 0.49 psi/ft at 16,824 feet). Moderate overpressure (0.61 psi/ft) was reported in the<br />
Hunton Fm at 24,200 feet in the Exxon Green well at Northeast Mayfield Field (Sec. 3, T. 10 N., R. 25 W.,<br />
Beckham County). This appears to be another uplifted fault-block structure (Kennedy, 1982) where the Hunton<br />
section in the hanging wall may be juxtaposed with overpressured Springer-Caney shales in the foot wall.<br />
Overpressure is rare in the deep Hunton reservoirs; normal to subnormal pressures are most common.<br />
DISCUSSION: DOES THE WOODFORD FIT THE BASIN-CENTER MODEL ?<br />
As noted above, the Woodford Shale is a thin but organic-rich hydrocarbon source rock and is thermally mature<br />
to post-mature in the deep basin. The Woodford may have expelled as much as 22 billion barrels of bitumen and 16<br />
billion barrels of saturated hydrocarbons (Comer and Hinch, 1987). Thick, tight, Mississippian limestones with very<br />
low porosity should have made an effective regional seal above the Woodford, and should have trapped hydrocarbons -<br />
and excess pore pressures - within the Woodford interval. But the mud weight data listed in Table 1 indicate that the<br />
Woodford is not regionally overpressured (with the exception of two locally overpressured areas described above). The<br />
underlying Hunton section is generally normally or subnormally pressured.<br />
The absence of regional overpressure may be due to high permeability zones within the Hunton dolomites.<br />
Bebout and others (1993, Table 28) list permeabilities ranging from 0.01 to 30 mD in deep Hunton reservoirs, with<br />
average values ranging from 9 to 15 mD. These values greatly exceed the 0.1 to 1 mD threshold typically found in<br />
known basin-center gas accumulations. Hydrocarbons expelled from the Woodford source rock may have escaped<br />
downward into permeable zones within the Hunton, and may have been able to migrate into other zones relatively<br />
easily, without developing extensive overpressures. The combination of impermeable top seal, rich source rock and<br />
permeable underlying reservoir zones, saturated with normally to sub-normally pressured hydrocarbons and salt water,<br />
does not appear to match the typical basin-center gas model.<br />
OVERPRESSURES IN THE ATOKA, MORROW AND SPRINGER GROUPS<br />
Abnormal pressures within the Atoka, Morrow and Springer Groups have been described by Breeze (1971),<br />
Bradley and Powley (1994), Al-Shaieb (1991), and Al-Shaieb and others (1992; 1994; 1999). A regionally extensive<br />
“mega-compartment complex” (MCC) has been identified in the central Anadarko basin. The MCC contains many<br />
different abnormally pressured compartments, which are thought to be laterally bounded by cement-filled fault zones<br />
and sealed by impermeable bands of silica and calcite-cemented sandstone and shale (Price, 1998a and 1998b, Al-<br />
Shaieb, 2000). The top of overpressuring cuts across stratigraphic units at depths of 10,000 to 12,000 feet.
An online database of pressure measurements, pressure gradients and pressure versus depth plots for the<br />
Anadarko basin has been generated by Dr. Al-Shaieb and his associates at Oklahoma State University (OSU) and the<br />
Gas Research Institute (GRI). The pressure data are based on well reports available from Petroleum<br />
Information/Dwights Corporation, completion reports filed at the Oklahoma Oil and Gas Conservation Division, and<br />
Amoco well files (Al-Shaieb and others, 1992). Many of these pressure data points were derived from bottom hole<br />
shut-in pressures and drill-stem tests, and some were extrapolated from shut-in tubing pressures. Work in progress<br />
to describe the various fluid types found in different pressure compartments was summarized by Al-Shaieb and others<br />
(1999).<br />
Figures 5a and 5b show pore pressure versus depth plots for Roger Mills and Beckham Counties in the central<br />
Anadarko basin, based on pressure data retrieved from the OSU-GRI pressure database. In Roger Mills County,<br />
normal and sub-normal pressures are found down to depths of approximately 10,000 to 12,000 feet. Overpressures<br />
are encountered in the Atoka, Morrow and Springer section, with pressure gradients reaching 0.83 to 0.94 psi/ft in<br />
several deep reservoirs. Overpressures occur below 12,500 feet in Beckham County (fig. 5b) and increase with depth<br />
through the Atoka, Morrow and Springer section down to about 19,500 feet. The deep Hunton section below<br />
24,000 feet deep is subnormally to normally pressured in two tests, but is overpressured in one localized<br />
compartment.<br />
Kennedy (1982, p. 70) and Kinchloe and others (1973) described typical drilling mud weights and casing points<br />
for deep wells in the central Anadarko basin. Mud weights of 9 to 10 pounds per gallon (ppg) are used to balance<br />
normal pore pressures down to approximately 10,000 feet. Mud weights are usually raised above 12 ppg to control<br />
increasing pore pressures within the Pennsylvanian Red Fork and Atoka section. Intermediate casing is usually set<br />
at approximately 12,500 feet to prevent lost circulation problems as the mud weight is increased. Mud weights are<br />
gradually raised to 16 ppg through the Morrow Group, and additional casing is often set at approximately 16,000<br />
feet. Mud weights as high as 18 ppg are often used while drilling through the severely overpressured Morrow,<br />
Springer, Goddard and Caney section. In ultra-deep Hunton-Arbuckle tests, casing is usually set just below the base<br />
of the Caney Shale, in the Flag or St. Genevieve Limestone. Then the mud weight is dropped to approximately 9.5<br />
ppg while the normally or sub-normally pressured Woodford-Hunton-Arbuckle is penetrated.<br />
Figure 6 shows the approximate extent of overpressuring in the Atoka-Morrow-Springer section. Detailed<br />
contour maps showing pressure gradients for the Red Fork, Morrow and Hunton Groups have been published by Al-<br />
Shaieb and others (1994), and maps of pressure gradients in Ellis, Custer and Dewey Counties have been published<br />
by Al-Shaieb and others (1992). Al Shaieb and others (2000) note that overpressure gradients greater than 0.6 psi/ft<br />
coincide with vitrinite reflectance values greater than 1.5%, and suggest that overpressuring is closely related to gas<br />
generation.<br />
SUBNORMAL PRESSURES ALONG THE NORTHERN SHELF<br />
Extensive subnormally pressured zones occur along the shallow northern shelf. The transition zones where<br />
overpressures merge into the sub-normal and normal pressures are complexly interfingered (Al-Shaieb and others,<br />
1992). The shallow northern shelf was not investigated as part of this project, but deserves further study because the<br />
pattern in the Springer-Morrow section resembles the typical pattern of a shrinking basin-center gas accumulation<br />
which has receded from its maximum extent due to recent erosion and cooling. This pressure pattern includes<br />
overpressure in the deepest part of the basin, sub-normal pressures along the shallow shelf, and normal pressures near<br />
outcrops. As noted above, the Anadarko basin may have lost 2,000 to 3,000 feet of overburden since Permian time<br />
and may have cooled, so the occurrence of sub-normal pressures is not unexpected.
DEEP GAS FIELDS IN THE ATOKA, MORROW AND SPRINGER GROUPS<br />
At least forty deep gas fields have been discovered within the regionally overpressured Atoka, Morrow and<br />
Springer section (Kennedy, 1982). This hydrocarbon system has many characteristics of a basin-center gas<br />
accumulation, including mature source rocks, high temperatures, abnormal pressures (0.8 to 0.94 psi/ft), and<br />
extensive gas production from tight sandstone reservoirs. As noted above, gas-prone, Type III source rocks are<br />
present in the clastic section, and vitrinite reflectance profiles indicate that these source rocks are mature and within<br />
the gas generation window. The composition of the produced gas is generally 94 to 97% methane, 1 to 1.5%<br />
ethane, 1 to 1.5% CO2 and 1 to 2% nitrogen (Kennedy, 1982). Carbon 13 isotope values generally range from -37<br />
to -43, indicating thermogenic origins from mature source rocks (Rice and others, 1988). Reservoir temperatures<br />
range from 200 to 360 °F in the deep producing zones.<br />
Sandstone reservoirs with moderate to very low porosity and permeability are interbedded with the source rocks.<br />
Porosity trends for Morrow and Springer sandstones have been described by Hester and Schmoker (1990), Hester<br />
(1993) and Keighin and Flores (1993). The log-derived sandstone porosity values typically range from 4% to 18%.<br />
According to Keighin and Flores (1993), secondary porosity caused by the dissolution of chert and feldspar grains is<br />
the most important type of effective porosity. Levine (1984) noted porosities ranging from 9 to 14% and<br />
permeabilities ranging from 0.1 to 1 md in Red Fork sandstone reservoirs. Fritz (1985) described porosities ranging<br />
from 10 to 16% in the Britt Sandstone (Springer Group) at depths of 15,500 to 16,000 ft in the Eakly Field. Nonproductive<br />
wells along the downdip edge of the field showed only 2 to 8% porosity. McMechan and Conway (1983,<br />
p.42) described Springer and Goddard sandstone reservoirs at Fletcher Field, where log-derived porosities generally<br />
range from 6 to 10%. They note that sweet spots in this field have porosity as high as 14%. Permeabilities are<br />
generally less than 1 md, and most production comes from zones with 0.01 to 0.1 mD. Reservoirs in the Britt<br />
Sandstone produce gas from zones with permeabilities of 0.1 - 0.5 mD. These ranges are similar to those found in<br />
many known basin-center gas accumulations, where tight sandstone reservoirs usually have permeabilities of less<br />
than 0.1 to 1 mD.<br />
GAS-WATER CONTACTS IN PRODUCING FIELDS<br />
The overpressured Atoka-Morrow-Springer section appears to be extensively charged with natural gas, but close<br />
inspections of well logs, scout cards, and completion records available at the Denver Earth Resources Library (730-<br />
17 th Street, Denver, CO, 80202) reveal that many formation tests recovered water from these deep sandstone<br />
reservoirs. Several gas-water contacts were identified during detailed investigations of Morrow and Springer gas<br />
production in the deep Anadarko basin. The presence of numerous conventional gas-water contacts within the<br />
overpressured MCC raises doubts about the application of the continuously gas-saturated, basin-center gas model to<br />
this hydrocarbon system.<br />
West Cheyenne Field<br />
West Cheyenne Field (T. 13-14 N., R. 24-25 W., Roger Mills County, Oklahoma) produces overpressured gas<br />
from approximately 18 wells which penetrate a stratigraphic trap in the Puryear Sandstone of the Morrow Group<br />
(Voris, 1980; Johnson, 1990; Al-Shaieb and others, 1993). The Puryear has been interpreted as a fan-delta deposit<br />
containing chert pebble conglomerate and sandstone lenses in northeast-trending channels surrounded by gray-black<br />
deltaic shales (Al-Shaieb and others, 1990). The main Puryear channel is 25 to 50 ft thick in the center of the field,<br />
with average porosity of approximately 14 % at depths of 14,800 to 15,700 feet. Gas is trapped where the channel<br />
pinches out updip to the north. The reservoir temperature is approximately 265 to 272 °F (Voris, 1980), and bottom<br />
hole shut-in pressures range from 11,400 to 14,317 psi at 15,000 ft (Kennedy, 1982). Pressure gradients for wells<br />
in this field (Table 2) range from 0.73 to 0.92 psi/ft, and drilling mud weights range from 16.8 to 18 ppg, indicating<br />
severe overpressure in this area. Gas kicks, blowouts and problems with stuck drill pipe were reported in the<br />
discovery wells. Cumulative production ranges from 7.4 to 23.5 BCFG per well in the main part the field.
Deep resistivities measured from dual induction logs (Table 2) range from 40 to 170 ohms where the Puryear<br />
Sandstone is productive, and the average water saturation is 29% (Voris, 1980). But a contour map of the structure of<br />
the Puryear Ss published by Voris (1980) shows two abandoned wells on the southwestern, downdip edge of the field<br />
which are clearly labeled “WET”, and Voris noted that a Puryear sandstone lens “tested water” along the southwestern<br />
side of the field. The deep resistivity of the Puryear reservoir is only 8 to 29 ohms in the unproductive wells on the<br />
southeast (downdip) side of the field. El Paso Natural Gas Company’s Thurmond No. 3 well (Sec. 35, T. 13 N., R.<br />
24 W.) perforated the Puryear Sandstone at 15,945-949 feet. The deep resistivity was only 18 to 29 ohms, and a<br />
Schlumberger Cyberlook log shows porosities ranging from 6 to 16% and water saturations ranging from 55 to 100<br />
%. Formation test results were “not released”, but the Puryear zone was abandoned after this test. This well was<br />
plugged at 14,284 feet and completed uphole in the Atoka Group.<br />
The dual induction log for the L. P.C. X. Corporation Thurmond No. 34-A well (Sec. 34, T. 13 N., R. 24 W.)<br />
shows only 8 to 25 ohms of deep resistivity in the Puryear Ss at depths of 15,964 -16,004 feet. The Schlumberger<br />
Cyberlook log shows porosities ranging from 5 to 15% and calculated water saturations of 60 to 100%. Notes on<br />
the log indicate “probable water” in the Puryear reservoir. The Puryear zone was abandoned without tests and the<br />
well was completed uphole in a Cherokee sand. Several other wells which penetrated the Puryear in low structural<br />
positions were completed uphole in other reservoirs, or were abandoned for lack of productive gas reservoirs. The<br />
Puryear reservoir does not appear to be continuously gas-saturated in this area.<br />
The gas column at West Cheyenne Field is approximately 1200 ft tall (Kennedy, 1982). There has been prolific<br />
gas production from the Puryear reservoir at the top of the trap, but there is evidently a transition into a low<br />
resistivity water-producing zone downdip. The gas/water contact occurs at a depth of approximately 15,800 feet (-<br />
13,600 feet). This highly productive gas field is located within a regional overpressure zone and has many of the<br />
characteristics of known basin-center gas accumulations. But West Cheyenne Field has a traditional trapping<br />
mechanism and a traditional gas/water contact. The available porosity in the Puryear reservoir was only partially<br />
filled with gas.<br />
Northwest Reydon Field<br />
Northwest Reydon Field is a structural-stratigraphic trap which produces overpressured gas from the Upper<br />
Morrow Puryear and Pierce Sandstones in T. 13-14 N., R. 26 W., Roger Mills County, Oklahoma (Huber, 1974, Al<br />
Shaieb and others, 1993). An anticlinal fold creates a structural high, and updip pinchouts of fluvial channels cause<br />
the stratigraphic traps. Average porosity is 13% at depths of approximately 14,900 feet and permeabilities are as<br />
high as 15 mD in the chert pebble conglomerate lenses. The reservoir temperature is approximately 262 to 289 °F.<br />
A reservoir pressure of 12,337 psi at 14,890 feet (0.83 psi/ft) was reported in the OSU-GRI database. Drilling mud<br />
weights range from 16.3 to 18.4 ppg, indicating severe overpressuring. One of the discovery wells blew out and<br />
caught on fire, destroying the drilling rig. Cumulative production ranges from 14 to 33 BCFG per well in the main<br />
part of the field.<br />
Well logs, scout cards and production data were examined along a north-south transect through Northwest<br />
Reydon Field. Deep resistivities (Table 3) range from 40 to 80 ohms in the gas-producing zones at the top of the<br />
structure. But the deep resistivity in these reservoirs decreases downdip, and falls as low as 5 to 15 ohms in several<br />
unproductive wells located downdip from a gas/water transition zone. Dyco Petroleum Corporation’ s Pennington<br />
No. 1-18 well (Sec. 18, T. 13 N., R. 25 W.) tested 25 MCFD and 68 bwpd from the Puryear at 15,694 to 15,699<br />
feet, but was abandoned after producing only 139 MMCFG. The deep resistivity was only 9 to 34 ohms in the<br />
Puryear reservoir. Farther downdip, water flows of 61 bwpd were reported from the Puryear interval at 16,202 ft in<br />
Wagner-Brown McColgin no. 1-29 (Sec. 29 T. 13 N. R. 25 W.). The Pierce Sandstone flowed 100 MCFD and 43<br />
bwpd when tested, and the well was abandoned. These wells were drilled too low on the structure, and penetrated the<br />
Puryear reservoir below the gas/water contact.
This severely overpressured, highly productive gas field has a gas column approximately 500 ft tall and a<br />
traditional gas/water contact at approximately 15,400 ft. The Puryear reservoir has high resistivity and low water<br />
saturations near the top of the trap, but the resistivities decrease down-dip, and the reservoir produces water below a<br />
distinct gas-water transition. The porosity available in the Puryear Sandstone was not completely saturated with gas.<br />
These characteristics indicate a conventional structural-stratigraphic gas trapping mechanism, and do not fit the<br />
pattern of a continuously saturated basin-center gas accumulation.<br />
Southwest Minco Field<br />
Southwest Minco Field is another structural-stratigraphic trap which produces gas from the Cunningham<br />
Member of the Springer Group at depths of 12,450 to 13,500 feet in Grady County, Oklahoma (Pipes, 1980). Gas<br />
has been trapped where the Cunningham Sandstones are truncated by erosional unconformities along the northern<br />
shelf. Average reservoir porosity is reported to be 18%. The field is located along the updip margin of the<br />
overpressured megacompartment and shows interfingered overpressures and normal pressures. Pressure data retrieved<br />
from the OSU-GRI database indicate a mixture of normal pressures (0.44 - 0.57 psi/ft) and overpressures (0.65 - 0.77<br />
psi/ft) in this area. Pipes (1980) reported an original reservoir pressure of 9071 psi at 12,465 feet (0.727 psi/ft).<br />
A published isopach map for the Cunningham A Sandstone (Pipes, 1980) shows a distinct gas-water contact,<br />
and a “gas-water contact” is identified in the field description. Gas is evidently trapped in the Cunningham A<br />
Sandstone at Southwest Minco Field by a traditional stratigraphic pinch-out with a conventional gas-water contact.<br />
This field is located along the margin of the Springer-Morrow overpressured zone, but the trapping mechanism does<br />
not fit the typical basin-center gas model.<br />
East Apache Field<br />
East Apache Field is a faulted anticlinal structure located north of the Wichita Frontal Fault in T. 5 N., R. 10-<br />
11 W., Caddo County, Oklahoma (Kennedy, 1982). Well logs, scout cards and production data were examined along<br />
a southwest-northeast transect (Table 4). As of late 1998, this field has produced 122 BCFG and 32 MBO from<br />
several Morrow, Springer and Goddard sandstone reservoirs. Pressure data retrieved from the OSU-GRI database<br />
show normal pressures down to 12,000 feet, then severe overpressures at depths of 16,000 to 20,500 ft in the deeper<br />
Morrow and Springer section, with pressure gradients ranging from 0.81 to 0.87 psi/ft. Drilling mud weights range<br />
from 15 to 17 ppg and bottom hole temperatures reach 270 to 285 °F. The gas produced from a deep Springer<br />
reservoir (Rice and others, 1988, Table 1, No. 79) contains 95% methane, 1.5 % ethane, 1.7% nitrogen, and 1%<br />
CO2. One of the main reservoirs at East Apache Field is the Britt Sandstone Member of the Springer Group, a 15<br />
to 50 ft thick shallow marine deposit with extensive lateral continuity. Forest Oil Fort Sill Unit 4 No. 2 (Sec. 30,<br />
T. 5 N., R. 10 W.) has produced 12.27 BCFG from the Britt Ss at 16,771 - 16,796 feet (-15,393 ft) as of June,<br />
1999 (Table 4). Kirby Exploration Mindemann No. 1-30 has produced over 13.19 BCFG from the Britt at 16,971-<br />
17,010 ft (-15,619 ft). The original reservoir pressure gradient was 0.75 psi/ft in this well.<br />
The Britt Sandstone is a prolific, highly overpressured gas reservoir near the top of the anticline, but there<br />
appears to be a gas-water contact along the northeast flank at approximately -15,700 feet. The Britt reservoir was<br />
tested at a depth of 17,149 - 17,165 feet (-15,740 ft) in the Forest Oil Lopez No. 1 well (Sec. 19, T. 5 N., R. 10<br />
W.) and flowed water at the rate of 349 bwpd. The Britt was tested farther down dip at the Kirby Exploration Murray<br />
No. 1 well (Sec. 5, T. 4 N., R. 10 W) and flowed water at the rate of 200 bwpd from perforations at 17,856-17,884<br />
feet (-16,640 ft). Deep resistivity measurements (Table 4) show a similar pattern to that observed at Northwest<br />
Reydon and West Cheyenne Fields. The highest resistivities occur in gas producing zones near the top of the trap;<br />
lower resistivities occur within the water-producing zones down-dip. Once again, the available porosity has not been<br />
completely filled with gas, and the reservoir is water-saturated below a conventional gas/water contact. This field<br />
does not fit the typical basin-center gas model.
MANY DEEP FORMATION TESTS PRODUCED WATER<br />
Table 5 lists various deep wells which recovered water during formation tests within the overpressured MCC.<br />
The most important examples are Shell Rumberger No. 5 (Sec. 16, T. 10 N., R 21 W., Beckham County,<br />
Oklahoma) and the GHK Nix No. 1 well, which tested Springer sandstone reservoirs below 21,000 feet. These wells<br />
offset the GHK Green No. 1 well (Sec. 1-T. 10 N., R. 21 W.) which produced more than 17.4 BCFG from<br />
overpressured Springer reservoirs at 21,604-22,652 ft. In the Rumberger well, Springer sandstones which correlate<br />
with the producing zones at the Green well flowed salt water during testing. A scout card issued in 1959 by<br />
Rinehart’s Oil <strong>Report</strong>s indicates that perforations at 21,595-21,645 feet flowed 9 MCFD of gas, but some salt water<br />
was recovered by bailing. The perforations were treated with xylene and kerosene, but 96 barrels of salt water were<br />
recovered and the wellbore eventually filled with salt water. The zone was abandoned and a bridge plug was set at<br />
21,465 feet before testing shallower zones. Water was also recovered from perforations in the Atoka at 13,810-<br />
13,812 feet, and the well was eventually abandoned.<br />
At the GHX Nix No. 1 well (Sec. 2, T. 10 N., R 20 W.), a Springer sandstone with deep resistivity of 55 to<br />
120 ohm was perforated at 22,123-22,192 feet. Notations typed on the Schlumberger Dual Induction Log show that<br />
the zone “Rec. show gas & oil, 270 BSW,” indicating that 270 barrels of salt water (?) were recovered during the<br />
test. The drilling mud weight was 16.5 ppg and the bottom hole temperature was 351 °F. The well was abandoned<br />
after several shallower zones were tested without establishing commercial production. At the Gulf Oil Corporation<br />
Anna Tabor No. 1 well (Sec. 24, T. 8 N., R. 15 W.), perforations in a Morrow sandstone at 16,660 to 16,704 feet<br />
flowed 3.12 MMCFD with 3 to 4 barrels of water per hour, and later flowed 815 MCFD with 67 bwpd. This well<br />
was eventually abandoned.<br />
Table 5 shows several other examples of water production. Additional investigations would probably identify<br />
other wet tests. However, the scout cards and completion reports available to the public frequently lack specific<br />
details about fluid recoveries, so it is often difficult to construct a clear understanding of the test results. It is evident<br />
that salt water has been produced from several deep, high temperature, highly overpressured reservoir zones with the<br />
Anadarko basin. This hydrocarbon system does not appear to be continuously saturated with gas; on the contrary,<br />
much of the available reservoir porosity appears to be saturated with water.<br />
WATER PRODUCTION NOTED BY PREVIOUS AUTHORS<br />
Johnson (1990, p. 7) described gas/water contacts at South Dempsey Field (T12N-R24W) in the Pierce<br />
Sandstone Member of the Morrow Group, at depths of approximately 15,700 feet: “Hydrocarbon traps are formed by<br />
stratigraphic pinchouts of reservoir rocks against impermeable shales. Those shales are believed to have been the<br />
source rocks for the hydrocarbons. Each of the units (A, B, C) has its own gas-water contact which is determined by<br />
the local structure.”<br />
Fritz (1985, p. 15) described the discovery of gas in the Britt Sandstone Member of the Springer Group at Eakly<br />
Field in Caddo County (10N-12W, 11N-13W): “The formula for success in the Eakly Field has been to locate a wet,<br />
porous sand and follow it updip until it starts to pinch out.” Pressure gradients for Springer zones within the Eakly<br />
trend range from 0.73 to 0.85 psi/ft at depths of 15,500-16,000 feet (OSU-GRI database), indicating severe<br />
overpressuring in this area. However, water-saturated zones were encountered in low structural positions. A<br />
successful exploration strategy. Involved locating water-saturated sandstone reservoirs and tracking them updip into<br />
gas traps formed by conventional structural closures and stratigraphic pinchouts. McMechan and Conway (1983, p.<br />
42) described hydraulic fracture treatments in the deep Fletcher Field, and noted that there are some areas were the<br />
Britt Sandstone was wet. “The Britt zone has proved commercially productive in parts of the field and wet in<br />
others”.<br />
The Society of Petroleum Engineers (1975) listed many water analyses from formation tests of deep Morrow and<br />
Springer reservoirs in their catalog of formation water resistivities. However, tracking water production in the<br />
Anadarko basin is difficult, because operators frequently do not report the details of drill stem tests, production tests<br />
or water production rates on the state completion reports. Scout cards often contain notations indicating that test
esults were “not released” or “not reported”. Tables of gas and oil production available from Petroleum<br />
Information/Dwights, do not list produced water volumes for Anadarko wells. Additional investigations are<br />
recommended using drill-stem test data available from commercial vendors. Well log analysis might also be useful<br />
for identifying water-saturated reservoirs.<br />
NORTH BROXTON AND ELK CITY FIELDS : WATER-FREE ?<br />
A localized, small scale basin-center gas accumulation might be present in the vicinity of North Broxton Field,<br />
which produces gas from Springer, Goddard and Boatwright sandstones at depths ranging from 19,600 to 21,200 feet.<br />
This deep gas field is located just north of the Frontal Fault Zone in T. 6 - 7 N., R. 12 W., Caddo County,<br />
Oklahoma. Drilling mud weights range from 16 to 17 ppg and gradients reported in the OSU-GRI database indicate<br />
strong overpressures (0.74 psi/ft). Bottom hole temperatures range from 260 to 300 °F. A brief review of well logs<br />
and production histories for wells in North Broxton Field reveals numerous high resistivity sandstones, extensive<br />
crossover effects on neutron-density logs, and numerous wells with high cumulative gas production. No obvious<br />
indications of water production were found during a brief review of scout cards and well data for this field. The deep<br />
Springer section may be continuously gas-saturated and capable of water-free gas production in this area.<br />
A brief review of well logs, scout cards and production data for deep gas production from the Springer section at<br />
Elk City Field (T. 10 N., R. 20 - 21 W., Washita and Beckham Counties, Oklahoma) revealed similar<br />
characteristics, including high drilling mud weights, high temperatures (280 to 310 °F) and high gas production rates<br />
from Springer sandstones at depths of 18,200 to 19,400 feet. Pressure gradients retrieved from the OSU-GRI<br />
database ranged from 0.72 to 0.88 psi/ft, indicating severe overpressures in this part of the basin. Several deep wells<br />
in this field have produced as much as 15 to 47 BCFG. Water production was reported for only one well, the El<br />
Paso Natural Gas Neice No. 2 in Sec. 27, T. 10 N., R. 20 W., where the initial production rate was 21,137 MCFD<br />
with 40 bwpd. Otherwise the Springer zone in Elk City Field appears to be water-free, and may be a locally<br />
continuous, small-scale basin-center gas accumulation.<br />
There may be small-scale basin-center gas accumulations within localized pressure compartments scattered<br />
throughout the Anadarko mega-compartment complex. Additional investigation of the ultra-deep Springer trend is<br />
recommended, especially using well log analysis to identify zones with high gas saturation. Careful examination of<br />
abandoned wells along the margins of the field and interviews with operators might be useful for identifying zones<br />
which produced water-free gas or large volumes of water during formation tests.<br />
DISCUSSION: DOES THE BASIN-CENTER GAS MODEL FIT HERE ?<br />
The Atoka-Morrow-Springer section within the overpressured MCC has many of the characteristics of a typical<br />
basin-center gas accumulation, including severe overpressures, reservoir temperatures exceeding 200 °F, thermally<br />
mature source rocks, tight sandstone reservoirs and extensive gas production. But detailed investigations of several<br />
overpressured gas fields, well data and reports by previous authors indicate that several gas traps have distinct<br />
gas/water contacts, and formation tests in several deep exploration wells have recovered large volumes of water.<br />
These investigations were hindered by the frequent lack of details about formation tests or water production in scout<br />
cards, completion reports and production data.<br />
The Atoka-Morrow-Springer hydrocarbon system almost matches the continuous basin-center gas model, but the<br />
presence of gas-water contacts and formation tests which produced water are a cause for concern. The frequent<br />
occurrence of water production within the regionally overpressured Atoka-Morrow-Springer section indicates that gas<br />
has filled only part of the available porosity. The reservoirs are often water-saturated below the gas-water contacts<br />
and produce large volumes of water when tested. This reservoir volume has not been regionally de-watered.
Perhaps the source rocks were too lean, perhaps the thermal gradient was too low, or perhaps erosion of several<br />
thousand feet of sediment since Permian time caused the source rocks to cease generating gas before the de-watering<br />
process was completed. For whatever reason, the total volume of gas expelled from the source rocks may have been<br />
insufficient to drive the formation water out of pore system and fully saturate the available pore space with gas. The<br />
unusually good reservoir quality of many Morrow and Springer sandstones may be another important factor. Some<br />
of the reported permeabilities are higher than those typically found in known basin-center gas accumulations.<br />
Extensive vertical and lateral migration of hydrocarbons may have occurred through high permeability zones in the<br />
Atoka-Morrow-Springer section.<br />
CONCLUSIONS<br />
The Woodford is a rich hydrocarbon source rock and is thermally mature or post-mature throughout the deep<br />
Anadarko Basin. It is overlain by thick, tight Mississippian limestones which probably form an effective regional<br />
top seal above the source rocks. But drilling mud weights indicate that the Woodford is not regionally overpressured,<br />
except in two localized structural compartments. The Hunton carbonate section immediately below the Woodford is<br />
normally to subnormally pressured throughout most of the deep basin, and contains dolomite reservoirs with good<br />
porosity and permeability. Hydrocarbons expelled from the Woodford Shale may have migrated downward into<br />
permeable zones within the Hunton and then migrated laterally into structural and stratigraphic traps. The absence of<br />
regional overpressure in the Woodford Shale and the presence of an underlying, sub-normally normally pressured<br />
aquifer indicate that this hydrocarbon system does not fit the basin-center gas model.<br />
The regionally overpressured Atoka-Morrow-Springer section has many characteristics of a basin-center gas<br />
accumulation. Overpressures are regionally extensive and reach extremely high gradients (0.8 to 0.94 psi/ft) in some<br />
localities. Reservoir temperatures are usually greater than 200 °F, and reach 360 °F in the deepest producing wells.<br />
Gas-prone, Type III source rocks are present within the Morrow-Springer-Caney shales. Vitrinite reflectance profiles<br />
show that these source rocks are thermally mature and are in the gas generation window in the central part of the<br />
basin. The produced gas is mostly methane with carbon isotopes indicating thermogenic origins. Sandstone<br />
reservoirs above and within the source rock section have good to very low porosity and permeability.<br />
Detailed inspections of well logs, completion reports and published field descriptions reveal many examples of<br />
formation tests which recovered salt water, and several examples of fields with conventional structural and<br />
stratigraphic traps and distinct gas-water contacts within the overpressured Atoka-Morrow-Springer section. The deep<br />
resistivities, cumulative production totals and formation test results indicate that water saturation increases downdip<br />
from the top of the trap. Large volumes of moveable water have been recovered during formation tests of low<br />
resistivity reservoirs located downdip from gas-water contacts. Previous authors have referred to wet wells and<br />
gas/water contacts downdip from gas traps located within the overpressured mega-compartment.<br />
The presence of numerous gas/water contacts and the frequent recovery of water during formation tests indicates<br />
that the available porosity in the Atoka-Morrow-Springer section within the MCC is only partially filled with gas.<br />
This reservoir system is still relatively water-saturated. The Springer-Morrow source rocks apparently did not<br />
generate enough gas to completely de-water the available porosity and fully saturate the pores with gas. The<br />
overpressuring fluid appears to be ‘fizz-water’ - a mixture of gas and water. On a regional scale, the Atoka-Morrow-<br />
Springer hydrocarbon system within the Anadarko basin MCC is almost, but ‘not quite’ a basin-center gas<br />
accumulation. The presence of numerous gas-water contacts and the frequent production of water during formation<br />
tests are the main concerns.<br />
On a local scale, the deep Springer section below 18,500 feet at North Broxton Field and Elk City Field appears<br />
be continuously gas-saturated and almost water-free. Further investigation is recommended to determine whether<br />
these deep, overpressured sandstone reservoirs are part of a small scale, continuous basin-center gas accumulation.
Components of the Basin-Center Gas Model<br />
Conceptual models of basin-center gas accumulations have been described by Masters (1979), Davis<br />
(1984), Law and Dickinson (1985), Spencer (1987), Spencer (1989) and Law and Spencer (1993). Key<br />
components of a continuous basin-center gas accumulation include:<br />
1) Present day reservoir temperatures are at least 190 - 200 °F (88 - 93 °C).<br />
2) Organic-rich source rocks have minimum vitrinite reflectance of 0.8% for gas-prone source<br />
material. Many basin-center gas accumulations are in rocks with vitrinite reflectance in the 1 to<br />
3% range.<br />
3) Rich source beds have expelled enough gas to cause pore pressures to rise above normal pressure<br />
gradients (> 0.45 psi/ft). Temperature-induced hydrocarbon generation forces water out of pore<br />
spaces and saturates nearby reservoirs with hydrocarbons. Water saturations decline to irreducible<br />
levels.<br />
4) Extensive abnormal pressures, either overpressure or subnormal pressure. Overpressure is sustained<br />
by hydrocarbon generation at rates exceeding escape.<br />
5) Pressure gradients rise to the lowest fracture gradients in the rock sequence. High pore pressures<br />
fracture the rocks; hydrocarbons escape via the fractures. Calcite and silica cements episodically<br />
close the fractures.<br />
6) Hydrocarbons (oil and/or gas) are the primary fluid-pressuring phase. No truly “dry” holes are<br />
drilled, all wells have some gas shows.<br />
7) Gas/water contacts are absent. Little or no water is produced from the overpressured reservoirs.<br />
However, water may intrude via fractures, fault zones and permeable beds as reservoir pressure is<br />
reduced.<br />
8) Reservoirs are usually tight sandstones with low porosity (3 - 14 %) and very low permeability<br />
(usually < 0.1 md). Diagenetic cements are abundant.<br />
9) Uplift and erosion of the basin may result in cooling, pore volume expansion and gas escape.<br />
Subnormal pressures may develop in zones which were previously overpressured. Overpressured<br />
and/or subnormally pressured gas reservoirs generally occur downdip from normally pressured<br />
reservoirs with water drive mechanisms.
REFERENCES<br />
Al-Shaieb, Z., Alberta, P.L., and Gaskins, M., 1990, Depositional environment, petrology, diagenenesis, and<br />
porosity of the Upper Morrow chert conglomerate in Oklahoma: Transaction Volume of the 1989 AAPG<br />
Mid-Continent Section Meeting, AAPG-OCGS, p. 13-29.<br />
Al-Shaieb, Z., 1991, Compartmentation, fluid pressure important in Anadarko exploration: Oil and Gas Journal,<br />
v. 89, p. 52-56.<br />
Al-Shaieb, Z., Puckette, J., Ely, P., and Abdalla, A., 1993, The Upper Morrowan fan-delta chert conglomerate<br />
in Cheyenne and Reydon Fields: completely sealed gas-bearing pressure compartments: Oklahoma<br />
Geological Survey Circular 95, p. 26-39.<br />
Al-Shaieb, Z., Puckette, J., Abdalla, A., and Ely, P., 1994, Megacompartment complex in the Anadarko basin:<br />
a completely sealed overpressured phenomenon: in Ortoleva, P., ed., Basin compartments and seals:<br />
American Association of Petroleum Geologists Memoir 61, p. 55-68.<br />
Al-Shaieb, Z., Puckette, J., and Deyhim, P., 1999, Compartmentalization of the overpressured interval in the<br />
Anadarko basin: American Association of Petroleum Geologists Bulletin v. 83, p. 1191 (abs).<br />
Al-Shaieb, Z., Puckette, J., and Deyhim, P., 2000, Compartmentalization of the overpressured interval in the<br />
Anadarko basin: in RMAG 2000 Basin Center Gas Symposium (abs), Rocky Mountain Association of<br />
Geologists, October 6, 2000.<br />
Bradley, J.S. and Powley, D.E., 1994, Pressure compartments in sedimentary basins: a review: in Ortoleva, P.,<br />
ed., Basin compartments and seals: American Association of Petroleum Geologists Memoir 61, p. 3-26.<br />
Brewer, J.A., Good, R., Oliver, J.E., Brown, L.D., and Kaufman, S., 1983, COCORP profiling across the<br />
southern Oklahoma aulacogen: overthrusting of the Wichita Mountains and compression within the<br />
Anadarko basin: Geology, v. 11, p. 109-114.<br />
Breeze, A.F., 1971, Abnormal-subnormal pressure relationships in the Morrow sandstone of northwestern<br />
Oklahoma: Shale Shaker, v. 21, p. 172-193.<br />
Burruss, R.C. and Hatch, J.R., 1992, Geochemistry of Pennsylvanian crude oils and source rocks in the greater<br />
Anadarko basin, Oklahoma, Texas, Colorado, and Nebraska: an update: Oklahoma Geological Society<br />
Circular 93, p. 197.<br />
Cardott, B.J. and Lambert, M.W., 19865, Thermal maturation by vitrinite reflectance of Woodford Shale,<br />
Anadarko basin, Oklahoma: American Association of Petroleum Geologists Bulletin, v. 69, No. 11, p.<br />
1982-1998.<br />
Cardott, B.J., 1989, Thermal maturation of the Woodford Shale in the Anadarko Basin: Oklahoma Geological<br />
Survey Circular 90, p. 32 - 43.<br />
Carter, L.S., Kelley, S.A., Blackwell, D.D., and Naeser, N. D., 1998, Heat flow and thermal maturity of the<br />
Anadarko basin, Oklahoma: American Association of Petroleum Geologists Bulletin, v. 82, p. 291-316.<br />
Comer, J.B. and Hinch, H.H., 1987, Recognizing and quantifying expulsion of oil from the Woodford<br />
Formation and age-equivalent rocks in Oklahoma and Arkansas: American Association of Petroleum<br />
Geologists Bulletin v. 71, p. 844 - 858.<br />
Davis, T.B., 1984, Subsurface pressure Profiles in gas-saturated basins: in Masters, J.A., ed., Elmworth- Case<br />
study of a deep basin gas field: American Association of Petroleum Geologists Memoir 38, p. 189-203.
Davis, H.G. and Northcutt, R.A., 1991, Anadarko basin: in Gluskoter and others, eds., Geological Society of<br />
America, The Geology of North America, v. P-2, p. 325-338.<br />
Fritz, M., 1985, Anadarko gas still lures explorationists: American Association of Petroleum Geologists<br />
Explorer, v. 6, no. 8, p. 14-16.<br />
Gallardo, J.D. and Blackwell, D.D., 1999, Thermal structure of the Anadarko basin: American Association of<br />
Petroleum Geologists Bulletin, v. 83, p. 333-361.<br />
Hester, T.C., 1993, Trends of sandstone porosity in the Anadarko Basin - a preliminary evaluation: Oklahoma<br />
Geological Survey Circular 95, p. 225 - 229.<br />
Hester, T.C. and Schmoker, J.W., 1990, Porosity trends of non-reservoir and reservoir sandstones, Anadarko<br />
basin, Oklahoma: AAPG Bulletin, v. 75, p. 594 (abs).<br />
Hester, T.C., Schmoker, J.W., and Sahl, H.L., 1990, Log-derived regional source-rock characteristics of the<br />
Woodford Shale, Anadarko basin, Oklahoma: USGS Bulletin No. 1866-D, 38 p.<br />
Hill, G.W., 1984, The Anadarko basin: a model for regional petroleum accumulations: in Borger, J.G., ed.,<br />
1984, Technical Proceedings of the 1981 AAPG Mid-Continent regional meeting, Oklahoma City<br />
Geological Society, p. 1 - 29.<br />
Howery, S.D., 1994, Regional look at Hunton production in the Anadarko basin: Shale Shaker v. 44, no. 5, p.<br />
88-91.<br />
Huber, D.D., 1974, Reydon Field: in Berg, O.R., ed., Oil and Gas Fields of Oklahoma, Supplement 1,<br />
Oklahoma City Geological Society, p. 20-21.<br />
Johnson, B., 1990, Regional geology of the Pierce Member of the Upper Morrow Formation in the Anadarko<br />
basin, with a detailed look at South Dempsey Field in Roger Mills County, Oklahoma: Transaction<br />
Volume of the 1989 AAPG Mid-Continent Section Meeting, AAPG-OCGS, p. 1-12.<br />
Kennedy, C.L., ed., 1982, The Deep Anadarko Basin: Petroleum Information Corp.<br />
Keighin, C.W. and Flores, R.M., 1993, Petrology and sedimentology of Morrow/Springer rocks and their<br />
relationship to reservoir quality, Anadarko basin, Oklahoma: Oklahoma Geological Survey Circular 95,<br />
p. 25 (abs).<br />
Kinchloe, R., Hefner, R.A. III, and Wheeler, R., 1973, The drilling and production of ultra-deep natural gas<br />
accumulations occurring below 20,000 ft in the Anadarko basin, U. S. A.: International Gas Union, 12 th<br />
World Gas Conference, Nice, France, p.1 - 16.<br />
Levine, S.D., 1984, Provenance and diagenesis of the Cherokee sandstones, deep Anadarko basin, western<br />
Oklahoma: Shale Shaker, v. 34, no. 10, p. 120-144.<br />
Masters, J.A., 1979, Deep basin gas trap, western Canada: American Association of Petroleum Geologists<br />
Bulletin, v. 63, p. 152-181.<br />
McConnell, D.A., Goydas, M.J., Smith, G.N., and Chitwood, J.P., 1990, Morphology of the Frontal fault<br />
zone, southwest Oklahoma: implications for deformation and deposition in the Wichita uplift and<br />
Anadarko basin: Geology, v. 18, p. 634-637.
Oklahoma State University, Department of Geology, and Gas Research Institute, Oklahoma Pressure Data,<br />
listed at Internet site http://www.okstate.edu/geology/gri.<br />
Oklahoma Oil and Gas Conservation Division, Technical Department, 1983, Pressure and H2S Data.<br />
Peace, H.W., 1994, Mississippian facies relationships, eastern Anadarko basin, Oklahoma: Shale Shaker, v. 45,<br />
no. 2, p. 26-35.<br />
Perry, W.J., 1989, Tectonic evolution of the Anadarko basin region, Oklahoma: USGS Bulletin 1866-A, 19 p.<br />
Pipes, P.B., 1980, S. W. Minco Field: in Pipes, P.B., ed., Oil and Gas Fields of Oklahoma, Supplement II,<br />
Oklahoma City Geological Society.<br />
Powers, R.B., ed., 1994, Petroleum exploration plays and resource estimates, 1989, onshore United States-<br />
Region 7, Mid-Continent: USGS Open-File <strong>Report</strong> No. 94-24.<br />
Price, L.C., Clayton, J.L., and Rumen, L.L., 1981, Organic geochemistry of the 9.6 km Bertha Rogers No. 1<br />
well, Oklahoma: Organic Geochemistry, v. 3, p. 59 - 77.<br />
Price, L.C., 1997, Origins, characteristics, evidence for, and economic viabilities of conventional and<br />
unconventional gas resource bases: in Dyman, T. S. et al., ed., Geologic Controls of Deep Natural Gas<br />
Resources in the United States: USGS Bulletin 2146, p. 181-207.<br />
Price, C.L., 1998a, Frontal Fault Zone of the Wichita Mountains: identification and characterization of a faultassociated<br />
lateral seal, part I: Shale Shaker, v. 49, No. 1, p. 7-20.<br />
Price, C.L., 1998b, Frontal fault zone of the Wichita Mountains: identification and characterization of a faultassociated<br />
lateral seal, part II: Shale Shaker, v. 49, No. 2, p. 31-42.<br />
Rice, D.R., Threlkeld, C.N., and Vuletich, A.K., 1988, Analyses of natural gases from Anadarko basin,<br />
southwestern Kansas, western Oklahoma, and Texas Panhandle: USGS Open-file <strong>Report</strong> No. 88-391.<br />
Roberts, C.T. and Mitterer, R.M., 1992, Laminated black shale - bedded chert cyclicity in the Woodford<br />
Formation, Southern Oklahoma: Oklahoma Geological Survey Circular 93, p. 330-336.<br />
Schmoker, J.W., 2000, USGS, Personal communication regarding erosion in Anadarko.<br />
Society of Petroleum Engineers, 1975, Survey of resistivities of water from subsurface formations in<br />
Oklahoma: Oklahoma City Section, Society of Petroleum Engineers of AIME.<br />
Voris, R.H., 1980, West Cheyenne Field: in Pipes, P.B., ed., Oil and Gas Fields of Oklahoma, Supplement II,<br />
Oklahoma City Geological Society.<br />
Wang, H.D., 1993, A Geochemical study of potential source rocks and crude oils in the Anadarko Basin,<br />
Oklahoma: Ph.D. dissertation, University of Oklahoma, 290 p.<br />
Wang, H.D. and Philp, R.P., 1997, Geochemical study of potential source rocks and crude oils in the Anadarko<br />
Basin, Oklahoma: American Association of Petroleum Geologists Bulletin, v. 81, p. 249-275.
APPENDIX 1: COMPONENTS OF THE BASIN-CENTER GAS MODEL<br />
Conceptual models of basin-center gas accumulations have been described by Masters (1979), Davis (1984), Law<br />
and Dickinson (1985), Spencer (1987), Spencer (1989) and Law and Spencer (1993). Key components of a<br />
continuous basin-center gas accumulation include:<br />
1) Present day reservoir temperatures are at least 190 - 200 °F (88 - 93 °C).<br />
2) Organic-rich source rocks have minimum vitrinite reflectance of 0.8% for gas-prone source material. Many<br />
basin-center gas accumulations are in rocks with vitrinite reflectance in the 1 to 3% range.<br />
3) Rich source beds have expelled enough gas to cause pore pressures to rise above normal pressure gradients<br />
(> 0.45 psi/ft). Temperature-induced hydrocarbon generation forces water out of pore spaces and saturates<br />
nearby reservoirs with hydrocarbons. Water saturations decline to irreducible levels.<br />
4) Extensive abnormal pressures, either overpressure or subnormal pressure. Overpressure is sustained by<br />
hydrocarbon generation at rates exceeding escape.<br />
5) Pressure gradients rise to the lowest fracture gradients in the rock sequence. High pore pressures fracture the<br />
rocks; hydrocarbons escape via the fractures. Calcite and silica cements episodically close the fractures.<br />
6) Hydrocarbons (oil and/or gas) are the primary fluid-pressuring phase. No truly “dry” holes are drilled, all<br />
wells have some gas shows.<br />
7) Gas/water contacts are absent. Little or no water is produced from the overpressured reservoirs. However,<br />
water may intrude via fractures, fault zones and permeable beds as reservoir pressure is reduced.<br />
8) Reservoirs are usually tight sandstones with low porosity (3 - 14 %) and very low permeability (usually <<br />
0.1 md). Diagenetic cements are abundant.<br />
9) Uplift and erosion of the basin may result in cooling, pore volume expansion and gas escape. Subnormal<br />
pressures may develop in zones which were previously overpressured.<br />
10) Overpressured and/or subnormally pressured gas reservoirs generally occur downdip from normally pressured<br />
reservoirs with water drive mechanisms.
NEW MEXICO<br />
0<br />
-5,000'<br />
25 50 MILES<br />
0 25 50 100 KM<br />
OKLAHOMA<br />
TEXAS<br />
-3,000'<br />
Northwestern Shelf<br />
KANSAS<br />
Frontal Fault Zone<br />
ANADARKO<br />
BASIN<br />
-20,000'<br />
-10,000'<br />
-25,000'<br />
-5,000'<br />
-15,000'<br />
AMARILLO - WICHITA UPLIFT<br />
Figure 1. Map of Oklahoma showing the Anadarko basin, Amarillo-Wichita Uplift, Frontal Fault Zone and depth (in feet) of<br />
Precambrian basement. Modified from Bebout and others (1993, p. 15).<br />
NEMAHA RANGE
Depth, in thousands<br />
of feet<br />
0<br />
-30<br />
-60<br />
-90<br />
AMARILLO -<br />
SW WICHITA ANADARKO NE<br />
UPLIFT<br />
SEDIMENTARY ROCKS<br />
BASIN<br />
PRECAMBRIAN BASEMENT<br />
IGNEOUS & METAMORPHIC<br />
BASEMENT ROCKS<br />
0 100 KM<br />
Figure 2. Structural diagram showing the Amarillo-Wichita Uplift and Anadarko basin.<br />
Modified after Perry (1989, p. A6).
PERMIAN (PART)<br />
PENNSYLVANIAN<br />
MISSISSIPPIAN<br />
CAMBRIAN ORDOVICIAN SILURIAN DEVONIAN<br />
PERIOD<br />
GUADALUPIAN<br />
LEONARDIAN<br />
WOLFCAMPIAN<br />
VIRGILIAN<br />
MISSOURIAN<br />
DESMOINESIAN<br />
ATOKAN<br />
MORROWAN<br />
CHESTERIAN<br />
MERAMECIAN<br />
OSAGEAN<br />
KINDERHOOKIAN<br />
UPPER<br />
MIDDLE<br />
LOWER<br />
UPPER<br />
LOWER<br />
UPPER<br />
MIDDLE<br />
LOWER<br />
UPPER<br />
MIDDLE<br />
LOWER<br />
PROTEROZOIC<br />
"GRANITE WASH"<br />
GROUP/FORMATION<br />
CLOUD CHIEF FM.<br />
WHITEHORSE GR.<br />
EL RENO GROUP<br />
HENNESSEY SHALE<br />
GARBER SANDSTONE<br />
WELLINGTON FM.<br />
CHASE GR.<br />
COUNCIL CROVE GR.<br />
ADMIRE GR.<br />
WABAUNSEE GR.<br />
SHAWNEE GR.<br />
DOUGLAS GR.<br />
LANSING GR.<br />
KANSAS CITY GR.<br />
MARMATON GR.<br />
CHEROKEE GR.<br />
RED FORK<br />
ATOKAN GR.<br />
MORROW GR.<br />
SPRINGER GR.<br />
CHESTER GR.<br />
MERAMEC LIME<br />
OSAGE LIME<br />
WOODFORD SHALE<br />
HUNTON GR.<br />
SYLVAN SHALE<br />
VIOLA FM.<br />
SIMPSON GR.<br />
ARBUCKLE GR.<br />
TIMBERED HILLS GR.<br />
GRANITE, RHYOLITE,<br />
AND GABBRO<br />
GRANITE, RHYOLITE,<br />
AND METASEDIMENTS<br />
Figure 3. Stratigraphic column for the central Anadarko basin. Modified after Gallardo and<br />
Blackwell (1999, p. 337).
DEPTH, IN THOUSANDS OF FEET<br />
0<br />
4<br />
8<br />
12<br />
16<br />
20<br />
24<br />
28<br />
32<br />
0.2<br />
0.4<br />
0.6<br />
1.0<br />
1.5<br />
2.0<br />
4.0<br />
6.0<br />
MEAN VITRINITE REFLECTANCE, IN PERCENT<br />
Figure 4. Mean vitrinite reflectance (%Ro) versus depth profile for Woodford Shale samples in the<br />
Anadarko basin (dots) and for several units in the Bertha Rogers-1 well, Washita County,<br />
Oklahoma (crosses). Modified from Price (1997, p. 188) and Cardott and Lambert (1985).<br />
10.0
DEPTH, IN THOUSANDS OF FEET<br />
0 0<br />
5<br />
10<br />
15<br />
20<br />
25<br />
RED FORK<br />
ATOKA<br />
MORROW<br />
SPRINGER<br />
HUNTON<br />
DEPTH, IN THOUSANDS OF FEET<br />
HUNTON<br />
30<br />
25<br />
0 5000 10000 15000 20000 25000 30000 0 5000 10000 15000 20000<br />
PRESSURE (psi) PRESSURE (psi)<br />
5<br />
10<br />
15<br />
20<br />
GRANITE WASH<br />
DES MOINES<br />
RED FORK<br />
ATOKA<br />
MORROW<br />
SPRINGER<br />
Figures 5a and 5b. Pressure versus Depth Plots of formation test data in Roger Mills and Beckham Counties, Anadarko basin,<br />
Oklahoma. Sloping line shows a normal hydrostatic gradient (0.465 psi/ft). Modified from pressure data listed at Internet site<br />
www.okstate.edu/geology/gri/AnadarkoPr.
NEW MEXICO<br />
0<br />
-5,000'<br />
25 50 MILES<br />
0 25 50 100 KM<br />
OKLAHOMA<br />
TEXAS<br />
OCHILTREE<br />
ROBERTS<br />
LUPSCOME<br />
HEMPHILL<br />
ELLIS<br />
HARPER<br />
-3,000'<br />
Northwestern Shelf<br />
KANSAS<br />
Frontal Fault Zone<br />
WOODWARD<br />
ANADARKO<br />
BASIN<br />
-20,000'<br />
-10,000'<br />
-5,000'<br />
DEWEY<br />
CUSTER<br />
-25,000'<br />
WASHITA<br />
WOODS<br />
MAJOR<br />
BLALNE<br />
-15,000'<br />
CADDO<br />
AMARILLO - WICHITA UPLIFT<br />
Figure 6. Structure map showing contours on the top of the Morrow Group, central Anadarko basin, Oklahoma. Shaded area<br />
shows the approximate extent of overpressure within the Atoka, Morrow, and Springer section. Modified from Bebout and<br />
others (1993, p. 45) and pressure data listed at Internet site www.okstate.edu/geology/gri/AnadarkoPr.<br />
GRADY<br />
NEMAHA RANGE
Well Name FIELD Sec. Twp. Rg. Formation Mud Depth BHT Hunton Fm Test Hunton Pr/Depth Test Results, Comments<br />
ppg ft degF psi/ft<br />
Davis Oil Pickett #1 Watonga 10 16 N. 12 W. Woodford 10 11,112 187 WDFD= probably Normal Pressure<br />
Sunray DX Cullen #1 wildcat 34 10 N. 7 W. Woodford 9.8 11,550 181 WDFD= probably Normal Pressure<br />
Coquina Oil Bahan #1 wildcat 34 15 N. 12 W. Woodford 9 12,720 232 WDFD= probably Normal Pressure<br />
Southern UPC Droke #1 wildcat 10 15 N. 16 W. Woodford 10.4 14,502 230 perfs rec gas 0.43 psi/ft WDFD= probably Normal Pressure<br />
Helmerich&Pyne Cupp #1 W Mayfield 27 10 N. 26 W. Woodford 9.3 14,640 238 perfs rec gas 0.45 psi/ft WDFD= probably Normal Pressure<br />
Helmerich&P Cupp C#1 W Mayfield 22 10 N. 26 W. Woodford 9.5 14,895 261 perfs rec gas 0.42 psi/ft WDFD= probably Normal Pressure<br />
Helmerich&P Cupp #2 W Mayfield 27 10 N. 26 W. Woodford 9.6 14,930 215 WDFD= probably Normal Pressure<br />
Magnolia Troy Smith #1 wildcat 12 11 N. 11 W. Woodford 10.2 15,110 238 WDFD= probably Normal Pressure<br />
Helmerich&P Sutton #1 W Mayfield 23 10 N. 26 W. eroded? 10.2 15,160 216 perfs rec gas WDFD= probably Normal Pressure.<br />
McCulloch Schimmer #1 wildcat 5 14 N. 16 W. Woodford 9.5 15,634 262 DST rec SW WDFD= probably Normal Pressure<br />
ARKLA Expl'n Harrill #1 wildcat 29 17 N. 21 W. Woodford 9.5 16,224 249 DST rec SW WDFD= probably Normal Pressure<br />
El Paso Expl'n Penry #1 NW Leedy 27 17 N. 21 W. Woodford 9.9 16,490 250 perfd, no gas WDFD= probably Normal Pressure<br />
Getty Oil Hall #1 wildcat 19 16 N. 19 W. Woodford 10.1 16,590 272 WDFD= probably Normal Pressure<br />
Lone Star Berryman #1 wildcat 24 17 N. 24 W. Woodford 10.4 16,600 288 DST rec SW 0.44 psi/ft WDFD= probably Normal Pressure<br />
Hoover-Bracken Anders #1 Leedy 6 16 N. 20 W. Woodford 9.4 16,690 246 WDFD= probably Normal Pressure<br />
Continental Gordon U #1 W Mayfield 20 10 N. 26 W. Woodford 16,600 DST rec gas 0.49 psi/ft WDFD= probably Normal Pressure<br />
ARKLA Expl'n Harrell #1 wildcat 17 16 N. 21 W. Woodford 9.1 17,290 302 DST rec SW WDFD= probably Normal Pressure<br />
Continental Guenzel #1 W Mayfield 25 10 N. 26 W. 10.4 17,770 268 perfs rec g&w WDFD= probably Normal Pressure<br />
Hoover-Bracken Cecil #1 wildcat 4 16 N. 26 W. Woodford 10.8 17,845 320 perfs, NR, PB WDFD= probably Normal Pressure<br />
Woods Petrl'm Switzer #1 wildcat 32 16 N. 21 W. Woodford 9.5 17,900 266 WDFD= probably Normal Pressure<br />
Roden Oil Nickel #1 wildcat 35 13 N. 16 W. Woodford 9.4 18,025 312 DST rec SW 0.363 psi/ft WDFD= probably Normal Pressure<br />
Clark Cand'n Viersen #1 wildcat 8 15 N. 22 W. Woodford 9.6 18,710 325 0.427 psi/ft WDFD= probably Normal Pressure<br />
French Baker #1 Crawford 31 16 N. 25 W. Woodford 9.5 18,845 342 WDFD= probably Normal Pressure<br />
INEXCO Lovett #1 wildcat 21 14 N. 24 W. Woodford 9.5 20,490 360 perfs rec gas WDFD= probably Normal Pressure<br />
McCulloch Cross U #1 wildcat 4 14 N. 25 W. Woodford 10 20,540 346 WDFD= probably Normal Pressure<br />
Tenneco Bradshaw #1 wildcat 27 14 N. 24 W. Woodford 9.3 20,870 349 perfd, no gas 0.39 psi/ft WDFD= probably Normal Pressure<br />
JOC Expl'n Garver #1 wildcat 11 14 N. 26 W. Woodford 9.7 20,965 360 DST rec SW WDFD= probably Normal Pressure<br />
El Paso Expl'n Maddux #1 wildcat 27 14 N. 23 W. Woodford 9.3 21,250 364 WDFD= probably Normal Pressure<br />
Texas Pacific Libby #1 NW Reydon 33 14 N. 26 W. Woodford 9.4 21,656 369 perfd rec wtr WDFD= probably Normal Pressure<br />
El Paso Expl'n Pierce #1 wildcat 9 13 N. 25 W. Woodford 9.5 22,400 374 perfs rec gas 0.346 psi/ft WDFD= probably Normal Pressure<br />
Forest Oil Tahpoodle #1 wildcat 27 7 N. 12 W. Woodford 10.3 26,180 302 WDFD= probably Normal Pressure<br />
Lone Star Rogers #1 wildcat 27 10 N. 19 W. Woodford 10.1 27,520 385 0.380 psi/ft WDFD= probably Normal Pressure<br />
MRT Expl'n Sanders #1 wildcat 24 10 N. 25 W. Woodford 15.2 23,380 342 perfs rec gas 0.49 psi/ft Set csg at 23,272' ft. 15.2 ppg mud. WDFD=Overpr'd ?<br />
MRT Expl'n Kirtley #1 wildcat 19 10 N. 24 W. Woodford 16.5 23,755 346 perfs, stuck p Set csg at 20,594 ft. 16.5 ppg mud. WDFD=Overpr'd ?<br />
Natomas Patten #1 wildcat 14 10 N. 24 W. Morrow 18.2 19,500 283 18.2 ppg mud in Morrow north of the Frontal Fault<br />
Phillips Wesner A #1 wildcat 35 9 N. 17 W. Woodford 18.1 22,220 302 perfs, NR Set csg at 18,500'. 18.2 ppg mud. WDFD=Overpr'd ?<br />
Located in hangingwall of Cordell Fault Zone<br />
Shell Oil Britton #1 wildcat 28 9 N. 17 W. Springer 16.5 16,600 246 Located in hangingwall of Cordell Fault Zone<br />
Forest Oil Bobwhite #1 wildcat 16 8 N. 16 W. Woodford 17.6 21,790 285 stuck pipe 17.6 ppg mud Located in hangingwall of Cordell Fault Zone<br />
Gulf Oil Tabor #1 wildcat 24 8 N. 15 W. Springer 15.8 18,500 248 Springer test in footwall north of Cordell Fault Zone<br />
Table 1. Mud weights, depths, bottom hole temperatures, pressure gradients and formation test results for wells penetrating the Woodford Shale and Hunton Group in the deep Anadarko basin, Oklahoma,<br />
based on well logs, scout cards and completion reports available from Denver Earth Resources Library, 730 17th Street, Denver, Colorado, 80202. Approximate pressure gradients in Hunton reservoirs were<br />
calculated by dividing the maximum reported shut-in pressure (ISIP or FSIP) by the mid-point of the formation test interval.
Well Name No. FIELD Sec. Twp. Rg. Formation Mud Depth Pr/Depth BHT Rdeep Test Results, IP, CP, Comments<br />
ppg ft psi/ft degF ohmm<br />
El Paso N. G. Smith 1 W Cheyenne 5 13 N. 24 W. Puryear Ss 17.3 14,804 0.88 272 50 - 80 Gas kick. IP=6 MMCFD, no water. CP= 23.53 BCFG.<br />
Helmerich & Payne Lester 1 W Cheyenne 9 13 N. 24 W. Puryear Ss 17.7 15,092 0.84 278 70 - 90 IP= 10.4 MMCFD, no water. CP= 16.69 BCFG (6/99).<br />
El Paso N. G. Hunt-Cross 1 W Cheyenne 22 13 N. 24 W. Puryear Ss 16.8 15,521 0.92 272 50 - 170 IP= 10 MMCFD, no water. CP= 8.39 BCFG (12/92).<br />
El Paso N. G. Thurmond 1 W Cheyenne 27 13 N. 24 W. Puryear Ss 18 15,695 0.73 265 40 - 110 IP= 12.9 MMCFD, no water. CP= 7.43 BCFG (12/91).<br />
W Cheyenne Puryear Ss 15,800 1000 ft Gas column. Gas-water contact at approx. 15,800 ft.<br />
El Paso NG Thurmond 3 W Cheyenne 35 13 N. 24 W. Puryear Ss 17.6 15,955 246 18 - 29 Calculated Sw= 55-100%. Test results NR. Abd.<br />
L.P.C.X. Thurmond 34A W Cheyenne 34 13 N. 24 W. Puryear Ss 17.2 15,980 240
Well Name No. FIELD Sec. Twp. Rg. Formation Mud Depth Pr/Depth BHT Rdeep Test Results, IP, CP, Comments<br />
ppg ft psi/ft degF ohms<br />
Texas Pacific Nellie Libby 1 NW Reydon 33 14 N. 26 W. Puryear Ss 16.3 14,890 0.83 40 - 60 IP= 8.729 MMCFD, no wtr. CP= 33.24 BCFG (6/99).<br />
Gulf Oil Hartley 1 NW Reydon 34 14 N. 26 W. Puryear Ss 14.9 14,970 0.81 263 58 - 65 IP= 3.2 MMCFD + 3 bwpd. CP = 16.98 BCFG (6/99.)<br />
El Paso N. G. Scrivner 1 NW Reydon 35 14 N. 26 W. Puryear Ss 17 15,000 0.82 289 60 - 80 Gas kick, rig fire. IP= 8 MMCFD. CP= 14.09 BCFG.<br />
El Paso NG Robertson A 1 NW Reydon 1 13 N. 26 W. Puryear Ss 16.5 15,128 0.8 258 50 - 80 IP= 3.8 MMCFD, no wtr. CP= 8.82 BCFG (6/99).<br />
El Paso N. G. King 1 NW Reydon 6 13 N. 26 W. Puryear Ss 16.2 15,262 261 20 - 42 IP= 600 MCFD. Reservoir "depleted, non-commercial". Abd.<br />
Dyco Petr Yowell 1 NW Reydon 7 13 N. 25 W. Puryear Ss 16.4 15,360 23 - 24 IP= 500 MCFD. Probably watered out. Abd.<br />
NW Reydon Puryear Ss 15,400 500 ft Gas column. Gas-water contact at approx. 15,400 ft.<br />
Dyco Petr Pennington 1 NW Reydon 18 13 N. 25 W. Puryear Ss 16.5 15,695 270 9 - 34 IP=25 MCFD + 68 bwpd. CP= 139 MMCFG. Abd.<br />
El Paso N. G. Pennington 1 NW Reydon 17 13 N. 25 W. Puryear Ss 16.9 15,745 0.72 262 8 - 15 Swabbed Puryear, no gas shows, probably wet. Abd.<br />
Apexco Robinson Unit 1 NW Reydon 32 13 N. 25 W. Puryear Ss 18.4 16,125 5 - 15 Puryear Ss not tested. Very low resistivity, probably wet. Abd.<br />
Wagner & Brown McColgin 1 NW Reydon 29 13 N. 25 W. Puryear Ss 16,020 Puryear Ss flowed 61bw. Abd.<br />
Table 3. Mud weights, depths, bottom hole temperatures, pressure gradients, deep resistivities and formation test results for several wells at Northwest Reydon Field, Roger Mills County,<br />
Oklahoma, based on well logs, scout cards and completion reports available from the Denver Earth Resources Library, 730 17th Street, Denver, Colorado, 80202. There is evidently a gaswater<br />
contact at approximately 15,400 ft. Several wells located above the gas-water contact have produced large volumes of natural gas from high resistivity zones (20-80 ohm) in the<br />
overpressured Puryear Ss (Morrow Group). Downdip from the gas-water contact, the Puryear reservoir shows lower deep resistivity (4-16 ohm), flowed water at 61 to 68 bwpd, and<br />
the zone was abandoned. The available porosity in this reservoir was only partially filled with gas.
Well Name No. FIELD Sec. Twp. Rg. Formation Depth Mud Pr/Depth BHT Rdeep Test Results, IP, CP, Comments<br />
ft ppg psi/ft degF ohmm<br />
Forest Oil Fort Sill Unit 4 East Apache 30 5N 10W Britt Ss 16,780 16.0 0.75 55 - 62 IP= 7.3 MMCFD + 63 bwpd. CP= 12.27 BCFG (6/99).<br />
Kirby Exp Mindemann 1 East Apache 30 5N 10W Britt Ss 16,990 15.6 0.75 35 - 65 IP= 11.7 MMCFD, no water. CP= 13.19 BCFG (6/99).<br />
East Apache Britt Ss 17,115 Gas-water contact at approx. 17,115 ft (-15,700 ft)-.<br />
Forest Oil Lopez 1 East Apache 19 5N 10W Britt Ss 17,160 15.9 228 30 - 46 Britt Ss flowed 349 bwpd. Abd.<br />
Kirby Exp M. Murray 1 East Apache 5 4N 10W Britt Ss 17,870 Britt Ss flowed 200 bwpd. Abd. Completed uphole in Atoka.<br />
Table 4. Mud weights, depths, bottom hole temperatures, pressure gradients, deep resistivities and formation test results for several wells at East Apache Field, Caddo<br />
County, Oklahoma, based on well logs, scout cards and completion reports available from the Denver Earth Resources Library, 730 17th Street, Denver, Colorado, 80202.<br />
There is evidently a gas-water contact at approximately 16,970 ft (-15,640 ft). Two wells located above the gas-water contact have produced large volumes of natural gas<br />
from high resistivity zones (55-65 ohm) in the overpressured Britt Ss (Springer Group). Downdip from the gas-water contact, the Britt Ss reservoir shows lower deep<br />
resistivity (30-46 ohm). The Britt Ss flowed water at 200 to 349 bwpd, and the zone was abandoned. The available porosity in this reservoir was only partially filled<br />
with gas.
Well Name No. FIELD Sec. Twp. Rg. Formation Mud Depth Pr/Depth BHT Rdeep Test Results, IP, CP, Comments<br />
ppg ft psi/ft degF ohmm<br />
Hall-Jones Neely 1 wildcat 9 14 N. 11 W. Atoka 10,260 0.76 Atoka DST rec 3,330' ft gassy water. FSIP= 7754 psi.<br />
Mustang Prod Dolan 1 Watonga 25 13 N. 11 W. Morrow 11,399 Morrow flowed 200 MCFD + 129 bl swtr. Abd.<br />
Trigg Drilling Heiliger 1 Watonga 12 12 N. 11 W. Boatwright 11,606 0.67 29 - 34 Flowed 480 bl swtr. Abd.<br />
ONG Exp Cannon 1 wildcat 14 12 N. 11 W. Morrow 14.8 11,975 0.64 210 30 - 60 DST rec 5,000 ft gassy water. ISIP= 7792 psi. Abd.<br />
Bartex Exp Snow 1 Bridgeport 10 12 N. 11 W. Britt 12,020 Flowed 180 bwpd. Abd.<br />
Mustang Prod Lee-D 1 Bridgeport 16 12 N. 11 W. Morrow 14.8 12,278 60 Flowed 150 MCFD + 89 bl swtr in 22 hours. Abd.<br />
Texas Pacific Betcher A 1 wildcat 8 8 N. 16 W. Springer 17.6 14,036 208 10 - 25 Flowed 1.2 MMCFD + 10 bwph. Abd.<br />
Sanguine Brown 1 NE Oney 4 9 N. 11 W. Cunningham 15,112 Flowed 400 MCFD + 15 bwph.<br />
Gulf Oil Anna Tabor 1 wildcat 24 8 N. 15 W. Springer 15.6 16,685 0.61 248 Flowed 815 MCFD + 67 bwpd. Abd.<br />
Shell Oil Rumberger 5 Elk City 16 10 N. 21 W. Springer 15 21,625 324 75 Flowed 9 MCFD, bailed 96 bl swtr. Flowed more swtr. Abd.<br />
GHK Nix 1 wildcat 2 10 N. 20 W. Springer 16.5 22,165 351 55 - 120 Flowed 270 bl swtr + show of gas and oil. Abd.<br />
Table 5. Mud weights, depths, bottom hole temperatures, pressure gradients, deep resistivities and formation test results for various exploration wells which recovered water from<br />
within the overpressured mega-compartment, based on well logs, scout cards and completion reports available from the Denver Earth Resources Library, 730 17th Street, Denver,<br />
CO, 80202. Several deep, overpressured reservoirs have produced water. The continuously gas saturated, basin-center model does not appear to fit this hydrocarbon system.
ABSTRACT<br />
Is There a Basin-Center Gas Accumulation<br />
in the Cotton Valley Sandstone, Gulf Coast Basin, USA?<br />
Charles E. Bartberger<br />
Petroleum Geologist<br />
Potential of Upper Jurassic/Lower Cretaceous Cotton Valley sandstones in the northern Gulf Coast Basin to<br />
harbor a basin-center gas accumulation was evaluated by examining (1) depositional/diagenetic history and reservoir<br />
properties of Cotton Valley sandstones, (2) presence and quality source rocks for generating gas, (3) burial/thermal<br />
history of source rocks and time of gas generation/migration relative to tectonic development of Cotton Valley traps,<br />
(4) gas and water recoveries from drillstem and formation tests, (5) distribution of abnormal pressures based on shutin-pressure<br />
data, and (6) presence or absence of gas-water contacts associated with gas accumulations in Cotton<br />
Valley sandstones.<br />
Cotton Valley sandstones comprise a predominantly progradational sequence deposited in fluvial-deltaic, barrierisland,<br />
and shallow-marine environments across the northern Gulf Coast Basin from east Texas to Alabama. In<br />
northern Louisiana, barrier-island sands were reworked and spread landward during periodic transgressive events<br />
resulting in development of a stacked series of extensive sandstone tongues that are interbedded with, and pinch out<br />
northward into, lagoonal shales. Referred to informally as blanket sandstones, these transgressive sandstones have<br />
sufficient porosity and permeability to produce gas at commercial rates without fracture-stimulation treatment.<br />
Elsewhere across the northern Gulf Basin, stacked fluvial-deltaic and barrier-island sandstones of the Cotton Valley<br />
Group comprise a massive-sandstone sequence with poor reservoir properties. These massive sandstones have been<br />
designated as tight-gas sandstones and they require substantial hydraulic-fracture treatments to produce gas at<br />
commercial rates. High permeability of Cotton Valley blanket sandstones is not conducive to presence of a basincentered<br />
gas accumulation, but low-permeability massive sandstones provide the type of reservoir in which<br />
continuous-gas accumulations commonly occur.<br />
Source rocks that generated gas found in Cotton Valley sandstone reservoirs are considered to be Bossier marine<br />
shales situated directly beneath the Cotton Valley sandstone, and stratigraphically lower carbonate mudstones of the<br />
Jurassic Smackover Formation. Marine shales interbedded with Cotton Valley sandstones also might have<br />
contributed some gas. Burial- and thermal-history data suggest that generation and migration of gas occurred during<br />
the past 60 m.y. Gas migration postdates development of the Sabine Uplift, smaller structures on the Uplift, and salt<br />
structures in the East Texas and North Louisiana Salt Basins.<br />
Abnormally high pressures in Cotton Valley sandstone reservoirs occur in northeast Louisiana in both the<br />
permeable, blanket-sandstone and tight, massive-sandstone trends. However, most gas accumulations in the tight,<br />
massive-sandstone trend across north Louisiana and northeast Texas are normally pressured. Geographic distribution<br />
of overpressure suggests that it is not associated with thermal generation of gas, and pressure data do not support<br />
presence of a basin-center gas-accumulation in either the blanket- or massive sandstone trend.<br />
Presence of a gas-water contact perhaps is the most definitive criterion suggesting that a gas accumulation is<br />
conventional rather than a “sweetspot” within a basin-center, continuous-gas accumulation. Occurrence of short gaswater<br />
transition zones and well-defined gas-water contacts in gas fields within the blanket-sandstone trend is<br />
consistent with relatively high permeability of these reservoirs, and suggests that these gas accumulations are<br />
conventional. Within the tight, massive-sandstone trend, however, permeability is sufficiently low that gas-water<br />
transition zones are long, and gas-water contacts poorly defined. With increasing depth through these long gas-water<br />
transition zones, gas saturation in reservoir sandstones decreases and water saturation increases. Eventually gas<br />
saturation becomes sufficiently low that, in terms of cumulative gas production, wells become marginally<br />
commercial to non-commercial at a structural position still within the transition zone above the gas-water contact.<br />
Consequently, gas-water contacts in Cotton Valley tight-gas-sandstone accumulations rarely are encountered by
drilling, but best available data suggest that gas-water contacts are present. Presence of gas-water contacts associated<br />
with gas accumulations in the tight, massive Cotton Valley sandstone trend suggests that accumulations in this<br />
trend, too, are conventional, and that a basin-center gas accumulation does not exist within Cotton Valley sandstones<br />
in the northern Gulf of Mexico Basin.<br />
INTRODUCTION<br />
As part of the 1995 <strong>National</strong> Assessment of United States Oil and Gas Resources by the U.S. Geological<br />
Survey, Schenk and Viger (1996) identified one continuous-gas play and two conventional-gas plays (fig. 1) within<br />
the Cotton Valley sandstone trend in east Texas and northern Louisiana. Goals of this new study are to re-evaluate<br />
the 1995 play boundaries and parameters for establishing those boundaries through more-extensive evaluation of data<br />
on reservoir properties, reservoir pressures, gas and water recoveries, gas-production rates, and gas-water contacts in<br />
Cotton Valley sandstones.<br />
From a regional perspective, two productive trends of Cotton Valley sandstones can be identified based on<br />
sandstone-reservoir properties, gas-production rates, and necessity of hydraulic-fracturing treatments to achieve<br />
commercial production. Across northernmost Louisiana, so-called Cotton Valley blanket sandstones have sufficiently<br />
high porosity and permeability that commercial rates of gas production can be obtained without artificial well<br />
stimulation. South of this area in northern Louisiana and extending westward across the Sabine Uplift into northeast<br />
Texas, sandstones in the Cotton Valley massive-sandstone trend have poor reservoir properties and require massivehydraulic-fracturing<br />
treatments to achieve commercial rates of gas production. Because basin-center, continuous-gas<br />
accumulations characteristically occur within low-permeability reservoirs, the tight, massive Cotton Valley<br />
sandstone trend across northern Louisiana and northeast Texas is an ideal setting in which to look for basin-centered,<br />
continuous-gas accumulations. With wireline logs and mudlogs unavailable for this study, interpretations and<br />
conclusions presented herein are based entirely upon data reported in public literature and on production data<br />
accessible in a publicly available database from IHS <strong>Energy</strong> Group (petroROM Version 3.43).<br />
METHOD FOR EVALUATING POTENTIAL OF BASIN-CENTER GAS IN COTTON VALLEY<br />
SANDSTONES<br />
One of the main requirements for occurrence of a basin-centered, continuous-gas accumulation is presence of a<br />
regional seal to trap gas in a large volume of rock across a widespread geographic area. Within that large volume of<br />
rock, discrete gas accumulations with conventional seals and gas-water contacts are absent, and occurrence of gas<br />
often cuts across stratigraphic units. In classic basin-center-gas accumulations (Law and Dickinson, 1985; Spencer,<br />
1987; Law and Spencer, 1993), the regional seal is provided by low-permeability of the reservoir itself, as described<br />
above. To evaluate potential for presence of a continuous-gas accumulation within the Cotton Valley Sandstone,<br />
therefore, it is necessary to examine reservoir properties of Cotton Valley sandstones across the northern Gulf Coast<br />
Basin. Because reservoir properties of Cotton Valley sandstones are governed by diagenetic characteristics, which are<br />
controlled primarily by depositional environment, it is helpful to understand Cotton Valley depositional systems and<br />
related diagenetic patterns.<br />
Although gas production from Cotton Valley sandstones seems to occur from discrete fields, it is necessary to<br />
determine if those fields are separate, conventional accumulations or so-called “sweet spots” within a regional,<br />
continuous-gas accumulation. Thus, it is essential to understand what characterizes the apparent productive limits of<br />
existing Cotton Valley gas fields, including presence or absence of gas-water contacts.<br />
<strong>Final</strong>ly, because continuous-gas accumulations commonly are characterized by overpressure associated with<br />
thermal generation of gas from source rocks in proximity to low-permeability reservoirs, it is important to evaluate<br />
presence and quality of potential source rocks, burial and thermal history of those source rocks, and reservoir-pressure<br />
data.<br />
2
GEOLOGIC SETTING FOR COTTON VALLEY GROUP IN NORTHERN GULF BASIN<br />
The Cotton Valley Group is an Upper Jurassic to Lower Cretaceous sequence of sandstone, shale, and limestone<br />
which underlies much of the northern Gulf of Mexico coastal plain from east Texas to Alabama (figs. 2 and 3).<br />
Cotton Valley strata occur only in the subsurface and form a sedimentary wedge that thickens southward into the<br />
Gulf Basin from a zero edge in southern Arkansas and East Texas (fig. 2). Downdip limit of the Cotton Valley<br />
Group has not been delineated by drilling to date. Depth to top of the Cotton Valley ranges from about 4,000 feet<br />
subsea near the updip zero edge to more than 13,000 feet subsea along the southern margins of the East Texas and<br />
Louisiana Salt Basins (figs. 2 and 4). In southeastern Mississippi, top of the Cotton Valley occurs at nearly 20,000<br />
feet subsea. Greatest thickness of Cotton Valley rocks penetrated exceeds 5,000 feet in southeastern Mississippi<br />
(Moore, 1983).<br />
The Cotton Valley Group and overlying Travis Peak (Hosston) Formation represent the first major influx of<br />
terrigenous clastic sediments into the Gulf of Mexico Basin following its initial formation during continental rifting<br />
180 Ma in Late Triassic time (Salvador, 1987; Worrall and Snelson, 1989). Earliest sedimentary deposits in East<br />
Texas and North Louisiana sub-basins (figs. 2 and 3) include upper Triassic nonmarine redbeds of the Eagle Mills<br />
Formation, the thick lower and middle Jurassic evaporite sequence known as Werner Anhydrite and Louann Salt, and<br />
the nonmarine Norphlet Sandstone. Following a major regional marine transgression across the Norphlet, upper<br />
Jurassic Smackover regressive carbonates were deposited, capped by redbeds and evaporites of the Buckner Formation<br />
(fig. 3). A subsequent minor marine transgression is recorded by the Gilmer or Cotton Valley Limestone in east<br />
Texas, although equivalent facies in north Louisiana and Mississippi are terrigenous clastics known as Haynesville<br />
Formation. The marine Bossier Shale, lowermost formation of the Cotton Valley Group (figs. 3 and 5) was<br />
deposited conformably atop the Gilmer-Haynesville.<br />
Louann Salt became mobile as a result of sediment loading and associated basinward tilting. Salt movement was<br />
initiated during Smackover carbonate deposition and became more extensive with influx of Cotton Valley clastics<br />
(McGowen and Harris, 1984). Many Cotton Valley and Travis Peak fields in east Texas, Louisiana, and Mississippi<br />
are structural or combination traps associated with Louann salt structures. Salt structures range from small, lowrelief<br />
salt pillows to large, piercement domes (McGowen and Harris, 1984; Kosters and others, 1989).<br />
As shown in figures 2 and 4, the Sabine Uplift is a broad, low-relief, basement-cored arch separating the East<br />
Texas and North Louisiana Salt Basins. With vertical relief of 2,000 feet, the Sabine Uplift has a closed area<br />
exceeding 2,500 square miles (Kosters and others, 1989). Isopach data across the Uplift indicate that it was a positive<br />
feature during deposition of Louann Salt in the Jurassic, but that main uplift occurred in late, mid-Cretaceous (101 to<br />
98 Ma) and early Tertiary time (58 to 46 Ma) (Laubach and Jackson, 1990; Jackson and Laubach, 1991). As a high<br />
area for the past 60 m.y., the Sabine Uplift has been a focal area for hydrocarbon migration in the northern Gulf<br />
Basin during that time. Numerous smaller structural highs on the Uplift in the form of domes, anticlines, and<br />
structural noses provide traps for hydrocarbon accumulations, including many gas fields in Cotton Valley sandstones.<br />
Origins of these smaller structures have been attributed to salt deformation and small igneous intrusions, as<br />
summarized by Kosters and others (1989). Because the Louann Salt is thin across the Sabine Uplift, Kosters and<br />
others (1989) suggest that most of the smaller structures across the Sabine Uplift developed in association with<br />
igneous activity.<br />
COTTON VALLEY STRATIGRAPHIC NOMENCLATURE<br />
Since the first penetration of Cotton Valley strata in north Louisiana in 1927, complex informal stratigraphic<br />
nomenclature developed as numerous Cotton Valley oil and gas fields were discovered across northern Louisiana<br />
through the 1940s. Nomenclature became complex because of local stratigraphic complexities within Cotton Valley<br />
strata in north Louisiana and also because of regional variations in Cotton Valley depositional systems across the<br />
northern Gulf Basin. Terminology established by Swain (1944) was used until the complete revision of Cotton<br />
Valley stratigraphy by Thomas and Mann (1963) and Mann and Thomas (1964). Most subsequent reports, including<br />
the classic work of Collins (1980), have used Mann-Thomas terminology. Refinements to that terminology have<br />
been contributed by Coleman and Coleman (1981) and Eversull (1985).<br />
3
Cotton Valley lithofacies and associated stratigraphic nomenclature in north Louisiana are shown in figures 5<br />
and 6. Basal formation of the Cotton Valley Group is the Bossier Shale, a dark, calcareous, fossiliferous, marine<br />
shale. In east Texas, isolated turbidite sandstones occur within the Bossier Shale (Collins, 1980). Overpressured gas<br />
currently is being produced from these sandstones in a rapidly developing new play (PI Dwights Drilling Wire, Jan.<br />
3, 2000; Exploration Business Journal, 2 nd quarter 2000). Completely encased in marine shale, these gas-charged<br />
sandstones in this newly developing play might represent a continuous-gas accumulation. The Bossier Shale grades<br />
upward into Cotton Valley sandstones with interbedded shales. These sandstones consist of stacked barrier-island,<br />
offshore-bar, strandplain, and fluvial-deltaic sandstones, and are known as the Terryville massive-sandstone complex<br />
in north Louisiana (Coleman and Coleman, 1981). In east Texas, the stratigraphically equivalent unit is called<br />
Cotton Valley Sandstone, and it consists of braided-stream, fan-delta, and wave-dominated-delta sandstones (Wescott,<br />
1983; Coleman, 1985; Dutton and others, 1993). Across the Cotton Valley hydrocarbon-productive trend in east<br />
Texas and north Louisiana, the Terryville or Cotton Valley Sandstone averages about 1,000 to 1,400 feet in<br />
thickness (Finley, 1984; Presley and Reed, 1984). Sand deposition was interrupted in early Cretaceous time by a<br />
regional transgressive event marked by deposition of Knowles Limestone, the uppermost formation of the Cotton<br />
Valley Group (figs. 5 and 6). In updip areas of east Texas and south Arkansas, the Knowles pinches out, and Travis<br />
Peak clastics directly overly Cotton Valley sandstones (figs. 3, 5 and 6).<br />
COTTON VALLEY DEPOSITIONAL SYSTEMS<br />
Regional Framework<br />
From East Texas to Mississippi, CottonValley/Terryville stacked barrier-island, strandplain, and fluvial-deltaic<br />
sandstones reflect influx of sands from a number of depocenters. Evolution of Cotton Valley depocenters and<br />
associated paleogeography across northern Louisiana are described and illustrated by Coleman and Coleman (1981)<br />
who subdivided the Terryville Sandstone into four depositional “events” based on widespread shale breaks. Across<br />
south-central Mississippi, Moore (1983) shows three sequential paleogeographic reconstructions of Cotton Valley<br />
Sandstone deposition. Although similar, concise paleogeographic reconstructions have not been published for East<br />
Texas Basin, McGowen and Harris (1984) and Wescott (1985) provide data from which basic paleogeographic maps<br />
can be constructed. I have integrated data from these various workers to generate a regional paleogeographic map of<br />
upper Cotton Valley depositional systems (equivalent to Terryville IV of Coleman and Coleman, 1981) across the<br />
northern Gulf Basin from east Texas to Mississippi (fig. 7).<br />
As shown in figure 7, Cotton Valley fluvial-deltaic depocenters were located in present-day northeast Texas,<br />
south-central Mississippi, and along the Louisiana-Mississippi border. The system along the Louisiana-Mississippi<br />
border represents the ancestral Mississippi River and was a locus of major clastic influx. Large quantities of sand<br />
delivered to the marine environment by this system were transported westward by longshore currents producing an<br />
extensive east-west barrier-island or strandplain complex (Thomas and Mann, 1966). Vertical stacking of these<br />
barrier-island/strandplain sands through time resulted in accumulation of the Terryville massive-sandstone complex<br />
(figs. 6 and 7). The east-west barrier-island complex across northern Louisiana sheltered a lagoon to the north from<br />
open-marine waters to the south (Thomas and Mann, 1966). Shales of the Hico Formation accumulated in the<br />
lagoon while fluvial and coastal-plain sandstones and shales of the Schuler Formation were deposited in continental<br />
environments north of the lagoon (figs. 6 and 7). Development of a similar, but smaller, lagoon associated with<br />
barrier islands formed from longshore-transported sands in south-central Mississippi was documented by Moore<br />
(1983), as shown in figure 7. In east Texas, during the earliest phase of Cotton Valley sandstone deposition, small<br />
fan deltas developed along the updip margin of East Texas Basin (McGowen and Harris, 1984; Wescott, 1985; Black<br />
and Berg, 1987). The drainage system was immature with small fan deltas formed by numerous small streams.<br />
According to McGowen and Harris, 1984, fan-delta deposition persisted through Cotton Valley time along the<br />
western margin of East Texas Basin where fan-delta deposits characterize most of the Cotton Valley sandstone<br />
interval. Along the northern flank of East Texas Basin in the region of the present-day Sabine Uplift, a mature<br />
drainage system developed as fan deltas prograded basinward and evolved into a wave-dominated delta system. Lower<br />
Cotton Valley sandstones from this system commonly are referred to as the Taylor Sandstone, according to Kast<br />
(1983) and Wescott (1985). After Taylor Sand deposition was terminated by a sub-regional transgressive event, delta<br />
4
progradation resumed with development of a more elongate, fluvial-dominated system in the upper Cotton Valley<br />
(fig. 7), referred to as the Lone Oak Delta by Kast (1983).<br />
Blanket Sandstones of Northern Louisiana<br />
In northern Louisiana, at least 20 distinct tongues of sandstone extend landward from barrier-island deposits of<br />
the Terryville massive-sandstone complex and become thinner northward before pinching out into shales of the Hico<br />
lagoon, as shown in figure 6. Some of these sandstones have limited geographic extent covering only part of the<br />
lagoon, whereas others extend across most or all of the lagoon and interfinger with continental deposits of the<br />
Schuler Formation on the landward side of the lagoon (Coleman and Coleman, 1981; Eversull, 1985). These<br />
sandstones have been interpreted as transgressive deposits with sand being derived from Terryville barrier islands and<br />
transported landward into the Hico lagoon during periods of relative sea-level rise and/or diminished sediment supply<br />
(Coleman and Coleman, 1981; Eversull, 1985). These transgressive sandstones have significantly better porosity and<br />
permeability than Terryville massive sandstones from which they were derived, and have been prolific producers of<br />
oil and gas from structural, stratigraphic, and combination traps discovered in the 1940s, 1950s, and 1960s across<br />
northern Louisiana (Collins, 1980; Bebout and others, 1992). Referred to informally as “blanket” sandstones<br />
(Eversull, 1985), they can be correlated readily across northern Louisiana, and as shown in Figure 6, they were given<br />
informal names by operators during drilling in the 1940s and 1950s (Sloane, 1958; Thomas and Mann, 1963; and<br />
Eversull, 1985).<br />
Based on isopach map patterns, Eversull (1985) identified two groups of blanket sandstones. Geographically<br />
more extensive sandstones of the first group span most of the Hico lagoon and often interfinger with continental<br />
deposits of the Schuler Formation. These sandstones generally are 30 to 70 feet thick and can reach a thickness of<br />
140 feet toward the south where they merge with barrier-island sandstones of the Terryville massive-sandstone<br />
complex. Blanket sandstones of the second group generally are less than 30 feet thick, have limited geographic<br />
extent, and most commonly occur in the eastern part of the Hico lagoon proximal to the fluvial-deltaic source. These<br />
sandstones pinch out northward into shales of the Hico lagoon. Transgressive, blanket sandstones of both groups<br />
collectively have significantly higher porosity and permeability than barrier-island sandstones of the Terryville<br />
massive-sandstone complex to the south (Collins, 1980; Bebout and others, 1992).<br />
Reservoir Properties Define Two Productive Trends: Blanket Sandstones and Massive<br />
Sandstones<br />
Significant differences in reservoir properties between transgressive, blanket sandstones on the north and<br />
massive, barrier-island sandstones to the south define two different hydrocarbon-productive trends of Cotton Valley<br />
sandstones (fig. 8). Blanket sandstones have significantly higher porosity and permeability than Terryville massive<br />
sandstones to the south. Eversull (1985) reported that blanket sandstones are cleaner and better sorted, and attributed<br />
their superior reservoir properties to high-energy reworking during transgressive events. Coleman (1985), however,<br />
reported that blanket sandstones exhibit an increase in calcite cement and clay content northward toward their<br />
pinchout edges, and that superior reservoir properties occur because (1) clays inhibited precipitation of quartz<br />
overgrowths and (2) secondary porosity was generated through widespread dissolution of calcite cement. Absence of<br />
detrital clay coats on sand grains in high-energy barrier-island sandstones of the Terryville massive-sandstone<br />
complex to the south, however, permitted widespread precipitation of quartz cement as syntaxial overgrowths,<br />
resulting in nearly complete occlusion of porosity (Sloane, 1958; Coleman and Coleman, 1981). Whatever the cause<br />
of porosity differences, blanket sandstones generally have sufficient porosity and permeability to flow gas or liquids<br />
on open-hole drillstem tests (DSTs) and to produce gas without fracture-stimulation treatment (Collins, 1980;<br />
Bebout and others, 1992). Terryville massive sandstones to the south and west, however, have such poor reservoir<br />
properties that they do not flow gas or liquids during DSTs, and they require massive-hydraulic-fracture treatments<br />
before commercial production can be obtained.<br />
5
DIAGENESIS OF COTTON VALLEY SANDSTONES<br />
Because understanding reservoir mineralogy is critical to successful wireline-log analysis and design of fracturestimulation<br />
treatments in Cotton Valley sandstones, considerable attention has been devoted to understanding<br />
diagenetic patterns of Cotton Valley sandstones, especially in the low-permeability, Cotton Valley massivesandstone<br />
trend. Focusing on those sandstones in east Texas, Wescott (1983) reported that Cotton Valley sandstones<br />
are very fine-grained, well-sorted quartz arenites and subarkoses with monocrystalline quartz and feldspar being the<br />
primary framework components. Principal cements include quartz, calcite, clays, and iron oxides. In unraveling the<br />
complex diagenetic history of these sandstones, Wescott (1983) interpreted two major diagenetic sequences. The most<br />
common sequence is (1) formation of clay coats, primarily chlorite, on framework grains, usually covering grains<br />
partially, not completely, (2) precipitation of syntaxial quartz overgrowths on quartz grains, (3) dissolution of<br />
unstable grains, most commonly feldspars, (4) precipitation of clays, primarily illite and chlorite with minor<br />
kaolinite, (5) precipitation of calcite cement in both relict primary pores and secondary pores, and (6) large-scale<br />
replacement of grains and cements by calcite, resulting in poikilotopic texture in which a few relict quartz grains are<br />
“floating” in calcite. In the other, less-common diagenetic sequence, which occurs primarily in cleaner, coarsergrained<br />
sandstones, calcite cementation commenced early and progressed to yield a fabric with widespread replacement<br />
of grains by calcite.<br />
Wescott (1983) classified Cotton Valley sandstones into three general groups on the basis of primary<br />
depositional texture and resulting diagenetic characteristics. In general, Wescott (1983) found that clean, well-sorted<br />
sands deposited in high-energy environments (Type I) generally are nearly completely cemented by quartz and/or<br />
calcite, have little or no porosity and permeability, and provide little reservoir potential. In some cases, these<br />
sandstones exhibit preservation of minor amounts of primary intergranular porosity from presence of authigenic<br />
chlorite coats (Hall and others, 1984). In sands deposited in lower-energy environments where abundant detrital clays<br />
remained (Type II), nucleation of quartz overgrowths generally was inhibited by clays. Most clay-bearing sandstones,<br />
however, contain significantly large amounts of clay, and although abundant microporosity is associated with these<br />
clays, permeability generally is low. Highest porosities, according to Wescott (1983), occur in Type III sandstones<br />
which developed abundant secondary porosity from dissolution of unstable grains and calcite cement. Hall and others<br />
(1984), however, reported that dissolution of unstable grains often is incomplete, secondary pores generally are<br />
poorly interconnected, and these sandstones, too, have poor permeability, and require fracture stimulation to produce<br />
gas commercially.<br />
In northern Louisiana, as interpreted by Russell and others (1984), upper Cotton Valley (Bodcaw) sandstones at<br />
Longwood Field on the east flank of the Sabine Uplift experienced a virtually identical diagenetic history to that<br />
described for Cotton Valley sandstones in east Texas by Wescott (1983). Like Wescott (1983), Russell and others<br />
(1984) reported that nucleation of quartz overgrowths was inhibited by presence of clays, but the quantity of porefilling<br />
clays generally is so large that permeability is low despite presence of high microporosity. Also, as in east<br />
Texas, best reservoir sandstones are those that have low clay content and developed abundant secondary porosity<br />
through dissolution of unstable grains and cement. Similar diagenetic patterns in north Louisiana also were reported<br />
for Cotton Valley sandstones at Frierson Field by Sonnenberg (1976) and for the lowermost Terryville Sandstone<br />
(Taylor Sandstone) at Terryville Field by Trojan (1985). In addition to authigenic constituents reported in east Texas<br />
and north Louisiana, Trojan (1985) also found small amounts of authigenic pyrite in Taylor Sandstones at Terryville<br />
Field. Pyrite occurs as small silt-size clusters (framboids) and volumetrically is the least abundant authigenic mineral<br />
reported by Trojan (1985), but its presence is significant because of its effect on wireline-log measurements of<br />
formation resistivity.<br />
IMPACT OF DIAGENETIC MINERALOGIES ON WIRELINE LOGS<br />
Complex diagenetic mineralogy of tight Cotton Valley sandstones prohibits use of standard calculation<br />
procedures in reservoir evaluation with wireline logs. The main difficulty is that properties of certain diagenetic<br />
constituents result in abnormally low resistivity measurements which lead to such high calculated water saturations<br />
that productive zones appear to be wet. Major factors contributing to abnormally low resistivities in tight Cotton<br />
Valley sandstones include bound water associated with pore-filling clays or clay coats and conductive authigenic<br />
minerals such as pyrite and ankerite (Janks and others 1985; Turner, 1997).<br />
6
Pore-lining and pore-filling clays have exceptionally high ratios of surface area to volume. Large surface area and<br />
high cation-exchange capacity of clays result in formation of a double ionic layer on clay surfaces (Almon, 1979;<br />
Snedden, 1984). This bound double layer can be significantly more conductive than pore waters, resulting in<br />
abnormally low measured resistivities, especially with induction logs (Almon, 1979; Wescott, 1983). Highly<br />
conductive authigenic minerals, such as ankerite and pyrite, in Cotton Valley sandstones also cause abnormally low<br />
resistivities. Trojan (1985) found that pyrite concentrations as low as one percent in Cotton Valley sandstones had a<br />
dramatic effect on resistivity measurements and hence on calculated water saturations. Standard calculation methods<br />
showed that pyrite-bearing sandstones at Terryville Field in north Louisiana had water saturations in excess of 100<br />
percent. Trojan (1985) showed that if these sandstones were pyrite-free, calculated water saturations would be closer<br />
to 50 percent. Although water saturations in productive Cotton Valley sandstones commonly are 25 to 30 percent,<br />
water-free gas production has been achieved from zones with calculated water saturations as high as 60 percent<br />
(Nangle and others, 1982; Wilson and Hensel, 1984; Dutton and others, 1993).<br />
Porosity measurements from wireline logs also can be affected adversely from diagenetic mineral constituents in<br />
Cotton Valley sandstones. In a study of Taylor Sandstones at Terryville Field in north Louisiana, Ganer (1985)<br />
demonstrated the negative impact of authigenic carbonates on porosity measurements from wireline logs. Located<br />
within the porous, permeable blanket sandstone trend, Terryville Field was discovered in 1954 with production from<br />
the Cotton Valley “D” Sandstone, one of the blanket sandstones. The Taylor Sandstone occurs in the lower part of<br />
the Cotton Valley Sandstone interval, and its productive potential at Terryville Field was not discovered until 1978.<br />
Unlike the stratigraphically higher blanket sandstones, the Taylor Sandstone has relatively poor reservoir properties<br />
similar to those of tight Cotton Valley massive sandstones to the south. Like Wescott (1983), Ganer (1985) found<br />
that although the Taylor Sandstone is predominantly a quartz sandstone, it contains authigenic carbonate cement, and<br />
locally can be composed of more than 50 percent carbonate resulting in a poikilotopic texture. With abundant<br />
secondary porosity from carbonate dissolution, these high-carbonate sandstones are the best gas producers within the<br />
Taylor Sandstone interval at Terryville Field. Ganer (1985) identified several different carbonate minerals in Taylor<br />
Sandstones, including calcite, ankerite, and siderite. Grain densities of these minerals are 2.71, 3.00, and 3.96 g/cm 3 ,<br />
respectively. If porosity logs based on a sandstone matrix (grain density of 2.65 g/cm 3 ) are run across an interval<br />
containing abundant carbonate constituents with higher densities, such as the Taylor Sandstone, measured porosity<br />
values will be pessimistic. Working with 420 feet of conventional core from four wells at Terryville Field, Ganer<br />
(1985) reported sandstone intervals with abundant carbonate constituents where log-measured porosities were close to<br />
zero, but core-measured porosities exceeded six percent. With complex effects of diagenetic minerals on both porosity<br />
and resistivity measurements from wireline logs, Ganer (1985) showed that a single porosity/water saturation limit<br />
is not suitable for evaluating productive potential of Cotton Valley sandstones at Terryville Field. Ganer’s<br />
conclusions probably are applicable to most, or all, of the tight, massive Cotton Valley Sandstone trend across<br />
northeastern Texas and northern Louisiana.<br />
In comparing core-derived reservoir properties with wireline-log measurements for Cotton Valley sandstones<br />
from Carthage Field in east Texas, Wilson and Hensel (1984) reported that no apparent relationship exists between<br />
porosity and permeability. From core analyses, they noted that it is not uncommon to find a sandstone interval with<br />
10 percent porosity and 1 to 3 mD permeability adjacent to a zone with similar porosity but with permeability less<br />
than 0.05 mD. Similarly, Ganer (1985) reported that Taylor sandstones with 8 percent porosity at Terryville Field in<br />
north Louisiana have permeabilities ranging from 0.01 to 13 mD. For Carthage Field, Wilson and Hensel (1984)<br />
also noted that empirically derived values of cementation factor (m) and saturation exponent (n), used in calculation<br />
of water saturation, vary significantly from zone to zone. Wilson and Hensel (1984) derived general empirical values<br />
of m and n for Carthage Field area to achieve more accurate log-derived estimates of water saturation. Because of such<br />
difficulties in determining water saturations from wireline logs, Presley and Reed (1984) stress that gas-pay cutoff<br />
values should be based on experience by operators in a given area.<br />
A consequence of difficulties in accurate reservoir evaluation from conventional log analysis, of course, is that<br />
intervals capable of producing gas might be bypassed because of high calculated water saturations. For this study, the<br />
significance of these difficulties with wireline logs in tight Cotton Valley sandstones is that logs are of limited value<br />
in differentiating between gas-productive and wet intervals, and therefore in identifying gas-water contacts on the<br />
flanks of Cotton Valley fields.<br />
7
SOURCE ROCKS<br />
Relatively scant information has been published on source rocks for hydrocarbons produced from Cotton Valley<br />
reservoirs in north Louisiana and east Texas. In studying the overlying Travis Peak Formation in east Texas, Dutton<br />
(1987) showed that shales interbedded with Travis Peak sandstone reservoirs were deposited in fluvial-deltaic settings<br />
where organic matter commonly is oxidized and not preserved. With measured values of total organic carbon (TOC)<br />
in Travis Peak shales generally less than 0.5 percent, these shales are not considered as potential hydrocarbon source<br />
rocks (Tissot and Welte, 1978). Dutton (1987) suggested that the most likely sources for hydrocarbons in Travis<br />
Peak reservoirs in east Texas are laminated, lime mudstones of the lower member of the Jurassic Smackover<br />
Formation and prodelta and marine shales of the Bossier Shale, basal formation of the Cotton Valley Group (Figure<br />
3). Sassen and Moore (1988) demonstrated that Smackover carbonate mudstones are a significant hydrocarbon source<br />
rock charging various reservoirs in Mississippi and Alabama, and Wescott and Hood (1991) documented the Bossier<br />
Shale as a significant source rock in east Texas. Presley and Reed (1984) suggested that gray to black shales<br />
interbedded with Cotton Valley sandstones, as well as the underlying Bossier Shale, probably are the source for gas<br />
in Cotton Valley sandstone reservoirs. Similar implication is made for sourcing Cotton Valley sandstone reservoirs<br />
in north Louisiana by Coleman and Coleman (1981), who state that “hydrocarbons were generated from neighboring<br />
source beds”. In summary, despite limited source-rock data, it seems likely that adequate hydrocarbon source rocks<br />
occur in Bossier Shales immediately beneath Cotton Valley sandstones, and also in stratigraphically lower<br />
Smackover carbonate mudstones (fig. 3).<br />
BURIAL AND THERMAL HISTORY<br />
Vitrinite reflectance (R o) is a measure of thermal maturity of source rocks based on diagenesis of vitrinite, a type<br />
of kerogen derived from terrestrial woody plant material. In a study of diagenesis and burial history of the Travis<br />
Peak Formation in east Texas, Dutton (1987) reported that measured R o values for Travis Peak shales generally range<br />
from 1.0 to 1.2 percent, indicating that these rocks have passed through the oil window (R o = 0.6 to 1.0 percent) and<br />
are approaching the level of onset of dry-gas generation (R o = 1.2 percent) (Dow, 1978). Maximum R o of 1.8 percent<br />
was measured in the deepest sample from a downdip well in Nacogdoches County, Texas. Despite thermal maturity<br />
levels reached by Travis Peak shales, the small amount, and gas-prone nature, of organic matter in these shales<br />
precludes generation of oil, although minor amounts of gas might have been generated (Dutton, 1987).<br />
In the absence of actual measurements of R o, values of R o can be estimated by plotting burial depth of a given<br />
source rock interval versus time in conjunction with an estimated paleogeothermal gradient (Lopatin, 1971; Waples,<br />
1980). Dutton (1987) presented burial-history curves for tops of the Travis Peak, Cotton Valley, Bossier Shale, and<br />
Smackover for seven wells on the crest and western flank of the Sabine Uplift. The burial-history curves show total<br />
overburden thickness through time and use present-day compacted thicknesses of stratigraphic units. Sediment<br />
compaction through time was considered insignificant because of absence of thick shale units in the stratigraphic<br />
section. Loss of sedimentary section associated with late, mid-Cretaceous and mid-Eocene erosional events was<br />
accounted for in the burial-history curves.<br />
Dutton (1987) provided justification for using the average present-day geothermal gradient of 2.1º F/100 ft for<br />
the paleogeothermal gradient for the five northernmost wells. Paleogeothermal gradients in the two southern wells<br />
probably were elevated temporarily because of proximity to the area of initial continental rifting. Based on the crustal<br />
extension model of Royden and others (1980), Dutton (1987) estimated values for elevated paleogeothermal gradients<br />
for these two wells for 80 m.y. following the onset of rifting before reverting to the present-day gradient for the past<br />
100 m.y.<br />
Using estimated paleogeothermal gradients in conjunction with burial-history curves, Dutton (1987), found that<br />
calculated values of R o for Travis Peak shales agree well with measured values. Because of this agreement, Dutton<br />
(1987) used the same method to calculate R o values for tops of the Cotton Valley Group, Bossier Shale, and<br />
Smackover Formation in east Texas. Estimated R o values for the Bossier Shale and Smackover in seven wells range<br />
from 1.8 to 3.1 percent and 2.2 to 4.0 percent, respectively, suggesting that these rocks have reached a stage of<br />
thermal maturity in which dry gas was generated. Assuming that high-quality, gas-prone source rocks occur within<br />
8
these two formations, it is likely that one or both of these units generated gas found in overlying Cotton Valley and<br />
Travis Peak reservoirs.<br />
No such regional source-rock and thermal-maturity analysis is known for Travis Peak and Cotton Valley<br />
intervals in northern Louisiana. Scardina (1981) presented burial-history data for the Cotton Valley, but included no<br />
information on geothermal gradients and thermal history of rock units. Present-day reservoir temperatures in tight<br />
Cotton Valley sandstones of east Texas and the tight, massive Terryville sandstone in northern Louisiana both are in<br />
the 250º to 270º F range (Finley, 1986; White and Garrett, 1992). It is likely that Bossier and Smackover source<br />
rocks in north Louisiana experienced relatively similar thermal history to their stratigraphic counterparts in east<br />
Texas and, therefore, are sources for Cotton Valley gas in north Louisiana. Herrmann and others (1991) presented a<br />
burial-history plot for Ruston Field in the Cotton Valley blanket-sandstone trend in northern Louisiana. At Ruston<br />
Field, they suggest that Smackover gas was derived locally from Smackover lime mudstones and Cotton Valley gas<br />
from Cotton Valley and Bossier shales. Their burial-history plot shows the onset of generation of gas from<br />
Smackover and Bossier source rocks at Ruston Field occurred about 80 Ma and 45 Ma, respectively. As noted earlier<br />
in this report, the Sabine Uplift has been a positive feature for the past 60 m.y. (Kosters and others, 1989; Jackson<br />
and Laubach, 1991). Therefore, it would have been a focal area for gas migrating from Smackover, Bossier, and<br />
Cotton Valley source rocks in East Texas and North Louisiana Salt Basins.<br />
ABNORMAL PRESSURES<br />
Pore pressure or reservoir pressure commonly is reported as a fluid-pressure gradient in pounds per square<br />
inch/foot (psi/ft). Normal FPG is 0.43 psi/ft in freshwater reservoirs and 0.50 psi/ft in reservoirs with very saline<br />
waters (Spencer, 1987). Abnormally high pore pressures as high as 0.86 psi/ft have been encountered in Cotton<br />
Valley reservoirs, especially in northeastern Louisiana (fig. 9). Multiple FPG values for a particular gas field in<br />
figure 9 refer to gradients calculated for different, stacked blanket-sandstone reservoirs penetrated in that field. Across<br />
northern Louisiana, as shown in figure 9, highest FPGs of 0.84 and 0.86 psi/ft occur in the southeast, and gradients<br />
generally decrease to nearly normal values of 0.43 to 0.50 psi/ft in the northwest. This pattern exhibits general<br />
agreement with reservoir-pressure data for northern Louisiana summarized by Coleman and Coleman (1981), as<br />
shown in figure 10. The dashed line in figure 10 shows a modification of Coleman’s and Coleman’s (1981) pressure<br />
boundary to include the 0.63 psi/ft gradient in Hico-Knowles Field and 0.67 psi/ft gradient in Tremont Field (fig. 9).<br />
Most significant for this study, boundary between overpressured and normally pressured Cotton Valley sandstones<br />
(fig. 10) shows no relationship to the two different productive Cotton Valley Sandstone trends defined by differences<br />
in reservoir properties (fig. 8). Additionally, most Cotton Valley sandstone reservoirs, especially in the tight,<br />
massive-sandstone trend across western Louisiana and east Texas are normally pressured, as shown in figure 9.<br />
HISTORY OF COTTON VALLEY SANDSTONE EXPLORATION<br />
Beginning in 1937 and continuing through the 1940s, 1950s, and into the early 1960s, commercial gas<br />
production was established from porous and permeable Cotton Valley blanket-sandstone reservoirs across north<br />
Louisiana. Blanket sandstones flowed gas at commercial rates without artificial stimulation. Initial discoveries were<br />
in anticlinal traps associated with salt structures. Subsequent discoveries came from more complex and subtle traps,<br />
including (1) combination traps with blanket sandstones pinching out across anticlines or structural noses, and (2)<br />
stratigraphic traps with blanket sandstones pinching out on regional dip (Pate, 1963; Coleman and Coleman, 1981).<br />
By the early 1960s, the high-porosity blanket-sandstone play matured, and exploratory drilling waned. Low-porosity,<br />
low-permeability, massive Cotton Valley sandstones to the south in Louisiana and to the west on the Sabine Uplift<br />
in west Louisiana and east Texas flowed gas at rates less than 1,000 MCFD (thousand cubic feet of gas per day) and<br />
were not commercial with gas selling at $0.18/mcf in the 1960s (Collins, 1980).<br />
9
In the 1970s, production from low-permeability, massive Cotton Valley sandstones became commercial as a<br />
result of technical advances in massive-hydraulic-fracturing techniques together with significantly higher gas prices.<br />
At Bethany Field on the Sabine Uplift in east Texas in 1972, Texaco successfully increased rate of production from<br />
tight Cotton Valley sandstones from 500 MCFD to a sustained rate of 2,500 MCFD and 30 bcpd (barrels of<br />
condensate per day) through massive-hydraulic fracturing (Jennings and Sprawls, 1977). In conjunction with<br />
development of improved stimulation technology, price deregulation through the Natural Gas Policy Act (NGPA) of<br />
1978 spawned a dramatic increase in drilling for low-permeability Cotton Valley gas sandstones (Bruce and others,<br />
1992). In 1980, the Federal <strong>Energy</strong> Regulatory Commission (FERC) officially classified low-permeability Cotton<br />
Valley sandstones as “tight gas sands”, qualifying them for additional incentive gas prices. Production from tight<br />
Cotton Valley sandstones surged. At Carthage Field in east Texas, for example, Cotton Valley production increased<br />
from 2.2 BCFG (billion cubic feet of gas) in 1976 to 70.9 BCFG in 1980 (Meehan and Pennington, 1982). The<br />
large area across north Louisiana and northeast Texas within which Cotton Valley sandstones have been designated<br />
tight-gas-sandstones by FERC includes all the counties named in figure 4 (Dutton and others, 1993).<br />
COMPARISON OF BLANKET-SANDSTONE AND MASSIVE-SANDSTONE TRENDS<br />
Two productive Cotton Valley sandstone trends are identified based on reservoir properties (fig. 8). As described<br />
above, Cotton Valley sandstone reservoir properties are a function of diagenetic characteristics, which are controlled<br />
by depositional environment. Reservoir properties in turn govern gas-production characteristics, including both<br />
initial rate of gas production and necessity of hydraulic-fracture treatments to achieve commercial production rates.<br />
Table 1 summarizes these and other key parameters distinguishing blanket- and massive-Cotton Valley sandstone<br />
reservoir trends. Data presented in table 1 were derived from a variety of sources as indicated in the table caption,<br />
with much of the information coming from a series of seven reports by the Shreveport Geological Society on oil and<br />
gas fields in northern Louisiana (Shreveport Geological Society Reference <strong>Report</strong>s, 1946, 1947, 1951, 1953, 1956,<br />
1963, 1987). Detailed information obtained from those reports on more than 20 Cotton Valley oil and gas fields in<br />
northern Louisiana, including data on porosity, permeability, initial production rates, gas-water contacts, and FPGs,<br />
is presented in table 2.<br />
Most of the significant fields across northern Louisiana and northeastern Texas from which Cotton Valley<br />
sandstones produce gas are shown in figure 8. The area shown in figure 8 is part of the larger region shown in figure<br />
4 within which Cotton Valley sandstones were designated as tight-gas sandstones by FERC in 1980. As shown in<br />
figure 8, however, 15 Cotton Valley fields were excluded from FERC’s tight-gas sandstone designation. All but one<br />
of these fields are located within the porous and permeable Cotton Valley blanket-sandstone trend.<br />
Blanket-Sandstone Trend<br />
Transgressive, Cotton Valley blanket sandstones have porosities ranging from 10 to 19 percent and<br />
permeabilities from one to 280 mD (tables 1 and 2). Porosity and permeability data are not readily available for each<br />
individual, productive blanket sandstone in all Cotton Valley fields. However, sufficient data are available from<br />
several blanket sandstones within a dozen fields across northern Louisiana to observe the widespread distribution of<br />
relatively high-quality reservoir sandstones across the Cotton Valley blanket-sandstone trend (fig. 11). Data shown in<br />
figure 11 are derived primarily from field reports by the Shreveport Geological Society and from White and others<br />
(1992). Multiple values of porosity and permeability for a given field in figure 11 represent measured values for<br />
separate, stacked blanket sandstones within that field. Average porosity and permeability for Cotton Valley blanket<br />
sandstones, calculated from data in figure 11, are 15 percent and 115 mD, respectively.<br />
Relatively high porosity and permeability of blanket sandstones is reflected in (1) ability of these sandstones to<br />
flow gas and/or liquids on open-hole DSTs, and (2) high initial flow rates from these sandstones in production tests<br />
without massive-hydraulic fracture-stimulation treatments, as shown in figure 12. Multiple values of initial flow<br />
rates for a given field shown in figure 12 represent rates from different stacked blanket sandstones that produce in that<br />
field. Across the blanket-sandstone trend, as shown in figure 12, initial production rates range from 500 MCFD to<br />
25,000 MCFD, and average 5,000 MCFD.<br />
10
Gas-water contacts have been reported in seven fields across the blanket-sandstone trend as shown in figure 13.<br />
In Hico-Knowles, South Drew, and Choudrant Fields, separate gas-water contacts for individual blanket sandstones<br />
have been identified (table 2). No gas-water contacts were encountered in Cheniere Field as of 1963 or in Tremont<br />
Field as of 1980 (table 2). In all other Cotton Valley fields described in Reference <strong>Report</strong>s by the Shreveport<br />
Geological Society (1946, 1947, 1951, 1953, 1956, 1963, 1987), no mention of fluid contacts was made.<br />
Massive-Sandstone Trend<br />
Cotton Valley sandstones in the massive-sandstone trend (fig. 8 and table 1) have significantly poorer reservoir<br />
properties than those in the blanket-sandstone trend. Massive Cotton Valley sandstones have sufficiently low<br />
permeability that they generally do not flow gas or liquids during open-hole DSTs, and they require fracturestimulation<br />
treatment to obtain commercial rates of gas production (Collins, 1980). Commercial gas production<br />
from these sandstones was not achieved until technological advances in massive-hydraulic fracturing occurred together<br />
with higher gas prices from deregulation in the 1970s. Consequently, development of Cotton Valley fields in the<br />
tight, massive Cotton Valley sandstone trend did not occur until the late 1970s and 1980s. Cotton Valley<br />
development drilling in Elm Grove and Caspiana Fields in northern Louisiana continues at the time this report is<br />
being written (Al Taylor, former BP Amoco geologist, personal communication, April 2000). A consequence of<br />
such recent development of fields in the tight, massive Cotton Valley sandstone trend is less published information<br />
on characteristics of these fields than on older fields in the blanket-sandstone trend.<br />
Limited Data in Public Literature<br />
Summary information presented by Dutton and others (1993) for the tight, massive Cotton Valley sandstone<br />
trend across northeast Texas and north Louisiana indicates porosities in the 6 to 10 percent range. Based on<br />
measurements from cores in 11 wells in Carthage Field, one of the largest Cotton Valley fields in northeast Texas,<br />
Wilson and Hensel (1984) reported porosities ranging from 5.8 to 8.1 percent, with an average of 6.6 percent.<br />
Associated permeabilities range from 0.02 to 0.33 mD, with an average of 0.067 mD. From core data for 126 wells<br />
in Harrison and Rusk counties in northeast Texas, Finley (1984) reported average permeability of 0.043 mD for<br />
Cotton Valley sandstones. In northern Louisiana, average permeability was reported as 0.015 mD based on data from<br />
Cotton Valley cores in 302 wells. However, there are stratigraphic intervals within the tight, massive Cotton Valley<br />
trend with significantly higher permeabilities. Locally, permeabilities approaching 100 mD have been reported<br />
(Wilson and Hensel, 1984).<br />
Significantly poorer porosity and permeability of tight, massive Cotton Valley sandstones relative to blanket<br />
sandstones is reflected in poorer production characteristics. Average flow rate prior to fracture-stimulation treatment<br />
is 50 MCFD (Dutton and others, 1993). Post-stimulation rates generally are in the 500 to 2,500 MCFD range,<br />
although rates as high as 10,000 MCFD and 11,700 MCFD have been reported from Bethany Field (Jennings and<br />
Sprawls, 1977) and Carthage Field (Meehan and Pennington, 1982), respectively.<br />
Published data on presence of gas-water contacts or production of water without gas on the flanks of Cotton<br />
Valley fields in the tight, massive-sandstone trend are meager. Summary data presented by Nangle and others (1982)<br />
described gas-water contacts as poorly defined with long transition zones in contrast to short, well-defined transition<br />
zones with sharp gas-water contacts in the blanket-sandstone trend. Also suggesting presence of gas-water contacts<br />
with long transition zones is the statement by Dutton and others (1993) that for Cotton Valley Sandstone intervals<br />
200 feet above the free-water level, calculated water saturations should be less than 40 percent to achieve successful<br />
gas completions.<br />
In northeast Texas, where most of the drilling for tight Cotton Valley sandstones has occurred, best reservoir<br />
potential is reported to be in wave-dominated-delta Taylor Sandstones in the lower part of the Cotton Valley section<br />
(Wescott, 1983, 1985). In Oak Hill Field, production logs show that Taylor Sandstones contribute more than 80<br />
percent of the gas production and that sandstones in the middle and upper Cotton Valley section contribute most of<br />
the water production, although they produce significant gas as well (Tindall and others, 1981). Presley and Reed<br />
11
(1984) and Dutton and others (1993) both report presence of water-bearing sandstones in the upper Cotton Valley<br />
interval. To avoid production of water from these sandstones, fracture-stimulation treatments in stratigraphically<br />
adjacent gas-bearing sandstones in the upper Cotton Valley must be significantly smaller that those in the Taylor<br />
Sandstone. At Bethany Field, several wells reportedly were plugged because of production of salt water from Cotton<br />
Valley sandstones (Jennings and Sprawls, 1997).<br />
Analysis of Drillstem-Test and Production-Test Data<br />
As mentioned above, general statements in published reports suggest presence of gas-water contacts in fields that<br />
produce gas from tight Cotton Valley sandstones across northeastern Texas and northern Louisiana. Unlike data for<br />
the Cotton Valley blanket-sandstone trend, however, no documentation was found identifying specific gas-water<br />
contacts in Cotton Valley sandstones in any of the tight-gas sandstone fields in Texas or Louisiana. In the absence of<br />
such published data, and considering the difficulties using wireline logs to evaluate water saturations in tight Cotton<br />
Valley sandstones, an attempt was made to document presence or absence of gas-water contacts through analysis of<br />
data from DSTs and production tests. The goal was to determine if Cotton Valley fields that produce from tight-gas<br />
sandstones were flanked by dry holes that tested water only without gas, suggesting` presence of a gas-water contact.<br />
A data set of wells penetrating the Cotton Valley Group across most of northeastern Texas and northern Louisiana<br />
was extracted from a database provided by IHS <strong>Energy</strong> Group (petroROM Version 3.43) for analysis of drillstem-test<br />
and production-test data using ARCVIEW software. Because tight Cotton Valley sandstones generally do not flow<br />
fluids on open-hole DSTs, it was anticipated that most useful data would be derived from production tests made<br />
through perforations in casing following fracture-stimulation treatments. Well data were sorted and displayed in map<br />
view using ARCVIEW software such that wells which produce from Cotton Valley sandstones could be<br />
distinguished from dry holes with tests. While viewing the map display, test results from any particular well could<br />
be examined.<br />
Reconnaissance analysis of data from Carthage, Bethany, Oak Hill, Waskom, and Woodlawn Fields in<br />
northeastern Texas, and from Bear Creek-Bryceland, Elm Grove, and Caspiana Fields in northern Louisiana, revealed<br />
few dry holes penetrating Cotton Valley strata on the flanks of these Cotton Valley fields. No flanking dry holes<br />
were found which tested only water. The few Cotton Valley dry holes present generally did not report tests,<br />
suggesting that no tests were performed in those wells, and that, most likely, the wells were plugged based on<br />
evaluation of wireline logs.<br />
Test results from Cotton Valley sandstones in Oak Hill Field in Texas and Elm Grove/Caspiana Fields in<br />
Louisiana were evaluated more rigorously, revealing several general patterns. Initial rates of gas production generally<br />
are higher in crestal wells than in flank wells in these fields, as shown for Caspiana Field in figure 14. At both Oak<br />
Hill and Elm Grove-Caspiana Fields, initial rates of gas production from Cotton Valley sandstones range from 1,000<br />
to more than 4,000 MCFD in central regions of the fields, and generally are less than 1,000 MCFD in structurally<br />
lower wells on edges of the fields. Many flank wells exhibit initial rates less than 500 MCFD, as shown in Figure<br />
14. This trend exhibits more variability at Oak Hill Field, where a considerably greater number of low-rate wells<br />
occur in the center of the field. Such low-rate wells in the central region of the field could be attributed to a number<br />
of factors, including reservoir variability, formation damage during drilling, and poor fracture-stimulation treatments.<br />
All these wells must be fracture stimulated, and significant variation in success of such stimulation treatments is not<br />
uncommon. Also, initial rates on the west flank of Oak Hill Field are high and show an abrupt change to dry holes<br />
rather than showing a gradual decline toward the flank of the field. One well there flowed gas with an initial rate<br />
exceeding 4,000 MCFD and is flanked to the west by four Cotton Valley dry holes. In three of these dry holes,<br />
Cotton Valley sandstones apparently were not tested, and a test in the fourth must have resulted in non-commercial<br />
production with only “one unit of gas” reported.<br />
Initial rates of water production in bwpd (barrels of water per day) also were mapped at Oak Hill and Elm Grove-<br />
Caspiana Fields and show no obvious patterns across these fields. No attempt was made to contour water production<br />
data for several reasons. Not only is variability in initial rate of water production high and seemingly random, but<br />
also, data are incomplete. Whereas the IHS <strong>Energy</strong> database reports report initial rate of gas production for most all<br />
wells in these fields, initial rate of water production is not reported for a significant percentage of wells. In wells at<br />
12
Oak Hill, Elm Grove-Caspiana Fields for which a value is entered in the appropriate position of the database for<br />
water production, a null value is never reported. Some volume of water production seems to occur along with gas in<br />
all these wells. Hence, it does not seem appropriate to interpret absence of water-production data for a given well as<br />
meaning zero production of water. Absence of initial water production data is especially significant at Oak Hill Field,<br />
and that factor alone makes it difficult to analyze water production from that field. Data on initial water production at<br />
Elm Grove-Caspiana Fields are more complete. Although rates of water production were considerably higher at<br />
Caspiana Field, data were most complete for that field, and patterns of initial water production at Caspiana Field were<br />
evaluated by plotting barrels of water produced per MMCFG. As shown in Figure 15, wells in the central part of<br />
Caspiana Field commonly exhibit production of 100 or fewer bbls wtr/MMCFG. Progressing outward toward flanks<br />
of the field, rates of initial water production increase to 300 to more than 600 bbls wtr/MMCFG. Highest initial rate<br />
of water production occurs on the west flank of the field where production of 1,477 bbls wtr/MMCFG is reported<br />
(fig. 15). That same well had an initial rate of gas production of only 325 MMCFD, as shown in figure 14.<br />
Nevertheless, no wells were identified on the flanks of these fields that tested water only without gas from Cotton<br />
Valley sandstones and hence inferred a gas-water contact for the field. Surrounding Elm Grove-Caspiana Fields, 23<br />
Cotton Valley dry holes were identified. Of these, 19 wells reported no tests in the Cotton Valley sandstone interval,<br />
presumably indicating that no Cotton Valley tests were run, and that Cotton Valley completions were not made on<br />
the basis of wireline-log evaluation. Production tests after fracture-stimulation were run in two other wells. One<br />
reported “one unit of gas and one unit of oil”, presumably indicating non-commercial rates. The other well reported<br />
only “one unit of water”, suggesting that the Cotton Valley sandstone might be below a gas-water contact at that<br />
location. On the south and west flanks of Oak Hill Field, six Cotton Valley dry holes without tests were identified,<br />
again suggesting abandonment of Cotton Valley potential based on wireline-log evaluation. Production tests were<br />
run in Cotton Valley sandstones in two wells on the west flank of Oak Hill Field. One reported “one unit of gas”,<br />
the other “one unit of gas and one unit of water”. On the south flank of the field, production tests were run in Cotton<br />
Valley sandstones in two Cotton Valley dry holes, but no results were reported. Evaluation of test data from Oak<br />
Hill and Elm Grove-Caspiana Fields, therefore, provides no definitive information regarding or of presence or absence<br />
of gas-water contacts in these Cotton Valley fields.<br />
DISCUSSION OF EVIDENCE FOR AND AGAINST BASIN-CENTERED GAS<br />
Source Rocks and Burial/Thermal History<br />
Source rocks responsible for generating gas in basin-center gas accumulations commonly are in stratigraphic<br />
proximity to low-permeability reservoirs that they are charging with gas. As described above, published data on<br />
source rocks responsible for generating gas found in Cotton Valley sandstone reservoirs in both the blanket- and<br />
massive-sandstone trends are meager. However, the marine Bossier Shale, which is stratigraphically directly beneath<br />
Cotton Valley sandstones, and Smackover laminated lime mudstones, which lie below the Bossier Shale, are<br />
considered to be source rocks capable of generating gas for Cotton Valley sandstone reservoirs. Gray to black marine<br />
shales interbedded with Cotton Valley sandstones also are considered to be potential source rocks. Also, as<br />
summarized above, burial- and thermal-history data for the northern Gulf Coast Basin suggest that burial depths of<br />
Bossier and Smackover source rocks, in conjunction with the regional geothermal gradient, have been sufficient to<br />
generate dry gas. Time of generation of much of the gas postdates development of both the Sabine Uplift and<br />
structures in the East Texas and Louisiana Salt Basins. Hence, available data on presence of source rocks, burial and<br />
thermal history of source rocks, and timing of gas generation for Cotton Valley reservoirs would be consistent with<br />
interpretation of a potential continuous-gas accumulation in sandstones of the Cotton Valley Group.<br />
Porosity, Permeability, and Gas-Production Rates<br />
Basin-centered, continuous-gas accumulations commonly involve a large volume of gas-saturated rock in which<br />
presence of gas cuts across stratigraphic units. Such gas accumulations require a regional seal to trap gas, and that<br />
seal characteristically is provided by inherent low-permeability of reservoir rocks themselves. Thus, continuous-gas<br />
reservoirs characteristically have low permeability, and when reservoirs are sandstones, they often are referred to as<br />
tight-gas sandstones.<br />
13
As described above, Cotton Valley sandstone reservoirs across the northern Gulf of Mexico Basin can be divided<br />
into two groups based on reservoir properties and associated rates of gas production. Sandstones in the Cotton Valley<br />
blanket-sandstone trend across northernmost Louisiana have porosities in the 10 to 19 percent range and<br />
permeabilities from 1 to 280 mD (table 1). These sandstones generally flow gas and/or liquids during open-hole<br />
DSTs. Gas-productive sandstones flow at initial rates ranging from 500 to 25,000 MCFD without fracturestimulation<br />
treatment. Consequently, these sandstones are not tight-gas reservoirs, and most fields producing from<br />
Cotton Valley sandstones in the blanket-sandstone trend were excluded from tight-gas status by FERC in 1980<br />
(Figure 8). Therefore, in the absence of some other regional top seal that could allow development of basin-wide<br />
overpressure, sandstones in this trend would not be expected to harbor a basin-center gas accumulation.<br />
South of this blanket-sandstone trend in northern Louisiana lies the massive-Cotton Valley sandstone trend, and<br />
it extends westward across the Sabine Uplift into northeast Texas, as shown in Figure 8. Massive Cotton Valley<br />
sandstones generally have porosities in the 6 to 10 percent range with permeabilities commonly less than 0.1 mD.<br />
Most of these sandstones, therefore, would be defined as tight-gas sandstones, and most all fields producing gas from<br />
these sandstones were designated as tight-gas-sandstone fields by FERC in 1980. Tight, massive Cotton Valley<br />
sandstones generally do not flow gas and/or liquids on open-hole DSTs, and they require massive-hydraulic-fracture<br />
treatment to produce gas at commercial rates. As shown in table 1, pre-stimulation initial-production rates generally<br />
range from too-small-to-measure (TSTM) to 300 MCFD. Post-stimulation rates commonly are 500 to 2,500<br />
MCFD. Although higher-permeability intervals occur locally within the massive-sandstone trend as noted by Wilson<br />
and Hensel (1984), characteristic low permeability of sandstones throughout this trend suggests that they might have<br />
potential to provide their own seal for gas in a continuous-gas accumulation.<br />
Abnormal Pressures<br />
In a study of abnormally high pressures in basin-centered-gas accumulations in Rocky Mountain basins, Spencer<br />
(1987) considered reservoirs to be significantly overpressured if FPGs exceed 0.50 psi/ft where waters are fresh to<br />
moderately saline, and 0.55 psi/ft where waters are very saline. With formation-water salinity of Cotton Valley<br />
sandstone reservoirs on the order of 170,000 ppm TDS (Dutton and others, 1993), salinity is considered high, and<br />
reservoirs should be considered to be overpressured if their FPGs exceed 0.55 psi/ft.<br />
Based on Spencer’s (1987) cutoff value of 0.55 psi/ft, abnormally high reservoir pressures have been encountered<br />
in Cotton Valley sandstones in an area of northeastern Louisiana, as shown in Figure 10, where calculated pressure<br />
gradients of 0.63 to 0.86 psi/ft occur. Boundary between areas of overpressure and normal pressure cuts across the<br />
permeable, blanket- and tight, massive-sandstone trends such that overpressures occur within both reservoir trends.<br />
(Figures 8 and 10). Although overpressures associated with generation of gas might be anticipated in tight Cotton<br />
Valley sandstones, such overpressures would not be expected to develop in high-permeability blanket sandstones<br />
without a sub-regional top seal stratigraphically above the sandstones. As shown in Figure 9 and table 2, some of<br />
the separate, stacked blanket sandstones within Hico, Tremont, and Calhoun Fields are overpressured, whereas others<br />
are normally pressured. Examination of discovery dates of gas in individual sandstones shows that in all cases for<br />
these three fields, normally pressured sandstone reservoirs were discovered prior to overpressured ones. Thus, pressure<br />
differences among individual blanket-sandstone reservoirs indicate presence of separate, compartmentalized reservoirs,<br />
rather than pressure depletion from production of gas from different sandstones that are in pressure communication.<br />
Additionally, normally pressured Cotton Valley sandstones were encountered at South Drew Field, whereas, at<br />
Cheniere Field immediately to the west, Cotton Valley sandstones were significantly overpressured with a FPG of<br />
0.86 psi/ft. Thus, for gas fields in the blanket-sandstone trend where data are abundant, reservoir pressures exhibit<br />
significant variation from normal to abnormally high among separate sandstone reservoirs within individual gas<br />
fields, and also between adjacent fields. Such compartmentalization of overpressured reservoirs in proximity to<br />
normally pressured ones, rather than development of overpressure on a regional scale, is more indicative of<br />
conventional-gas fields than basin-center gas accumulations.<br />
14
Within the western half of the blanket-sandstone trend and spanning the vast majority of the tight, massivesandstone<br />
trend across northwest Louisiana and northeast Texas, FPGs range from 0.32 to 0.55 psi/ft, and therefore,<br />
would be considered normal, according to methodology of Spencer (1987). However, two episodes of erosion have<br />
occurred in northeast Texas, one in late mid-Cretaceous time, and the second in early mid-Tertiary time (Dutton,<br />
1987; Laubach and Jackson, 1990; Jackson and Laubach, 1991). During late mid-Cretaceous time, maximum erosion<br />
occurred on the crest of the Sabine Uplift where approximately 1,800 feet of sedimentary section was removed.<br />
Tertiary erosion resulted in removal of about 1,500 feet of section across much of northeast Texas. Burial-history<br />
data for Ruston Field area in northern Louisiana on the boundary between overpressured and normally pressured<br />
regions, show about 1,500 and 500 feet of uplift and loss of section, respectively, in two erosional periods<br />
(Herrmann and others, 1991). It is possible, therefore, that with deeper burial, reservoir pressures in much or all of<br />
the massive-sandstone trend were higher, and that reduction of pressure has occurred as a result of uplift and erosion.<br />
However, much of the gas found in Cotton Valley sandstone reservoirs is believed to have been derived from Bossier<br />
Shale source rocks. Migration of most of that gas into Cotton Valley sandstones probably commenced between 57<br />
and 45 Ma (Dutton, 1987; Hermann and others, 1991). Therefore, if basin-wide overpressure in Cotton Valley<br />
sandstones were to have developed in response to thermal generation of gas from Bossier Shale source rocks, its<br />
development would have postdated the Tertiary erosional event.<br />
The sharp boundary between overpressured and normally pressured areas of Cotton Valley sandstones (Figure 10)<br />
and presence of overpressure in both permeable, blanket- and tight, massive-sandstone trends, suggest that<br />
abnormally high pressures encountered in Cotton Valley sandstones in northeast Louisiana are not caused by thermal<br />
generation and migration of gas. Coleman and Coleman (1981) attributed development of overpressures in Cotton<br />
Valley sandstones across the region shown in figure 10 to a late-stage of diagenesis in which extreme pressure,<br />
presumably overburden pressure, and temperature caused dissolution of silica at contact points of quartz-sand grains<br />
and precipitation of silica in adjacent pores. With pore waters apparently unable to escape, porosity reduction<br />
associated with this late-stage chemical compaction reportedly resulted in development of overpressure in Cotton<br />
Valley sandstones across the area shown in figure 10. According to Coleman and Coleman (1981), a significant<br />
factor in preventing fluid loss from Cotton Valley sandstones during this late diagenetic episode was presence of a<br />
tight top seal provided by the Knowles Limestone and upper Cotton Valley/lower Hosston shales.<br />
If late-stage chemical compaction and cementation in conjunction with a top seal of tight limestone and shale<br />
are responsible for development of overpressure, it is not clear why the geographic distribution of overpressure<br />
exhibits the pattern shown in figure 10. Perhaps an alternative mechanism for generating the distribution of<br />
overpressures within Cotton Valley sandstones shown in figure 10 could be one reported by Parker (1972) as cause<br />
for overpressures in Jurassic Smackover sandstone and carbonate reservoirs to the east in Mississippi. Parker (1972)<br />
noted that that much of the Smackover gas is sour and has a high relatively high content of CO 2 and/or N 2. He<br />
suggested that migration of gases derived from late-Cretaceous emplacement of the Jackson (igneous) Dome might<br />
be responsible for “inflation” of pressures in well-sealed Smackover reservoirs. Specifically, Jones (1977) suggested<br />
that H 2S and CO 2 present in Smackover gas in Mississippi were derived from igneous intrusion of anhydrite and<br />
limestone/dolomite, respectively. The mapped pattern of overpressured Cotton Valley sandstones (fig. 10) extends<br />
east-southeastward into Mississippi directly toward location of Jackson Dome (Studlick and others, 1990). Evidence<br />
supporting such a mechanism of overpressure development in Cotton Valley sandstones of northeast Louisiana<br />
would be elevated levels of CO 2 and/or N 2 in overpressured Cotton Valley sandstone reservoirs, but such data are not<br />
known.<br />
In summary, within most of the tight, massive Cotton Valley sandstone trend across western Louisiana and<br />
northeast Texas, Cotton Valley reservoirs are slightly, but not significantly, overpressured. Based on methodology<br />
and terminology of Spencer (1987), these reservoirs would be characterized as normally pressured. As described<br />
above, basin-centered, continuous-gas accumulations characteristically are significantly overpressured. Although<br />
pressure data for the tight, massive Cotton Valley sandstone trend are not definitive, they tend to suggest that a<br />
basin-center gas accumulation characterized by abnormally high pressures from thermal generation of gas is not<br />
present within the Cotton Valley Sandstone.<br />
15
Gas-Water Contacts<br />
Perhaps the most definitive criterion for establishing presence of a continuous-gas accumulation is absence of<br />
gas-water contacts. Gas-water contacts are distinctive features of conventional gas accumulations. Presence of a gaswater<br />
contact indicates change from gas-saturated to water-saturated porosity within a particular reservoir unit. This<br />
implies that a well drilled into that reservoir structurally below the gas-water contact should encounter only water,<br />
thereby demonstrating the absence of a continuous-gas accumulation in that immediate area.<br />
Within the blanket-sandstone trend across northernmost Louisiana, gas-water contacts have been reported in<br />
seven fields, as shown in Figure 13. Because of relatively high porosity and permeability in blanket sandstones, gaswater<br />
contacts are sharp and often are reported as a subsea depth to the nearest foot. Separate gas-water contacts for<br />
individual, stacked blanket sandstones have been identified in Hico-Knowles, South Drew, and Choudrant Fields<br />
(table 2). The seven fields in which gas-water contacts have been described are widely distributed across the blanketsandstone<br />
trend (Figure 13). Because of the relatively uniform distribution of high-permeability Cotton Valley<br />
sandstone reservoirs with conventional shale seals in fields across the blanket-sandstone trend, it is likely that all<br />
Cotton Valley fields in this trend have well-defined gas-water contacts similar to those documented in the seven fields<br />
shown in Figure 13. The Cotton Valley blanket-sandstone trend was defined as a continuous-gas accumulation in the<br />
1995 <strong>National</strong> Assessment of United States Oil and Gas Resources by the U.S. Geological Survey, Schenk and<br />
Viger (1996). However, presence of abundant gas-water contacts across this area suggests that the blanket-sandstone<br />
trend should be redefined as a conventional-gas play.<br />
Evaluating presence or absence of gas-water contacts in the tight, massive Cotton Valley sandstone trend is<br />
considerably more difficult. No reference to specific gas-water contacts for Cotton Valley sandstones in any Cotton<br />
Valley gas field has been found in published literature. Nangle and others (1982) and Dutton and others (1993),<br />
however, make general statements indicating that gas-water contacts are present in Cotton Valley fields across the<br />
tight, massive Cotton Valley sandstone trend.<br />
Although Taylor Sandstones in the lower part of the Cotton Valley section produce gas in all significant Cotton<br />
Valley fields in the tight, massive-sandstone trend, water-bearing sandstones have been reported along with gascharged<br />
sandstones in the middle and upper Cotton Valley interval in some fields. The seal for gas in wavedominated-delta<br />
Taylor Sandstones reportedly is provided by marsh and lagoonal shales (CER Corporation and S. A.<br />
Holditch & Associates, 1991). This seal would be considered conventional rather than one provided by low<br />
permeability of the reservoir sandstones. Along with Taylor Sandstones, most of the upper Cotton Valley Sandstone<br />
interval produces gas at some fields, such as Carthage Field, according to Al Brake (BP Amoco engineer, personal<br />
communication, 2000). At other fields such as Woodlawn and Blocker, however, gas is produced only from lower<br />
Cotton Valley Taylor sandstones and from a few sandstones in the uppermost Cotton Valley section. Intervening<br />
middle- and upper-Cotton Valley sandstones are water-bearing. Presence of individual gas-bearing and water-bearing<br />
sandstone intervals separated by conventional shale seals suggests presence of gas-water contacts, and is more<br />
indicative of conventional-gas accumulations than of continuous-gas accumulations.<br />
Complex diagenetic mineralogy of tight Cotton Valley sandstones probably precludes use wireline logs to<br />
identify gas-water contacts. As reported above, complex diagenetic mineralogy of tight Cotton Valley sandstones<br />
dramatically affects values of resistivity and porosity measured by wireline logs, and hence determination of water<br />
saturation by standard calculation techniques. Because of vertical and lateral diagenetic variations, accurate<br />
determination of water saturation is difficult without accompanying lithologic data from cores or cuttings to calibrate<br />
wireline logs. Additionally, as described above, examination of production-test data from wells flanking many<br />
Cotton Valley gas fields in the tight-gas-sandstone trend reveals no dry holes that tested water only without gas.<br />
Therefore, even if wireline logs provided accurate estimates of water saturations in tight Cotton Valley sandstones,<br />
few wells apparently exist in which logs could be used to identify gas-water contacts.<br />
As described above, reconnaissance evaluation of DST and production-test data from Cotton Valley sandstones in<br />
a number of fields in the tight-gas sandstone trend revealed few dry holes penetrating Cotton Valley sandstones on<br />
flanks of those fields. No dry holes were found that tested water only without gas, thereby implying existence of a<br />
gas-water contact for a particular field. Detailed analysis of data on initial rates of gas and water production from Oak<br />
16
Hill and Elm-Grove/Caspiana Fields in the tight-gas-sandstone trend reveal no definitive understanding of presence or<br />
absence of gas-water contacts in these Cotton Valley fields. Initial rates of gas production from flank wells, however,<br />
generally are lower than from crestal wells in these tight-gas Cotton valley fields, as illustrated for Caspiana Field in<br />
figure 14. Also, as shown for Caspiana Field in figure 15, ratio of initial rate of water production to initial rate of<br />
gas production in terms of bbls wtr/MMCFG is significantly higher in flank wells. Initial rates of gas production<br />
from crestal wells commonly range from 1,000 to more than 4,000 MCFD and ratio of initial rate of water to gas<br />
generally is less than 200 bbls wtr/MMCFG and often below 100 bbls wtr/MMCFG (figs 14 and 15). Initial rates of<br />
gas production from flank wells generally are less than 1,000 MCFD, and water production initially is significantly<br />
higher, usually in the 300 to 600 bbls wtr/MMCFG range, but sometimes exceeding 1,000 bbls wtr/MMCFG (figs.<br />
14 and 15). These data suggest a decrease in gas saturation and accompanying increase in water saturation in Cotton<br />
valley sandstones from crestal wells to flank wells, and that a commercial limit to gas production has been reached,<br />
although gas-water contacts have not been encountered.<br />
Information suggesting that commercial limits generally have been established and that these tight-gas-sandstone<br />
Cotton Valley fields have gas-water contacts is provided by former BP Amoco geologist Al Taylor, who worked the<br />
Cotton Valley trend for BP Amoco and continues to prospect in that trend as an independent geologist. According to<br />
Al Taylor (personal communication, 2000), Cotton Valley fields in the tight-gas-sandstone trend have vertically<br />
extensive gas-water transition zones situated between structurally high regions of fields, where gas saturations are<br />
high, and gas-water contacts below. His interpretation is consistent with that reported by Nangle and others (1982),<br />
and with patterns observed at Caspiana Field, as shown in figures 14 and 15. In moving structurally lower through<br />
such a long gas-water transition zone toward the gas-water contact, gas saturation of sandstone reservoirs continually<br />
decreases while water saturation simultaneously increases. Wells that are low in the transition zone on the edges of<br />
Cotton Valley fields in the tight-gas sandstone trend exhibit low initial rates of gas production and high initial rates<br />
of water production, as shown by some flank wells at Caspiana Field in figures 14 and 15. Hyperbolic decline rates<br />
in conjunction with lower gas saturations of reservoir sandstones in these transition-zone wells result in such low<br />
cumulative production of gas that these wells are marginally commercial to non-commercial, and in effect are dry<br />
holes (Al Taylor, personal communication, 2000). Hence, commercial limits of gas production are reached before<br />
gas-water contacts are encountered by development drilling. To help illustrate this, it might be instructive to map<br />
cumulative gas production for wells in these Cotton Valley fields in addition to initial rates of gas and water<br />
production.<br />
Knowing gas saturations of Cotton Valley reservoir sandstones from log calculations and capillary properties of<br />
those sandstones from core analyses at Caspiana Field in northwest Louisiana, Al Taylor (personal communication,<br />
2000) estimated gas-column heights required to produce those gas saturations. From column-height data, he<br />
determined the subsea position of gas-water contacts. Estimates made in this fashion for structural level of the gaswater<br />
contact at Caspiana Field using data from a number of wells cluster within a zone about 75 feet thick,<br />
suggesting presence of a single gas-water contact for the field. A Cotton Valley well situated structurally below this<br />
estimated gas-water contact reportedly tested water only from Cotton Valley sandstones (Al Taylor, personal<br />
communication, 2000).<br />
Physical principles governing effects of porosity and permeability on capillary forces, and hence on thickness of<br />
transition zones in sandstones with different reservoir properties, are well understood. Arps (1964) diagrammatically<br />
showed a simple physics experiment in which glass tubes of different diameters are partially immersed in a container<br />
filled with water. As shown in Figure 16 the height to which water rises in the tubes is a function of diameter of the<br />
tubes. Water rises to the highest level in the tube with the smallest diameter in response to capillary forces. The<br />
same principle operates in reservoir sandstones in a geological structure, as depicted on the left side in Figure 16. In<br />
fine-grained, clay-rich, tight sandstones, where pore throats are small, water tends to rise higher above the free-water<br />
level than it does in cleaner, coarser-grained sandstones with higher porosity and permeability. Effect of different<br />
porosity and permeability on capillary-pressure forces also is illustrated by capillary-pressure curves shown on the<br />
graph on the right side of Figure 16. “Low”, “medium”, and “high” on the curves indicate relative magnitude of<br />
porosity and permeability of three hypothetical reservoir sandstones. The sandstone with lowest porosity and<br />
permeability clearly displays a considerably thicker transition zone than the sandstone with best reservoir properties.<br />
As Arps (1964) concluded from his discussion of Figure 16, the minimum vertical closure necessary to achieve<br />
water-free gas production is a function of porosity and permeability of a reservoir sandstone. As shown in the graph<br />
17
on the right side of Figure 16, minimum structural closure necessary to obtain water-free production of gas must<br />
exceed the vertical height required to be below the critical water saturation. Because such long gas-water transition<br />
zones are present in tight Cotton valley sandstones, Al Taylor (personal communication, 2000), suggests that<br />
structural or stratigraphic traps with less than 150 feet of vertical closure in the tight Cotton Valley trend will not<br />
have sufficient gas saturation to produce gas at commercial rates.<br />
In summary, Cotton Valley blanket sandstones across northernmost Louisiana have sufficiently high porosity<br />
and permeability that gas accumulations exhibit short transition zones and have sharp gas-water contacts. Gas fields<br />
in this trend have clearly defined productive limits, beyond which, wells produce water only. However, lowpermeability<br />
Cotton Valley sandstones in the tight-gas-sandstone trend across north Louisiana, the Sabine Uplift,<br />
and East Texas Basin, display long gas-water transition zones with poorly defined gas-water contacts. Productive<br />
limits of fields in this trend are difficult to define based on data from production tests or wireline logs. In conjunction<br />
with long gas-water transition zones, structural dips are gentle on the flanks of these gas accumulations. As<br />
development drilling progresses down the flank of one of these fields through the long gas-water transition zone, gas<br />
saturations in the sandstone reservoir decrease and water saturations increase. Eventually gas saturations become<br />
sufficiently low that, in terms of cumulative gas production, wells become marginally commercial to noncommercial<br />
at a structural position still within the transition zone above the gas-water contact. Hence, development<br />
wells on the flanks of these gas accumulations rarely encounter gas-water contacts. If drilling and completion costs<br />
hypothetically were reduced to zero, causing even the smallest amount of gas recovery to be commercial,<br />
development drilling probably would progress down the full length of transition zones, and gas-water contacts would<br />
be encountered in these gas accumulations. Presence of gas-water contacts in both Cotton Valley blanket- and<br />
massive-sandstone trends suggests that gas accumulations in these trends are conventional, and that a basin-center gas<br />
accumulation does not exist within Cotton Valley sandstones in the northern Gulf of Mexico Basin.<br />
Basin-Center Gas Potential within Bossier Shale<br />
As mentioned above in the section on Cotton Valley Stratigraphic Nomenclature, a basin-center, continuous-gas<br />
accumulation might have been discovered recently in sandstones within the Bossier Shale, the lower formation of the<br />
Cotton Valley Group. In a currently developing play on the western flank of East Texas Basin, gas is being produced<br />
from turbidite sandstones within the Bossier Shale. These turbidite sandstones probably are downdip time-equivalent<br />
deposits of deltaic sandstones in the lower portion of the Cotton Valley Sandstone and reportedly were deposited<br />
seaward of the underlying Haynesville carbonate platform edge in a slope or lowstand-fan setting. Accommodation<br />
space was provided by salt withdrawal such that updip and lateral traps currently are formed by pinchout of sandstone<br />
into shale. Two stacked, stratigraphically separate Bossier turbidite-fan systems occur at depths of 13,000 to 14,000<br />
feet. Two fields, Dew and Mimms Creek, with combined estimated recoverable reserves of more than one TCFG,<br />
currently are being developed by Anadarko Petroleum, one of the main operators. As of January 2000 (PI-Dwights<br />
Drilling Wire, Jan 3, 2000; Jan 12, 2000), Anadarko had drilled more than 100 wells with only one dry hole in this<br />
Bossier sandstone play. Gas-charged sandstones reportedly are overpressured, and no water has been encountered in the<br />
system (Exploration Business Journal, 2 nd quarter, 2000). Within the upper turbidite-fan interval, porosity ranges<br />
from 6 to 15 percent and permeability from 0.01 to 1.0 mD. Initial production rates from wells average 3 to 4<br />
MMCFGD after fracture stimulation and decline exponentially with estimated per-well recoveries of 1 to 5 BCFG. In<br />
the lower sandstone interval, porosity ranges from 9 to 20 percent, permeability from 1 to 10 md, pressures are<br />
higher, and initial production rates of up to 30 MMCFGD have been obtained. This play does not seem to involve<br />
the classic type of basin-center gas accumulation with trap produced by inherent low-permeability of reservoir<br />
sandstones. Instead, the trap seems to be provided by marine shales that completely encase these turbidite sandstones,<br />
but the sandstone reservoirs are overpressured, seem to lack water and gas-water contacts, and are gas-charged over an<br />
extensive area as witness by only one dry hole in more than 100 wells drilled.<br />
18
CONCLUSIONS<br />
19<br />
1) Cotton Valley Sandstone and underlying Bossier Shale represent the first major influx of clastic sediment<br />
into the Gulf of Mexico Basin. Major depocenters were located in south-central Mississippi, along the<br />
Louisiana-Mississippi border, and in northeast Texas. Sands supplied by the ancestral Mississippi drainage<br />
along the Louisiana-Mississippi border were swept westward by longshore currents, creating an east-west<br />
barrier-island or strandplain system across north Louisiana that isolated a lagoon to the north. More than<br />
1,000 feet of stacked barrier-island sands accumulated as the Terryville Massive-Sandstone complex.<br />
Periodic transgressive events reworked barrier-island sands, transporting them northward into the lagoon.<br />
These transgressive sandstones pinch out into lagoonal shales, can be correlated across north Louisiana, and<br />
are referred to informally as blanket sandstones.<br />
2) Two major trends of Cotton Valley sandstones are identified based on reservoir properties and associated<br />
characteristics of gas production. Transgressive, blanket sandstones across northernmost Louisiana have<br />
porosities ranging from 10 to 19 percent and permeabilities from 1 to 280 mD. These sandstones flow gas<br />
and/or liquids during open-hole DSTs, and do not require fracture-stimulation treatment to produce gas at<br />
commercial rates. Fields producing from these sandstone reservoirs were developed during the 1940s through<br />
1960s. Cotton Valley massive sandstones to the south and extending westward across the Sabine Uplift into<br />
east Texas exhibit porosities from 6 to 10 percent and permeabilities generally less than 0.1 mD.<br />
Designated as tight-gas sandstones, these reservoirs commonly do not flow gas or liquids during DSTs, and<br />
they require fracture-stimulation treatments to achieve commercial rates of production. Gas production from<br />
these sandstones in east Texas and north Louisiana was not established until the mid 1970s when advances<br />
in massive-hydraulic-fracture techniques occurred in conjunction with a significant increase in gas prices as a<br />
result of price deregulation.<br />
3) Porosity and permeability of Cotton Valley sandstones are controlled by diagenetic properties, which in turn<br />
are governed by depositional environment. Although diagenetic mineralogy and patterns are complex, highenergy,<br />
clean sandstones generally are cemented by authigenic quartz and/or calcite and have poor reservoir<br />
properties. In lower energy sandstones, clay coats on quartz grains inhibited development of quartz<br />
overgrowths, resulting in preservation of primary porosity. High clay content, however, generally imparts<br />
poor permeability to these sandstones. Best reservoir sandstones are those which have experienced<br />
development of significant secondary porosity from dissolution of calcite cement and unstable framework<br />
grains.<br />
4) Complex diagenetic mineralogy of tight Cotton Valley sandstones prohibits use of standard calculation<br />
methods in reservoir evaluation with wireline logs. Bound water associated with pore-filling clays or clay<br />
coats and conductive minerals such as pyrite result in abnormally low resistivity measurements leading to<br />
such high calculated water saturations that productive zones often appear wet. Also resulting in erroneous<br />
reservoir evaluations are pessimistic measurements of porosity with wireline logs caused by presence of<br />
high-density carbonate minerals such as ankerite and siderite. Therefore, without lithologic data from cores<br />
or drill cuttings to calibrate wireline logs, such logs are of limited value in differentiating between gasproductive<br />
and wet intervals, and therefore in identifying gas-water contacts on the flanks of Cotton Valley<br />
fields.<br />
5) Abnormally high reservoir pressures with fluid-pressure gradients exceeding 0.55 psi/ft occur in Cotton<br />
Valley sandstones in northeast Louisiana. Boundary between the overpressured area on the east and normally<br />
pressured region to the west cuts across the permeable, blanket- and tight, massive-sandstone trends such<br />
that overpressures occur within both reservoir trends. Within the blanket-sandstone trend, where pressure<br />
data are more abundant, some Cotton Valley fields are overpressured whereas adjacent fields are normally<br />
pressured. Also, within certain fields, some of the stacked blanket sandstones are overpressured whereas<br />
others are normally pressured. Such compartmentalization of overpressured reservoirs in proximity to<br />
normally pressured ones, rather than development of overpressure on a regional scale, suggests that these<br />
blanket-sandstone fields are conventional-gas accumulations and not part of a basin-centered accumulation.<br />
Also, occurrence of normally pressured reservoirs across the majority of the tight, massive Cotton Valley
20<br />
sandstone trend is not indicative of presence of a basin-center, continuous-gas accumulation. Geographic<br />
distribution of overpressures in Cotton Valley sandstones suggests that overpressuring was caused by<br />
“inflation” of existing pressures in tightly sealed reservoirs by gases derived from emplacement of nearby<br />
Jackson (igneous) Dome.<br />
6) Gas found in Cotton Valley sandstone reservoirs is believed to be derived from interbedded Cotton Valley<br />
marine shales, underlying marine shales of the Bossier Formation, and/or stratigraphically lower, Jurassic<br />
Smackover laminated, lime mudstones. These source rocks are believed to have been buried to sufficient<br />
depths relative to regional geothermal gradient to have generated dry gas during the past 60 m.y. Timing of<br />
gas generation and migration is favorable because it postdates development of the Sabine Uplift, smaller<br />
structures on and flanking the Uplift, and salt structures in the East Texas and North Louisiana Salt Basins.<br />
Stratigraphic proximity of source rocks with Cotton Valley sandstone reservoirs and appropriate thermal<br />
maturity and time of generation and migration would be consistent with interpretation of a potential basincentered<br />
gas accumulation.<br />
7) Presence of a gas-water contact is perhaps the most definitive criterion suggesting that a gas accumulation<br />
is conventional rather than a “sweetspot” within a basin-center, continuous-gas accumulation. Within the<br />
Cotton Valley blanket-sandstone trend across northernmost Louisiana, short gas-water transition zones and<br />
well-defined gas-water contacts have been reported in seven gas fields. Relatively high porosity and<br />
permeability of blanket sandstones and associated high gas-production rates achieved without fracture<br />
stimulation throughout the trend suggest that all gas fields within the blanket-sandstone trend probably have<br />
well-defined gas-water contacts, and therefore that these gas accumulations are conventional.<br />
8) Within the tight, massive-sandstone trend, porosity and permeability are sufficiently low that gas-water<br />
transition zones are long and gas-water contacts poorly defined. Productive limits of these tight-gassandstone<br />
Cotton Valley fields are not defined by wells which encounter a gas-water contact or test water<br />
only without gas from a zone below a gas-water contact, as in the blanket-sandstone trend. With increasing<br />
depth through long gas-water transition zones, gas saturation in reservoir sandstones decreases and water<br />
saturation increases. Eventually gas saturations become sufficiently low that, in terms of cumulative gas<br />
production, wells become marginally commercial to non-commercial at a structural position still within the<br />
transition zone above the gas-water contact. Therefore, development wells on the flanks of gas<br />
accumulations in the tight, massive Cotton Valley sandstone trend rarely encounter gas-water contacts. If<br />
even the smallest amount of gas recovery were commercial, development drilling probably would progress<br />
down the full length of transition zones, and gas-water contacts would be encountered in these gas<br />
accumulations. Presence of gas-water contacts in gas accumulations within the tight, massive Cotton<br />
Valley sandstone trend suggests that accumulations in this trend, too, are conventional, and that a basincenter<br />
gas accumulation does not exist within the Cotton Valley Sandstone in the northern Gulf of Mexico<br />
Basin.<br />
9) A basin-center, continuous-gas accumulation might occur in turbidite sandstones within the Bossier Shale,<br />
the lower formation of the Cotton Valley Group. In a currently developing play on the western flank of<br />
East Texas Basin, gas production with estimated recoverable reserves exceeding one TCFG is being obtained<br />
from sandstone reservoirs, interpreted as slope or lowstand fan deposits, that are completely encased in<br />
marine shales. Reservoirs are significantly overpressured and no water has been encountered in the system.<br />
More than one hundred successful wells have been drilled with only one dry hole.
ACKNOWLEDGEMENTS<br />
I thank Steve Condon, USGS geologist in Denver, for extracting Cotton Valley well and test data from the IHS<br />
<strong>Energy</strong> Group database and preparing them for analysis with ACRVIEW software at the USGS Denver facility.<br />
Laura Biewick, USGS Denver, and Steve Condon provided expert instruction and assistance in using ARCVIEW to<br />
evaluate Cotton Valley well and test data. Ted Dyman, Chris Schenk, and Laura Biewick, USGS Denver, provided<br />
background information on the 1995 USGS assessment of Cotton Valley gas resources. I also thank the staff at the<br />
USGS library in Denver, USGS geologist Ted Dyman, and Gregory J. Zerrahn and Joseph A. Lott, geologists with<br />
Palmer Petroleum, Shreveport, Louisiana, for prompt and thorough assistance in obtaining reports, maps, and<br />
literature, without which, this study could not have been accomplished. <strong>Final</strong>ly, thanks go to Al Brake, BP Amoco<br />
engineer, and Al Taylor, former BP Amoco geologist, for providing invaluable information on characteristics of<br />
Cotton Valley tight-gas accumulations not available in published literature.<br />
21
REFERENCES<br />
Almon, W.R., 1979, A geologic appreciation of shaly sands: Society of Professional Well Log Analysts,<br />
Twentieth Annual Logging Symposium, p. WW 1-14.<br />
Arps, J.J., 1964, Engineering concepts useful in oil finding: Amer. Assoc. Petroleum Geologists Bull., v. 48,<br />
no. 2, p. 157-165.<br />
Bebout, D.G., W.A. White, C.M. Garrett, Jr., and T.F. Henz, 1992, Atlas of major central and eastern Gulf<br />
Coast gas reservoirs: University of Texas at Austin, Bureau of Economic Geology, 88 p.<br />
Black, C.E., and R.R. Berg, 1987, Fan-delta reservoirs in the Lower Cotton Valley Group (Jurassic), Kildare<br />
Field, northeast Texas: Gulf Coast Assoc. Geol. Socs. Trans., v. 37, p. 35-42.<br />
Bruce, P.L., J.L. Hunter, R.D. Kuhlman, and D.D. Weinheimer, 1992, New fracturing techniques reduce tight<br />
gas sand completion problems: Oil and Gas Journal, v. 90, no. 41, p. 72-76.<br />
CER Corporation and S.A. Holditch & Associates, eds., 1991, Staged field experiment no. 3: application of<br />
advanced technologies in tight-gas sandstones—Travis Peak and Cotton Valley Formations, Waskom<br />
Field, Harrison County, Texas: Gas Research Institute report 91/0048, 253 p.<br />
Coleman, J.L., Jr., and C.J. Coleman, 1981, Stratigraphic, sedimentologic and diagenetic framework for the<br />
Jurassic Cotton Valley Terryville massive sandstone complex, northern Louisiana: Gulf Coast Assoc.<br />
Geol. Socs. Trans., v. 31, p. 71-79.<br />
Coleman, J.L., Jr., 1985, Diagenesis of Cotton Valley Sandstone (Upper Jurassic), East Texas: Implications for<br />
tight-gas formation pay recognition: Discussion: Amer. Assoc. Petroleum Geologists Bull., v. 69, no. 5,<br />
p. 813-815.<br />
Collins, S.E., 1980, Jurassic Cotton Valley and Smackover reservoir trends, east Texas, north Louisiana, and<br />
south Arkansas: Amer. Assoc. Petroleum Geologists Bull., v. 64, no. 7, p. 1004-1013.<br />
Dow, W.G., 1978, Petroleum source beds on continental slopes and rises: Amer. Assoc. Petroleum Geologists<br />
Bull., v. 62, no. 9, p. 1584-1606.<br />
Dutton, S.P., 1987, Diagenesis and burial history of the Lower Cretaceous Travis Peak Formation, East Texas:<br />
University of Texas, Bureau of Economic Geology, <strong>Report</strong> of Investigations No. 164, 58 p.<br />
Dutton, S.P., S.J. Clift, D.S. Hamilton, H.S. Hamlin, T.F. Hentz, W.E. Howard, M.S. Akhter, and S.E<br />
Laubach, 1993, Major low-permeability sandstone gas reservoirs in the continental United States:<br />
University of Texas, Bureau of Economic Geology, <strong>Report</strong> of Investigations No. 211, 221 p.<br />
Eversull, L.G., 1985, Depositional systems and distribution of Cotton Valley blanket sandstones in northern<br />
Louisiana: Gulf Coast Assoc. Geol. Socs. Trans., v. 35, p. 49-57.<br />
Finley, R.J., 1984, Geology and engineering characteristics of selected low-permeability gas sandstones: a<br />
national survey: University of Texas, Bureau of Economic Geology, <strong>Report</strong> of Investigations No. 138,<br />
220p.<br />
Finley, R.J., 1986, An overview of selected blanket-geometry, low-permeability gas sandstones in Texas, in<br />
Spencer, C.W. and R.F. Mast, eds., Geology of tight-gas reservoirs: Amer. Assoc. Petroleum Geologists<br />
Studies in Geology No. 24, p. 69-85.
2<br />
Ganer, B.L., 1985, Case history of Cotton Valley Sand log interpretation for a north Louisiana field: Jour.<br />
Petroleum <strong>Technology</strong>, v. 37, no. 11, p. 1995 –2005.<br />
Gies, R.M., 1984, Case history for a major Alberta deep-basin gas trap: the Cadomin Formation, in Masters,<br />
J.A., ed., Elmworth—Case study of a deep-basin gas field: Amer. Assoc. Petroleum Geologists Memoir<br />
39, p. 115-140.<br />
Hall, C.D., J.S. Janks, and G.H. Ladle, 1984, Sedimentology and diagenesis of the Cotton Valley sandstone in<br />
the Amoco No. 1 Cullers well, Rusk County, Texas, in Presley, M.W., ed., The Jurassic of east Texas:<br />
East Texas Geological Society, Tyler, Texas, p. 127-140.<br />
Herrmann, L.A., J.A. Lott, and R.E. Davenport, 1991, Ruston Field—U.S.A., Gulf Coast Basin, Louisiana, in<br />
Beaumont, E.A. and N.H. Foster, eds., Amer. Assoc. Petroleum Geologists Treatise of Petroleum<br />
Geology, Structural Traps V, p. 151-186.<br />
Jackson, M.L.W., and S.E. Laubach, 1991, Structural history and origin of the Sabine Arch, East Texas and<br />
Northwest Louisiana: University of Texas at Austin, Bureau of Economic Geology, Geological Circular<br />
91-3, 47 p.<br />
Janks, J.S., T. Sanness, and B.A. Rasmussen, 1985, Diagenesis of the Cotton Valley sandstones, Catahoula<br />
Creek Field, southern Mississippi: Gulf Coast Assoc. Geol. Socs. Trans., v. 35, p. 415-423.<br />
Jennings, A.R., and B.T. Sprawls, 1977, Successful stimulation in the Cotton Valley sandstone – a lowpermeability<br />
reservoir: Jour. Petroleum <strong>Technology</strong>, v. 29, no. 10, p. 1267 – 1276.<br />
Jones, P.H., 1977, Geopressuring mechanism of Smackover gas reservoirs, Jackson Dome Area, Mississippi:<br />
Discussion: Jour. Petroleum <strong>Technology</strong>, v. 29, no. 5, p.584-585.<br />
Kast, J.A., 1983, Depositional environments of Schuler Formation (Cotton Valley Sands), Upshur County,<br />
Texas: (abs), Amer. Assoc. Petroleum Geologists Bull., v. 67, no. 3, p. 493.<br />
Kosters, E.C., D.G. Bebout, S.J. Seni, C.M. Garrett, Jr., L.F. Brown, Jr., H.S. Hamlin, S.P. Dutton, S.C.<br />
Ruppel, R.J. Finley, and Noel Tyler, 1989, Atlas of major Texas gas reservoirs: University of Texas at<br />
Austin, Bureau of Economic Geology, 161 p.<br />
Laubach, S.E., and M.L.W. Jackson, 1990, Origin of arches in the northwestern Gulf of Mexico Basin:<br />
Geology, v. 18, p. 595-598.<br />
Law, B.E., and W.W. Dickinson, 1985, Conceptual model for origin of abnormally pressured gas accumulations<br />
in low-permeability reservoirs: Amer. Assoc. Petroleum Geologists Bulletin, v. 69, no. 8, p. 1295-1304.<br />
Law, B.E., and C.W. Spencer, 1993, Gas in tight reservoirs—an emerging major source of energy, in Howell,<br />
D.G., ed., The future of energy gases: U.S. Geological Survey Professional Paper 1570, p. 233-252.<br />
Lopatin, N.V., 1971, Temperature and geologic time as factors of carbonification (in Russian): Izvestiya<br />
Akademii Nauk SSSR, Seriya Geologischeskaya, no 3., p. 95-106.<br />
Mann, C.J., and W.A. Thomas, 1964, Cotton Valley Group (Jurassic) nomenclature Louisiana and Arkansas:<br />
Gulf Coast Assoc. Geol. Socs. Trans., v. 14, p. 143-152.<br />
McGowen, M.K., and D.W. Harris, 1984, Cotton Valley (Upper Jurassic) and Hosston (Lower Cretaceous)<br />
depositional systems and their influence on salt tectonics in the East Texas Basin: University of Texas,<br />
Bureau of Economic Geology, Geological Circular 84-5, 41p.
3<br />
Meehan, D.N., and B.F. Pennington, 1982, Numerical simulation results in the Carthage Cotton Valley Field:<br />
Jour. Petroleum <strong>Technology</strong>, v. 34, no. 1, p. 189-198.<br />
Moore, T., 1983, Cotton Valley depositional systems of Mississippi: Gulf Coast Assoc. Geol. Socs. Trans., v.<br />
33, p. 163-167.<br />
Nangle, P., W.H. Fertl, and E. Frost, Jr., 1982, What to expect when logging the Cotton Valley trend: World<br />
Oil, v. 195, no. 5, p. 175-195.<br />
Parker, C.A., 1972, Geopressures in the Smackover on Mississippi, in Abnormal subsurface pressure<br />
symposium (Baton Rouge): Soc. Petroleum Engineers SPE 3885, p.109-114.<br />
Pate, B.F., 1963, Significant north Louisiana Cotton Valley stratigraphic traps: Gulf Coast Assoc. Geol. Socs.<br />
Trans., v. 13, p. 177-183.<br />
Pate, B.P., and R.N. Goodwin, 1961, Calhoun Field, Jackson, Lincoln, Ouachita Parishes, Louisiana: Gulf<br />
Coast Assoc. Geol. Socs. Trans., v. 11, p. 197-201.<br />
Presley, M.W., and C.H. Reed, 1984, Jurassic exploration trends of east Texas, in Presley, M.W., ed., The<br />
Jurassic of east Texas: East Texas Geological Society, Tyler, Texas, p. 11-22.<br />
Royden, L., J.G. Sclater, and R.P. Von Herzen, 1980, Continental margin subsidence and heat flow: important<br />
parameters in formation of petroleum hydrocarbons: Amer. Assoc. Petroleum Geologists Bull., v. 64,<br />
no. 2, p. 173-187.<br />
Russell, B.J., Jr., A.A. Sartin, and E.B. Ledger, 1984, Depositional and diagenetic history of the Bodcaw Sand,<br />
Cotton Valley Group (Upper Jurassic), Longwood Field, Caddo Parish, Louisiana: Gulf Coast Assoc.<br />
Geol. Socs. Trans., v. 34, p. 217-228.<br />
Salvador, A., 1987, Late Triassic-Jurassic paleogeography and origin of Gulf of Mexico Basin: Amer. Assoc.<br />
Petroleum Geologists Bull., v. 71, no. 4, p. 419-451.<br />
Sassen, R., and C.H. Moore, 1988, Framework of hydrocarbon generation and destruction in eastern Smackover<br />
trend: Amer. Assoc. Petroleum Geologists Bull., v. 72, no. 6, p. 649-663.<br />
Scardina, A.D., 1981, Tectonic subsidence history of the North Louisiana Salt Basin, M.S. Thesis, Louisiana<br />
State University, 103 p.<br />
Schenk, C.J., and R.J. Viger, 1996, East Texas Basin and Mississippi-Louisiana Salt Basins Provinces, Region<br />
6—Gulf Coast, Geologic Framework, in Gautier, D.L., G.L. Dolton, K.I. Takahashi, and K.L. Varnes,<br />
eds., 1995 <strong>National</strong> assessment of United States oil and gas resources—results, methodology, and<br />
supporting data, U.S. Geological Survey Digital Data Series DDS-30, Release 2.<br />
Shreveport Geological Society, 1946, Reference report on certain oil and gas fields of north Louisiana, south<br />
Arkansas, Mississippi, and Alabama: Shreveport Geological Society Reference Volume I, 333p.<br />
Shreveport Geological Society, 1947, Reference report on certain oil and gas fields of north Louisiana, south<br />
Arkansas, Mississippi, and Alabama: Shreveport Geological Society Reference Volume II, 503p.<br />
Shreveport Geological Society, 1951, Reference report on certain oil and gas fields of north Louisiana, south<br />
Arkansas, Mississippi, and Alabama: Shreveport Geological Society Reference Volume III, no. 1, 42p.<br />
Shreveport Geological Society, 1953, Reference report on certain oil and gas fields of north Louisiana, south<br />
Arkansas, Mississippi, and Alabama: Shreveport Geological Society Reference Volume III, no. 2, 109p.
4<br />
Shreveport Geological Society, 1958, Reference report on certain oil and gas fields of north Louisiana, south<br />
Arkansas, Mississippi, and Alabama: Shreveport Geological Society Reference Volume IV, 204p.<br />
Shreveport Geological Society, 1963, <strong>Report</strong> on selected north Louisiana and south Arkansas oil and gas fields<br />
and regional geology: Shreveport Geological Society Reference Volume V, 202p.<br />
Shreveport Geological Society, 1980, <strong>Report</strong> on selected oil and gas fields, north Louisiana and south Arkansas:<br />
Shreveport Geological Society Reference Volume VI, 160p.<br />
Shreveport Geological Society, 1987, <strong>Report</strong> on selected oil and gas fields, Ark-La-Tex and Mississippi:<br />
Shreveport Geological Society Reference Volume VII, 153p.<br />
Sloane, B.J., Jr., 1958, The subsurface Jurassic Bodcaw sand in Louisiana: Louisiana Geological Survey,<br />
Geological Bulletin, no. 33, 33p.<br />
Snedden, J.W., 1984, Validity of the use of the spontaneous potential curve shape in the interpretation of<br />
sandstone depositional environments: Geol. Socs. Trans., v. 34, p. 255-263.<br />
Sonnenberg, S.A., 1976, Interpretation of Cotton Valley depositional environment from core study, Frierson<br />
Field, Louisiana: Gulf Coast Assoc. Geol. Socs. Trans., v. 26, p. 320-325.<br />
Spencer, C.W., 1987, Hydrocarbon generation as a mechanism for overpressuring in Rocky Mountain region:<br />
Amer. Assoc. Petroleum Geologists Bull., v. 71, no. 4. p. 368-388.<br />
Studlick, J.R.J., R.D. Shew, G.L. Basye, and J.R. Ray, 1990, A giant carbon dioxide accumulation in the<br />
Norphlet Formation, Pisgah anticline, Mississippi, in Barwis, J.H., J.C. McPherson, and J.R.J.<br />
Studlick, eds., Sandstone petroleum reservoirs: New York, Springer-Verlag, p. 181-203.<br />
Swain, F.M., 1944, Stratigraphy of Cotton Valley beds of northern Gulf coastal plain: Amer. Assoc. Petroleum<br />
Geologists Bull., v. 28, no. 5. p. 577-614.<br />
Thomas, W.A., and C.J. Mann, 1963, Correlation chart of the upper Cotton Valley sands, in Herrmann, L.A.,<br />
ed., Shreveport Geol. Soc. Reference Rept., v. V, p. 9-17.<br />
Thomas, W.A., and C.J. Mann, 1966, Late Jurassic depositional environments, Louisiana and Arkansas: Amer.<br />
Assoc. Petroleum Geologists Bull., v. 50, no. 1. p. 178-182.<br />
Tindall, W.A., J.K. Neal, and J.C. Hunter, 1981, Evolution of fracturing the Cotton Valley Sands in Oak Hill<br />
Field: Jour. Petroleum <strong>Technology</strong>, v. 33, no. 5, p.799-807.<br />
Tissot, B.P., and D.H. Welte, 1978, Petroleum formation and occurrence: New York, Springer-Verlag, 538 p.<br />
Trojan, M., 1985, Effects of diagenesis on reservoir properties and log response, Upper Jurassic Taylor<br />
Sandstone, Cotton Valley Group, Lincoln Parish, Louisiana: Geol. Socs. Trans., v. 35, p. 515-523.<br />
Turner, J.R. 1997, Recognition of low resistivity, high permeability reservoir beds in the Travis Peak and<br />
Cotton Valley of East Texas: Gulf Coast Assoc. Geol. Socs. Trans., v. 47, p. 585-593.<br />
Wapples, D.W., 1980, Time and temperature in petroleum formation: application of Lopatin’s method to<br />
petroleum exploration: Amer. Assoc. Petroleum Geologists Bull., v. 64, no. 6, p. 916-926.
5<br />
Wescott, W.A., 1983, Diagenesis of Cotton Valley Sandstone (Upper Jurassic), East Texas: Implications for<br />
tight gas formation pay recognition: Amer. Assoc. Petroleum Geologists Bull., v. 67, no. 6, p. 1002-<br />
1013.<br />
Wescott, W.A., 1985, Diagenesis of Cotton Valley Sandstone (Upper Jurassic), East Texas: Implications for<br />
tight gas formation pay recognition: Reply: Amer. Assoc. Petroleum Geologists Bull., v. 69, no. 5, p.<br />
816-818.<br />
Wescott, W.A., and W.C. Hood, 1991, Hydrocarbon generation and migration routes in the East Texas Basin:<br />
Gulf Coast Assoc. Geol. Socs. Trans., v. 41, p. 675.<br />
White, W.A., and C.M. Garrett, Jr., 1992, KJ-1. Hosston Formation and Cotton Valley Group sandstones—<br />
Sabine Uplift, in Bebout, D.G., W.A. White, C.M. Garrett, Jr., and T.F. Hentz, eds., Atlas of major<br />
central and eastern Gulf Coast gas reservoirs: University of Texas, Bureau of Economic Geology, p. 63-<br />
64.<br />
White, W.A., C.M. Garrett, Jr., and M. Woodward, 1992, JS-1. Cotton Valley shallow-marine sandstone—<br />
ARKLA region, in Bebout, D.G., W.A. White, C.M. Garrett, Jr., and T.F. Hentz, eds., Atlas of major<br />
central and eastern Gulf Coast gas reservoirs: University of Texas, Bureau of Economic Geology, p. 72-<br />
74.<br />
Wilson, D.A. and W.M. Hensel, 1984, The Cotton Valley Sandstone of East Texas: A log-core study, in<br />
Presley, M.W., ed., The Jurassic of east Texas: East Texas Geological Society, Tyler, Texas, p. 141-152.<br />
Worrall, D.M., and S. Snelson, 1989, Evolution of the northern Gulf of Mexico, with emphasis on Cenozoic<br />
growth faulting and the role of salt, in Bally, A.W., and A.R. Palmer, eds., The Geology of North<br />
America; an overview: Geol. Soc. America, The Geology of North America Series, v. A, p. 97-138.
HEADINGS & ABBREVIATIONS FOR TABLE 2: COTTON VALLEY FIELDS<br />
Field Name of field producing from Cotton Valley (CV) sandstone<br />
FERC “Tight” Did FERC designate the field “Tight-gas sand” for Cotton Valley?<br />
Trap Trapping mechanism for field.<br />
Struct = structural trap<br />
Strat = stratigraphic trap<br />
Comb = combination structural & stratigraphic trap<br />
A = anticline<br />
FA = faulted anticline<br />
FC = facies change (sandstone pinchout)<br />
N = structural nose<br />
Disc Date Discovery date of field<br />
CV Disc Date: ss Date of CV sandstone discovery and specific CV ss that was productive<br />
Depth CV perfs Depth in feet of CV perforations in discovery well for specific ss<br />
IP (CV) IP for specific CV ss<br />
GOR Gas:oil ratio<br />
Por Porosity (decimal)<br />
Perm Permeability (mD)<br />
BHT Bottom hole temp (º F)<br />
BHP Bottom hole pressure (psi)<br />
FPG Fluid-pressure gradient (psi/ft)<br />
Sw Water saturation (decimal)<br />
GWC Information about gas-water contact<br />
Drive Drive mechanism<br />
SG = solution gas<br />
PD = pressure depletion<br />
GC = Gas-cap expansion<br />
WD = water drive<br />
SGS Ref <strong>Report</strong> Shreveport Geological Society Reference <strong>Report</strong> (vol: page)
Table 1. Comparison of two productive trends of Cotton Valley sandstones in east Texas and north Louisiana. Data from Shreveport Geological Society (1946,<br />
1947, 1951, 1953, 1958, 1963, 1980, 1987), Collins (1980), Nangle et al. (1982), Finley (1984, 1986), Bebout et al. (1992), and Dutton et al. (1993).<br />
PARAMETER BLANKET SANDSTONE MASSIVE SANDSTONE<br />
Porosity 0.10 to 0.19 (Ave = 0.15) 0.06 to 0.10<br />
Permeability (mD) 1.0 to 280 (Ave = 110) 0.042 (E. TX) 0.015 (N. LA)<br />
Open-hole DST Wells flow gas and/or liquids Wells generally do not flow gas or liquids<br />
Stimulation treatment No treatment necessary for commercial production Massive-hydraulic fracturing required to achieve commercial<br />
production<br />
Initial flow rates (MCFD) 500 to 25,000 (Ave 5,000) Pre-stimulation: TSTM1 to 300<br />
Post-stimulation: 500 to 2,500<br />
Sw in productive zones < 0.40 Can be as high as 0.60<br />
Gas/water contacts Short, well-defined transition zones and gas-water contacts Long transition zones with poorly defined gas-water contacts<br />
Formation damage Possible Commonly severe<br />
1 TSTM = Too small to measure
Field FERC Trap Disc CV Disc Date: ss Depth CV perfs IP (CV) GOR Por Perm (mD) BHT BHP FPG Sw GWC Drive SGS Ref Rpt (vol:pge)<br />
"Tight" Date (feet) MCFD BOPD BCPD BWPD Ave Min Max (F) (psi) (psi/ft)<br />
Ada-Sibley Comb (FA, FC) 1936 1954: CV 9,900 I: 93; I: 189<br />
Athens Struct (FA) 1941 1948: Vaughn 8,500-8,544 10,500 254 41,338:1 II: 385; III-2: 41; IV: 197<br />
1949: "B" 8,464-8,494 12,000 156 76,923:1<br />
1950:Bodcaw 8,148-8,186 694 2 347,000:1<br />
1951: "D" 8,145-8,170 3,370 208 16,201:1<br />
Bayou Middlefork Struct (A) 1953: Bodcaw 7,764 191 210 00,909:1<br />
Bear Creek-Bryceland Struct (A) 1937 1966 CV 10,700 I:97; V: 114<br />
Beekman No Comb (N, FC) 1942 1942: Cv 3,700-3,711 1,500 35 28 42,800:1 II: 391<br />
Benton Struct (A) 1944 1944: "D" 8,001-8,040 3,280 164 20,000:1 0.18 136 190 3,765 0.47 0.17 GWC -7,818 II: 395; VII: 44<br />
1945: Bodcaw 8,137-8,148 1,306 127 10,286:1 0.14 85 190 3,725 0.44 OWC -7,876<br />
Blackburn Comb (N, FC) 1953 1953: Bodcaw 8,717 1,301 54 24,092:1<br />
E. Blackburn 1959<br />
Cadeville 1955 9,700<br />
Calhoun No Struct (FA) 1948 1948: "D" 9,500 814 22 37,000:1 0.17 4,000 0.47 SG,PD No SGS report<br />
Comb (FA, FC) 1957: Cadeville 9,121-9,124 4,779 1,148 4,162:1 0.15 2,132 8,201 0.86 0.05 SG,PD Pate & Goodwin, 1961<br />
Carlton Struct (A) 1953 1953: Bodcaw<br />
N. Carlton No Comb (A,FC) 1964: Purdy 8,950 No SGS report<br />
1965: CV ? 9,470<br />
Cartwright 1960<br />
Caspiana Comb (N, FC) 1975: Cotton Valley 8,500<br />
Cheniere No Comb (N, FC) 1962 1962: Cadeville 9,682-9,697 4,401 528 8,335:1 8,188 0.84 v: 120<br />
1963: CV "A" 9,603-9,609 1,230 8 153,750:1<br />
Choudrant Struct (A) 1946 1946: "D" 9,097--9129 4,732 211 21,000:1 0.19 250 Separate GWCs in 2 "D" ss II: 409; III-2: 55<br />
Clay Struct (A) 1952: CV 9,700 No SGS report<br />
Cotton Valley No Struct (A) 1922 1937: Bodcaw 8,170 TD (OH) 5,323 455 11,700:1 0.16 121 775 231 4,000 0.49 0.15 GWC @ -8,420 WD II:413; VI:63<br />
1937: Davis 8,521-8,551 (OH) 4,800 400 12,000:1 0.15 280 4,368 0.51 0.10 GC<br />
1938: "D" 8,502-8,532 1,020 1,200 00,850:1 0.18 150 3,926 0.43<br />
1949: Justiss 9,050 0.16 34 4,700 0.55 0.22 GC<br />
"C"<br />
Taylor<br />
D'Arbonne 1947 1947: Bodcaw 8,157 4,100 88 46,590:1<br />
Dixie 1929<br />
Downsville 1948<br />
S. Downsville No Struct (A) 1961 1961: Vaughn 8,900 No SGS report<br />
S. Drew Strat (FC) 1972 1972: "D" 9,061-9,069 2,560 85,000:1 0.12 20 200 4,850 0.53 0.40 3 GWCs in "D" ss GC VI: 116<br />
1976: Vaughn 9,525-9,531 873 15 58,200:1 0.10 8 200 4,250 0.45 0.40 GC<br />
Elm Grove Struct (FA) 1973 Cotton Valley 7,768 0.08 1 247 4,154 0.53 0.45<br />
Greenwood-Waskom No 1924<br />
Haynesville Struct (A) 1921 1944: Taylor 8,835-8,920 373 01068:1 3,870 0.43 I: 119; III-1, 18<br />
1945: Camp 7,980-8,004 264 00500:1<br />
E. Haynesville 1945 1949: Tucker 8,588-8,600 2,898 276 10,500:1 II: 435; III-2: 63<br />
Hico-Knowles No<br />
Hico Struct (FA) 1946 1946: Vaughn 8,525-8,556 8,240 121 68,100:1 0.17 3,686 0.42 Multiple GWCs PD I:125; III-2: 75<br />
1946: Bodcaw 8,287-8,345 892 41 21,649:1 0.18 4,061 0.47 PD<br />
1949: Feazel-McFearin 8,914-8,929 2,880 308 9,350:1 0.15 5,616 0.63<br />
Knowles Struct (A) 1945 1945: Vaughn 8,700-8,750 5,212 139 37,500:1 3,500 0.40 III-2: 82<br />
1946: Bodcaw 8,630-8,670 8,516 158 53,900:1<br />
1948: McCrary 8,912-8,924 6,762 761 8,886:1<br />
1953: Feasel-McFearin 8,996-9,008 7,000 275 25,450:1<br />
Homer 1919<br />
Ivan 1952<br />
Lake Bistineau 1916<br />
Leatherman Creek Struct (FA) 1975 1975: Cotton Valley 10,400-10,800 0.12 1 0.30 PD VI: 70<br />
Lisbon No Struct (FA) 1936 1939: Vaughn 8,444-8,464 5,000 61 82,000:1 0.17 150 0.35 PD I: 143<br />
1940: Burgess-Simmons 8,766-8,806 1,993 160 12,458:1 0.14 40 PD<br />
N. Lisbon Comb (N, FC) 1941 1942: Burgess-Simmons 8,502-8,525 510 17 30,000:1 I: 169<br />
1943: Bodcaw 7,790-7,816 19,000 0.17 196<br />
Longwood Strat (FC) 1927 1948: Bodcaw 8,350<br />
Minden 1957<br />
Monroe 1916<br />
W. Monroe 1957<br />
Plain Dealing 1946<br />
Rocky Mount 1959<br />
Ruston No Comb (A,FC) 1943 1948: "D" 8,796-8,806 6,500 56 24,000:1 0.18 100 210 4,100 0.47 0.23 GWC in Vaughn ss PD I: 185; III-2: 87; VI: 108<br />
1949: Bodcaw 8,707-8,730 4,263 195 21,860:1 0.19 150 PD<br />
1949: Vaughn 8,809-8,838 7,995 390 20,501:1 PD<br />
1949: "D" 8,674-8,706 8,250 PD
Field FERC Trap Disc CV Disc Date: ss Depth CV perfs IP (CV) GOR Por Perm (mD) BHT BHP FPG Sw GWC Drive SGS Ref Rpt (vol:pge)<br />
"Tight" Date (feet) MCFD BOPD BCPD BWPD Ave Min Max (F) (psi) (psi/ft)<br />
1949: Bodcaw 8,760-8,810 15,500 PD<br />
1951: Feazel (Davis) 9,468-9,476 1,062 50 21,240:1 0.18 80 PD<br />
S. Sarepta Comb (FA,FC) 1949 1949: Bodcaw 8,710 2,160 173 12,485:1 0.17 265 4300 0.49 0.14 PD<br />
1949: Savis 9,000 0.13 75 4,500 0.50 0.15 PD<br />
1949: Ardis 9,150 0.12 50 4,525 0.49 0.14 GC<br />
Sentell No Comb (N, FC) 1951 1951: Bodcaw 8,320 25,500 455 56,043:1 0.16 50 No SGS report<br />
Shongaloo 1921<br />
Sligo No 1922 I: 193<br />
Sugar Creek Struct (FA) 1930 1957: Bodcaw 8,724-8,730 5,000 210 23,810:1 3,972 0.45 I: 213; VI: 126<br />
1957: Vaughn 8,780-8,795 2,850 48.5 58,763:1 2,955 0.34<br />
1958: "D" 7,917-7,925 21,000 896 23,437:1<br />
1962: "D" 7,686-7,693 3,200 112 28,571:1<br />
1962: McFearin 8,003-8,008 2,800 168 17,500:1<br />
1979: Price 9,462-9,474 520<br />
Terryville No Comb (N, FC) 1954 1954: "D" 9,203-9,227 3,739 277 13,514:1 0.10 125 GWC in "D" ss WD V: 196<br />
1957: "C" 9,169-9,182 1,030 38 29 27,105:1<br />
1959: "C" 9,049-9,053 133 00,934:1<br />
1962: McGrary 9,354-9,362 4,000 300 13,333:1<br />
Tremont Comb (N, FC) 1944 1944: Bodcaw 9,060-9,080 2,235 97 23,000:1 4,200 0.46 I: 219; VI: 133<br />
1971: Davis 9,633-9,706 1,145 144 7,951:1 0.14 34 217 6,519 0.67 0.15 PD<br />
Unionville Strat (FC) 1950 1950: Vaughn 8,550<br />
1950: Davis 8,700<br />
Vernon Strat (FC) 1967: Cadeville 10,900
34° N<br />
32° N<br />
30° N<br />
28° N<br />
OKLAHOMA<br />
TEXAS<br />
96° W 94° W 92° W 90° W 88° W<br />
4922<br />
4924<br />
ARKANSAS<br />
LOUISIANA<br />
4923<br />
Gulf of Mexico<br />
MISSISSIPPI<br />
ALABAMA<br />
0 50<br />
Miles<br />
100<br />
Figure 1. Map of north-central Gulf Coast Basin from Schenk and others (1996) showing outlines of three Cotton Valley plays identified<br />
by U.S. Geological Survey in the 1995 <strong>National</strong> Assessment of United States Oil and Gas Resources. Shown are the Cotton Valley<br />
Blanket Sandstones Gas Play (4923), identified as a continuous-gas play, and the Cotton Valley Salt Basins Gas Play (4922) and<br />
Cotton Valley Sabine Uplift Gas Play (4924), identified as conventional-gas plays.<br />
FL
34° N<br />
32° N<br />
30° N<br />
APPROX UPDIP LIMIT<br />
OF COTTON VALLEY GROUP<br />
(SWAIN, 1944)<br />
96° W 94° W 92° W 90° W<br />
MEXIA-TALCO<br />
GINGER<br />
FAULT<br />
FAULT ZONE<br />
ZONE<br />
EAST<br />
TEXAS<br />
SALT<br />
BASIN<br />
MT ENTERPRISE<br />
APPROX DOWNDIP LIMIT<br />
OF COTTON VALLEY<br />
SANDSTONE<br />
FAULT ZONE<br />
SOUTH<br />
SABINE<br />
ARCH<br />
COMANCHEAN SHELF<br />
TEXAS<br />
ARKANSAS<br />
LOUISIANA<br />
(THOMAS & MANN, 1966)<br />
ARKANSAS<br />
LOUISIANA<br />
NORTH<br />
LOUISIANA<br />
SALT<br />
BASIN<br />
EDGE<br />
FAULT ZONE<br />
0 20 40<br />
MILES<br />
60 80<br />
GULF OF MEXICO<br />
MONROE<br />
UPLIFT<br />
PICKENS<br />
MISSISSIPPI<br />
SALT<br />
BASIN<br />
MISSISSIPPI<br />
LOUISIANA<br />
FAULT ZONE<br />
Figure 2. Index map of north-central Gulf Coast Basin, modified from Dutton and others (1993), showing major tectonic features.<br />
Sabine and Monroe Uplifts were not positive features during deposition of Cotton Valley Group sediments, and major Cotton<br />
Valley sands depocenters were located across the entire northern Gulf Basin from east Texas to Alabama. Salt movement in East<br />
Texas and North Louisiana Salt Basins was contemporaneous with deposition of Cotton Valley Group clastic sediments. Cotton<br />
Valley Group is an entirely subsurface sequence of strata with approximate updip limits shown here.
SYSTEM<br />
TERTIARY<br />
PALEOGENE<br />
UPPER CRETACEOUS<br />
LOWER CRETACEOUS<br />
JURASSIC<br />
TRIASSIC<br />
SERIES<br />
EOCENE<br />
PALEOGENE<br />
GULFIAN<br />
COMANCHEAN<br />
COAHUILAN<br />
UPPER<br />
MIDDLE<br />
LOWER<br />
UPPER<br />
CHRONOSTRATAGRAPHIC SECTION OF NORTH LOUISIANA<br />
STAGE GROUP FORMATION<br />
YPRESIAN<br />
THANETIAN<br />
DANIAN<br />
MAESTRICHTIAN<br />
CAMPANIAN<br />
SANTONIAN<br />
CONIACIAN<br />
TURONIAN<br />
CENOMANIAN<br />
ALBIAN<br />
APTIAN<br />
BARREMIAN<br />
HAUTERIVIAN<br />
VALANGINIAN<br />
BERRIASIAN<br />
TITHONIAN<br />
KIMMERIDGIAN<br />
OXFORDIAN<br />
CALLOVIAN<br />
BATHONIAN<br />
BAJOCIAN<br />
AALENIAN<br />
TOARCIAN<br />
PLIENSBACHIAN<br />
SINEMURIAN<br />
HETTANGIAN<br />
RHAETIAN<br />
WILCOX WILCOX<br />
MIDWAY MIDWAY<br />
NAVARRO<br />
TAYLOR<br />
AUSTIN<br />
EAGLE FORD<br />
WOODBINE<br />
WASHITA<br />
FREDRICKSBURG<br />
TRINITY<br />
COTTON VALLEY<br />
GLEN<br />
ROSE<br />
HIATUS<br />
HIATUS<br />
HIATUS<br />
ARKADELPHIA<br />
NACATOCH<br />
SARATOGA<br />
ANNONA<br />
OZAN<br />
TOKIO<br />
AUSTIN<br />
EAGLE FORD<br />
BOSSIER<br />
AGE<br />
(MA)<br />
TUSCALOOSA<br />
100<br />
PALUXY<br />
WASHITA-FREDERICKSBURG<br />
MOORINGSPORT<br />
FERRY LAKE ANHYDRITE<br />
RODESSA<br />
JAMES<br />
PINE ISLAND<br />
PETTET (SLIGO) MBR<br />
SLIGO<br />
HOSSTON<br />
(TRAVIS PEAK)<br />
SCHULER<br />
HAYNESVILLE-BUCKNER<br />
SMACKOVER<br />
NORPHLET<br />
LOUANN<br />
WERNER<br />
EAGLE MILLS<br />
Figure 3. Chronostratigraphic section of north Louisiana from Shreveport Geological Society (1987)<br />
showing Cotton Valley Group comprised of Bossier and Schuler Formations. Schuler Formation<br />
was assigned to Lower Cretaceous in mid 1980s. Prior to that time, entire Cotton Valley Group<br />
was considered to be Upper Jurassic in age.<br />
60<br />
70<br />
80<br />
90<br />
110<br />
120<br />
130<br />
140<br />
150<br />
160<br />
170<br />
180<br />
190<br />
200<br />
210<br />
MILLIONS OF YEARS
DALLAS<br />
ELLIS<br />
COLLIN<br />
ROCK-<br />
WALL<br />
OKLAHOMA<br />
KAUFMAN<br />
NAVARRO<br />
LIMESTONE<br />
FANNIN<br />
HUNT<br />
FREESTONE<br />
DELTA<br />
RAINS<br />
VAN ZANDT<br />
HENDERSON<br />
LAMAR<br />
HOPKINS<br />
ANDERSON<br />
WOOD<br />
FALLS LEON<br />
ANGELINA<br />
MILAM<br />
-5000<br />
-10,000<br />
ROBERTSON<br />
-11,000<br />
BRAZOS<br />
-4000<br />
-12,000<br />
-5000<br />
-6000<br />
-7000<br />
-9000<br />
MADISON<br />
-13,000<br />
-10,000<br />
-8000<br />
-8000<br />
HOUSTON<br />
FRANKLIN<br />
SMITH<br />
CHEROKEE<br />
TRINITY<br />
RED RIVER<br />
TITUS<br />
CAMP<br />
UPSHUR<br />
MORRIS<br />
GREGG<br />
-9000<br />
RUSK<br />
NACODOCHES<br />
-11,000<br />
-12,000<br />
-13,000<br />
BOWIE<br />
CASS<br />
MARION<br />
HARRISON<br />
PANOLA<br />
-8000<br />
SHELBY<br />
-10,000<br />
SAN<br />
AGUSTINE<br />
0 10 20 30 40 50<br />
Miles<br />
Contour Interval: 1000 feet<br />
-6000<br />
BOSSIER<br />
CADDO<br />
DE SOTO<br />
SABINE<br />
SABINE<br />
WEBSTER<br />
RED RIVER<br />
ARKANSAS<br />
BIENVILLE<br />
NATCHITOCHES<br />
VERNON<br />
CLAIBORNE<br />
TEXAS LA<br />
LINCOLN<br />
JACKSON<br />
WINN<br />
GRANT<br />
UNION<br />
RAPIDES<br />
OUACHITA<br />
CALDWELL<br />
LA SALLE<br />
MOREHOUSE<br />
RICHLAND<br />
FRANKLIN<br />
CATAHOULA<br />
CONCORDIA<br />
MADISON<br />
TENSAS<br />
MISSISSIPPI<br />
Figure 4. Generalized structure contours on top of Cotton Valley Sandstone across northeast Texas and north Louisiana, modified from<br />
Finley (1984). Cotton Valley Sandstone has been designated as “tight-gas sandstone” in all counties shown on this map with<br />
exception of 15 gas fields in north Louisiana (see Figure 8).<br />
-7000<br />
-11,000<br />
-14,000<br />
-15,000<br />
-11,000<br />
-12,000<br />
-13,000<br />
-10,000<br />
-9000<br />
-7000<br />
-8000<br />
-5000<br />
-6000<br />
-4000
CRETACEOUS<br />
JURASSIC<br />
COTTON VALLEY GROUP<br />
(SOUTH) (NORTH)<br />
WINN LS<br />
DOWNDIP<br />
CALVIN<br />
MASSIVE<br />
SAND COMPLEX<br />
UNNAMED SANDS & SHALES<br />
KNOWLES LIMESTONE<br />
BLANKET<br />
SANDSTONES<br />
TERRYVILLE<br />
MASSIVE<br />
SAND COMPLEX<br />
BOSSIER SHALE<br />
HICO<br />
SHALE<br />
UPDIP<br />
HOSSTON FORMATION<br />
SCHULER FM<br />
HAYNESVILLE-BUCKNER<br />
SMACKOVER<br />
Figure 5. Generalized stratigraphic nomenclature of Cotton Valley Group in northern Louisiana,<br />
modified from Coleman and Coleman (1981).
A<br />
SOUTH<br />
1<br />
WINN LIMESTONE<br />
2 3 4 5 6 7 8 9<br />
CALVIN<br />
SANDSTONE<br />
KNOWLES LIMESTONE<br />
TERRYVILLE<br />
Figure 6a. North-south stratigraphic cross section of Cotton Valley Group across northern Louisiana<br />
based on data from 15 wells. Section is modified from Coleman and Coleman (1981) to show<br />
details of Cotton Valley blanket sandstones as identified and described by Eversull (1985) and<br />
Thomas and Mann (1963). Line of cross section shown in Figures 7 and 8.
10<br />
IV<br />
11<br />
MASSIVE<br />
BOSSIER SHALE<br />
12<br />
Cadeville<br />
B C<br />
D<br />
III<br />
(Barrier Islands<br />
offshore bars)<br />
HOSSTON<br />
13<br />
Bodcaw<br />
Vaughn Price<br />
McGreary<br />
Bolinger<br />
II<br />
SANDSTONES<br />
I<br />
Davis<br />
E<br />
Justiss<br />
Ardis<br />
(Lagoon/bay)<br />
Roseberry?<br />
14<br />
HICO SHALE<br />
SCHULER FORMATION<br />
(Alluvial, coastal plain,<br />
fluvial deltaic<br />
10 5 0<br />
Miles<br />
A'<br />
NORTH<br />
15<br />
Feet<br />
1000<br />
Figure 6b. North-south stratigraphic cross section of Cotton Valley Group across northern Louisiana based<br />
on data from 15 wells. Section is modified from Coleman and Coleman (1981) to show details of<br />
Cotton Valley blanket sandstones as identified and described by Eversull (1985) and Thomas and<br />
Mann (1963). Line of cross section shown in Figures 7 and 8.<br />
Sexton<br />
Taylor<br />
Tucker<br />
500<br />
0
OKLAHOMA<br />
TEXAS<br />
LONE OAK DELTA<br />
COTTON VALLEY<br />
DEPOCENTER<br />
MAXIMUM<br />
0 25 50<br />
Miles<br />
75 100<br />
UPPER COTTON VALLEY PALEOGEOGRAPHY<br />
TEXAS<br />
SOUTHERN EXTENT<br />
HICO LAGOON<br />
BARRIER ISLAND<br />
OF<br />
LOUISIANA<br />
8<br />
9<br />
TERRYVILLE<br />
A' 15<br />
7<br />
4<br />
3<br />
2<br />
1<br />
14<br />
13<br />
12<br />
11<br />
10<br />
A<br />
OK<br />
NM<br />
DETAIL<br />
AREA<br />
TX<br />
5 6<br />
AR<br />
LA<br />
AL<br />
Gulf of Mexico<br />
LOCATION MAP<br />
ARKANSAS<br />
LOUISIANA<br />
MASSIVE SANDSTONES<br />
MS<br />
TN<br />
MISSISSIPPI<br />
LOUISIANA<br />
ANCESTRAL MISSISSIPPI<br />
RIVER COTTON VALLEY<br />
DEPOCENTER<br />
BAY/LAGOON<br />
BARRIER ISLAND<br />
Figure 7. Regional paleogeographic map showing sedimentary environments of Cotton Valley Group during deposition of uppermost<br />
Cotton Valley sandstones (Terryville IV sandstone of Coleman and Coleman, 1981). Map synthesized from data of Thomas and<br />
Mann (1966), Coleman and Coleman (1981), Moore (1983), McGowen and Harris (1984), Wescott (1985), and Eversull (1985).
OK<br />
Detail<br />
Area<br />
AR<br />
TX LA<br />
EAST<br />
TEXAS<br />
SALT<br />
BASIN<br />
MS<br />
Gulf of Mexico<br />
LOCATION MAP<br />
AL<br />
Oak Hill<br />
Dirgin<br />
Woodlawn<br />
Blocker<br />
Carthage<br />
TEXAS<br />
Longwood<br />
Greenwood-<br />
Waskom<br />
Bethany-<br />
Plain<br />
Dealing<br />
S Sarepeta<br />
Rocky<br />
Mount<br />
Ivan<br />
Dixie<br />
Longstreet<br />
Benton<br />
Sentell<br />
Sligo<br />
Caspiana<br />
SABINE UPLIFT<br />
Shongaloo<br />
Cotton<br />
Valley<br />
Elm Grove<br />
E Haynesville<br />
Haynesville<br />
Minden<br />
Leatherman<br />
Creek<br />
Sibley<br />
Lake<br />
Bistineau<br />
NORTH<br />
A' 15<br />
Blackburn<br />
W Lisbon<br />
14 NE Lisbon<br />
Hico Knowes<br />
Homer<br />
13<br />
Lisbon<br />
Athens<br />
12<br />
Sugar<br />
Creek<br />
Rustin<br />
Ada<br />
Terryville<br />
10<br />
11<br />
Calhoun<br />
Bryceland<br />
9<br />
Clay Tremont<br />
8 Bear<br />
Creek<br />
Vernon<br />
7<br />
A<br />
3<br />
1<br />
2<br />
4<br />
Cotton Valley sandstone field<br />
(designated tight gas by FERC, 1980)<br />
Cotton Valley sandstone field<br />
(excluded from 1980 FERC tight-gas designation)<br />
Cotton Valley tight, massive sandstone trend<br />
(low porosity & permeability, frac required)<br />
Cotton Valley blanket-sandstone trend<br />
(good porosity & permeability, no frac required)<br />
East Texas & Louisiana Salt Basins<br />
5<br />
ARKANSAS<br />
LOUISIANA<br />
Unionville<br />
D'Arbonne<br />
Choudrant<br />
Downsville<br />
6<br />
S Downsville<br />
N Carlton<br />
Carlton<br />
S Drew<br />
Cheniere<br />
Cadeville<br />
LOUSIANA<br />
SALT BASIN<br />
Beekman<br />
0 25<br />
Miles<br />
50<br />
Figure 8. Map of northeast Texas and northwest Louisiana showing major fields that have produced hydrocarbons from Cotton Valley<br />
sandstones. Two different productive trends are recognized based on reservoir properties and resulting producing capabilities of<br />
Cotton Valley sandstone reservoirs. Fifteen fields excluded from “tight-gas” designation by FERC in 1980 are shown in solid color.<br />
Map modified from Collins (1980) and White and others (1992b).
OK<br />
Dallas<br />
TX<br />
AR<br />
DETAIL<br />
AREA<br />
CALHOUN<br />
0.86<br />
0.47<br />
LA<br />
MS<br />
AL<br />
Gulf of Mexico<br />
LOCATION MAP<br />
OAK HILL<br />
0.32<br />
CARTHAGE<br />
0.55<br />
TEXAS<br />
LOUISIANA<br />
0.51<br />
LEGEND<br />
Cotton Valley sandstone field<br />
BENTON<br />
0.47<br />
0.44<br />
BETHANY EAST<br />
Fluid-pressure gradient (psi/ft) for<br />
different Cotton Valley sandstones<br />
FLUID-PRESSURE GRADIENTS (PSI/FT)<br />
COTTON VALLEY SANDSTONES<br />
HAYNESVILLE<br />
S SAREPETA 0.43<br />
0.50<br />
0.49<br />
0.49<br />
COTTON VALLEY<br />
0.55<br />
0.51<br />
0.49<br />
0.43<br />
ELM GROVE<br />
0.53<br />
SUGAR CREEK<br />
0.45<br />
0.34<br />
HICO KNOWLES<br />
0.63<br />
0.47<br />
ARKANSAS<br />
LOUISIANA<br />
0.42 RUSTON<br />
0.47<br />
CALHOUN<br />
0.86<br />
0.47<br />
CHENIERE<br />
0.84<br />
TREMONT<br />
0.67<br />
0.46<br />
S DREW<br />
0.53<br />
0.45<br />
0 25<br />
Miles<br />
50<br />
Figure 9. Map of northeast Texas and northwest Louisiana showing fluid-pressure gradients calculated from shut-in pressures in Cotton<br />
Valley sandstone reservoirs. Multiple pressure-gradient values for a particular gas field refer to gradients calculated for different,<br />
stacked blanket-sandstone reservoirs penetrated in that field. Shut-in-pressure data for Louisiana fields shown in Table 2.<br />
LOUISIANA<br />
MISSISSIPPI
OK AR<br />
Dallas<br />
TX<br />
DETAIL<br />
AREA<br />
LA<br />
MS<br />
Gulf of Mexico<br />
LOCATION MAP<br />
AL<br />
TEXAS<br />
LOUISIANA<br />
DISTRIBUTION OF RESERVOIR PRESSURES<br />
COTTON VALLEY SANDSTONES<br />
NORMALLY<br />
ARKANSAS<br />
LOUISIANA<br />
PRESSURIZED<br />
OVER PRESSURIZED<br />
0 25<br />
Miles<br />
50<br />
Figure 10. Map of northeast Texas and northwest Louisiana modified from Coleman and Coleman (1981) showing geographic<br />
distribution of abnormally high pressures in Cotton Valley sandstone reservoirs. Dashed line shows modification of Coleman and<br />
Coleman’s (1981) pressure boundary to include the 0.63 psi/ft fluid-pressure gradient in Hico-Knowles Field and 0.67 psi/ft gradient<br />
in Tremont Field as shown in Figure 9 and documented in table 2. Comparison of this map with map in figure 8 shows boundary<br />
between overpressure and normal pressure cuts across two productive trends of Cotton Valley sandstones.<br />
LOUISIANA<br />
MISSISSIPPI
OK AR<br />
Dallas<br />
TX<br />
Porosity<br />
DETAIL<br />
AREA<br />
LA<br />
MS<br />
Gulf of Mexico<br />
LOCATION MAP<br />
TREMONT<br />
0.14 34<br />
AL<br />
LEGEND<br />
TEXAS<br />
LOUISIANA<br />
Cotton Valley<br />
Sandstone field<br />
Permeability<br />
S SAREPETA<br />
0.17<br />
0.13<br />
0.12<br />
265<br />
75<br />
50<br />
POROSITY AND PERMEABILITY<br />
COTTON VALLEY BLANKET SANDSTONES<br />
ARKANSAS<br />
LOUISIANA<br />
LISBON<br />
0.17 150<br />
0.14 40<br />
NE LISBON<br />
0.17 196 HICO KNOWLES<br />
0.18<br />
0.17<br />
0.15<br />
BENTON<br />
COTTON VALLEY<br />
0.18 135 0.15 280<br />
0.14 85 0.18 150<br />
LEATHERMAN<br />
0.16 121 CREEK RUSTON<br />
0.16 34 0.12 1 0.19150<br />
TERRYVILLE 0.18100<br />
0.10 125 0.18 80<br />
CHOUDRANT<br />
0.19 250<br />
TREMONT<br />
0.14 34<br />
S DREW<br />
CALHOUN<br />
0.12 20<br />
0.17<br />
0.10 8<br />
0.15<br />
0 25<br />
Miles<br />
50<br />
Figure 11. Map of northeast Texas and northwest Louisiana showing measured values of porosity and permeability in Cotton Valley<br />
blanket sandstones. Porosity and permeability data documented in table 2. Multiple values of porosity and permeability for a given<br />
field represent measured values for separate, stacked blanket sandstone reservoirs in that field.<br />
LOUISIANA<br />
MISSISSIPPI
OK AR<br />
Dallas<br />
TX<br />
BENTON<br />
3,280<br />
1,306<br />
DETAIL<br />
AREA<br />
LA<br />
MS<br />
Gulf of Mexico<br />
LOCATION MAP<br />
AL<br />
TEXAS<br />
LOUISIANA<br />
LEGEND<br />
Cotton Valley Sandstone field<br />
S SAREPETA<br />
2,160<br />
BENTON<br />
3,280<br />
1,306<br />
SENTELL<br />
25,500<br />
Initial rates of gas production (MCFD) from different<br />
Cotton Valley sandstones without fracture stimulation<br />
INITIAL RATES OF GAS PRODUCTION<br />
COTTON VALLEY BLANKET SANDSTONES<br />
COTTON<br />
VALLEY<br />
5,323<br />
4,900<br />
1,020<br />
HICO KNOWLES<br />
NE LISBON 8,516<br />
19,000 7,000<br />
E HAYNESVILLE<br />
2,898 510 6,762<br />
5,212<br />
2,880<br />
BLACKBURN<br />
1,301<br />
LISBON<br />
5,000<br />
1,993<br />
ATHENS<br />
12,000<br />
10,500<br />
3,370<br />
694<br />
ARKANSAS<br />
LOUISIANA<br />
RUSTON<br />
15,500<br />
8,250<br />
7,995<br />
6,500<br />
CHOUDRANT<br />
4,732<br />
4,263<br />
1,062<br />
SUGAR<br />
S DREW<br />
CREEK<br />
TERRYVILLE<br />
2,650<br />
21,000<br />
CHENIERE<br />
4,000<br />
873<br />
CALHOUN<br />
5,000<br />
4,401<br />
3,739 4,779<br />
3,200<br />
1,230<br />
1,030 814<br />
2,850<br />
TREMONT<br />
2,800<br />
2,235<br />
520<br />
1,145<br />
0 25<br />
Miles<br />
50<br />
Figure 12. Map of northeast Texas and northwest Louisiana showing initial rates of gas production from Cotton Valley blanket<br />
sandstones. Multiple values of initial flow rates for a given field represent rates from different stacked blanket sandstone reservoirs<br />
which produce in that field. All rates are from blanket sandstones, which do not require fracture-stimulation treatment for<br />
commercial production.<br />
LOUISIANA<br />
MISSISSIPPI
OK AR<br />
Dallas<br />
TX<br />
DETAIL<br />
AREA<br />
LA<br />
MS<br />
Gulf of Mexico<br />
LOCATION MAP<br />
AL<br />
TEXAS<br />
LOUISIANA<br />
BENTON<br />
KNOWN FIELDS WITH GAS-WATER CONTACTS<br />
IN COTTON VALLEY SANDSTONES<br />
COTTON<br />
VALLEY<br />
ARKANSAS<br />
LOUISIANA<br />
HICO<br />
KNOWLES<br />
TERRYVILLE RUSTON<br />
CHOUDRANT<br />
S DREW<br />
0 25<br />
Miles<br />
50<br />
Figure 13. Map of northeast Texas and northwest Louisiana showing fields productive from Cotton Valley sandstones in which gaswater<br />
contacts have been identified and reported in public literature. Presence of gas-water contacts in these fields suggests they are<br />
conventional-gas accumulations. Details on gas-water contacts including sources of information are shown inTable 2.<br />
LOUISIANA<br />
MISSISSIPPI
325<br />
500<br />
785<br />
150<br />
860<br />
900<br />
800<br />
700<br />
1000<br />
605<br />
1450<br />
1 unit gas<br />
1454<br />
1410<br />
2000<br />
1850<br />
1170<br />
2061<br />
1350<br />
1020<br />
2014<br />
2108<br />
3230<br />
264<br />
666<br />
R 13 W R 12 W<br />
980<br />
1081<br />
583<br />
3100 730<br />
400<br />
905<br />
938<br />
1736<br />
1250 548<br />
2500 1250<br />
1512 1908<br />
4850 2883 1750 1832<br />
1<br />
1304<br />
1464<br />
561<br />
1200<br />
1439<br />
1250<br />
1800<br />
1000<br />
900<br />
1300<br />
2618<br />
2723<br />
2232<br />
2110<br />
1150<br />
980<br />
2041<br />
1591<br />
1776<br />
1800<br />
2100<br />
1687 1725<br />
2667<br />
2376<br />
2500<br />
2900<br />
2022<br />
1000<br />
1000<br />
2000<br />
2000<br />
3000<br />
4000<br />
3000<br />
1000<br />
2000<br />
2000<br />
1000<br />
950<br />
2100<br />
250<br />
762<br />
1500<br />
3050<br />
200<br />
956<br />
1035<br />
1400<br />
2256<br />
2450<br />
1592<br />
1587<br />
185<br />
200<br />
1500<br />
1700<br />
1117<br />
1200<br />
2006<br />
TD Cotton Valley<br />
No Cotton Valley tests<br />
482<br />
2006<br />
925<br />
927<br />
T 15 N<br />
T 14 N<br />
EXPLANATION<br />
Hosston producer<br />
(TD in Cotton Valley)<br />
LOUISIANA<br />
Map<br />
Area<br />
LOCATION MAP<br />
Figure 14. Map of Caspiana Field in northwest Louisiana in the tight, massive Cotton Valley sandstone trend showing initial rate of gas<br />
production (MCFD) from Cotton Valley sandstone reservoirs. Data from database of IHS <strong>Energy</strong> Group (petroROM Version 3.43).<br />
Contour interval is 1,000 MCFD. Map shows general decrease in initial rates of gas production from center to flank of fields.<br />
2000<br />
1000<br />
2000<br />
2000<br />
3000<br />
1000<br />
1000<br />
1000<br />
2000
1477<br />
1000<br />
600<br />
432<br />
500<br />
549<br />
800<br />
178,000<br />
600<br />
500<br />
378<br />
400<br />
300<br />
700<br />
344<br />
200<br />
241<br />
600<br />
500<br />
300<br />
400<br />
600<br />
500<br />
363 240 244<br />
694<br />
238<br />
800 400<br />
500<br />
377<br />
334<br />
368<br />
36 units wtr<br />
1 unit gas<br />
549<br />
398<br />
443<br />
627<br />
400<br />
300<br />
200<br />
270 144<br />
100<br />
33<br />
207<br />
18 71<br />
303<br />
424<br />
270<br />
470<br />
?<br />
267<br />
385<br />
95<br />
?<br />
38<br />
73<br />
?<br />
172<br />
114<br />
334<br />
?<br />
187<br />
199<br />
255<br />
?<br />
300<br />
R 13 W R 12 W<br />
200<br />
?<br />
200<br />
?<br />
500<br />
609<br />
73<br />
200<br />
214<br />
223<br />
114<br />
200<br />
177<br />
600 400<br />
290<br />
229<br />
293<br />
74<br />
138<br />
162 217<br />
?<br />
400<br />
300<br />
285<br />
278<br />
205<br />
75<br />
236<br />
286<br />
?<br />
160<br />
200<br />
300<br />
500<br />
100<br />
200<br />
?<br />
600<br />
695<br />
?<br />
500<br />
105<br />
571<br />
188<br />
155<br />
72<br />
?<br />
100<br />
200<br />
300<br />
400<br />
?<br />
367 205<br />
483<br />
100<br />
?<br />
350<br />
260<br />
300<br />
300<br />
400<br />
400<br />
300<br />
200<br />
100<br />
83<br />
25<br />
201<br />
200<br />
100<br />
?<br />
?<br />
?<br />
T 15 N<br />
T 14 N<br />
EXPLANATION<br />
? No data for water<br />
production<br />
Hosston producer<br />
(TD in Cotton Valley)<br />
Map<br />
Area<br />
LOUISANA<br />
LOCATION MAP<br />
Figure 15. Diagram, modified from Arps (1964), showing effect of porosity and permeability in a hydrocarbon reservoir on thickness of<br />
hydrocarbon-water transition zone and on minimum closure required for water-free hydrocarbon production.
MINIMUM<br />
CLOSURE<br />
MEDIUM PERMEABILITY & POROSITY<br />
WATER-FREE<br />
GAS PRODUCTION<br />
PRODUCTION OF GAS<br />
AND WATER<br />
WATER PRODUCTION<br />
REQUIRED MINIMUM CLOSURE REQUIRED FOR<br />
FREE WATER SURFACE<br />
SPILL<br />
POINT<br />
EFFECT OF PERMEABILITY ON<br />
THICKNESS OF<br />
GAS-WATER TRANSITION ZONE<br />
HIGH MEDIUM LOW<br />
WETTING PHASE (WATER)<br />
CAPILLARY PRESSURE (Pc)<br />
OR HEIGHT (FEET)<br />
CAPILLARY<br />
PRESSURE CURVES<br />
CRITICAL<br />
WATER<br />
SATURATION<br />
MEDIUM<br />
HIGH<br />
LOW<br />
0 45 100<br />
INTERSITIAL<br />
WATER SATURATION (S w )<br />
MINIMUM<br />
CLOSURE<br />
REQUIRED
IS THERE A BASIN-CENTER GAS ACCUMULATION<br />
IN THE ORDOVICIAN-AGE GLENWOOD FORMATION AND ST. PETER<br />
SANDSTONE, CENTRAL MICHIGAN BASIN ?<br />
ABSTRACT<br />
By Michael S. Wilson, Consulting Geologist<br />
Well data, structure maps, previous studies of abnormal pressures and thermal maturity, and published<br />
descriptions of gas fields were evaluated to determine if a basin-center gas accumulation might exist within<br />
the Ordovician-age Glenwood Formation and St. Peter Sandstone in the Michigan basin. The Glenwood-St.<br />
Peter section has several characteristics of typical basin-center gas accumulations, including thermally<br />
mature source rocks, low porosity sandstone reservoirs, extensive overpressure and extensive gas dry gas and<br />
condensate production.<br />
Well histories and data from more than 100 drill-stem tests reveal that many wells recovered significant<br />
volumes of salt water or gassy salt water with high chloride content (230,000 – 270,000 ppm Cl - ) from the<br />
Glenwood-St. Peter interval. Pressure gradients range from 0.4 to 0.56 psi/ft, indicating normal pressures to<br />
moderate overpressures. Core descriptions indicate fair porosity (4 to 13%, average 9%) within the St. Peter<br />
Sandstone. Permeabilities vary widely, ranging from
GEOLOGIC SETTING<br />
The Michigan basin (fig. 1) is a circular-shaped cratonic depocenter (fig. 2) containing sedimentary<br />
rocks of Pre-Cambrian through Jurassic age and a thin covering of Quaternary glacial deposits (Wollensak,<br />
1991; Catacosinos and Daniels, 1991). The basin contains numerous subtle anticlinal structures, but lacks<br />
major transverse fault zones or tectonic partitions. Thermally mature source rocks with measured vitrinite<br />
reflectance greater than 1 %Ro are present in the central part of the basin (Cercone and Pollack, 1991;<br />
Moyer, 1982; Fisher and Barratt, 1985; Wang et al., 1994). Oil, condensate and natural gas have been<br />
discovered in many different stratigraphic intervals (Wollensak, 1991).<br />
STRATIGRAPHY: GLENWOOD FORMATION AND ST. PETER SANDSTONE<br />
The Middle Ordovician-age Glenwood Formation and St. Peter Sandstone (fig. 3) are economically<br />
important reservoirs for natural gas and condensate. The term “St. Peter Sandstone” is used here to include<br />
the thick sandstone section below the Glenwood Formation and above the Brazos Shale and Foster<br />
Formation, which are members of the Prairie Du Chien Group. It includes previous oil field names such as<br />
the Massive Sandstone, Jordan Sandstone, Bruggers Formation, and Prairie Du Chien Formation. Previous<br />
disagreements about the pre-Glenwood stratigraphic nomenclature have been discussed at length by Barnes<br />
and others (1992) and Nadon and others (2000).<br />
The St. Peter Sandstone ranges from less than 100 ft thick along the basin margins (fig. 1) to more<br />
than 1,200 ft in the basin center (Fisher and Barratt, 1985). It contains supratidal sand flat, eolian dune,<br />
shallow marine barrier bar and marine shoreface deposits with intense bioturbation, fair porosity and good<br />
permeability (Barnes and others, 1992). Dolomite layers commonly found within the thick sandstone beds<br />
provide good markers for detailed sequence stratigraphic analyses (Nadon and others, 2000).<br />
OVERPRESSURED COMPARTMENT<br />
A regionally extensive overpressured mega-compartment has been identified within the St. Peter<br />
Sandstone and Glenwood Formation (Bahr and others, 1994; Dott and Nadon, 1992). Formation test results<br />
and pressure data were collected by these authors from the Michigan Department of Natural Resources and<br />
IHS-Petroleum Information, Inc. Hydrostatic heads were calculated from drill-stem test and reservoir<br />
pressures, and data points showing overpressured heads which exceed surface elevations were plotted on<br />
contour maps. Selected shut-in reservoir pressure points were plotted on pressure versus depth charts. Pore<br />
pressures exceed the normal pressure gradient for salt water brine (0.5 psi/ft or 1.16 g/cc) below depths of<br />
7,500 ft in the east-central part of the basin and along the shore of Lake Huron (fig. 4).<br />
CAUSE OF OVERPRESSURE<br />
The cause of the moderate overpressures in the St. Peter-Glenwood section has been attributed to glacial<br />
loading during the last ice age (Bahr and others, 1994; Dott and Nadon, 1992). However the occurrence of<br />
natural gas fields and thermally mature source rocks in this area (Cercone and Pollack, 1991; Moyer, 1982)<br />
raises the possibility that overpressure within the Glenwood-St. Peter section may have been caused by<br />
hydrocarbons expelled from nearby source rocks. Thin layers of organic-rich black shale and thin,<br />
carbonaceous algal lamination have been noted in cores collected from the Lower Ordovician Brazos (fig. 3)<br />
and Foster Formations (Fisher and Barratt, 1985). These potential hydrocarbon source rocks have reached<br />
thermal maturity and may have expelled large volumes of hydrocarbons in the basin center. The<br />
overpressuring observed in the Glenwood-St. Peter section may have been caused by hydrocarbon<br />
generation, and a continuously gas-saturated, basin-center gas accumulation might be present within the<br />
overpressured area.
WELL HISTORIES AND FORMATION TEST DATA<br />
Well histories, well logs, drill-stem test reports (available at the Denver Earth resources Library, 730-<br />
17 th Street, Denver, CO 80202, via microfiche from IHS-Petroleum Information, Inc.) and field descriptions<br />
published by the Michigan Basin Geological Society (Wollensak, 1991) were reviewed to evaluate mud<br />
weights, bottom hole temperatures, drill-stem test shut-in pressures, depth, porosity, permeability and fluid<br />
and/or gas recovery data. Table 1 lists well data for more than 100 St. Peter penetrations within and<br />
surrounding the overpressured area. The pressures listed are the maximum shut-in pressures reported by the<br />
operator, usually the initial shut-in or final shut-in pressures, without any additional extrapolations. In<br />
many cases these pressures are probably somewhat lower than true reservoir pressure due to short buildup<br />
times, and could be extrapolated higher by using Horner plots or similar methods. Fluid and/or gas<br />
recoveries were listed by the operator on Michigan DNR completion report forms, or noted in service<br />
company test reports. Porosities and permeabilities were derived from core analyses or from calculated<br />
values noted in drill stem test reports.<br />
EXTENSIVE SALT WATER SATURATION<br />
The formation tests listed in Table 1 generally recovered salt water from the Glenwood-St. Peter-Brazos<br />
section, with occasional gas shows indicating potentially commercial gas accumulations. The test data<br />
indicate regionally extensive salt water-saturation at “normal” to slightly above normal pressure gradients<br />
(0.4 to 0.56 psi/ft). Salt water appears to be the primary overpressuring fluid. Analyses of the salt water<br />
brines recovered during some of these formation tests show chloride contents ranging from 190,000 to<br />
300,000 ppm and fluid densities equivalent to 10.3 to 10.6 lb/gal drilling mud (+/- 1.24 - 1.27 g/cc).<br />
Drilling mud densities range from 9.1 to 11.3 pounds per gallon at depths ranging from 6490 to 11,850 ft.<br />
Reservoir temperatures in the Glenwood-St. Peter interval range from 125 to 191 °F throughout the region.<br />
These temperatures are lower than those typically found in known basin-center gas accumulations, which<br />
usually occur in reservoirs with temperatures greater than 190-200 °F.<br />
CORE DATA<br />
Bahr and others (1994) note average porosity of 11.4% and average permeability of 5 md in Glenwood-<br />
St. Peter reservoirs. Barnes and others (1992, p. 1529) presented conventional core analyses from three St.<br />
Peter Sandstone cores. Porosities range from approximately 2 to 21% at depths of 7920 - 9020 ft,<br />
depending on depositional environment, depth of burial, diagenetic cements, and development of secondary<br />
porosity. Permeability values greater than 10 md are common, and some intervals exceed 100 md.<br />
Core analyses for three other deep wells (Marathon Bentley No. 4-20, Sec. 20, T. 17N., R. 2E.,<br />
Gladwin County; Marathon Trout River No. 3-18, Sec. 18, T. 22N., R. 2E., Ogemaw County; and Brown<br />
Gingrich No. 1-13, Sec. 31, T. 18N., R. 10W., Osceola County) show measured porosities ranging from<br />
1% to 14% at depths of 8600 to 12,100 ft. Measured permeabilities are highly variable, ranging from less<br />
than 0.1 mD to 750 mD. Many thin zones have permeabilities in the 11 to 88 mD range. These<br />
permeability values are much higher than those generally found in known basin-center gas accumulations,<br />
where tight sandstone reservoirs usually have permeabilities less than 0.1 mD.<br />
Cores of the St. Peter were often described as white, friable sandstone with abundant vertical fractures,<br />
burrow structures, excellent permeability and good intergranular porosity. Some of the cores were “sweating<br />
water” or “bleeding salt water” soon after removal from the core barrels. Measured water saturations (Sw) in<br />
cores from the two Marathon wells and the Brown well ranged from 26% to 95%. In the Marathon Bentley<br />
No. 4-20 well, measured water saturations in the St. Peter core ranged from 31 to 95%, with most Sw<br />
values near 77%. This well was plugged and abandoned after each of four drill stem tests recovered salt<br />
water. The St. Peter Sandstone was found to be convincingly water-productive at this location.
The salt water recoveries noted in many drill stem tests and the high water saturations listed in the core<br />
analyses indicate that the Glenwood-St. Peter reservoir section is regionally saturated with salt-water and<br />
probably contains high saturations only within localized structural gas traps. The extensive salt water<br />
saturation indicates that this is probably not a basin-center gas accumulation.<br />
SIXTEEN GAS FIELDS<br />
Detailed descriptions of sixteen fields which have produced natural gas and/or condensate from the<br />
Glenwood-St. Peter section have been published by the Michigan Basin Geological Society (Wollensak,<br />
1991). Figure 5 shows the location of these gas fields, and Table 2 lists pertinent reservoir data. All of the<br />
sixteen fields have been described as conventional hydrocarbon traps located within faulted anticlinal<br />
structures. Gas and/or condensate is typically found within the upper part of each trap, and salt water is<br />
found at lower levels. Some of the traps appear to be incompletely filled with gas. Most of the published<br />
field descriptions note distinct gas/water contacts, which are shown on marked logs, cross sections or<br />
structure maps.<br />
Strong water drives and problems with increasing water production were noted in several field reports.<br />
Increasing water production rates evidently caused some producing wells to be shut in. Abandoned wells<br />
located downdip from the gas traps frequently recovered salt water from the reservoir section. The formation<br />
waters are often described as black, sulfurous brines with chloride contents of 150,000 to 300,000 ppm.<br />
Reservoir pressure gradients range from normal to moderately overpressured. All of these fields have<br />
reservoir temperatures lower than 200 °F. The Glenwood-St. Peter reservoirs have relatively high<br />
permeabilities (30 mD to 119 mD, with sweet spots as high as 750 mD). These values are much higher<br />
than those typically found in known basin-center gas accumulations.
CONCLUSIONS<br />
Pressures, temperatures and fluid recoveries from at least 120 drill-stem tests and published descriptions<br />
of sixteen gas fields and were reviewed to evaluate the possibility that a basin-center gas accumulation<br />
might be present within the overpressured Glenwood Formation and St. Peter Sandstone in the central<br />
Michigan Basin. The formation test data indicate a regionally extensive, salt-water saturated aquifer system<br />
with relatively low temperature (< 191 °F), unusually high permeabilities (0.1 to 88 to 750 mD) and nearnormal<br />
(0.4 psi/ft) to moderately overpressured (0.56 psi/ft) reservoir pressure gradients. Formation water<br />
salinities (150,000 to 350,000 ppm chlorides) are remarkably consistent throughout the region.<br />
Published descriptions of sixteen gas fields producing from the Glenwood-St. Peter section indicate that<br />
all are located within conventional structural traps in anticlinal closures. Most of these fields have distinct<br />
gas/water contacts which are described in reports or shown on marked logs, cross sections and/or published<br />
structure maps. Gas-water transition zones for several fields are indicated by abandoned wells downdip which<br />
recovered salt water during drill stem tests. Numerous exploratory wells in between the producing fields<br />
have recovered salt water from the Glenwood-St. Peter section.<br />
Regional structure maps indicate a relatively uncomplicated basin structure lacking major transverse<br />
fault zones or major fault-bounded pressure compartments. Drill-stem test data and field descriptions indicate<br />
that salt water probably extends throughout the central basin within the Glenwood-St. Peter aquifer. The<br />
porosity available within the reservoir system has not been de-watered or continuously gas-saturated.<br />
Perhaps the Cambrian-Ordovician source rocks were not thick or rich enough to generate and expel<br />
enough gas to effectively saturate the available porosity, or perhaps the source rocks cooled down and ceased<br />
expelling gas too early. Perhaps the permeabilities were too high, so that large volumes gas escaped<br />
vertically into shallower reservoirs or migrate laterally toward the basin margins. For whatever reasons, the<br />
pore space available in the Glenwood Fm and St. Peter Sandstone appears to be extensively saturated with<br />
salt water. Reservoirs are charged with gas and/or condensate only within several localized structural traps.<br />
Based on review of well data and field descriptions, the Glenwood-St. Peter section in the Central Michigan<br />
basin does not contain a basin-center gas accumulation.
REFERENCES CITED<br />
Bahr, J.M., Moline, G.R., and Nadon, G.C., 1994, Anomalous pressures in the deep Michigan basin:<br />
in Ortoleva, P J., ed., Basin Compartments and Seals, AAPG Memoir 61, p. 153-165.<br />
Barnes, D.A., Lundgren, C.E., and Longman, M.W., 1992, Sedimentology and diagenesis of the St.<br />
Peter Sandstone, central Michigan basin, United States: AAPG Bulletin v. 76, no. 10, p. 1507-<br />
1532.<br />
Catacosinos, P.A., and Daniels, P.A. Jr., 1991, Stratigraphy of Middle Proterozoic to Middle<br />
Ordovician formations in the Michigan basin: in Catacosinos, P.A., and Daniels, P.A., eds.,<br />
Early sedimentary evolution of the Michigan basin: Geological Society of America Special<br />
Paper 256, p. 53-71.<br />
Cercone, K.R. and Pollack, H.N., 1991, Thermal maturity of the Michigan basin: in Catacosinos,<br />
P.A., and Daniels, P.A., eds., Early sedimentary evolution of the Michigan basin: Geological<br />
Society of America Special Paper 256, p. 1-11.<br />
Dott, R.H. Jr. and Nadon, G., 1992, Modeling of pressure compartments in the St. Peter Sandstone<br />
gas reservoir in the Michigan basin: Gas Research Institute <strong>Report</strong> no. 93-0015, 59 p.<br />
Fisher, J.H. and Barratt, M.W., 1985, Exploration in Ordovician of central Michigan basin: AAPG<br />
Bulletin v. 69, no. 12, p. 2065-2076.<br />
Moyer, R.B., 1992, Thermal maturity and organic content of selected Paleozoic formations, Michigan<br />
basin: M. Sc. Thesis, Michigan State University, East Lansing, Michigan, 62 p.<br />
Nadon, G.C., Simo, J.A., Dott, R.H. Jr., and Byers, C.W., 2000, High-resolution sequence<br />
stratigraphic analysis of the St. Peter Sandstone and Glenwood Formation (Middle Ordovician),<br />
Michigan basin, USA: AAPG Bulletin, v. 84, no. 7, p. 975-996.<br />
Wang, H.F., Crowley, K.D., and Nadon, G.C., 1994, Thermal history of the Michigan basin from<br />
apatite fission-track analysis and vitrinite reflectance: in Ortoleva, P. J., ed, Basin compartments<br />
and seals, AAPG Memoir 61, p. 167-177.<br />
Wollensak, M. S., ed., 1991, Oil and gas field manual of the Michigan basin: Michigan Basin<br />
Geological Society, 502 p.
LAKE MICHIGAN<br />
1000<br />
500<br />
0 Miles 100<br />
Contour Interval = 100 ft.<br />
500<br />
LAKE HURON<br />
LAKE ERIE<br />
Figure 1. Isopach map of the St. Peter Sandstone in the central Michigan basin. Modified<br />
from Barnes and others (1992, fig. 3).
LAKE MICHIGAN<br />
-5,000<br />
-10,000<br />
0 Miles 100<br />
Contour Interval = 1,000 ft.<br />
LAKE HURON<br />
LAKE ERIE<br />
Figure 2. Structure contour map of the top of the Glenwood Formation in the central<br />
Michigan basin. Modified from Fisher and Barratt (1985, fig. 12).<br />
D U<br />
D U<br />
D U
SYSTEM<br />
ORDOVICIAN S<br />
CAMBRIAN<br />
U<br />
M<br />
L<br />
U<br />
M<br />
L<br />
PRECAMBRIAN<br />
MILLION<br />
YEARS<br />
438<br />
478<br />
505<br />
523<br />
570<br />
FORMATION<br />
Cinncinnatian<br />
Utica<br />
Trenton<br />
Black River<br />
Glenwood<br />
St. Peter<br />
Brazos<br />
Foster<br />
Prairie Du Chien Group<br />
Trempealeau<br />
Franconia<br />
Galesville<br />
Eau Claire<br />
Mt. Simon<br />
Figure 3. Cambrian and Ordovician stratigraphic units in the Michigan basin, including the<br />
Glenwood Fm, St. Peter Sandstone, Brazos Shale and Foster Fm. Modified from Barnes and<br />
others (1992, fig. 2).
LAKE MICHIGAN<br />
0 100<br />
Miles<br />
LAKE HURON<br />
LAKE ERIE<br />
Figure 4. Map showing the overpressured area in the Glenwood Fm and St. Peter<br />
Sandstone, central Michigan basin. Modified from Bahr and others (1994, p. 158).
LAKE MICHIGAN<br />
Burdell<br />
Leroy<br />
Reed City<br />
Woodville<br />
Goodwell<br />
Ensley<br />
Falmouth<br />
Winterville<br />
S. Buckeye<br />
Fletcher<br />
Pond<br />
Rose City<br />
West Branch<br />
Clayton<br />
Kawkawlin<br />
0 100<br />
Miles<br />
Akron<br />
LAKE HURON<br />
Hardwood<br />
Point<br />
LAKE ERIE<br />
Figure 5. Map showing 16 gas fields which produce from the Glenwood-St. Peter Sandstone<br />
section. Modified from Wollensak (1991).
Well Name No. Sec. T. R. County Formation Mud Wt. BHT ISIP Depth PrGrad Perm Porosity Test Results, IP, Cores, Comments<br />
ppg degF psi ft psi/ft mD %<br />
Brown Snowplow 5-9 9 29 N. 5 E. Alpena St. Peter 10 145 3668 7,240 0.51 21 5 to 13 Perf'd 7220-7264 ft IP= 60 BCPD + 4900 MCFD.<br />
Shell Huber 1-36 26 20 N. 6 E. Arenac Brazos 10.7 5542 11,630 0.48 Perf's 11620-644 ft IP=26 BCPD + 4164 MCFD, no water.<br />
Shell Huber 1-36 26 20 N. 6 E. Arenac St. Peter 10.7 5410 10,450 0.52 DST rec gas + trace of condensate to surface.<br />
Shell Huber 1-36 26 20 N. 6 E. Arenac St. Peter 10.7 5464 10,565 0.52 DST rec 19 bl fm water + trace of gas.<br />
Shell Huber 1-36 26 20 N. 6 E. Arenac St. Peter 10.7 5681 11,050 0.51 DST rec gas + condensate-cut drilling mud.<br />
Shell Huber 1-36 26 20 N. 6 E. Arenac Brazos 10.7 6563 11,640 0.56 DST rec gas to surface at 3.7 MMCFD.<br />
Shell Eisenman 1-3 3 14 N. 4 E. Bay St. Peter 11.3 161 4312 10,510 0.41 DST rec cushion + drilling mud.<br />
Shell Dow 1-10 10 14 N. 5 E. Bay St. Peter 5158 10,550 0.49 DST rec cushion + drilling mud.<br />
Shell Walczak 1-7 7 14 N. 5 E. Bay St. Peter 166 5094 10,510 0.48 DST rec 5394 ft gassy salt water + 496 ft loose sand.<br />
Shell Walczak 1-7 7 14 N. 5 E. Bay St. Peter 160 5410 10,370 0.52 DST rec gassy mud + flowed gas to surface.<br />
Shell Walczak 1-7 7 14 N. 5 E. Bay Brazos 5416 11,090 0.5 Perf'd 11025-114 ft. IP= 305 BCPD + 6100 MCFD.<br />
Shell Vermeesch 1-21 21 14 N. 6 E. Bay Glenwood 153 5423 10,380 0.52 DST rec gas + condensate-cut mud, flowed gas to surf.ace<br />
Shell Vermeesch 1-21 21 14 N. 6 E. Bay St. Peter 5194 10,900 0.48 Perf'd 10832-980 ft. IP=122 BCPD, 2101 MCFD + 17 bwpd.<br />
Fed NatGas Metz 1-15 15 16 N. 4 E. Bay St. Peter 6067 11,690 0.52 DST flowed gas to surface at 220 MCFD.<br />
Fed NatGas Metz 1-15 15 16 N. 4 E. Bay St. Peter 5901 11,705 0.51 Perf'd 11635-11768 ft. IP= 150 MCFD, no water.<br />
Hunt Lease Mgmt 1-12 13 17 N. 7 W. Clare St. Peter 5063 10,630 0.48 Perf'd 10640-611, 10690-740 ft. IP= 708 MCFD + 31 bwpd.<br />
Petrostar Winterfield 1 19 20 N. 6 W. Clare St. Peter 10.1 5344 10,458 0.51 Perf'd 10452-462 ft. IP= 800 MCFD + 240 bwpd.<br />
Petrostar Winterfield 1 19 20 N. 6 W. Clare St. Peter 10.1 5271 10,430 0.5 DST rec 365 ft fm water.<br />
Petrostar Winterfield 1 19 20 N. 6 W. Clare Brazos 10.1 190 5508 10,950 0.5 DST rec 480 ft muddy water.<br />
NM Expl Gernat 2-19 19 20 N. 6 W. Clare St. Peter 10.6 4263 10,470 0.41 DST rec 3770 ft formation water.<br />
Hunt Winterfield A 1 30 20 N. 6 W. Clare St. Peter 10.8 130 4064 10,545 0.39 DST rec 19 stands water + 1 stand mud.<br />
Petrostar St Winterfield 1 31 20N 6W Clare St. Peter 195 5582 11,080 0.5 DST rec 540 ft formation water.<br />
Petrostar St Winterfield 1 31 20N 6W Clare St. Peter 10.4 191 4819 10,900 0.44 DST rec 20 ft condensate, 600 ft mud + 400 ft gassy fm water<br />
Petrostar St Winterfield 1 31 20N 6W Clare St. Peter 10.4 190 4581 11,300 0.4 DST rec 1120 ft muddy water<br />
Petrostar St Winterfield 1 31 20N 6W Clare St. Peter 10.4 190 5601 11,340 0.49 Perf'd 11323-354 ft IP=3 BOPD, 2650 MCFD + 37 bwpd<br />
JEM Dalrymple 1-16 16 22N 4W Clare St. Peter 4850 11,090 0.44 DST rec 480 ft gas-cut mud. sampler rec 3.8 cu ft gas<br />
JEM Dalrymple 1-16 16 22N 4W Clare St. Peter 5253 11,120 0.47 fair DST rec 1142 ft gas-cut mud. No fluor or cut in Ss<br />
Hunt Martin 1-15 15 17N 1E Gladwin St. Peter 11.2 178 5753 11,500 0.5 DST rec 1200 ft water-cut mud + 8136 ft gas-cut mud<br />
Marathon Bentley 4-20 20 17N 1E Gladwin St. Peter 10.3 167 1027 11,350 11 9 to 13 DST rec 200 ft fm water. Cored ss with good permeability<br />
Marathon Bentley 4-20 20 17N 1E Gladwin St. Peter 10.5 173 5700 12,055 0.43 0.005 7 DST rec 75 ft fm water, sampler rec water-cut mud<br />
Marathon Bentley 4-20 20 17N 1E Gladwin St. Peter 10.4 171 5883 11,490 0.51 0.7 8 to 10 DST rec 74 bl gassy water<br />
Amoco Letts Unit 2-36 36 18N 1W Gladwin St. Peter 10.5 171 5826 11,240 0.52 4.6 10 to 17 Perf'd 11218-252 ft. IP= 80 BCFD, 3095 MCFD + 32 bwpd<br />
Amoco Ballentine 1 35 18N 1W Gladwin St. Peter 10.3 5816 11,270 0.52 Perf'd 11260-280 ft. IP= 76 MCFD + 19 BWPD. Plug back<br />
Amoco Ballentine 1 35 18N 1W Gladwin St. Peter 10.3 5476 11,170 0.49 Perf'd 11147-183 ft. IP= 9 BCPD, 417 MCFD + 2 BWPD<br />
Sun Cameron 1-10 10 18N 2W Gladwin St. Peter 10.8 174 5464 11,290 0.48 DST rec cushion, 350 ft gassy water, flowed gas to surface<br />
Sun Cameron 1-10 10 18N 2W Gladwin St. Peter 10.8 168 5601 11,850 0.47 DST rec 8 bl gas-cut mud, flowd gas to surface<br />
Shell Gettel 1-5 5 15N 10E Huron St. Peter 11.1 152 5096 10,245 0.5 DST rec 10 bl fm water<br />
Cities Service Gettel 1 1 15N 9E Huron St. Peter 160 3941 10,650 DST rec gassy mud<br />
Shell Baranski 1-28 28 18N 13W Huron St. Peter 10.9 124 470 8,500 0.51 DST rec 30 bl gassy muddy fm water<br />
Shell Baranski 1-28 28 18N 13W Huron Brazos 10.9 143 4983 9,300 0.54 DST rec 90 bl formation water<br />
Shell Baranski 1-28 28 18N 13W Huron Brazos 10.9 141 4949 9,510 0.52 DST rec 37 bl water-cut drilling mud<br />
Amoco Oboyle 1-31 31 15N 3W Isabella St. Peter 10 182 5228 10,110 0.52 1.34 DST rec 56 bl formation water, 228,000 ppm Cl-<br />
Amoco Oboyle 1-31 31 15N 3W Isabella St. Peter 10.1 184 5099 10,130 0.5 good DST rec 8213 ft water. "Zone has good permeability"<br />
Sun Anderson 1-20 20 14N 10W Mecosta St. Peter 10.4 3643 7,880 0.46 good DST rec 66 bl gassy fm water<br />
Pure Oil Emery 1 21 13N 1W Midland St. Peter 180 4991 9,820 0.51 0.2 14 DST flowed gas at 2.6 MMCFD, water with 225,000 ppm Cl-<br />
KEP Schoenmaker 1 7 21N 6W Missauk St. Peter 4285 10,760 0.4 DST rec 514 ft gas + water cut mud. Core, good permeability<br />
Petromax M-Pollingt 1 2 21N 7W Missauk St. Peter 4660 10,770 0.43 DST rec 300 ft mud + 314 ft salt water<br />
Terra Cramer 1-20 20 21N 7W Missauk St. Peter 9.1 183 4077 10,640 DST rec 185 ft gassy salt water, with 286,000 ppm Cl-<br />
Cities Service Kuiper 1 29 21N 8W Missauk St. Peter 10.4 163 4376 10,620 0.41 5 to 10 DST rec 460 ft mud, 440 ft water. Core "bleeding salt water"<br />
JEM Doornbos 30-5 30 22N 6W Missauk St. Peter 4410 10,675 0.41 fair DST rec 1885 ft black sulfurous water, flowed gas to surface<br />
JEM Doornbos 30-5 30 22N 6W Missauk St. Peter 5181 10,850 0.48 DST rec 450 ft mud, 399 ft fm water<br />
JEM Workman 10-31 31 22N 6W Missauk St. Peter 10.4 4603 10,740 0.43 exc good DST rec 200 ft fm water. Core "sweating water"<br />
JEM Visser 3-35 35 22N 6W Missauk St. Peter 9.8 4778 10,870 0.44 DST flowed gas to surface, rec 730 ft fm water<br />
JEM Visser 3-35 35 22N 6W Missauk St. Peter 10,945 DST rec 2004 ft gassy fm water with 279,000 ppm Cl-<br />
Patrick Gilde 1-25 25 22N 7W Missauk St. Peter 10.9 175 5300 10,580 0.5 good Perf'd 10560-595 ft. IP=6.75 MMCFD<br />
JEM Koetje 1-25 25 22N 7W Missauk St. Peter 9.8 4325 10,690 0.4 fair DST rec 465 ft mud + 300 ft salt water<br />
JEM Koetje 1-25 25 22N 7W Missauk St. Peter 9.8 161 4785 10,745 0.44 DST rec 90 ft gas-cut mud + 520 ft fm water<br />
DART Edwards 7-36 36 22N 7W Missauk Black River 2893 10,154 DST rec 100 ft gassy salt water<br />
DART Edwards 7-36 36 22N 7W Missauk St. Peter 3434 10,580 DST rec 123 ft mud + 10,327 ft gas in drillpipe<br />
DART Edwards 7-36 36 22N 7W Missauk St. Peter 5265 10,620 0.5 Perf'd 10613-745 ft. IP= 12.26 MMCFD<br />
Petrostar Norwich 1-12 12 24N 5W Missauk Brazos 9.6 5109 11,640 0.44 good DST#1 rec 7048 ft salt water with 206,000 ppm Cl-<br />
JEM Bruggers 3-7 7 24N 6W Missauk St. Peter 4757 10,600 0.45 DST rec 1400 ft mud + 270 ft 10.7 pg salt water<br />
Jennings Crimmins 1 18 12N 9W Montcal St. Peter 4203 7,915 0.53 DST rec 60 ft fm water + trace of gas<br />
Jennings Crimmins 1 18 12N 9W Montcal St. Peter 3457 8,010 DST rec 465 ft fm water + 30 ft drilling mud + trace of gas<br />
Shell Houtm-Croton 1 33 12N 11W Newayg Brazos 3190 6,840 0.47 IP= 24 BCPD + 3128 MCFD<br />
Wolverine Wise 1-3 3 13N 11W Newayg St. Peter 10.5 125 3371 7,425 0.45 DST rec 150 ft gas + 1755 ft muddy water with 225,000 ppm Cl-<br />
Wolverine Wise 1-3 3 13N 11W Newayg St. Peter 10.5 127 3448 7,520 0.46 DST rec 5,290 ft muddy fm water with 246,000 ppm Cl-<br />
Terra Vanderly-Millis 1 5 14N 14W Newayg St. Peter 6,856 Perf'd 6,856-6,860 ft. Swabbed fm water<br />
Terra Vanderly-Millis 1 5 14N 14W Newayg St. Peter 6,606 Perf'd 6,600-6,612' ft. Swabbed fm water<br />
Terra Vanderly-Millis 1 5 14N 14W Newayg St. Peter 6,490 Perf'd 6,495-6,484 ft. IP= 24 BCPD + 2.2 MMCFD + 120 bwpd<br />
Ensource Thompson 1 27 15N 12W Newayg St. Peter 10.5 145 3379 8,390 0.4 DST rec 1,240 ft gassy muddy fm water<br />
Amoco Mansfield 1-36 36 21N 3E Ogemaw St. Peter 5561 10,700 0.52 Perf'd 10,662-10,758 ft. IP= 92 BCPD + 1.07 MMCFD + 7 bwpd<br />
Amoco Cailotto 1-31 31 21N 4E Ogemaw St. Peter 5552 10,620 0.52 Perf'd 10,584-750 ft. IP=235 BCPD + 2.45 MMCFD + 41 bwpd<br />
Marathon Robinson 1 13 22N 1E Ogemaw St. Peter 10.6 171 11,105 4.6 12.5 Cores: Perm=0.12 to 88 mD. Porosity= 2.7 to 13.7%<br />
Marathon Trout R 3-18 18 22N 2E Ogemaw St. Peter 10,600 3.7 7.8 Cores: Perm= 0.1 to 23 mD. Porosity= 1.8 to 14.5%<br />
Marathon Trout R 3-18 18 22N 2E Ogemaw St. Peter 174 5850 11,040 0.53 Perf'd 11,000-11,068 ft. IP=881 BCPD + 2.9 MMCFD + 5 bwpd<br />
Shell Foster 1-20 20 24N 2E Ogemaw St. Peter 10.5 165 5150 10,360 0.5 DST rec gas and condensate to surface<br />
Shell Foster 1-20 20 24N 2E Ogemaw St. Peter 10.5 180 5511 10,720 0.51 Perf'd 10,310-390, 10,695-765 ft. IP= 225 BCPD+ 6250 MCFD<br />
Shell Foster 1-21 21 24N 2E Ogemaw St. Peter 19 143 5038 10,373 0.48 good Perf'd 10,215-338 ft. IP=124 BCPD + 8.28 MMCFD + 288 bwpd<br />
Shell Foster 2-28 28 24N 2E Ogemaw St. Peter 10.1 167 4915 10,067 0.49 11 to 13 Perf'd 10,339-10,474 ft. IP=106 BCPD + 2.9 MMCFD.<br />
Shell State Foster 1-28 28 24N 2E Ogemaw St. Peter 10.3 166 10,450 6 to 9 Cored Ss, no shows. D&A. Downdip from Rose City Field<br />
Brazos State Foster 1 28 24N 2E Ogemaw St. Peter 10.8 148 5061 11,200 0.45 DST rec cushion, 100 ft mud + 790 ft salt water<br />
Brazos State Foster 1 28 24N 2E Ogemaw Brazos 10.7 180 11,800 Cored Foster Fm. Bleeding gas, black carbonaceous beds<br />
Brown Corvey 1 5 17N 10W Osceola St. Peter 9.4 142 3106 8,815 DST rec 400 ft muddy water + trace of gas<br />
Brown Corvey 1 5 17N 10W Osceola Brazos 9.4 4568 9,595 0.48 Perf'd 9,584-9,602 ft. IP=7.2 MMCFD + 16 bwpd<br />
Fairway Richmond 1 9 17N 10W Osceola Brazos 10.5 155 9,943 Mudlog: no gas shows in the St Peter Ss<br />
Brown Hayes 1-29 29 17N 10W Osceola St. Peter 155 3555 8,745 DST rec NR. "no shows"<br />
BWAB Rose City 1 7 17N 7W Osceola St. Peter 184 4602 10,050 0.46 good DST rec 196 ft gassy mud + 1,281 ft water with 263,000 ppm Cl-<br />
Brown Gingrich 1-31 31 18N 10W Osceola St. Peter 9,965 23 6.9 Perf'd 9,958-9,975 ft. IP=180 BCPD + 4 MCFD. Cored high perm Ss<br />
Sun Hopmeier 1 1 18N 10W Osceola St. Peter 10.6 164 4240 9,460 0.45 DST rec 1,600 ft gassy 10.4 ppg fm water<br />
Sun Hopmeier 1 1 18N 10W Osceola Brazos 10.6 160 4697 10,320 0.46 DST rec 860 ft 110.6 ppg salt water+O45<br />
Wolverine Greenwald 27 18N 10W Osceola St. Peter 10.4 164 4382 9,020 0.49 DST rec 120 ft gassy water + 2157 ft salt water<br />
Wolverine Greenwald 27 18N 10W Osceola St. Peter 10.4 168 4542 9,630 0.47 DST rec 5,851 ft gassy fm water<br />
Wolverine Greenwald 27 18N 10W Osceola Brazos 10.4 168 4745 9,840 0.49 DST rec 17 bl gas+condensate-cut drilling mud<br />
Wolverine Greenwald 27 18N 10W Osceola Brazos 10.4 168 4731 9,888 0.48 Perf'd 9,881-9,894 ft. IP= 3.4 MCFD<br />
Brown Lewsby 1-20 20 18N 10W Osceola St. Peter 9.4 156 4242 8,860 0.48 0.04 DST rec 557 ft muddy fm water<br />
Brown Lewsby 1-20 20 18N 10W Osceola St. Peter 9.4 162 4288 9,400 0.46 DST rec 5,316 ft salt water with 225,000 ppm Cl-<br />
Wolverine Giese 1 34 18N 10W Osceola St. Peter 172 4853 9,886 0.49 17.1 Perf'd 9,877-9,898 ft. IP= 6 BCPD + 4.3 MMCFD, no water<br />
Sun Zinger H 1 1 18N 10W Osceola St. Peter 157 4402 9,385 0.47 DST rec gas to surface at 3.2 MCFD + 834 ft gassy water<br />
Sun Zinger H 1 1 18N 10W Osceola St. Peter 163 4664 9,890 0.47 DST rec 1,620 ft gas-cut drilling mud<br />
Union Richards 1-19 19 18N 10W Osceola St. Peter 4080 8,980 0.45 DST rec 43 bl muddy water<br />
Union Richards 1-19 19 18N 10W Osceola St. Peter 4168 9,400 0.44 DST rec 2,470 ft gassy 10.6 ppg salt water<br />
Union Richards 1-19 19 18N 10W Osceola Brazos 4541 9,810 0.46 DST rec 74 bl salt water<br />
JEM McCormick 2-27 27 18N 8W Osceola St. Peter 4485 9,790 0.46 DST rec 900' water-cut mud<br />
Sun Loop 1-6 6 18N 9W Osceola St. Peter 10.5 167 4582 9,950 0.46 DST rec 1350' salt water, 9.6 ppg<br />
Sun Loop 1-6 6 18N 9W Osceola St. Peter 10.5 159 4647 9,440 0.49 DST rec 600' fm water<br />
Sun Loop 1-6 6 18N 9W Osceola Glenwood 10.5 150 3832 9,380 0.4 DST rec 220' muddy salt water<br />
Sun Sundmacher 1-33 33 18N 9W Osceola Brazos 10.6 9,845<br />
Petrostar Boyce 2-19 19 20N 10W Osceola St. Peter 3862 9,750 DST rec trace of gas to surface + 200 ft fm water<br />
Petrostar Boyce 2-19 19 20N 10W Osceola St. Peter 4478 9,745 0.46 Perf'd 9,740-9,748 ft. IP= 525 MCFD<br />
Sun Roseville 1-17 17 21N 1W Roscom St. Peter 5256 11,690 0.45 good DST rec 400 ft fm water. Cores "bleeding gas + water"<br />
Petrostar Roscom 1-30 30 21N 3W Roscom St. Peter 9.7 181 4378 11,320 0.06 7 to 12 DST rec 365 ft fm water with 220,000 ppm Cl-, BHP = 5700 psi<br />
Petrostar Roscom 1-30 30 21N 3W Roscom St. Peter 9.9 191 5900 11,707 0.5 DST rec 1,188 ft gassy muddy salt water with 190,000 ppm Cl-<br />
Sun State Lake 1-29 29 23N 4W Roscom St. Peter 11.3 182 4475 10,550 0.42 DST rec 1250' fm water<br />
Amoco Wahl Unit 1-14 14 24N 1W Roscom St. Peter 10.5 161 3126 10,300 DST rec 750' water<br />
Petrostar Almer Land 1 10 13N 9E Tuscola St. Peter 9.7 159 5103 10,340 0.49 0.02 10 DST rec 1,663' condensate-cut mud + 204 ft parafin<br />
Wolverine Dostal 1-27 27 21N 12W Wexford St. Peter 10.6 153 3840 8,520 0.45 DST rec 465 ft mud + 5,022 ft salt water with 236,000 ppm Cl-<br />
JEM Benson 1-14 14 21N 9W Wexford St. Peter 10.3 4359 10,260 0.43 DST rec 375 ft mud + 2,850 ft gassy salt water<br />
JEM Benson 1-14 14 21N 9W Wexford St. Peter 10.3 145 4717 10,350 0.46 DST rec 470 ft mud + 1440' ft gassy salt water<br />
Table 1. Michigan Basin DST Data
FIELD NAME Sec. T. R. County Formation Trap PrGrad BHT Porosity Permeability Wet DST ? G-WC at Depth Comments<br />
psi/ft degF % mD ft Refererence: Wollensak (1991)<br />
Akron 31 14 N. 8 E. Tuscola St. Peter anticline 0.49 155 3 to 28 .14 to 44 several G-WC -9,403 High swtr production, low BHT, gas-water contact.<br />
Burdell 19 20 N. 10 W. Osceola St. Peter anticline 0.46 165 0 to 11 G-WC -9,126 Water prod'n, low BHT, gas-water contact.<br />
Clayton 4 20 N. 4 E. Arenac St. Peter anticline 0.52 165 6 to 14 .3 to 3.5 several G-WC -9,952 200 bwpd, low BHT, gas-water contact.<br />
Ensley 7 11 N. 11 W. Newaygo St. Peter anticline 0.47 118 3 to 25 G-WC -5,825 High IP, then St. Peter perfs "watered out."<br />
Falmouth 36 22 N. 7 W. Missaukee St. Peter anticline 0.5 175 4 to 18 2 to 4 several G-WC -9,397 Low BHT, G/W contact. Cores "bleeding salt water."<br />
Fletcher Pond 9 29 N. 5 E. Alpena St. Peter anticline 0.51 145 7 to 15 .1 to 100 G-WC -6,400 Water prod'n, low BHT, gas-water contact.<br />
Goodwell 8 14 N. 11 E. Newaygo St. Peter anticline 0.45 140 5 to 24 several G-WC -6,900 Short gas column. Two gas-water contacts.<br />
Hardwood Point 28 29 N. 9 E. Alpena St. Peter anticline 0.55 114 5 to 10 2 to 119 G-WC -5,104 High water prod'n, gas-water contact.<br />
Kawkawlin 11 14 N. 4 E. Monitor St. Peter anticline 0.52 168 4 to 17 .1 to 750 several G-WC -9,950 High Perms. Two gas-water contacts.<br />
Leroy 27 19 N. 10 W. Osceola St. Peter anticline 0.48 171 6 to 10 55 to 65 G-WC -8,175 High water production, gas-water contact<br />
Reed City 19 18 N. 10 W. Osceola St. Peter anticline 0.46 168 5 to 14 .1 to 125 several G-WC -8,530 Low BHT, high permeabilities, gas-water contact.<br />
Rose City 21 24 N. 2 E. Ogemaw St. Peter anticline 0.5 174 7 to 14 .05 to 30 several G-WC -9,057 "Strong water drive," gas-water contact.<br />
South Buckeye 36 18 N. 1 W. Gladwin St. Peter anticline 0.52 171 6 to 19 4 to 28 several ? ? Water production. Salt water downdip at Martin No. 1-5.<br />
West Branch 21 22 N. 2 E. Ogemaw St. Peter anticline 0.53 174 9 to 15 1.3 to 13 G-WC -9,615 Water production. Two gas-water contacts.<br />
Winterfield 31 20 N. 6 W. Clare St. Peter anticline 0.51 191 fair several G-WC -9,288 Water production, gas-water contact.<br />
Woodville 29 15 N. 11 W. Newaygo St. Peter anticline 0.46 143 12 to 14 20 to 30 several G-WC -6,928 High water production, gas-water contact.<br />
Table 2. Michigan Basin Gas Field Data
ABSTRACT<br />
IS THERE A BASIN-CENTER GAS ACCUMULATION<br />
IN THE PASCO BASIN, CENTRAL WASHINGTON ?<br />
By Michael S. Wilson, Consulting Geologist<br />
Well data, vitrinite analyses and previous geologic literature were examined to determine if the sparsely<br />
drilled Pasco basin in central Washington might contain a basin-center gas accumulation similar to those<br />
found in several Rocky Mountain basins. The limited geologic data available to the public show that many<br />
pre-requisites are present, including abnormal pressure gradients, thermally mature source rocks, high<br />
temperatures, abundant shows of natural gas, and tight sandstone reservoirs. However the results of twenty<br />
formation tests conducted in several deep exploration wells indicate that water-bearing zones have been<br />
encountered frequently. With the exception of a 1,850 ft thick section in the Roslyn Fm in the Shell<br />
Yakima Mineral Co. No. 1-33 well which might be gas-saturated, the test data indicate widespread “fizzwater”<br />
(gassy formation water) and several zones which produced water at high rates (> 50 bwpd). The<br />
sedimentary section does not appear to be extensively gas-saturated.<br />
The Pasco basin appears to be almost, but not quite a basin-center gas accumulation, with adequate<br />
temperatures, thermally mature, gas-prone source rocks, overpressure and gas shows. But the formation test<br />
results indicate too much water and not enough gas to completely match the definition. The volume of gas<br />
expelled from the source rocks may have been inadequate to effectively de-water the reservoir section. A<br />
Miocene-age regional hydrothermal event may have altered the plumbing of the basin.<br />
INTRODUCTION<br />
The Pasco basin (fig. 1) is located along the Columbia River near the cities of Pasco and Yakima in<br />
central Washington (Terra Graphics, 1981; Campbell, 1989; Johnson and others, 1993). This basin has also<br />
been called the Roslyn basin by Campbell (1989), and is part of a larger basin assemblage generally known<br />
as the Columbia basin (Lingley and Walsh, 1986). The boundaries and internal structure of the Pasco basin<br />
are poorly understood because the sedimentary section is almost entirely covered by thick, Miocene-age<br />
basalt flows of the Columbia River Basalt Group.<br />
In spite of obvious the difficulties of prospecting beneath basalt flows, the Columbia basin has been<br />
the focus of exploration activity by several petroleum companies. Early reports of gas and shows in shallow<br />
water wells stimulated several exploration drilling attempts. Gas shows, a gas kick, and strong water flows<br />
were reported in the Miocene Petroleum Company Union Gap well (Sec. 17, T. 12 N., R. 19 E., Yakima<br />
County) which reached a total depth of 3,810 ft in 1929. Shallow gas production was established in 1930 at<br />
the Rattlesnake Hills Gas Field in T. 11 N., R. 26 E., Yakima County, Washington. Low pressure gas<br />
containing 97% methane and 2.5% nitrogen was trapped in basalt flows at depths of only 700 to 915 ft in a<br />
faulted anticline structure (Hammer, 1934). Approximately 1.3 BCFG was produced from 16 wells above a<br />
distinct gas/water contact, but the field depleted rapidly and was finally abandoned in 1941 (McFarland,<br />
1979).<br />
Gas shows, a gas explosion and water flows (fig. 2, Table 1) were reported in the P. J. Hunt Snipes 1<br />
well (Sec. 33, T. 10 N., R. 22 E., Yakima County), which reached a total depth of 1,408 ft in 1945. A<br />
gas sample from 1,160 ft in this well contained 66% methane, 29% nitrogen and 4.5% oxygen. Johnson<br />
and others (1993) noted that methane gas has been found in many shallow aquifers within the Columbia<br />
River Basalts. They suggest that methane gas expelled from thermally mature Eocene-age coal beds has<br />
migrated vertically along fault zones into the shallow groundwater system within the basalt flows.
The Standard Oil Company drilled an exploratory well to test the deeper potential of the Ratttlesnake<br />
Hills anticlinal structure in 1958 (Standard Oil Rattlesnake 1, Sec 15-T11N-R24E). The well reached a total<br />
depth of 10,655 ft, but was abandoned with no significant oil or gas shows reported (Table 1). The drilling<br />
history and sample reports indicate that the well was still in basalt flows and tuff beds at total depth, and did<br />
not penetrate the sedimentary section which was thought to be buried beneath the basalts.<br />
RECENT EXPLORATION ACTIVITY<br />
Improvements in geophysical methods (Halpin and Muncey, 1982; Campbell, 1981) stimulated a<br />
second wave of exploratory drilling to evaluate the sedimentary section below the Columbia River basalts.<br />
Shell Western Exploration and Production Company drilled six deep wells in the Pasco basin during the<br />
1980’s (Table 1; fig. 2), and Meridian Oil and Gas Corporation drilled one deep well in 1989. All seven<br />
wells were plugged and abandoned without establishing commercial hydrocarbon production. The<br />
combination of MT surveys, regional seismic and gravity data, surface mapping and deep exploratory<br />
drilling resulted in an improved understanding of the stratigraphy and structure of the sediments buried<br />
beneath the flood basalts.<br />
A series of Cretaceous-age rift basins have been interpreted in south-central Washington and northcentral<br />
Oregon by Fritts and Fisk (1985a, 1985b) and Davis and others (1978). Several fault-bounded<br />
grabens (fig. 3) and half-grabens formed during Late Cretaceous and early Tertiary time, and filled with<br />
marine, lacustrine and fluvial sediments. The stratigraphic section (fig. 4) includes Jurassic and Cretaceousage<br />
igneous and metamorphic basement, Paleocene and Eocene-age marine and/or lacustrine deposits (Swauk<br />
Fm); alluvial, fluvial and coal deposits of the Eocene-age Roslyn Formation; and volcanic flows, tuff beds<br />
and arkosic sandstones of the Oligocene-age Naches, Ohanapecosh, Wenatchee, and Wildcat Creek<br />
Formations. The Tertiary sediments are almost completely covered by thick basalt flows and tuff deposits of<br />
the Miocene-age (17.2 to 15.6 Ma) Columbia River Basalt Group (Campbell, 1989; Johnson and others,<br />
1993; Baksi, 1989).<br />
Sumner and Verosub (1992) have suggested that a regional hydrothermal event occurred at<br />
approximately 23 to 24 Ma, pre-dating the Columbia River Basalts. Widespread low temperature<br />
hydrothermal activity is thought to have caused extensive chlorite, zeolite and siliceous alteration in the<br />
Cretaceous and Tertiary sediments, and acceleration of the thermal maturation of Tertiary source rocks.<br />
Sample descriptions noted in the mud-logs of several deep exploratory wells indicate the widespread<br />
occurrence of zeolite minerals (especially laumontite), silicified zones and chlorite diagenesis throughout the<br />
sedimentary section. An episode of tectonic compression during late Miocene caused extensive folding and<br />
faulting of the basalt flows. Maps showing the surface anticlines, synclines and fault structures have been<br />
published by Tolan and Reidel (1989), Campbell (1989) and Johnson and others (1993).<br />
HYPOTHETICAL BASIN-CENTER GAS PLAY<br />
Law (1995) reviewed the exploration activity in the Columbia basin as part of the USGS 1995<br />
Regional Assessment, and suggested that a hypothetical basin-center gas play (USGS No. 503) might be<br />
present in the Pasco basin northwest of the Columbia River. Law noted many of the characteristics<br />
typically found in known basin-center gas accumulations, including overpressuring, gas shows, and tight<br />
sandstones with 6 to 15% porosity in the sedimentary section below the basalt flows. Law (1995) noted<br />
that gas had been recovered at rates of 3.1 MMCFD but that “some water” had been recovered during drill<br />
stem tests in several deep wells.
EVALUATION OF WELL DATA<br />
Data from the deep wells drilled by Shell and Meridian and from several other wells in the region were<br />
reviewed to evaluate this hypothetical basin-center gas play in more detail. Well data were collected from<br />
MJ Microfiche Systems, the Denver Earth Resources Library (730-17th Street, Denver, CO, 80202), the<br />
USGS well log collection, and from several published reports. Drilling mud weights, bottom hole<br />
temperatures, reservoir pressures, vitrinite reflectance measurements, permeabilities, porosities and<br />
formation test results are summarized in Table 1. Figures 5 and 6 show stratigraphic and structural<br />
interpretations for most of these key wells.<br />
Bottom hole temperatures in the deep wells ranged from 218 to 362 °F (Table 1). These temperatures<br />
exceed the 190-200 °F threshold for basin-center gas accumulations proposed by Law and Dickinson (1985)<br />
and Law and Spencer (1989; 1993). Published vitrinite reflectance measurements (Lingley and Walsh, 1986;<br />
Summer and Verosub, 1987) range from 1.1 to 1.3 %Ro at depths of 10,800 to 15,820 ft in the Shell<br />
Yakima Mineral Co. No. 1-33 and Shell BN No. 1-9 wells. These values exceed the threshold of 0.75% to<br />
1 %Ro suggested by Law (1995), Spencer (1989) and Law and Spencer (1993) for typical basin-center gas<br />
accumulations. Lower vitrinite reflectance (0.57 %Ro at 10,080 ft) was measured in the Shell Bissa No. 1-<br />
29 well, which appears to be located on an uplifted fault block (fig. 6).<br />
Mud-logs for several Pasco basin wells are available from MJ Microfiche Systems and/or from the<br />
USGS well log collection. These show that moderate to low-level shows of background gas (mostly<br />
methane) were encountered throughout much of the sedimentary section. Stronger gas shows with heavier<br />
C3, C4 and iC4 hydrocarbons and occasional solvent cuts, oil stain, and yellow-green oil fluorescence were<br />
encountered in several of the deep wells, indicating the presence of condensate and light oil accumulations.<br />
Drilling mud weights and reservoir pressures (Table 1) indicate extensive overpressuring within the<br />
Roslyn, Teanaway and Swauk Formations throughout the Pasco basin. Mud weights as high as 16 to 17.3<br />
ppg were needed to control the deep wells in this area. Reservoir pressures measured during drill stem and<br />
production tests indicate moderate overpressures ranging from 0.55 to 0.72 psi/ft. Assuming that these<br />
measurements are accurate, the 16 to 17.3 ppg (0.83 to 0.89 psi/ft) drilling muds were significantly<br />
overbalanced. Most of the wells were drilled with water-based mud systems, and problems with borehole<br />
caving, sloughing and stuck pipe were reported in several drilling histories. There may have been problems<br />
with swelling clays in the volcanic ash deposits, which might have reacted with water in the drilling mud.<br />
Unusually high mud weights may have been used to stabilize boreholes which were sloughing or being<br />
squeezed due to swelling clays.<br />
Twenty formation tests (Table 1) were performed to evaluate hydrocarbon shows and zones of interest<br />
in the Wildcat Creek, Wenatchee, Ohanapecosh and Roslyn Formations below the basalt flows. Six of the<br />
twenty tests recovered no measurable volumes of gas or liquids. Five tests recovered natural gas at low,<br />
non-commercial flow rates. The formation test at 13,372-388 ft in the Shell BN No. 1-9 well recovered gas<br />
and condensate at a sub-commercial flow rate (3100 MCFD and 6 BCFD) after hydraulic fracture<br />
stimulation. However, this productive reservoir was sandwiched in between zones which produced water at<br />
high flow rates (3 to 5 bwph) when tested. Three of the twenty formation tests flowed gassy water at<br />
moderate rates (more than 50 bwpd), and five tests recovered water at high flow rates (120 to 5400 bwpd).<br />
In summary, eight of the fourteen productive tests flowed water or gassy water at moderate to high flow<br />
rates, and six tests flowed gas and/or condensate without water. The pressuring phase has often been water<br />
or gassy water, and less frequently gas without water. The available test data are limited, but they indicate<br />
that this hydrocarbon system contains abundant moveable water. The available porosity has not been<br />
extensively de-watered and does not appear to be continuously gas-saturated.<br />
Hydraulic fracture stimulations were used in four of the twenty formation tests. At the Shell BN No.<br />
1-9 well (sec. 9, T. 15 N., R. 25 E.) a fracture treatment using 7,500 gallons of 15% acetic acid at 14,056-<br />
14,346 ft resulted in water production at 3 BWPH with traces of gas containing 40 to 380 ppm hydrogen<br />
sulfide. This zone was plugged off. A hydraulic fracture stimulation using 90,000 pounds of Interprop at
13,372-13,388 ft increased gas production from 1,345 MCFD to the sub-commercial rate of 3,100 MCFD<br />
+ 6 barrels of 30.2° API condensate per day. The shut-in reservoir pressure was 7,800 psi (0.58 psi/ft)<br />
before the treatment and 6,900 psi (0.52 psi/ft) after the fracture treatment. Calculations reported by the<br />
operator indicate that the fracture stimulation nearly doubled the “kh” (permeability x height) of the<br />
reservoir, which was a thin sandstone layer with unusually good porosity. However, this productive zone<br />
was sandwiched in between upper and lower zones which produced water at 3 to 5 BWPH during tests.<br />
Farther uphole, perforations at 12,694-12,880 ft produced gas at 553 mcfd with no water before treatment.<br />
After fracture stimulation with 89,000 pounds of Interprop, the “kh” increased from 1.33 mDft to 2.02<br />
mDft and the zone flowed gas and water at a stabilized rate of 2,395 MCFD and 5.6 BWPH. This fracture<br />
treatment evidently improved the permeability of the reservoir, but also connected a gas-producing zone to a<br />
water-producing zone. An acid-fracture stimulation using 77,000 pounds of sintered bauxite proppant at<br />
12,430-12,380 ft in the Shell Yakima Mineral Company No. 1-33 well (Sec. 33, T. 15 N., R. 19 E.)<br />
resulted in a gas flow at 500 MCFD, but the flow rate declined to 150 MCFD within five days and the zone<br />
was eventually plugged. Hydraulic fracture stimulations in the Roslyn Formation evidently include<br />
significant risks: the induced fracture may improve reservoir permeability, but may also connect gasproducing<br />
zones with nearby water-producing zones. As noted by Johnson and others (1993), the<br />
sedimentary section may be cross-cut by fault and fracture zones which can function as permeable pathways<br />
for gas and water migrating upward into shallower zones.<br />
Four of the tests conducted at the Shell Yakima Mineral Company No. 1-33 well (Sec. 33, T. 15 N.,<br />
R. 19 E., Yakima County) evaluated zones of interest in the Roslyn Fm between 10,604 ft and 12,450 ft.<br />
According to reports released by the operator, each of these tests flowed natural gas at low rates (10 MCFD;<br />
85 MCFD; 75 MCFD; 500 to 150 MCFD) without any water production. The bottom hole temperatures<br />
range from 228 to 244 °F in this interval, and published vitrinite reflectance measurements range from 1.1<br />
to 1.3 %, indicating thermal maturity. The maturity data and lack of water production during testing indicate<br />
that a gas-saturated section might be present within this 1,850 ft thick interval. However, zones above and<br />
below this depth range produced gassy water at very high rates when tested (1700 bwpd at 7,535-8,040 ft;<br />
5400 bwpd at 12,976-13,568 ft). So the potentially gas-saturated section is evidently sandwiched in between<br />
water-producing zones.<br />
DISCUSSION<br />
Fourteen of twenty formation tests in the Pasco basin were productive. Six tests recovered gas and/or<br />
condensate without water, and eight tests recovered water or gassy water at moderate to high flow rates.<br />
Based on the limited data available, water production is common, so the deep sedimentary section is<br />
apparently not continuously saturated with gas. Four tests in the Shell Yakima Min Co #1-33 well<br />
produced gas at very low rates, without any water, indicating a potential gas-saturated section between<br />
10,604 and 12,450 ft deep. However water was produced above and below this 1,850 ft thick section.<br />
Additional testing would be needed to prove that the 1,850 ft thick zone is continuously gas-saturated and<br />
would not produce water.<br />
Previous authors have suggested that coal beds within the Eocene-age Roslyn Fm are the source of<br />
natural gas and condensate in the Pasco Basin. But careful inspection of mudlogs, sample descriptions,<br />
caliper logs and density logs in the deep exploration wells indicates that the coal beds are very thin and<br />
relatively rare. No coal beds thicker than 5 ft were observed in the various density logs and mudlogs. The<br />
coal beds may have been formed in shallow, short-lived swamps which were frequently covered by volcanic<br />
ash flows or lava flows. The Roslyn Fm apparently lacks a thick, concentrated coal section where large<br />
volumes of gas might have been generated and expelled. The mud-logs also note fine-grained carbonaceous<br />
(lignite) material in sandstone, siltstone and shale samples within the Roslyn section. This organic material<br />
may be a widespread, disseminated source for natural gas. But by qualitative estimate, the overall volume of<br />
coal and carbonaceous material within the Roslyn Fm in the subsurface appears to be relatively low, while<br />
the total volume of porous sandstone and tuff appears to be quite high. This implies that the available
source rocks may have inadequate to fully de-water and gas-saturate the porosity in the Pasco basin.<br />
Additional studies of source rock volumes are recommended.<br />
One of the deep wells - Shell Bissa No. 1-29 (Sec. 29, T. 18 N., R. 21 E.) penetrated a thick section of<br />
black shale and limestone near total depth which has been identified as Eocene Swauk Formation<br />
(Campbell, 1989). Shows of heavy gases (C3, C4 and iC4), traces of oil in the drilling mud, oil stain,<br />
fluorescence and yellow solvent cuts were noted in an untested sandstone at 13,570 ft, just above the black<br />
shale section. Fluorescence and yellow cut were noted in samples of limestone at 13,760 ft, within the<br />
black shale. The Swauk Fm may contain oil-prone, organic-rich source rocks, and might be the source of<br />
condensates and heavy gases in the Roslyn Basin. The hydrocarbons encountered in the seven exploratory<br />
wells may have been derived from a dual-source system. Methane and light gases may have been expelled<br />
mainly from thin coal beds and disseminated carbonaceous material in the Roslyn Fm. Light oil, condensate<br />
and heavy gases may have migrated vertically from the shales Swauk Fm. Further study is needed to<br />
evaluate these possibilities.<br />
Based on the results of the seven exploratory wells drilled to date, it appears important to locate<br />
structural or stratigraphic traps where gas and condensate might be concentrated, and to carefully avoid<br />
perforating and/or fracturing reservoirs which produce water. The frequent discovery of water-producing<br />
zones makes the exploration process more difficult and more risky. The search for commercial hydrocarbon<br />
traps in the Pasco basin is complicated by the challenges involved in acquiring reliable geophysical images<br />
of potential structural or stratigraphic traps beneath the thick basalt flows.
CONCLUSIONS<br />
The Pasco basin has many of the prerequisites of a typical basin-center gas accumulation, including<br />
overpressures, high temperatures, thermally mature gas-prone source rocks, gas and condensate shows, and<br />
tight, low porosity sandstone reservoirs. Twenty formation tests have been conducted in several deep<br />
exploratory wells which have evaluated the Eocene-age Wenatchee, Roslyn and Swauk formations below the<br />
Columbia Basalt flows. Six of the twenty tests were unproductive, with no measurable fluids or gas<br />
recovered. Six tests recovered gas and/or condensate without any water, and eight tests recovered water or<br />
gassy water at moderate to high flow rates. Four hydraulic fracture stimulations were attempted to improve<br />
flow rates. One of these resulted in gas and condensate production at rates of 3100 MCFD and 6 BCPD<br />
from a thin sandstone reservoir with good porosity. But this reservoir interval was sandwiched in between<br />
upper and lower zones which produced water at high rates. Another fracture stimulation resulted in gas<br />
production at 500 MCFD, but the rate soon declined to 150 MCFD and the zone was abandoned. Another<br />
stimulation apparently connected a gas-producing reservoir to a water-bearing zone, and caused increased<br />
water production. The results of fracture stimulations have been mixed, and indicate significant risk of<br />
connecting gas reservoirs with water-producing zones.<br />
Four of the six tests which recovered gas without water indicate a possible gas-saturated interval<br />
between 10,604 ft and 12,450 ft in the Shell Yakima Mineral Co. No. 1-33 well. Gas was recovered at flow<br />
rates of 10 to 500 MCFD in this section. But water was produced at very high rates during formation tests<br />
above and below this zone, so additional testing is needed to confirm if the section is continuously gassaturated.<br />
The sedimentary section below the flood basalts evidently contains several water-bearing zones which<br />
are inter-bedded with gas-producing reservoirs. This implies that the available porosity in the sedimentary<br />
section is only partially saturated with hydrocarbons. The limited data available at this time indicate that the<br />
Pasco basin is almost, but not quite an unconventional, continuous-type basin-center gas accumulation.<br />
The volume of mature source rocks may be relatively low, and the gas expelled may have been insufficient<br />
to de-water and gas-saturate the available porosity. The sedimentary section may be cross-cut by several<br />
fault and fracture zones which serve as pathways for gas and fluids migrating upward into shallower zones.
REFERENCES CITED<br />
Baksi, A.K., 1989, Reevaluation of the timing and duration of extrusion of the Imnaha, Picture Gorge,<br />
and Grande Ronde Basalts, Columbia River Basalt Group: in Reidel, S.P. and Hooper, P.R.,<br />
editors, Volcanism and Tectonism in the Columbia River Flood-Basalt Province, GSA Special<br />
Paper 239, p. 105-111.<br />
Campbell, N.P., 1981, Geologic evaluation of the Great Western Oil Company oil and gas leases,<br />
Yakima County, Washington: consultant’s report. c/o Denver Earth Resources Library.<br />
Campbell, N.P., 1989, Structural and stratigraphic interpretation of rocks under the Yakima fold belt,<br />
Columbia Basin, based on recent surface mapping and well data: in Reidel, S.P. and Hooper,<br />
P.R., eds., Volcanism and Tectonism in the Columbia River Flood-Basalt Province, GSA<br />
Special Paper 239, p. 209-222.<br />
Davis, G.A., Monger, J.W., and Burchfiel, B.C., 1978, Mesozoic construction of the Cordilleran<br />
“collage,” central British Columbia to central California: in Howell, D.G. and McDougall,<br />
K.A., eds., Mesozoic Paleogeography of the Western U. S., Pacific Section SEPM Pacific<br />
Coast Paleogeography Symposium no. 2, p. 1-32.<br />
Fisk, L.H. and Fritts, S.G., 1987, Field guide and road log to the geology and petroleum potential of<br />
North-Central Oregon: Northwest Geology, v. 16, p. 105-125.<br />
Fritts, S.G. and Fisk, L.H., 1985a, Tectonic model for formation of Columbia basin: implications for<br />
oil, gas potential of North Central Oregon: Oil & Gas Journal, v. 83, no. 34, August 26, 1985,<br />
p. 84-88.<br />
Fritts, S.G. and Fisk, L.H., 1985b, Structural evolution of south margin-relation to hydrocarbon<br />
generation: Oil & Gas Journal, v. 83, no. 35, September 2, 1985, p. 85-90.<br />
Halpin, D.L. and Muncey, G., 1982, Magnetotelluric Survey in the Northern Columbia River Plateau<br />
of South-central Washington: Geotronics Corporation, Austin, Texas, 70 p., report available at<br />
Denver Earth Resources Library, Denver, CO.<br />
Hammer, A.A., 1934, Rattlesnake Hills Gas Field: American Association of Petroleum Geologists<br />
Bulletin, v. 18, p. 847-855.<br />
Johnson, V.G., Graham, D.L. and Reidel, S.P., 1993, Methane in Columbia River basalt aquifers:<br />
isotopic and geohydrologic evidence for a deep coal-bed gas source in the Columbia Basin,<br />
Washington: American Association of Petroleum Geologists Bulletin, v. 77, no. 7, p. 1192-<br />
1207.<br />
Law, B.E., 1995, Play 503, Hypothetical Basin Center Gas Play, Columbia River Basin: in Gautier,<br />
D.L., Dolton, G.L., Takahahi, K.I. And Varnes, K.L., editors, 1995 <strong>National</strong> Assessment of<br />
United States Oil and Gas Resources-Results, Methodology, and Supporting Data: USGS<br />
Digital Data Series DDS-30.<br />
Law, BE. and Dickinson, W. W., 1985, Conceptual model for origin of abnormally pressured gas<br />
accumulations in low-permeability reservoirs: American Association of Petroleum Geologists<br />
Bulletin, v. 69, no. 8, p. 1295-1304.<br />
Law, B.E. and Spencer, C.W., 1993, Gas in tight reservoirs- an emerging major source of energy: in<br />
Howell, D.G., ed., The Future of <strong>Energy</strong> Gases: U. S. Geological Survey Professional Paper<br />
1570, p. 233-252.
Lingley, W.S. Jr. And Walsh, T.J., 1986, Issues relating to petroleum drilling near the proposed highlevel<br />
nuclear waste repository at Hanford: Washington Geologic Newsletter, v. 14, no. 3, p. 10-<br />
19.<br />
McFarland, C., 1979, History of oil and gas exploration in the state of Washington: Washington<br />
Geologic Newsletter, v. 7, no. 3, p. 1-3.<br />
Spencer, C.W., 1989, Review of characteristics of low permeability gas reservoirs in the western<br />
United States: American Association of Petroleum Geologists Bulletin, v. 73, no. 5, p. 613-<br />
629.<br />
Summer, N.S. and Verosub, K.L., 1987, Extraordinary maturation profiles of the Pacific Northwest:<br />
Oregon Geology, v. 49, no. 11, p. 135-140.<br />
Summer, N.S. and Verosub, K.L., 1992, Diagenesis and organic maturation of sedimentary rocks under<br />
volcanic strata, Oregon: American Association of Petroleum Geologists Bulletin, v. 76, no. 8,<br />
p. 1190-1199.<br />
Terra Graphics, Inc., 1981, Oil and Gas Map of Washington and Oregon.<br />
Tolan, T.L. and Reidel, S.P., 1989, Structure map of a portion of the Columbia River Flood-Basalt<br />
Province: in Reidel, S.P. and Hooper, P.R., eds., Volcanism and Tectonism in the Columbia<br />
River Food-Basalt Province, GSA Special Paper 239, map pocket.
124° 122° 120° 118°<br />
WASHINGTON<br />
0 5 10 20<br />
MILES<br />
Columbia<br />
OREGON<br />
Colu mbia<br />
YAKIMA<br />
PASCO<br />
PASCO BASIN<br />
Figure 1. Map showing the approximate outline of the Pasco Basin, central Washington. Modified from Campbell (1989, p. 217).<br />
River<br />
River<br />
S nake<br />
River<br />
IDAHO<br />
48°<br />
47°<br />
46°<br />
45°
A<br />
Scale:<br />
C<br />
DAN<br />
ELLENSBURG<br />
YAKIMA<br />
6 Miles<br />
SYM 1<br />
MUG<br />
C'<br />
SB1<br />
MBN<br />
Columbia<br />
HS 1<br />
B<br />
SRS 1<br />
15E 20E 25E 30E 5N<br />
SQ 1<br />
SBN 1<br />
RHGF<br />
River<br />
PASCO<br />
A'<br />
B'<br />
DAB 1<br />
Snake River<br />
Figure 2. Map showing Pasco, Yakima, Ellensburg, Columbia and Snake Rivers, and the locations of<br />
key wells and cross sections in the Pasco basin. Modified after Terra Graphics (1981), Johnson<br />
and others (1993, p. 1193), and Campbell (1989, p. 211). SD1 = Shell Darcell No. 1; DAB1=<br />
Development Associates Basalt Explorer No. 1; SQ1 = Shell Quincy No. 1; SBN1 = Shell<br />
Burlington Northern No. 1; SRS1 = Standard Oil Rattlesnake Hills No. 1; RHGF = Rattlesnake<br />
Hills Gas Field; HS1= P.G. Hunt Snipes No. 1; MUG = Miocene Union Gap well; SYM1 = Shell<br />
Yakima Mineral Company No. 1; MBN = Meridian Oil Co. B.N. No. 23; SB1 = Shell Bissa No. 1;<br />
DAN = Development Associates NORCO No. 1.<br />
25N<br />
20N<br />
15N<br />
SD 1<br />
10N
DEPTH, IN THOUSANDS OF FEET<br />
0<br />
8<br />
16<br />
24<br />
A A'<br />
ROSLYN<br />
Basalt<br />
NACHES<br />
ROSLYN<br />
SWAUK<br />
PASCO BASIN<br />
W E<br />
ROSLYN<br />
SWAUK<br />
GRANITE<br />
AND GNEISS<br />
Figure 3. Cross section showing an interpretation of the Pasco basin as a rift graben structure. Not to scale. Modified from<br />
Fritts and Fisk ( 1985b, p. 87).
PERIOD/<br />
EPOCH<br />
PLEISTOCENE<br />
PLIOCENE<br />
MIOCENE<br />
OLIGOCENE<br />
EOCENE<br />
PALEOCENE<br />
CRETACEOUS<br />
JURASSIC<br />
AGE<br />
Ma<br />
3.3<br />
8.5<br />
13.5<br />
14.5<br />
15.6<br />
17.5<br />
30<br />
40<br />
47<br />
48<br />
54<br />
55<br />
63<br />
93<br />
138<br />
150<br />
205<br />
Columbia River<br />
Basalt Group<br />
FORMATION LITHOLOGY<br />
Hanford<br />
Ringold<br />
Saddle Mountains<br />
Basalt<br />
Wanapum Basalt<br />
Grande Ronde Basalt<br />
Imnaha Basalt<br />
Wildcat Creek<br />
Wenatchee<br />
Ohanapecosh<br />
Naches<br />
Roslyn<br />
Teanaway<br />
Swauk<br />
Stuart<br />
Batholith<br />
Ingalls Metamorphic<br />
Complex<br />
Basalt and tuff<br />
Rhyolite and basalt flows<br />
interbedded with<br />
tuff and sandstone<br />
Arkosic and tuffaceous<br />
sandstone, siltstone,<br />
shale, coal, and<br />
conglomerate<br />
Basalt flows and tuff<br />
Lacustrine black shale,<br />
limestone, arkosic sandstone,<br />
conglomerate<br />
Granodiorite and<br />
quartz diorite<br />
Schist, amphibolite,<br />
gneiss, serpentine<br />
Figure 4. Stratigraphic units in the Pasco Basin, central Washington. Modified after Campbell<br />
(1989, p. 212) and Johnson and others (1993, p. 1195).
DEPTH, IN THOUSANDS OF FEET<br />
SOUTH NORTH<br />
4<br />
Sea<br />
level<br />
- 4<br />
- 8<br />
- 12<br />
- 16<br />
- 20<br />
B B'<br />
STANDARD OIL<br />
RATTLESNAKE No.1<br />
(1958)<br />
PASCO BASIN<br />
26 mi<br />
COLUMBIA<br />
RIVER<br />
BASALT<br />
GROUP<br />
SHELL<br />
B.N. No.1<br />
(1983)<br />
18 mi<br />
? ? ?? ? ? ?<br />
ROSLYN FM<br />
WENATCHEE FM<br />
? ? ? ?<br />
SWAUK FM<br />
? ? ? ?<br />
BASEMENT<br />
?<br />
?<br />
?<br />
?<br />
SHELL<br />
QUINCY No.1<br />
(1988)<br />
ROSLYN<br />
FM<br />
METAMORPHIC<br />
BASEMENT<br />
COLUMBIA<br />
RIVER<br />
BASALT<br />
GROUP<br />
?<br />
?<br />
?<br />
?<br />
40 mi<br />
?<br />
?<br />
?<br />
?<br />
?<br />
DEVELOPMENT<br />
ASSOCIATES<br />
BASALT<br />
EXPLORER No.1<br />
(1960)<br />
GRANITIC<br />
BASEMENT<br />
Figure 5: Correlation Diagram B-B’ showing key wells and stratigraphic units. Not to scale.<br />
Perforations<br />
VERTICAL SCALE: 1 in = 4,000 ft<br />
HORIZONTAL: NOT TO SCALE
DEPTH, IN THOUSANDS OF FEET<br />
SOUTH NORTH<br />
4<br />
Sea<br />
level<br />
- 4<br />
- 8<br />
- 12<br />
- 16<br />
- 20<br />
C C'<br />
SWAUK<br />
FM ?<br />
MIOCENE P. Co.<br />
UNION GAP<br />
(1929)<br />
BASEMENT ?<br />
TEANAWAY FM<br />
15 mi<br />
COLUMBIA<br />
RIVER<br />
BASALT<br />
GROUP<br />
?<br />
?<br />
?<br />
SWAUK FM ?<br />
BASEMENT ?<br />
OHANAPECOSH<br />
FM<br />
?<br />
STUCK PIPE<br />
?<br />
?<br />
?<br />
ROSLYN FM<br />
?<br />
PASCO BASIN<br />
SHELL<br />
YAKIMA M. Co. No.1<br />
(1980)<br />
DST<br />
?<br />
STUCK PIPE<br />
14 mi<br />
POSSIBLE<br />
GAS-SATURATED<br />
INTERVAL<br />
?<br />
?<br />
?<br />
?<br />
?<br />
?<br />
MERIDIAN<br />
B.N. No. 23<br />
(1989)<br />
? ?<br />
?<br />
?<br />
?<br />
11 mi<br />
COLUMBIA<br />
RIVER<br />
BASALT<br />
GROUP<br />
ROSLYN FM<br />
?<br />
SWAUK FM<br />
Perforations<br />
SHELL<br />
BISSA No.1<br />
(1982)<br />
GRANITIC<br />
BASEMENT<br />
VERTICAL SCALE: 1 in = 4,000 ft<br />
HORIZONTAL: NOT TO SCALE<br />
Figure 6: Correlation Diagram C-C’ showing key wells and stratigraphic units. Not to scale.
Table 1 Pasco Basin Well Data<br />
Well Name No. County Sec. T. R. Formation Depth Mud BHT Ro at Depth SIP Pgrad Perm Porosity Test Results, Cores, Comments<br />
ft ppg degF %, ft psi psi/ft mD %<br />
Shell Darcell 1-10 Walla 10 10 N. 33 E. basement 8,556 11.8 158 Base of Basalt=7820 ft. Tuff + Ss. Basement = gneiss at 8390 ft.<br />
P.J. Hunt Snipes 1 Yakima 33 10 N. 22 E. 1,176 Basalt to 1079 ft. Green shale to 1176 ft with gas shows, water flows.<br />
Standard Oil Rattlesnake 1 Benton 15 11 N. 24 E. basalt 9,495 68.0 230 Deep test at Rattlesnake Gas Field. TD = 10650 ft in basalt.<br />
Miocene Petr. Co. Union Gap Yakima 17 12 N. 19 E. Swauk ? 3,810 Basalt to 1811 ft. Shale + ls to 3811 ft with gas +oil shows, water flows.<br />
Bailey 1 Yakima 24 14 N. 17 E. basalt 530 TD in basalt. Tested 500 MCFD ? Gas = 69% N2 + 28% CH4.<br />
Shell Yakima Mineral Co. 1-33 Yakima 33 15 N. 19 E. Wildcat Ck 5,800 Perf'd 5,770-5,880 ft, rec 1,030 bwpd + trace of gas. Abd.<br />
Shell Yakima Mineral Co. 1-33 Yakima 33 15 N. 19 E. Ohanapecosh 7,700 Perf'd 7,535-8,040 ft, rec gas at 27 MCFD + 1700 bwpd. Abd.<br />
Shell Yakima Mineral Co. 1-33 Yakima 33 15 N. 19 E. Roslyn 10,796 228 1.1% at 10,810 ft Perf'd 10,604-10,930 ft, rec gas at 10 MCFD. Abd.<br />
Shell Yakima Mineral Co. 1-33 Yakima 33 15 N. 19 E. Roslyn 11,240 1.2% at 11,020 ft Perf'd 11,202-11,256 ft, acidized, rec gas at 85 MCFD. Abd.<br />
Shell Yakima Mineral Co. 1-33 Yakima 33 15 N. 19 E. Roslyn 11,746 15.0 244 1.38% at 11,870 ft Perf'd 11,598-11,652 ft, acidized, rec gas at 75 MCFD. Abd.<br />
Shell Yakima Mineral Co. 1-33 Yakima 33 15 N. 19 E. Roslyn 12,400 15.0 Perf'd 12,430-380 ft, acidized, frac'd, rec gas at 500 to 150 MCFD. Abd.<br />
Shell Yakima Mineral Co. 1-33 Yakima 33 15 N. 19 E. Roslyn 13,968 15.0 314 Perf'd 12,976-13,568 ft, flowed 570 MCFD & 5400 BWPD. Abd.<br />
Shell Yakima Mineral Co. 1-33 Yakima 33 15 N. 19 E. Roslyn 15,500 16.0 Perf'd 15,466-15,540 ft, acidized, rec trace of gas, no flow rate. Abd.<br />
Shell Yakima Mineral Co. 1-33 Yakima 33 15 N. 19 E. Teanaway 15,865 16.0 362 Stuck pipe at 16,199 ft. Top of fish= 15,870 ft.<br />
Shell Yakima Mineral Co. 2-33 Yakima 33 15 N. 19 E. Wildcat Ck 5,609 13.0 158 400 mD 10-20% Perf'd 5,133-5,174 ft, rec trace of gas. Abd. Basalts + tuff to 5,100 ft.<br />
Shell Yakima Mineral Co. 2-33 Yakima 33 15 N. 19 E. Wildcat Ck 5,609 13.0 158 Perf'd 5,282-5,322 ft, acidized, rec trace of gas. Abd. Cut 7 Cores.<br />
Shell Yakima Mineral Co. 2-33 Yakima 33 15 N. 19 E. Wildcat Ck 5,609 13.0 158 250 mD 10-15% Perf'd 5,360-5,397 ft, acidized, rec gas at 25 - 50 MCFD. Abd.<br />
Shell Burlington Northern 1-9 Grant 9 15 N. 25 E. Wenatchee 12,177 9.6 200 0.6% at 12,000 ft Basalt to 11,500 ft. Thin ss, sh, coal beds. Gas shows. Cut 9 cores.<br />
Shell Burlington Northern 1-9 Grant 9 15 N. 25 E. Roslyn 12,696 13.5 Perf'd 12,694-12,699 ft, rec gas at 2.4 MMCFD + 134 bwpd (L+W, 1986).<br />
Shell Burlington Northern 1-9 Grant 9 15 N. 25 E. Roslyn 12,792 13.5 8100.0 0.64 BHP = 8,100 psi at 12,696 ft (0.64 psi/ft) before fracturing stimulation.<br />
Shell Burlington Northern 1-9 Grant 9 15 N. 25 E. Roslyn 12,700 13.5 9065.0 0.72 DST at 12,792 ft, FSIP=9,065 psi (0.72 psi/ft), rec NR.<br />
Shell Burlington Northern 1-9 Grant 9 15 N. 25 E. Roslyn 12,800 13.9 Perf'd 12,880-694 ft, rec 553 MCFD. Frac'd 12,880-694 ft, rec<br />
Shell Burlington Northern 1-9 Grant 9 15 N. 25 E. Roslyn 2,395 MCFD & 5 bwph. Prefrac kh=1.33 mDft, Postfrac kh=2.02 mDft.<br />
Shell Burlington Northern 1-9 Grant 9 15 N. 25 E. Roslyn 13,300 14.4 Perf'd 13,288-304 ft, flowed water at 5 bwph. Zeolites below 13,100 ft.<br />
Shell Burlington Northern 1-9 Grant 9 15 N. 25 E. Roslyn 13,380 14.4 7800.0 0.58 0.23 mD 5 - 10% Perf'd 13,372-388 ft, rec 350 MCFD + 9 bwpd. Frac'd, rec 3100 MCFD<br />
Shell Burlington Northern 1-9 Grant 9 15 N. 25 E. Roslyn + 6 BCPD. Pre-frac kh= 3.8 mDft, post-frac kh= 7.1 mDft. CO2 + H2S.<br />
Shell Burlington Northern 1-9 Grant 9 15 N. 25 E. Roslyn 14,190 14.5 1.1% at 15,120 ft Perf'd 14,052-340', no flow, acidized, swabbed 3 bwph, tr gas+H2S.<br />
Shell Burlington Northern 1-9 Grant 9 15 N. 25 E. Roslyn 17,518 15.3 334 1.3% at 15,820 ft TD= 17,518 ft in ss and tuff with chlorite + zeolite matrix.<br />
Meridian B.N. 23-35 Kittitas 35 17 N. 20 E. Wenatchee 8,925 10.6 131 Basalt to 6680 ft, tuff to 7860 ft. RoslynFm, ss, coal and tuff to TD.<br />
Meridian B.N. 23-35 Kittitas 35 17 N. 20 E. Roslyn 11,372 12.3 194 >6700 >0.55 DST 12,584-11,919 ft, rec cushion, 3600 ft fm water with 500 ppm cl-.<br />
Meridian B.N. 23-35 Kittitas 35 17 N. 20 E. Roslyn 12,584 12.4 240 Stuck DST tool, left fish in hole. Abd.<br />
Shell Bissa 1-29 Kittitas 29 18 N. 21 E. Roslyn 8,393 9.2 175 0.53% at 9,220 ft Basalt to 4,580 ft. Perf'd 8,486-800 ft, rec trace of gas. Abd.<br />
Shell Bissa 1-29 Kittitas 29 18 N. 21 E. Roslyn 9,763 9.5 158 Perf'd 9,436-830 ft, rec trace of gas. Abd.<br />
Shell Bissa 1-29 Kittitas 29 18 N. 21 E. Roslyn 10,978 10.3 174 0.57% at 10,080 ft Perf'd 10,314-898 ft, acidized, rec trace of gas. Abd.<br />
Shell Bissa 1-29 Kittitas 29 18 N. 21 E. Roslyn 12,324 12.7 220 Heavy laumontite, zeoloite cements below 11,320 ft, no visible porosity.<br />
Shell Bissa 1-29 Kittitas 29 18 N. 21 E. Swauk 13,510 14.6 218 Gas show at 13,560', oil in mud, fluorescence and cut, not tested.<br />
Shell Bissa 1-29 Kittitas 29 18 N. 21 E. basement 14,965 17.3 270 Swauk Fm, sh, ls, ss below 13,655 ft. Granitic basement at 14,920 ft.<br />
Shell Quincy 1 Grant 22 18 N. 25 E. Roslyn 11,835 12.5 218 Basalt to 7200 ft. Ss + tuff to 12,790'. Coal bed, gas show at 10,200 ft.<br />
Shell Quincy 1 Grant 22 18 N. 25 E. basement 13,202 13.9 239 Metamorphic basement at 12,790 ft. No tests reported. Abd.<br />
Dev. Assoc. Basalt Explorer 1 Lincoln 10 21 N. 31 E. basement 4,682 138 Basalt to 4,465 ft, ss, sh, ss. Granitic basement at 4,667 ft.Abd.<br />
Dev. Assoc. Norco 1 Chelan 26 22 N. 20 E. Swauk ? 4,903 0.5% at 4,850 ft Drilled in 1935. Several gas shows. Re-entered, logged in 1974. Abd.
1<br />
POTENTIAL FOR A BASIN-CENTERED GAS ACCUMULATION IN THE RATON<br />
BASIN, COLORADO AND NEW MEXICO<br />
INTRODUCTION<br />
By Ronald C. Johnson and Thomas M. Finn<br />
The Raton Basin covers an area of about 4,000 square miles of southeastern Colorado and northeastern<br />
New Mexico. The basin is bounded on the west by the Sangre de Cristo Mountains, on the north by the<br />
Wet Mountains, on the southeast by the Sierra Grande arch, on the east by the Las Animas arch and on the<br />
northeast by the Apishapa arch (Figure 1). The basin is highly asymmetrical with the deep axis just east of<br />
the Sangre de Cristos. The east flank of the basin gently tilted toward the west at from 1 to 5 degrees<br />
whereas steep dips and thrust faults occur along the west flank adjacent to the Sangre de Cristo Mountains.<br />
The Raton Basin is in the southeastern part of the area in the Rocky Mountain region that was affected by<br />
the Laramide orogeny (Late Cretaceous through Eocene).<br />
The Raton Basin contains a thick stratigraphic section of Devonian through Recent rocks (Figure 2).<br />
The units considered most likely to contain a basin-centered gas accumulation include the Upper Cretaceous<br />
Trinidad Sandstone, Upper Cretaceous Vermejo Formation, Upper Cretaceous and Paleocene Raton<br />
Formation, and the Paleocene Poison Canyon Formation.<br />
The marginal marine Trinidad Sandstone conformably overlies the Pierre Shale throughout the basin<br />
and was deposited along an eastward prograding shoreline during the final retreat of the Cretaceous seaway<br />
from northern New Mexico and southern Colorado. It was deposited in shallow marine, shoreface, and<br />
deltaic environments (Pillmore and Maberry, 1976; Billingsley, 1977). The Trinidad Sandstone varies from<br />
0 to over 300 ft thick (Rose and others, 1986). It is truncated by the Poison Canyon Formation in the<br />
northernmost part of the basin.<br />
The Late Cretaceous Vermejo Formation conformably overlies the Trinidad Sandstone. The Vermejo<br />
Formation varies from 0 to 380 ft thick (Figure 2). It is truncated by the Poison Canyon Formation in the<br />
northernmost part of the basin. It was deposited in fluvial channel, overbank-levee, crevasse splay,<br />
floodplain lake, low-lying and raised mire environments environments (Strum, 1985; Flores, 1987; Flores<br />
and Pillmore, 1987). Total coal in the Vermejo Formation ranges to over 30 ft (Tyler and others, 1995).<br />
The Raton Formation varies from 0 to 2,100 ft thick in the basin (Figure 2). It is unconformable with<br />
the underlying Vermejo Formation throughout much of the basin. It is divided into a basal conglomeratic<br />
interval, a lower coal-rich interval, a sandstone-dominated interval, and an upper coal-rich interval (Figure<br />
3). The Cretaceous-Tertiary boundary is conformable in the Raton Basin and occurs near the top of the<br />
lower coal-rich interval (Figure 2) (Tsudy and others, 1984; Pillmore and Flores, 1984). The basal<br />
conglomerate is as much as 50 ft thick and consists of interbedded pebble conglomerate and quartzose<br />
sandstone (Pillmore and Flores, 1987). The lower coal-rich zone varies from 100 to 250 ft thick and the<br />
upper coal-rich zone varies from about 600 to 1,100 ft thick. Both are composed of interbedded sandstone,<br />
siltstone, mudstone, carbonaceous shale and coal. The coaly intervals include lenticular channel sandstones<br />
and thin comparatively persistent crevasse splay sandstones (Figures 4 and 5). Total net thickness of coal in<br />
the Raton Formation ranges to over 140 ft (Tyler and others, 1995). The sand-dominated interval separates<br />
the two coal-rich zones and varies from 180 to 600 ft thick. Sandstones are coarsest in the sand-dominated<br />
interval. Estimates of total coal in both the Vermejo and Raton formations vary from 1.5 to 4.8 billion<br />
short tons (Read and others, 1950: Wanek, 1963), however, more recently Amuedo and Bryson (1977)<br />
estimated 5 billion short tons in the Vermejo Formation alone.<br />
The Poison Canyon Formation is as much as 198 m thick and conformably overlies and intertongues<br />
with the Raton Formation (Figure 2) (Johnson and Wood, 1956; Flores, 1987). The Formation consists of<br />
interbedded coarse-grained conglomeratic sandstone, mudstone and siltstone (Hills, 1888; Johnson and<br />
others, 1966), and becomes finer-grained towards the east in the basin. The Poison Canyon contains little<br />
coal or carbonaceous shale.<br />
The Raton Basin was extensively intruded by dikes, sills, laccoliths, and stocks in middle to late<br />
Tertiary time. A major intrusive center of Miocene age (26 to 22 Ma), thought to represent the roots of<br />
breached volcanoes (Steven, 1975), occurs in the northern part of the basin (Figure 1). Two of these<br />
breached intrusions form East and West Spanish Peaks which tower over the basin at elevations of 12,683
ft and 13,724 ft respectively. Dikes and sills related to this intrusive center occur throughout the northern<br />
part of the basin. Sills related to this intrusive center have followed coal beds destroying tremendous<br />
quantities of coal in this area (Carter, 1956).<br />
COAL RANK IN THE RATON BASIN<br />
Coal ranks at the base of the Vermejo Formation vary from a vitrinite reflectance of 0.57% around the<br />
margins of the northern part of the basin to 1.58% along the Purgatoire River in the central part of the<br />
basin. Coal ranks of anthracite or greater occur locally near intrusions (Jurich and Adams, 1984). The<br />
unusually high coal ranks along the Purgatoire River are unusual in that they do not occur near the major<br />
intrusions found further to the north in the basin. Wells drilled near the river have, however, encountered<br />
some sills (ARI Inc., 1991) which may have played a role in elevating coal ranks. Merry and Larsen (1982)<br />
suggested that the high coal ranks may be due to a combination of deep burial during the Pliocene and<br />
proximity to intrusions. Tyler and others (1991) suggested that hot waters ascending to an ancestral<br />
Purgatoire River may account for the high values near the river.<br />
COALBED METHANE IN THE RATON BASIN<br />
It has long been known that coals in the basin contain large amounts of methane. Nearly all coal mines<br />
in the Raton Basin encountered some gas. Jurach and Adams (1984) reported that 2 million cubic feet of<br />
methane per day was being ventilated from just three mines in the west-central part of the basin. <strong>Report</strong>ed<br />
gas contents for coal in the Vermejo Formation vary from 115 to 492 ft 3 /short ton (3.6-15.5 cm 3 /gm) while<br />
coals in the Raton Formation contain from 23 to 193 ft 3 /short ton (0.72-6.07 cm 3 /gm) (Tyler and others,<br />
1995). As of 1998 there were about 85 coalbed methane wells in the Raton Basin producing about 17.5<br />
million cubic feet of gas per day (Johnson and Flores, 1998) with a significant number of new coalbed<br />
methane wells having been drilled since 1998. Wells are completed mainly in the Vermejo Formation.<br />
Production thus far is concentrated in a 25 by 15-mile northeast trending area near the Purgatoire River,<br />
west of Trinidad in and area where coal ranks are unusually high. Coalbed methane exploration began in the<br />
Raton Basin by Amoco in 1980 at their Cottontail Pass unit. The best wells in Amoco’s unit yielded more<br />
than 590 MCFD. Maximum depth for coalbed methane wells in the basin is about 2,400 ft in the<br />
northwest part of Amoco’s Cottontail Pass unit.<br />
GEOLOGY OF BASIN-CENTERED GAS ACCUMULATIONS<br />
Extensive basin-centered gas accumulations have been identified in many Rocky Mountain basins that<br />
formed during the Laramide orogeny (Late Cretaceous through Eocene). Reservoirs within basin-centered gas<br />
accumulations typically have low permeabilities (in-situ permeability to gas of 0.1 millidarcy or less) and<br />
are commonly referred to as tight reservoirs (Spencer, 1989). These accumulations differ from conventional<br />
hydrocarbon accumulations in that they: (1) cut across stratigraphic units, (2) commonly occur structurally<br />
down dip from more permeable water-filled reservoirs, (3) have no obvious structural and stratigraphic<br />
trapping mechanism, and (4) are almost always either overpressured or underpressured. The abnormal<br />
pressures of these reservoirs indicate that water in hydrodynamic equilibrium with outcrop is not the<br />
pressuring agent. Instead, hydrocarbons within the tight reservoirs are thought to provide the pressuring<br />
mechanism (Spencer, 1987).<br />
Masters (1979) was one of the first to study these unique accumulations, which occur downdip from<br />
more permeable, water-wet rocks. Masters (1979) proposed that gases generated in the deep, thermally<br />
mature areas of sedimentary basins with low-permeability rocks, are inhibited from migrating upwards and<br />
out of the basin by a capillary seal. Masters (1979) pointed out that low-permeability rocks (1 md), with<br />
40% water saturation, are only three-tenths as permeable to gas as they are to water, and at 65% water<br />
saturation, the rock is almost completely impervious to the flow of gas. The concepts for the development<br />
of basin-centered gas accumulations in the Rocky Mountains have been further refined by a number of<br />
2
workers such as Jiao and Surdam (1993), Meissner (1980; 1981; 1984), McPeek (1981), Law, 1984; Law<br />
and others (1979; 1989), Law and Dickinson (1985), MacGowan and others (1993), Spencer and Law<br />
(1981), Spencer (1985; 1987), and Yin and Surdam (1993). In general, the conceptual models suggest that<br />
overpressuring, which is commonly encountered in these basin-centered accumulations, is the result of<br />
volumetric increases during hydrocarbon generation by the coals, carbonaceous shales, and marine shales<br />
that are interbedded with the sandstone reservoir rocks. Law (1984) suggested that migration distances from<br />
source rock to reservoir rock in the basin-centered gas accumulation of the Greater Green River Basin of<br />
Wyoming, Colorado, and Utah are generally less than a few hundred feet. Much of the water that originally<br />
filled the pore spaces in the potential reservoirs is driven out by hydrocarbons (Law and Dickinson, 1985).<br />
According to Law and Dickinson (1985), the capillary seal is activated as gas replaces water in the pore<br />
space, and hence the basin-centered gas accumulations seal themselves as they form. These seals are so<br />
efficient that they may be able to maintain abnormally high pressures for tens of millions of years<br />
(MacGowan and others, 1993).<br />
Many basin-centered gas accumulations in Rocky Mountain basins are partially to totally<br />
underpressured, and it is believed that all of these underpressured areas were overpressured at some time in<br />
the past (Meissner, 1978; Law and Dickinson, 1985). Moreover, it is believed that a previous period of<br />
overpressuring would have been necessary to drive much of the water out of the system. A change from<br />
overpressured to underpressured conditions can occur as a result of cooling related to uplift and erosion or to<br />
a decrease in thermal gradients (Meissner, 1978; Law and Dickinson, 1985). Most of the cooling in Rocky<br />
Mountain basins has occurred within the last 10 my as the onset of major regional uplift initiated a period<br />
of rapid downcutting throughout region. For a summary of the evidence for late Cenozoic uplift in the<br />
Rocky Mountain region see Keefer (1970) and Larson and others (1975). Overpressured areas became<br />
underpressured during cooling as gas contracts and the rate of gas generation decreases (Meissner, 1978; Law<br />
and Dickinson, 1985). Surface water enters the basin-centered accumulation through newly created<br />
permeability pathways created as pore throats and fractures dilate. According to Meissner (1978) this<br />
contraction may ultimately result in a “dead” basin where the basin-centered accumulation has been<br />
completely dissipated. Many Rocky Mountain basin-centered gas accumulations have underpressured zones<br />
surrounding an overpressured central core indicating that this process has only partially run to completion.<br />
The underpressured zone will grade outward into a predominantly water-bearing zone that is in pressure<br />
equilibrium with the local hydrodynamic regime. Any gas present in this water-bearing zone will be trapped<br />
in conventional reservoirs on anticlinal structures or in stratigraphic pinchouts.<br />
Levels of thermal maturity define areas where potential source rocks have generated gas at some time in<br />
the past and are commonly used as an indirect method of defining the limits of a basin-centered gas<br />
accumulation. Masters (1984, p. 27, Fig. 25) in a study of the basin-centered gas accumulation in the Deep<br />
Basin of Alberta, indicated that a vitrinite reflectance (Ro) of 1.0% corresponds approximately to the limit<br />
of the accumulation. In the Piceance Basin of western Colorado, Johnson and others (1987) used a vitrinite<br />
reflectance (Ro) of 1.1% to define the limits of the basin-centered gas accumulation. Ro values of from 0.73<br />
to 1.1% were used to define a transition zone containing both tight reservoirs and reservoirs with<br />
conventional permeabilities. Johnson and others (1996; 1999) used these same thermal maturity limits to<br />
help define the basin-centered gas accumulation in the Wind River Basin of Wyoming and the Bighorn<br />
Basin of Wyoming and Montana. In the Greater Green River Basin of Wyoming, Colorado, and Utah, Law<br />
and others (1989) used an Ro of 0.80% to define the top of overpressuring in the basin-centered gas<br />
accumulation.<br />
3
EVIDENCE FOR A BASIN-CENTERED GAS ACCUMULATION IN THE RATON<br />
BASIN<br />
Evidence for gas at shallow depths in Uppermost Cretaceous and Paleocene strata in the Raton basin<br />
was documented by Dolly and Meissner (1977). According to Dolly and Meissner (1977, p. 259) “gas flows<br />
encountered during the drilling and testing of exploratory and shallow water wells are of a nearly universal<br />
nature in sandstones, coals and fracture zones present in Poison Canyon, Raton, Vermejo, and Trinidad<br />
formations.” Dolly and Meissner (1977) describe sandstones in these formations as “tight, clay-filled” and<br />
similar to productive Cretaceous and Tertiary sandstones in many other Rocky Mountain basins. They site<br />
one well, the Filon no. 1 Golden Cycle in sec. 11 T. 29S., R. 67W. that tested 30 MCF of gas from a<br />
zone at 1,630 to 1,760 ft in the lower part of the Raton Formation. . An unusually low fluid pressure<br />
gradient of 0.25 psi/ft was noted by Dolly and Meissner (1977, p. 268) in the tested interval from this well<br />
indicating significant underpressuring. They noted that this pressure gradient corresponds to a potentiometric<br />
head of approximately 780 ft below the well site. Initial production testing after fracing with nitrogen foam<br />
and KCl inhibited water indicated a flow rate of 75 MCFPD and 1,500 barrels of water per day (BWPD).<br />
After two months, the well stabilized at about 72 MCFPD and 100 BWPD. It is unclear how much of the<br />
initial water production was frac water. Although Dolly and Meissner (1977, Fig. 13) clearly believed that<br />
discrete gas-water contacts existed in the productive lenticular sandstones, the presence of underpressured gas<br />
in tight reservoirs is characteristic of many basin-centered gas accumulations in the Ricky Mountain region.<br />
Underpressuring indicates that the reservoirs are isolated from the regional groundwater regime.<br />
More recently Rose and others (1986) used variations in resistivity logs to try to delineate the gassaturated<br />
basin-centered accumulation in just the Trinidad Sandstone in the northern part of the basin. The<br />
Trinidad is a marginal marine “blanket-like” sandstone that persists throughout the Raton Basin. This<br />
contrasts with the much more lenticular fluvial sandstones found in the nonmarine parts of the Upper<br />
Cretaceous and Paleocene section in the basin. Rose and others (1986) suggested that an analog to the<br />
Trinidad Sandstone may be the highly gas productive Upper Cretaceous marginal marine Pictured Cliffs<br />
Sandstone in the San Juan Basin to the west. The Pictured Cliffs Sandstone produces from stratigraphic<br />
traps formed by stratigraphic jumps toward the northeast (Meissner, 1984).<br />
Regional underpressuring at shallow depths in the Raton Basin has been documented by several workers<br />
(Howard, 1982; Geldon, 1990; Close and Dutcher, 1990; Tyler and others, 1995). A potentiometric surface<br />
map of the Vermejo-Raton aquifer constructed by Stevens and others (1992) and published by Tyler and<br />
others (1995, p. 170) indicates that underpressured conditions exist in the main coal-bearing intervals<br />
throughout most of the basin. Tyler and others (1995, p. 169-170) state that the pressure regime in the<br />
basin is poorly understood but list some of the possible causes for this underpressuring. They noted that<br />
low pressures indicate that the rocks are isolated from topographically high recharge areas along the west<br />
margin of the basin and suggest that low permeability in the sandstones and coal beds may limit hydrologic<br />
connection.<br />
4
DISCUSSION<br />
It has long been suspected that a substantial basin-centered type gas accumulation is present in Upper<br />
Cretaceous and Paleocene sandstones in the Raton Basin. Few attempts have been made to develop these<br />
resources because of the lack of gas pipelines out of the basin. Success with the current coalbed methane<br />
exploration in the basin will eventually alleviate this pipeline problem and should lead to new attempts to<br />
develop these sandstone gas resources. Gas resources found in coal beds and in adjacent sandstone reservoirs<br />
are developed concurrently in many Rocky Mountain basins.<br />
It is suggested here that the widespread gas shows encountered in the Vermejo and Raton formations<br />
along with abnormally low pressures indicates a basin centered gas accumulation developed in these units.<br />
Using analogs from other Rocky Mountain basins, sandstones where thermal maturities are greater than Ro<br />
1.1% were probably once overpressured and largely gas-saturated. At lower levels of thermal maturity, both<br />
gas-charged and water-wet sandstones were probably present. The big unanswered question in the Raton<br />
Basin is how much of the original accumulation is still intact? Present-day depths to the top of the<br />
Trinidad Sandstone are less than 3,500 ft throughout most of the basin except in the immediate vicinity of<br />
the Spanish Peaks were it obtains a depth of over 9,000 ft (Figure 7). The widespread reports of<br />
underpressured gas-saturated sandstones at shallow depths suggests that a largely intact basin-centered<br />
accumulation still exists in that part of the Trinidad Sandstone, Vermejo Formation and Raton Formation<br />
that was not eroded away as a result of regional uplift and downcutting.<br />
Coalbed gas and sandstone gas are typically developed together in Rocky Mountain basins. The San<br />
Juan Basin of New Mexico and Colorado has by far the most successful coalbed methane production the<br />
United States. Yet the original exploration targets were not the coal beds but the adjacent sandstones which<br />
were typically gas-charged (Dugan and Williams, 1988). Only after gas wells started experiencing increases<br />
in rates of production did operators begin to suspect that adjacent coal beds may be contributing<br />
significantly to production. At Grand Valley field in the Piceance Basin of western Colorado, lenticular<br />
fluvial sandstones interbedded with coals of the Cameo-Fairfield coal zone have become the principle<br />
exploration target in the field, although both coals and sandstones were originally targeted (Reinecke and<br />
others, 1991). Sandstones adjacent to the thick lower Tertiary coal beds in the Powder River Basin of<br />
Wyoming and Montana are typically gas-charged (Hobbs, 1978) and are increasingly becoming targets for<br />
exploration. Gas from coal beds and adjacent sandstone beds are typically commingled in the Upper<br />
Cretaceous Ferron play on the Wasatch Plateau in central Utah.<br />
It is suggested that within a few years the Raton Basin will evolve into both a coalbed methane play<br />
and a basin-centered sandstone gas play. At present, there appears to be no identified production in the Raton<br />
basin from sandstones within the basin-centered accumulation, and it is difficult to assess how successful<br />
this play will be. A more comprehensive study of this gas resource should be made once more reliable<br />
information is available concerning sandstone production characteristics in the basin.<br />
5
REFERENCES CITED<br />
6<br />
Amuedo, C. L., and Bryson, R. S., 1977, Trinidad-Raton basins: a model coal resource evaluation<br />
program: in Murray, D. K., ed., Geology of Rocky Mountain Coal: Proceedings of the 1976<br />
Symposium, Colorado Geological Survey, p. 45-60.<br />
ARI, Inc., 1991, Geologic assessment of natural bas from coal seams in the Raton Basin: geologic<br />
peer review prepared for the Gas Research Institute, 93p.<br />
Billingsley, L. T., 1977, Stratigraphy of the Trinidad Sandstone and associated formations Walsenburg<br />
area, Colorado: in Veal, H. K., ed., Exploration Frontiers of the Central and Southern Rockies;<br />
Rocky Mountain Association of Geologists Guidebook, p. 235-246.<br />
Carter, D. A., 1956, Coal deposits of the Raton Basin: in McGinnis, C, J., ed., Geology of the Raton<br />
Basin, Colorado: Rocky Mountain Association of Geologists Guidebook , p. 89-92.<br />
Close, J. C., and Dutcher, R. R., 1990, Update on coalbed methane potential of Raton Basin, Colorado<br />
and New Mexico: Society of Petroleum Engineers, Proceedings, 65 th Technical Conference, SPE<br />
Paper 20667, p. 497-512.<br />
Dolly, E. D., and Meissner, F. F., 1977, Geology and gas exploration potential, Upper Cretaceous and<br />
Lower Tertiary strata, Northern Raton Basin, Colorado: in Veal, H. K., ed., Exploration<br />
Frontiers of the Central and Southern Rockies; Rocky Mountain Association of Geologists<br />
Guidebook, p. 247-270.<br />
Dugan, T. A., and Williams, B. L., 1988, History of gas produced from coal seams in the San Juan<br />
Basin: in Fassett, J. E., ed., Geology and coalbed methane resources of the northern San Juan<br />
Basin, Colorado and New Mexico: Rocky Mountain Association of Geologists Guidebook, p. 1-<br />
9.<br />
Flores, R. M., 1987, Sedimentology of Upper Cretaceous and Tertiary siliciclastics and coals in the<br />
Raton, Basin, New Mexico and Colorado: in Lucas, S. G., and Hunt, A. P., eds., Northeastern<br />
New Mexico: New Mexico Geological Society Thirty-eighth Annual Field Conference, p. 255-<br />
264.<br />
Flores, R. M., and Bader, L. R., 1999, A summary of Tertiary coal resources of the Raton Basin,<br />
Colorado and New Mexico: U.S. Geological Survey Professional Paper 1625A, Chapter SR.<br />
Geldon, A. L., 1990, Ground-water hydrology of the central Raton Basin, Colorado and New Mexico:<br />
U.S. Geological Survey Water Supply Paper 2288, 81p.<br />
Hills, R. C., 1888, The recently discovered Tertiary beds of the Huerfano River Basin, Colorado:<br />
Colorado Scientific Society , Proceedings, vol. 3, p. 148-164.<br />
Hobbs, R. G., 1978, Methane occurrences, hazards, and potential resources-Recluse geologic analysis<br />
area, northern Campbell County, Wyoming: U.S. Geological Survey Open-File <strong>Report</strong> 78-401,<br />
20p.<br />
Howard, W. B., 1982, The hydrogeology of the Raton Basin, south-central Colorado: Indiana<br />
University Master’s Thesis, 95p.<br />
Jiao, Z. S., and Surdam, R. C., 1993, Low-permeability rocks, capillary seals, and pressure<br />
compartment boundaries in the Cretaceous section of the Powder River Basin: in Stroock, B.,<br />
and Andrew, S., eds., Wyoming Geological Association Jubilee Anniversary Field Conference<br />
Guidebook, p. 297-310.<br />
Johnson, R. B., and Wood, H. H., Jr., 1956, Stratigraphy of Upper Cretaceous and Tertiary rocks of<br />
Raton Basin, Colorado and New Mexico: American Association of Petroleum Geologists<br />
Bulletin, vol. 40, p. 707-721.<br />
Johnson, R. B., Dixon, G. H., and Wanek, A. A., 1966, Late Cretaceous and Tertiary stratigraphy of<br />
the Raton Basin of New Mexico and Colorado: in Northrop, S. A., and Read, C. B., eds.,<br />
Guidebook of Taos- Raton- Spanish Peaks Country, New Mexico and Colorado: New Mexico<br />
Geological Society Seventeenth Field Conference, p. 88-98.<br />
Johnson, R. C., Finn, T. M., Crovelli, R. A., and Balay, R. H., 1996, An assessment of in-place gas<br />
resources in low-permeability Upper Cretaceous and lower Tertiary sandstone reservoirs, Wind<br />
River Basin, Wyoming: U.S. Geological Survey Open-File <strong>Report</strong> 96-264.
7<br />
Johnson, R. C., Crovelli, R. A., Spencer, C. W., and Mast, R. F., 1987, An assessment of gas<br />
resources in low-permeability sandstones of the Upper Cretaceous Mesaverde Group, Piceance<br />
Basin, Colorado: U.S. Geological Survey Open-File <strong>Report</strong> 87-357, 165p.<br />
Johnson, R. C., and Flores, R. M., 1998, Developmental geology of coalbed methane from shallow to<br />
deep in Rocky Mountain basins and in Cook Inlet- Matanuska basin, Alaska, U.S.A. and<br />
Canada: International Journal of Coal Geology, 35, p. 241-282.<br />
Johnson, R. C., Crovelli, R. A., Lowell, B. G., and Finn, T. M., 1999, An assessment of in-place<br />
gas resources in the low-permeability basin-centered gas accumulation of the Bighorn Basin,<br />
Wyoming and Montana: U.S. Geological Survey Open-File <strong>Report</strong> 99-315-A, 123 p.<br />
Jurich, D., and Adams, M. A., 1984, Geologic overview, coal and coalbed methane resources of Raton<br />
Mesa region, Colorado and new Mexico: in Rightmire, C. T., Eddy, G. E., and Kirr, J. N. eds.,<br />
Coalbed Methane Resources of the United States: American Association of Petroleum<br />
Geologists Studies in Geology Series, 17, p. 163-184.<br />
Keefer, W. R., 1970, Structural Geology of the Wind River Basin, Wyoming: U.S. Geological Survey<br />
Professional Paper 495-D, 35 p.<br />
Larson, E. E., Ozima, M., and Bradley, W. C., 1975, Late Cenozoic basin volcanism in northwestern<br />
Colorado and its implications concerning tectonism and the origins of the Colorado River<br />
System: in Curtis, B. F., ed., 1975, Cenozoic History of the Southern Rocky Mountains: The<br />
Geological Society of America Memoir 144, p. 155-178.<br />
Law, B. E., 1984, Relationships of source-rock, thermal maturity, and overpressuring to gas generation<br />
and occurrence in low-permeability Upper Cretaceous and Lower Tertiary rocks, Greater Green<br />
River Basin, Wyoming, Colorado and Utah: in Woodward, J., Meissner, F. F., and Clayton, J.<br />
L., eds., Hydrocarbon Source Rocks of the Greater Rocky Mountain Region: Rocky Mountain<br />
Association of Geologists, Denver Co., p. 469-490.<br />
Law, B. E., and Dickinson, W. W., 1985, Conceptual model for the origin of abnormally pressured gas<br />
accumulations in low-permeability reservoirs: American Association of Petroleum Geologists<br />
Bulletin, v. 69, no. 8, p. 1295-1304.<br />
Law, B. E., Spencer, C. W., and Bostick, N. H., 1979, Preliminary results of organic maturation,<br />
temperature, and pressure studies in the Pacific Creek area, Sublette County, Wyoming, in 5th<br />
DOE Symposium on Enhanced Oil and Gas Recovery and Improved Drilling Methods, Tulsa,<br />
Oklahoma, Proceedings, v. 3 - Gas and Drilling: Tulsa, Oklahoma, Petroleum Publishing Co.,<br />
p. 1-13.<br />
Law, B. E., Spencer, C. W., Charpentier, R. R., Crovelli, R. A., Mast, R. F., Dolton, G. L., and<br />
Wandrey, C. J., 1989, Estimates of gas resources in overpressured low-permeability Cretaceous<br />
and Tertiary sandstone reservoirs, Greater Green River Basin, Wyoming, Colorado, and Utah: in<br />
Eisert, J. L., ed; Gas Resources of Wyoming: Wyoming Geological Association Fourteenth<br />
Field Conference Guidebook, p. 39-61.<br />
MacGowan, D. B., Garcia-Gonzalez, M., Britton, D. R., and Surdam, R. C., 1993, Timing of<br />
hydrocarbon generation, organic-inorganic diagenesis, and the formation of abnormally pressured<br />
gas compartments in the Cretaceous of the Greater Green River Basin: a Geochemical Model: in<br />
Stroock, B., and Andrew, S., eds., Wyoming Geological Association Guidebook, Jubilee<br />
Anniversary Field Conference, p. 325-348.<br />
Mackenzie, M. G., Stratigraphy and petrology of the Mesaverde Group, southern part of the Bighorn<br />
Basin, Wyoming: Unpub. Ph.D. Thesis, Tulane University, New Orleans, Louisiana, 155p.<br />
Masters, J. A., 1979, Deep basin gas trap western Canada: American Association of Petroleum<br />
Geologists Bulletin, v. 63, no. 2, p. 151-181.<br />
McPeek, L. A., 1981, Eastern Green River Basin--a developing giant gas supply from deep,<br />
overpressured Upper Cretaceous sandstone: American Association of Petroleum Geologists<br />
Bulletin, v. 65, p. 1078-1098.<br />
Meissner, F. F., 1978, Patterns of source-rock maturity in non-marine source-rocks of some typical<br />
western interior basins in non-marine Tertiary and Upper Cretaceous source rocks and the<br />
occurrences of oil and gas in the west central U.S.: Rocky Mountain Association of Geologists<br />
Continuing Education Course Notes.
8<br />
Meissner, F. F., 1980, Examples of abnormal fluid pressure produced by hydrocarbon generation:<br />
American Association of Petroleum Geologists Bulletin, v. 65, p. 749.<br />
Meissner, F. F., 1981, Abnormal pressures produced by hydrocarbon generation and maturation and<br />
their relation to processes of migration and accumulation: American Association of Petroleum<br />
Geologists Bulletin, v. 65, p. 2467.<br />
Meissner, F. F., 1984, Cretaceous and Lower Tertiary coals as sources for gas accumulations in the<br />
Rocky Mountain area, in Woodward, Jane, Meissner, F. F., and Clayton, J. L., eds.,<br />
Hydrocarbon Source Rocks of the Greater Rocky Mountain Region: Rocky Mountain<br />
Association of Geologists, p. 401-431.<br />
Merry, R. D., and Larsen, V. E., 1982, Geologic investigation of the methane potential of western<br />
U.S. coalbeds: final report prepared for the Gas Research Institute under contract no. CE-807083,<br />
155 p.<br />
Pillmore, C. L., 1969, Geology and coal deposits of the Raton coal field, Colfax County, New<br />
Mexico: Mountain Geologist, v. 6, p. 125-142.<br />
Pillmore, C. E., and Maberry, J. O., 1976, Depositional environments and trace fossils of the Trinidad<br />
Sandstone, southern Raton Basin, New Mexico: in Ewing, R. C., and Kues, B. S., eds.,<br />
Guidebook to Vermejo Park Northeastern New Mexico: New Mexico Geological Society 27 th<br />
Field Conference, p. 191-195.<br />
Pillmore, C. E., and Flores, R. M., 1984, Field Guide and discussion of coal deposits, depositional<br />
environments and the Cretaceous –Tertiary boundary, southern Raton Basin: in Lintz, J., Jr.,<br />
ed., Western Geological Excursions: Geological Society of America Annual Meeting<br />
Guidebook, vol. 3, p. 1-51.<br />
Pillmore, C. E., and Flores, R. M., 1987, Stratigraphy and depositional environments of the<br />
Cretaceous-Tertiary boundary clay and associated rocks, Raton Basin, New Mexico and Colorado:<br />
in Fassett, J. E., and Rigby, J. K., Jr., eds., The Cretaceous-Tertiary Boundary in the San Juan<br />
and Raton Basins, New Mexico and Colorado: Geological Society of America Special Paper<br />
209, p. 111-130.<br />
Read, C. B., Duffney, R. T., Wood, G. H., Jr., and Zapp, A. D., 1950, Coal resources of New<br />
Mexico: U.S. Geological Survey Circular 89, 24 p.<br />
Reinecke, K. M., Rice, D. D., and Johnson, R. C., 1991, Characteristics and development of fluvial<br />
sandstone and coalbed reservoirs of Upper Cretaceous Mesaverde Group, Grand Valley Field,<br />
Garfield County, Colorado: in Schwochow, S. D., Murray, D. K., and Fahy, M. F., eds.,<br />
Coalbed Methane of Western North America: Rocky Mountain Association of Geologists 1991<br />
Guidebook, p. 209-225.<br />
Rose, P. R., Everett, J. R., and Merin, I. S., 1986, Potential basin-centered gas accumulation in<br />
Cretaceous Trinidad Sandstone, Raton Basin, Colorado: in Spencer, C. W., and Mast, R. F.,<br />
eds., Geology of Tight Gas Reservoirs: American Association of Petroleum Geologists Studies<br />
in Geology Series, 24, p. 111-128.<br />
Spencer, C. W., 1985, Geologic aspects of tight gas reservoirs in the Rocky Mountain region: Journal<br />
of Petroleum <strong>Technology</strong>, July, p. 1308-1314.<br />
Spencer, C. W., 1987, Hydrocarbon generation as a mechanism for overpressuring in the Rocky<br />
Mountain Region: American Association of Petroleum Geologist Bulletin, v. 71, p. 368-388.<br />
Spencer, 1989, Review of characteristics of low-permeability gas reservoirs in western United States:<br />
American Association of Petroleum Geologists, v. 73, no. 5, p. 613-629.<br />
Spencer, C. W., and Law, B. E., 1981, Overpressured, low-permeability gas reservoirs in Green River,<br />
Washakie, and Great Divide basins, southwestern Wyoming (abs.): American Association of<br />
Petroleum Geologists Bulletin, v. 65, p. 569.<br />
Steven, S. H., Lombardi, T. E., Kelso, B. S., and Coates, J. M., 1992, A geological assessment of<br />
natural gas from coal seams in the Raton and Vermejo formations, Raton Basin: Advanced<br />
Resources International, Inc., topical report prepared for the Research Institute under contract no.<br />
5091-214-2316, GRI 92/0345, 84p.<br />
Stevens, T. A., 1975, Middle Tertiary volcanic field in the southern Rocky Mountains: in Curtis, B.<br />
F., ed., Cenozoic History of the Southern Rocky Mountains: Geological Society of America<br />
Memoir 144, p. 75-94.
9<br />
Tschudy, R. H., Pillmore, C. I., Orth, C. J., Gilmore, J. S., and Knight, J. D., 1984, Disruptions of<br />
the terrestrial plant ecosystem at the Cretaceous-Tertiary Boundary, Western Interior: Science,<br />
vol. 225, no. 4666, p. 1030-1034.<br />
Tyler, R., Ambrose, W. A., Scott, A. R., and Kaiser, W. R., 1991, Coalbed methane potential of the<br />
Greater Green River, Piceance, Powder River and Raton basins: The University of Texas at<br />
Austin, Bureau of Economic Geology, topical report prepared for the Gas Research Institute<br />
under contract no. 5087-214-1544, GRI-91/0315, 244 p.<br />
Tyler, R., Kaiser, W. R., Scott, A. R., Hamilton, D. S., and Ambrose, W. A., 1995, Geologic and<br />
hydrologic assessment of natural gas from coal: Greater Green River, Piceance, Powder River,<br />
and Raton basins, Western United States: Bureau of Economic Geology, Austin, Texas, <strong>Report</strong><br />
of Investigations no. 228, 219 p.<br />
Wanek, A. A., 1963, Geology and fuel resources of the southwestern part of Raton coal field, Colfax<br />
County, New Mexico, U.S. Geological Survey Coal Investigations Map C 45.<br />
Yin, P., and Surdam, R., 1993, Diagenesis and overpressuring in the Almond Sandstone, Mesaverde<br />
Group, in Stroock, B., and Andrew, S., eds., Wyoming Geological Association Guidebook,<br />
Jubilee Anniversary Field Conference, p. 349-357.
Basin Axis<br />
Sangre De Cristo Mountains<br />
Stonewall<br />
0 15 Miles<br />
105°<br />
0 20 Kilometers<br />
Walsenburg<br />
Apishapa Arch<br />
Raton<br />
Sierra Grande Arch Las Animas<br />
Alluvium, slopewash, and<br />
landslide material<br />
Basalt flows<br />
Huerfano Formation<br />
Middle Tertiary intrusives<br />
Cuchara Formation<br />
Poison Canyon Formation<br />
Raton Formation<br />
Vermejo Formation<br />
Trinidad Sandstone and<br />
Pierre Shale undivided<br />
Pierre Shale/Niobrara undivided<br />
Precambrian rock undivided<br />
Raton Basin boundary<br />
Arch<br />
Colorado<br />
New Mexico<br />
N<br />
Colorado<br />
New<br />
Mexico<br />
Holocene and<br />
Quaternary<br />
}<br />
}<br />
Tertiary<br />
Cretaceous<br />
Raton Basin<br />
Figure 1: Generalized geologic map of the Raton<br />
Basin, Colorado and New Mexico. From Flores<br />
and Bader (1999).<br />
37°
TERTIARY<br />
MESOZOIC<br />
AGE<br />
PALEOCENE<br />
UPPER CRETACEOUS<br />
FORMATION NAME<br />
POISON CANYON<br />
FORMATION<br />
RATON<br />
FORMATION<br />
VERMEJO<br />
FORMATION<br />
TRINIDAD SANDSTONE<br />
PIERRE SHALE<br />
GENERAL DESCRIPTION<br />
SANDSTONE–Coarse to conglomeratic beds 13–50 feet<br />
thick. Interbeds of soft, yellow-weathering clayey<br />
sandstone. Thickens to the west at expense of<br />
underlying Raton Formation<br />
Formation intertongues with Poison Canyon Formation<br />
to the west<br />
UPPER COAL ZONE–Very fine grained sandstone,<br />
siltstone, and mudstone with carbonaceous shale<br />
and thick coal beds<br />
BARREN SERIES–Mostly very fine to fine grained<br />
sandstone with minor mudstone, siltstone, with<br />
carbonaceous shale and thin coal beds<br />
LOWER COAL ZONE–Same as upper coal zone; coal<br />
beds mostly thin and discontinuous. Conglomeratic<br />
sandstone at base; locally absent<br />
SANDSTONE–Fine to medium grained with mudstone,<br />
carbonaceous shale, and extensive, thick coal beds.<br />
Local sills<br />
SANDSTONE--Fine to medium grained; contains casts of<br />
Ophiomorpha<br />
SHALE--Silty in upper 300 ft. Grades up to fine grained<br />
sandstone. Contains limestone concretions<br />
{ {{<br />
LITH-<br />
OLOGY<br />
APPROX.<br />
THICKNESS<br />
IN FEET<br />
500+<br />
0?–2,100<br />
K/T Boundary<br />
0–380<br />
0–300<br />
1800-1900<br />
Figure 2: Generalized stratigraphic column for Cretaceous and Tertiary rocks in the Raton Basin. From<br />
Flores and Bader (1999), modified from Pillmore (1969), Pillmore and Flores (1987), and Flores (1987).
West East<br />
CRISTO MOUNTAINS<br />
COLO.<br />
N.MEX.<br />
w<br />
SANGRE DE<br />
0<br />
50 Miles<br />
0 50 Kilometers<br />
Coal<br />
Sandstone<br />
E<br />
Measured section<br />
Cross section<br />
N<br />
COLORADO<br />
NEW<br />
MEXICO<br />
INDEX MAP<br />
Siltstone and mudstone<br />
Poison Canyon Formation<br />
Basal Raton<br />
conglomerate<br />
VERMEJO FORMATION<br />
TRINIDAD SANDSTONE<br />
PIERRE SHALE<br />
See<br />
Figure SR-5 Sandstone-dominated<br />
interval<br />
Coarsening-upward<br />
megacycle<br />
Coarsening-upward<br />
megacycle<br />
RATON FORMATION<br />
Upper Coal Zone<br />
See Figure SR-4<br />
Lower Coal Zone<br />
Coarsening-upward<br />
megacycle<br />
Figure 3: East-west stratigraphic cross section across the southern part of the Raton Basin<br />
showing vertical and lateral variations in Upper Cretaceous and Paleocene rocks. The<br />
vertical variation is shown by the succession of coarsening-upward megacycles that<br />
divide the Cretaceous and Tertiary rocks. Modified from Flores (1987), Flores and<br />
Bader (1999).<br />
0<br />
300<br />
Feet
West East<br />
40 Feet<br />
1,000 Feet<br />
Coal<br />
Sandstone<br />
Siltstone and mudstone<br />
Measured section<br />
SUBSURFACE<br />
EROSIONAL<br />
Tin Pan<br />
Canyon coal<br />
SURFACE<br />
Potato<br />
Canyon coal<br />
SUBSURFACE<br />
Figure 4. Lateral and vertical variations of coal-bearing rocks in the lower part of the upper coal zone of the<br />
Raton Formation in the southern part of the basin. Modified from Strum (1984).
South North<br />
EROSIONAL<br />
SUBSURFACE<br />
York Canyon coal<br />
1,000 Feet<br />
SURFACE<br />
40 Feet<br />
Chimney Divide coal<br />
Coal<br />
Sandstone<br />
Siltstone and mudstone<br />
Measured section<br />
Figure 5. Lateral and vertical variations of coal bearing rocks in the upper part of the upper coal zone<br />
of the Raton Formation in the southern part of the basin. Modified from Strum (1984).
DOES THE FORBES FORMATION IN THE SACRAMENTO BASIN<br />
CONTAIN A<br />
BASIN-CENTER GAS ACCUMULATION ?<br />
ABSTRACT<br />
By Michael S. Wilson, Consulting Geologist<br />
Well data, structural cross sections and published studies of abnormal pressures, methane isotopes,<br />
vitrinite reflectance measurements and thermal maturity were evaluated to determine if a basin-center gas<br />
accumulation might exist within the Cretaceous-age Forbes Formation in the Sacramento Basin, California.<br />
The Forbes Fm is a mud-rich turbidite system with thick marine shale deposits and discontinuous sandstone<br />
lenses. At least twenty-seven natural gas fields have been discovered in the Forbes Fm, mainly in traditional<br />
structural and stratigraphic traps with distinct gas-water contacts.<br />
Previous studies of source rock organic content show that the Forbes Fm contains low levels of gasprone<br />
organic material, mainly dispersed fragments of lignite, wood and land plants. A recent study of the<br />
Dobbins Shale notes extensive bioturbation and lack of laminations, indicating oxidizing conditions.<br />
Studies of source rock quality in outcrops along the western flank of the basin found low organic content<br />
throughout the Upper Cretaceous section. Thermal gradients and bottom hole temperatures are unusually<br />
low in the Sacramento Basin. Published vitrinite reflectance profiles show that the Forbes is immature to<br />
sub-mature throughout most of the basin. All Forbes gas production comes from thermally immature<br />
sandstone reservoirs with low temperatures (0.9% at 15,000 ft and<br />
Ro > 3% at approximately 26,000 ft. The lower Forbes, Dobbins, Funks and Yolo shales are probably<br />
within the gas generation window. If these source rocks are rich enough to generate large quantities of gas, a<br />
basin-center gas system might exist in the deepest parts of the Delta Depocenter. Several exploration wells<br />
have been drilled to 14,000 - 15,059 ft in this area. Well histories, well logs and drill stem test results were<br />
reviewed for evidence of basin-center gas conditions near total depth. High drilling mud densities indicate<br />
overpressures, but high-pressure salt water was recovered in several formation tests. The Forbes Fm is<br />
evidently still water-saturated at this depth. The formation test data do not indicate basin-center gas<br />
conditions in the 14,000 - 15,000 foot depth range.<br />
1
An ultra-deep basin-center gas system might exist below 16,000 ft in the Delta Depocenter, if gas<br />
expelled from mature source rocks has extensively saturated and de-watered the reservoirs. However, the<br />
complex Midland and Kirby Hills Fault zones may provide permeable migration paths for gas to escape<br />
from this deep gas kitchen. The gas kitchen may have been breached by faulting, and may have failed to<br />
become a continuous, basin-center gas accumulation. There have not yet been any wells drilled deep enough<br />
to evaluate this gas kitchen. The possibility of a basin-center gas accumulation in the Delta Depocenter<br />
should be considered highly speculative.<br />
INTRODUCTION<br />
The Upper Cretaceous-age Forbes Formation contains thick, mud-rich turbidite deposits with numerous<br />
discontinuous sandstone lenses which have been important targets for natural gas exploration in the<br />
Sacramento basin, California (fig. 1). At least twenty-seven commercial fields have produced gas from the<br />
Forbes Fm (table 1). The lower Forbes Fm and the underlying Dobbins Shale are highly overpressured<br />
throughout much of the basin, and most of the produced gas is over-mature methane, without any oil or<br />
condensate. This unusual combination indicates that a basin-center gas accumulation (Spencer, 1987; 1989;<br />
Law and Dickinson, 1985) might exist somewhere within the hydrocarbon system.<br />
Well data, drill stem test results, structural cross sections and previous studies of thermal maturity and<br />
abnormal pressures have been reviewed and evaluated to determine if a basin-center gas accumulation might<br />
exist within the Forbes Fm and/or Dobbins Shale. Results of the evaluation are presented below. Some<br />
characteristics of the Forbes gas system fit the typical basin-center gas model, but many do not. It is<br />
unlikely that the Forbes is extensively gas-saturated. However, a ‘gas kitchen’ may exist deep within the<br />
Delta Depocenter, a fault-bounded structural depression in the southwestern Sacramento basin. There may be<br />
a localized basin-center gas accumulation within this sub-basin.<br />
GEOLOGIC SETTING<br />
The Sacramento basin (fig. 1) is a north-south trending fore-arc depocenter located along the east flank<br />
of the Sierra Mountains in northern California (Ingersoll and Dickinson, 1990; Cherven, 1983). It is<br />
flanked on the east by granitic rocks and on the west by folded metasediments of the Jurassic and<br />
Cretaceous-age Franciscan assemblage. The western margin of the basin (fig. 2) has been folded and uplifted<br />
by active, east-directed thrusting of wedges of Franciscan blueschists above an east-dipping subduction zone<br />
where the Farallon plate descends beneath the North American plate (Unruh and others, 1995; Unruh and<br />
Moores, 1992). The Mesozoic and Tertiary stratigraphy of the Sacramento Basin is shown in Figure 3. The<br />
Great Valley Sequence thickens from east to west, and includes Upper Jurassic, Lower Cretaceous, Upper<br />
Cretaceous and Tertiary sediments resting on Jurassic-age metamorphic and granitic basement.<br />
FORBES FORMATION<br />
The Upper Cretaceous, Campanian-age Forbes Formation is 3,000 to 5,000 feet thick, and has been<br />
interpreted as a mud-rich marine turbidite fan system (Imperato and others, 1990; Nilsen, 1990) which<br />
overlies the thin, regionally extensive Dobbins Shale of Santonian-Campanian-age. During Upper<br />
Santonian and Lower Campanian time, clastic sediments from the Klamath and Sierra Mountains were<br />
deposited in prograding deltas (Kione Fm) along the northeastern margin of the basin. Some sediments were<br />
carried into far out the basin as the slope and turbidite deposits of the Forbes Formation. The turbidites<br />
filled an extensive north-south trending submarine canyon incised into the underlying Funks Shale and<br />
Guinda Sandstone near Willows and Arbuckle Gas Fields (Williams and others, 1998).<br />
2
The Forbes Fm contains thick marine shales, discontinuous turbidite channels and crevasse splay<br />
deposits (Imperato and Nilsen, 1990; Garvey, 1983). Diagenesis and development of secondary porosity in<br />
Forbes sandstones has been described by Mertz (1990). Secondary porosity was formed by dissolution of<br />
biotite and feldspar grains and leaching of carbonate cements. Compaction caused significant reduction of<br />
porosity with increasing depth of burial. Log-derived porosity values reported for Forbes sandstone<br />
reservoirs (table 1) generally range from 17 to 30% (CDOG, 1981). These reported porosity values are two<br />
to five times higher than those typically reported in known basin-center gas accumulations.<br />
TRADITIONAL GAS TRAPS<br />
Natural gas has been produced from Forbes reservoirs in at least twenty-seven gas fields in the central<br />
and northern Sacramento Basin (fig. 1; table 1). Maps and cross sections of the producing fields (Bowen,<br />
1962; CDOG, 1981; Weagant, 1972; Imperato and Nilsen, 1990) generally show traditional structuralstratigraphic<br />
traps with updip permeability barriers such as sandstone pinch-outs or sand/shale<br />
juxtapositions across faults. Downdip producing limits are usually drawn as horizontal boundaries,<br />
implying gas/water contacts. Field descriptions frequently note distinct gas/water contacts. Maps and cross<br />
sections of Grimes Gas Field show numerous thin Forbes sandstone lenses with pinch-outs, faulted<br />
truncations and clearly marked gas/water contacts (Weagant, 1972). The Forbes reservoirs at Arbuckle Gas<br />
Field have traditional structural and stratigraphic traps, pressure depletion drives and distinct gas/water<br />
contacts (Imperato and Nilsen, 1990). Drill stem test results at Arbuckle Gas Field (table 1) include a range<br />
of gas, gassy salt water and completely salt water recoveries. The water is generally recovered from downdip<br />
locations. The deepest Forbes production listed by the California Division of Oil and Gas (1981, 1999) was<br />
from Clarksburg Gas Field (32-T7N-R4E), where thin sandstone lenses contain gas in a fault trap with a<br />
down-dip gas-water contact at 11,100 ft. The temperature in the Forbes reservoir was 182 °F, the average<br />
porosity was 22%, and the pressure gradient was only 0.46 psi/ft, indicating normal pressures.<br />
OVERPRESSURE IN THE FORBES<br />
Previous studies by Burns and Surdam (1999), Unruh and others. (1992), Horan (1992), Rymer and<br />
Ellsworth (1990), Price (1988, 1986), Lico and Kharaka (1983), Berry and Kharaka (1981), and Berry (1982,<br />
1973, 1965), have shown that the lower Forbes Formation and Dobbins Shale are overpressured throughout<br />
much of the central and southern Sacramento basin. The top of overpressure occurs near the top of the<br />
Dobbins Shale in the northern part of the basin (fig. 4) and is generally found within the Forbes and<br />
Winters Formations in the central and southern parts of the basin (Lico and Kharaka (1983).<br />
Pressure versus depth trends at the Arbuckle, Kirk, Buckeye and Grimes Gas Fields show rapid<br />
increases in pore pressure below 5500 feet (fig. 5). Pressure gradients often exceed 0.7 psi/ft below 7700 to<br />
8000 feet and approach lithostatic gradient below 9,000 ft (Berry, 1973; Price, 1986; Price, 1988).<br />
Commercial gas accumulations generally occur only within the moderately overpressured zones, where<br />
gradients range from 0.5 to 0.7 psi/ft (Price, 1986; Price, 1988). Zones with pressure gradients exceeding<br />
0.70 psi/ft are seldom productive. Yerkes et al. (1990) and Berry (1973) found severe overpressures in deep<br />
wells along the west side of the San Joaquin Valley to the south (fig. 5). The overpressure phenomenon is<br />
regionally extensive, cross-cuts stratigraphy, and does not appear to be restricted to a particular geologic<br />
formation.<br />
3
PRESSURE GRADIENTS AND PORE FLUIDS<br />
Table 2 contains mud weights, bottom hole temperatures, drill stem test initial shut-in pressures,<br />
calculated pressure versus depth gradients, and reported fluid recoveries from deep wells in Arbuckle, Kirk,<br />
Buckeye and Grimes Gas Fields and the Rumsey Hills area (Figure 1), where the Forbes Fm is generally<br />
overpressured. Well data were also evaluated for several Forbes penetrations in T17N-R2W, for several wells<br />
with published vitrinite profiles (Jenden and Kaplan, 1989), and for several deep wells in the Delta<br />
Depocenter (table 3). Fluid pressure gradients were calculated by dividing the initial shut-in pressure by the<br />
depth of the middle of the test interval, and generally range from 0.5 to 0.92 psi/ft. Most drill stem tests<br />
recovered overpressured gassy salt water (“fizz-water”). A few tests produce gas with very little water,<br />
indicating potential gas-producing reservoirs.<br />
High pressure salt water flows were noted in many drilling histories, indicating that drilling mud<br />
densities were not high enough to balance overpressures in the Forbes Fm. Carlson (1982) described several<br />
exploration wells in the Rumsey Hills area which encountered high pressure salt water flows. The drilling<br />
history of Texaco Arbuckle Unit #1 (Sec 18-T13N-R1W) contains several notations such as “dumped 60<br />
bbl salt water after trip” while the Forbes section was being penetrated (table 2). High pressure salt water<br />
flowed into the borehole while the pipe was run out of the hole for drill bit changes, indicating that the<br />
drilling mud was under-balanced.<br />
The drill stem test data presented in Tables 2 and 3 show that the pore fluid causing the overpressure in<br />
the Forbes Fm is generally gassy salt water, and rarely gas. The overpressured Forbes section appears to be<br />
extensively water-saturated. It has not become de-watered and gas-saturated like most typical basin-center<br />
gas accumulations (Spencer, 1989; Law and Dickinson, 1985).<br />
SALT WATER SPRINGS<br />
Perennial salt water springs and gas seeps have been found in several outcrops along the west side of<br />
the Sacramento Valley (Figure 2) where the Upper Cretaceous section dips eastward into the basin (Irwin<br />
and Barnes, 1975; Unruh and others, 1992; Davisson and others, 1994). Waters flowing from these springs<br />
are indistinguishable from formation waters produced from the gas fields in the deep basin. Most of the<br />
spring waters contain low concentrations of sodium chloride (lower than normal sea water) and are enriched<br />
in calcium and quartz. The calcium may be derived from active clay diagenesis and albitization of<br />
plagioclase in the subsurface. These springs are evidently the surface discharge vents for high pressure<br />
formation waters migrating updip from the deep basin. Davisson and others (1994) suggested that some<br />
spring waters may originate as deep as 4 km, and flow updip through the fractured cores of deep anticlinal<br />
folds and fault zones. Berry (1982, 1986) noted that fractures and fault zones within the Forbes section<br />
provide permeable conduits for the migration of deep, high pressure formation waters.<br />
4
CAUSE OF OVERPRESSURE<br />
Previous authors (Berry, 1973; Berry, 1965; Berry and Kharaka, 1981; Lico and Kharaka, 1983;<br />
Davisson and others, 1994) considered the most important causes of overpressure in the Forbes to be<br />
tectonic compression and aquathermal pressuring. Berry (1973) identified a north-south trending zone 400 to<br />
500 miles long and 25 to 80 miles wide along the west side of the Sacramento and San Joaquin basins<br />
where near-lithostatic pore pressure gradients have been encountered in deep wells. He suggested that<br />
overpressuring was caused by tectonic compression of Cretaceous and Tertiary sediments crushed between<br />
the folded Franciscan blueschists on the west (fig. 2) and the Sierran granite on the east. High fluid<br />
potentials result from formation water being squeezed out of the thick, compressible Cretaceous and Tertiary<br />
shales. Direct evidence of active tectonic compression includes visible anticlinal folds and recent earthquake<br />
data, especially the Winters/Vacaville earthquake in 1892 (Unruh and others, 1995) and the Coalinga<br />
earthquake of 1983 (Yerkes and others, 1990). High fluid pressures probably assist the thrusting by sliding<br />
friction and facilitating movement along the deep faults.<br />
Price (1986) analyzed DST results, mud weights, shale resistivities and sonic transit times in Forbes<br />
reservoirs at Grimes Gas Field. She discovered that pore pressures calculated from shale compaction data<br />
were consistently lower than pressures measured by drill stem tests at the same depth. Due to this<br />
discrepancy, Price concluded that under-compaction was not the most significant cause of overpressure in<br />
this area. She suggested that tectonic compression and smectite dehydration may be more important causes<br />
of overpressuring in the Sacramento basin.<br />
HYDROCARBON SOURCE ROCKS<br />
Previous analyses of source rock potential in the Cretaceous-age shales outcropping along the west side<br />
of the basin (Trask and Hammar, 1934) showed low total organic content throughout the entire Cretaceous<br />
section. They noted a “discouraging” lack of thick, distinct organic-rich source rock layers. Organic content<br />
ranged from 0.6 to 1.0 % throughout the section. Kirby (1943) described massive, green-gray colored<br />
carbonaceous shale beds in the Forbes Formation and blue-gray colored shale with tan limestone concretions<br />
in the Dobbins Shale section. Kirby described thin beds of gray carbonaceous shale in the Guinda Fm,<br />
greenish gray shale and siltstone in the Funks Fm, and more shale in the Yolo Fm. None of these shale<br />
units were described as black colored or ‘sooty’ or unusually rich in organic material. These outcrop studies<br />
indicate lean, poor quality source rocks.<br />
Jenden and Kaplan (1989) analyzed organic matter from cuttings and cores in five wells and noted that<br />
source rocks in the Upper Cretaceous section have generally low total organic content (range = 0.2 to 2.0%,<br />
average = 1.0% TOC). Organic content in the Forbes Fm and Dobbins Shale ranged from 0.5 to 1.8%<br />
TOC. Older shales in the Funks, Sites and Venado Formations contained 1.1 to 1.3 % TOC. Most of the<br />
organic matter consists of gas-prone woody material and plant fragments. Several mudlogs and core<br />
descriptions reviewed for this study noted dispersed fragments of lignite and carbonaceous material in the<br />
Forbes, Dobbins and Guinda shales. A study of the Dobbins Shale by Trosper (1985) described limey,<br />
concretionary mudstone with extensive bioturbation and well preserved calcareous foraminifera. The<br />
Dobbins Shale was evidently deposited in an oxidizing environment and is bioturbated, indicated suboptimal<br />
conditions for the preservation of organic material.<br />
5
TEMPERATURE GRADIENTS<br />
Subsurface temperature gradients are relatively low in the Great Valley, ranging from 15 to 25 °C/km<br />
in the northern and central Sacramento basin and from 25 to 35 °C/km in the southwestern part (Yerkes and<br />
others., 1990; Lico and Kharaka, 1983; Price 1986). Horan (1992) described an average temperature gradient<br />
of 1.2 °F/100 ft in the Forbes Fm. Price (1986) found a shallow thermal gradient of 1.02 °F/100 ft and a<br />
deep gradient of 1.4 °F/100 ft in the Forbes at South Grimes Field. With these gradients, relatively deep<br />
burial would be needed for thermogenic gas generation.<br />
THERMAL MATURITY<br />
Berry (1986) and Horan (1990) noted that kerogen in the Forbes Fm is generally not sufficiently mature<br />
to generate hydrocarbon gases, and suggested that gas produced from the Forbes Fm has migrated long<br />
distances. Five published vitrinite profiles (Jenden and Kaplan, 1989, p. 436-437) indicate that the Forbes<br />
Fm is thermally immature throughout most of the basin, especially along the east side. They stated (p.<br />
443) that all of the gas fields in the Sacramento basin produce from thermally immature strata.<br />
Temperature data are listed in Tables 1 and 2. All of the Forbes gas fields (CDOG, 1981) and all the<br />
Forbes wells listed in Table 2 have bottom hole temperatures less than 190 °F. Bottom hole temperatures<br />
exceeding 200 °F were reported only in the Delta Depocenter (table 3). Vitrinite reflectance values greater<br />
than 0.7% were found only in two deep wells in the Delta Depocenter. These were used to constrain the<br />
thermal maturity model described below.<br />
METHANE ISOTOPES<br />
Gas samples from 94 producing wells were analyzed by Jenden and Kaplan (1989). The methane<br />
contains mixtures of immature biogenic (microbial) methane with light isotopic values, and overmature,<br />
thermogenic methane with very heavy isotope values. The overmature methane has apparently migrated<br />
long distances from deeply buried gas sources. Berry (1965, 1986) suggested that methane gas has migrated<br />
long distances from a deep gas kitchen to shallower, lower pressure gas traps via aqueous solution. The<br />
high percentage of methane gas and lack of heavier gases may be the result of selective dissolution.<br />
Methane is easily dissolved and transported in formation water. Heavier gases which could not be dissolved<br />
as easily may have been left behind near the gas kitchen. Horan (1992) noted the occurrence of gas<br />
condensates in fields near the Delta Depocenter and the absence of condensate elsewhere in the basin. Jenden<br />
and Kaplan (1989) noted the local occurrence of wet gases and condensates in the Delta Depocenter, west of<br />
the Midland Fault.<br />
DISCUSSION: BASIN-CENTER GAS MODEL DOES NOT FIT HERE<br />
The Forbes gas system has several characteristics of a typical basin-center gas accumulation, but many<br />
which don’t fit the model. The lower Forbes Fm and Dobbins Shale appear to be extensively overpressured,<br />
but the pressuring fluid is generally gassy salt water. The primary cause of overpressuring appears to be<br />
tectonic compression, not hydrocarbon saturation. Thick, rich source beds are conspicuously absent in the<br />
Upper Cretaceous section. Total organic carbon content is generally low, and is mainly plant and woody<br />
material. Regional temperature gradients are unusually low. Published vitrinite profiles indicate that the<br />
Forbes Fm is thermally submature to immature throughout most of the basin. The profiles indicate only<br />
two locations where %Ro exceeds 0.7%, whereas most known basin-center gas accumulations have vitrinite<br />
values exceeding 0.9% and often reaching 1 to 3%. All Forbes gas production has been from reservoirs with<br />
temperatures less than 190 °F, whereas most known basin-center gas accumulations are hotter than 190 to<br />
200 °F.<br />
6
Forbes gas is mostly methane, with some nitrogen. The methane consists of mixed biogenic gas and<br />
overmature, thermogenic methane which has apparently migrated long distances; whereas most basin-center<br />
gas accumulations are charged with thermogenic hydrocarbons expelled from nearby source rocks. Forbes<br />
gas accumulations have generally been found in traditional structural and stratigraphic traps with distinct<br />
gas/water contacts. Forbes sandstone porosities are relatively high (17 - 30%), much higher than typical<br />
porosity ranges in known basin-center gas accumulations. There do not appear to be any sub-normally<br />
pressured zones within the Forbes Fm. The Forbes Fm evidently does not contain a basin-center gas<br />
system in the central, northern or eastern parts of the basin.<br />
DELTA DEPOCENTER<br />
Berry (1981), Horan (1992) and Magoon (1994) suggested that the Delta Depocenter (Figure 1), located<br />
near the Kirby Hills and Rio Vista Gas Fields, may contain the ‘gas kitchen’ where much of the gas in the<br />
Sacramento Basin was generated. Published structural maps and cross sections (MacKevett, 1990; Johnson,<br />
1990; Krug and others, 1992) show a small, deep wrench basin bounded by the Kirby Hills Fault on the<br />
west and the Midland Fault on the east. Some authors have interpreted strike-slip motion along the Kirby<br />
Hills Fault. Mackvett (1990) interpreted these faults to be listric growth faults with opposite vergence<br />
(Figure 6). The top of the Forbes Fm is approximately 16,000 ft deep in this depression. The Dobbins<br />
Shale may be 18,000 to 20,000 ft deep, and older Cretaceous units such as the Funks Fm and Yolo Shale<br />
may be buried 23,000 to 27,000 ft deep, depending on westward thickening of the Cretaceous section.<br />
THERMAL MATURITY MODEL<br />
A thermal maturity model was constructed for the deepest part of the Delta Depocenter, using Basin-<br />
Mod software. The model is located in T4N-1E along an east-west cross section (fig. 6) modified after<br />
MacKevett (1990). Formation tops and bottom hole temperatures were verified by checking several<br />
annotated well logs available from MJ Microfiche, Inc. Projected depths for the Cretaceous units below the<br />
Forbes Fm are based on thicknesses of measured outcrop sections (Ojakangas, 1968; Kirby, 1943).<br />
Published source rock data, temperature gradients (Lico and Kharaka, 1983; Price, 1986) and a nearby<br />
vitrinite reflectance profile (Jenden and Kaplan, 1989) were used to calibrate the model.<br />
The thermal maturity model (fig. 7a, 7b) indicates that vitrinite reflectance may reach 0.9 %Ro in the<br />
Upper Cretaceous Winters Fm at approximately 15,000 ft deep. The 2.0 %Ro level probably occurs in the<br />
Funks Shale at approximately 22,000 ft. The 3.0 % reflectance level is reached near the top of the Venado<br />
Fm at 26,000 ft, and 4.0 %Ro is reached in the Lower Cretaceous section at approximately 30,000 ft.<br />
Significant gas generation and expulsion for the gas-prone, Type III organic material found in the<br />
Cretaceous rocks probably starts at about 0.9 %Ro (Leckie and others, 1988, p.824). Peak dry gas<br />
generation probably occurs at 1.2 to 2 %Ro. The maturity model shows that much of the Forbes Fm may<br />
be within the gas generation window below 16,000 ft. The Lower Forbes, Dobbins, Funks and Yolo shales<br />
are apparently within the peak gas generation window (%Ro greater than 1.2) below 18,000 ft. The burial<br />
history diagram indicates that these formations may have been generating dry gas since mid-Eocene time.<br />
The thermal maturity model indicates that a gas kitchen is probably located within the Delta Depocenter. If<br />
the source rocks are rich enough, and if the gas system has not been breached by recent strike-slip faulting,<br />
there might be a basin-center gas accumulation deep in this sub-basin.<br />
7
DEEP DRILLING RESULTS<br />
Several deep wells in the Delta Depocenter area reached 12,000 to 15,059 ft total depth. Well logs,<br />
drilling histories and test data for these wells were examined for evidence of possible basin-center gas<br />
conditions. DST pressure gradients, bottom hole temperatures and comments are listed in Table 3. Six<br />
wells reached the 14,000 to 15,059 ft depth range. Two of these were plugged back without any formation<br />
tests in the deep section. Two drill stem tests in the 14,700- 14,800 ft range (Cook 13 and Cook 15)<br />
recovered drilling mud or gassy mud, indicating tight reservoirs. Four deep drill stem tests recovered high<br />
pressure salt water (Cook 14 at 14,840 ft; Cook 15 at 14,215’; Cook 16 at 14,770’; Cook 16 at 14,255’).<br />
These few test recoveries indicate that the Forbes Fm is probably water-saturated, not continuously gassaturated,<br />
in the 14,000 to 15,000 ft depth range. The bottom hole temperatures (table 3) exceed the 190-<br />
200 °F threshold, which often coincides with the tops of basin-center gas accumulations (Law and<br />
Dickinson, 1985; Spencer, 1987, 1989), but these Forbes reservoirs flowed high pressure salt water. There<br />
is no convincing evidence from these deep exploratory wells to indicate that a basin-center gas accumulation<br />
exists within the 14,000 to 15,000 ft range. The source rocks might be too lean to have generated enough<br />
gas to saturate the reservoirs at this depth.<br />
ULTRA-DEEP BASIN-CENTER GAS ?<br />
Perhaps the peak gas generation window is even deeper. The thermal maturity model (fig. 7) indicates<br />
that the gas-window extends through depths greater than 16,000 ft. If rich, thermally mature source rocks<br />
have expelled enough gas to de-water the reservoirs, a localized, continuous basin-center gas accumulation<br />
might be present in this part of the basin. Figure 8 shows the approximate outline of a hypothetical, highly<br />
speculative basin-center gas system which might exist below 16,000 ft. The map shows a deep, narrow,<br />
NNW-SSE trending depression between the Midland and Kirby Hills Faults, based on structural<br />
interpretations by MacKevett (1992) and Krug and others (1992). The top of the Forbes Fm is probably<br />
15,000 to 16,000 ft deep in this highly faulted area.<br />
No wells have been drilled deep enough to evaluate this potential basin-center gas system. The high<br />
pressure salt water flows encountered in the Standard Oil Cook 14, 15 and 16 wells may have discouraged<br />
deep drilling in this area. The preservation of seals above the deep gas kitchen is a significant risk. Active<br />
strike-slip faulting may have breached the system, and much of the gas may have escaped.<br />
8
CONCLUSIONS<br />
Well data, drill stem test results, structural cross sections and previous studies of abnormal pressures,<br />
methane isotopes and thermal maturity were evaluated to determine if a basin-center gas accumulation might<br />
exist within the Upper Cretaceous-age Forbes Formation in the Sacramento basin, California. The Forbes<br />
Fm is overpressured in the central and southern parts of the basin, and produces methane gas from many<br />
sandstone reservoirs within an extensive, mud-rich turbidite fan system. Some characteristics of the Forbes<br />
Formation and its associated gas production indicate a possible basin-center accumulation, but many do not<br />
appear to fit the typical model. Bottom hole temperatures and measured vitrinite reflectances are low, and<br />
the Forbes appears to be thermally immature throughout most of the basin. The pore fluid causing the<br />
overpressure is usually gassy salt water. Drill stem tests and drilling mud weights indicate extensive<br />
overpressures, with gradients ranging from 0.5 to 0.92 psi/ft. Formation tests often recover abundant highpressure<br />
salt water.<br />
Methane gas in Forbes reservoirs is usually a mixture of immature biogenic gas and overmature,<br />
thermogenic methane which apparently migrated long distances from a deep gas kitchen. The gas traps<br />
discovered to date have generally been traditional structural and stratigraphic traps with distinct gas/water<br />
contacts. It is unlikely that the Forbes section is extensively gas-saturated. The geologic evidence does not<br />
indicate a basin-center gas accumulation within the Forbes Formation in the central, northern or eastern<br />
Sacramento Basin.<br />
Previous authors have suggested that a ‘gas kitchen’ may exist deep within the fault-bounded Delta<br />
Depocenter in the southwestern part of the basin. Much of the basin’s hydrocarbons may have been<br />
generated and expelled from this structural depression. A thermal maturity model was constructed using<br />
Basin Mod software, deep well data, published cross sections, thermal gradients and vitrinite profiles. The<br />
Forbes Fm may be within the gas generation window from 16,000 to 20,000 ft. A highly speculative,<br />
localized basin-center gas accumulation might exist deep in the Delta Depocenter. Several exploratory wells<br />
have been drilled as deep as 15,059 ft in this area, but drill stem tests recovered high pressure salt water or<br />
drilling mud. No wells have been drilled deep enough to evaluate the potential basin-center gas<br />
accumulation in this relatively narrow wrench basin. The gas kitchen may have been breached by active<br />
strike-slip faults.. If the source rocks were too lean or if too much gas escaped, continuous, gas-saturated<br />
basin-center gas conditions might not have developed here. The existence of a basin-center gas accumulation<br />
in the Delta Depocenter should be considered highly speculative. Deeper exploratory drilling (>16,000 ft)<br />
would be needed to evaluate this possibility.<br />
9
REFERENCES CITED<br />
Barker, C., 1972, Aquathermal Pressuring - Role of Temperature in Development of Abnormal-<br />
Pressure Zones: AAPG Bulletin v. 56, no. 10, p. 2068-2071.<br />
Berry, F.A., 1965, Origins of Nitrogen-Methane Gas and Anomalously High Fluid Pressures,<br />
Sacramento Valley, California: AAPG Bulletin v. 49, p. 1757 (abs).<br />
Berry, F.A., 1973, High Fluid Potentials in California Coast Ranges and their Tectonic Significance:<br />
AAPG Bulletin, v. 57, p. 1219-1249.<br />
Berry, F.A., 1982, Subsurface Temperatures, Sacramento Valley, California: Guide to F-Zone(Forbes)<br />
Gas Accumulations: AAPG Bulletin v. 66, no. 5 p. 549 (abs).<br />
Berry, F.A., 1986, Origins of Traps and Gases; temperature Anomalies in F-Zone Overpressured Gas<br />
Accumulations, Sacramento Valley, California: AAPG Bulletin, v. 70, no. 7, p. 939 (abs).<br />
Berry, F.A. and Kharaka, Y., 1981, Origins of Abnormally-High Fluid-Pressure Systems in California:<br />
GSA Abstracts with Programs, v. 13, no. 7, p. 409.<br />
Bowen, O.E., 1962, ed., Geologic Guide to the Gas and Oil Fields of Northern California: California<br />
Division of Mines and Geology Bulletin 181, 412 p.<br />
Burns, D.M. and Surdam, R.C., 1999, A Sonic Anomaly Study of the Sacramento basin, California:<br />
AAPG Bulletin, v. 83, p. 1180 (abs).<br />
California Division of Oil and Gas, 1981, California Oil and Gas Fields, Northern California, Vol. 3.<br />
California Division of Oil and Gas, 1999, online database listing gas production and gas field data.<br />
Carlson, C.R., 1982, Oils Seeps and Early Petroleum Development in Northern California: in Bowen,<br />
O.E., 1962, ed., Geologic Guide to the Gas and Oil Fields of Northern California: California<br />
Division of Mines and Geology Bulletin 181, p. 23-30.<br />
Cherven, V.B., 1983, Mesozoic through Paleogene Evolution of the Sacramento Basin, California: in<br />
Cherven, V.B. and Graham, S.A. eds., Geology and Sedimentology of the Southwestern<br />
Sacramento Basin and East Bay Hills: AAPG Pacific Section Field Trip Guidebook, p. 21-31.<br />
Davis, T.B., 1984, Subsurface Pressure Profiles in Gas-Saturated Basins: in Masters, J. A., ed,<br />
Elmworth- Case Study of a Deep Basin Gas Field: AAPG Memoir 38, p. 189-203.<br />
Davisson, M.L., Presser, T.S. and Criss, R.E., 1994, Geochemistry of Tectonically Expelled Fluids<br />
from the Northern Coast Ranges, Rumsey Hills, California, USA: Geochimica et<br />
Cosmochimica Acta, v. 58, p. 1687-1699.<br />
Garvey, T.P., 1983, Hydrocarbon Accumulations in Turbidite and Contourite Sands of Upper<br />
Cretaceous Forbes Formation, Bounde Creek Gas Field, California: AAPG Bulletin v. 67, no.<br />
3, p. 468 (abs)<br />
Horan, E.P., 1990, Natural Gas Distribution, Entrapment and Production Phenomenon within the<br />
Upper Cretaceous Forbes Formation Depositional System, Northern Sacramento Basin, CA.:<br />
AAPG Bulletin v.74, no. 5, p. 677 (abs).<br />
10
Horan, E.P., 1992, Pressure-Temperature, Structural Trends and Natural Gas Distribution in the<br />
Sacramento Basin, Northern California: in Cherven, V.B. and Edmonson, W.F., eds, 1992,<br />
Structural Geology of the Sacramento Basin, AAPG Pacific Section Misc. Pub. 41, p. 158<br />
(abs).<br />
Imperato, D.P. and Nilsen, T.H., 1990, Deep-Sea-Fan Channel-Levee Complexes, Arbuckle Field,<br />
Sacramento Basin, California: in Barwis, J.H., McPherson, J.G., and Studlick, R.J., eds.,<br />
Sandstone Petroleum Reservoirs, p. 535-555.<br />
Imperato, D.P., Nilsen, T. H., and Moore, D.W., 1990, Regional Stratigraphy of the Mud-Rich<br />
Turbidite System of the Forbes formation, Sacramento Basin, California: in Ingersoll, R.V. and<br />
Nilsen, T.H., eds, Sacramento Valley Symposium and Guidebook: Pacific Section SEPM Book<br />
65, p. 69-79.<br />
Ingersoll, R.V. and Dickinson, W.R., 1990, Great Valley Group (Sequence), Sacramento Valley,<br />
California: in Ingersoll, R.V. and Nilsen, T.H., eds, Sacramento Valley Symposium and<br />
Guidebook: Pacific Section SEPM Book 65, p. 183-215.<br />
Irwin, W. P. and Barnes, I., 1975, Effects of Geologic Structure and metamorphic Fluids on Seismic<br />
Behavior of the San Andreas Fault System in Central and Northern California: Geology, v. 3, p.<br />
713-716.<br />
Jenden, P.D., and Kaplan, I.R., 1989, Origin of Natural Gas in Sacramento Basin, California: AAPG<br />
Bulletin, v.73, no. 4, p. 431-453.<br />
Jenden, P.D., Kaplan, I.R., Poreda, R.J. and Graig, H., 1988, Origin of Nitrogen-Rich Gases in the<br />
California Great Valley: Evidence from Helium, Carbon and Nitrogen Isotope Ratios:<br />
Geochimica et Cosmochimica Acta, v. 52, p. 851-861.<br />
Johnson, D.S., 1992, Tectonic Effects on the Upper Cretaceous and Paleogene Stratigraphy along the<br />
Midland Fault System, Southern Sacramento Basin, California: in Cherven, V.B. and<br />
Edmonson, W.F., eds, 1992, Structural Geology of the Sacramento Basin, AAPG Pacific<br />
Section Misc. Pub. 41, p. 15-25.<br />
Kirby, J.M., 1943, Upper Cretaceous Stratigraphy of West Side of Sacramento Valley South of<br />
Willows, Glen County, California: AAPG Bulletin v. 27, no. 3, p. 279-305.<br />
Krug, E.H., Cherven, V.B., Hatten, C.W., and Roth, J.C., 1992, Subsurface Structure in the<br />
Montezuma Hills, Southwestern Sacramento Basin: in Cherven, V.B. and Edmonson, W.F.,<br />
eds, 1992, Structural Geology of the Sacramento Basin, AAPG Pacific Section Misc. Pub. 41,<br />
p. 41-60.<br />
Law, B.E. and Dickinson, W.W., 1985, Conceptual Model for Origin of Abnormally Pressured Gas<br />
Accumulations in Low-Permeability Reservoirs: AAPG Bulletin, v. 69, no. 8 p. 1295-1304.<br />
Law, B.E. and Spencer, C.W., 1993, Gas in Tight Reservoirs - An Emerging Major Source of <strong>Energy</strong>:<br />
in Howell, D.G., Editor, The Future of <strong>Energy</strong> Gases, U. S. Geological Survey Professional<br />
Paper 1570, p. 233-252.<br />
Leckie, D.A., Kalkreuth, W.D., and Snowdon, L.R., 1988, Source Rock Potential and Thermal<br />
Maturity of Lower Cretaceous Strata: Monkman Pass Area, British Columbia: AAPG Bulletin,<br />
v. 72, no. 7, p. 820-838.<br />
11
Lico, M.S. and Kharaka, Y.K., 1983, Subsurface Pressure and Temperature Distributions in<br />
Sacramento Basin, California: in Hester, R.L. and Hallinger, D.E., eds., Selected Papers of the<br />
Pacific Section AAPG 1983 Annual Meeting, Sacramento, California, p. 57-75.<br />
Magoon, L.B., 1994, Two Petroleum Systems in the Sacramento Basin, California: a Basis for New<br />
Discoveries: AAPG Bulletin v. 78, no. 4, p. 669 (abs).<br />
Masters, J.A., 1979, Deep Basin Gas Trap, Western Canada: AAPG Bulletin, v. 63, no. 2, p. 152-181.<br />
Mertz, K.A., 1990, Summary of the Diagenetic History of the Upper Cretaceous Forbes, Starkey, and<br />
Winters Formations, Sacramento Basin, California: in Ingersoll, R.V. and Nilsen, T.H., eds,<br />
Sacramento Valley Symposium and Guidebook: Pacific Section SEPM Book 65, p. 53-67<br />
Nilsen, T.H., 1990, Santonian, Campanian, and Maestrichtian Depositional Systems, Sacramento<br />
Basin, California: in Ingersoll, R.V. and Nilsen, T.H., eds, Sacramento Valley Symposium and<br />
Guidebook: Pacific Section SEPM Book 65, p. 95-132.<br />
Ojankangas, R.W., 1968, Cretaceous Sedimentation, Sacramento Valley, California: GSA Bulletin, v.<br />
79, p. 973-1108.<br />
Price, C.A., 1986, Fluid Pressure Analysis of Sandstones in the Overpressured Forbes Formation;<br />
Southern Grimes Gas Field, Sacramento Valley, California: M. Sc. Thesis, San Diego State<br />
University, San Diego, CA., 257 p.<br />
Price, C.A., 1988, Fluid Pressures in Overpressured Forbes Formation, Sacramento Valley, California:<br />
AAPG Bulletin v. 72, no. 3, p. 391 (abs).<br />
Spencer, C.W., 1987, Hydrocarbon Generation as a Mechanism for Overpressuring in Rocky Mountain<br />
Region: AAPG Bulletin v. 71, no. 4, p. 368-388.<br />
Spencer, C.W., 1989, Review of Characteristics of Low Permeability Gas Reservoirs in the Western<br />
United States: AAPG Bulletin v. 73, no. 5, p. 613-629.<br />
Trosper, E. and Douglas, R., 1985, Paleoenvironments of Forbes Formation: AAPG Bulletin v. 69,<br />
no. 4 p. 681 (abs).<br />
Trask, P.D. and Hammar, H.E., 1934, Preliminary Study of Source Beds in Late Mesozoic Rocks on<br />
West Side of Sacramento Valley, California: AAPG Bulletin v. 18, no. 10, p. 1346-1373.<br />
Unruh, J.R., Davisson, M.L., Criss, R.E., and Moores, E.M., 1992, Implications of Perennial<br />
Springs for Abnormally High Fluid Pressures and Active Thrusting in Western California:<br />
Geology, v. 20, p. 431-434.<br />
Unruh, J.R., 1992, Quaternary Blind Thrusting in the Southwestern Sacramento Valley, California:<br />
Tectonics, v. 11, no. 2, p. 192-203.<br />
Unruh, J.R., Loewen, B.A., and Moores, E.M., 1995, Progressive Arcward Contraction of a Mesozoic-<br />
Tertiary Fore-arc Basin, Southwestern Sacramento Valley, California: GSA Bulletin, v. 107, no.<br />
1, p. 38-53.<br />
Weagant, F.E., 1972, Grimes Gas Field, Sacramento Valley, California: in King, R. E., ed.,<br />
Stratigraphic Oil and Gas Fields - Classification, Exploration Methods and Case Histories:<br />
AAPG Memoir 16, p. 428-439.<br />
12
Williams, T.A., Graham, S.A., and Constenius, K.N., 1998, Recognition of a Santonian submarine<br />
canyon, Great Valley Group, Sacramento basin, California: implications for petroleum<br />
exploration and sequence stratigraphy of deep marine strata: AAPG Bulletin, v. 82, no. 8, p.<br />
1575-1595.<br />
Yerkes, R.F., Levine, P., and Wentworth, C.M., 1990, Abnormally High Fluid Pressures in the<br />
Region of the Coalinga Earthquake Sequence and their Significance: in Rymer, M.J. and<br />
Ellsworth, W.L., 1990, The Coalinga, California, Earthquake of May 2, 1983: U. S. Geological<br />
Survey Professional Paper 1487, p. 235-256.<br />
13
Conceptual models of basin-center gas accumulations have been described by Masters (1979), Davis<br />
(1984), Law and Dickinson (1985), Spencer (1987), Spencer (1989) and Law and Spencer (1993). Key<br />
components of a basin-center gas accumulation include:<br />
1) Extensive abnormal pressure, either overpressure or subnormal pressure.<br />
2) Present day reservoir temperatures are at least 190 - 200 °F (88 - 93 °C).<br />
3) Organic-rich source rocks with minimum vitrinite reflectance of 0.8% for gas-prone source<br />
material. Many basin-center gas accumulations are in rocks with vitrinite reflectance in the 1 to<br />
3% range.<br />
4) Rich source beds have generated enough gas to cause pore pressures to rise above normal pressure<br />
gradients (> 0.43 psi/ft). Temperature-induced hydrocarbon generation forces water out of pore<br />
spaces and saturates the reservoirs with hydrocarbons. Water saturations decline to irreducible<br />
levels. Overpressure is sustained by hydrocarbon generation at rates exceeding escape.<br />
5) Pressure gradients rise to the lowest fracture gradients in the rock sequence. High pore pressures<br />
fracture the rocks and create migration pathways for hydrocarbons to escape. Cementation<br />
episodically closes the fractures.<br />
6) Hydrocarbons (oil and/or gas) are the primary fluid-pressuring phase. Little or no water is produced<br />
from the overpressured reservoirs. However, water may intrude via fractures and more permeable<br />
beds as reservoir pressure is reduced.<br />
7) Reservoirs are frequently in tight sandstone with heavy cementation, low porosity (3 - 14 %) and<br />
very low permeability (usually < 0.1 md).<br />
8) Uplift and erosion of the basin may result in unloading, cooling, pore expansion and gas escape,<br />
leading to development of sub-normally pressured reservoirs in zones which were previously<br />
overpressured.<br />
9) Overpressured and/or sub-normally pressured gas reservoirs generally occur downdip from normally<br />
pressured reservoirs with water drive mechanisms.<br />
14
40° 00'<br />
39° 30'<br />
39° 00'<br />
A<br />
122° 30'<br />
38° 30'<br />
KIRKWOOD<br />
WILLOWS FAULT<br />
B<br />
MALTON-<br />
BLACK BUTTE<br />
WILLOWS-<br />
BEEHIVE BEND<br />
BOUNDE CREEK<br />
STEGEMAN<br />
COMPTON<br />
LANDING<br />
38° 00'<br />
ARTOIS<br />
WILLIAMS<br />
MOON BEND<br />
SYCAMORE<br />
GRIMES, W.<br />
ARBUCKLE<br />
122° 00'<br />
RANCHO<br />
CAPAY<br />
BUCKEYE<br />
DUNNIGAN<br />
HILLS<br />
C<br />
APTON<br />
37 30'<br />
122° 00'<br />
DDC<br />
GRIMES<br />
KIRK<br />
SACRA MENTO RIVER<br />
RIO<br />
VISTA<br />
SUTTER<br />
BUTTES<br />
ROBBINS<br />
C'<br />
B'<br />
KLAMATH<br />
MTS.<br />
COAST<br />
FREEPORT<br />
CLARKSBURG POPPY RIDGE<br />
MIDLAND FAULT<br />
STOCKTON<br />
121° 30'<br />
SAN<br />
A'<br />
SACRAMENTO<br />
FAULT<br />
JO AQUIN R.<br />
RANGES<br />
SIERRA NEVADA MTS.<br />
CALIFORNIA<br />
CENOZOIC VOLCANICS<br />
UPPER MESOZOIC GREAT<br />
VALLEY SEQUENCE<br />
SIERRAN BASEMENT<br />
ROCKS<br />
0 5 10<br />
MILES<br />
15 20<br />
Figure 1. Map of Sacramento basin showing gas fields which have produced from the Forbes Formation.<br />
Locations of cross sections A-A’, B-B’ and C-C’ are shown. DDC = Delta Depocenter. Modified from<br />
Jenden and Kaplan (1989, fig. 1).
A<br />
SW NE<br />
Coast Ranges Rumsey Hills Sacramento Basin<br />
Franciscan<br />
Blueschists<br />
Cretaceous<br />
Franciscan<br />
Blueschists<br />
SUBDUCTION ZONE<br />
Farallon Plate<br />
Franciscan<br />
Cretaceous<br />
Jurassic - Cretaceous<br />
Sediments<br />
Ophiolite<br />
Arbuckle Kirk Grimes<br />
Tertiary Sediments<br />
Cretaceous Sediments<br />
Moho<br />
Upper Mantle Lithosphere<br />
Sierran Basement<br />
Figure 2. Structural cross section A-A’ showing the Sacramento basin, Rumsey Hills, Coast Ranges, Arbuckle, Kirk and Grimes gas fields.<br />
Wedges of Franciscan blueschists, ophiolites and sediments have been thrust eastward along blind thrusts above an east-dipping<br />
subduction zone. Cretaceous sediments have been folded due to back-thrusting along the west flank of the basin. Modified from Unruh<br />
and others (1995).<br />
A'<br />
Kilometers<br />
-5<br />
-10<br />
-15<br />
-20<br />
-25<br />
-30<br />
-35<br />
8<br />
16<br />
24<br />
32<br />
40<br />
48<br />
56<br />
64<br />
72<br />
80<br />
88<br />
96<br />
104<br />
112<br />
120<br />
Depth, in thousands of feet
SYSTEM SERIES<br />
QUATER.<br />
TERTIARY<br />
CRETACEOUS<br />
SACRAMENTO BASIN STRATIGRAPHY<br />
PLIOCENE<br />
MIOCENE<br />
OLIGOCENE<br />
EOCENE<br />
PALEOCENE<br />
UPPER<br />
LOWER<br />
JURASSIC UPPER<br />
OIL GAS<br />
STRATIGRAPHIC UNIT PROD. PROD.<br />
Winters<br />
Formation<br />
Forbes<br />
Formation<br />
Tehama Formation<br />
Valley Springs Formation<br />
Markley Canyon fill<br />
Markley Formation<br />
Nortonville Shale<br />
Domengine Formation<br />
Capay Formation<br />
Meganos Shale<br />
Martinez Formation<br />
Mokelumne River Formation<br />
H & T Shale<br />
Sacramento Shale<br />
Dobbins Shale Member<br />
Guinda Formation<br />
Funks Formation<br />
Sites Formation<br />
Yolo Formation<br />
Kione<br />
Formation<br />
Venado Formation<br />
Shasta Formation<br />
Starkey<br />
Formation<br />
Middle and lower<br />
Great Valley sequence<br />
Knoxville Formation<br />
Figure 3. Stratigraphic units and hydrocarbon producing zones in the Sacramento basin, California.<br />
Modified from Jenden and Kaplan (1989) and Nilsen (1990).
SEA LEVEL<br />
Depth, in thousands of feet<br />
-2<br />
-4<br />
-6<br />
-8<br />
-10<br />
-12<br />
-14<br />
-16<br />
-18<br />
-20<br />
B B'<br />
Delta<br />
Malton-<br />
S N<br />
Depocenter Colusa Basin<br />
Black Butte<br />
BASEMENT ?<br />
MIDLAND FAULT<br />
ZONE<br />
TERTIARY<br />
TOP OF OVERPRESSURE<br />
FORBES FM<br />
DOBBINS SHALE<br />
CRETACEOUS<br />
BASEM ENT<br />
TOP OF OVERPRESSURE<br />
Figure 4. North-south cross section B-B’ showing the top of overpressure in the Sacramento basin. The Dobbins Shale is overpressured<br />
in the northern part of the basin. The Forbes Fm is overpressured in the central and southern parts of the basin. The Forbes Fm is<br />
buried deepest in the Delta Depocenter and Midland Fault Zone. Modified from Lico and Kharaka (1983, fig. 7).<br />
10 Miles<br />
16 Km
Depth, in thousands of feet<br />
SEA<br />
LEVEL<br />
-2<br />
-4<br />
-6<br />
-8<br />
-10<br />
-12<br />
-14<br />
-16<br />
-18<br />
-20<br />
LITHOSTATIC GRADIENT ~ 1 PSI/FT<br />
ARBUCKLE FIELD<br />
GRIMES GAS FIELD<br />
KIRK-<br />
BUCKEYE<br />
FIELD<br />
SOUTHERN SAN JOAQUIN BASIN<br />
HYDROSTATIC GRADIENT ~ 0.43 PSI/FT<br />
2000 4000 6000 8000 10000 12000<br />
INITIAL SHUT-IN PRESSURE (PSI)<br />
Figure 5. Pressure vs depth trends for several overpressured Forbes Gas Fields - Arbuckle, Grimes and<br />
Kirk-Buckeye; also the average pressure versus depth trend for the southern San Joaquin Basin.<br />
Lithostatic (1 psi/ft) and hydrostatic (0.43 psi/ft) gradients are shown. Modified from Berry<br />
(1973, fig. 2), Price (1986, fig. 15) and Yerkes and others (1990).
C C'<br />
TERTIARY<br />
CRETACEOUS<br />
KIRBY HILLS FAULT<br />
MARTINEZ<br />
H&T SH<br />
STARKEY<br />
WINTERS<br />
FORBES<br />
DOBBINS SH<br />
GUINDA<br />
FUNKS<br />
SITES<br />
YOLO<br />
VENADO<br />
LOWER<br />
CRETACEOUS<br />
CAPAY<br />
DELTA DEPOCENTER<br />
WEST KIRBY HILLS NW RIO VISTA<br />
SHELL<br />
LAMBRY #3<br />
23-4N-1W<br />
SHELL<br />
PETERSEN #1<br />
32-5N-1E<br />
PACIFIC<br />
TURNER #2<br />
21-4N-1E<br />
DDBM<br />
CHEVRON<br />
EMIGH #1<br />
2-4N-1E<br />
OCCIDENTAL<br />
HATCH #1<br />
6-4N-2E<br />
UMC<br />
PETERSEN #1<br />
32-5N-2E<br />
STARKEY<br />
WINTERS<br />
FORBES<br />
DOBBINS SH<br />
MIDLAND FAULT<br />
FORBES<br />
H&T SH<br />
SIERRAN<br />
BASEMENT<br />
Figure 6. Structural cross section C-C’ through the Delta Depocenter, showing the Midland and Kirby Hills Faults and several deep wells.<br />
DDBM = Location of Delta Depocenter Basin Model. Modified from MacKevett (1992, fig. 12) and Krug and others (1992).<br />
STANDARD<br />
COOK #16<br />
10-4N-2E<br />
STANDARD<br />
COOK #13<br />
12-14N-2E<br />
STANDARD<br />
COOK #14<br />
12-4N-2E<br />
STANDARD<br />
COOK #15<br />
8-4N-3E<br />
EAST<br />
SEA<br />
LEVEL<br />
- 4<br />
- 8<br />
- 12<br />
- 16<br />
- 20<br />
- 24<br />
- 28<br />
- 32<br />
- 36<br />
- 40<br />
Depth, in thousands of feet
Depth, in thousands of feet<br />
0<br />
- 5<br />
- 10<br />
- 15<br />
- 20<br />
- 25<br />
- 30<br />
- 35<br />
- 40<br />
- 45<br />
- 50<br />
Delta Depocenter<br />
* *<br />
GAS GENERATION WINDOW<br />
FOR TYPE III GAS-<br />
PRONE KEROGEN<br />
.9 1 2 3 4 10<br />
Maturity (%Ro)<br />
Figure 7a. Delta Depocenter Basin Model showing stratigraphic units at present depth of burial, two<br />
measured vitrinite reflectance data points (%Ro), predicted maturity curve, and predicted gas<br />
generation window for Type III kerogen. %Ro reaches 0.9% and top of gas generation window at<br />
approximately -15,500 ft, however several drill stem tests near this depth recovered high pressure<br />
salt water, not gas. Forbes, Dobbins, Funks and deeper Cretaceous source rocks may be within the<br />
peak gas generation window from -16,000 to -29,000 ft.<br />
Fm<br />
t=0<br />
Tertiary<br />
Markley<br />
Nortonville<br />
Domengine<br />
Capay<br />
Meganos C<br />
Martinez<br />
McCormick<br />
Mok River<br />
H&T Shale<br />
Starkey<br />
Winters<br />
Sac. Shale<br />
Forbes<br />
Dobbins<br />
Guinda<br />
Funks<br />
Yolo-Sites<br />
Venado<br />
L. Cret.
Depth, in thousands of feet<br />
0<br />
- 5<br />
- 10<br />
- 15<br />
- 20<br />
- 25<br />
- 30<br />
- 35<br />
- 40<br />
- 45<br />
- 50<br />
Delta Depocenter<br />
100( F)<br />
200( F)<br />
CRETACEOUS PAL. EOCENE OLIG. MIOCENE P Fm<br />
300( F)<br />
400( F)<br />
500( F)<br />
600( F)<br />
700(F)<br />
160 150 100 50 0<br />
Age (my)<br />
Tertiary<br />
Markley<br />
Nortonville<br />
Domengine<br />
Capay<br />
Meganos C<br />
Martinez<br />
McCormick<br />
Mok River<br />
H&T Shale<br />
Starkey<br />
Figure 7b. Burial history curves, depths, ages (my) and temperatures for Cretaceous and Tertiary sediments in the Delta Depocenter, from<br />
BasinMod thermal maturity model. Forbes, Dobbins, Funks and Yolo source rocks may be within the gas generation window below<br />
16,000 ft and 300 °F within the deepest part of the Delta Depocenter.<br />
Winters<br />
Sac. Shale<br />
Forbes<br />
Dobbins<br />
Guinda<br />
Funks<br />
Yolo-Sites<br />
Venado<br />
L. Cret.
7N<br />
6N<br />
5N<br />
4N<br />
3N<br />
2N<br />
1N<br />
1S<br />
C<br />
KIRBY<br />
KIRBY<br />
HILLS<br />
HILLS FAULT<br />
N<br />
5 Miles<br />
BASIN AXIS<br />
DDBM<br />
RIO<br />
VISTA<br />
POTENTIAL<br />
GAS KITCHEN<br />
AND BASIN-CENTER<br />
GAS ACCUMULATION<br />
MARSH CREEK FAULT<br />
MIDLAND<br />
BRUSHY CRE EK FAULT<br />
2S 1W 1E 2E 3E<br />
Figure 8. Map showing outline of potential gas kitchen in the Forbes Fm and Dobbins Shale; also<br />
location of cross section C-C’[. If the source rocks have expelled large volumes of gas, there<br />
may be a localized, continuous basin-center gas accumulation here. However, active strike-slip<br />
and wrench faulting may have breached the system. Modified after Krug and others (1992, p. 43)<br />
and MacKevett (1992, fig. 12).<br />
FAULT<br />
C'
Table 1. Fields which produced gas from the Forbes Fm, with typical porosities and<br />
reservoir temperatures. All Forbes gas has been produced from thermally immature<br />
reservoirs with temperatures less than 190 °F. Data from California Division of Oil and<br />
Gas (1981, 1999).<br />
FIELD NAME Sec Twp Rg Prod Fm Depth Porosity Temp<br />
(Data: CDOG, 1981, 1999) feet % deg F<br />
AFTON 34 19N 1W Forbes 6,000 130<br />
ARBUCKLE 3 13N 1W Forbes 6,400 23 133<br />
ARTOIS 11 20N 3W Forbes 5,900 25 113<br />
BLACK BUTTE DAM 21 23N 4W Forbes 950 18 - 23 92<br />
BOUNDE CREEK 13 18N 2W Forbes 5,450 15 - 24 135<br />
BUCKEYE 24 13N 1W Forbes 8,500 143<br />
BUTTE SLOUGH 1 15N 1W Forbes 7,200 15 - 20 138<br />
CLARKSBURG 31 7N 4E Forbes 11,100 22 182<br />
COLLEGEVILLE EAST 33 1N 8E Forbes 7,450 20 144<br />
COMPTON LANDING 30 17N 1W Forbes 6,260 20 - 24 151<br />
DUNNIGAN HILLS 36 11N 1W Forbes 8,400 16 - 25 155<br />
FREEPORT 18 7N 5E Forbes 8,040 22 126<br />
GREENWOOD 35 22N 3W Forbes 5,400<br />
GRIMES 26 15N 1W Forbes 8,800 22 - 30 164<br />
KIRK 15 13N 1E Forbes 8,700 24 - 29 154<br />
KIRKWOOD 10 23N 3W Forbes 4,020 18 - 25 105<br />
MALTON-BLACK BUTTE 33 23N 3W Forbes 4,950 18 - 25 125<br />
MOON BEND 9 15N 1W Forbes 6,850 24 - 30 145<br />
POPPY RIDGE 5 6N 5E Forbes 7,270 23 - 27<br />
RANCHO CAPAY 4 22N 2W Forbes 5,000 18 - 24 166<br />
ROBBINS 5 12N 3E Forbes 7,100 17 - 23 167<br />
STEGEMAN 1 17N 2W Forbes 3,700<br />
SYCAMORE SLOUGH 22 15N 1W Forbes 7,370 135<br />
TISDALE 17 14N 2E Forbes 6,200 24 - 32 122<br />
WEST BUTTE 20 16N 1E Forbes 6,500 18 - 25 132<br />
WILLIAMS GAS 31 16N 2W Forbes 5,300 15 - 19 118<br />
WILLOWS-BEEHIVE 11 19N 2W Forbes 6,700 24 - 30 129
Table 2. Mud weights (lb/cubic ft), reservoir temperatures (°F), drill stem test shut-in pressures (highest pressure reported, either ISIP or FSIP), pressure gradients<br />
and gas or fluid recoveries for selected Forbes wells, central Sacramento basin. Well logs, drilling histories and DST data were collected from MJ Microfiche, Inc.<br />
and Petroleum Information/Dwights LLC.<br />
Well Name FIELD Sec Twp Rg Year TD FM at TD Mud Wt at Depth BHT DST SIP at Depth Pr/Depth Drill Stem Test Recoveries, Gas + Water Analyses, Comments<br />
ft lb/cubic ft ft deg F psi ft psi/ft<br />
Superior Glenn #72-20 31 21N 1W 1943 9178 basement 103.0 9178 193 See Jenden and Kaplan, 1989, p.436, %Ro=0.6 at 8200'.<br />
W. Gulf Hutton #2 Kirk 8 13N 1E 1961 8603 Forbes 106.0 8603 147 4532 7840 0.58 Recovered gas at 5820 mcfd + no fluid<br />
5440 8578 0.63 Recovered gas at 5720 mcfd + 399' salt water<br />
W. Gulf Wilkins G#1 Kirk 19 13N 1E 1960 9727 Forbes 112.0 8727 143 5090 8360 0.61 Recovered 1075' salt water, 1170 g/g cl-, no gas<br />
5540 8540 0.65 Recovered gas at 5920 mcfd, no water<br />
Shell Cameron Schor #1 Kirk 16 13N 1E 1961 8735 Forbes 103.0 8735 148 5744 8685 0.66 Recovered gas at 460 mcfd + 10 gal salt water<br />
5801 8700 0.67 Recovered 300' gassy watery mud<br />
W. Gulf G. Erdman #1 Kirk 15 13N 1E 1960 9512 Guinda 130.0 9512 157 5835 8750 0.67 Recovered gas, no fluid<br />
NahamaW Sanborn #1-3 Grimes 3 14N 1E 9607 Forbes 92.0 9607 3267 6460 0.51 Recovered gas at 3600 mcfd, no fluid<br />
3939 7010 0.56 Recovered gas at 3250 mcfd + 15' salt water, 4050 ppm cl-<br />
3954 7175 0.55 Recovered gasat 3000 mcfd, no fluid<br />
NahamaW East Grimes #1 Grimes 3 14N 1E 1982 7828 Forbes 90.0 7828 148 3034 6580 0.46 Recovered gas at 599 mcfd + 200' mud. %Ro, J&K, 1989 p. 436<br />
Mobil Grimes U4 #1 Grimes 4 14N 1E 1960 8242 Forbes 114.0 8242 145 3250 6550 0.5 Recovered gas at 2500 mcfd + 155' salt water, 680 g/g cl-<br />
3800 6970 0.55 Recovered gas at 1200 mcfd, no fluid<br />
4390 7350 0.6 Recovered gas at 2740 mcfd, no fluid<br />
King Resources Davis #1 wildcat 22 15N 1W 1969 8605 Forbes 127.0 8605 5131 7505 0.68 Recovered 3082' salt water + trace of gas<br />
6590 8279 0.795 Recovered 3015' salt water<br />
Coastal Gobel #1 W. Grimes 21 15N 2W 1986 7100 Forbes 6010 126 3490 6007 0.58 Recovered gas at 1906 mcfd, no fluid. Effective Perm = 0.27 md<br />
Coastal Abel Rd #1 W. Grimes 21 15N 2W 1986 7173 Forbes 97.0 4807 119 2266 4807 0.47 Recovered gas, gas analysis = 97% methane, 1.5% nitrogen<br />
Humble Davis #B-6 W. Grimes 22 15N 1W 1962 10017 Dobbins 129.0 10017 172 7200 9552 0.75 Recovered 446' muddy salt water, no gas<br />
Chevron C. City #4 W. Grimes 27 14N 1W 1981 9372 Forbes 119.0 9372 155 6049 8550 0.71 Recovered gas at 160 mcfd + 1380' gascut mud<br />
5299 9300 0.57 Recovered gas at 260 mcfd & flowed 268 bwpd<br />
Honolulu Balsdon #1 W. Grimes 34 14N 1W 1961 10005 Forbes 131.0 10005 160 6624 8760 0.76 Recovered gas at 714 mcfd + 120' salt water<br />
5785 9600 0.6 Recovered gas at 2113 mcfd, no fluid<br />
Occidental Sacheiter #4 W. Grimes 4 14N 1W 1961 9370 Forbes 128.0 9370 150 5368 7740 0.69 Recovered 60' muddy salt water, 1255 g/g cl- + trace of gas<br />
6927 8425 0.82 Recovered 220 muddy salt water, 1235 g/g cl- + trace of gas<br />
6584 8485 0.78 Recovered 208' muddy salt water, 1013 g/g cl-, no gas<br />
7334 8760 0.84 Recovered 120' muddy salt water, 600 g/g cl- + trace of gas<br />
8392 9383 0.89 Recovered 1130' muddy salt water, 1450 g/g cl-, no gas<br />
Chevron C. City #3A W. Grimes 34 14N 1W 1981 9800 Dobbins 133.0 9320 157 7811 9570 0.82 Recovered gas + 240' water-cut mud<br />
7398 9205 0.8 Recovered gas at 1.3 mcfd + flowed 24 bpd salt water<br />
Exxon Carter #3 Compton 7 17N 1W 1984 8100 Guinda 132.0 8100 162 3340 5200 0.64 Repeat Fm Tester pressures<br />
3246 5346 0.6 Repeat Fm Tester pressures<br />
3977 5772 0.69 Repeat Fm Tester pressures<br />
4437 5919 0.75 Repeat Fm Tester pressures<br />
4000 5928 0.67 Repeat Fm Tester pressures<br />
4639 5933 0.78 Repeat Fm Tester pressures<br />
Gulf Boggs Unit #1 wildcat 29 17N 1W 1964 8759' Forbes 130.0 8759 153 6313 7965 0.79 Recovered gas at 1541 mcfd + 271' wtr-cut mud, 96% CH4, 2.5% N<br />
Texaco Dennis #1 wildcat 30 17N 2W 1979 8191 Forbes 136.0 8191 179 6201 6770 0.92 Very high ISIP, recovered 1423' salt water<br />
4608 5520 0.83 Recovered 3300' salt water + trace of gas<br />
Chevron Thompson #1 wildcat 15 17N 2W 1981 8448 Forbes 127.0 8448 144 8168 Water shut off test flowed 75 mcfd + salt water at 96 bwpd<br />
6425 Flowed salt water to surface at 1400 bwpd<br />
6344 Recovered 1440' gassy salt water<br />
Honolulu West Larkins #1 wildcat 10 17N 2W 1961 8810 Forbes 134.0 8810 145<br />
NARECO Terhel Farm #1 wildcat 29 17N 1W 1981 8220 Forbes 122.0 8220 156 3662 6160 0.59 Recovered gas at 229 mcfd + 1085' salt water, 17000 ppm cl-<br />
6066 7920 0.77 Recovered 437' salt water + trace of gas
Table 2. Mud weights (lb/cubic ft), reservoir temperatures (°F), drill stem test shut-in pressures (highest pressure reported, either ISIP or FSIP), pressure gradients<br />
and gas or fluid recoveries for selected Forbes wells, central Sacramento basin. Well logs, drilling histories and DST data were collected from MJ Microfiche, Inc.<br />
and Petroleum Information/Dwights LLC.<br />
Well Name FIELD Sec Twp Rg Year TD FM at TD Mud Wt at Depth BHT DST SIP at Depth Pr/Depth Drill Stem Test Recoveries, Gas + Water Analyses, Comments<br />
ft lb/cubic ft ft deg F psi ft psi/ft<br />
Occidental SC Club #B-1 wildcat 11 16N 1W 7300 volc sill 123.0 7300 3088 4385 0.7 Recovered gas at 460 mcfd + 317' salt water, 920 g/g cl-<br />
3452 5340 0.65 Recovered 520' salt water, 925 g/g cl- + trace of gas<br />
Humble Capital #B-1 wildcat 3 16N 1W 1953 10126 basement 126.0 10014 163 Cored Dobbins Shales & Guinda SS<br />
Shell Kingsbury #4X-11 wildcat 11 11N 3W 1954 5500 Guinda 119.0 5500 137 3330 4710 0.71 Recovered 990' muddy salt water, 905 g/g cl-, cut cores<br />
Texaco Crawford #1 wildcat 32 13N 2E 1952 5013 Forbes 5013 107 Cored Forbes & Dobbins Sh, noted lignitic carbonaceous mat'l<br />
Occidental Dobbins #1 wildcat 8 13N 3W 1960 3643 Sites 114.0 3463 115 1442 2060 0.7 Recovered gas at 1390 mcfd + 1229' salt water, 1740 g/g cl-<br />
1774 2630 0.67 Recovered 80' drilling mud + trace of gas<br />
Texaco Arbuckle U1 #1 wildcat 18 13N 1W 1971 12210 Guinda 129.0 12200 180 Mudlog notes many severe salt water flows into borehole<br />
119.0 8970 "Well flowed during trip, dumped 20 bbls salt water"<br />
122.0 9704 "Dumped 16 bbl salt water after trip" High background gas<br />
127.0 10500 in Dobbins Shale. "Dumped 30 bbls salt water after trip"<br />
Occidental Arbuckle X #2 Arbuckle 34 14N 2W 6712 Forbes 3454 6180 0.56 Recovered gas at 1987 mcfd, no fluid<br />
Occidental Arbuckle Y #1 Arbuckle 35 14N 2W 6565 Forbes 3543 5970 0.59 Recovered 258' muddy salt water, 1170 g/g cl-<br />
Gulf Arbuckle UU#1 Arbuckle 5 13N 2W 7362 Forbes 3820 6560 0.58 Tool plugged after 1 hour shut in period<br />
W. Gulf Arbuckle AA #1 Arbuckle 11 13N 2W 1957 7000 Forbes 5252 6790 0.77 Recovered 4238' muddy salt water + trace of gas<br />
3355 6100 0.55 Recovered gas at 1507 mcfd + flowed salt water to surface<br />
Great Basins P-Munell #2 Arbuckle 15 13N 2W 1978 7453 Forbes 3485 5910 0.59 Recovered gas at 1232 mcfd + no fluid. Gas analysis, J&K 1989<br />
Great Basins P-Munell #1 Arbuckle 15 13N 2W 1977 7335 Forbes 7240 Recovered 1660' salt water, 17,800 ppm cl-<br />
Occidental Arbuckle S#1 Arbuckle 4 13N 3W 1959 6866 Forbes 95.0 6387 3954 6725 0.59 Recovered gas at 5980 mcfd + 400' salt water, 1250 g/g cl-<br />
W. Gulf Arbuckle T#1 Arbuckle 4 13N 2W 1957 6515 Forbes 3510 6400 0.55 Recovered gas at 1800 mcfd + 800' salt water, 2000 g/g cl-<br />
3470 6315 0.55 Recovered gas at 5720 mcfd, no fluid<br />
W. Gulf Wilkins B #2 wildcat 24 13N 1W 1960 8700 Forbes 111.0 8700 5900 8515 0.69 Recovered gas at 300 mcfd + 880' salt water, 1240 g/g cl-<br />
5200 8380 0.62 Recovered gas at 720 mcfd, no fluid<br />
Hudson Zumwalt #1 wildcat 36 14N 3W 1958 7013 Forbes 115.0 7013 132 4015 5702 0.7 Recovered 3240' salt water<br />
2650 5178 0.51 Recovered 735' gassy salt water<br />
Phillips Swanston #1 wildcat 26 9N 3E 1961 11194 Dobbins 93.0 11185 165 Note %Ro data, %Ro=0.75 near TD, J&K 1989, p. 436
Table 3. Mud weights (lb/cubic ft), reservoir temperatures (°F), drill stem test shut-in pressures (highest pressure reported, either ISIP or FSIP), pressure gradients<br />
and gas or fluid recoveries for selected Forbes wells, Delta Depocenter, southwestern Sacramento Basin. Well logs, drilling histories and DST data were collected from<br />
MJ Microfiche, Inc. and Petroleum Information/Dwights LLC.<br />
Well Name FIELD Sec Twp Rg Year TD FM at TD Mud Wt at Depth BHT DST SIP at Depth Pr/Depth Drill Stem Test Recoveries, Water Analyses, Comments<br />
ft lb/cu ft ft deg F psi ft psi/ft<br />
Occidental CollinsHatch #1 wildcat 6 4N 2E 1980 12645 Winters 94.0 12,645 230 8,340 12,600 0.66 Recovered 1 bbl mud, no gas or water<br />
Chevron CH-Emigh #1-2 wildcat 2 4N 2E 1983 13026 Winters 120.0 13,026 234 12,818 Recovered 3648' salt water + 8082' gassy drilling mud<br />
12,870 Recovered 1000' drilling mud + 4200' salt water.<br />
Shell Petersen Ranch #1 wildcat 32 5N 1E 1960 15001 Forbes 130.0 14,518 298 9,840 12,070 0.82 Recovered 3660' gassy salt water<br />
129.0 15,001 Cut 3 cores 14042-14931', mostly shale & ss<br />
CSOG Emigh #8 wildcat 33 5N 1E 1986 12200 Winters 90.0 12,200 186<br />
Pacific SW Turner #2 wildcat 21 4N 1E 1962 12215 Starkey 105.0 12,215 228 11,472 Recovered 192' salt water, no gas, in Starkey Fm<br />
11,450 Recovered 3190' gassy salt water, 300 g/g cl-, in Starkey Fm<br />
Standard Oil P. Cook #13 wildcat 12 4N 2E 1961 15056 Forbes 124.0 15,056 214 14,780 Recovered 760' gassy mud. Retest recovered 1137' gassy mud<br />
Standard Oil P. Cook #14 wildcat 12 4N 2E 1963 15003 Forbes 126.0 15,003 238 14,840 Recovered 2700' muddy water, 240 g/g cl-, no gas<br />
10,512 12,900 0.82 Recovered 12,550' salt water + trace of gas, flowed salt water<br />
9,856 12,370 0.8 Recovered 3780' salt water, 380 g/g, + trace gas, flowed salt water<br />
Standard Oil P. Cook #15 wildcat 8 4N 3E 1964 15059 Forbes 116.0 15,059 232 14,785 Recovered 94' drilling mud, no gas or water<br />
4,697 14,215 0.33 Recovered 866' water, 250 g/g, no gas<br />
13,260 Water shut off test recovered 300' muddy water, 370 g/g cl-<br />
3,405 11,635 0.3 Recovered 100' muddy water, 235 g/g cl-<br />
4,057 9,480 0.43 Recovered 368' mud + 2397' salt water, 320 g/g cl-<br />
Standard Oil P. Cook #16 wildcat 10 4N 2E 1964 15050 Forbes 126.0 15,050 256 9,090 14,770 0.62 Recovered 4850' muddy water, 393 g/g cl- + trace of gas<br />
10,053 14,255 0.71 Recovered 680' salt water, 400 g/g cl-<br />
7,325 14,255 0.52 Retested, recovered 1746' salt water, 230 g/g cl-<br />
8,473 12,680 0.67 Rec gas tstm rec 758' salt water, 200 g/g & 910' mud<br />
8,291 11,830 0.7 Recovered 2460' salt water, 290 g/g cl- + trace gas, flowed water<br />
11,410 Recovered trace of gas, flowed water at 252 bwpd, 370 g/g cl-<br />
McCulloch Petersen #1-32 wildcat 32 5N 2E 1980 12550 Winters 108.0 12,500 223 12,448 Recovered 4500' salt water, no gas, swabbed salt water<br />
11,756 Water shut off test recovered 300' muddy water, 370 g/g cl-<br />
MCOR Anderson #1-5 wildcat 5 3N 2E 1980 14269 Winters 105.0 14,269 276 8,472 13,106 0.65 Recovered 2000' water, 2600 ppm cl-, in Starkey Fm, reversed SP<br />
This is the hottest BHT. Total Depth in Winters SS
ABSTRACT<br />
Is there a Basin-Center Gas Accumulation in the<br />
Travis Peak (Hosston) Formation, Gulf Coast Basin, USA?<br />
Charles E. Bartberger<br />
Petroleum Geologist<br />
Potential of Lower Cretaceous Travis Peak sandstones in the northern Gulf Coast Basin to harbor a basin-center<br />
gas accumulation was evaluated by examining (1) depositional/diagenetic history and reservoir properties of Travis<br />
Peak sandstones, (2) presence and quality source rocks for generating gas, (3) burial/thermal history of source rocks<br />
and time of gas generation/migration relative to tectonic development of Travis Peak traps, (4) gas and water<br />
recoveries from drillstem and formation tests, (5) distribution of abnormal pressures based on shut-in-pressure data,<br />
and (6) presence or absence of gas-water contacts associated with gas accumulations in Travis Peak sandstones.<br />
The Travis Peak Formation is a basinward-thickening wedge of terrigenous clastic sedimentary rocks that<br />
underlies the northern Gulf of Mexico Basin from east Texas across northern Louisiana to southern Mississippi.<br />
Clastic influx was focused in two main fluvial-deltaic depocenters located in northeast Texas and southeast<br />
Mississippi/northeast Louisiana. Across the main hydrocarbon-productive trend in east Texas and north Louisiana,<br />
the Travis Peak Formation is about 2,000 feet thick. In east Texas, stacked, fluvial-channel sandstones comprise the<br />
bulk of the Formation. Channel sandstones grade upward from braided to meandering, and are capped by a thin<br />
sequence of coastal-plain, paralic, and marine strata reflecting the overall transgression and relative rise in sea level<br />
that occurred during Travis Peak deposition. In north Louisiana, sandstones deposited in interdeltaic settings are<br />
separated by thicker shale intervals.<br />
Most Travis Peak hydrocarbon production in east Texas comes from drilling depths between 6,000 and 10,000<br />
feet. Significant decrease in porosity and permeability through that depth interval results primarily from increasing<br />
amounts of quartz cement with depth. Reservoir properties of many Travis Peak sandstones, however, are<br />
significantly better than those characteristic of basin-center gas reservoirs in which inherent, ubiquitous, lowpermeability<br />
provides an internal, leaky seal for thermally generated gas. Above 8,000 feet in east Texas, Travis<br />
Peak sandstone matrix permeabilities often are significantly higher than the 0.1 mD cutoff that characterizes tightgas<br />
reservoirs. Below 8,000 feet, matrix permeability of Travis Peak sandstones is low because of pervasive quartz<br />
cementation, but abundant natural fractures impart significant fracture permeability. In east Texas, oil and gas seem<br />
to be concentrated in meandering-channel and paralic sandstones in the upper 300 feet of the Travis Peak. This<br />
probably occurs because these sandstones are encased in thick shales that provide effective seals. The underlying thick<br />
fluvial sequence lacks widespread shale barriers, and stacked, braided-channel sandstones provide an effective upward<br />
migration pathway for gas. In north Louisiana, relatively thick shales throughout the Travis Peak provide effective<br />
seals for interdeltaic sandstones.<br />
Because of significant variation with depth in both reservoir properties and occurrence of shale seals in the<br />
Travis Peak Formation in east Texas, inaccurate interpretations can be made by using pressure data or presence of<br />
hydrocarbon-water contacts at a particular depth to characterize the entire Travis Peak at a given well location.<br />
Although pressure data within the middle and lower Travis Peak Formation are limited in east Texas, significant<br />
overpressure caused by thermal generation of gas, which is typical of basin-center gas accumulations, is not common<br />
within the Travis Peak. Significant overpressure was found in only one Travis Peak sandstone reservoir in one of 24<br />
oil and gas fields examined across east Texas and north Louisiana. Presence of a gas-water contact perhaps is the<br />
most definitive criterion indicating that a gas accumulation is conventional rather than a “sweetspot” within a basincenter<br />
gas accumulation. Hydrocarbon-water contacts within Travis Peak sandstone reservoirs were documented in 17<br />
fields, and probably occur in considerably more fields, across the productive Travis Peak trend in east Texas and north<br />
Louisiana. All known hydrocarbon-water contacts in Travis Peak reservoirs in east Texas, however, occur within<br />
sandstones in the upper 500 feet of the Formation. Widespread presence of hydrocarbon-water contacts indicates lack<br />
of significant basin-center gas accumulations within the Travis Peak Formation throughout north Louisiana, and
within the upper 500 feet of the Travis Peak in east Texas. Although no gas-water contacts have been reported<br />
within the lower three-fourths of the Travis Peak Formation in northeast Texas, gas production from that interval is<br />
limited. Best available data suggest that most middle and lower Travis Peak sandstones are water-bearing in northeast<br />
Texas, at least in some fields. These data together with absence of significant overpressure suggest that the middle<br />
and lower Travis Peak section, too, lacks significant basin-center gas in northeast Texas.<br />
Insufficient hydrocarbon charge relative to permeability of Travis Peak reservoirs might be primarily responsible<br />
for lack of overpressure and basin-center gas within the Travis Peak Formation. Shales interbedded with Travis Peak<br />
sandstones in east Texas are primarily oxidized floodplain deposits with insufficient organic-carbon content to be<br />
significant sources of oil and gas. Most likely sources for hydrocarbons in Travis Peak reservoirs are two<br />
stratigraphically lower units, Jurassic-age Bossier Shale of the Cotton Valley Group, and laminated, lime mudstones<br />
of the Jurassic Smackover Formation. Hydrocarbon charge, therefore, might be sufficient for development of<br />
conventional gas accumulations but insufficient for development of basin-center gas as a result of absence of<br />
proximal source rocks and lack of effective migration pathways from stratigraphically or geographically distant<br />
source rocks. Additionally, relatively high matrix and fracture permeability through significant portions of Travis<br />
Peak sandstone reservoirs might allow upward migration of gas to the degree that abnormally high pressure and<br />
basin-center gas cannot develop.<br />
INTRODUCTION<br />
In 1982 under the auspices of its Tight Gas Sands Program, the Gas Research Institute (GRI) conducted a<br />
nationwide survey of low-permeability gas-bearing sandstones (Fracasso and others, 1988; Holditch, and others,<br />
1988; Dutton and others, 1991a). From that survey, the Lower Cretaceous Travis Peak Formation was one of two<br />
formations selected for comprehensive geologic and engineering research. Goals of this research were to develop<br />
knowledge for improving recovery of gas and reducing costs of producing gas, from low-permeability sandstone<br />
reservoirs. Main emphasis was on developing more effective hydraulic-fracture treatments with anticipation of<br />
transferring this technology to other low-permeability gas reservoirs. As part of this research program, the Bureau of<br />
Economic Geology (BEG) at the University of Texas in Austin conducted comprehensive geological analyses of the<br />
Travis Peak Formation from 1983 to 1986. BEG focus was on depositional systems, sandstone diagenesis, natural<br />
fractures, source rocks, burial and thermal history, and structural evolution of East Texas and North Louisiana Salt<br />
Basins and the Sabine Uplift. Studies of reservoir engineering properties and production characteristics of Travis Peak<br />
sandstones in selected gas fields also were conducted. Much of this research was based on core, wireline-log, and<br />
production data which GRI contractors collected from seven cooperative Travis Peak wells with permission from<br />
operating companies. Results from this research prompted GRI to drill and complete three Staged Field Experiment<br />
(SFE) wells to test understandings developed and to acquire additional data (Dutton and others, 1991a). SFE No.1<br />
was drilled in August 1986 in Waskom Field, Harrison County, Texas, and SFE No. 2 was drilled in September<br />
1987 in North Appleby Field, Nacogdoches County, Texas. Research in these two wells focused on gas-productive<br />
sandstones near the top and base of the Travis Peak Formation. SFE No. 3 was drilled in September 1988 in<br />
Waskom Field to attempt to apply technologies developed in the Travis Peak to low-permeability Cotton Valley<br />
sandstones. As a result of research from this GRI Tight Gas Sands Program, a wealth of information on Travis Peak<br />
and Cotton Valley low-permeability sandstone reservoirs was published by both GRI and BEG. Those data and<br />
accompanying interpretations provide a significant part of the information used in this study to evaluate potential for<br />
basin-center gas in the Travis Peak. Because wireline-logs and mudlogs were not available for this study,<br />
interpretations and conclusions herein are based solely on data reported in public literature and on production data<br />
accessible in a publicly available database from IHS <strong>Energy</strong> Group (petroROM Version 3.43).<br />
2
METHOD FOR EVALUATING POTENTIAL OF BASIN-CENTER GAS IN TRAVIS PEAK<br />
SANDSTONES<br />
One of the main requirements for occurrence of a basin-center, continuous-gas accumulation is presence of a<br />
regional seal to trap gas in a large volume of rock across a widespread geographic area. In classic basin-center-gas<br />
accumulations (Law and Dickinson, 1985; Spencer, 1987; Law and Spencer, 1993), the regional seal is provided by<br />
low-permeability of the reservoir itself, as described above. To evaluate potential for a continuous-gas accumulation<br />
within the Travis Peak Formation, therefore, it is necessary to examine reservoir properties of Travis Peak<br />
sandstones across the northern Gulf Coast Basin. Because reservoir properties of Travis Peak sandstones are governed<br />
by diagenetic characteristics, which are controlled primarily by depositional environment, it is helpful to understand<br />
Travis Peak depositional systems and related diagenetic patterns.<br />
Although gas production from Travis Peak sandstones seems to occur from discrete fields, it is necessary to<br />
determine if those fields are separate, conventional accumulations or so-called “sweet spots” within a regional,<br />
continuous-gas accumulation. Thus, it is essential to understand what characterizes the apparent productive limits of<br />
existing Travis Peak gas fields, including presence or absence of gas-water contacts.<br />
Because continuous-gas accumulations commonly are characterized by overpressure associated with thermal<br />
generation of gas from source rocks that generally are proximal to low-permeability reservoirs, it is important to<br />
evaluate presence and quality of potential source rocks, burial and thermal history of those source rocks, and<br />
reservoir-pressure data.<br />
In northeast Texas, the 2,000-foot Travis Peak Formation is characterized by heterogeneities that require one to<br />
exercise caution when evaluating for potential of basin-center gas accumulations. Because permeability decreases by<br />
four orders of magnitude across the productive depth range from 6,000 to 10,000 feet, it is inappropriate to attempt<br />
to characterize the entire Travis Peak Formation in a particular well using a single value for permeability. Similarly,<br />
because of depositional heterogeneities, sandstones in the upper 300 feet of the Travis Peak commonly are isolated<br />
bodies encased in shales, whereas the bulk of the underlying Travis Peak consists of an interconnected network of<br />
multistory, multilateral sandstone bodies without widespread shale barriers. Whereas a single fluid-pressure gradient<br />
might characterize much of the interconnected sandstone sequence, that gradient might be considerably different than<br />
the gradient for one of the isolated sandstone units in the upper Travis Peak, hence the difficulty in attempting to<br />
characterize the entire formation with one fluid-pressure gradient. Likewise, presence of a gas-water contact within<br />
one upper Travis Peak sandstone reservoir in a particular Travis Peak field might not be indicative of deeper Travis<br />
Peak reservoirs in that area. <strong>Final</strong>ly, because most Travis Peak hydrocarbon production in northeast Texas comes<br />
from sandstone reservoirs within the upper 300 feet of the Formation, significantly fewer data are available from the<br />
lower three fourths of the Travis Peak.<br />
GEOLOGIC SETTING FOR TRAVIS PEAK IN NORTHERN GULF BASIN<br />
The Travis Peak Formation, or Hosston Formation as it is known outside of Texas, is a Lower Cretaceous<br />
basinward-thickening wedge of terrigenous clastic sedimentary rocks that underlies the northern Gulf of Mexico<br />
coastal plain from east Texas across southern Arkansas and northern Louisiana into southern Mississippi. Thickness<br />
of the Travis Peak Formation ranges from less than 1,000 feet in southern Arkansas to more than 3,200 feet in<br />
north-central Louisiana. Downdip limit of the Travis Peak has not been delineated by drilling to date. Travis Peak<br />
strata crop out in portions of Brown, Mills, McCulloch, San Saba, and Lampasas Counties in east-central Texas<br />
(Hartman and Scranton, 1992). Across the hydrocarbon-productive trend of the Travis Peak Formation (figs. 1a, 1b,<br />
and 1c), depth to top of the Travis Peak ranges from about 4,000 feet subsea in southern Arkansas to more than<br />
18,000 feet subsea in north-central Louisiana and southern Mississippi (Saucier, 1985). Although Travis Peak<br />
sandstones produce gas from drilling depths in excess of 16,000 feet in southern Mississippi (Thomson, 1978), most<br />
Travis Peak production across the major productive trend in east Texas and northern Louisiana is from drilling depths<br />
between 6,000 and 10,000 feet (Dutton and others, 1993). Travis Peak production across east Texas and north<br />
Louisiana is primarily gas, but some fields produce oil as well (figs. 1a and 1b).<br />
3
As shown in figure 2, the Travis Peak (Hosston) is the lowermost formation of the Lower Cretaceous Trinity<br />
Group, which overlies the Upper Jurassic-Lower Cretaceous Cotton Valley Group. The Cotton Valley Group and<br />
overlying Travis Peak Formation represent the first two major influxes of terrigenous clastic sediments into the Gulf<br />
of Mexico Basin following its initial formation during continental rifting 180 Ma in Late Triassic time (Salvador,<br />
1987; Worrall and Snelson, 1989). Earliest sedimentary deposits in East Texas and North Louisiana Salt Basins<br />
(figs. 2 and 3) include Upper Triassic nonmarine redbeds of the Eagle Mills Formation, the thick lower and middle<br />
Jurassic evaporite sequence known as Werner Anhydrite and Louann Salt, and the nonmarine Norphlet Sandstone.<br />
Following a major regional marine transgression across the Norphlet, upper Jurassic Smackover regressive<br />
carbonates were deposited, capped by redbeds and evaporites of the Buckner Formation (fig. 2). A subsequent minor<br />
marine transgression is recorded by the Gilmer or Cotton Valley Limestone in east Texas, although equivalent facies<br />
in north Louisiana and Mississippi are terrigenous clastics known as Haynesville Formation. The marine Bossier<br />
Shale, lowermost formation of the Cotton Valley Group (fig. 2) was deposited conformably atop the Gilmer-<br />
Haynesville followed by progradation of the major fluvial-deltaic sequence known as Cotton Valley sandstone or<br />
Schuler Formation (fig. 2).<br />
A significant marine transgression that halted Cotton Valley fluvial-deltaic sedimentation is recorded by the<br />
Knowles Limestone, uppermost formation of the Cotton Valley Group (figs. 2 and 4). Prodelta and fluvial-deltaic<br />
deposits of the Travis Peak Formation overlie the Knowles Limestone, marking the second major influx of<br />
terrigenous clastics into the northern Gulf Basin. In updip regions of the Gulf Basin, the Knowles Limestone<br />
pinches out, and Travis Peak fluvial-deltaic strata rest directly on Schuler fluvial deltaic units of the Cotton Valley<br />
Group (fig. 4). Whereas most workers consider the Knowles-Travis Peak contact to be conformable, controversy<br />
exists regarding presence or absence of an unconformity between the updip Schuler and Travis Peak Formations.<br />
McFarlan (1977), Todd and Mitchum (1977), and Tye (1989) identify a major unconformity between the Schuler and<br />
Travis Peak, whereas Nichols and others (1968) and Saucier (1985) consider the contact to be conformable. There is<br />
general agreement that the upper contact of the Travis Peak with overlying shallow-marine carbonates of the Sligo<br />
Formation (known as Pettet Formation outside Texas) is conformable. Most of the 15-m.y. period of Travis Peak<br />
deposition occurred during a relative rise in sea level (McFarlan, 1977; Vail and others, 1977), and the Travis Peak-<br />
Sligo contact is a time-transgressive boundary with Sligo oolitic and micritic limestones onlapping Travis Peak<br />
paralic and marine clastics to the north out of the Gulf Basin (Tye, 1991) (figs. 2 and 4).<br />
The thick Louann Salt became mobile as a result of sediment loading and associated basinward tilting in late<br />
Jurassic and early Cretaceous time. Salt movement was initiated during Smackover carbonate deposition and became<br />
more extensive with influx of the thick sequence of Cotton Valley and Travis Peak clastics (McGowen and Harris,<br />
1984). Many Cotton Valley and Travis Peak fields in east Texas, Louisiana, and Mississippi are structural or<br />
combination traps associated with Louann Salt structures. Salt structures range from small, low-relief salt pillows to<br />
large, piercement domes (McGowen and Harris, 1984; Kosters and others, 1989).<br />
The Sabine Uplift (fig. 3) is a broad, low-relief, basement-cored arch separating the East Texas and North<br />
Louisiana Salt Basins. With vertical relief of 2,000 feet, the Sabine Uplift has a closed area exceeding 2,500 square<br />
miles (Kosters and others, 1989). Isopach data across the Uplift indicate that it was a positive feature during<br />
deposition of Louann Salt in the Jurassic, but that main uplift occurred in late, mid-Cretaceous (101 to 98 Ma) and<br />
early Tertiary time (58 to 46 Ma) (Laubach and Jackson, 1990; Jackson and Laubach, 1991). As a high area during<br />
the past 60 m.y., the Sabine Uplift has been a focal area for hydrocarbon migration in the northern Gulf Basin during<br />
that time. Numerous smaller structural highs on the Uplift in the form of domes, anticlines, and structural noses<br />
provide traps for hydrocarbon accumulations, including many oil and gas fields with Travis Peak reservoirs.<br />
Interpretations of the origins of these smaller structures have included salt deformation and small igneous intrusions,<br />
as summarized by Kosters and others, (1989). Because the Louann Salt is thin across the Sabine Uplift, Kosters and<br />
others, (1989) suggest that most of the smaller structures across the Sabine Uplift developed in association with<br />
igneous activity.<br />
4
TRAVIS PEAK STRATIGRAPHY<br />
The Travis Peak Formation is not divided formally into members. However, Saucier (1985) and Saucier and<br />
others (1985) distinguished three separate stratigraphic intervals within the Travis Peak across east Texas and north<br />
Louisiana based on relative amounts of sandstone and shale as reflected in spontaneous-potential (SP) and gamma-ray<br />
character of sandstones on wireline logs. As shown in figures 5 and 6, a thin, basal interval of mixed sandstones and<br />
shales interpreted as delta-fringe gradationally is overlain by a thick, sandstone-rich, sequence of fluvial and<br />
floodplain deposits that grades upward into another interval of sandstone and mudstone interpreted as coastal-plain and<br />
paralic deposits (Saucier, 1985; Fracasso and others, 1988; Tye, 1989, 1991). The middle fluvial/floodplain interval,<br />
which is thickest and forms the bulk of the Travis Peak section, consists of stacked, aggradational, braided-channel<br />
sandstone units that grade upward into more isolated meandering-channel sandstone deposits (fig. 6). Sandstone units<br />
are interpreted as braided based on blocky SP curves, bedforms observed in conventional cores, and sandstone-body<br />
geometry. Stacked, braided channel units generally are 12 to 45 feet thick, but because of the absence of preserved<br />
shales, amalgamated channel sandstones occasionally occur as massive sandstone units up to 250 feet thick with<br />
blocky SP curves (Saucier, 1985). Serrated gamma-ray curves within such intervals reflect abundant shale rip-up<br />
clasts at the scoured bases of individual channels (Tye, 1989). Upward-fining sequences are not common and occur<br />
only where individual channel units are isolated by siltstones and/or shales (Saucier, 1985).<br />
This thick fluvial/floodplain sequence gradationally overlies a much thinner sequence with considerably higher<br />
mudstone content in which discrete sandstones are separated by thicker mudstones. Sandstones in this lower Travis<br />
Peak sequence display a variety of upward-coarsening, upward-fining, and serrated SP signatures and are interpreted as<br />
delta-fringe deposits.<br />
The thick, middle fluvial/delta-plain sequence grades upward into the third interval recognized by Saucier (1985)<br />
which forms the uppermost portion of the Travis Peak. Like the lower Travis Peak delta-fringe interval, this upper<br />
interval is characterized by discrete sandstones separated by thicker mudstones. Many sandstones in the upper interval<br />
display thin, spiky upward-coarsening, upward-fining, and serrated SP signatures, and are interpreted as representing<br />
coastal-plain and paralic deposits. Upper Travis Peak paralic units are transgressive deposits that step upward and<br />
landward with time (fig. 2) as they interfinger with, and are gradationally overlain by, shallow-marine shelf<br />
carbonates of the Sligo (Pettet) Formation (Fracasso and others, 1988). Sligo carbonates thin updip to the northwest<br />
as they onlap Travis Peak paralic deposits. Contact of the Travis Peak with the overlying Sligo Formation,<br />
therefore, is time transgressive.<br />
TRAVIS PEAK DEPOSITIONAL SYSTEMS<br />
Regional Framework<br />
Following the regional marine transgression recorded by deposition of the Knowles Limestone at the close of<br />
Cotton Valley time, Travis Peak fluvial-deltaic systems began prograding basinward across surfaces of the Schuler<br />
and Knowles Formations (fig. 4). Two main Travis Peak fluvial-deltaic depocenters (fig. 3) have been documented<br />
along the arcuate northern Gulf Coast Basin (Saucier, 1985; Tye, 1989). One depocenter was located in northeast<br />
Texas where the ancestral Red River flowed into East Texas Salt Basin through a structural downwarp in the<br />
Ouachita thrust belt. Drainage area of the ancestral Red River most likely spanned a large portion of present-day<br />
southwestern and midwestern United States. Coarse clastic sediment probably was derived from highlands in western<br />
Utah and southern Arizona. Triassic redbeds were exposed in the provenance area during Travis Peak time, and these<br />
might be the source of abundant red siltstones within the Travis Peak Formation in East Texas (Saucier, 1985).<br />
The second Travis Peak depocenter was situated in southern Mississippi and northeast Louisiana where the<br />
ancestral Mississippi River, which had developed as a major fluvial system during Cotton Valley time (Coleman<br />
and Coleman, 1981), continued to transport clastic sediments to high-constructive, elongate Travis Peak deltas in the<br />
northeastern Gulf Basin (Reese, 1978; Saucier, 1985; Tye, 1989). Evidence for presence of these two depocenters is<br />
provided by sandstone isopach patterns from Saucier (1985) who divided the Travis Peak section at its midpoint and<br />
mapped gross sandstone thickness of the lower and upper halves of the Formation.<br />
5
Across the Travis Peak hydrocarbon-productive trend in east Texas, the Formation has been divided informally<br />
into three general sequences based on relative amounts of sandstone and shale, as described above. However, because<br />
of rapid early progradation of Travis Peak fluvial-deltaic systems, the lowermost delta-fringe sequence is thin (figs 5<br />
and 6). With the bulk of the Travis Peak Formation deposited during a relative rise in sea level, the Formation can<br />
be considered to be comprised of two main units, a lower aggradational to retrogradational fluvial sequence, and an<br />
upper retrogradational coastal-plain/paralic sequence<br />
DEPOSITIONAL ENVIRONMENTS AND SAND-BODY GEOMETRY<br />
Lower-Travis Peak Delta-Fringe Deposits<br />
The basal 100 to 500 feet of the Travis Peak Formation across much of east Texas is characterized by discrete<br />
sandstones separated by thicker mudstones. Sandstones display upward-coarsening, upward-fining, and spiky to<br />
serrated SP signatures, and are interpreted as representing distributary-channel, distributary-mouth-bar, delta-front,<br />
interdistributary-bar, barrier-bar environments. Upward in this section, sandstones become thicker and log character<br />
changes from upward-coarsening to blocky as depositional systems grade into the thick, massive, sandstone-rich<br />
fluvial section of the middle Travis Peak. Across much of east Texas, lower Travis Peak delta-fringe deposits are<br />
absent and Travis Peak fluvial sandstones directly overlie the Knowles Limestone or its updip fine-grained clastic<br />
equivalents (Saucier, 1985). This is because the stable Travis Peak shelf, which is underlain by continental crust,<br />
probably did not subside readily relative to rate of lower Travis Peak deposition, and lower Travis Peak rivers eroded<br />
and reworked their own delta-fringe deposits as Travis Peak fluvial-deltaic systems prograded seaward (Saucier, 1985).<br />
Little analysis is devoted to these lower delta-fringe sandstones in the Travis Peak literature, nor is any mention<br />
made of hydrocarbon production from them. Perhaps this is because they are absent across much of the updip portion<br />
of East Texas Basin, and also, as discussed below in the section on diagenesis, reservoir properties of Travis Peak<br />
sandstones deteriorate significantly with depth.<br />
Middle Travis Peak Fluvial Deposits<br />
As shown in figures 5 and 6, the middle Travis Peak sandstone-rich, fluvial interval accounts for approximately<br />
three fourths of the 2,000-foot thickness of the Formation in east Texas. Travis Peak fluvial systems prograded<br />
rapidly seaward across East Texas Basin, then slowly retreated landward with time, primarily in response to relative<br />
rise in sea level documented during this portion of Lower Cretaceous time (McFarlan, 1977; Todd and Mitchum,<br />
1977; Tye, 1989, 1991). However, the thick sequence of Travis Peak fluvial sandstones and associated finer-grained,<br />
floodplain deposits reflects deposition during a time when aggradation (sediment supply) and development of<br />
accommodation space (shelf subsidence) were in approximate balance. Although channel sandstones usually are<br />
stacked, amalgamated units with scoured basal contacts, there is little evidence of significant incision within the<br />
thick Travis Peak fluvial sequence (Davies and others, 1991).<br />
The relative rise in sea level that occurred during Travis Peak time might have been responsible for an observed<br />
evolution in patterns of fluvial deposition from braided to meandering (Tye, 1989, 1991), as shown in figure 6.<br />
Regional stratigraphic studies across East Texas Basin suggest that early Travis Peak fluvial systems consisted of<br />
low-sinuosity, braided channels with bed-load movement of sand being the dominant sediment transport mechanism.<br />
With relative rise in sea level, upper Travis Peak fluvial systems evolved into higher-sinuosity braided and<br />
meandering rivers carrying significantly larger volumes of mud in suspension in addition to bed-load sand. Data from<br />
cores indicate that channel sandstones comprise 65 percent of the total rock volume in the low-sinuosity fluvial<br />
section, with the remaining 35 percent being finer-grained, argillaceous crevasse-splay sandstones and overbank<br />
mudstones (Davies and others, 1991). In the higher-sinuosity, meandering fluvial system, channel sandstones<br />
comprise only 30 percent of the section, with 70 percent of the rock volume consisting of fine-grained, argillaceous<br />
overbank sandstones and floodplain shales.<br />
6
Whereas Tye (1989, 1991) suggests that Travis Peak fluvial systems evolved from low- to high-sinuosity with<br />
time, Davies and others (1991) report channel type varies more with geographic position within the Travis Peak<br />
depocenter. They suggest that high-sinuosity channels comprise the bulk of the fluvial section on the northeastern<br />
flank of the Travis Peak depocenter, while low-sinuosity channels predominate in central portions of the depocenter.<br />
Davies and others (1991), however, admit that distinguishing between high- and low-sinuosity channel systems<br />
using wireline-logs alone in the absence of core data is difficult, and they recognize that most of the 2,000-foot<br />
Travis Peak section in East Texas Basin is not cored. Evolution of fluvial systems from low- to high-sinuosity with<br />
time is consistent with the documented relative rise in sea level, gradation of fluvial deposits into paralic deposits in<br />
the upper Travis Peak, and culmination of the transgression with deposition of Sligo carbonates. Marzo and others<br />
(1988) showed that in moving from proximal to distal positions within a fluvial-sheet sandstone sequence,<br />
amalgamated sandstone bodies become less connected and more separated by mudstones. Vertical change from stacked<br />
braided-channel sandstones to meandering-channel sandstones isolated within floodplain shales in the Travis Peak<br />
Formation, therefore, might be expected at any given location in East Texas Basin as a result of landward<br />
displacement of fluvial-deltaic facies during the overall Travis Peak transgression.<br />
Low-Sinuosity Fluvial System<br />
Within the Travis Peak low-sinuosity fluvial system, average thickness of individual channel sandstones is eight<br />
feet (Davies and others, 1991). Abandoned-channel deposits of gray-black shale that cap channel sandstones are not<br />
common, and where present are only a few inches thick. Because channel sandstones, reflecting successive flood<br />
events, tend to accumulate in vertical or en echelon patterns, solitary channel deposits are rare. Although channels<br />
have scoured basal contacts, significant amounts of incision have not been observed. Basal-lag conglomerates with<br />
black-shale clasts are thin, and generally occur only above underlying channels that are capped by thin abandonment<br />
units. Travis Peak amalgamated channel-sandstone units range from 12 to 45 feet thick and consist of two to five<br />
stacked channels (Davies and others, 1991). Occasionally, massive sandstone units up to 250 feet in thickness occur<br />
(Saucier, 1985). Sedimentary structures consist predominantly of planar cross stratification and horizontal<br />
laminations, with minor amounts of ripples (Tye, 1991; Davies and others, 1991). Because of the low amount of<br />
mud transported as suspended load, mud drapes are not common. Main barriers to flow that might compartmentalize<br />
these reservoir sandstones, therefore, are zones where porosity is occluded as a result of extensive quartz cementation.<br />
Stacked channel sandstone sequences are capped by red and gray floodplain mudstones and siltstones that commonly<br />
show evidence of roots and would seem to provide top seals. However, lateral switching in conjunction with vertical<br />
and en echelon stacking of channels results in multi-lateral and multistory sandstone units which span wide<br />
geographic areas and probably have complex interconnections with respect to pressure communication and fluid<br />
migration. Low-sinuosity channels are broad, tabular sandstone bodies, with thickness to width ratios of<br />
approximately 1:800 (Tye, 1991; Dutton and others, 1991a). At North Appleby Field in Nacogdoches County,<br />
Texas, Tye (1991) found channel-belt widths ranging from three to six miles. In a gas-productive zone at the base of<br />
the low-sinuosity fluvial section at North Appleby Field, Tye (1991) reported average thickness of stacked channelbelt<br />
sandstones to be 26 feet and average channel-belt width to be 4.5 miles. Patterns of channel avulsion in lowsinuosity<br />
rivers tend to result in preservation of long sandstone bodies, and Davies and others (1991) demonstrated<br />
that Travis Peak channel-belt sandstone bodies commonly span areas of 5,000 acres or more. Tye reports individual<br />
productive channel-belt sandstone bodies can cover 25,000 acres.<br />
7
High-Sinuosity Fluvial System<br />
High-sinuosity channel deposits in the Travis Peak Formation commonly include a lower sandstone unit that<br />
accumulates as a migrating point-bar deposit in an active channel and an overlying mudstone plug deposited in the<br />
abandoned-channel stage (Davies others, 1991). Point-bar sandstone thickness commonly is 12 to 15 feet with the<br />
lower 8 to 10 feet consisting of relatively clean, trough-cross-bedded sandstone overlain by a thinner sequence of<br />
finer-grained often shaly, rippled, sandstone with mudstone drapes. Mudstone drapes are deposited during periods of<br />
normal, low-velocity flow in between flood events, and collectively they can compartmentalize the upper portions of<br />
point-bar sandstone units. Eventual cut off of meander loops by channel avulsion during floods results in isolation of<br />
point-bar sandstone units. Although high-sinuosity channel sandstone units in the Travis Peak occasionally exhibit<br />
vertical stacking or cross cutting of successive units, most such point-bar sandstone units are isolated from each<br />
other by overbank mudstones and siltstones, which comprise 70 percent of the high-sinuosity sequence (Davies and<br />
others, 1991). High-sinuosity Travis Peak fluvial-channel deposits generally have thickness to width ratios of 1:100<br />
(Dutton and others, 1991). Geological estimates of the size of fully developed Travis Peak point-bar units are<br />
approximately 300 acres, a figure which agrees closely with drainage areas predicted from GRI reservoir-engineering<br />
simulation (Davies and others, 1991).<br />
Upper Travis Peak Coastal-Plain and Paralic Deposits<br />
Cores from the upper Travis Peak interval reveal the most diverse assemblage of environments within the Travis<br />
Peak Formation, and this diversity manifests itself along depositional dip from northwest to southeast across east<br />
Texas into north Louisiana (Tye, 1989). In updip regions, sandstones represent meandering-channel and overbank,<br />
crevasse-splay deposits, and grade downdip into distributary-channel, distributary-mouth-bar, delta-front,<br />
interdistributary-bar deposits. Farther downdip, sandstones were deposited in estuarine, tidal-flat, tidal-channel, and<br />
marine settings. Point-bar sandstones in updip coastal-plain settings are slightly thinner (5 to 15 feet thick) than<br />
those in the underlying high-sinuosity channel sequence, but exhibit similar characteristics, including isolation from<br />
each other within overbank mudstone deposits (Tye, 1989). Farther downdip, blocky to upward-fining sandstones 10<br />
to 25 feet thick display trough and ripple cross bedding with abundant burrows, flaser bedding, bi-directional cross<br />
stratification indicative of tidal currents, coal streaks and organic debris, and occasional bivalve and gastropod shell<br />
fragments (Tye, 1989). These sandstones are interpreted as deposits from distributary-mouth bars, and tidal and<br />
estuarine channels. Thinner sandstones with spiky log characters are believed to have accumulated in tidal-flat<br />
settings. Most all these sandstones are isolated within mudstones.<br />
DIAGENESIS OF TRAVIS PEAK SANDSTONES<br />
Burial History<br />
Following deposition, the Travis Peak Formation experienced progressively deeper burial in east Texas until<br />
late, mid-Cretaceous time when the Sabine Arch witnessed the first of two periods of uplift and erosion (Jackson and<br />
Laubach, 1991; Dutton and Diggs, 1992). Prior to this late mid-Cretaceous uplift, total burial depth and depth from<br />
surface were identical because Travis Peak strata were essentially horizontal. Because late mid-Cretaceous erosion was<br />
significantly greater on the crest than on the flanks of the Sabine Uplift, Travis Peak strata no longer were horizontal<br />
as renewed burial commenced in late Cretaceous time. Burial continued into the early Tertiary when a second period<br />
of uplift and erosion resulted in removal of 1,500 feet of section across most of northeast Texas (Jackson and<br />
Laubach, 1991; Dutton and Diggs, 1992). Consequently, maximum burial depth for the Travis Peak at any given<br />
locale in northeast Texas is 1,500 feet greater than present burial depth.<br />
In northeast Texas, most Travis Peak sandstones are fine- to very-fine-grained quartzarenites and subarkoses.<br />
Average framework composition is 95 percent quartz, 4 percent feldspar, and 1 percent rock fragments (Dutton and<br />
Diggs, 1992). Dutton and Diggs (1992) defined clean sandstones as those with less that two-percent detrital clay<br />
matrix. Average grain size of clean fluvial sandstones is 0.15 mm versus 0.12 mm for clean paralic sandstones.<br />
8
COMPACTION AND CEMENTATION<br />
In northeast Texas, Travis Peak sandstones experienced a complex diagenetic history involving (1) mechanical<br />
compaction, (2) precipitation of cements and authigenic minerals, including dolomite, quartz, illite, chlorite, and<br />
ankerite, (3) generation of secondary porosity through dissolution of feldspar, and (4) formation of reservoir bitumen<br />
(Dutton and Diggs, 1992). Loss of primary sandstone porosity in near-surface settings following deposition was<br />
negligible in most fluvial sandstones. Minor loss of porosity occurred in paralic sandstones from precipitation of<br />
dolomite cement. From surface to a burial depth of about 3,000 feet, Travis Peak sandstones lost primary porosity<br />
mainly though mechanical compaction. Potential further compaction was halted by extensive quartz cementation that<br />
occurred between 3,000 and 5,000 feet. The next significant diagenetic event was creation of secondary porosity<br />
through dissolution of feldspar. Additional minor porosity reduction occurred by a depth of 7,500 feet from<br />
precipitation of authigenic chlorite, illite, and ankerite. Sandstones on higher parts of the Sabine Uplift did not<br />
experience further porosity reduction from cementation. However, in Travis Peak sandstones buried below 8,000 feet<br />
on the west flank of the Uplift, a second episode of extensive quartz cementation occurred in which silica was<br />
generated from pressure solution associated with development of stylolites.<br />
Reservoir Bitumen<br />
A late-stage diagenetic event that significantly reduced porosity and permeability in some Travis Peak sandstones<br />
in northeast Texas was formation of reservoir bitumen (Dutton and others, 1991a; Lomando, 1992). Reservoir<br />
bitumen is a solid hydrocarbon that lines and fills both primary and secondary pores in Travis Peak sandstones.<br />
Formation of reservoir bitumen occurred after precipitation of quartz and ankerite cement (Dutton and others, 1991a),<br />
and its occurrence is limited to sandstones within the upper 300 feet of the Travis Peak Formation, which are<br />
primarily paralic sandstones. Geochemical analyses suggest that reservoir bitumen formed from deasphalting of oil<br />
trapped in pores of upper Travis Peak sandstones (Rogers and others, 1974; Dutton and others, 1991). The oil<br />
probably was similar to oil currently being produced from some Travis Peak sandstone reservoirs in fields in<br />
northeast Texas. According to Tissot and Welte (1978), deasphalting commonly occurs in medium to heavy oil when<br />
large amounts of gas dissolve into the oil. Gas that dissolves in an oil to cause deasphalting can be generated from<br />
thermal alteration of the oil itself, or from introduction of new gas from outside the reservoir. Level of kerogen<br />
maturity in mudstones interbedded with Travis Peak sandstone reservoirs suggests that oils in Travis Peak sandstones<br />
were subjected to temperatures sufficient to generate gas internally (Dutton, 1987).<br />
Among sandstones in the upper Travis Peak that contain reservoir bitumen, average and maximum volumes of<br />
bitumen are 4 percent and 19 percent, respectively. Samples examined by Dutton and others (1991a) that contain<br />
reservoir bitumen had average porosity of 7.5 percent prior to formation of bitumen. Formation of reservoir bitumen<br />
reduced that average porosity to 3.5 percent, a loss of 55 percent of the pre-bitumen pore space. Within the paralic<br />
facies, where most of the reservoir bitumen occurs, permeability patterns probably controlled the pore spaces into<br />
which oil originally migrated and in which reservoir bitumen eventually formed. Cross-bedded and rippled sandstones<br />
that are clean and well-sorted contain large volumes of reservoir bitumen, whereas burrowed, shaly, poorly-sorted<br />
sandstones have little or no reservoir bitumen. Consequently, many sandstone intervals that had the highest porosity<br />
and permeability following compaction and cementation now have little or no porosity because of formation of<br />
reservoir bitumen. Dutton and others (1991a) provide a specific example demonstrating the deleterious effect of<br />
reservoir bitumen on porosity, permeability, and wireline-log measurement of porosity. They describe a Travis Peak<br />
sandstone that has no reservoir bitumen from a depth of 8,216.5 feet in a particular well as having 11.6 percent<br />
porosity as measured by porosimeter, in-situ permeability of 22.5 mD, and average grain density of 2.65 g/cm 3 . Less<br />
that one foot below at 8,217.2 feet, the sandstone contains reservoir bitumen, and has porosimeter porosity of 5.4<br />
percent, permeability of 0.0004 mD, and average grain density of 2.51 g/cm 3 . Not only does reservoir bitumen<br />
significantly reduce porosity and permeability, but it dramatically affects porosity measurements from a neutrondensity<br />
log. Although porosimeter porosity in the sandstone at 8217.2 feet was measured as 5.4 percent, porosity<br />
determined from a neutron-density log was 13 percent. Overestimation of porosity with a neutron-density log occurs<br />
because (1) density of reservoir bitumen is approximately the same as density of drilling-mud filtrate, which<br />
penetrates sandstone pores during drilling, and (2) 90 to 99 percent of reservoir bitumen is measured as porosity by a<br />
neutron log as a result of its hydrogen content.<br />
9
Porosity<br />
Porosity and permeability of Travis Peak reservoir sandstones are controlled directly by diagenetic factors<br />
described above. Most hydrocarbon production from Travis Peak sandstones in northeast Texas is from drilling<br />
depths between 6,000 and 10,000 feet, and sandstone porosity decreases significantly with depth through that interval<br />
(Dutton and Diggs,1992). Average porosity of clean Travis Peak sandstones decreases from 16.6 percent at 6,000 feet<br />
to 5.0 percent at 10,000 feet. For all Travis Peak sandstones (clean and shaly), average porosity decreases from 10.6<br />
percent at 6,000 feet to 4.4 percent at 10,000 feet (fig. 7). Decrease in porosity from 6,000 to 10,000 feet is not<br />
caused by increased compaction (Dutton and others, 1991a; Dutton and Diggs, 1992). Decrease in porosity with<br />
depth results primarily from (1) increasing amount of quartz cement, and (2) decrease in amount of secondary<br />
porosity. Secondary porosity was generated almost exclusively from dissolution of feldspar, and original feldspar<br />
content of Travis Peak sandstones decreases systematically with depth (Dutton and Diggs, 1992). High initial<br />
porosity together with high degree of connectivity of multi-lateral, multistory braided-channel sandstones permitted<br />
large volumes of diagenetic fluids to move through the thick Travis Peak fluvial-sandstone sequence. As a result, the<br />
thick fluvial section generally lost most of its primary porosity to extensive quartz cementation. However, because<br />
sandstones in the upper 300 feet of the Travis Peak are encased in mudstones, smaller volumes of diagenetic fluids<br />
moved through these sandstones, and they often retain significant primary porosity (Dutton and Land, 1988).<br />
Within Travis Peak fluvial-sandstone reservoirs at North Appleby Field, Tye (1991) reported that greatest<br />
thickness of porous sandstone generally occurs in the widest portions of channel belts, and highest porosities occur<br />
within three to five feet upwards from the base of channels.<br />
Permeability<br />
According to Dutton and Diggs (1992), average stressed permeability of clean Travis Peak sandstones in<br />
northeast Texas decreases by four orders of magnitude from 10 mD at 6,000 feet to 0.001 mD at 10,000 feet. For all<br />
sandstones, average stressed permeability declines from 0.8 mD to 0.0004 mD at 10,000 feet (fig. 8). Decrease in<br />
permeability from 6,000 to 10,000 feet primarily is a function of (1) decrease in porosity, which in turn is caused<br />
principally by increasing quartz cement, and (2) increasing overburden pressure that closes narrow pore throats.<br />
Whereas this latter effect has a significant impact on permeability, it has little effect on porosity.<br />
At any given depth within the Travis Peak Formation in northeast Texas, permeability ranges over<br />
approximately four orders of magnitude. Also, at any given depth, average permeability is 10 times greater in clean,<br />
fluvial sandstones than in clean, paralic sandstones. According to Dutton and Diggs (1992), superior permeability of<br />
clean, fluvial sandstones probably can be attributed to three factors. First, because paralic sandstones are finer<br />
grained, they had poorer permeability than coarser-grained fluvial sandstones at the time of deposition. Second,<br />
although paralic sandstones and fluvial sandstones contain similar amounts of quartz cement, paralic sandstones<br />
contain an average of seven percent more total cement by having significantly larger volumes of authigenic<br />
dolomite, ankerite, illite and chlorite, as well as more reservoir bitumen. Thirdly, much of the porosity in paralic<br />
sandstones is secondary porosity and also microporosity associated with authigenic illite and chlorite that occurs<br />
within secondary pores. Secondary porosity and microporosity both contribute significantly less to permeability than<br />
does primary porosity in which pores are better connected.<br />
10
HYDROCARBON PRODUCTION<br />
Although clean, paralic sandstones have an order of magnitude poorer permeability than clean fluvial sandstones<br />
at any given depth, most hydrocarbon production from the Travis Peak Formation in east Texas has come from<br />
paralic and high-sinuosity fluvial sandstones in the upper 300 feet of the Formation (Fracasso and others, 1988;<br />
Dutton and others, 1991a; Dutton and others, 1993). Concentration of producible hydrocarbons in sandstones in the<br />
upper part of the Formation probably results from absence of effective traps and seals in the underlying sandstonerich,<br />
low-sinuosity fluvial sequence. Multi-story and multi-lateral fluvial-channel belts within the fluvial sequence<br />
afford a highly interconnected network of channel sandstones that provide effective migration pathways for<br />
hydrocarbons. Additionally, hydrocarbon migration through this sandstone network would be enhanced by presence of<br />
natural fractures which are significantly more abundant in the quartz-cemented, sandstone-rich, low-sinuosity fluvial<br />
sequence than in overlying paralic sandstones (Dutton and others, 1991a). Consequently, most hydrocarbons<br />
migrating upward into the Travis Peak Formation may have passed through the sandstone-rich fluvial section until<br />
they were trapped within upper Travis Peak paralic and high-sinuosity, fluvial sandstones, which are encased in<br />
mudstones that provide effective hydrocarbon seals. Main reservoirs within the paralic sequence include tidal-channel<br />
and tidal-flat sandstones along with high-sinuosity, fluvial-channel sandstones deposited in coastal-plain settings<br />
(Tye, 1989; Dutton and others, 1991b)<br />
Most Travis Peak hydrocarbon production comes from (1) structural, combination, or stratigraphic traps<br />
associated with low-relief closures or structural noses on the crest and flanks of the Sabine Uplift, and (2) structural<br />
or combination traps associated with salt structures in the East Texas and North Louisiana Salt Basins (Kosters and<br />
others, 1989; Dutton and others, 1991b). Combination and stratigraphic traps occur where fluvial sandstones pinch<br />
out into floodplain mudstones and/or paralic sandstones pinch out into tidal-flat, estuarine, or shallow-marine<br />
mudstones across closures, noses, or on regional dip.<br />
According to Fracasso and others (1988), wells on west flanks of structures in northeast Texas generally require<br />
hydraulic-fracture treatments to produce commercially from Travis Peak sandstone reservoirs, whereas wells on the<br />
east flanks usually flow gas at commercial rates without stimulation. These trends reflect a general east to west<br />
deterioration in Travis Peak sandstone porosity and permeability across structures. These east-west patterns in<br />
reservoir quality of upper Travis Peak paralic sandstones are not related to depositional facies changes. According to<br />
Fracasso and others (1988), these patterns are attributed to controls exerted by structures on regional flow of<br />
diagenetic fluids which resulted in cementation being fostered on western flanks, or inhibited on eastern flanks, or<br />
both.<br />
SOURCE ROCKS<br />
In a study of diagenesis and burial history of the Travis Peak Formation in east Texas, Dutton (1987) showed<br />
that shales interbedded with Travis Peak sandstone reservoirs were deposited in fluvial-deltaic settings where organic<br />
matter commonly was oxidized and not preserved. With measured values of total organic carbon (TOC) in Travis<br />
Peak shales generally are less than 0.5 percent, these shales are not considered as potential hydrocarbon source rocks,<br />
according to Tissot and Welte (1978). Dutton (1987) suggested that the most likely sources for hydrocarbons in<br />
Travis Peak reservoirs in east Texas are (1) prodelta and basinal marine shales of the Jurassic Bossier Shale, basal<br />
formation of the Cotton Valley Group, and (2) laminated, lime mudstones of the lower member of the Jurassic<br />
Smackover Formation (fig. 3). Sassen and Moore (1988) demonstrated that Smackover carbonate mudstones are a<br />
significant hydrocarbon source rock in Mississippi and Alabama. Wescott and Hood (1991) documented the Bossier<br />
Shale as a major source rock in east Texas. Presley and Reed (1984) suggested that gray to black shales interbedded<br />
with Cotton Valley sandstones, as well as the underlying Bossier Shale, could be a significant source for gas. In<br />
summary, despite limited source-rock data, it seems likely that significant hydrocarbon source rocks occur in Bossier<br />
Shales of the Cotton Valley Group, which underlies the Travis Peak Formation, and also in stratigraphically lower<br />
Smackover carbonate mudstones (fig. 3).<br />
11
BURIAL AND THERMAL HISTORY<br />
Vitrinite reflectance (R o) is a measure of thermal maturity of source rocks based on diagenesis of vitrinite, a type<br />
of kerogen derived from terrestrial woody plant material. In studying diagenesis and burial history of the Travis Peak<br />
Formation in east Texas, Dutton (1987) reported that measured R o values for Travis Peak shales generally range from<br />
1.0 to 1.2 percent, indicating that these rocks have passed through the oil window (R o = 0.6 to 1.0 percent), and are<br />
approaching the level of onset of dry-gas generation (R o = 1.2 percent) (Dow, 1978). Maximum R o of 1.8 percent<br />
was measured in the deepest sample from a downdip well in Nacogdoches County, Texas. Despite relatively high<br />
thermal maturity levels reached by Travis Peak shales, the small amount, and gas-prone nature, of organic matter in<br />
these shales precludes generation of oil, although minor amounts of gas might have been generated (Dutton, 1987).<br />
In the absence of actual measurements of R o, values of R o can be estimated by plotting burial depth of a given<br />
source rock interval versus time in conjunction with an estimated paleogeothermal gradient (Lopatin, 1971; Waples,<br />
1980). Dutton (1987) presented burial-history curves for tops of the Travis Peak, Cotton Valley, Bossier Shale, and<br />
Smackover for seven wells on the crest and western flank of the Sabine Uplift. The burial-history curves show total<br />
overburden thickness through time and use present-day compacted thicknesses of stratigraphic units. Sediment<br />
compaction through time was considered insignificant because of absence of thick shale units in the stratigraphic<br />
section. Loss of sedimentary section associated with late, mid-Cretaceous and mid-Eocene erosional events was<br />
accounted for in the burial-history curves.<br />
Dutton (1987) provided justification for using the average present-day geothermal gradient of 2.1º F/100 ft for<br />
the paleogeothermal gradient for the five northernmost wells. Paleogeothermal gradients in the two southern wells<br />
probably were elevated temporarily because of proximity to the area of initial continental rifting. Based on the crustal<br />
extension model of Royden and others (1980), Dutton (1987) estimated values for elevated paleogeothermal gradients<br />
for these two wells for 80 m.y. following the onset of rifting before reverting to the present-day gradient for the past<br />
100 m.y.<br />
Using estimated paleogeothermal gradients in conjunction with burial-history curves, Dutton (1987), found that<br />
calculated values of R o for Travis Peak shales agree well with measured values. Because of this agreement, Dutton<br />
(1987) used the same method to calculate R o values for tops of the Cotton Valley, Bossier, and Smackover<br />
Formations in east Texas. Estimated R o values for the Bossier Shale and Smackover in seven wells range from 1.8 to<br />
3.1 percent and 2.2 to 4.0 percent, respectively, suggesting that these rocks reached a stage of thermal maturity in<br />
which dry gas was generated. Assuming that high-quality, gas-prone source rocks occur within these two formations,<br />
it is likely that one or both of these units generated gas found in Travis Peak reservoirs.<br />
No such regional source-rock and thermal-maturity analysis is known for Travis Peak (Hosston) Formation in<br />
northern Louisiana. Scardina (1981) presented burial-history data for the Cotton Valley Group, but included no<br />
information on geothermal gradients and thermal history of rock units. Present-day reservoir temperatures in Travis<br />
Peak sandstones of east Texas and northern Louisiana both are in the 200º to 250º F range (Table 1). It is likely that<br />
Bossier and Smackover source rocks in northern Louisiana have experienced a relatively similar thermal history to<br />
their stratigraphic counterparts in east Texas and, therefore, are sources for Travis Peak gas in northern Louisiana.<br />
Herrmann and others (1991) presented a burial-history plot for Ruston Field in northern Louisiana. At Ruston Field,<br />
they suggest that Smackover gas was derived locally from Smackover lime mudstones and Cotton Valley gas from<br />
Cotton Valley and Bossier shales. Their burial-history plot shows onset of generation of gas from Smackover and<br />
Cotton Valley source rocks at Ruston Field occurred about 80 Ma and 45 Ma, respectively. These estimates are<br />
reasonably consistent with Dutton’s (1987) date of 57 Ma for onset of generation of dry gas from Bossier Shales in<br />
east Texas. Most salt structures in East Texas Salt Basin were growing during Travis Peak deposition (McGowen<br />
and Harris, 1984) and presumably were in North Louisiana Salt Basin, as well. Therefore, these structures would<br />
have provided traps for hydrocarbons generated from Smackover, Bossier and Cotton Valley source rocks. Also, as<br />
noted earlier in this report, the Sabine Uplift has been a positive feature for the past 60 m.y. (Kosters and others,<br />
1989; Jackson and Laubach, 1991). It therefore would have been a focal area for gas migrating from Smackover,<br />
Bossier, and Cotton Valley source rocks in East Texas and North Louisiana Salt Basins.<br />
12
ABNORMAL PRESSURES<br />
Pore pressure or reservoir pressure commonly is reported as a fluid-pressure gradient (FPG) in pounds per square<br />
inch/foot (psi/ft). Normal FPG is 0.43 psi/ft in freshwater reservoirs and 0.50 psi/ft in reservoirs with very saline<br />
waters (Spencer, 1987). In his study of abnormally high pressures in basin-center gas accumulations in Rocky<br />
Mountain basins, Spencer (1987) considered reservoirs to be significantly overpressured if FPGs exceed 0.50 psi/ft<br />
where waters are fresh to moderately saline, and 0.55 psi/ft where waters are very saline. With formation-water<br />
salinity of Travis Peak sandstone reservoirs on the order of 170,000 ppm TDS (Dutton and others, 1993), salinity is<br />
considered high, and these reservoirs should be considered to be significantly overpressured if their FPGs exceed 0.55<br />
psi/ft.<br />
Calculated FPGs for Travis Peak sandstone reservoirs for various oil and gas fields in northeast Texas and<br />
northern Louisiana are presented in table 1, and are shown in map view in figures 9 and 10. FPGs were calculated<br />
from initial-shut-in pressures reported in Herald (1951), Shreveport Geological Society Reference <strong>Report</strong>s (1946,<br />
1947, 1951, 1953, 1956, 1963, 1987), Kosters and others (1989), Shoemaker (1989), and Bebout and others (1992).<br />
Multiple FPG values for a particular field in figures 9 and 10 refer to FPGs calculated for different, stacked Travis<br />
Peak sandstone reservoirs in that field. As shown in table 1 and figures 9 and 10, most calculated FPGs are between<br />
0.41 and 0.49 psi/ft. Higher FPGs were encountered in three fields in northeast Texas (fig. 9), 0.53 psi/ft at Tri-<br />
Cities and Percy-Wheeler Fields, and 0.54 psi/ft at Carthage Field. A gradient of 0.79 psi/ft was calculated for one<br />
Travis Peak sandstone reservoir in Clear Branch Field in northern Louisiana, although gradients in three other Travis<br />
Peak reservoirs within the same field were 0.47, 0.48, and 0.48 psi/ft (table 1, fig. 10). A number of other fields<br />
scattered geographically across northeast Texas and northern Louisiana exhibit below normal FPGs ranging from<br />
0.36 to 0.38 psi/ft. Lowest FPG in the Travis Peak field trend is 0.27 psi/ft in Village Field, Columbia County,<br />
Arkansas (fig. 10).<br />
In north Louisiana where Travis Peak hydrocarbon production comes from various interdeltaic sandstones<br />
scattered throughout the Travis Peak section, shut-in pressure data are available from a variety of depths within the<br />
Formation. In northeast Texas, however, most production comes from sandstone reservoirs in the upper 300 feet of<br />
the Travis Peak Formation. Consequently, shut-in pressure data are abundant for the upper 300 to 500 feet of the<br />
Travis Peak, but are limited in the lower three-fourths of the Formation, which includes the thick fluvial sequence<br />
that characterizes the bulk of the Travis Peak in northeast Texas. Calculated FPGs from sandstone reservoirs at<br />
depths of 500 or more feet below top to the Travis Peak are normal at Appleby North, Bethany, Cedar Springs, and<br />
Trawick Fields, and sub-normal at Waskom and Whelan Fields (table 1, fig 9). Reservoirs in the middle and lower<br />
Travis Peak section at Woodlawn and Carthage Fields also are normally pressured, according to Al Brake (BP Amoco<br />
engineer, personal communication, 2000), who also reports no knowledge of any significant overpressure in Travis<br />
Peak reservoirs at any depth within the Formation in northeast Texas. Best available data, therefore, suggest that<br />
significant overpressures do not occur within any reservoirs throughout the entire Travis Peak Formation in<br />
northeast Texas.<br />
13
HYDROCARBON-WATER CONTACTS<br />
Based on data for various Travis Peak oil and gas fields reported primarily by the Shreveport Geological Society<br />
(1946, 1947, 1951, 1953, 1956, 1963, 1987), East Texas Geological Society (Shoemaker, 1989), and Texas Bureau<br />
of Economic Geology (Herald, 1951), hydrocarbon-water contacts have been documented in Travis Peak sandstone<br />
reservoirs in 10 fields across east Texas and north Louisiana (figs. 11 and 12). Field reports edited by Herald (1951)<br />
do not use the terms “gas-water contact” or “oil-water contact”, but do report “elevation of bottom of oil or gas” and<br />
“lowest oil or gas”. It seems likely that “lowest gas” refers to the lowest elevation gas had been encountered by<br />
drilling at the time the report was written, whereas “elevation of bottom of gas” refers to an actual gas/water contact.<br />
Supporting that interpretation is the fact that the term “elevation of bottom of gas” clearly was used to indicate<br />
elevation of a gas-oil contact at Henderson Field (Herald, 1951). If this interpretation of “elevation of bottom of gas”<br />
is correct, hydrocarbon-water contacts are documented in Travis Peak sandstone reservoirs in four additional fields<br />
(Herald, 1951), as indicated in table 1 and shown by dashed field outlines in figure 11.<br />
With most Travis Peak production in northeast Texas coming from the upper 300 feet of the Formation,<br />
hydrocarbon-water contacts documented in Travis Peak sandstone reservoirs in the seven Texas fields indicated in<br />
table 1 and figure 11, all occur within reservoirs in that upper part of the Formation. No documentation of<br />
hydrocarbon-water contacts in middle or lower Travis Peak reservoirs in northeast Texas has been found. At Appleby<br />
North Field, Nacogdoches County, Texas, Tye (1991) reported that gas seems to be present throughout the Travis<br />
Peak section, though not necessarily in commercial amounts, and a discrete gas-water contact does not exist within<br />
the Travis Peak.<br />
An attempt was made to document presence or absence of hydrocarbon-water contacts in additional Travis Peak<br />
fields through analysis of data from drillstem tests (DSTs) and production tests. The goal was to determine if fields<br />
that produce from Travis Peak sandstones are flanked by dry holes that tested water only without gas, indicative of<br />
presence of a gas-water contact. A data set of wells penetrating the Travis Peak and Cotton Valley Group across<br />
much of northeast Texas and north Louisiana was extracted from a database provided by IHS <strong>Energy</strong> Group<br />
(petroROM Version 3.43) for analysis of DST and production-test data using ARCVIEW software. Well data were<br />
sorted and displayed in map view using ARCVIEW software such that wells which produce from Travis Peak<br />
sandstones could be distinguished from Travis Peak dry holes with tests. While viewing the map display, test results<br />
from any particular well could be examined.<br />
Reconnaissance analysis of test data show that water was recovered without gas from production tests or DSTs<br />
in Travis Peak sandstone reservoirs in wells on one or more flanks of Bethany-Longstreet, Cheniere Creek, and<br />
Caspiana Fields in northern Louisiana (fig. 12). These data indicate presence of gas-water contacts within Travis<br />
Peak sandstone reservoirs in those fields.<br />
In summary, hydrocarbon-water contacts have been documented in Travis Peak sandstone reservoirs at various<br />
depths within the formation in north Louisiana and within the upper 300 feet of the Formation in northeast Texas.<br />
Although data from the middle and lower Travis Peak section in northeast Texas are limited, no hydrocarbon-water<br />
contacts have been reported from that interval in northeast Texas.<br />
14
DISCUSSION OF EVIDENCE FOR AND AGAINST BASIN-CENTER GAS<br />
Source Rocks and Burial/Thermal History<br />
Source rocks responsible for generating gas in basin-center gas accumulations commonly are in stratigraphic<br />
proximity to low-permeability reservoirs that they are charging with gas. As described above, shales interbedded with<br />
Travis Peak sandstone reservoirs in northeast Texas have passed through the oil window and are approaching the<br />
level of onset of dry-gas generation. However, these shales are primarily oxidized floodplain shales with TOC<br />
content generally less than 0.5 percent, and therefore are not considered as potential hydrocarbon source rocks (Tissot<br />
and Welte, 1978; Dutton, 1987). Dutton (1987) suggested that Travis Peak marine shales depositionally downdip<br />
from the Travis Peak hydrocarbon-productive trend probably have higher TOC content, and thus might be potential<br />
source rocks. Because these marine shales occur primarily in Louisiana, Dutton (1987) expressed concern about long<br />
lateral migration distances that would be required to move hydrocarbons from these shales to updip Travis Peak<br />
sandstone reservoirs in east Texas. Dutton (1987) concluded that source rocks most likely to have generated<br />
hydrocarbons produced from Travis Peak reservoirs in east Texas are the marine Bossier Shale, which is the<br />
lowermost formation of the Cotton Valley Group, and Smackover laminated lime mudstones, which lie below the<br />
Bossier Shale (fig. 3). Gray to black marine shales interbedded with Cotton Valley sandstones also might be<br />
potential source rocks. As discussed above, burial- and thermal-history data for the northern Gulf Coast Basin<br />
suggest that burial depths of Bossier and Smackover source rocks, in conjunction with the regional geothermal<br />
gradient, have been sufficient to generate dry gas. Also, as described above, time of generation of most of this gas<br />
postdates development of both the Sabine Uplift and structures in East Texas and North Louisiana Salt Basins.<br />
Available data, therefore, provide a reasonable scenario for charging Travis Peak sandstone reservoirs with oil and<br />
gas. Postulated Bossier Shale source rocks, however, are separated stratigraphically from Travis Peak sandstone<br />
reservoirs by at least 1,000 feet of tight Cotton Valley sandstones and interbedded shales, and also by the tight<br />
Knowles Limestones across much of the area (fig. 4). Potential Smackover source rocks are stratigraphically lower<br />
yet, and are separated from the Bossier by Haynesville/Buckner units, which include anhydrite. Although a reasonable<br />
scenario can be established for charging Travis Peak sandstone reservoirs with gas derived from stratigraphically<br />
lower source rocks, abundant gas-prone source rocks are not proximal to those reservoirs. This is not characteristic,<br />
in general, of classic basin-center gas accumulations.<br />
Porosity and Permeability<br />
Basin-center, continuous-gas accumulations commonly involve a large volume of gas-saturated reservoir rock in<br />
which presence of gas cuts across stratigraphic units. Such gas accumulations require a regional seal to trap gas, and<br />
that seal characteristically is provided by inherent low-permeability of reservoir rocks themselves. Thus, continuousgas<br />
reservoirs characteristically have low permeability, and when reservoirs are sandstones, they generally are referred<br />
to as tight-gas sandstones.<br />
As discussed in the introduction, the Travis Peak Formation was selected by GRI as one of two lowpermeability<br />
formations for comprehensive geologic and engineering studies under auspices of its Tight Gas Sands<br />
Program. Also, Travis Peak sandstones have been designated as “tight” by FERC in selected areas of northeast<br />
Texas, north Louisiana, and in one well in Jefferson Davis County, Mississippi (Dutton and others, 1993). That<br />
Travis Peak sandstones have been designated “tight” only in selected areas and not universally across the northern<br />
Gulf Basin, however, reflects relatively high permeability of Travis Peak sandstone reservoirs locally and significant<br />
variation of permeability with depth (fig. 8) and geographically across the northern Gulf Basin (figs. 13 and 14).<br />
As shown in figure 8, permeability of Travis Peak sandstones in northeast Texas varies significantly with depth.<br />
Above 7,500 feet, numerous Travis Peak sandstone samples exhibit permeability values above 0.1 mD, the general<br />
permeability cutoff for designation as a tight-gas sandstone. At depths less than 6,000 feet, permeability can exceed<br />
100 mD. As discussed above, decrease in permeability of Travis Peak sandstones by four orders of magnitude from<br />
6,000 to 10,000 feet in northeast Texas is controlled primarily by volume of quartz cement. Such variation with<br />
depth probably explains much of the apparent geographic variation in permeability of Travis Peak sandstones shown<br />
15
in Figures 13 and 14. Multiple values of permeability for a given field in figures 13 and 14 refer to measurements<br />
from different, stacked Travis Peak sandstones within that field. For many fields in Figures 13 and 14, a range of<br />
measured permeability values are given, probably reflecting primarily variation of sandstone permeability with depth<br />
within those fields. Abundance of high-permeability sandstones, especially in upper portions of the Travis Peak<br />
Formation, is not characteristic of reservoirs that harbor basin-center gas accumulations. This is because such higherpermeability<br />
reservoirs cannot provide their own internal, albeit leaky, seal for gas. Although sandstones throughout<br />
the entire Travis Peak Formation reportedly are charged with gas in some Travis Peak fields, though not necessarily<br />
in commercial quantities (Davies and others, 1991; Tye, 1991; Dutton and others, 1993), gas production comes<br />
primarily from sandstones in the upper 300 feet of the Formation (Fracasso and others, 1988; Al Brake, BP Amoco<br />
engineer, personal communication, 2000). To some degree, this might be a function of higher permeability of upper<br />
Travis Peak sandstones, resulting in preferential completion of upper Travis Peak zones by operators. However,<br />
Fracasso and others (1988) suggest that hydrocarbons tend to be concentrated in upper Travis Peak sandstones<br />
because these sandstones are encased in shales that provide effective traps. Underlying low-sinuosity fluvial<br />
sandstones, comprising the bulk of the Travis Peak Formation, form a highly interconnected reservoir not only by<br />
virtue of their inherent multistory, multilateral sand-body geometries, but also because of the abundance of natural<br />
vertical fractures within the highly quartz-cemented, fluvial-sandstone sequence. Thus, the thick fluvial sequence<br />
seems to provide an effective upward migration pathway for gas. Data from Woodlawn Field in Harrison County,<br />
Texas, corroborate this interpretation. According to Al Brake (BP engineer, personal communication, 2000), mudlog<br />
gas shows are prominent in sandstones within the upper 500 feet of the Travis Peak at Woodlawn Field, but<br />
generally absent in sandstones throughout the middle and lower Travis Peak. Completion attempts within the few<br />
thin middle and lower Travis Peak zones that exhibit gas shows and higher resistivities generally yield marginally to<br />
non-commercial quantities of gas before depleting and/or giving way to water production (Al Brake, BP engineer,<br />
personal communication, 2000). In summary, permeability within much of the Travis Peak Formation is<br />
significantly higher than the 0.1-mD cutoff value defining tight-gas sandstones. Traps for much of the gas in Travis<br />
Peak sandstone reservoirs are provided by mudstones that encase sandstone units in the upper portions of the<br />
Formation rather than by inherent low permeability of the sandstone reservoirs. Travis Peak sandstone reservoirs<br />
exhibit reservoir properties and trapping patterns that are not entirely characteristic of basin-center gas reservoirs in<br />
which inherent, ubiquitous, low-permeability provides a seal for thermally generated gas.<br />
Abnormal Pressures<br />
Based on the cutoff value of FPG = 0.55 psi/ft, above which Spencer (1987) considered reservoirs with highly<br />
saline waters to be significantly overpressured, virtually all Travis Peak sandstone reservoirs across northeast Texas<br />
and north Louisiana are normally pressured (figs. 9 and 10). Some Travis Peak reservoirs have slightly elevated<br />
FPGs between 0.43 and 0.54 psi/ft, and a few exhibit subnormal FPGs between 0.36 and 0.38 psi/ft. Based on data<br />
from 24 Travis Peak fields, the only Travis Peak sandstone reservoir that is significantly overpressured is one with a<br />
FPG of 0.79 psi/ft in Clear Branch Field, Jackson Parish, Louisiana (fig. 9). Three shallower Travis Peak sandstone<br />
reservoirs in Clear Branch field have normal FPGs of 0.47 to 0.48 psi/ft (fig. 9). Although pressure data for Travis<br />
Peak reservoirs in north Louisiana come from various depths throughout the Travis Peak Formation, most pressure<br />
data for Travis Peak reservoirs in northeast Texas are from sandstones within the upper 300 feet of the Formation. Of<br />
17 FPG values for Travis Peak reservoirs in northeast Texas, 6 are believed to be from reservoirs at depths of 500<br />
feet or greater below top of the Travis Peak (table 1 and fig. 9). Four of these six FPGs are normal and two are<br />
subnormal. Al Brake (BP engineer, personal communication, 2000) identified two additional fields in northeast<br />
Texas, Woodlawn and Carthage Fields, where Travis Peak reservoirs exhibit normal FPGs throughout the<br />
Formation. Al Brake is not aware of any significantly overpressured Travis Peak reservoirs in northeast Texas.<br />
Available data, therefore, suggest absence of significant overpressure throughout the Travis Peak Formation in<br />
northeast Texas. If significant overpressure does occur within the middle and lower Travis Peak Formation in<br />
northeast Texas, it probably would be a local phenomenon without regional extent.<br />
16
A number of Travis Peak reservoirs exhibit subnormal FPGs (0.27 to 0.38 psi/ft), as shown in figures 9 and<br />
10. It is possible that these lower FPGs represent errors in measurement or lack of development of equilibrium<br />
conditions during tests in low-permeability rock. Also it is possible that a subnormal FPG for a particular sandstone<br />
reservoir reflects depletion of pressure caused by hydrocarbon production from another Travis Peak sandstone that is<br />
in pressure communication with the apparently subnormally pressured interval. However, if one assumes that all the<br />
subnormal-FPG values shown in figures 9 and 10 reflect original, virgin pressures unaffected by depletion, one<br />
might argue that they represent pressure declines associated with Tertiary uplift and erosion. If that were true, perhaps<br />
many Travis Peak reservoirs that today are normally pressured or slightly overpressured might have been<br />
significantly overpressured prior to Tertiary uplift and erosion. During Tertiary uplift between 58 and 46 Ma,<br />
approximately 1,500 feet of strata were removed across much of northeast Texas (Dutton, 1987; Laubach and<br />
Jackson, 1990; Jackson and Laubach, 1991). However, if much of the gas found in Travis Peak reservoirs was<br />
derived from Bossier Shale source rocks, migration of that gas into Travis Peak sandstones probably commenced<br />
between 57 and 45 Ma (Dutton, 1987; Hermann and others, 1991). Therefore, most of the thermally generated gas<br />
that presumably would cause development of overpressure probably migrated into Travis Peak reservoirs following<br />
Tertiary uplift. If Tertiary uplift and erosion resulted in pressure reduction within Travis Peak sandstone reservoirs,<br />
subsequent introduction of thermally generated gas has not been able to produce significant widespread overpressure<br />
within those reservoirs. Perhaps most subnormal FPGs calculated for Travis Peak reservoirs, therefore, reflect<br />
depletion of pressure caused by hydrocarbon production from another Travis Peak sandstone reservoir that is in<br />
pressure communication with the apparently subnormally pressured interval, or lack of development of equilibrium<br />
conditions during the pressure test. Best available data indicate that widespread, abnormally high pressure caused by<br />
thermal generation of gas that is typical of basin-center gas accumulations does not occur within the Travis Peak<br />
Formation. Stated another way, occurrence of normally pressured, gas-charged sandstone reservoirs throughout most<br />
of the Travis Peak Formation across the northern Gulf Basin suggests that a significant basin-center accumulation is<br />
not present within the Travis Peak.<br />
It is interesting to speculate on the absence of widespread overpressure in Travis Peak sandstone reservoirs across<br />
east Texas and north Louisiana. Perhaps there is insufficient hydrocarbon charge associated with absence of proximal<br />
source rocks, or with poor migration pathways from stratigraphically or geographically distant source rocks.<br />
Additionally, relatively high matrix and fracture permeability of significant volumes of Travis Peak sandstone<br />
reservoirs might prevent the Travis Peak Formation as a whole from retarding upward migration of gas sufficiently<br />
to enable abnormally high pressures to develop. Insufficient hydrocarbon charge relative to effectiveness of Travis<br />
Peak sandstone reservoirs to transmit, rather than retard the flow of, gas could explain lack of regional overpressure<br />
within the Travis Peak Formation.<br />
Restriction of reservoir bitumen in Travis Peak sandstones to reservoirs in the uppermost 300 feet of the<br />
Formation might be significant in understanding hydrocarbon charge. Reservoir bitumen probably formed in pores of<br />
Travis Peak sandstones from deasphalting of oil caused by dissolution of gas in the oil. Was oil present throughout<br />
most of the Travis Peak Formation, but sufficient quantities of gas developed, or were introduced, only in the upper<br />
300 feet of the Travis Peak to promote deasphalting there? Or was oil that experienced deasphalting originally<br />
present only in sandstones within the uppermost 300 feet of the Formation, reflecting limited charge of oil into the<br />
Travis Peak? The latter explanation seems more logical because even within upper Travis Peak sandstones, bitumen<br />
occurs only in clean, well-sorted, rippled and cross-bedded sandstones. Absence of bitumen from burrowed, shaly,<br />
poorly sorted sandstones in the upper Travis Peak suggests that charge was insufficient to drive oil through smaller<br />
pore throats. Thus with respect to the oil phase, hydrocarbon charge seems to be limited.<br />
An additional question concerns the source of gas that promoted deasphalting of Travis Peak oil to produce<br />
reservoir bitumen. Was the gas generated in place through thermal alteration of Travis Peak oil, or was it introduced<br />
from some external source? The answer is unknown, although level of kerogen maturity in mudstones interbedded<br />
with Travis Peak sandstone reservoirs suggests that oils in Travis Peak sandstones were subjected to temperatures<br />
sufficient to generate gas internally (Dutton, 1987). However, the extensive volume of gas within Travis Peak<br />
reservoirs regionally might suggest that much of that gas was derived from an external source, presumably Bossier<br />
Shales and/or Smackover laminated, lime mudstones. Thus there might have been a two-phase of migration of<br />
hydrocarbons into Travis Peak reservoirs, perhaps similar to that described in general terms by Gussow (1954). As<br />
Bossier and Smackover source rocks were buried, they first generated oil, some of which might have migrated into<br />
17
Travis Peak sandstones where it was trapped. With continued burial, Bossier and Smackover source rocks reached the<br />
gas window, spawning an episode of gas generation that might be continuing today. This later gas might have<br />
caused deasphalting of previously emplaced oil in Travis Peak sandstones as well as displacement of oil from some<br />
Travis Peak reservoirs. However, as evidence seems to suggest a limited charge of oil into Travis Peak reservoirs,<br />
perhaps gas charge also is sufficiently limited relative to transmissibility of Travis Peak sandstone reservoirs to<br />
prohibit development of regional overpressure and accompanying basin-center gas.<br />
Hydrocarbon-Water Contacts<br />
Perhaps the most definitive criterion for establishing presence of a basin-center gas accumulation is absence of<br />
gas-water contacts. Gas-water contacts are distinctive features of conventional gas accumulations. Presence of a gaswater<br />
contact indicates a change from gas-saturated to water-saturated porosity within a particular reservoir unit. This<br />
implies that a well drilled into that reservoir structurally below the gas-water contact should encounter only water,<br />
thereby demonstrating the absence of a continuous-gas accumulation in that immediate area. Documentation of<br />
occurrence of gas-water contacts within a particular stratigraphic unit in various gas fields distributed across a<br />
particular basin argues strongly against presence of a continuous- or basin-center gas accumulation within that<br />
particular interval in the basin.<br />
As shown in figures 11 and 12, hydrocarbon-water contacts have been documented within Travis Peak sandstone<br />
reservoirs in 13 fields across east Texas and north Louisiana. As discussed above and as indicated by dashed field<br />
outlines in figure 11, four additional Travis Peak fields probably also have hydrocarbon-water contacts, depending<br />
upon interpretation of the term “elevation of bottom of gas” as reported by Herald (1951). Data for many Travis Peak<br />
fields presented in Shreveport Geological Society Reference <strong>Report</strong>s (1946, 1947, 1951, 1953, 1956, 1963, 1987)<br />
and Shoemaker (1989) either do not mention hydrocarbon-water contacts or report that none were encountered.<br />
However, because many of those reports were prepared not long after fields were discovered, sufficient development<br />
drilling probably had not occurred to encounter hydrocarbon-water contacts. In other cases, fluid contacts were not<br />
included as part of the field description. Lack of reported Travis Peak hydrocarbon-water contacts in such field reports,<br />
therefore, should not be interpreted as absence of oil-water or gas-water contacts in those fields. Consequently, it is<br />
likely that considerably more of the Travis Peak fields shown in figures 1a and 1b have hydrocarbon-water contacts<br />
than illustrated in figures 11 and 12.<br />
Supporting that inference is the inferred presence of Travis Peak gas-water contacts at fields such as Bethany-<br />
Longstreet and Cheniere Creek in northern Louisiana (fig. 12) based on recoveries of water without gas from<br />
production tests and DSTs of Travis Peak sandstone reservoirs on flanks of those fields. Although water recoveries<br />
from flank wells suggest presence of gas-water contacts within Travis Peak reservoirs in those fields, gas-water<br />
contacts were not reported for Travis Peak reservoirs in those fields in Shreveport Geological Society Reference<br />
<strong>Report</strong>s (1963, 1987).<br />
As discussed above, all hydrocarbon-water contacts within Travis Peak sandstone reservoirs in fields in northeast<br />
Texas documented in this report (table 1 and figure 11) occur the upper 300 feet of the Travis Peak Formation. No<br />
documentation of hydrocarbon-water contacts in middle or lower Travis Peak reservoirs in northeast Texas has been<br />
found. At Woodlawn Field in Harrison County, Texas, a discrete gas-water contact has not been identified in the<br />
lower Travis Peak Formation. However, commercial gas production from the middle and lower Travis Peak section<br />
at Woodlawn Field is limited, and most of that interval at Woodlawn Field is considered water-bearing, according to<br />
Al Brake (BP engineer, personal communication, 2000). In addition to sandstones within the upper 500 feet of the<br />
Travis Peak, a deeper sandstone interval about 200 feet above the bottom of the Travis Peak Formation produces gas<br />
in commercial quantities at Woodlawn Field. BP refers to this deeper productive interval at Woodlawn Field as the<br />
McGee Sandstone. Al Brake reports that the bulk of the Travis Peak section between the McGee Sandstone and<br />
productive sandstones in the upper 500 feet of the Travis Peak lacks mudlog gas shows and is not considered<br />
productive. Locally within the middle and lower Travis Peak interval at Woodlawn Field, Al Brake reports that<br />
scattered 10- or 12-foot sandstones occasionally have high resistivity within the upper one to three feet accompanied<br />
by mudlog gas shows, and lower resistivity below with no mudlog gas shows. Some of these thin, high-resistivity<br />
intervals have been perforated and tested. Typical cumulative production from one of these thin intervals ranges from<br />
18
insignificant to a maximum of only about 0.1 BCFG before the zone depletes and gives way to water production.<br />
Based on general lack of mudlog gas shows, scattered presence of only thin one- to three-foot high-resistivity gasbearing<br />
zones, and limited recovery of gas throughout the bulk of the Travis Peak section between the deeper McGee<br />
Sandstone and the uppermost 500 feet of the Formation, Al Brake (BP Amoco engineer, personal communication,<br />
2000) considers the middle and lower Travis Peak interval at Woodlawn Field to be largely water-bearing. If these<br />
reservoir and production characteristics are typical of other Travis Peak Fields, this information from Woodlawn<br />
Field tends to confirm the interpretation of Fracasso and others (1988) that commercial quantities of hydrocarbons in<br />
Travis Peak sandstones are concentrated within the sandstones in the upper 300 feet of the Formation.<br />
Patterns of gas occurrence and production at Woodlawn Field might have significance in understanding Travis<br />
Peak gas reservoirs at Appleby North Field in Nacogdoches County, Texas. According to Tye (1991), gas occurs<br />
throughout the Travis Peak Formation at North Appleby Field, though not necessarily in commercial amounts, and<br />
a discrete gas-water contact reportedly is not present. As at Woodlawn Field, however, sandstone reservoirs<br />
throughout the Travis Peak Formation at North Appleby Field, are normally pressured (Lin and others, 1985), which<br />
is not characteristic of basin-center gas accumulations. Furthermore, although most of the Travis Peak section at<br />
North Appleby Field reportedly is gas-charged, perforations in the field well shown by Tye (1991) are limited to only<br />
a few sandstones that are capped by thicker shale units. Perforated sandstones in this well are restricted to two zones,<br />
one within the upper 500 feet of the Travis Peak between depths of 8,200 and 8,500 feet, and a second zone about<br />
200 feet from the bottom of the Formation between depths of 9,800 and 10,000 feet. This pattern of perforations is<br />
strikingly similar to that described by Al Brake for Travis Peak sandstones at Woodlawn Field. Although cores were<br />
cut in several intervals within the thick intervening fluvial-sandstone section in that well at Appleby North Field, no<br />
zones were perforated between 8,500 feet and 9,800 feet. Examination of production-test data from other wells in<br />
Appleby North Field indicates that most perforations are restricted to the upper 500 feet of the Travis Peak section.<br />
Only two other wells in Appleby North Field were found with perforations in that deeper interval about 200 feet<br />
from the base of the Travis Peak. Initial-production rates of 72 and 114 MCFD from lower-Travis Peak perforations<br />
in these two wells suggest that this deeper zone at Appleby North Field probably is marginally to non-commercial.<br />
Limitation of perforations within the middle and lower Travis Peak Formation at Appleby North Field to one zone<br />
about 200 feet from the bottom of the Travis Peak shows striking resemblance to the pattern observed at Woodlawn<br />
Field where the normally pressured middle and lower Travis Peak section reportedly is largely water-bearing.<br />
Although mudlog data from wells in Appleby North Field were not available for this study, one might wonder if the<br />
bulk of the middle and lower Travis Peak section there the lacks gas shows and largely is water-bearing despite the<br />
report of being gas charged by Tye (1991). Tye’s report that the middle and lower Travis Peak Formation at Appleby<br />
North Field is gas charged was based on personal communication with no supporting data, and was accompanied by<br />
the qualification that gas might not be present in commercial quantities throughout the section. Such qualification<br />
bears some resemblance to the situation described by Al Brake at Woodlawn Field where scattered thin, highly<br />
resistive zones in the middle and lower Travis Peak produce small amounts of gas before depleting and yielding<br />
water. <strong>Final</strong>ly, in considering the potential for basin-center gas, it is significant that despite the lack of documented<br />
gas-water contacts within the middle and lower Travis Peak at Woodlawn and Appleby North Fields, the entire Travis<br />
Peak interval at both fields reportedly is normally pressured.<br />
In summary, hydrocarbon-water contacts in Travis Peak sandstone reservoirs have been documented at various<br />
depths within the Travis Peak Formation in nine fields in north Louisiana. In northeast Texas, hydrocarbon-water<br />
contacts have been reported within Travis Peak sandstone reservoirs in eight fields, but these all occur within the<br />
upper 300 to 500 feet of the Travis Peak Formation. Rather than being clustered, however, these fields with<br />
documented hydrocarbon-water contacts are widely distributed across the east-Texas and north-Louisiana Travis Peak<br />
productive trend. Wide distribution of such conventional hydrocarbon accumulations with hydrocarbon-water contacts<br />
suggests absence of significant basin-center gas accumulations within the entire Travis Peak Formation in north<br />
Louisiana and within the upper 500 feet of the Travis Peak Formation in northeast Texas. Data on hydrocarbon-water<br />
contacts in the lower three fourths of the Travis Peak section in northeast Texas are limited and less conclusive. At<br />
fields such as Appleby North and Woodlawn in northeast Texas, clearly defined gas-water contacts reportedly are not<br />
present or have not been identified. Travis Peak reservoirs at Appleby North and Woodlawn Fields, however, are<br />
normally pressured, which is not characteristic of basin-center gas accumulations. Best available data suggest that the<br />
lower three fourths of the Travis Peak Formation across much of northeast Texas is characterized by a general lack of<br />
mudlog gas shows and only a few gas-charged sandstones that yield marginal to non-commercial production before<br />
19
depleting and giving way to water production. Operators consequently seem to focus efforts on Travis Peak<br />
completions within sandstone reservoirs in the uppermost 300 to 500 feet of the Travis Peak Formation, resulting in<br />
limited data in the lower three fourths of the Formation. Although pressure data from depths below 500 feet of top of<br />
the Travis Peak are limited, data from eight fields indicate normal or subnormal FPGs, and suggest absence of<br />
significant overpressure throughout the Travis Peak Formation in northeast Texas. In the absence of documented gaswater<br />
contacts below 500 feet of top of the Travis Peak Formation in northeast Texas, limited data indicating<br />
presence of abundant water-bearing sandstones and a lack of significant overpressure together suggest absence of<br />
significant basin-center gas accumulations within the middle and lower Travis Peak.<br />
CONCLUSIONS<br />
20<br />
1) The Travis Peak (Hosston) Formation is a Lower Cretaceous basinward-thickening wedge of terrigenous<br />
clastic sedimentary rocks that underlies the northern Gulf of Mexico Basin from east Texas across northern<br />
Louisiana into southern Mississippi. Clastic influx was focused in two main fluvial-deltaic depocenters<br />
associated with the ancestral Red River in northeast Texas and the ancestral Mississippi River in southern<br />
Mississippi and northeast Louisiana.<br />
2) Across its hydrocarbon-productive trend in northeast Texas, the Travis Peak Formation is divided into three<br />
informal units based on relative amounts of sandstone and shale. A thin lower interval consists of mixed<br />
sandstones and shales interpreted as delta-fringe deposits. It is gradationally overlain by a thick, sandstonerich,<br />
sequence that forms the bulk of the Travis Peak section comprised primarily of stacked, braidedchannel<br />
sandstones grading up into meandering-channel deposits. The third and uppermost interval consists<br />
of mixed sandstone and mudstone interpreted as coastal-plain, paralic, and marine deposits. Upward<br />
stratigraphic evolution from braided- through meandering-fluvial systems to paralic and marine strata reflects<br />
an overall transgression and relative rise in sea level that occurred during Travis Peak deposition.<br />
3) Most hydrocarbon production from the Travis Peak Formation in northeast Texas and north Louisiana is<br />
from drilling depths of 6,000 to 10,000 feet, and through that interval, porosity and permeability of Travis<br />
Peak sandstones decrease significantly with depth. In northeast Texas, average porosity of clean Travis Peak<br />
sandstones decreases from 16.6 percent at 6,000 feet to 5.0 percent at 10,000 feet. Average stressed<br />
permeability of clean sandstones decreases by four orders of magnitude from 10 mD at 6,000 feet to 0.001<br />
mD at 10,000 feet. Decrease in porosity with depth results primarily from (a) increasing amount of quartz<br />
cement, and (b) decrease in amount of secondary porosity, which was derived almost exclusively from<br />
dissolution of feldspar. Decrease in permeability with depth occurs mainly because of (a) decrease in<br />
porosity, which in turn is caused principally by increasing quartz cement, and (b) increasing overburden<br />
pressure that closes narrow pore throats.<br />
4) Reservoir properties of many Travis Peak sandstones are significantly better than those characteristic of<br />
basin-center gas reservoirs in which inherent, ubiquitous, low-permeability provides an internal, leaky seal<br />
for thermally generated gas. Although Travis Peak sandstones have received tight-gas designation across<br />
selected portions of east Texas and north Louisiana, at depths less than 7,500 feet in northeast Texas, the<br />
sandstones often exhibit permeabilities well above the 0.1-mD cutoff for qualification as a tight-gas<br />
reservoir. At depths less than 6,000 feet, permeability can exceed 100 mD. At depths below 8,000 feet,<br />
where matrix permeability generally is less than 0.1 mD as a result of extensive quartz cementation, natural<br />
fractures are common, imparting fracture permeability to the reservoir. In north Louisiana where interdeltaic<br />
sandstones are separated by shale intervals, hydrocarbon production comes from sandstones throughout the<br />
Travis Peak. In northeast Texas, most production of oil and gas from the Travis Peak comes from sandstone<br />
reservoirs in the upper 300 feet of the Formation. This seems to reflect a concentration of hydrocarbons in<br />
the upper Travis Peak, though in some fields, sandstones throughout the Travis Peak Formation are<br />
reportedly gas-charged. Concentration of oil and gas probably occurs in upper Travis Peak sandstones<br />
because these meandering-channel, tidal-channel, and tidal-flat sandstones are encased in thick shales that<br />
provide effective seals. Underlying low-sinuosity fluvial sandstones, comprising the bulk of the Travis Peak
21<br />
Formation, form a highly interconnected network because of their inherent multistory, multilateral sandbody<br />
geometries, as well as abundance of natural vertical fractures within the highly quartz-cemented<br />
sequence. Thus, the thick fluvial sequence with its lack of thick, widespread shale barriers seems to provide<br />
an effective upward-migration pathway for gas rather than affording inherent sealing capabilities typical of<br />
reservoirs harboring basin-center gas accumulations.<br />
5) Source rocks generating hydrocarbons produced from Travis Peak sandstone reservoirs are not proximal to<br />
those reservoirs. Vitrinite reflectance (Ro) of Travis Peak shales interbedded with reservoir sandstones in<br />
east Texas indicate that they have passed through the oil window and are approaching onset of dry-gas<br />
generation. However, these shales are primarily oxidized, floodplain shales with total organic carbon content<br />
less than 0.5 percent, and consequently are not considered likely sources of oil and gas. Travis Peak marine<br />
shales depositionally downdip in the Gulf Basin in central Louisiana might have generated hydrocarbons,<br />
but relatively long-distance lateral migration would be necessary. Most likely source rocks for gas and oil<br />
produced from Travis Peak sandstones are Jurassic Bossier Shale of the underlying Cotton Valley Group and<br />
stratigraphically lower, laminated, carbonate mudstones of the Jurrassic Smackover Formation. Burial- and<br />
thermal-history data for east Texas and north Louisiana suggest that onset of dry-gas generation from<br />
Smackover mudstones and Bossier Shales occurred about 80 Ma and 57 Ma, respectively. Bossier Shales,<br />
however, are separated from Travis Peak reservoirs by at least 1,000 feet of tight Cotton Valley sandstones<br />
and interbedded shales, and also by the tight Knowles Limestone across much of the area.<br />
6) Unlike basin-center gas reservoirs, which generally are abnormally pressured, Travis Peak sandstone<br />
reservoirs across east Texas and north Louisiana commonly are normally pressured. Of 24 fields for which<br />
pressure data are reported here, only one has a Travis Peak reservoir that is considered significantly<br />
overpressured, i.e., with FPG greater than 0.55 psi/ft. At Clear Branch Field, Louisiana, one sandstone has<br />
a FPG = 0.79 psi/ft, but three other Travis Peak sandstone reservoirs within that field are normally<br />
pressured. In north Louisiana, pressure data are available from sandstones throughout the Travis Peak,<br />
whereas in northeast Texas, most available pressure data are from reservoirs in the upper 300 to 500 feet of<br />
the Travis Peak Formation. Limited data from the lower three fourths of the Travis Peak in northeast Texas<br />
suggest absence of significant overpressures in that interval, too. Some fields exhibit underpressured<br />
reservoirs with FPGs ranging from 0.27 to 0.38 psi/ft. If these data are accurate, they might suggest<br />
pressure decrease associated with Tertiary uplift and erosion across northeast Texas. Most of the gas<br />
presumably generated from Bossier and Smackover source rocks probably migrated into Travis Peak<br />
reservoirs following Tertiary uplift. If Tertiary uplift and erosion resulted in pressure reduction within<br />
Travis Peak sandstone reservoirs, subsequent introduction of thermally generated gas has not been able to<br />
produce significant widespread overpressure in those reservoirs. Thus, Travis Peak reservoirs across the<br />
northern Gulf Basin are characterized by normal to slightly below normal pressures. Widespread abnormally<br />
high pressure caused by thermal generation of gas that is typical of basin-center gas accumulations does not<br />
occur within the Travis Peak Formation.<br />
7) Presence of a gas-water contact perhaps is the most definitive criterion suggesting that a gas accumulation<br />
is conventional rather than a “sweetspot” within a basin-center, continuous-gas accumulation. Hydrocarbonwater<br />
contacts within Travis Peak sandstone reservoirs have been documented in nine fields in north<br />
Louisiana and eight fields in northeast Texas. In all eight fields in northeast Texas, however, hydrocarbonwater<br />
contacts occur in sandstone reservoirs in the uppermost 300 to 500 feet of the Travis Peak Formation.<br />
In northeast Texas, no documented gas-water contacts have been found in Travis Peak reservoirs in the<br />
lower three fourths of the Formation. In a few Travis Peak fields, such as Appleby North Field,<br />
Nacogdoches County, Texas, gas reportedly is present, though not always in commercial amounts, in<br />
sandstones throughout the Travis Peak Formation, and a discrete gas-water contact reportedly is not present.<br />
However, Travis Peak reservoirs at North Appleby field are normally pressured. Perhaps vertically-extensive<br />
gas-water transition zones with poorly defined gas-water contacts occur in some Travis Peak reservoirs such<br />
as those at North Appleby Field, as is characteristic of normally pressured conventional gas accumulations<br />
in low-permeability reservoirs. Alternatively, pattern of perforated intervals at Appleby North Field is<br />
similar to that at Woodlawn Field where most of the middle and lower Travis Peak section reportedly is<br />
water-bearing. Despite lack of documented gas-water contacts within the lower three fourths of the Travis
22<br />
Peak in northeast Texas, limited data on pressures within that interval indicates lack of significant<br />
overpressure, and hence suggests absence of significant basin-center gas accumulations. Fields with clearly<br />
documented hydrocarbon-water contacts throughout the Travis Peak in Louisiana and within the upper 300<br />
to 500 feet of the Formation in northeast Texas are distributed widely across the Travis Peak productive<br />
trend. Wide distribution of conventional hydrocarbon accumulations with discrete hydrocarbon-water<br />
contacts indicates absence of a significant basin-center gas accumulation within the Travis Peak Formation<br />
in Louisiana, and within the upper 300 to 500 feet of the Travis Peak in northeast Texas.<br />
8) Insufficient hydrocarbon charge together with sufficiently high reservoir permeability might explain why<br />
Travis Peak sandstone reservoirs generally are normally pressured and commonly exhibit discrete<br />
hydrocarbon-water contacts. Perhaps lack of proximal source rocks and lack of effective migration pathways<br />
from stratigraphically or geographically distant source rocks result in insufficient hydrocarbon charge.<br />
Furthermore, Travis Peak sandstone reservoirs might have sufficiently high matrix and fracture permeability<br />
through sufficient stratigraphic thickness and across sufficient geographic extent to allow upward migration<br />
of gas to the degree that abnormally high pressure and basin-center gas cannot develop. The result might be<br />
that hydrocarbons are trapped primarily in sandstones encased in thick shales within the upper portion of the<br />
Travis Peak, which commonly does occur.<br />
9) Lack of proximal source rocks, relative abundance of reservoir sandstone with significant matrix and fracture<br />
permeability, and especially the abundance of normally pressured reservoirs together with widespread<br />
presence of hydrocarbon-water contacts suggest that basin-center gas is absent or insignificant within the<br />
Travis Peak Formation. If any areas of continuous gas occur within the Travis Peak Formation, they<br />
probably occur in northeast Texas southwest of the Sabine Uplift within the lower three fourths of the<br />
Travis Peak, and probably are not sufficiently large to have a significant impact on hydrocarbon resource<br />
assessment for the Travis Peak.<br />
ACKNOWLEDGEMENTS<br />
I thank Steve Condon, USGS geologist in Denver, for extracting Travis Peak well and test data from the IHS<br />
<strong>Energy</strong> Group database and preparing them for analysis with ARCVIEW software at the USGS Denver facility.<br />
Laura Biewick, USGS Denver, and Steve Condon provided expert instruction and assistance in using ARCVIEW to<br />
evaluate Travis Peak well and test data. I also thank the staff at the USGS library in Denver, USGS geologist Ted<br />
Dyman, and Gregory J. Zerrahn and Joseph A. Lott, geologists with Palmer Petroleum, Shreveport, Louisiana, for<br />
prompt and thorough assistance in obtaining reports, maps, and literature, without which this study could not have<br />
been accomplished.
REFERENCES<br />
Bebout, D.G., W.A. White, C.M. Garrett, Jr., and T.F. Henz, 1992, Atlas of major central and eastern Gulf<br />
Coast gas reservoirs: University of Texas at Austin, Bureau of Economic Geology, 88 p.<br />
Coleman, J.L., Jr., and C.J. Coleman, 1981, Stratigraphic, sedimentologic and diagenetic framework for the<br />
Jurassic Cotton Valley Terryville massive sandstone complex, northern Louisiana: Gulf Coast Assoc.<br />
Geol. Socs. Trans., v. 31, p. 71-79.<br />
Davies, D.K., B.P.J. Williams, and R.K. Vessell, 1991, Reservoir models for meandering and straight fluvial<br />
channels; examples from the Travis Peak Formation, East Texas: Gulf Coast Assoc. Geol. Socs. Trans.,<br />
v. 41, p. 152-174.<br />
Dow, W.G., 1978, Petroleum source beds on continental slopes and rises: Amer. Assoc. Petroleum Geologists<br />
Bull., v. 62, no. 9, p. 1584-1606.<br />
Dutton, S.P., 1987, Diagenesis and burial history of the Lower Cretaceous Travis Peak Formation, East Texas:<br />
University of Texas, Bureau of Economic Geology, <strong>Report</strong> of Investigations No. 164, 58 p.<br />
Dutton, S.P., and L.S. Land, 1988, Cementation and burial history of a low-permeability quartzarenite, Lower<br />
Cretaceous Travis Peak Formation, East Texas: Geol. Soc. America Bulletin, v. 100, p.1271-1282.<br />
Dutton, S.P., S.E. Laubach, R.S. Tye, R.W. Baumgardner, and K.L. Herrington, 1991a, Geologic<br />
characterization of low-permeability gas reservoirs, Travis Peak Formation, East Texas: University of<br />
Texas, Bureau of Economic Geology, <strong>Report</strong> of Investigations No. 204, 89 p.<br />
Dutton, S.P., S.E. Laubach, and R.S. Tye, 1991b, Depositional, diagenetic, and structural controls on reservoir<br />
properties of low-permeability sandstone, Travis Peak Formation, East Texas: Gulf Coast Assoc. Geol.<br />
Socs. Trans., v. 41, p. 209-220.<br />
Dutton, S.P. and T.N. Diggs, 1992, Evolution of porosity and permeability in the Lower Cretaceous Travis<br />
Peak Formation, East Texas: Amer. Assoc. Petroleum Geologists Bulletin, v. 76, no. 2, p. 252-269.<br />
Dutton, S.P., S.J. Clift, D.S. Hamilton, H.S. Hamlin, T.F. Hentz, W.E. Howard, M.S. Akhter, and S.E<br />
Laubach, 1993, Major low-permeability sandstone gas reservoirs in the continental United States:<br />
University of Texas, Bureau of Economic Geology, <strong>Report</strong> of Investigations No. 211, 221 p.<br />
Fracasso, M.A., S.P. Dutton, and R.J. Finley, 1988, Depositional systems and diagenesis of Travis Peak tightgas<br />
sandstone reservoirs, Sabine Uplift Area, Texas: SPE Formation Evaluation, v. 3, p.105-115.<br />
Gautier, D.L., G.L. Dolton, K.I. Takahashi, and K.L. Varnes, eds., 1995 <strong>National</strong> assessment of United States<br />
oil and gas resources—results, methodology, and supporting data, U.S. Geological Survey Digital Data<br />
Series DDS-30, Release 2.<br />
Gies, R.M., 1984, Case history for a major Alberta deep-basin gas trap: the Cadomin Formation, in Masters,<br />
J.A., ed., Elmworth—Case study of a deep-basin gas field: Amer. Assoc. Petroleum Geologists Memoir<br />
39, p. 115-140.<br />
Gussow, W.C., 1954, Differential entrapment of oil and gas: a fundamental principle: Amer. Assoc. Petroleum<br />
Geologists Bulletin, v. 38, no. 5, p. 816-853.<br />
Hartman, B.M., and D.F. Scranton, 1992, Geologic map of Texas, 1:500,000: University of Texas, Bureau of<br />
Economic Geology.
2<br />
Herald, F.A., ed., 1951, Occurrence of oil and gas in northeast Texas: University of Texas, Bureau of Economic<br />
Geology, 449 p.<br />
Herrmann, L.A., J.A. Lott, and R.E. Davenport, 1991, Ruston Field—U.S.A., Gulf Coast Basin, Louisiana, in<br />
Beaumont, E.A. and N.H. Foster, eds., Amer. Assoc. Petroleum Geologists Treatise of Petroleum<br />
Geology, Structural Traps V, p. 151-186.<br />
Holditch, S.A., B.M. Robinson, W.S. Whitehead, and J.W. Ely, 1988, The GRI staged field experiment: SPE<br />
Formation Evaluation, v. 3, p.519-533.<br />
Jackson, M.L.W., and S.E. Laubach, 1991, Structural history and origin of the Sabine Arch, East Texas and<br />
Northwest Louisiana: University of Texas, Bureau of Economic Geology, Geological Circular 91-3, 47<br />
p.<br />
Kosters, E.C., D.G. Bebout, S.J. Seni, C.M. Garrett, Jr., L.F. Brown, Jr., H.S. Hamlin, S.P. Dutton, S.C.<br />
Ruppel, R.J. Finley, and Noel Tyler, 1989, Atlas of major Texas gas reservoirs: University of Texas at<br />
Austin, Bureau of Economic Geology, 161 p.<br />
Laubach, S.E., and M.L.W. Jackson, 1990, Origin of arches in the northwestern Gulf of Mexico Basin:<br />
Geology, v. 18, p. 595-598.<br />
Law, B.E., and W.W. Dickinson, 1985, Conceptual model for origin of abnormally pressured gas accumulations<br />
in low-permeability reservoirs: Amer. Assoc. Petroleum Geologists Bulletin, v. 69, no. 8, p. 1295-1304.<br />
Law, B.E., and C.W. Spencer, 1993, Gas in tight reservoirs—an emerging major source of energy, in Howell,<br />
D.G., ed., The future of energy gases: U.S. Geological Survey Professional Paper 1570, p. 233-252.<br />
Lin, Z.S., and R.J. Finley, 1985, Reservoir engineering properties and production characteristics of selected<br />
tight gas fields, Travis Peak Formation, East Texas Basin, in Proceedings, 1985 Society of Petroleum<br />
Engineers/Department of <strong>Energy</strong> Joint Symposium on Low-Permeability Reservoirs, SPE/DOE Paper<br />
No. 13901, p. 509-522.<br />
Lomando, A.J., 1992, The influence of solid reservoir bitumen on reservoir quality: Amer. Assoc. Petroleum<br />
Geologists Bulletin, v. 76, no. 8, p. 1137-1152.<br />
Lopatin, N.V., 1971, Temperature and geologic time as factors of carbonification (in Russian): Izvestiya<br />
Akademii Nauk SSSR, Seriya Geologischeskaya, no 3., p. 95-106.<br />
Marzo, M., W. Numan, and C. Puigdefabregas, 1988, Architecture of the Castissent fluvial sheet sandstones,<br />
Eocene, South Pyrenees, Spain: Sedimentology, v. 35, p. 719-738.<br />
McFarlan, E., Jr., 1977, Lower Cretaceous sedimentary facies and sea level changes, U.S. Gulf Coast, in<br />
Bebout, D.G., and R.G. Loucks, eds., Cretaceous carbonates of Texas and Mexico—applications to<br />
subsurface exploration: University of Texas, Bureau of Economic Geology, <strong>Report</strong> of Investigations No.<br />
89, p. 5-11.<br />
McGowen, M.K., and D.W. Harris, 1984, Cotton Valley (Upper Jurassic) and Hosston (Lower Cretaceous)<br />
depositional systems and their influence on salt tectonics in the East Texas Basin: University of Texas,<br />
Bureau of Economic Geology, Geological Circular 84-5, 41p.<br />
Nichols, P.H., G.E. Peterson, and C.E. Wuestner, 1968, Summary of subsurface geology of northeast Texas, in<br />
Beebe, B.W., ed., Natural gasses of North America—a symposium: Assoc. Petroleum Geologists<br />
Memoir 9, p. 982-1004.
3<br />
Presley, M.W., and C.H. Reed, 1984, Jurassic exploration trends of east Texas, in Presley, M.W., ed., The<br />
Jurassic of east Texas: East Texas Geological Society, Tyler, Texas, p. 11-22.<br />
Reese, D., 1976, Pre-Ferry Lake Lower Cretaceous Deltas of South Mississippi and Producing Trends: Gulf<br />
Coast Assoc. Geol. Socs. Trans., v. 26, p. 59-63.<br />
Rogers, M.A., J.D. McAlary, and N.J.L. Bailey, 1974, Significance of reservoir bitumens to thermalmaturation<br />
studies, western Canada Basin: Amer. Assoc. Petroleum Geologists Bulletin, v. 58, no. 9, p.<br />
1806-1824.<br />
Royden, L., J.G. Sclater, and R.P. Von Herzen, 1980, Continental margin subsidence and heat flow: important<br />
parameters in formation of petroleum hydrocarbons: Amer. Assoc. Petroleum Geologists Bull., v. 64,<br />
no. 2, p. 173-187.<br />
Salvador, A., 1987, Late Triassic-Jurassic paleogeography and origin of Gulf of Mexico Basin: Amer. Assoc.<br />
Petroleum Geologists Bull., v. 71, no. 4, p. 419-451.<br />
Sassen, R., and C.H. Moore, 1988, Framework of hydrocarbon generation and destruction in eastern Smackover<br />
trend: Amer. Assoc. Petroleum Geologists Bull., v. 72, no. 6, p. 649-663.<br />
Saucier, A.E., 1985, Geologic framework of the Travis Peak (Hosston) Formation of East Texas and North<br />
Louisiana, in Finley, R.J., Dutton, S.P., Lin, Z.S., and Saucier, A.E., The Travis Peak (Hosston)<br />
Formation: geologic framework, core studies, and engineering field analysis: University of Texas, Bureau<br />
of Economic Geology, contract report prepared for the Gas Research Institute under contract no. 5082-<br />
211-0708, 233 p.<br />
Saucier, A.E., R.J. Finley, and S.P. Dutton, 1985, The Travis Peak (Hosston) Formation of East Texas and<br />
North Louisiana, in Proceedings, 1985 Society of Petroleum Engineers/Department of <strong>Energy</strong> Joint<br />
Symposium on Low-Permeability Reservoirs, SPE/DOE Paper No. 13850, p. 15-22.<br />
Scardina, A.D., 1981, Tectonic subsidence history of the North Louisiana Salt Basin, M.S. Thesis, Louisiana<br />
State University, 103 p.<br />
Shoemaker, P.W., ed., 1989, Occurrence of oil and gas in northeast Texas: East Texas Geological Society, 210<br />
p.<br />
Shreveport Geological Society, 1946, Reference report on certain oil and gas fields of north Louisiana, south<br />
Arkansas, Mississippi, and Alabama: Shreveport Geological Society Reference Volume I, 333p.<br />
Shreveport Geological Society, 1947, Reference report on certain oil and gas fields of north Louisiana, south<br />
Arkansas, Mississippi, and Alabama: Shreveport Geological Society Reference Volume II, 503p.<br />
Shreveport Geological Society, 1951, Reference report on certain oil and gas fields of north Louisiana, south<br />
Arkansas, Mississippi, and Alabama: Shreveport Geological Society Reference Volume III, no. 1, 42p.<br />
Shreveport Geological Society, 1953, Reference report on certain oil and gas fields of north Louisiana, south<br />
Arkansas, Mississippi, and Alabama: Shreveport Geological Society Reference Volume III, no. 2, 109p.<br />
Shreveport Geological Society, 1958, Reference report on certain oil and gas fields of north Louisiana, south<br />
Arkansas, Mississippi, and Alabama: Shreveport Geological Society Reference Volume IV, 204p.<br />
Shreveport Geological Society, 1963, <strong>Report</strong> on selected north Louisiana and south Arkansas oil and gas fields<br />
and regional geology: Shreveport Geological Society Reference Volume V, 202p.
4<br />
Shreveport Geological Society, 1980, <strong>Report</strong> on selected oil and gas fields, north Louisiana and south Arkansas:<br />
Shreveport Geological Society Reference Volume VI, 160p.<br />
Shreveport Geological Society, 1987, <strong>Report</strong> on selected oil and gas fields, Ark-La-Tex and Mississippi:<br />
Shreveport Geological Society Reference Volume VII, 153p.<br />
Spencer, C.W., 1987, Hydrocarbon generation as a mechanism for overpressuring in Rocky Mountain region:<br />
Amer. Assoc. Petroleum Geologists Bull., v. 71, no. 4. p. 368-388.<br />
Thomson, A., 1978, Petrography and diagenesis of the Hosston Sandstone reservoirs at Bassfield, Jefferson<br />
Davis County, Mississippi: Gulf Coast Assoc. Geol. Socs. Trans., v. 28, p. 651-664.<br />
Tissot, B.P., and D.H. Welte, 1978, Petroleum formation and occurrence: New York, Springer-Verlag, 538 p.<br />
Todd, R.G., and R.M. Mitchum, Jr., 1977, Seismic stratigraphy and global changes of sea level, part 8:<br />
Identification of Upper Triassic, Jurassic, and Lower Cretaceous seismic sequences in Gulf of Mexico and<br />
offshore West Africa, in Payton, C.E., ed., Seismic stratigraphy—applications to hydrocarbon<br />
exploration: Amer. Assoc. Petroleum Geologists Memoir 26, p. 145-163.<br />
Tye, R.S., 1989, Stratigraphy and depositional systems of the Lower Cretaceous Travis Peak Formation, East<br />
Texas Basin: University of Texas, Bureau of Economic Geology, topical report prepared for the Gas<br />
Research Institute under contract no. 5082-211-0708, 80 p.<br />
Tye, R.S., 1991, Fluvial sandstone reservoirs of the Travis Peak Formation, East Texas Basin, in Miall, A.D.,<br />
and Noel Tyler, eds., The three-dimensional facies architecture of terrigenous clastic sediments, and its<br />
application for hydrocarbon discovery and recovery: SEPM (Society of Sedimentary Geology) Concepts<br />
in Sedimentology and Paleontology, v. 3, p. 172-188.<br />
Vail, P.R., R.M. Mitchum, and S. Thompson, 1977, Seismic stratigraphy and global changes of sea level, part<br />
4: Global cycles of relative changes in sea level, in Payton, C.E., ed., Seismic stratigraphy—applications<br />
to hydrocarbon exploration: Amer. Assoc. Petroleum Geologists Memoir 26, p. 83-97.<br />
Wapples, D.W., 1980, Time and temperature in petroleum formation: application of Lopatin’s method to<br />
petroleum exploration: Amer. Assoc. Petroleum Geologists Bull., v. 64, no. 6, p. 916-926.<br />
Wescott, W.A., and W.C. Hood, 1991, Hydrocarbon generation and migration routes in the East Texas Basin:<br />
Gulf Coast Assoc. Geol. Socs. Trans., v. 41, p. 675.<br />
Worrall, D.M., and S. Snelson, 1989, Evolution of the northern Gulf of Mexico, with emphasis on Cenozoic<br />
growth faulting and the role of salt, in Bally, A.W., and A.R. Palmer, eds., The Geology of North<br />
America; an overview: Geol. Soc. America, The Geology of North America Series, v. A, p. 97-138.
HEADINGS & ABBREVIATIONS FOR TABLE 1: TRAVIS PEAK FIELDS<br />
Field Name of field producing from Travis Peak sandstones<br />
County, State County and state in which field is located<br />
Disc Date Date of discovery of oil or gas in particular Travis Peak sandstone<br />
Trap Trapping mechanism for field.<br />
Struct = structural trap<br />
Strat = stratigraphic trap<br />
Comb = combination structural & stratigraphic trap<br />
A = anticline<br />
FA = faulted anticline<br />
FC = facies change (sandstone pinchout)<br />
N = structural nose<br />
FN = faulted structural nose<br />
Depth Depth in feet to particular productive Travis Peak sandstone reservoir<br />
Porosity Sandstone porosity (decimal)<br />
Perm Permeability (mD)<br />
BHT Bottom hole temp (º F)<br />
BHP Bottom hole pressure (psi)<br />
FPG Fluid pressure gradient (psi/ft)<br />
S w<br />
Water saturation (decimal)<br />
Fluid Contacts Gas-oil, oil-water, and gas-water contacts<br />
GOC = gas-oil contact<br />
OWC = oil-water contact<br />
GWC = gas-water contact<br />
IP = Initial production rate for specific Travis Peak sandstone reservoirs<br />
MCFD = thousand cubic feet per day (gas)<br />
BOPD = barrels of oil per day<br />
BCPD = barrels of condensate per day<br />
BWPD = barrels of water per day
Field County State Discovery Trap Depth Porosity Perm BHT BHP FPG Pos Sw Fluid Contacts IP IP IP IP<br />
Date (feet) (md) (F) (psi) (psi/ft) (mcfd) (bopd) (bcpd) (bwpd)<br />
Appleby North Nacogdoches TX Strat (FC) 8872 0.11 0.015 (ave) 254 3890 0.44 L 0.28<br />
Bethany Panola, Harrison TX 1940 Comb(FA, FC) 6024 2295 0.38 U 60,000 720<br />
1948 6300 0.15 115 206 3113 0.49 uL 0.34<br />
Blackfoot Anderson TX 1948 Comb(A, FC) 9918 U Elevation of bottom of oil -9589 63<br />
Carthage Panola TX 1942 Struct (A) 6128 Lenticular sandstones w/ complex GWCs 5,900 147.5<br />
1944 6,439 26.7<br />
1945 6230 0.15 10.8 3350 0.54 U 0.24<br />
Cedar Springs Upshur TX 1967 Struct(A) 8960 0.10 240 4409 0.49 L 0.30<br />
Chapel Hill Smith TX 1947 Comb(A, FC) U Elevation of bottom of gas -7835<br />
Cyril Rusk TX 1963 Strat (FC) 7650 0.09 -0.18
Field County State Discovery Trap Depth Porosity Perm BHT BHP FPG Pos Sw Fluid Contacts IP IP IP IP<br />
Date (feet) (md) (F) (psi) (psi/ft) (mcfd) (bopd) (bcpd) (bwpd)<br />
Holly DeSoto LA 1974 Strat(FC) 7000<br />
Leatherman Creek Claiborne LA 1975 Comb(FA, FC) 8387-9614 0.10 0.7 215 0.47 0.30 5,585 24<br />
Lisbon Claiborne LA 1941 Strat (FC) 5100 0.23 500<br />
Lisbon North Claiborne LA 1941 Struct(A) 5112 3,840 56<br />
Lucky Bienville LA 1943 Struct(FA) 7900 0.15 2800 0.35 2,000<br />
Ruston Lincoln LA 1943 Comb(A, FC) 5896 2400 0.41 Multiple sands with separate GWCs 45,000<br />
1944 5745 25,000<br />
Sailes Bienville LA 1945 Comb(FA, FC) 8847 0.14 0.3 432<br />
Shreveport Caddo, Bossier LA 1951 Struct(A) 6238 2,080<br />
Simsboro Lincoln LA 1936 Struct(FA) 6571 0.22 500 Multiple sands with separate GWCs 67,634<br />
1951 Struct(FA) 8069 0.15 2 to 50 16,500<br />
Sugar Creek Claiborne LA 1936 Comb(FA, FC) 5600 0.19 65 2300 0.41 20,000<br />
1937 5718 Multiple sands with separate GWCs & OWCs 205<br />
Vixen Caldwell LA 1945 Struct(A) 9700 3600 0.37 9,000<br />
Waskom Caddo LA Comb(A,FC)<br />
Village Columbia AR 1946 Struct(A) 4800 0.26 706 1300 0.27
Hill<br />
Falls<br />
OK<br />
DETAIL<br />
AREA<br />
TX<br />
Ellis<br />
Limestone<br />
Collin<br />
AR<br />
LA<br />
Navarro<br />
MS<br />
Gulf of Mexico<br />
LOCATION MAP<br />
POKEY<br />
AL<br />
Hunt<br />
RISCHERS STORE<br />
REED<br />
TEAGUE WEST<br />
McBEE<br />
Henderson<br />
Freestone<br />
Van Zandt<br />
Leon<br />
Rains<br />
TRI CITIES<br />
Hopkins Franklin<br />
Anderson<br />
OPELIKA<br />
BLACKFOOT<br />
Travis Peak Gas<br />
Travis Peak Oil<br />
0 10 20 30 40 Miles<br />
Figure 1a. Map of northeast Texas showing major fields that have produced hydrocarbons from Travis Peak (Hosston) sandstone<br />
reservoirs.<br />
Wood<br />
Smith<br />
CHAPEL HILL<br />
Cherokee<br />
Titus<br />
Camp<br />
Upshaw<br />
WILLOW<br />
SPRINGS<br />
Gregg<br />
PERCY WHEELER<br />
CYRIL<br />
WHITE OAK<br />
CREEK<br />
CEDAR SPRINGS<br />
DANVILLE<br />
Rusk<br />
HENDERSON<br />
Angelina<br />
Morris<br />
HENDERSON<br />
SOUTH<br />
TRAWICK<br />
LANSING<br />
NORTH<br />
MINDEN<br />
Nacogdoches<br />
Cass<br />
LASSATER<br />
Marion<br />
WHELAN<br />
APPLEBY<br />
NORTH<br />
Harrison<br />
Panola<br />
Shelby<br />
TEXAS<br />
WOODLAWN<br />
CARTHAGE<br />
PINEHILL SOUTHEAST<br />
JOAQUIN<br />
San Augustine<br />
Miller<br />
LA<br />
Caddo<br />
LOUISIANA AR<br />
LONGWOOD<br />
WASKOM<br />
BETHANY-<br />
LONGSTREET<br />
De Soto<br />
Hemphill<br />
Sabine
Cass<br />
Marion<br />
Harrison<br />
TEXAS<br />
LOUISIANA<br />
WASCOM<br />
Panola<br />
Shelby<br />
Miller<br />
Caddo<br />
SHREVEPORT<br />
Lafayette<br />
Bossier<br />
CASPIANA<br />
BETHANY-<br />
LONGSTREET<br />
De Soto<br />
Sabine<br />
ELM<br />
GROVE<br />
Columbia<br />
COTTON<br />
VALLEY<br />
Claiborne<br />
ATHENS<br />
Webster<br />
LEATHERMAN<br />
CREEK<br />
SIBLEY<br />
SAILES<br />
Beinville<br />
LUCKY<br />
Red River<br />
ADA<br />
BRYCELAND<br />
WEST<br />
VILLAGE<br />
Natchitoches<br />
LISBON NORTH<br />
LISBON<br />
SUGAR<br />
CREEK<br />
DANVILLE<br />
ARCADIA<br />
Union<br />
ARKANSAS<br />
LOUISIANA<br />
HICO-KNOWLES<br />
Lincoln<br />
RUSTON<br />
SIMSBORO<br />
BRYCELAND<br />
Jackson<br />
BEAR CREEK CHATHAM<br />
HODGE<br />
CLAY<br />
Winn<br />
Travis Peak Gas<br />
Travis Peak Oil<br />
0 10 20 30 40 Miles<br />
Figure 1b. Map of north Louisiana and southern Arkansas showing major fields that have produced hydrocarbons from Travis Peak<br />
(Hosston) reservoirs. Modified from Bebout et al. (1992).<br />
Union<br />
DOWNSVILLE<br />
CHOUDRANT<br />
Ouachita<br />
CALHOUN<br />
CLEAR BRANCH<br />
CHENIERE<br />
CREEK<br />
VIXEN<br />
COTTON PLANT<br />
Caldwell<br />
Ashley<br />
Morehouse<br />
Catahoula<br />
Richland<br />
OK<br />
Franklin<br />
Dallas<br />
TX<br />
West<br />
Carroll<br />
Concordia<br />
AR<br />
DETAIL<br />
AREA<br />
LA<br />
East<br />
Carroll<br />
Tensas<br />
MS<br />
Gulf of Mexico<br />
LOCATION MAP<br />
Madison<br />
LOUISIANA<br />
AL<br />
MISSISSIPPI
Amite<br />
St Helena<br />
Hinds<br />
Copiah<br />
Lincoln<br />
Pike<br />
Tangipahoa<br />
MONTICELLO<br />
Lawrence<br />
Walthall<br />
MISSISSIPPI<br />
LOUISIANA<br />
Washington<br />
St Tammany<br />
Rankin<br />
Simpson<br />
Jefferson Davis<br />
WHITESAND<br />
OAKVILLE<br />
KNOXO<br />
GREENS CREEK<br />
Travis Peak oil/gas fields<br />
Covington<br />
McRANEY<br />
BASSFIELD<br />
HOLIDAY CREEK<br />
MORGANTOWN EAST<br />
SANDY HOOK WEST<br />
0 10 20 30<br />
40 Miles<br />
TATUMS CAMP<br />
POPLARVILLE<br />
Figure 1c. Map of central Mississippi showing major fields that have produced hydrocarbons from<br />
Travis Peak (Hosston) reservoirs. Modified from Bebout et al. (1992).<br />
Marion<br />
OK<br />
Dallas<br />
TX<br />
AR<br />
DETAIL<br />
AREA<br />
LA<br />
Pearl River<br />
Gulf of Mexico<br />
Lamar<br />
MS<br />
LOCATION MAP<br />
Hancock<br />
AL<br />
Jones<br />
Forrest<br />
Stone<br />
Harrison
SYSTEM<br />
TERTIARY<br />
PALEOGENE<br />
UPPER CRETACEOUS<br />
LOWER CRETACEOUS<br />
JURASSIC<br />
TRIASSIC<br />
SERIES<br />
EOCENE<br />
PALEOGENE<br />
GULFIAN<br />
COMANCHEAN<br />
COAHUILAN<br />
UPPER<br />
MIDDLE<br />
LOWER<br />
UPPER<br />
CHRONOSTRATAGRAPHIC SECTION OF NORTH LOUISIANA<br />
STAGE GROUP FORMATION<br />
YPRESIAN<br />
THANETIAN<br />
DANIAN<br />
MAESTRICHTIAN<br />
CAMPANIAN<br />
SANTONIAN<br />
CONIACIAN<br />
TURONIAN<br />
CENOMANIAN<br />
ALBIAN<br />
APTIAN<br />
BARREMIAN<br />
HAUTERIVIAN<br />
VALANGINIAN<br />
BERRIASIAN<br />
TITHONIAN<br />
KIMMERIDGIAN<br />
OXFORDIAN<br />
CALLOVIAN<br />
BATHONIAN<br />
BAJOCIAN<br />
AALENIAN<br />
TOARCIAN<br />
PLIENSBACHIAN<br />
SINEMURIAN<br />
HETTANGIAN<br />
RHAETIAN<br />
WILCOX WILCOX<br />
MIDWAY MIDWAY<br />
NAVARRO<br />
TAYLOR<br />
AUSTIN<br />
EAGLE FORD<br />
WOODBINE<br />
WASHITA<br />
FREDRICKSBURG<br />
TRINITY<br />
COTTON VALLEY<br />
GLEN<br />
ROSE<br />
HIATUS<br />
HIATUS<br />
HIATUS<br />
ARKADELPHIA<br />
NACATOCH<br />
SARATOGA<br />
ANNONA<br />
OZAN<br />
TOKIO<br />
AUSTIN<br />
EAGLE FORD<br />
AGE<br />
(MA)<br />
TUSCALOOSA<br />
100<br />
PALUXY<br />
WASHITA-FREDERICKSBURG<br />
MOORINGSPORT<br />
FERRY LAKE ANHYDRITE<br />
RODESSA<br />
JAMES<br />
PINE ISLAND<br />
PETTET (SLIGO) MBR<br />
SLIGO<br />
HOSSTON<br />
(TRAVIS PEAK)<br />
SCHULER<br />
BOSSIER<br />
HAYNESVILLE-BUCKNER<br />
SMACKOVER<br />
NORPHLET<br />
LOUANN<br />
WERNER<br />
EAGLE MILLS<br />
Figure 2. Chronostratigraphic section of north Louisiana from Shreveport Geological Society (1987)<br />
showing general stratigraphic succession for northern Gulf of Mexico Basin. Travis Peak<br />
Formation, lowermost formation of the Trinity Group, is designated as Hosston on this diagram.<br />
Upper contact of Travis Peak (Hosston) with overlying Sligo carbonates is time-transgressive.<br />
60<br />
70<br />
80<br />
90<br />
110<br />
120<br />
130<br />
140<br />
150<br />
160<br />
170<br />
180<br />
190<br />
200<br />
210<br />
MILLIONS OF YEARS
34° N<br />
32° N<br />
30° N<br />
ANCESTRAL<br />
RED RIVER<br />
TRAVIS PEAK<br />
DEPOCENTER<br />
(SAUCIER, 1985)<br />
96° W 94° W 92° W 90° W<br />
MEXIA-TALCO<br />
GINGER<br />
FAULT<br />
FAULT ZONE<br />
ZONE<br />
EAST<br />
TEXAS<br />
SALT<br />
BASIN<br />
MT ENTERPRISE<br />
APPROX DOWNDIP LIMIT<br />
OF TRAVIS PEAK SANDSTONE<br />
FROM SANDSTONE ISOPACH<br />
MAPS OF SAUCIER (1985)<br />
FAULT ZONE<br />
SOUTH<br />
SABINE<br />
ARCH<br />
COMANCHEAN SHELF<br />
TEXAS<br />
ARKANSAS<br />
LOUISIANA<br />
ARKANSAS<br />
LOUISIANA<br />
NORTH<br />
LOUISIANA<br />
SALT<br />
BASIN<br />
EDGE<br />
FAULT ZONE<br />
0 20 40<br />
MILES<br />
60 80<br />
GULF OF MEXICO<br />
MONROE<br />
UPLIFT<br />
PICKENS<br />
MISSISSIPPI<br />
SALT<br />
BASIN<br />
MISSISSIPPI<br />
LOUISIANA<br />
ANCESTRAL<br />
MISSISSIPPI RIVER<br />
TRAVIS PEAK<br />
DEPOCENTER<br />
(SAUCIER, 1985)<br />
FAULT ZONE<br />
Figure 3. Index map of northern Gulf of Mexico Basin from Dutton et al. (1993) showing major tectonic features, including Sabine<br />
Arch and Salt Basins of East Texas, North Louisiana, and Mississippi. Sabine and Monroe Uplifts were not positive features<br />
during Travis Peak deposition. Movement of salt in the salt basins commenced during deposition of Smackover carbonates, and<br />
became more extensive with influx of thick sequence of Cotton Valley and Travis Peak terrigenous clastic sediment.
TRINITY GROUP<br />
NORTH SOUTH<br />
Sligo<br />
Formation<br />
Travis Peak<br />
(Hosston)<br />
Formation<br />
COTTON<br />
VALLEY<br />
GROUP<br />
(fluvial-deltaic sandstones)<br />
Schuler Fm<br />
(fluvial-deltaic<br />
sandstones)<br />
INDEX<br />
INDEX<br />
MAP MAP<br />
N<br />
AR AR<br />
LA<br />
S<br />
ARKANSAS<br />
LOUISIANA<br />
Hico Shale<br />
(lagoonal)<br />
Feet<br />
1000<br />
500<br />
Restricted marine shale<br />
Knowles Limestone<br />
Terryville Sandstone<br />
(massive ss<br />
complex)<br />
Bossier Formation<br />
(marine shale)<br />
0<br />
0 10<br />
Miles<br />
20<br />
Calvin Ss<br />
Troy<br />
Ls<br />
?<br />
Winn Limestone<br />
contact projected<br />
CRET CRETACEOUS<br />
CRETACEOUS CEOUS<br />
JURASSIC JURASSIC JURASSIC Limit of well control<br />
Possible massive<br />
sandstone complex<br />
Open marine shale<br />
Figure 4. Diagrammatic north-south stratigraphic cross section across southern Arkansas and northern Louisiana showing depositional<br />
relationships among units of Cotton Valley Group and Travis Peak Formation (from Saucier, 1985). Datum is top of Cotton Valley Group.<br />
Relatively thick sequence of Cotton Valley (Terryville) Sandstone, with interbedded shales, and Knowles Limestone separates Bossier<br />
Shale source rocks from Travis Peak sandstone reservoirs. Coleman and Coleman (1981) consider Calvin Sandstone and Winn Limestone<br />
to be part of Cotton Valley Group.
Depth, in Feet<br />
0<br />
1000<br />
2000<br />
3000<br />
4000<br />
A<br />
WEST<br />
TEXAS<br />
A<br />
A'<br />
LOCATION MAP<br />
LOUSIANA<br />
Fluvial<br />
126 Miles<br />
TEXAS LOUISIANA<br />
Figure 5. East-west stratigraphic cross section of Travis Peak Formation across northeast Texas into west Louisiana showing major<br />
Travis Peak depositional systems (from Dutton et al., 1991b). Cross section oriented parallel to depositional dip. Threefold division<br />
of Travis Peak Formation across hydrocarbon-productive trend includes thin, basal deltaic unit overlain by thick fluvial sequence that<br />
grades upward into paralic deposits. Datum is top of Pine Island Shale.<br />
Datum<br />
Paralic<br />
Deltaic<br />
Shelf<br />
Shelf<br />
A'<br />
EAST<br />
Travis Peak Formation
Depth (feet)<br />
5000<br />
6000<br />
7000<br />
8000<br />
9000<br />
10000<br />
r = 0.56<br />
n = 1687<br />
= 95 percent<br />
confidence limit<br />
11000<br />
0 10 100<br />
Porosimeter porosity (percent)<br />
Figure 6. Composite wireline log with gamma-ray and resistivity responses through complete<br />
section of Travis Peak Formation in east Texas (modified from Davies et al., 1991). Gamma-ray<br />
and resistivity character distinguish thin basal deltaic sequence, thick middle fluvial sequence,<br />
and thin upper paralic interval. Log responses within thick fluvial sequence also distinguish<br />
lower interval of stacked braided-channel sandstones with minor floodplain mudstones from<br />
upper interval of meandering-channel sandstones encased in thicker overbank mudstones. Most<br />
Travis Peak hydrocarbon production in northeast Texas comes from sandstones encased in shales<br />
within the upper 300 feet of the Travis Peak Formation. Depth increments on log are 50 feet.<br />
2<br />
3<br />
Depth (kilometers)
Depth (feet)<br />
5000<br />
6000<br />
7000<br />
8000<br />
9000<br />
10000<br />
r = 0.63<br />
n = 649<br />
= 90 percent<br />
confidence limit<br />
11000<br />
.00001 .0001 .001 .01 0.1 1 10 100 1000<br />
Stressed permeability (md)<br />
Figure 7. Semi-log plot of porosimeter porosity versus depth for 1,687 Travis Peak sandstone<br />
samples from wells in east Texas (from Dutton et al., 1991a). Samples include both clean and<br />
shaly sandstones.<br />
2<br />
3<br />
Depth (kilometers)
Hill<br />
OK<br />
Falls<br />
DETAIL<br />
AREA<br />
TX<br />
AR<br />
LA<br />
Limestone<br />
Collin<br />
Navarro<br />
Rockwall<br />
MS<br />
Gulf of Mexico<br />
LOCATION MAP<br />
POKEY<br />
0.46<br />
AL<br />
RISCHERS STORE<br />
0.41<br />
McBEE<br />
0.36<br />
Henderson<br />
Freestone<br />
Van Zandt<br />
Leon<br />
Rains<br />
Anderson<br />
Hopkins Franklin Titus<br />
FLUID-PRESSURE GRADIENTS (PSI/FT)<br />
Wood<br />
Smith<br />
TRI CITIES<br />
0.53 PERCY<br />
WHEELER<br />
0.53<br />
Houston<br />
Cherokee<br />
0 10 20 30 40 Miles<br />
CEDAR SPRINGS<br />
0.49<br />
Upshaw<br />
0.44<br />
WILLOW<br />
SPRINGS<br />
Gregg<br />
HENDERSON<br />
0.43<br />
Rusk<br />
TRAWICK<br />
0.43<br />
Angelina<br />
Nacogdoches<br />
WHELAN<br />
0.38<br />
0.43<br />
PINEHILL<br />
SOUTHEAST<br />
APPLEBY<br />
NORTH<br />
0.44<br />
Cass<br />
Harrison<br />
Marion<br />
WASKOM<br />
0.38<br />
Panola<br />
Shelby<br />
TEXAS<br />
CARTHAGE<br />
0.54<br />
San Augustine<br />
Miller<br />
LA<br />
LOUISIANA AR<br />
Caddo<br />
BETHANY-<br />
LONGSTREET<br />
0.38<br />
0.49<br />
Figure 8. Semi-log plot of stressed permeability versus depth for 649 Travis Peak sandstone samples from wells in east Texas (from<br />
Dutton et al., 1991a). Samples include both clean and shaly sandstones. Note that in addition to decrease in permeability with depth,<br />
permeability also varies by four orders of magnitude at any given depth.<br />
CYRIL<br />
0.46<br />
De Soto<br />
Hemphill<br />
Sabine
TEXAS<br />
LOUISIANA<br />
Miller<br />
Cass Lafayette Columbia<br />
Marion<br />
Harrison<br />
WASCOM<br />
0.58<br />
Panola<br />
Shelby<br />
Caddo<br />
BETHANY-<br />
LONGSTREET<br />
0.38<br />
0.49<br />
Bossier<br />
De Soto<br />
Sabine<br />
ELM<br />
GROVE<br />
0.46<br />
Webster<br />
LEATHERMAN<br />
CREEK<br />
0.47<br />
Beinville<br />
Red River<br />
VILLAGE<br />
0.27<br />
Claiborne<br />
Natchitoches<br />
SUGAR<br />
CREEK<br />
0.41<br />
LUCKY<br />
0.36<br />
FLUID-PRESSURE GRADIENTS (PSI/FT)<br />
Lincoln<br />
Union<br />
Jackson<br />
ARKANSAS<br />
LOUISIANA<br />
RUSTON<br />
0.41<br />
Winn<br />
CHATHAM<br />
0.38<br />
Grant<br />
Union<br />
DOWNSVILLE<br />
0.46<br />
0.49<br />
0.46<br />
CLEAR BRANCH<br />
0.47<br />
0.48<br />
0.48<br />
0.79<br />
Ouachita<br />
CHENIERE<br />
CREEK<br />
0.39<br />
VIXEN<br />
0.37<br />
COTTON PLANT<br />
0.48<br />
0.48<br />
LaSalle<br />
Caldwell<br />
0 10 20 30 40 Miles<br />
Ashley<br />
Morehouse<br />
Catahoula<br />
Richland<br />
OK<br />
Franklin<br />
Dallas<br />
TX<br />
Concordia<br />
Chicot<br />
AR<br />
DETAIL<br />
AREA<br />
LA<br />
Tensas<br />
MS<br />
Gulf of Mexico<br />
LOCATION MAP<br />
Figure 9. Map of northeast Texas showing fluid-pressure gradients (psi/ft) calculated from original shut-in pressures in Travis Peak<br />
sandstone reservoirs. Multiple pressure-gradient values for a particular field refer to gradients calculated for different stacked<br />
sandstone reservoirs in that field. Shut-in pressure data are shown in Table 1 along with sources for those data. Underlined FPG<br />
values indicate those from depths 500 feet or greater below top of Travis Peak Formation.<br />
Madison<br />
LOUISIANA<br />
AL<br />
MISSISSIPPI
Hill<br />
Falls<br />
OK<br />
DETAIL<br />
AREA<br />
TX<br />
Morris<br />
KNOWN FIELDS WITH TRAVIS PEAK HYDROCARBON-WATER CONTACTS<br />
AR<br />
LA<br />
MS<br />
Gulf of Mexico<br />
LOCATION MAP<br />
Limestone<br />
Collin<br />
Navarro<br />
Rockwall<br />
AL<br />
REED<br />
Hunt<br />
Henderson<br />
Freestone<br />
Rains<br />
Van Zandt<br />
Hopkins Franklin Titus<br />
BLACKFOOT<br />
Anderson<br />
Wood<br />
Hydrocarbon-water contacts reported in public literature<br />
Gas-water contact inferred from flank wells that tested water<br />
without gas from Travis Peak sandstones<br />
Field with probable hydrocarbon contacts depending on meaning<br />
of terms "elevation of bottom of gas or oil" from Herald (1951)<br />
0 10 20 30 40 Miles<br />
Nacogdoches<br />
Figure 10. Map of north Louisiana showing fluid-pressure gradients (psi/ft) calculated from original shut-in pressures in Travis Peak<br />
sandstone reservoirs. Multiple pressure-gradient values for a particular field refer to gradients calculated for different stacked<br />
sandstone reservoirs in that field. Shut-in pressure data are shown in Table 1 along with sources for those data.<br />
Smith<br />
CHAPEL HILL<br />
Cherokee<br />
CEDAR SPRINGS<br />
Upshaw<br />
Gregg<br />
Rusk<br />
HENDERSON<br />
HENDERSON<br />
SOUTH<br />
CYRIL<br />
Angelina<br />
LASSATER<br />
Marion<br />
Harrison<br />
CARTHAGE<br />
Cass<br />
Shelby<br />
TEXAS<br />
Panola<br />
San Augustine<br />
Miller<br />
LA<br />
LOUISIANA AR<br />
Caddo<br />
WASKOM<br />
BETHANY-<br />
LONGSTREET<br />
Hemphill<br />
De Soto<br />
Sabine
Cass<br />
Marion<br />
Harrison<br />
TEXAS<br />
LOUISIANA<br />
WASCOM<br />
Panola<br />
Shelby<br />
Miller<br />
Caddo<br />
Lafayette<br />
Bossier<br />
CASPIANA<br />
BETHANY-<br />
LONGSTREET<br />
KNOWN FIELDS WITH TRAVIS PEAK<br />
HYDROCARBON-WATER CONTACTS<br />
De Soto<br />
Sabine<br />
Columbia<br />
Webster<br />
Beinville<br />
Red River<br />
Natchitoches<br />
Claiborne<br />
SUGAR<br />
CREEK<br />
ARKANSAS<br />
LOUISIANA<br />
Lincoln<br />
RUSTON<br />
SIMSBORO<br />
BRYCELAND<br />
Jackson<br />
BEAR CREEK<br />
Winn<br />
Union<br />
DOWNSVILLE<br />
Ouachita<br />
Hydrocarbon-water contacts reported in public literature<br />
0 10 20 30 40 Miles<br />
CHENIERE<br />
CREEK<br />
Caldwell<br />
Gas-water contact inferred from flank wells that tested water<br />
without gas from Travis Peak sandstones<br />
Ashley<br />
Morehouse<br />
Catahoula<br />
Richland<br />
OK<br />
TX<br />
Franklin<br />
DETAIL<br />
AREA<br />
West<br />
Carroll<br />
Concordia<br />
AR<br />
LA<br />
East<br />
Carroll<br />
Tensas<br />
MS<br />
Gulf of Mexico<br />
LOCATION MAP<br />
Figure 11. Map of northeast Texas showing fields in which hydrocarbon-water contacts have been identified in Travis Peak sandstone<br />
reservoirs. Solid pattern indicates fields in which Travis Peak hydrocarbon-water contacts have been reported in public literature<br />
(see Table 1). Diagonal lines indicate fields in which gas-water contacts are inferred based on presence of flank wells that tested<br />
water only, without gas, identified from IHS <strong>Energy</strong> data. Fields with dashed outlines are those which might have gas-water or<br />
oil-water contacts depending on meaning of terms “elevation of bottom of gas” and “elevation of bottom of oil,” as reported in<br />
Herald (1951) and discussed in this report. All Travis Peak hydrocarbon-water contacts in these fields occur within upper 300 to<br />
500 feet of Travis Peak Formation.<br />
COTTON<br />
PLANT<br />
Madison<br />
LOUISIANA<br />
AL<br />
MISSISSIPPI
Hill<br />
Falls<br />
OK<br />
DETAIL<br />
AREA<br />
TX<br />
AR<br />
Collin<br />
LA<br />
Limestone<br />
MS<br />
Navarro<br />
Rockwall<br />
Gulf of Mexico<br />
LOCATION MAP<br />
AL<br />
Hunt<br />
Hopkins Franklin<br />
TRAVIS PEAK SANDSTONE PERMEABILITY Morris(md)<br />
Henderson<br />
Freestone<br />
Van Zandt<br />
Leon<br />
Rains<br />
TRI CITIES<br />
0.1 to 85.0<br />
Anderson<br />
Wood<br />
Smith<br />
Houston<br />
Cherokee<br />
Titus<br />
Camp<br />
WILLOW<br />
SPRINGS<br />
20<br />
1.48 (Ave)<br />
PERCY WHEELER<br />
0.076 (Ave)<br />
0 10 20 30 40 Miles<br />
Upshaw<br />
Gregg<br />
Rusk<br />
HENDERSON<br />
72<br />
CYRIL<br />
TEXAS<br />
LOUISIANA<br />
Miller<br />
Cass Lafayette Columbia<br />
Marion<br />
Harrison<br />
WASCOM<br />
65<br />
Panola<br />
Shelby<br />
Caddo<br />
Bossier<br />
BETHANY-<br />
LONGSTREET<br />
115<br />
De Soto<br />
Sabine<br />
Webster<br />
LEATHERMAN<br />
CREEK<br />
SIBLEY<br />
Beinville<br />
Red River<br />
0.7<br />
131<br />
VILLAGE<br />
706<br />
Claiborne<br />
ADA<br />
Natchitoches<br />
SUGAR<br />
CREEK<br />
BRYCELAND<br />
65<br />
BEAR CREEK<br />
LISBON<br />
500<br />
TRAVIS PEAK SANDSTONE PERMEABILITY (md)<br />
SIMSBORO<br />
170<br />
500<br />
2 to 50<br />
ARKANSAS<br />
LOUISIANA<br />
Lincoln<br />
Jackson<br />
CLEAR BRANCH<br />
Winn<br />
0 10 20 30 40 Miles<br />
OK<br />
DETAIL<br />
AREA<br />
TX<br />
AR<br />
LA<br />
MS<br />
Gulf of Mexico<br />
LOCATION MAP<br />
Figure 13. Map of northeast Texas showing measured values of permeability for productive Travis Peak sandstones in various fields.<br />
Multiple values of permeability for a particular field refer to measured values for different stacked sandstone reservoirs in that field.<br />
Permeability data are shown in Table 1 along with sources for those data.<br />
Grant<br />
3.8<br />
1.4<br />
0.6<br />
0.3<br />
Union<br />
CHOUDRANT<br />
250<br />
LaSalle<br />
Ouachita<br />
CHENIERE<br />
CREEK<br />
COTTON<br />
PLANT<br />
166<br />
6.0<br />
Caldwell<br />
Ashley<br />
Morehouse<br />
Catahoula<br />
Richland<br />
Franklin<br />
Concordia<br />
Chicot<br />
Tensas<br />
Madison<br />
LOUISIANA<br />
AL<br />
MISSISSIPPI
GAMMA<br />
RAY<br />
COMPOSITE LOG PROFILE OF TRAVIS PEAK FORMATION<br />
100 FT<br />
RESISTIVITY<br />
TRAVIS PEAK<br />
Coastal Plain / Paralic / Marine<br />
High-Sinuosity Fluvial<br />
(Isolated channel sandstones encased in<br />
laterally extensive floodplain shales)<br />
Low-Sinuosity Fluvial<br />
(Stacked channel and splay sandstones<br />
with minor floodplain shales)<br />
Delta Fringe / Marginal Marine<br />
(Alternating shales and sandstones deposited<br />
during initial progradation of Travis Peak)<br />
COTTON VALLEY<br />
(Isolated distributary-channel,<br />
tidal-channel, and tidal-flat<br />
sandstones encased in shales)<br />
Figure 14. Map of north Louisiana showing measured values of permeability for productive Travis Peak<br />
sandstones in various fields. Multiple values of permeability for a particular field refer to measured<br />
values for different stacked sandstone reservoirs in that field. Permeability data are shown in Table 1<br />
along with sources for those data.
The following talk was presented at the Rocky Mountain Association of Geologists symposium on<br />
basin-center gas.<br />
GEOLOGIC SCREENING OF THIRTY-THREE POTENTIAL BASIN-CENTER GAS<br />
ACCUMULATIONS IN THE U.S.<br />
Vito F. Nuccio, Thaddeus S. Dyman, James W. Schmoker, and Ronald C. Johnson, USGS;<br />
Timothy Gognat, Marin A. Popov, Michael S. Wilson, and<br />
Charles Bartberger, Consulting Geologists<br />
Basin-center accumulations, a type of continuous accumulation, have spatial dimensions equal to or<br />
exceeding those of conventional oil and gas accumulations, but unlike conventional fields, cannot be<br />
represented in terms of discrete, countable units delineated by downdip hydrocarbon-water contacts.<br />
Common geologic and production characteristics of continuous accumulations include their occurrence<br />
downdip from water-saturated rocks, lack of traditional trap or seal, relatively low matrix permeability,<br />
abnormal pressures (high or low), local interbedded source rocks, large in-place hydrocarbon volumes, and<br />
low recovery factors.<br />
The U.S. Geological Survey, in cooperation with the U.S. Department of <strong>Energy</strong>, <strong>National</strong> <strong>Energy</strong><br />
<strong>Technology</strong> <strong>Laboratory</strong>, Morgantown, West Virginia, is currently re-evaluating the resource potential of<br />
basin-center gas accumulations in the U.S. in light of changing geologic perceptions about these<br />
accumulations (such as the role of subtle structures to produce sweet spots), and the availability of new<br />
data. Better geologic understanding of basin-center gas accumulations could result in new plays or revised<br />
plays relative to those of the U.S. Geological Survey 1995 <strong>National</strong> Assessment (Gautier and others,<br />
1995).<br />
For this study, 33 potential basin-center gas accumulations throughout the U.S. were identified and<br />
characterized based on data from the published literature and from well and reservoir databases (Figure 1).<br />
However, well-known or established basin-center accumulations such as the Green River Basin, the Uinta<br />
Basin, and the Piceance Basin are not addressed in this study.<br />
The areas included in this study:<br />
Western North Slope of Alaska Hanna basin<br />
Central Alaska basins Park basins of Colorado<br />
Cook Inlet, Alaska Raton basin<br />
Puget Sound trough W. WA Denver basin<br />
Columbia basin/W. flank of the Cascades Permian basin<br />
Modoc/Northern California Rio Grande rift<br />
Sacramento/San Joaquin basins Anadarko basin<br />
Santa Maria basin Mid-continent rift<br />
Los Angeles basin (deep) Arkoma basin<br />
Salton trough Gulf Coast–Travis Peak/Cotton Valley<br />
Great Basin (Tertiary basins) Gulf Coast–Austin Chalk<br />
Snake River downwarp Gulf Coast–Eagle Ford Formation<br />
Central Montana (Sweetgrass arch) Black Warrior basin<br />
Paradox basin--Precambrian Michigan basin<br />
Paradox basin--Pennsylvanian Appalachian basin<br />
Wasatch Plateau Eastern U.S. Triassic rift basins<br />
North end San Rafael Swell
Figure 1: Map showing locations of the basins or areas screened for potential basin-center accumulations.<br />
For each potential accumulation, we summarized the geologic setting and the balance of evidence<br />
regarding the existence of a basin-center accumulation and mapped areas of favorable production<br />
characteristics (sweet spots) of the accumulation considered to have the best resource potential. This<br />
preliminary screening provides a rationale for planning and carrying out a program of detailed geologic<br />
studies leading toward full geologic assessments.<br />
The accumulations are described as to their potential (or in some cases, lack of potential). Some of the<br />
considerations for our determinations include: (1) the amount of data available for an accumulation, and our<br />
level of confidence in the data, (2) the 30-year impact of the potential accumulation, (3) the magnitude or<br />
size of the potential resource, (4) the geologic risk (e.g., depth, remoteness), (5) geographic distribution,<br />
and (6) the relationship to the USGS 1995 oil and gas assessment (have our perceptions about an<br />
accumulation changed since then?). Following is a list of the accumulations screened with a brief note as<br />
to the possibility or existence of a potential basin-center accumulation.
Basin or Area<br />
Evaluation of Area for Basin-Center<br />
Accumulation<br />
Western North Slope of Alaska Potential for basin-center accumulation. Multiple source<br />
and reservoir rocks, and gas shows in most wells drilled.<br />
To date, no off-structure wells have been drilled, so<br />
extent of accumulation uncertain.<br />
Central Alaska basins There are possibilities for basin-center accumulations in<br />
the Central Alaska basins. Source and reservoir rocks are<br />
present in Paleozoic through Cenozoic units, however,<br />
sparse data and remoteness make these plays fairly high<br />
risk.<br />
Cook Inlet, Alaska Potential for a basin-center accumulation is fair to low<br />
because of low thermal maturities, high permeabilities,<br />
and high water production.<br />
Puget Sound trough, W. WA Potential basin-center accumulation in the Upper Eocene<br />
Cowlitz Formation in the deeper parts of the trough.<br />
Columbia Basin/W. Flank of the Cascades Very limited data and a few wells with overpressuring<br />
indicate some potential in the Cretaceous and Tertiary,<br />
but high water production makes risk high.<br />
Modoc/Northern California Although speculative, a basin-center accumulation may<br />
exist in the Upper Cretaceous Hornbrook Formation and<br />
Eocene Montgomery Creek Formation.<br />
Sacramento/San Joaquin basins Small area in the deep basin may prove to have a basincenter<br />
gas accumulation in the Cretaceous Forbes<br />
Formation.<br />
Santa Maria basin Potential for a continuous accumulation in organic-rich,<br />
fractured shale of the Monterey Formation.<br />
Los Angeles Basin (deep) Potential basin-center accumulation in the deep Miocene<br />
section where mature source rocks may be present.<br />
Salton trough Low potential for basin-center accumulation due to lack<br />
of source rocks and extremely high temperatures.<br />
Great Basin (Tertiary basins) Source rocks along with high geothermal gradients may<br />
have contributed to basin-center gas accumulations<br />
within Tertiary grabens.<br />
Snake River downwarp Although speculative, several favorable factors necessary<br />
for a basin-center accumulation do exist in the Tertiary<br />
section.<br />
Central Montana (Sweetgrass arch) Potential for basin-center accumulation low.<br />
Paradox basin--Precambrian Chuar Group contains good source rocks, but virtually<br />
untested. Potential for a frontier basin-center<br />
accumulation, however risk is high.<br />
Paradox Basin--Pennsylvanian Possibility for a continuous-type oil (and where<br />
overmature, gas) accumulation in the Cane Creek<br />
interval. Fractures are critical to the success of the play.<br />
Wasatch Plateau Although located in proximity to a major coalbed<br />
methane play, potential for a basin-center accumulation<br />
here is low.
Basin or Area<br />
Evaluation of Area for Basin-Center<br />
Accumulation<br />
North end San Rafael Swell Potential for a basin-center accumulation in the<br />
Cretaceous Dakota Formation is there, however,<br />
supporting data are sparse.<br />
Hanna basin Geologic relations within the basin, and comparison<br />
with other Rocky Mountain basins make a Cretaceous<br />
and lower Tertiary basin-center accumulation probable.<br />
Park basins of Colorado Potential for basin-center accumulation in Apache Creek<br />
Sandstone and Niobrara Fm., especially in the South<br />
Park basin.<br />
Raton basin Potential basin-center gas accumulation in the<br />
Cretaceous Vermejo and Cretaceous and Paleocene Raton<br />
Formation.<br />
Denver basin Potential for basin-center accumulation in strata from the<br />
top of the Niobrara to the base of the Cretaceous.<br />
Permian basin The Abo Formation, although productive with abnormal<br />
pressures, does not contain most of the parameters for a<br />
basin-center accumulation.<br />
Rio Grande rift Gas shows, low permeabilities, and other evidence<br />
suggest a basin-center gas accumulation in the<br />
Cretaceous section in the Albuquerque basin.<br />
Anadarko basin Exhibits some characteristics of a basin-center gas<br />
accumulation, but has excessive water production and<br />
hydrocarbon-water contacts. Potential for localized gassaturated<br />
accumulations in the deep basin.<br />
Mid-continent rift Lack of adequate source rocks indicates low potential for<br />
a basin-center accumulation.<br />
Arkoma basin Entire Ordovician through Pennsylvanian section appears<br />
to be gas saturated. Potential for basin-center<br />
accumulation in Pennsylvanian Atoka Formation.<br />
Gulf Coast--Travis Peak/Cotton Valley Exhibits some characteristics of a basin-center<br />
accumulation but contains diffuse hydrocarbon-water<br />
contacts. Low to moderate potential.<br />
Gulf Coast--Austin Chalk Not necessarily a true basin-center accumulation,<br />
however, hydrocarbon saturation is high throughout<br />
much of the trend.<br />
Gulf Coast--Cretaceous Eagle Ford Formation Potential for a basin-center accumulation but high risk<br />
geologically and possibly economically due to lack of<br />
fractures. It is, however, a potential source rock for<br />
reservoirs such as the Woodbine and Austin Chalk.<br />
Black Warrior basin Potential in Late Paleozoic clastic units, especially the<br />
Mississippian Chester Group; Cambro-Ordovician<br />
through Devonian carbonate units.<br />
Michigan basin Little to no potential for a basin-center accumulation in<br />
the Ordovician St. Peter Sandstone due to conventional<br />
nature including high water production.
Basin or Area<br />
Evaluation of Area for Basin-Center<br />
Accumulation<br />
Appalachian basin Potential in the Lower Silurian Clinton and Medina<br />
Group sandstones.<br />
Eastern U.S. Triassic rift basins Potential in Triassic-Jurassic sequences of source and<br />
reservoir rock. The greatest potential appears to be in<br />
the Newark and Danville basins.