Atlas of Plasmodium falciparum intraerythrocytic development using expansion microscopy
- Department of Pharmacology and Toxicology, Indiana University School of Medicine, United States
- Biological and Biomedical Sciences, Harvard Medical School, United States
- Division of Infectious Diseases, Boston Children’s Hospital, United States
- Center for Tropical and Emerging Global Diseases, University of Georgia, United States
- Department of Cellular Biology, Franklin College of Arts and Sciences, University of Georgia, United States
- Research Centre for Infectious Diseases, School of Biological Sciences, University of Adelaide, Australia
- Institute for Photonics and Advanced Sensing, University of Adelaide, Australia
- Burnet Institute, 85 Commercial Road, Australia
- Department of Pediatrics, Harvard Medical School, United States
Figures
Figure 1 with 2 supplements
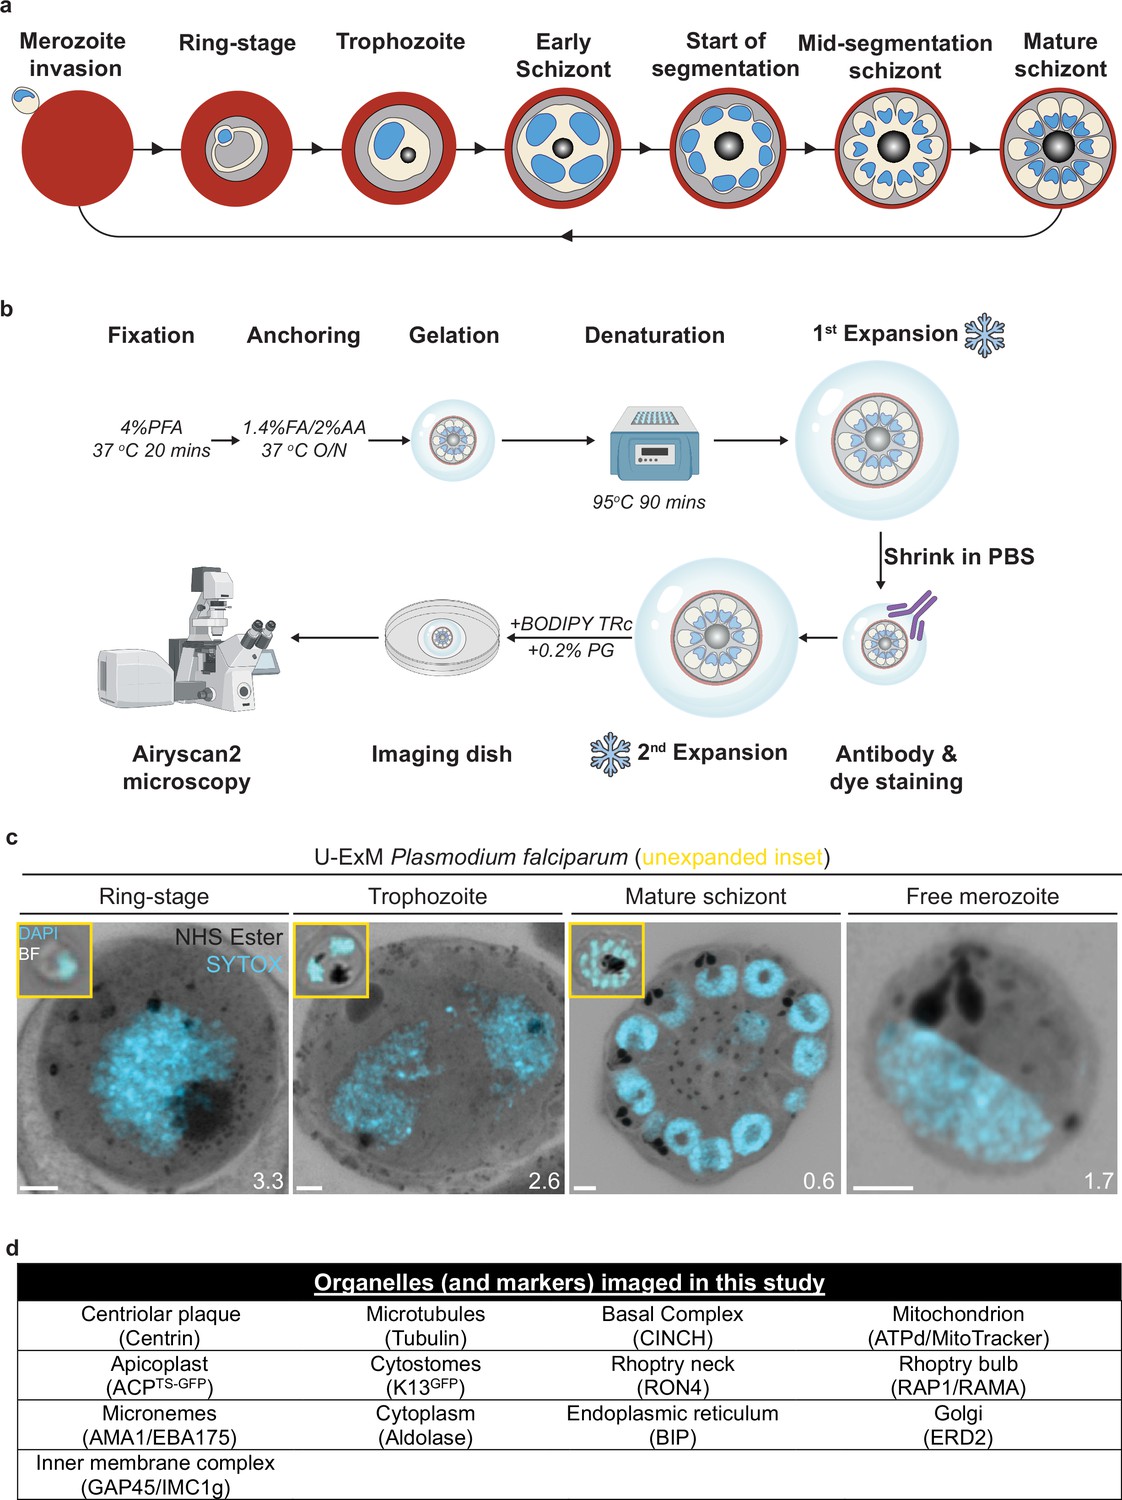
Ultrastructural expansion microscopy (U-ExM) workflow and summary of parasite structures imaged in this study.
(a) Diagram of asexual blood-stage lifecycle of P. falciparum. (b) U-ExM workflow used in this study. PFA = paraformaldehyde, FA = formaldehyde, AA = acrylamide, PG = propyl gallate. Snowflake indicates steps where gels were cryopreserved. (c) Comparison of brightfield and DAPI staining of unexpanded P. falciparum parasites (inset) with P. falciparum prepared by U-ExM, stained with N-hydroxysuccinimide (NHS) ester (protein density; grayscale) and SYTOX Deep Red (DNA; cyan), and imaged using Airyscan microscopy. Images are maximum-intensity projections, number on image = Z-axis thickness of projection in µm. Scale bars = 2 µm. (d) Summary of all organelles, and their corresponding antibodies, imaged by U-ExM in this study.
Figure 1—figure supplement 1

Size of gels imaged in this study.
(a) Forty-two of the expanded gels in this study were measured post-expansion to (b) calculate their expansion factor. The median gel length was 51 mm, which corresponds to a 4.25× expansion factor, and so for ‘actual’ measurements, values were divided by 4.25.
Figure 1—figure supplement 2
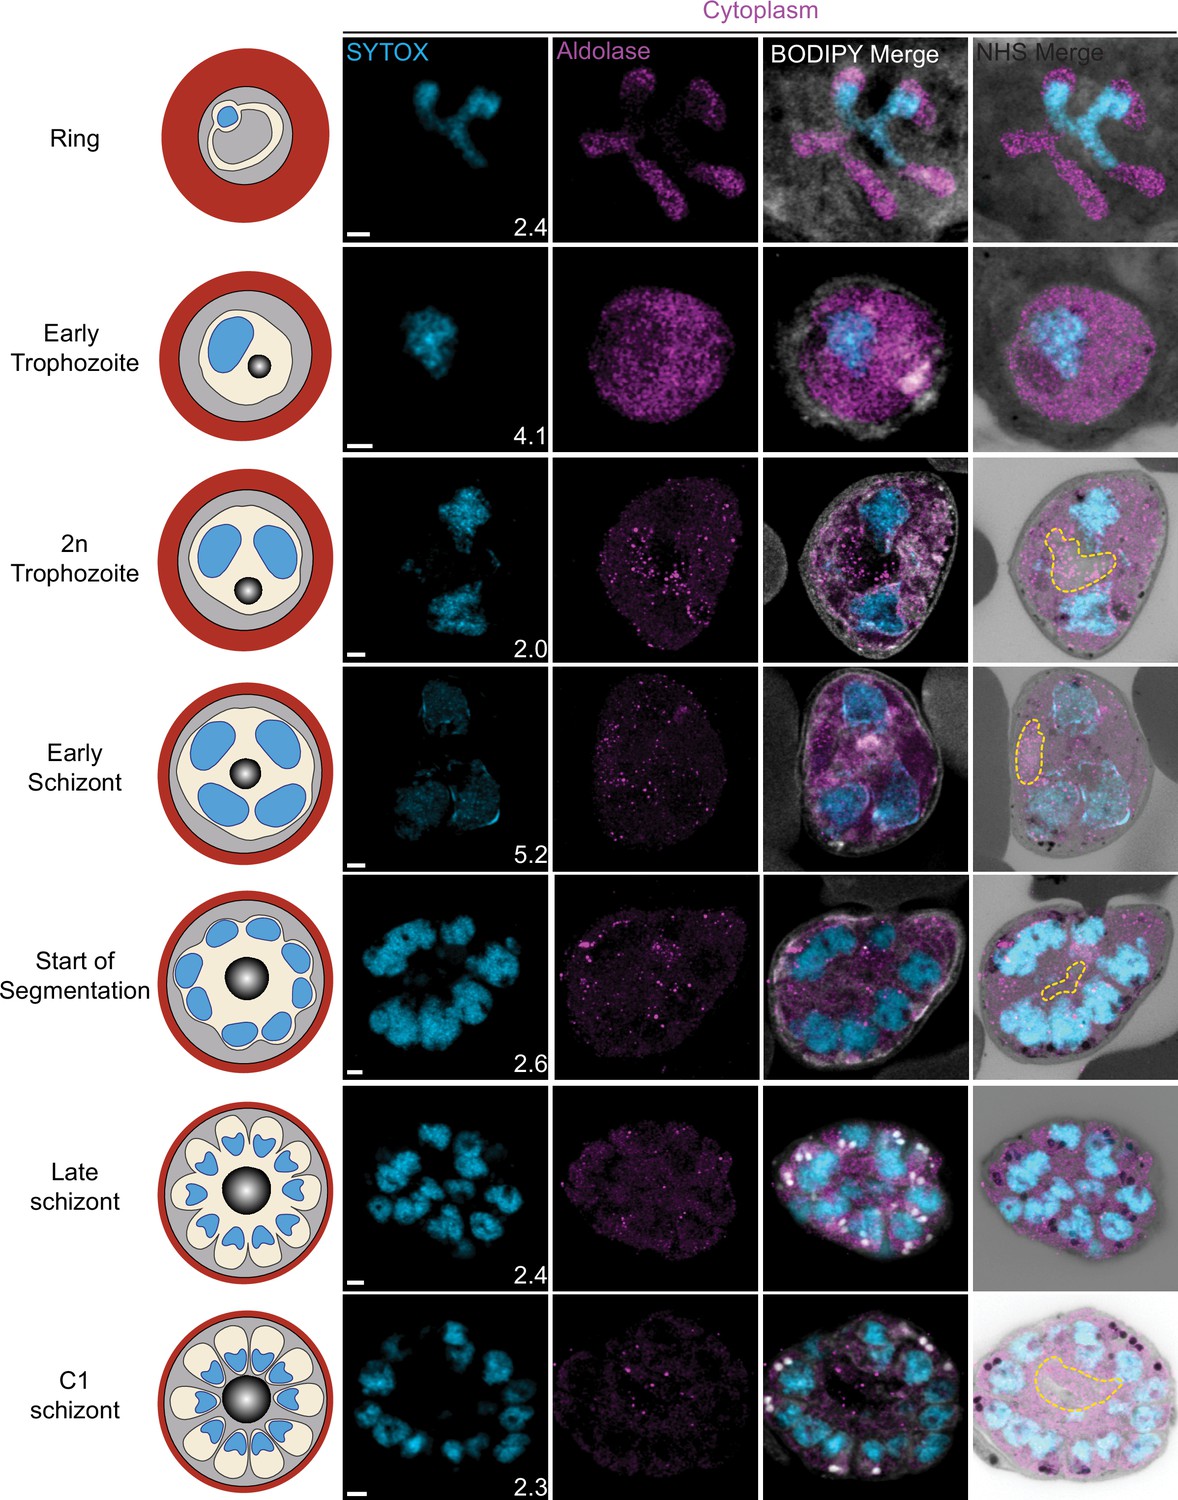
Cytoplasm staining during intraerythrocytic development.
3D7 parasites were prepared by ultrastructural expansion microscopy (U-ExM), stained with N-hydroxysuccinimide (NHS) ester (grayscale), BODIPY TRc (white), SYTOX (cyan), and anti-aldolase (cytoplasm; magenta) antibodies and imaged by Airyscan microscopy across the asexual blood stage. Yellow line indicates likely position of food vacuole lacking hemozoin crystal. n = nucleus number. Images are maximum-intensity projections, number on image = Z-depth in µm of projection. Scale bars = 2 µm.
Figure 2 with 2 supplements
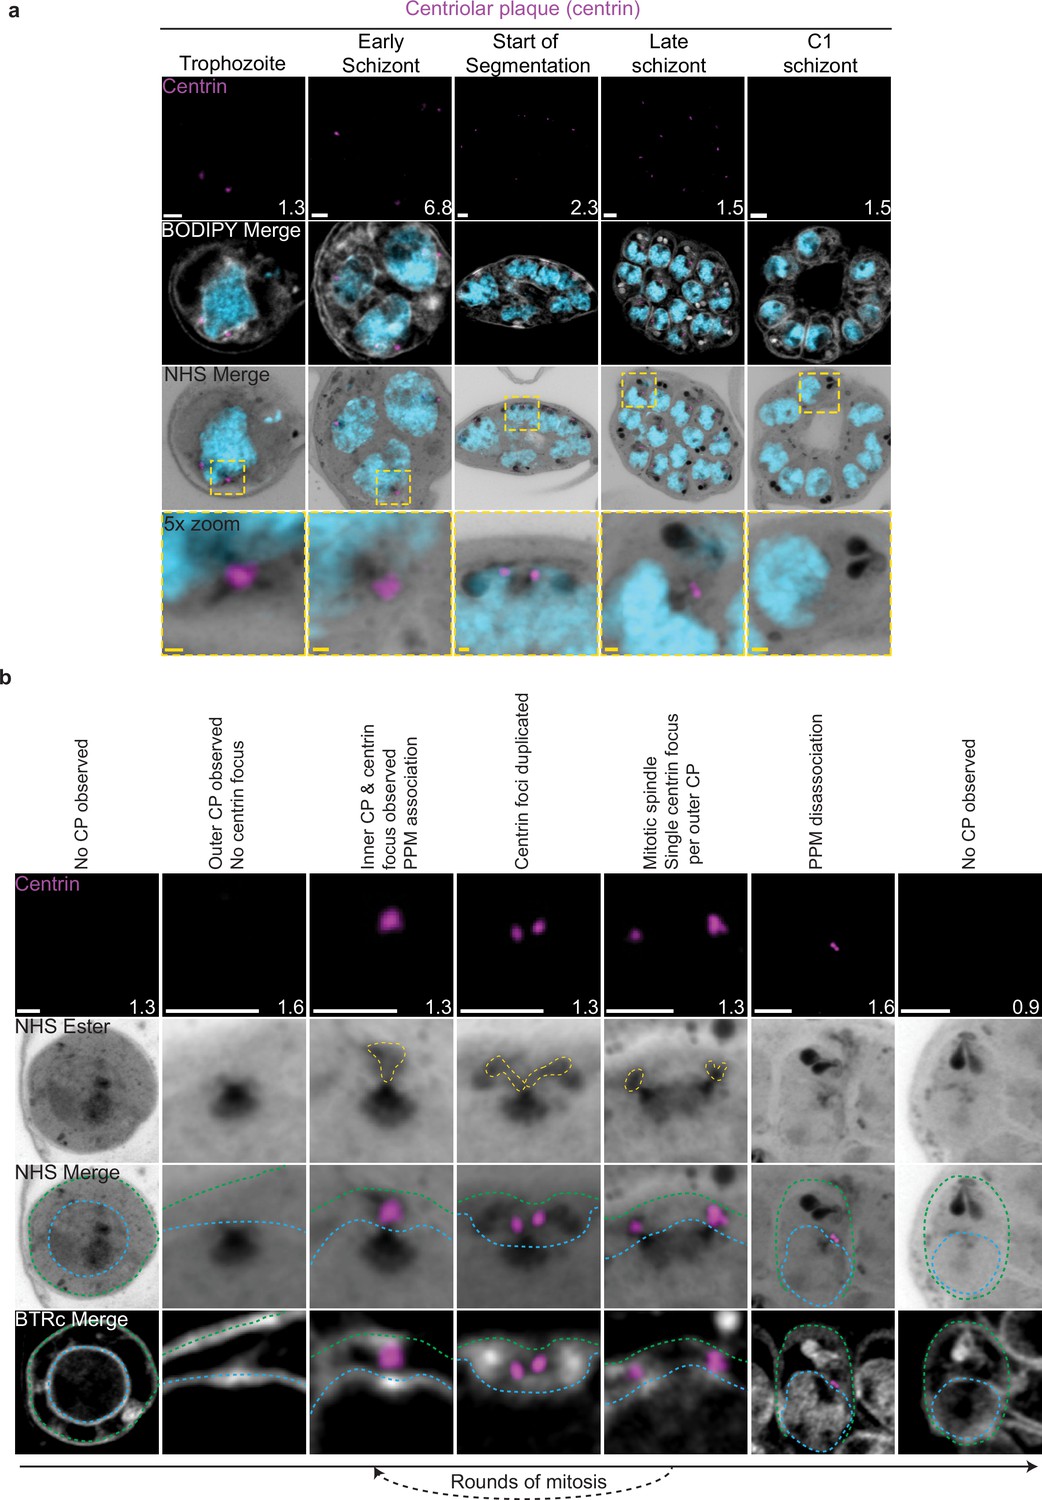
Centriolar plaque (CP) biogenesis and dynamics.
3D7 parasites were prepared by ultrastructural expansion microscopy (U-ExM), stained with N-hydroxysuccinimide (NHS) ester (grayscale), BODIPY TRc (white), SYTOX (cyan), and anti-centrin (outer CP; magenta) antibodies and imaged using Airyscan microscopy. (a) Images of whole parasites throughout asexual blood-stage development. (b) Whole parasite panel (left) followed by individual CP or CP pair zooms following our proposed timeline of events in CP biogenesis, dynamics, and disassembly. Yellow line = cytoplasmic extensions, blue line = nuclear envelope, green line = parasite plasma membrane. Images are maximum-intensity projections, number on image = Z-axis thickness of projection in µm. White scale bars = 2 µm, yellow scale bars = 500 nm.
Figure 2—figure supplement 1

Characterization of outer centriolar plaque (CP) branches.
(a) Mononucleated 3D7 parasites were prepared by ultrastructural expansion microscopy (U-ExM), stained with N-hydroxysuccinimide (NHS) ester (grayscale), anti-centrin (outer CP, magenta) and anti-tubulin (microtubules, yellow) antibodies and imaged by Airyscan microscopy. Nuclei form the first hemispindle before centrin is observed and associated with the parasite plasma membrane (PPM) following visualization of centrin. (b) Quantification of the number of cytoplasmic extensions (branches) per outer CP in parasites of varying age. Individual CPs from mitotic spindles were assessed separately. (c) Quantification of the co-occurrence of outer CP branch number with centrin foci. (d) In the 8% of two cytoplasmic extension outer CPs that had only a single centrin focus, these were likely non-resolvable at the image resolution. (e) Parasites that had started mitosis were stained with NHS ester and Golgi marker ERD2 (magenta). Golgi was seen associating with CPs and appeared to duplicate with the formation of the mitotic spindle. Images are maximum-intensity projections, number on image = Z-depth in µm of projection. Scale bars = 2 µm.
Figure 2—figure supplement 2

Golgi staining during intraerythrocytic development.
3D7 parasites were prepared by ultrastructural expansion microscopy (U-ExM), stained with N-hydroxysuccinimide (NHS) ester (grayscale), BODIPY TRc (white), SYTOX (cyan), and anti-ERD2 (Golgi; magenta) antibodies and imaged by Airyscan microscopy across the asexual blood stage. Images are maximum-intensity projections, number on image = Z-depth in µm of projection. White scale bars = 2 µm, yellow scale bars = 500 nm. 4× zooms show Golgi–centriolar plaque interaction.
Figure 3 with 1 supplement

Characterization of intranuclear and subpellicular microtubules (SPMTs).
3D7 parasites were prepared by ultrastructural expansion microscopy (U-ExM), stained with N-hydroxysuccinimide (NHS) ester (grayscale), BODIPY TRc (white), SYTOX (cyan), and anti-tubulin (microtubules; magenta) antibodies, and imaged using Airyscan microscopy. (a) Images of whole parasites throughout asexual blood-stage development. (b) Nuclei in the process of dividing, with their CPs connected by an interpolar spindle. (c) The number and type of microtubule branches in interpolar spindles and (d) length of interpolar microtubules. (e) SPMTs stained with an anti-poly-glutamylation (PolyE; yellow) antibody. (f) Quantification of the number of SPMTs per merozoite from C1-treated schizonts. (g) SPMT biogenesis throughout segmentation. (h) Model for SPMT biogenesis. PPM = parasite plasma membrane, APRs = apical polar rings, BC = basal complex, CP = centriolar plaque. Images are maximum-intensity projections, number on image = Z-axis thickness of projection in µm. Scale bars = 2 µm.
Figure 3—figure supplement 1
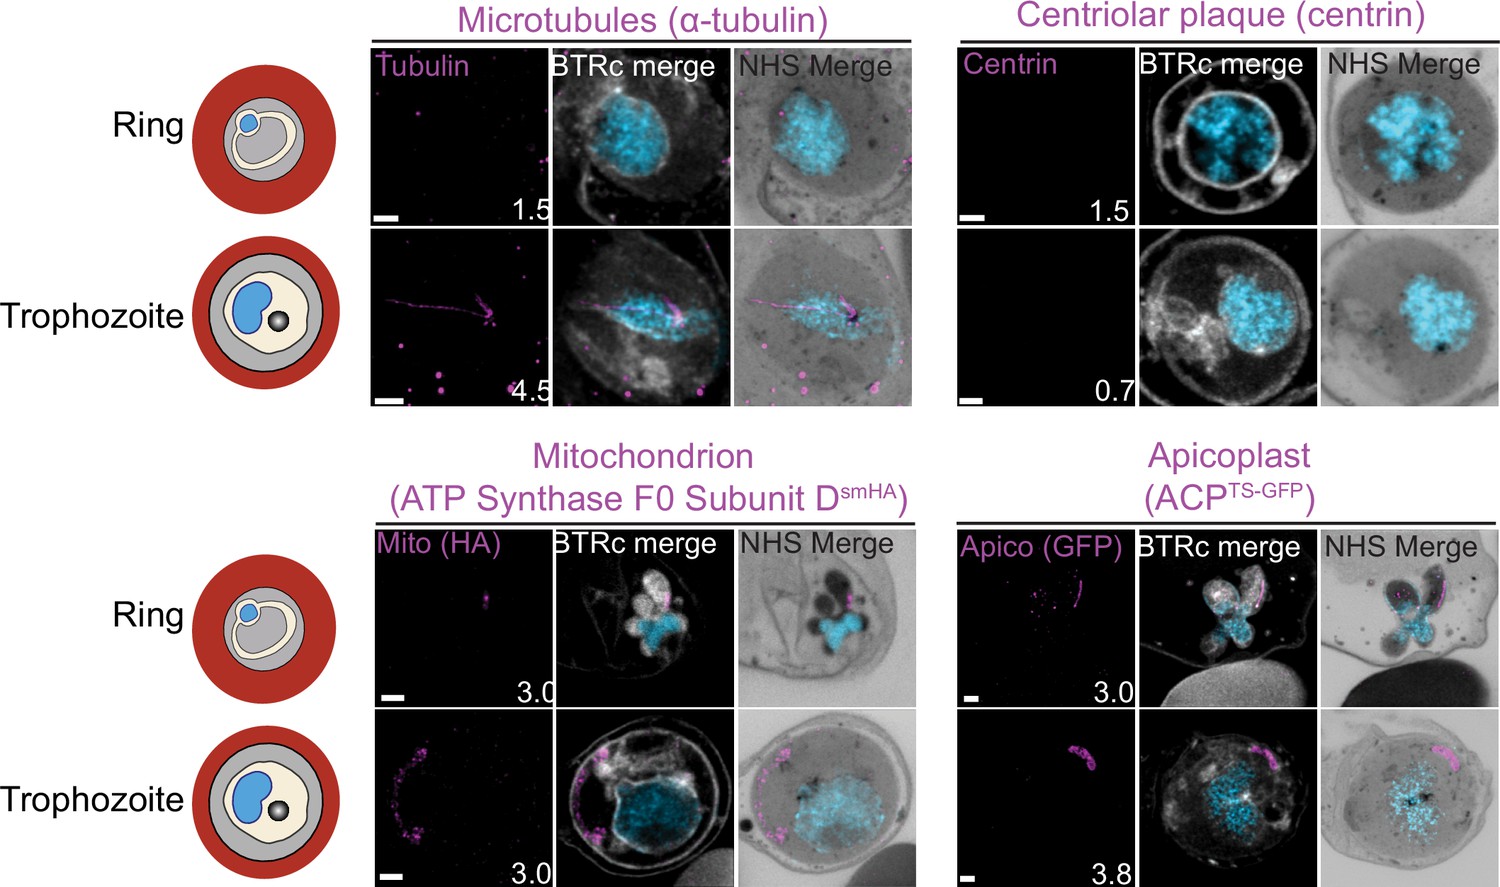
Staining of microtubules, centriolar plaque, mitochondrion, and apicoplast in rings or early trophozoite stages.
The focus of this study was parasites undergoing schizogony, but multiple ring-stage parasites and mononucleated trophozoites were also imaged. For microtubules and centrin, 3D7 parasites were prepared by ultrastructural expansion microscopy (U-ExM), stained with N-hydroxysuccinimide (NHS) ester (grayscale), BODIPY TRc (white), SYTOX (cyan), and either anti-tubulin (microtubules) or anti-centrin (outer centriolar plaque) (magenta) antibodies and imaged using Airyscan microscopy. For the mitochondrion, ATP synthase F0 subunit DsmHA parasites were stained as described for microtubules and centriolar plaque, except with anti-HA (mitochondrion) antibodies. For the apicoplast, parasites expressing a GFP-tagged copy of the apicoplast targeting signal of acyl carrier protein were stained as described previously except with anti-GFP (apicoplast) antibodies. Images are maximum-intensity projections, number on image = Z-depth in µm of projection. Scale bars = 2 µm.
Figure 4 with 3 supplements
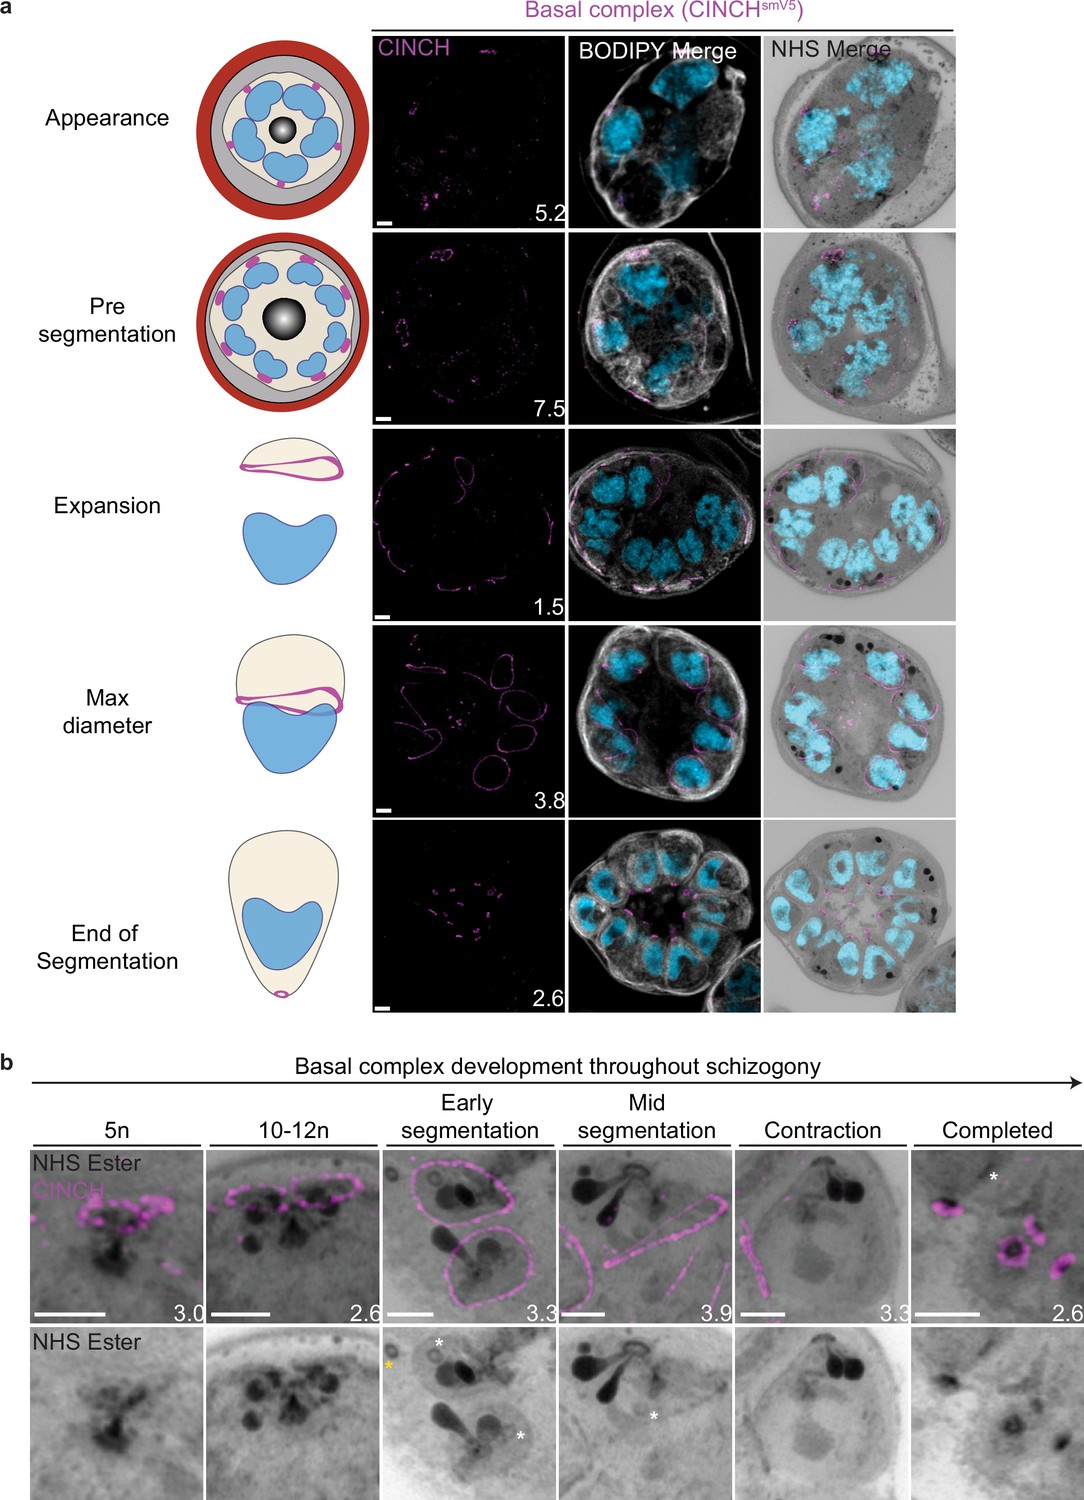
Basal complex biogenesis and development throughout segmentation.
Parasites expressing an smV5-tagged copy of the basal complex marker CINCH were prepared by ultrastructural expansion microscopy (U-ExM), stained with N-hydroxysuccinimide (NHS) ester (grayscale), BODIPY TRc (white), SYTOX (cyan), and anti-V5 (basal complex; magenta) antibodies and imaged using Airyscan microscopy across segmentation. (a) Images of whole parasites throughout asexual blood-stage development. (b) Basal complex development during schizogony. The basal complex is formed around the parasite plasma membrane (PPM) anchor of the outer centriolar plaque (CP). In nuclei whose outer CP has two branches, and will therefore undergo mitosis, the basal complex rings are duplicated. From early segmentation, the basal complex acquires a stable, expanding ring form. Cytostomes that will form part of merozoites are marked with a white asterisk, while those outside merozoites are marked with a yellow asterisk. Images are maximum-intensity projections, number on image = Z-axis thickness of projection in µm. Scale bars = 2 µm.
Figure 4—figure supplement 1
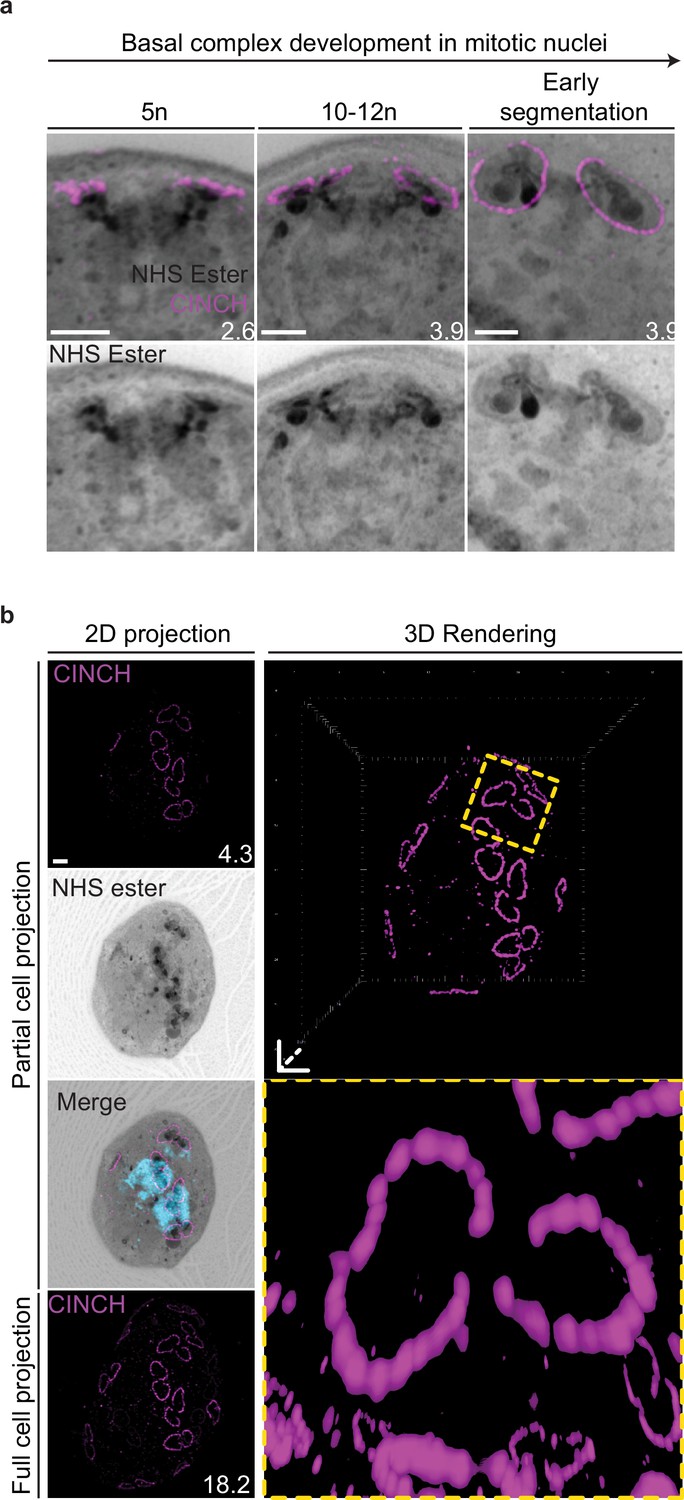
Basal complex biogenesis in mitotic nuclei.
(a) Parasites expressing an smV5-tagged copy of the basal complex marker CINCH were prepared by ultrastructural expansion microscopy (U-ExM), stained with N-hydroxysuccinimide (NHS) ester (grayscale), and anti-V5 (basal complex; magenta) antibodies and imaged by Airyscan microscopy across segmentation. All nuclei shown in Figure 4b, which describes basal complex biogenesis, had a single centriolar plaque. This figure shows comparable images of nuclei that have duplicated their centriolar plaque and have a visible mitotic spindle. (b) Maximum-intensity projection and 3D rendering during basal complex biogenesis showing semicircles of CINCH staining around the centriolar plaque. Images are maximum-intensity projections, number on image = Z-depth in µm of projection. Scale bars = 2 µm.
Figure 4—figure supplement 2
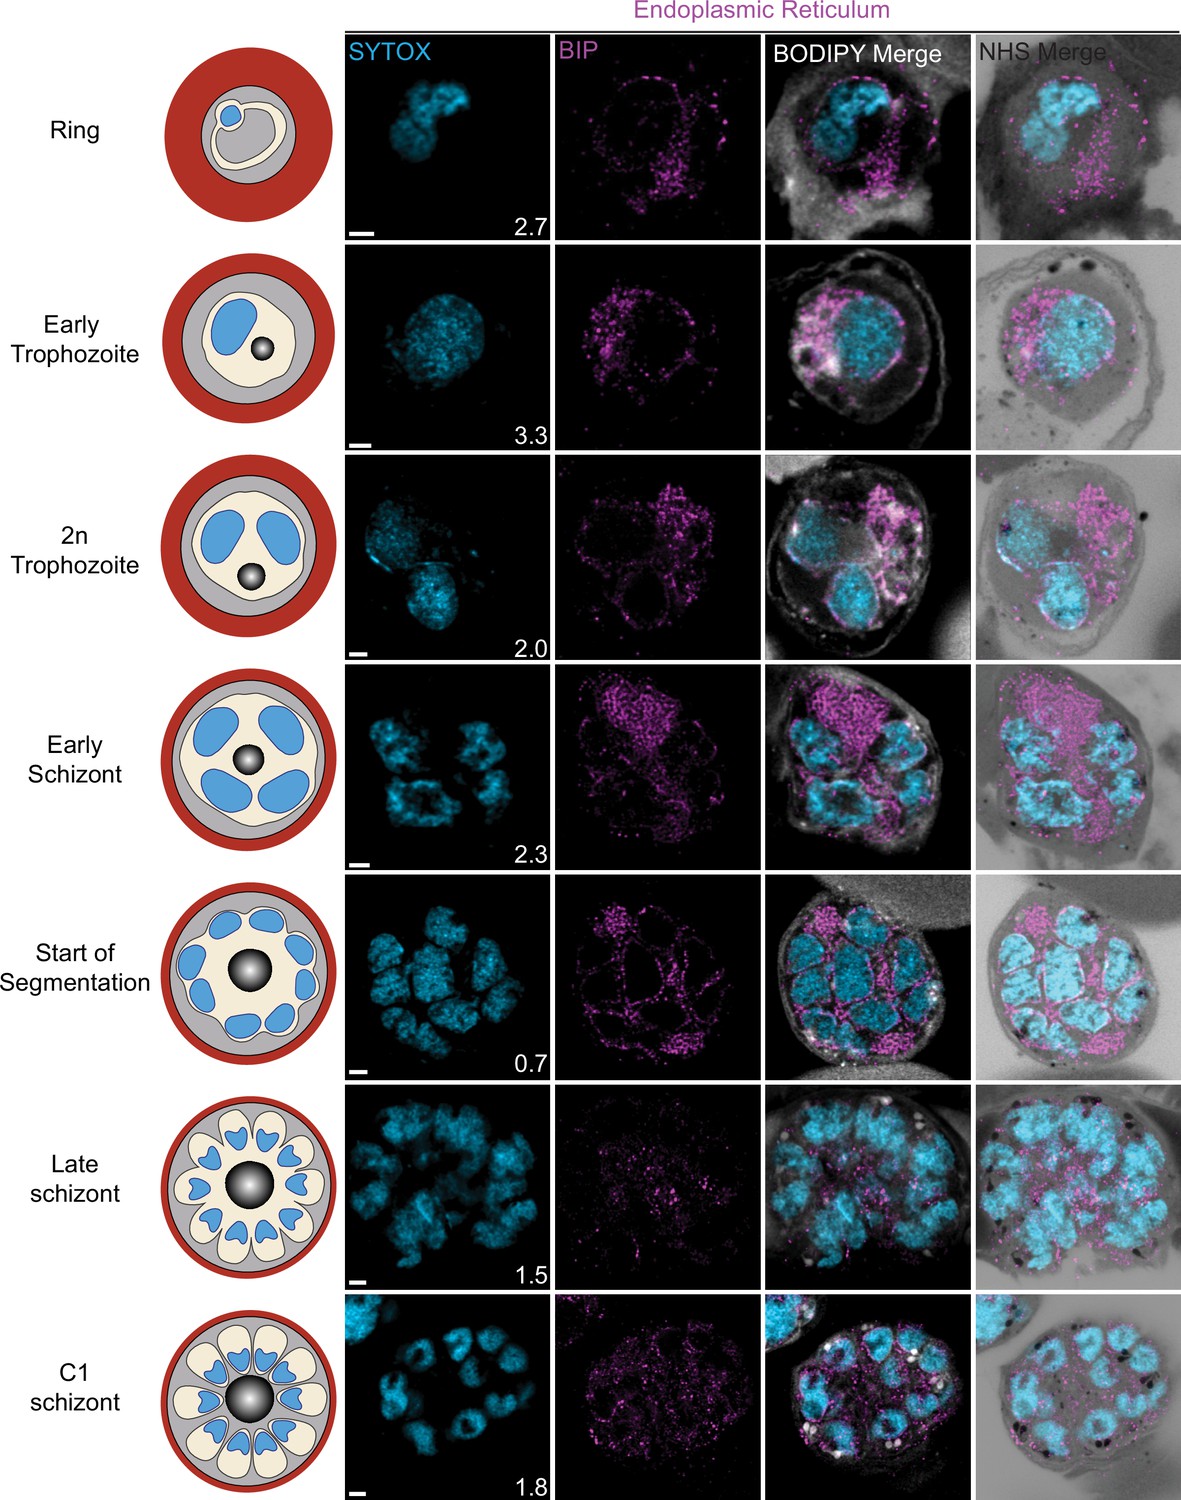
Endoplasmic reticulum staining during intraerythrocytic development.
3D7 parasites were prepared by ultrastructural expansion microscopy (U-ExM), stained with N-hydroxysuccinimide (NHS) ester (grayscale), BODIPY TRc (white), SYTOX (cyan), and anti-BIP (endoplasmic reticulum; magenta) antibodies and imaged by Airyscan microscopy across the asexual blood-stage. Images are maximum-intensity projections, number on image = Z-depth in µm of projection. Scale bars = 2 µm.
Figure 4—figure supplement 3
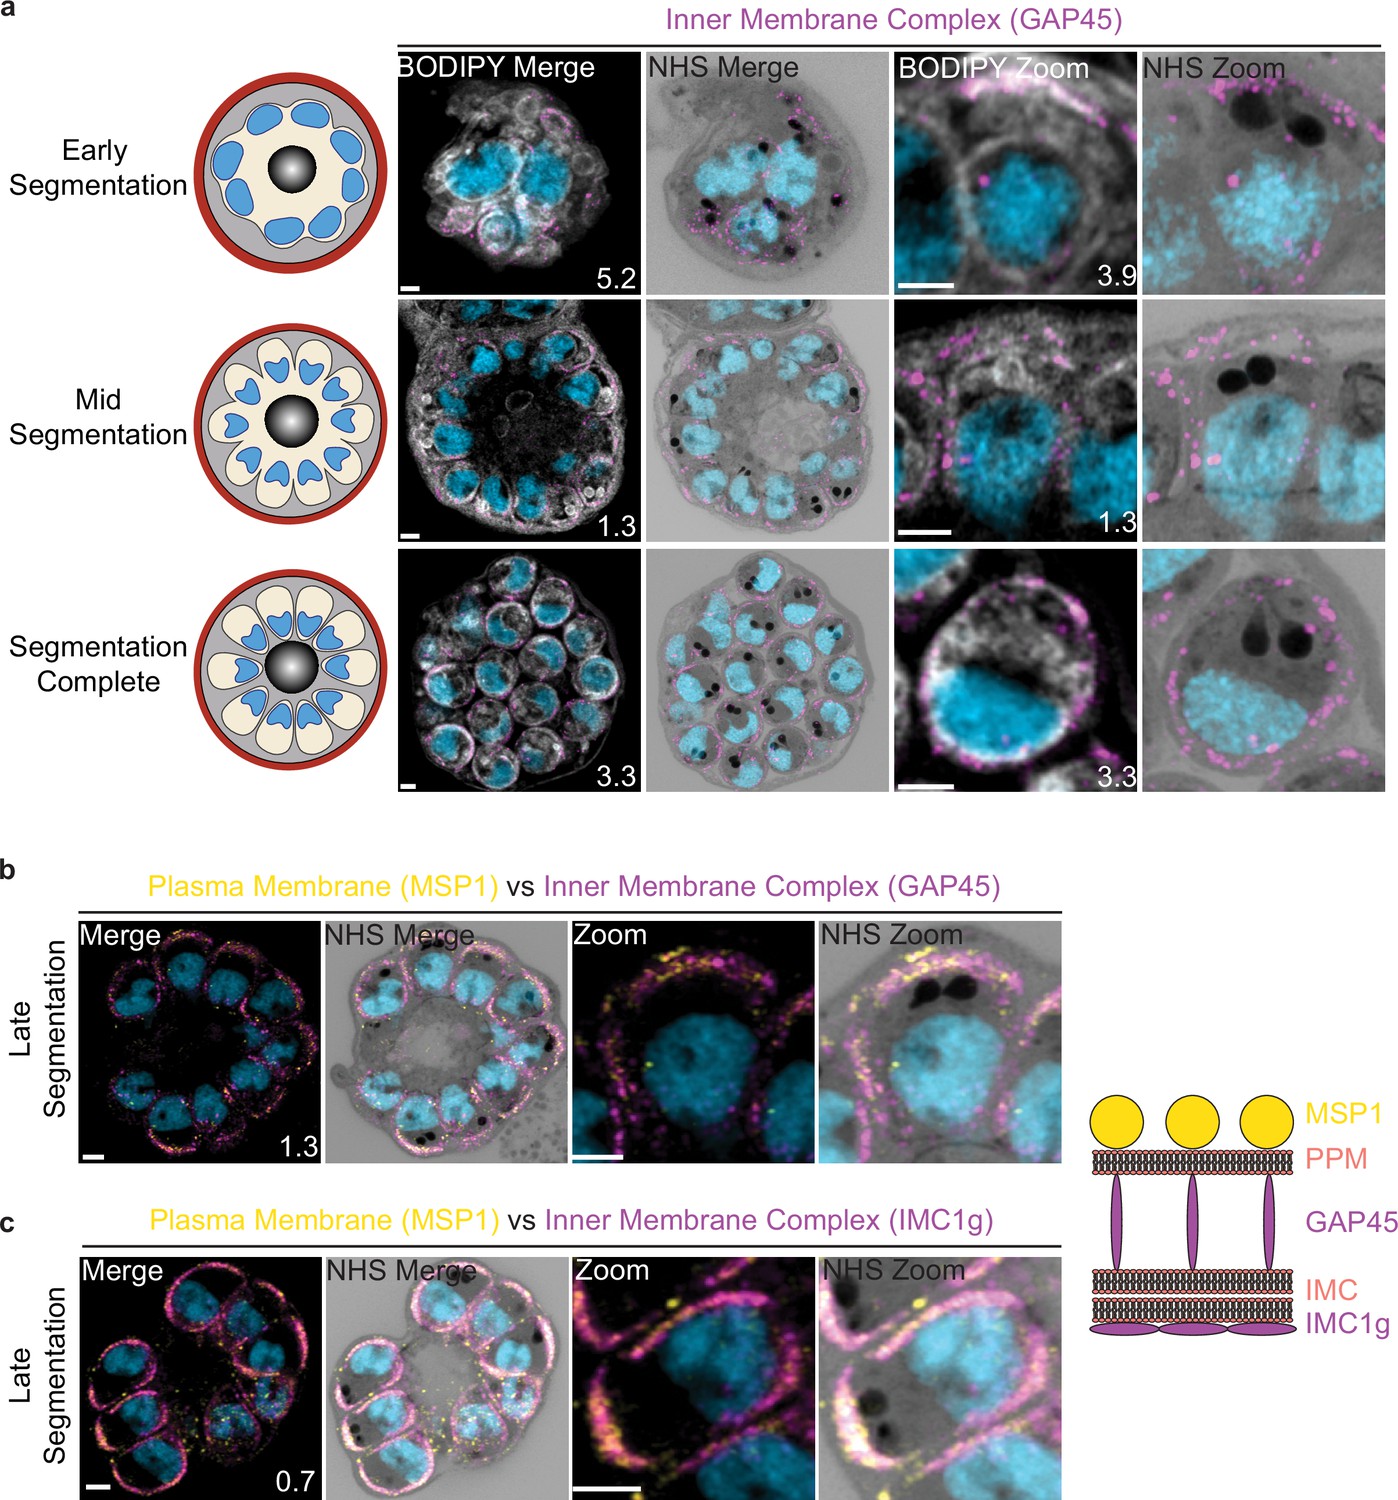
Inner membrane complex (IMC) progression through segmentation.
(a) 3D7 parasites were prepared by ultrastructural expansion microscopy (U-ExM), stained with N-hydroxysuccinimide (NHS) ester (grayscale), BODIPY TRc (white), SYTOX (cyan), and anti-GAP45 (IMC) (magenta) antibodies and imaged using Airyscan microscopy across segmentation. 3D7 parasites were stained with NHS ester, SYTOX, anti-MSP1 (parasite plasma membrane), and either anti-GAP45 (b) or anti-IMC1g (c) antibodies. GAP45 resides in the IMC luminal space, while IMC1g resides on the cytosolic side of the IMC. Neither GAP45 nor IMC1g could be reliably distinguished from MSP1. Images are maximum-intensity projections, number on image = Z-depth in µm of projection. Scale bars = 2 µm.
Figure 5 with 2 supplements
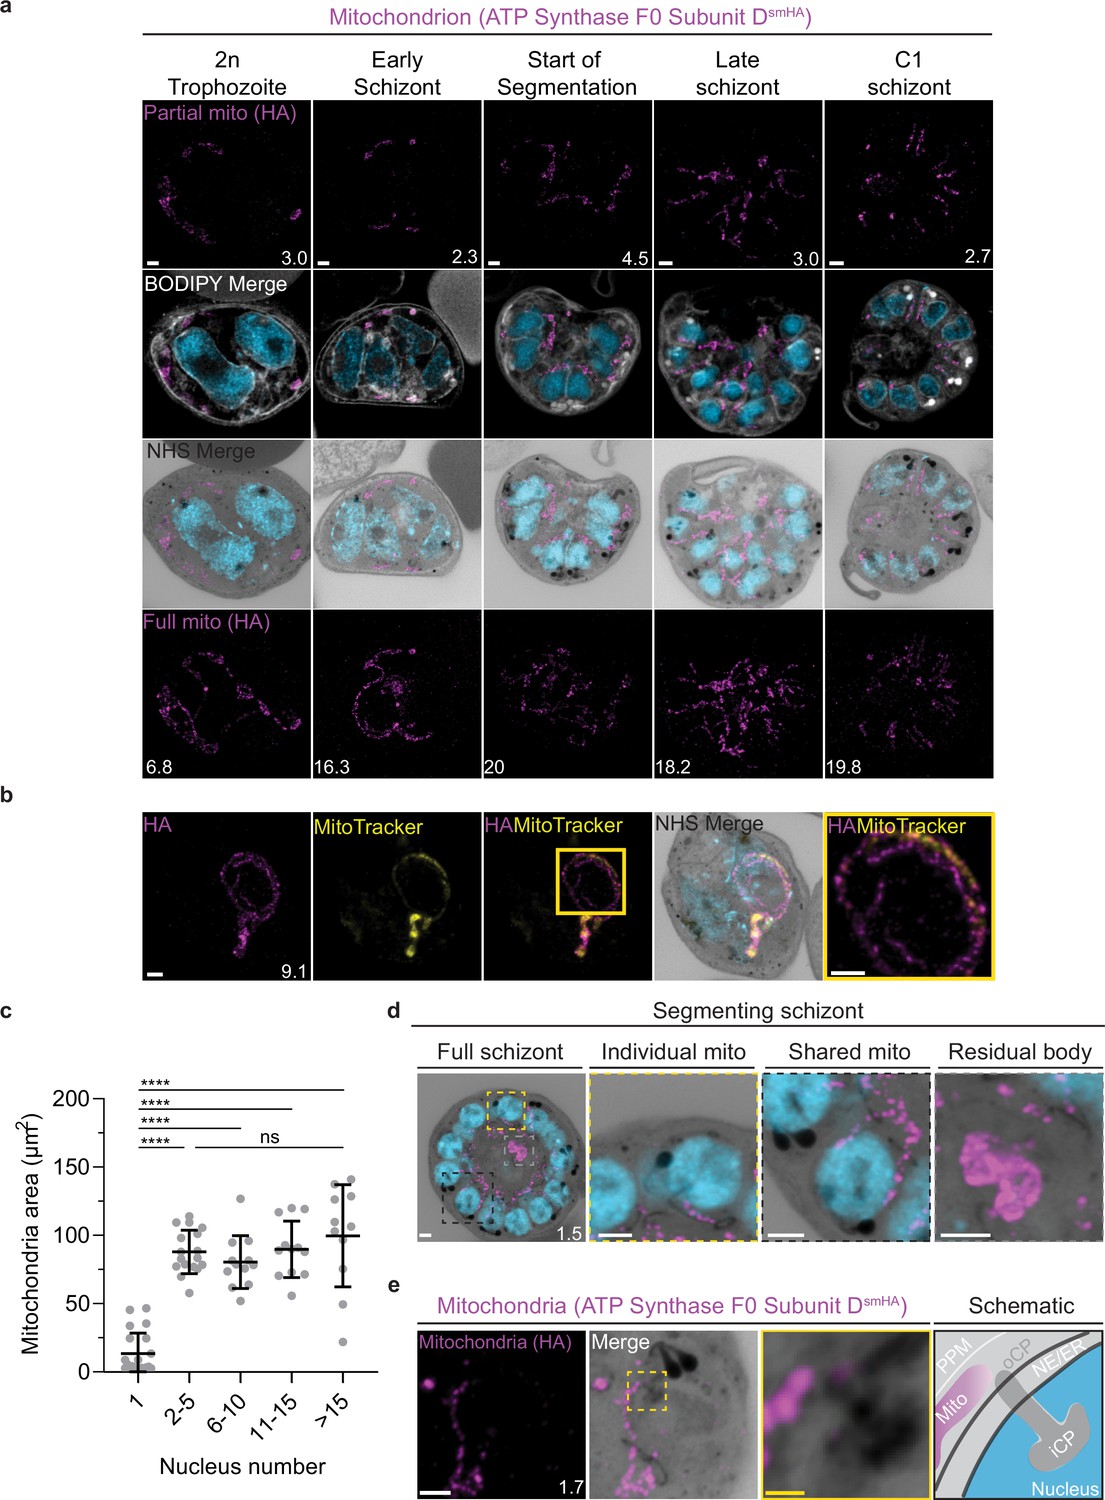
Growth and fission of the mitochondrion.
Parasites with an smHA-tagged copy of the ATP Synthase F0 Subunit D (ATPd, Pf3D7_0311800) as a mitochondrial marker were prepared by ultrastructural expansion microscopy (U-ExM), stained with N-hydroxysuccinimide (NHS) ester (grayscale), BODIPY TRc (white), SYTOX (cyan), and anti-HA (mitochondrion; magenta) antibodies and imaged using Airyscan microscopy. (a) Images of whole parasites throughout asexual blood-stage development. Maximum-intensity projections of both a subsection of the cell (partial mito) and the full cell (full mito) are shown. (b) ATPd staining was compared against MitoTracker Orange CMTMRos (yellow), which showed discontinuous staining in looped regions. (c) Area of the mitochondrion was quantified for parasites of varying nucleus number. Seventy-three cells were counted across four biological replicates. ****p<0.001, ns = p >0.05 by one-way ANOVA, error bars = SD. (d) Schizont with mitochondria that have undergone fission (yellow zoom), mitochondria that are shared between two nascent merozoites (black zoom), and mitochondria left outside merozoites in the forming residual body (gray). (e) During fission, mitochondria associate with the outer centriolar plaque (oCP). Images are maximum-intensity projections, number on image = Z-axis thickness of projection in µm. White scale bars = 2 µm, yellow scale bars = 500 nm.
Figure 5—figure supplement 1
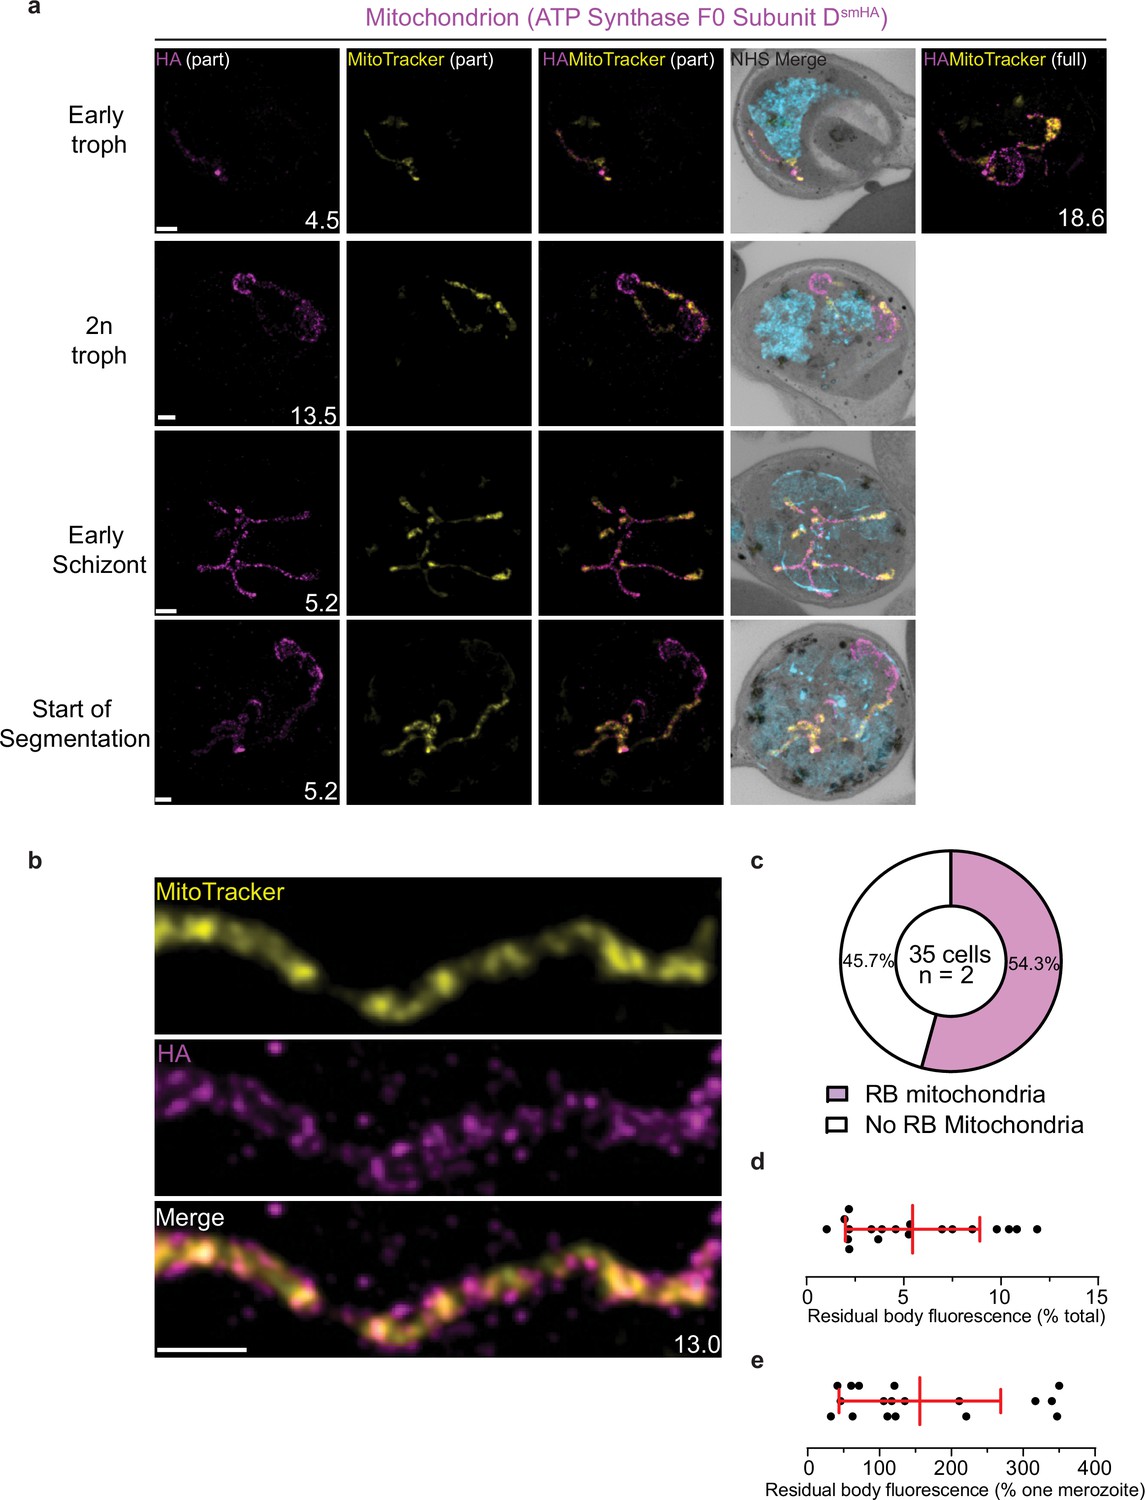
Comparison of MitoTracker with ATPd staining and residual body (RB) mitochondria quantification.
(a) Parasites with an smHA-tagged copy of the ATP Synthase F0 Subunit D (Pf3D7_0311800), a mitochondrial marker, were prepared by ultrastructural expansion microscopy (U-ExM), stained with N-hydroxysuccinimide (NHS) ester (grayscale), BODIPY TRc (white), SYTOX (cyan), MitoTracker (mitochondrion; yellow), and anti-HA (mitochondrion; magenta) antibodies and imaged Airyscan microscopy across the asexual blood-stage. Maximum-intensity projections that showed NHS Ester, BODIPY, and SYTOX of discernible structures often did not give a good indication of mitochondria shape. To address this, projections of both a subsection of the cell (part) and the full cell (full) are shown. (b) MitoTracker staining showed numerous punctae along the mitochondrion. (c) The percentage of C1-arrested schizonts where mitochondria staining was observed in the RB was quantified. This fluorescence was then compared against the total mitochondria fluorescence (d) and the mean mitochondria fluorescence of one merozoite within that schizont (e). Images are maximum-intensity projections, number on image = Z-depth in µm of projection. Scale bars = 2 µm.
Figure 5—figure supplement 2
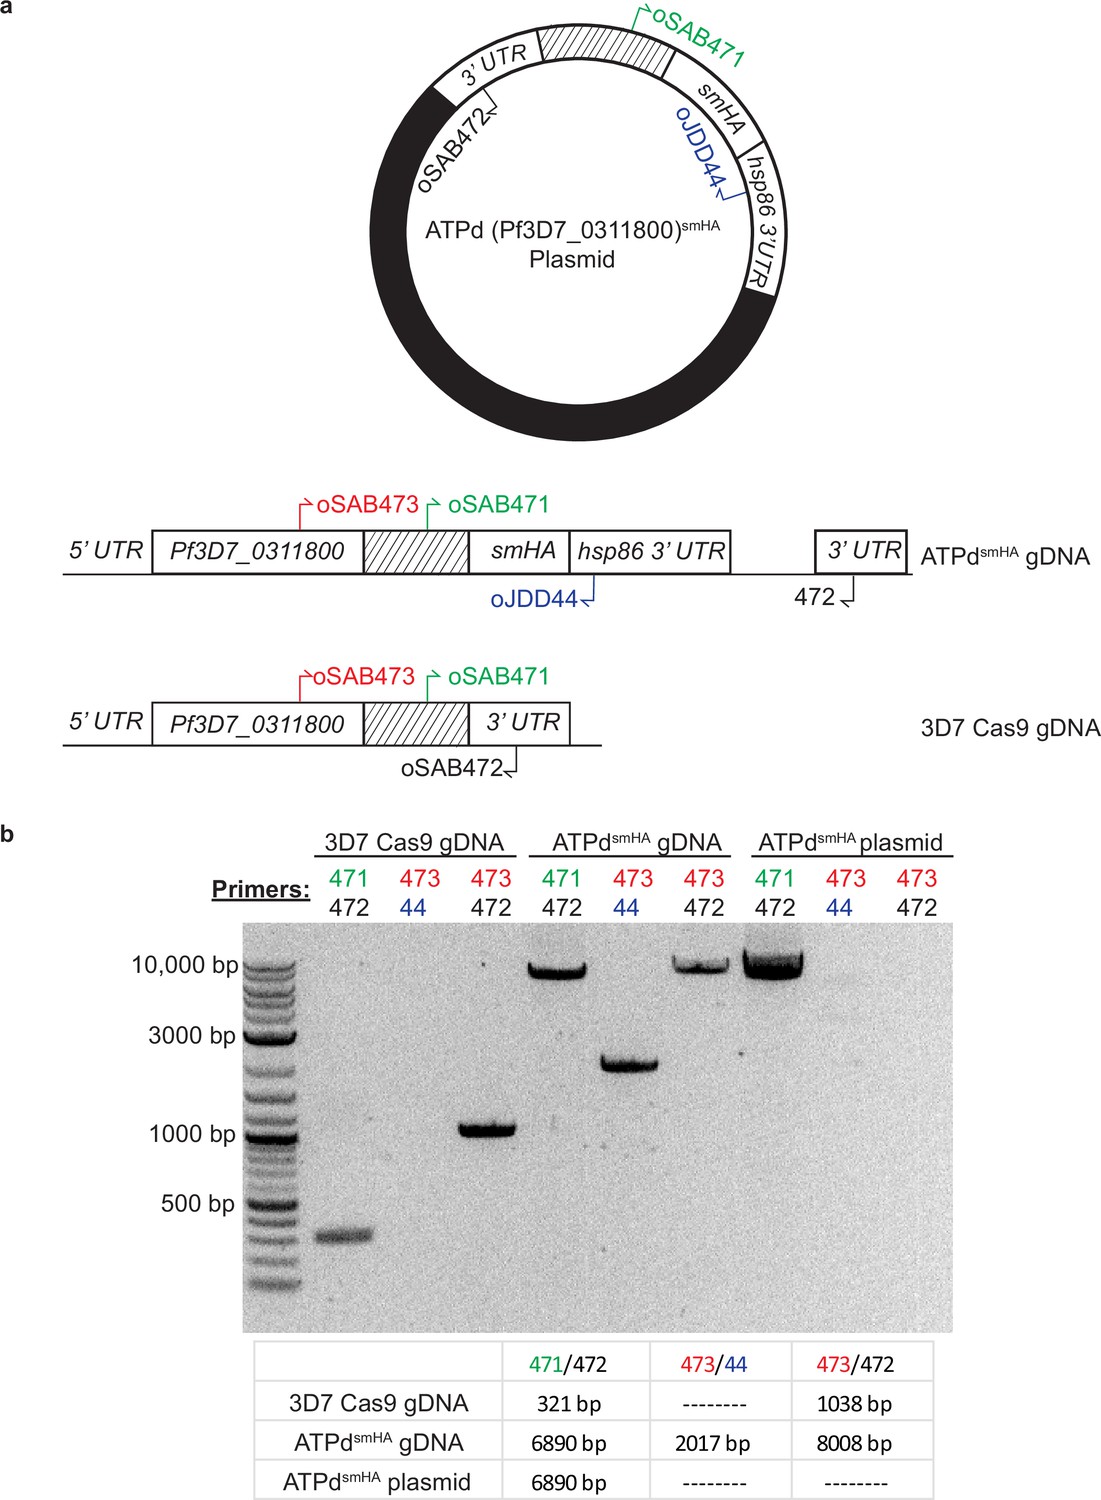
Generation of ATPd (Pf3D7_0311800) smHA parasites.
(a) To generate an smHA-tagged copy of ATPd (Pf3D7_0311800), 3D7 Cas9 parasites were transfected with a plasmid that contained a 3′ homology region to ATPd, followed by a C-terminal smHA-tag. (b) Integration of smHA tag into the ATPd locus was confirmed by PCR.
Figure 6
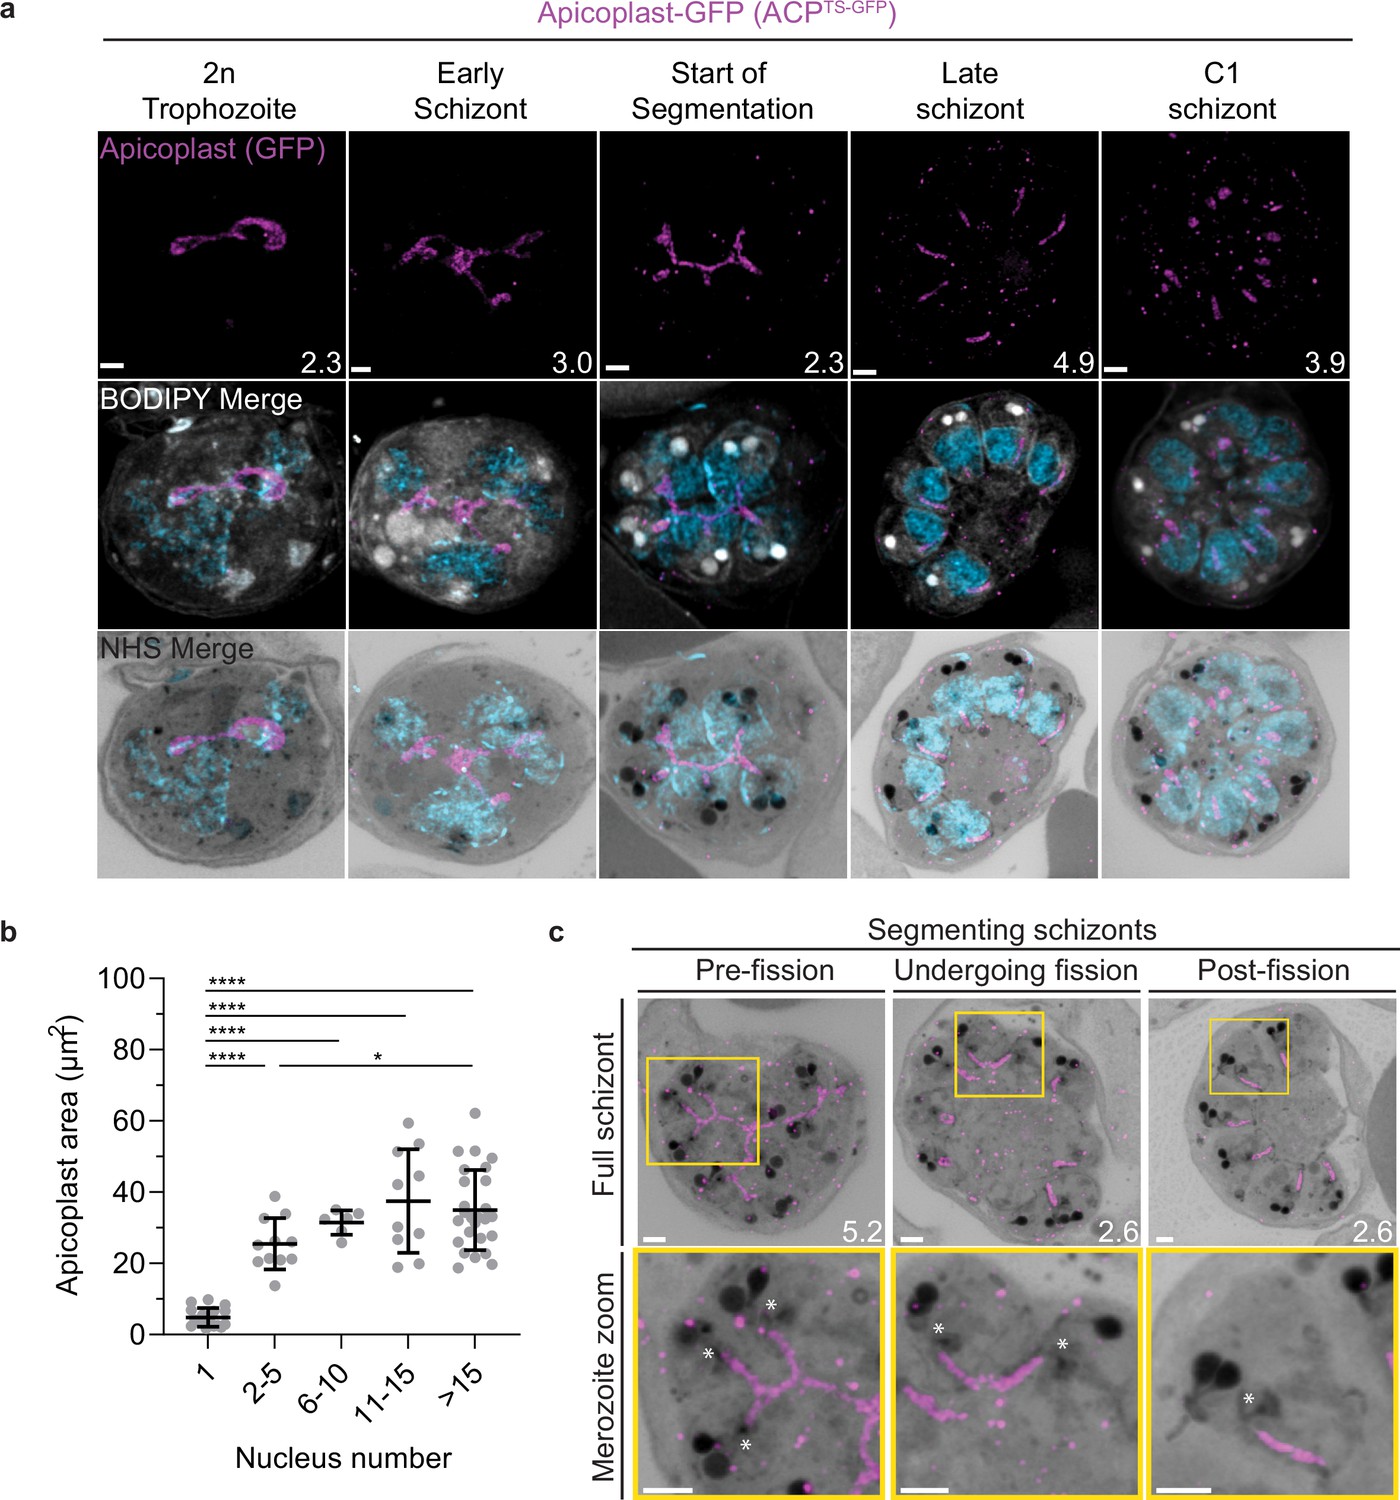
Growth and fission of the apicoplast.
Parasites expressing GFP-conjugated to the apicoplast transit signal of ACP (ACPTs-GFP) were prepared by ultrastructural expansion microscopy (U-ExM), stained with N-hydroxysuccinimide (NHS) ester (grayscale), BODIPY TRc (white), SYTOX (cyan), and anti-GFP (apicoplast) (magenta) antibodies and using Airyscan microscopy. (a) Images of whole parasites throughout asexual blood-stage development. Maximum-intensity projections of both a subsection of the cell (partial mito) and the full cell (full mito) are shown. (b) Area of the apicoplast was quantified for parasites of varying nucleus number. Seventy cells were counted across three biological replicates. ****p<0.001, *p<0.05 by one-way ANOVA, error bars = SD. (c) Representative images of the different stages of apicoplast fission. Images are maximum-intensity projections, number on image = Z-axis thickness of projection in µm. Asterisks represent centriolar plaques. Scale bars = 2 µm.
Figure 7 with 1 supplement
Cytostomes are observable by ultrastructural expansion microscopy (U-ExM) throughout the asexual blood stage of the lifecycle.
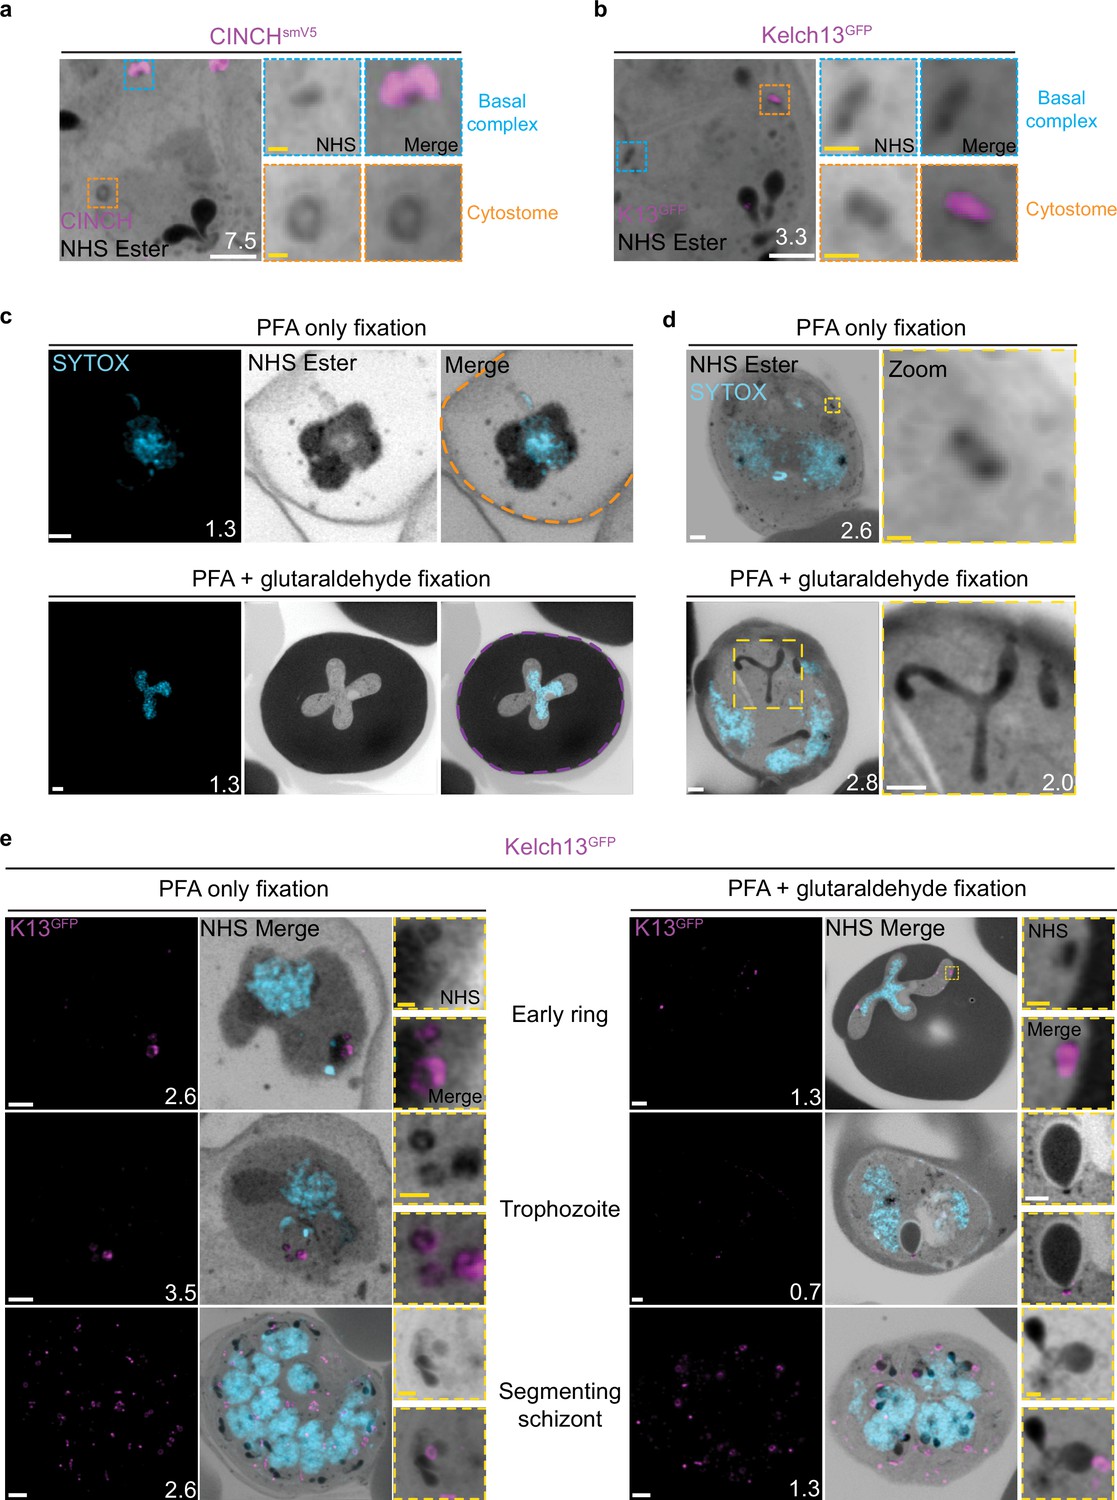
(a) Parasites expressing an smV5-tagged copy of the basal complex marker CINCH, prepared by U-ExM, and stained with anti-V5, show N-hydroxysuccinimide (NHS) ester-dense rings that are negative for this basal complex marker. (b) Parasites prepared by U-ExM where the cytostome marker Kelch13 was conjugated to GFP (K13-GFP) and stained with anti-GFP. Image shows co-localization between K13-GFP and the putative cytostome. NHS ester-dense ring. (c) Comparison between paraformaldehyde (PFA)-only and PFA-glutaraldehyde fixed U-ExM parasites, showing lysed (PFA only, orange) and intact (PFA-glutaraldehyde, magenta) red blood cell (RBC) membranes. (d) In PFA-only fixed parasites, only the cytostomal collar is preserved, while both the collar and bulb are preserved upon PFA-glutaraldehyde fixation. (e) K13-GFP parasites were either fixed in PFA only or PFA-glutaraldehyde, prepared by U-ExM, stained with NHS ester (grayscale), SYTOX (cyan), and anti-GFP (cytostome) (magenta) antibodies and imaged using Airyscan microscopy across the asexual blood stage. Zoomed regions show cytostomes. Images are maximum-intensity projections, number on image = Z-axis thickness of projection in µm. White scale bars = 2 µm, yellow scale bars = 500 nm.
Figure 7—figure supplement 1

Observed cytostome morphologies.
Parasites expressing a GFP-tagged copy of the cytostome marker Kelch13 (K13-GFP) were prepared for ultrastructural expansion microscopy (U-ExM), stained with N-hydroxysuccinimide (NHS) ester (grayscale) and anti-GFP (cytostome; magenta) antibodies and imaged using Airyscan microscopy. ‘Double’ cytostomes where two collars appeared to be stacked on top of each other, and cytostomes approximately twice the diameter of other cytostomes were occasionally observed. Additionally, in almost all segmenting schizonts, multiple cytostomes were observed that were not incorporated into the forming merozoites. Images are maximum-intensity projections, number on image = Z-depth in µm of projection. Black scale bar = 2 µm, yellow scale bars = 500 nm.
Figure 8 with 1 supplement
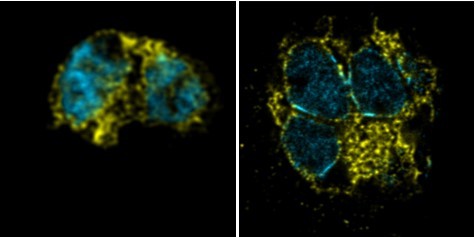
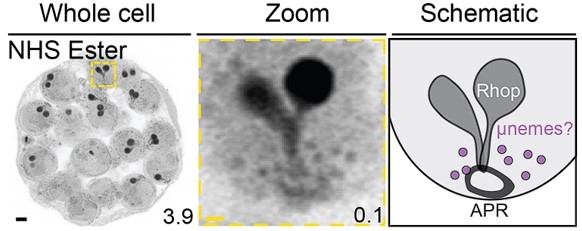
Rhoptries undergo biogenesis near the centriolar plaque and are segregated during nuclear division.
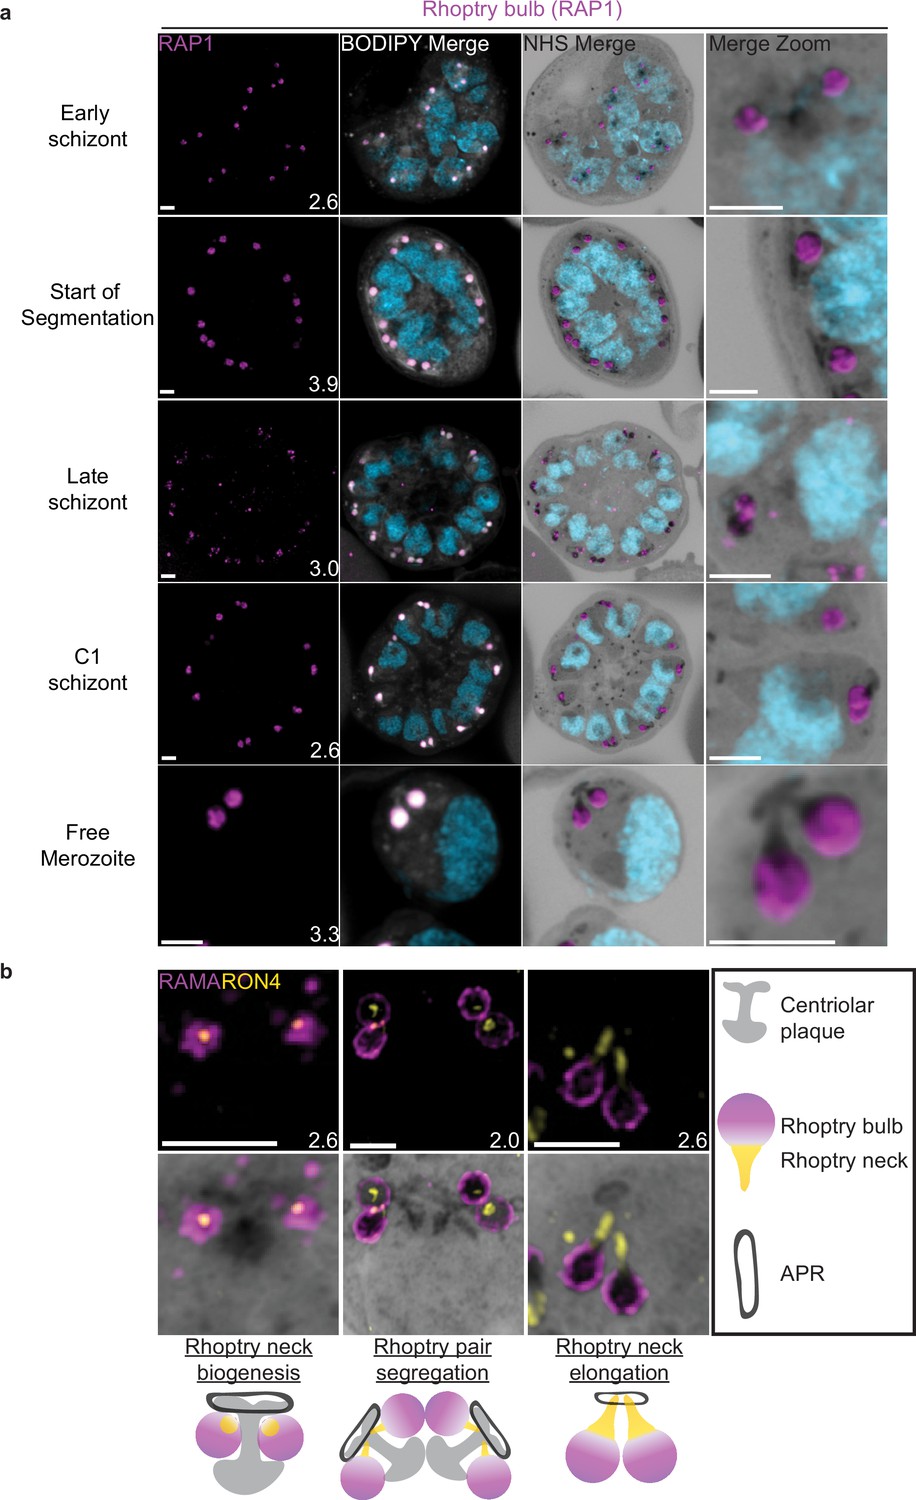
3D7 parasites were prepared by ultrastructural expansion microscopy (U-ExM), stained with N-hydroxysuccinimide (NHS) ester (grayscale), BODIPY TRc (white), SYTOX (cyan), and an anti-rhoptry antibodies and imaged using Airyscan microscopy. (a) Images of whole parasites throughout schizogony stained using an anti-RAP1 (rhoptry bulb; magenta) antibody. (b) Zoom into rhoptry pairs of 3D7 parasites that were prepared for U-ExM and stained with NHS ester (grayscale) along with antibodies against RAMA (rhoptry bulb; magenta) and RON4 (rhoptry neck; yellow) to assess rhoptry neck biogenesis. We observed that the rhoptry neck begins as a single focus inside each rhoptry. Rhoptries then get duplicated and segregated alongside the centriolar plaque. During the final mitosis, the rhoptry neck begins to elongate and the rhoptries separate from centriolar plaque. Images are maximum-intensity projections, number on image = Z-axis thickness of projection in µm. Scale bars = 2 µm.
Figure 8—figure supplement 1
Rhoptry biogenesis during schizogony.
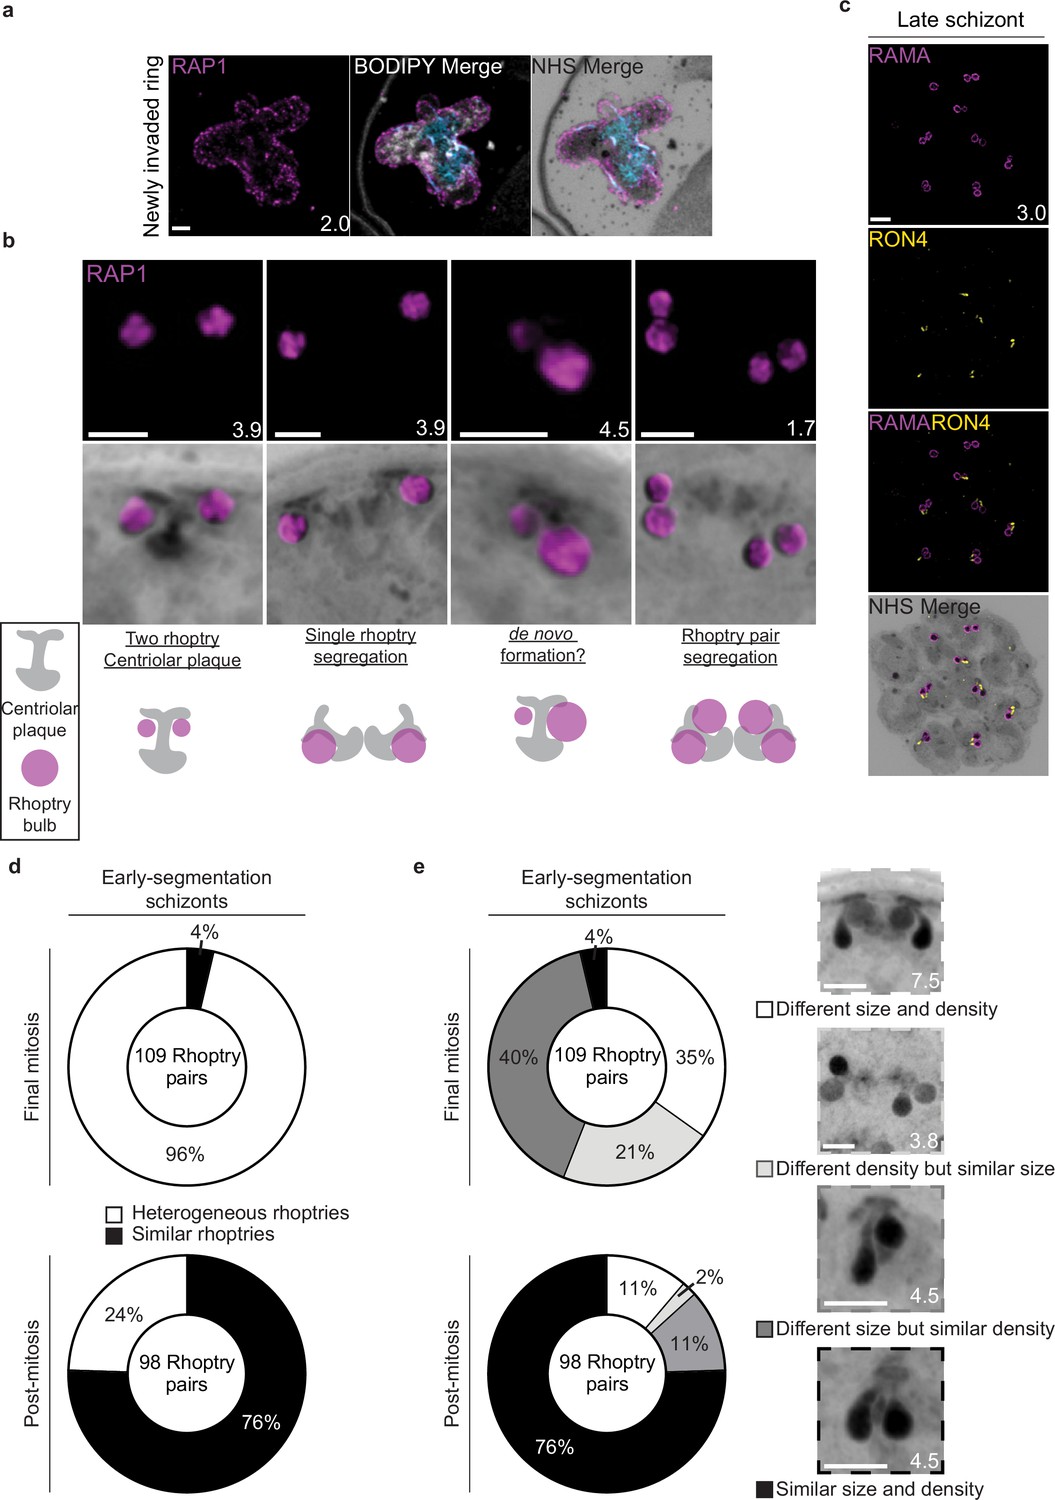
(a) The rhoptry marker RAP1 was observed coating the outside of a recently invaded ring-stage parasite. (b) Different combinations of rhoptries and plaques observed while imaging parasites undergoing schizogony. (c) Representative image of E64-arrested schizont stained with N-hydroxysuccinimide (NHS) ester (grayscale), the rhoptry bulb marker RAMA (magenta), and the rhoptry neck marker RON4 (yellow). (d) In early-segmentation schizonts that were either undergoing their final mitosis, or had completed their final mitosis (post-mitosis), the degree of heterogeneity between rhoptry pairs was quantified. Rhoptry pairs that showed visible differences in either size or NHS ester staining density were considered heterogeneous. (e) Breakdown of rhoptries using different classifications of heterogeneity. Images are maximum-intensity projections, number on image = Z-depth in µm of projection. Scale bars = 2 µm.
Figure 9
Micronemal proteins AMA1 and EBA175 reside in separate micronemes.
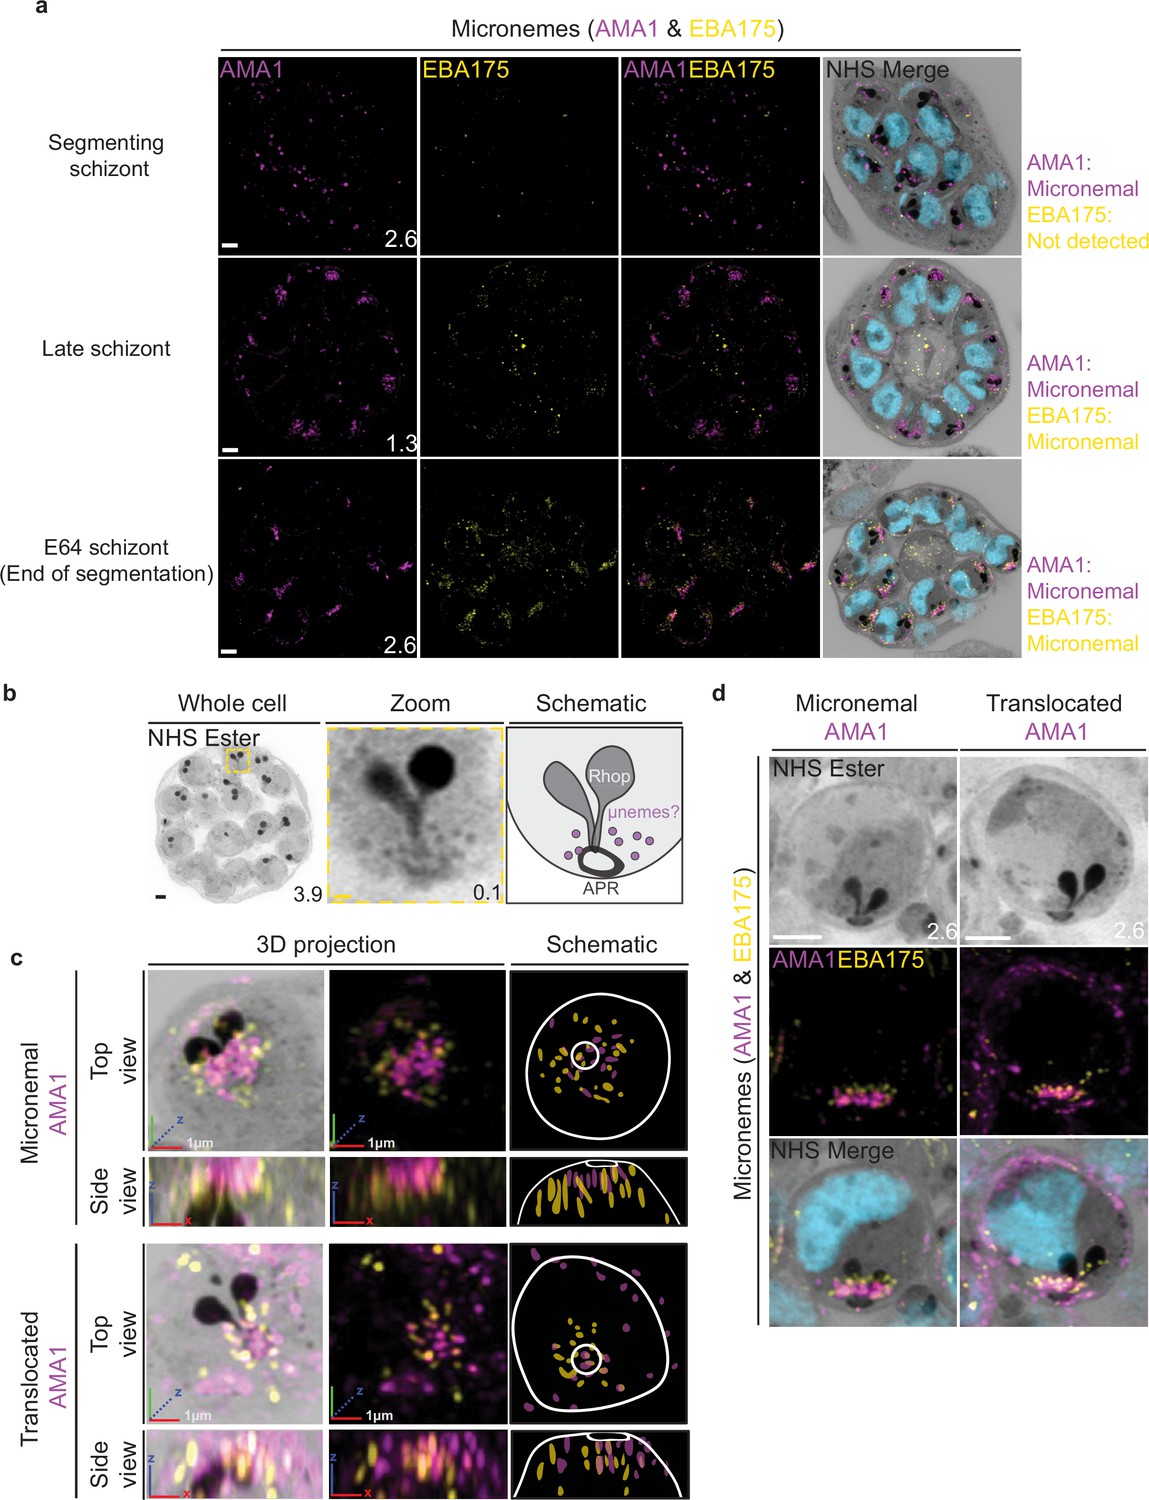
3D7 parasites were prepared by ultrastructural expansion microscopy (U-ExM), stained with N-hydroxysuccinimide (NHS) ester (grayscale), SYTOX (cyan), and antibodies against the micronemal markers AMA1 (magenta) and EBA-175 (yellow), and imaged using Airyscan microscopy in segmenting schizonts. (a) Images of whole parasites throughout schizogony. In schizonts still undergoing segmentation, AMA1 localized to the apical end while EBA175 was not detected. In late schizonts, both EBA175 and AMA1 were present in the micronemes. In E64-arrested schizonts, AMA1 was translocated to the merozoite surface while EBA175 remained micronemal. 3D rendering (b) and zooms (c) of merozoites with either micronemal or translocated AMA1. Foci of AMA1 and EBA175 to not routinely co-localize with each other. Images are maximum-intensity projections, number on image = Z-axis thickness of projection in µm. White scale bars = 2 µm, RGB scale bars for 3D rendering = 1 µm.
Figure 10

Summary of organelle organization and fission during schizogony.
(a) Apical organelle biogenesis: Biogenesis of the rhoptries, Golgi, basal complex, and apical polar rings occur at outer centriolar plaque (CP), between the nuclear envelope and parasite plasma membrane. Duplication and segregation of these organelles appears to be tied to CP duplication and segregation following nuclear division. Mid-segmentation merozoite: the rhoptry neck is distinguishable from the bulb, and AMA1-positive micronemes are present at the apical end of the forming merozoite. Each merozoite has inherited a cytostome. Subpellicular microtubules stretch the entire distance from the apical polar rings and the basal complex. The apicoplast has attached to the outer CP and begun fission. Mature merozoite: the parasite has completed segmentation, and each merozoite contains a full suite of organelles. The CP is no longer visible, and EBA175-positive micronemes are both visible and separate from AMA1-positive micronemes. (b) Model for fission of the mitochondrion and apicoplast. Prior to fission, both the apicoplast and mitochondrion branch throughout the parasite cytoplasm, before associating with the outer CP of each forming merozoite. For the apicoplast, this occurs during the final mitosis, but not until late in segmentation for the mitochondrion. Following outer CP association, the apicoplast and mitochondrion undergo a first fission event, which leaves an apicoplast and mitochondrion shared between forming merozoite pairs. Subsequently, both organelles undergo a second fission event, leaving each forming merozoite with a single apicoplast and mitochondrion.
Author response image 1
Author response image 2

Author response image 3
Author response image 4

Author response image 5
Author response image 6

Videos
Video 1
Slice-by-slice view of paraformaldehyde/glutaraldehyde fixed parasite.
Schizont stage parasite fixed with paraformaldehyde and glutaraldehyde to preserve erythrocyte membrane, prepared using ultrastructural expansion microscopy (U-ExM) and stained with N-hydroxysuccinimide (NHS) ester (protein density, grayscale) and SYTOX (DNA, cyan). This slice-by slice video through the parasite shows the elongated, protein-dense, cytostome invaginations in the parasite.
Tables
Table 1
Oligonucleotides for cloning and integration PCR.
| Oligo/gBlock name | Sequence (5′→3′) |
|---|---|
| JDD44 | TGGGGTGATGATAAAATGAAAG |
| JDD56 | ACACTTTATGCTTCCGGCTCGTATGTTGTG |
| JDD4889 | TATTGTCAAATCGTTACCTCTATG |
| JDD4890 | AAACCATAGAGGTAACGATTTGAC |
| JDD4891 | TAGgcggccgcGGTCCTACACCAATAAATATCA |
| JDD4892 | GTCTGATTCTTCCCATCaggccttccggaccgcggGGTCCCTTCATTGTAGACTTTTTATTATTGAAC |
| JDD4893 | GTCTACAATGAAGGGACCccgcggtccggaaggcctGATGGGAAGAATCAGACAAATGGT |
| JDD4894 | GATctcgagcAGcGGcAAtGAcTTcACgAATTCTCTTATTTCTTGTTTTTGCATTTCCT |
| SAB257 | CGGACCGAGAATTTATGTCCATTAACGTC |
| SAB471 | TGGTATTAATGGATGAAGACACACA |
| SAB472 | GTAATGGAATAGCTTTATATATGTACCTTCAT |
| SAB473 | TATGTGATCCATACATACCTGTTCAGAC |
Table 2
Summary of all antibodies and stains used in this study.
| Primary antibodies | Antibody species | Antibody source (Cat#) | Ab concentration | Reference | |||||
|---|---|---|---|---|---|---|---|---|---|
| Anti-alpha tubulin (Clone B-5-1-2) | Mouse (IgG1) | Thermo Fisher (32-2500) | 1:500 | ||||||
| Anti-centrin (Clone 20H5) | Mouse (IgG2a) | Sigma-Aldrich (04-1624) | 1:200 | ||||||
| Anti-Hscentrin1 | Rabbit | Thermo Fisher (PA5-29986) | 1:500 | ||||||
| Anti-polyE (IN105) | Rabbit | Adipogen (AG-25B-0030-C050) | 1:500 | ||||||
| Anti-ERD2 (MRA-1) | Rabbit | BEI Resources MR4 | 1:2000 | Elmendorf and Haldar, 1993 | |||||
| Anti-HA (3F10) | Rat | Roche (12158167001) | 1:50 | ||||||
| Anti-GFP | Rabbit | OriGene (TP401) | 1:2000 | ||||||
| Anti-RAP1 (2.29) | Mouse | European Malaria Reagent Repository | 1:500 | Hall et al., 1983 | |||||
| Anti-RON4 | Mouse | Gift from Alan Cowman | 1:100 | ||||||
| Anti-RAMA | Rabbit | Gift from Ross Coppel | 1:200 | Topolska et al., 2004 | |||||
| Anti-AMA1 | Rabbit | Gift from Carole Long | 1:500 | ||||||
| Anti-EBA175 (3D7) | Mouse | Gift from Alan Cowman | 1:500 | Sim et al., 2011 | |||||
| Anti-Aldolase | Rabbit | Abcam (ab207494) | 1:2000 | ||||||
| Anti-Histone H3 | Rabbit | Abcam (ab1791) | 1:1000 | ||||||
| Anti-BIP | Rabbit | Generated by Dvorin Lab | 1:2000 | ||||||
| Anti-GAP45 | Rabbit | Gift from Julian Rayner | 1:2000 | Jones et al., 2009 | |||||
| Anti-IMC1g | Rabbit | Generated by Dvorin Lab | 1:1000 | Cepeda Diaz et al., 2023 | |||||
| Anti-MSP1 (1E1) | Rabbit | Gift from Anthony Holder | 1:250 | Blackman et al., 1994 | |||||
| Anti-hemoglobin | Rabbit | Thermo Fisher (PA5-102943) | 1:1000 | ||||||
| Secondary antibodies | Antibody species | Antibody source | Antibody concentration | ||||||
| Anti-mouse IgG Alexa Fluor 488 | Goat | Thermo Fisher (A28175) | 1:500 | ||||||
| Anti-mouse IgG Alexa Fluor 555 | Goat | Thermo Fisher (A21428) | 1:500 | ||||||
| Anti-rabbit IgG Alexa Fluor 488 | Goat | Thermo Fisher (A11034) | 1:500 | ||||||
| Anti-rabbit IgG Alexa Fluor 555 | Goat | Thermo Fisher (A21428) | 1:500 | ||||||
| Anti-rat IgG Alexa Fluor 488 | Goat | Thermo Fisher (A11006) | 1:500 | ||||||
| Anti-mouse IgG2a Alexa Fluor 488 | Goat | Thermo Fisher (A21131) | 1:500 | ||||||
| Anti-mouse IgG1 Alexa Fluor 594 | Goat | Thermo Fisher (A21125) | 1:500 | ||||||
| Stains | Stain source (Cat#) | Stain concentration | |||||||
| NHS ester Alexa Fluor 405 | Thermo Fisher (A30000) | 1:250 (8 µM) in DMSO | |||||||
| BODIPY TR ceramide | Thermo Fisher (D7549) | 1:500 (2 µM) | |||||||
| SYTOX Deep Red | Thermo Fisher (S11381) | 1:1000 (1 µM) in DMSO | |||||||
Additional files
Download links
A two-part list of links to download the article, or parts of the article, in various formats.
Downloads (link to download the article as PDF)
Open citations (links to open the citations from this article in various online reference manager services)
Cite this article (links to download the citations from this article in formats compatible with various reference manager tools)
Atlas of Plasmodium falciparum intraerythrocytic development using expansion microscopy
eLife 12:RP88088.
https://doi.org/10.7554/eLife.88088.3


