JournalofHigherEducationManagement
Volume 37, Number 2 (2022)

1
AMERICAN ASSOCIATION OF UNIVERSITY ADMINISTRATORS
JOURNAL OF HIGHER EDUCATION MANAGEMENT
Volume 37, Number 2 (2022) ▪ ISSN 2640-7515
Dan L. King, Editor
Direct all correspondence to: Dan L. King, President and Chief Executive Officer, American Association of University Administrators. Postal Address: 1 Ralph Marsh Drive, Glen Mills, Pennsylvania 19342 – USA. Phone contact: 814-4606498. Email: dking@aaua.org.
Governance of the Journal of Higher Education Management is vested with the Publications Committee of the Board of Directors of the American Association of University Administrators. Committee membership includes:
Sr. Ann Heath, IHM, Chairperson
Kathleen Ciez-Volz Immaculata University Florida State College at Jacksonville
Jeffrey B. Leak
James M. Owston University of North Carolina at Charlotte Alderson Broaddus University
Neil Trotta
Julie E. Wollman Fisher College University of Pennsylvania
Opinions expressed in articles published in the Journal of Higher Education Management are those of the individual authors, and should not be taken as being representative of the opinions or positions of either the Journal, or the American Association of University Administrators, or of sponsors of this publication.
© Copyright 2022 by the American Association of University Administrators. Permission to reprint for academic/scholarly purposes is unrestricted provided the citation and permission statement appears on all duplicated copies. All other rights are reserved.
2
CONTENTS
Creating Sustainable University Structures for Offices of Diversity, Equity, and Inclusion (DEI) (Nwando Achebe, Carole Gibbs, Brian Johnson, Daniel Valez Ortiz & Chioma Nwaiche) 22
4
Hearing Diverse Perspectives: Authentic Signaling in Faculty Recruitment (Brent S. Opall, Kranti Dugar, Kevin Hansen, Nancy Hanson-Rasmussen & Bridget Kurtenbach) 39
Allyship Accountability in Academic Leadership: The Power and Responsibility in Privileged Roles (Jacob Bucher) 49
Looking for the Dream School: Understanding the Lived Experience of the College Choice Process (Ryan Ladner) 68 Do Academic Supervisors Know What Their Employees Want From Work? (John Griffith & Emily Faulconer) 80 Faculty Perceptions of the Essential Elements of Leadership Across Generations and Sex (Seth Kastle, Haley Moon & Jeni McRay) 97 Transferability to a Four-Year Institution: A Focus on an Urban Community College’s School of Business (Dan Hornick, George Hummer & Jeffrey L. Wilson) 103 A Mixed Methods Approach to Understanding College Students’ Experiences Throughout the COVID-19 Pandemic (Sarah Y. T. Hartzell, Megan E. LaMotte, Molly Hagen & Paul Devereux) 128
Resource Allocation Concerns: Matching Teaching and Research Needs with Financial Management at University Farms (Justin W. Rickard & Maria A. Boerngen) 136 The Nexus Between Corporate Governance and Leadership in the Post COVID-19 Era: The Context of Public Sector (Oluwassun Titi Adeosun) 148 Directions for Contributors 149 A.A.U.A. Board of Directors
3
, 37(2), 4-21 (ISSN 2640-7515).
All other rights reserved.
Creating Sustainable University Structures for Offices of Diversity, Equity, and Inclusion (DEI)
Nwando Achebe1 Carole Gibbs Brian Johnson Daniel Velez Ortiz Chioma Nwaiche Michigan State University
Introduction
Giving voice to diversity, equity and inclusion (DEI) perspectives can be a risky endeavor for DEI Champions in higher education, but also for DEI administrators who are part of institutional governance, but are not given the power, authority, and resources to do their work. These voices are often suppressed because DEI does not have a legitimized position within administration. It is with an understanding of this reality that we, as a DEI Administrator and Fellows, approach the work that we have done and continue to do. It is in this same spirit that we offer this assessment of our lived experience in engaging in DEI work at our university. We seek to advance DEI, while holding space for harm reduction and accountability.
The story of our work begins in 2020, when the dean of the College of Social Science (SSC) at Michigan State University (MSU) left the university for a higher position as Provost. Before she left, she announced the creation of a new Associate Dean for DEI. The position announced, however, was conceptualized as an afterthought and add on, instead of integrated into the overall administration structure. Moreover, the roles and responsibilities of the new position were limited —the focus was entirely on faculty. The new Associate Dean was not allowed to work with staff or students, nor did she have the authority or resources to do the work that needed to be done. An interim dean was soon named and was hesitant to extend the duties of the new Associate Dean to be inclusive of all DEI goals. After much dialogue with the Associate Dean, the interim dean encouraged her to put into writing her vision of the office for Associate Dean and how that position would align with other Associate Dean positions, and the Dean’s Office in general. The proposal would correct the existing problematic structure in the Dean’s Office. This was the impetus for the developing and writing of the SSC DEI office proposal; and the work was undertaken by members of the new Dean’s DEI Fellows in collaboration with the Associate Dean. In the absence of human and monetary resources, and broad support for the DEI mission of the College, the Dean’s DEI Fellows Pilot Program had been established. The Fellows, faculty from across the SSC and a graduate student, support the Associate Dean’s DEI efforts while building leadership skills in the DEI arena.
1 In light of our radical and transformative approach to DEI, we note that all authors contributed equally to this manuscript. To accommodate requirements for order of authorship, we alternate who serves as first author and list ourselves alphabetically thereafter.
4
Journal of Higher Education Management
© Copyright 2022 by the American Association of University Administrators. Permission to reprint for academic/scholarly purposes is unrestricted provided this statement appears on all duplicated copies.
The Dean’s DEI Fellows and Associate Dean undertook this charge with a singleness of purpose. Regardless of whether the interim dean or the new dean agreed to put into place the recommendations from the proposal, the Dean’s DEI Fellows and Associate Dean felt strongly about the proposal because how university DEI efforts are structured is important. The proposal aligned with best DEI practices and was evidence based. Thus, it represented a blueprint for DEI organizational structures at institutions of higher education. Furthermore, producing this DEI Office Structure document was important as it could not only codify DEI in SSC, but also serve to create DEI memory, sustainability, and continuity between administrations.
Codifying and creating sustainable DEI requires structure and process (Thomas, 2021; Harris, 2021; Ahmed, 2012). John Paul Kotter, thought leader in business, leadership, and organizational change, introduced an 8-stage organizational change framework in a 1995 article entitled “Leading Change: Why Transformation Efforts Fail.” This process-based framework has been applied to numerous organizations over the past 20 years, and updated in Kotter’s (2014) book to reflect lessons learned. The 2014 framework includes the following steps: (1) Create a sense of urgency; (2) Build a guiding coalition; (3) Form a strategic vision and initiatives; (4) Enlist a volunteer army; (5) Enable action by removing barriers; (6) Generate short-term wins; (7) Sustain acceleration; and (8) Institute change.
In the current paper, we situated our experiences and efforts to design and establish the proposed DEI office within Kotter’s (2014) organizational change framework. Such an office would institutionalize the college’s efforts to advance DEI. We selected Kotter’s framework because it contains practical steps for, and stages of, organizational change. Although Kotter situates his processes within the business sector, his organizational change framework has been used to study and assess change efforts (e.g., CDO implementation of diversity plans) in higher education (e.g., Stanley et al., 2018).2 We found it to be a useful model for shaping our change effort, but found that the stages articulated often overlap in the real world. In some instances, our DEI work connected to multiple steps. We found this to be true as we navigated the contours of creating our DEI structures document and doing DEI work in SSC.
Background
John Paul Kotter identifies “creat[ing] a sense of urgency as the first stage of organizational change. He visions it as an exigency to “help others see the need for change through a bold, aspirational opportunity statement that communicates the importance of acting immediately” (Kotterinc.com, n.d.). In the University context, this urgency for change can emerge from a broader context of racial unrest, heightened awareness of existing disparities in faculty representation, gaps in student success across racial lines, and sexual misconduct, spurring universities to articulate an “aspirational opportunity statement” to act. Indeed, it is against this backdrop that University efforts to institutionalize DEI have often occurred with a heightened sense of urgency to act. Urgency created out of obligation is performative, and rarely sustained.
2 Some have noted the challenges of using Kotter’s framework to change outcomes or processes controlled by faculty (e.g., curriculum), as faculty have much more autonomy than employees in a corporate setting (Kang, et al., 2020). However, faculty are not the focus of our change effort.
5
In fact, higher education has been under increased scrutiny for failure to address inequalities in representation and educational opportunities and outcomes. Regardless of high-school test scores, Black and Hispanic students are less likely to earn a college degree within 10 years in comparison to White and Asian students. Similarly, bachelors’ degree attainment is much lower among firstgeneration, low-income students, and far more likely among students from families in the highest income quartile. Blacks, Hispanics and Native Americans are also underrepresented in the conferral of all advanced degrees, particularly Masters’ and Doctoral degrees, in comparison to Caucasians (Carnevale, Fasules, Quinn and Peltier Campbell, 2019: 25). Critics charge that many universities fail to implement changes that can help reduce such gaps, such as inclusive pedagogy (Gooblar, 2020) and supporting students through graduation, not just recruitment (Holzer and Baum, 2017; Fischer, 2019). Representation in minoritized faculty is also dismal. As of 2019, Whites were overrepresented in tenure-track faculty positions in comparison to the U.S. population and the U.S. undergraduate student population, while African-American, Hispanic and Native American faculty remain underrepresented (Matias, Lewis, Jr. & Hope, 2021). Taken together, these disparities have galvanized an “immediacy of action” in academic leadership to inspire their communities to see the need to together find solutions to these issues.
MSU is no different in its challenges. The university has reported disparities in six-year graduation rates by race and between Pell and non-Pell students and first generation and non-first-generation students. In addition to being less likely to graduate in six years, Black and Latinx students are less likely to persist after their first semester and more likely to be placed on academic probation than White and Asian students (Largent, 2019). These gaps spurred urgency in MSU’s SSC to create a guiding coalition of stakeholders (faculty, staff, students, alumni) who collaboratively produced a college-wide strategic plan which articulated the need for change and improvement in persistence rates. The College committed to achieving a 5% improvement in six-year graduation rates and a 50% reduction in opportunity gaps for underrepresented minoritized undergraduates (SSC Office of the Dean, n.d.). This commitment represents “a volunteer army,” in the SSC context. The strategic planning committee, comprising a "coalition of effective people – born of its own ranks” was engaged “to guide . . . coordinate . . . and communicate [these change] activities” (Kotterinc.com, n.d.). As with other universities, African American, American Indian and Hispanic faculty are underrepresented at MSU among tenure-stream faculty (MSU Office of Inclusion and Intercultural Initiatives, 2020). This urgent need was addressed in the College’s Strategic plan, by its guiding coalition of stakeholders. One of the main foci of the DEI section of the plan was to grow the number of minoritized faculty and future faculty.
In addition to concerns regarding faculty representation and opportunity gaps, MSU experienced a major sexual abuse scandal and series of racist incidents on campus over several years, all creating additional pressure and urgency for the advancement of DEI. Faculty member Larry Nassar serially sexually abused more than 160 women and girls over several decades (Evans, Alesia & Kwiatkowski, 2018; Correa & Louttit, 2018). This resulted in the resignation, charging, and conviction of several high-ranking MSU administrators (Hauser & Zraick, 2018). In the wake of this negative publicity, the university president convened a “guiding coalition of stakeholders” to produce an institution wide “Relationship Violence and Sexual Misconduct Plan” to help foster a “safer campus community” (Office of the President, n.d.).
6
Unsurprisingly, the mishandling of sexual misconduct was not the university’s only failing. In 2019, several incidents targeted racialized groups on campus, including a toilet paper noose (Walker, 2019) and the destruction of property at the MSU Hillel Jewish Student Center (Tidwell, 2019). In addition, a faculty member studying how people respond to racist online speech sent a survey to students that failed to provide adequate warning regarding its offensive and profane content (Johnson, 2019). Continuing in 2020, staff at the gift shop at the Wharton Center for Performing Arts created a display of figures of African American leaders hanging from a rack resembling a tree (Das, 2020). Later the same year, students posted racist remarks in response to questions posed by Black students at a campus event designed for such questions, called “Ask President Stanley” (Guzman, 2020). Thus, one can argue that the congruence of these institutional failings and national events that made racial health inequities and police violence visible, spurred the need for urgent attention to DEI at MSU.
The newly appointed President Samuel Stanley and Provost Teresa Woodruff thus convened a guiding coalition to search for MSU’s first Vice President and Chief Diversity Officer. President Stanley also set up other coalitions—a DEI Steering Committee and Taskforce on Racial Equity—to guide, coordinate and communicate DEI change at MSU. The former inventoried existing efforts, gathered feedback, and reviewed best practices and metrics to measure progress (campus and unit specific) in order to devise a set of recommendations for advancement (Office of the President, n.d.). The latter created a series of recommendations to advance racial equity in the areas of policing, campus climate and safety, and faculty and staff diversity (Office of President b, n.d.).
Progress, however, has been uneven across campus. For example, as described further below, the College of Agriculture and Natural Resources is the only college on campus with an internally supported DEI office. In addition, there is a general disconnect between DEI initiatives around campus. Each unit and initiative were created independently, and only later were mechanisms generated to interface to some degree (MSU Office of Inclusion and Intercultural Initiatives, n.d.). Prior to a recent collaboration among three Associate Deans for DEI to create a Council of Diversity Deans (CODD), the DEI Deans were not connected across campus. The university’s Institutional Diversity, Excellence, and Action (IDEA) Coordinators—one in each college—arose in the 1990s as a network of individuals with DEI responsibility in MSU colleges and units. They meet as a committee regularly to not only support college and unit level goals related to DEI, but also to influence the direction of DEI in those units and serve as a resource for DEI work at MSU. The university’s Faculty Excellence Advocates (FEAs), who are selected by the Deans of each college to work as the drivers of DEI in all academic human resources in their colleges, meet as a consortium, separate from the IDEA coordinators or the Diversity Associate Deans. Michigan State University also has an Office of Intercultural Initiatives and Inclusion (OI3). Housed in OI3 is the Diversity Research Network (DRN), which provides a mechanism to help faculty of color and diversity scholars connect across campus to increase research collaboration and visibility. These entities, individual though they may be, in other ways can be viewed as guiding coalitions for DEI action across campus.
SSC context
With 291 tenure stream faculty, the SSC is the largest of MSU’S 17 degree-granting college (Office of Planning and Budget, 2021). The structure of the Dean’s Office includes a .51 full time-equivalent
7
(FTE) Associate Dean for Faculty Affairs who manages all matters relating to the hiring, reappointment, promotion, and tenure of SSC faculty. There is also a .75 FTE Associate Dean for Academic and Student Affairs who oversees all matters related to undergraduate students and studies. Then there is a .75 FTE Associate Dean for Graduate Studies and Research. She oversees the grant research concerns of faculty and manages graduate studies in the college. The Dean’s Office also has a Chief of Staff and Business Operations Manager, Communications and Marketing Director, and Senior Development Officer. Completing the leadership team of the Dean’s Office, prior to recent changes, is a .25 FTE Faculty Excellence Advocate (FEA) whose job it is to work “with faculty, department chairs, and the Dean’s Office, to create a climate of, and meet its goals for, quality, inclusiveness, alignment, objectivity, consistency, and transparency of all academic human resource policies and practices (particularly faculty recruitment, retention, and advancement) in the College of Social Science.” (MSU Worklife Office, 2020).
In 2017, the SSC welcomed a new Dean. One of this new leader’s first charges was to lead the College through the Strategic Planning process. The Strategic Planning process, through a guiding coalition, identified DEI as one of 4 areas of focus for the college (College of Social Science, 2017). In the absence of institutional structure or resources, the DEI portion of the plan called for the creation of an ad hoc committee, the Dean’s Advisory Board on Diversity and Inclusion or DABDI, composed of students, faculty, and staff from the SSC. This board, a guiding coalition and volunteer army, served as an advisory council on all diversity matters to the Dean, but at the same time supported the FEA, who was able to enlist this army of numerous senior DEI allies and thinkers in her quest to drive large-scale change in the DEI goals of the college (College of Social Science, Diversity Matters a, n.d.). As an advisory board, it was DABDI that first “rallied around a common opportunity” to recommended to the Dean that the position of Associate Dean for DEI be reintroduced, as the position was not filled after a previous Associate Dean for Graduate Studies and Diversity left the university. They applied pressure on the Dean by penning a memorandum to this effect. The Dean would eventually acquiesce and announce a university wide search for this Associate Dean position a few months before she left the university.
The DEI portion of the College strategic plan identified three areas of concentration: inclusive climate, faculty hiring and retention, and developing future faculty as focus areas. As part of the faculty hiring and retention, and developing future faculty foci areas, the Faculty Excellence Advocate led the creation of two new diversity hiring programs—the Dean’s Research Associate Program (College of Social Science, Diversity Matters b, n.d.) and the Dean’s Distinguished Senior Scholars Program (College of Social Science, Diversity Matters c, n.d.). Both programs promote an inclusive scholarly environment in which “outstanding scholars in the social sciences support the advancement of diversity, equity, and inclusion in the academy” (College of Social Science, Diversity Matters b, n.d.).
The fall 2020 hire of an Associate Dean for DEI represented the college’s first steps in attempting to institutionalize DEI in the college. The position, however, was not conceptualized with an understanding that DEI permeates everything that is done in a college or university. Instead, it was conceptualized as a stand-alone position, with little or no influence or far-reaching responsibility. Moreover, the position was constructed as a .51 FTE position, which included the responsibilities of the aforementioned FEA position, which was originally capped at .40 FTE. Thus, on paper the DEI
8
Associate Dean position only amounted to .11 FTE effort. Nonetheless, the new Associate Dean for DEI worked to form a strategic vision and initiatives, in order to “clarify how the future will be different from the past and how you can make that future a reality through initiatives linked directly to the vision” (Kotterinc.com, n.d.). In response to the requests from the interim Dean, the Associate Dean for DEI 1) developed a strategic vision for DEI in the SSC document that described the responsibilities and programs needed to institutionalize DEI across all domains (e.g., curriculum, recruitment, leadership) and 2) with the Dean’s DEI Fellows, created an office structure document to implement this work.
University-wide context
This conceptualization of the SSC Associate Dean for DEI position, however, does not necessarily reflect best practices in the DEI space, even at MSU. The same position in other colleges demonstrates this point. Although other colleges with more DEI infrastructure (e.g., Human Medicine and Veterinary Medicine) have supported such efforts by securing external grants, the College of Agriculture and Natural Resources (CANR) has a full-time Associate Dean for Diversity, Equity, and Inclusion who manages an Office of Diversity and has full-time staff. While the SSC is the largest and most diverse college in the university, it lags behind on legitimizing DEI as a structural component of its administration. This contrast presents an example of how lacking a DEI structure leaves an uneven distribution of resources in the hands and charity of individual leaders. In the same way, this charity approach undermines the efforts to even create a sense of urgency for change.
Challenges to Institutionalizing a DEI Structure
In addition to determining how to best implement and sustain a college-wide DEI structure, further logistical challenges also had to be considered. One initial logistical challenge included who would govern ideas around the proposed DEI structure. Ideally, faculty, staff, and students would not only benefit from our DEI efforts but would also play a pivotal role in determining the structure and reporting systems of our proposed plan. One way that we addressed this goal was through utilizing the expertise of DABDI. With their support, we produced the Dean’s requested "Office of the Associate Dean of DEI” document and presented this proposal to her. This strategy represents an application of the "Build a guiding coalition” stage in the organizational change framework.
A second logistical challenge to implementing a college-wide DEI structure consisted of securing resources for sustaining it. The “generate short-term wins” stage in the organizational framework implies the need to have measurable achievements. According to Kotter, this process “must be recognized, collected and communicated – early and often – to track progress and energize volunteers to persist” (Kotterinc.com, n.d.). We achieved this while addressing this second logistical challenge. First, the Dean’s DEI Fellows Pilot Program was created to provide some support for the Associate Dean. It attracts SSC faculty to build leadership skills around DEI and prepares the fellows to lead internally and externally. These DEI Fellows come from various social science departments in the college and meet on a weekly basis to provide input, representation, and assistance in the SSC. Through this process, we embodied the “Form a strategic vision and initiatives” stage in Kotter’s framework, and also further contributed to the “volunteer army.” While working within a
9
decentralized administrative structure, the Associate Dean also encouraged every unit in the College to have a DEI committee. As a result, all units in SSC now have a DEI committee, another "short term win.” In addition, some forward-looking departments actually created administrative positions of DEI Coordinators. These DEI Coordinators were administrators on the same footing as Associate Chairs and Directors, and the creation of these positions represented another “short term win” and further extended the reach of the SSC DEI volunteer army. Other short-term wins realized with the support of the DEI Fellows included a DEI small grants program created early in the tenure of the DEI Fellows Program, two DEI minors, the aforementioned ad hoc DABDI which was ratified into a permanent standing committee, now called Dean’s Advisory Committee on Diversity and Inclusion. Last, but not least, the Associate Dean’s “From the Desk of . . .” diversity monthly newsletters which celebrate the work of faculty, staff, students, and alumni in the DEI space, is another “short term win” that has been well received by the SSC community. As part of this monthly series, A DEI champion is featured every month in a university-wide publication that is also distributed to alumni.
To create a DEI model at the college-level, the Dean’s DEI Fellows conducted a nationwide review of DEI best practices, structure, and available resources in colleges of Social Science or its equivalent in universities across the nation. The review examined Diversity Champion Universities (as awarded by Insight into Diversity), Big Ten Universities, and other colleges at MSU.3 Their search was focused on three main points:
1. How are their DEI programs conceptualized and whom does it serve?
2. What is the basic structure of these DEI programs and what offices are they in?
3. What kinds of resources are available to these DEI programs?
For several weeks, each DEI Fellow was assigned a few universities to review. We started our search by looking at the university’s position and provisions for DEI at the university level, then college level, and finally individual departments and programs. Starting the review with 2019 Diversity Champion universities, the schools reviewed were Oklahoma State University, Rochester Institute of Technology, Texas A&M, Clemson, Florida State University, Medical University of South Carolina, University of Alabama-Birmingham, University of Cincinnati, University of Kentucky, University of North Florida, Virginia Commonwealth Universities, and University of Louisville. Although these universities are diversity champions, their investment on DEI differs, with some clearly lacking. For example, while some of the reviewed universities had clearly defined DEI offices and operating structures at the university and college levels; others barely had a DEI office, even at the university level.
Focusing on the Diversity Champion universities that are doing better with DEI, the fellows in their findings, identified some contributing factors that propel the success and sustenance of DEI in these universities. Some of the factors and recommendations include:
Having clearly defined DEI goals in the university, college, department, and programs’ strategic plans.
3 Applicants for the Higher Education Excellence in Diversity (HEED) Award are ranked and those in the top tier are considered Diversity Champions.
10
Colleges, departments, and programs that have inclusive teaching strategies, various ongoing initiatives targeted at faculty, staff and students offer better space for DEI to thrive.
Highlighting minoritized and first-generation students. Also, when possible, providing financial support to these underrepresented members of our community.
Creating a climate and inclusive committee. This committee should be dedicated to reviewing college, department, and program policies to make sure that they are inclusive.
Having a way of measuring progress or an annual accountability report.
Each department having a DEI committee, including a representative from the committee who serves on the college DEI committee.
Having initiatives that encouraged the recruitment of minoritized faculty, staff, and students, thus increasing the demographic diversity.
Advancing community engagement programs targeted at minoritized communities.
Establishing mentorship programs for minoritized and first-generation students
Offering course releases and other incentives to stimulate faculty interest in diversityrelated activities.
Since Michigan State University is a Big Ten University, the Dean’s DEI Fellows deemed it necessary to review MSU’s peers. The Big Ten universities reviewed were Purdue University, Ohio State University, University of Wisconsin, University of Illinois, Indiana University, The University of Iowa, University of Maryland, University of Michigan, Penn State University, University of Minnesota, and University of Nebraska-Lincoln. The Dean’s DEI Fellows identified some factors and best practices that ensure the sustenance of DEI in the reviewed universities. Examples of such factors include:
Strategic plans that lay out key areas and initiatives for promoting diversity and inclusion.
Promotion of diversity and inclusion through recruitment, mentoring, retention of minoritized faculty, staff, and students.
Inclusive leadership training courses for faculty, staff, and students.
Creation of culturally relevant mentoring programs and encouraging partnerships with local cultural resource centers.
Creation of centers for research on DEI that could be separate or within colleges that support research on DEI.
An office dedicated to DEI initiatives and implementation.
DEI advisory committee with faculty, staff, and student representation that advises the Dean.
Encourage inclusive pedagogy and research.
Encourage equity and accountability, recognize invisible labor, and establish a better reporting procedure to capture labor put into DEI.
Institutionalize DEI within College Units.
Diversifying the faculty, staff and students through minority hires and scholarships for minoritized students.
Comparing Michigan State University with its closest neighbor and peer, University of Michigan, it is very clear that MSU needs to invest a lot more resources in the promotion of DEI. Looking at University of Michigan’s Literature, Science, and the Arts (LSA), a close equivalent of College of Social Science here at MSU, it is obvious that U of M walks the talk. The college has invested both
11
human and financial resources in the promotion of DEI. The college has a functional office for DEI with resources committed to ensure efficacy and results. The office has the Associate Dean for DEI and Professional Development and a diversity manager. The manager supports the Associate Dean in the design and implementation of their strategic DEI goals and other DEI related issues. The LSA DEI office created in 2016 is charged with delivering DEI-related professional development training for faculty, staff and students in the college. They also:
“Provide consultations to students, staff, and faculty on DEI matters,
promote other DEI activities on and off campus that are open to students, staff, and faculty.
support diversity efforts in hiring and retention processes,
create and manage recruitment sources in efforts to diversify candidate pools for staff and faculty positions, and;
develop metrics to measure and evaluate the effectiveness of DEI initiatives.” (UM LSA DEI Office, n.d.).
Comparatively, the SSC at MSU can only boast of an active Associate Dean for DEI. This position comes with no “office” nor staff dedicated to DEI matters. U of M’s establishment of an office offers more guarantee for DEI sustainability as activities are not dependent on individuals. At MSU, the programs introduced by the Dean or Associate Dean for DEI may end with the tenure of that Dean or Associate Dean. Long term goals will be difficult to achieve, as there are no guarantees for sustainability. With this in mind, the Dean’s DEI fellows embarked on crafting an office structure for the College of Social Sciences. Comparing different programs across Big Ten universities was a pivotal first step to the foundational stage “create a sense of urgency” within the organizational change framework.
Revisioning the SSC Office of Associate Dean for Diversity, Equity, and Inclusion
Drawing inspiration from this exploratory and information-gathering process, with the knowledge that “to enable action, change requires removing barriers,” the Dean’s DEI Fellows began work on reimaging and revisioning the existing structure of the College of Social Science’s Dean’s Office so that diversity, equity, inclusion would be present in every part of the Dean’s Office administration. The DEI Fellows enabled action by removing the barrier existing in the form of college leadership. They rejected College leadership’s nonacceptance by forging ahead to publish DEI office structure, crafted based on good data and best practices as a guide for SSC and other institutions. What follows below is the actual “best practices/restructuring” document that the Dean’s DEI Fellows introduced and shared with the Interim Dean of the College of Social Science.
The Associate Dean for DEI Office—Collaborating to Promote an Inclusive SSC
Diversity, Equity, and Inclusion is not a standalone entity, but rather should permeate all that we do in the College of Social Science (SSC)—from recruitment and retention to campus climate, curriculum, and instruction, to research, student/faculty/staff success, to leadership development, advancement/development, and external relations (NADOHE, 2020).4 The work crosses multiple
4 See National Association of Diversity Officers in Higher Education (NADHOE), “Standards of Professional Practices for CDOs, (NADHOE, 2020), standard two, “diversity officers work to ensure that elements of equity, diversity, and
12
domains and requires capacity to ensure a sustainable infrastructure. Therefore, existing administrative structures in the Dean’s Office will have to be re-visioned and new DEI-focus positions created. When there is a mismatch between articulated commitment to DEI and the resources allocated to diversity initiatives, efforts, and offices, there is a potential that DEI work will become a source of tension, conflict, and failure (NADOHE, 2020).
The Associate Dean for DEI (henceforth AD) should necessarily be involved in every theater of operation in the College of Social Science’s Dean’s Office, infusing diversity principles throughout the College with the aim of transforming the culture of the College into a more diverse and inclusive space. Towards these ends, the AD should be bound together with all the other Associate Deans, in a network of inter-dependent relationships of collaboration with shared interests and goals.
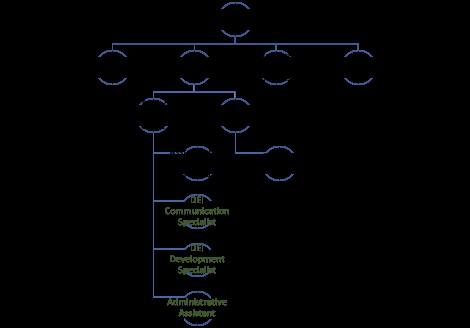
The SSC Office for Diversity, Equity, and Inclusive Affairs (DEIA) should be reintroduced to support and enhance the College’s commitment to creating an inclusive community.5 The Office will be overseen by the AD, assisted by a 1 FTE Assistant Dean for DEI/Associate Director of the Office. The AD will be responsible for the design, structure, and daily operation of the office. The primary mission of the office will be to provide quality support through programs and initiatives that foster a community climate that acknowledges and appreciates a multiplicity of diversities. The Office will be a multi-dimensional site for DEI work with multiple operations and arms collaborating to create a more equitable College for all. Above is a diorama that demonstrates the interconnectivity of DEI work in the Dean’s Office, and below is a narrative that lays out this interconnectivity in more detail.
General Responsibilities
o The AD and Director of DEIA Office oversees, facilitates, and advances all DEI-related interests in the College of Social Science.
o They network and liaise with other administrative units to promote, support, and advance all minoritized members of the SSC community.
o The AD and Director of DEIA liaises with community and academic partners to propel DEIrelated interests.
o The AD and Director of DEIA is an ex-officio member of Dean’s Advisory Committee on Diversity and Inclusion (DACDI) which provides feedback and guidance to the Associate Dean and Dean in addressing diversity-related concerns.
o They are members of CODD (Council of Diversity Deans). The present AD for DEI is founder and co-chair of CODD.
Organizational Chart – Dean’s Office6
inclusion are embedded as imperatives in the institutional mission, vision, and strategic plan,” 8.
5 MSU DEI Leaders—the Colleges of Engineering, Human Medicine, Agriculture and Natural Resources (CANR), Law, Veterinary Medicine, Madison, Communication Arts and Sciences, Natural Sciences (NatSci)—all have DEI offices to support the breadth and depth of the work. SSC established its office in 2005, only to get rid of it after the sitting Associate Dean for DEI left the university.
6 The justification for the above structure, roles, and responsibilities is inspired by the foremost professional organization for Diversity Officers NADHOE’s “Standards of Professional Practice for Diversity Officers” as well as justification from other Colleges at MSU.
13
Faculty Affairs
o The AD and Director of DEIA Office leads efforts to support and advance minoritized faculty members, in collaboration with the AD for Faculty. The AD’s efforts are concentrated on, but not limited to faculty hiring. The complete range of faculty affairs include:
o The AD and Director of DEIA Office leads efforts to support and advance minoritized faculty members, in collaboration with the AD for Faculty. The AD’s efforts are concentrated on, but not limited to:
o Works with search committees and the Dean’s Office in hiring faculty from job advertisements, to search committee trainings, to hire letters.
o Leads the Dean’s Research Associate Program
o Leads the Dean’s Distinguished Senior Scholars Program
o Leads the Dean’s DEI Fellows Program
o Retention, Promotion, and Tenure (RPT)

o Develops RPT Implicit Bias Training for College RPT Committee
o Ex officio member of College RPT Committee
Undergraduate and Graduate Student Affairs
o The AD and Director of DEIA Office leads efforts to infuse DEI into general undergraduate curriculum, including creating two SSC DEI Minors—domestic and international.
o They lead efforts to support and advance minoritized/first-generation undergraduate students, in collaboration with AD Academic and Student Affairs.
14
o The AD will manage all programming designed for minoritized/first generation students including Opportunity Gaps Programming. (Will collaborate with the AD of Academic and Student Affairs to conceptualize a first-generation program for undergraduates, with a middle school pathway program for marginalized students from the Detroit, Flint, Grand Rapids, and Lansing areas.
o The AD and Director of DEIA Office leads efforts to support and advance minoritized graduate students, in collaboration with AD Graduate Studies. (Manages AGEP—the Alliances for Graduate Education and the Professoriate, and Graduate School Pipeline Programs for minoritized students.)
Staff Affairs
o The AD and Director of DEIA Office leads efforts to support and advance minoritized staff members, in collaboration with all Associate Deans and the Dean’s office.
Communications
o The AD and Director of DEIA will collaborate with the Director of Communications and the DEI Communications Specialist in facilitating and mediating all DEI branding and communications on behalf of the Associate Dean/Dean’s office.
o The DEI Communications Specialist will manage DEI communications workload (newsletter, website, social media, journalistic responsibilities in general).
Development
o The AD and Director of DEIA Office will collaborate with the Senior Director of Development and the DEI Development Specialist in advancing and promoting College efforts in DEI development.
o The DEI Development Specialist will manage DEI development, including, working with the AD to attract donors, gifts, etc. from DEI-interested parties, and establish an alumni DACDI giving board.
Assistant
Dean for DEI /Associate Director of DEIA
Office
o The Assistant Dean for DEI /Associate Director of DEIA Office provides student-centered support for minoritized SSC students and facilitates a DEI-affirmative environment among the undergraduate and graduate student populations
o They report to the Associate Dean for DEI, and,
o Work with the Assistant Director DEI Academic Affairs
o Work more broadly with Associate Provost for Undergraduate Education (APUE). Is a liaison to APUE
o With oversight of AD, leads first-generation program.
15
Resources Needed (structural)
1. Percentage time of AD increased to .75 FTE.7
2. Creation of a Diversity, Equity, and Inclusive Affairs (DEIA) Office, with an Assistant Director/Assistant Dean of DEI (staff) at 1 FTE.
3. Space for the DEI Office (safe space for minoritized students, staff, and faculty)
4. 1 FTE administrative assistant
5. .50 FTE grad student assistant
6. 1 FTE Assistant Director of DEI undergraduate and graduate Affairs
7. .50 FTE DEI Communications Specialist
8. .50 FTE DEI Development Specialist
Resources Needed (financial)
1. Budget for DEI Faculty Hiring Initiatives
2. Extend Dean’s Research Associate Program for 5 years
3. Hire three Research Associates each year
4. Five years of unrestricted funds for programming in support for the Dean’s Research Associate Development Institute (DRADI)
5. Extend Dean’s Distinguished Senior Scholars Program for 5 years
6. Hire two Distinguished Senior Scholars each year
7. Unrestricted budget for SSC DEI initiatives $100,000
Theory to Practice: Implementing a Sustainable University DEI Structure
As we reflected upon the steps and processes involved in advocating for a sustainable DEI structure for the SSC, we explored various frameworks that would support our efforts. It was important to utilize a framework to provide empirical evidence in support of the efficacy of a DEI structure. In doing so, we utilized Kotter’s (2012) 8-Step Process for Leading Change, and determined how his processes aligned with our vision for a sustainable DEI structure within our College. An explanation and application of the stages are below.
Step 1: Creating a Sense of Urgency Around a Single Big Opportunity
According to the model, when seeking to institute change in a current structure, “heightening an organization’s awareness . . . and ridding an organization of complacency” (Kotter, 2012, p. 51) is critical. We decided to address the need to implement a sustainable DEI structure due to the very urgency of the moment. Racial inequities and tensions, not limited to the challenges mentioned above solidify the need for a sustainable DEI, structure. The recent racial tensions which forced corporations, workplaces, and society in general to evaluate injustices compelled higher educational institutions to express their solidarity with a rapid sense of urgency that may not have
7 Justification for the request for a higher FTE is that the DEI Associate Deans in CANR/NatSci are hired at 1 FTE, and the DEI Associate Dean in Education, a much smaller college than the College of Social Science is hired at .75 FTE.
16
otherwise occurred. Despite the intent or rationale for institutions moving swiftly, we had to utilize this rationale in order to further our DEI goals. Now that we have the platform, we must take advantage of the opportunity and make clear that implementing a sustainable structure will provide sustenance and support for faculty, staff, and students within our college not just during a “DEI P.R. Crisis.” In short, we are seeking to provide a DEI structure that permeates through every phase, person, and process of our SSC.
Step 2: Building and Maintaining a Guiding Coalition
A Guiding Coalition (GC) comprised of individuals of various levels throughout an organization is crucial to institutional success (Kotter, 2012). Further, each member of the GC should have equal say and input. In our case, the Associate Dean for Diversity purposefully sought to create opportunities for faculty and staff of various levels to contribute to our DEI goals. She created the Dean’s DEI Fellowship Program for that very reason.
Step 3: Forming a Strategic Vision and Initiatives
A strategic vision serves as the North star for the importance of change initiatives. Further, the vision demonstrates the importance of opportunities (Kotter, 2012). In our case, all of the aforementioned steps and processes that we have undertaken have supported our DEI vision. We began the process of undertaking a strategic vision based upon discontent with status quo and piecemeal DEI initiatives. In addition, nationwide evaluations of best DEI practices among other universities have provided insight on DEI effectiveness, as well as DEI necessities that are not being addressed.
Step 4: Enlisting a Volunteer Army
“The Volunteer Army is not a bunch of staff carrying out orders . . . its members are change leaders who bring energy, commitment, and enthusiasm” (Kotter, 2012, p. 56). As we began this initiative, we were not naïve to the fact that implementing institutional change is difficult, challenging, and at times frustrating. As such, it takes individuals who are willing to serve as change advocates - “even if 10% of an organization” (Kotter, 2012, p. 56). Within the SSC, DEI advocates seeking to sustain a permanent DEI structure are small, but mighty. DABDI members provide input, counsel, and suggestions for instituting structural change. DEI Fellows are committed to creating a blueprint for action. The army is small, but the mission is mighty.
Step 5: Enabling Action by Removing Barriers
In order to accelerate movement, those seeking change must ensure that barriers are being removed. In this case, we must ensure that the DEI needle is constantly advancing within the SSC to move beyond DEI statements. In our case, despite lack of resources to advance a sustainable DEI office, we sought to balance short-term wins discussed below in Step 6 with longer term strategies that would support implementation of our envisioned SSC structure.
17
Step 6: Generating Short-term Wins
Short-term wins “should be obvious, unambiguous, and clearly related to the vision” Kotter, 2012, p. 56). Such was the case with several efforts undertaken by the Associate Dean of Diversity for the SSC and the DEI Fellows. We implemented small grants for faculty and students within the SSC. A DEI vision was conceptualized and submitted to the Dean. We have created and proposed two DEI minors and begun with the help of an outside facilitator to develop a DEI strategic plan. Finally, we have produced three manuscripts that outline the DEI processes, challenges, and visions for academic outlets.
Step 7: Sustaining Acceleration
Recognizing that “urgency is central because when an organization takes its foot off the gas, cultural and political resistance arise,” (Kotter, 2012, p. 56) we sustained acceleration as a result of the external pressure generated by the Black Lives Matter movement, the Nassar scandal, the COVID pandemic, as well as the visibility of injustice across the country. All of these culminated into the need for Michigan State University to develop a university wide DEI strategic plan. This plan calls for further work at the college level. We have kept the urgency of developing a sustainable DEI Office at the forefront of our goals and objectives. DEI advocacy cannot be placed on the sidelines, and this served as a motivator to ensure that we continue to hold SSC leadership accountable: advocacy cannot wait.
Step 8: Instituting Change
As mentioned throughout, our goal is to develop a sustainable DEI structure that permeates throughout our SSC. DEI work can be isolating, and difficult to see advancement. With the implementation of a DEI permanent structure, we will institutionalize support that will be visible throughout SSC. Whether or not true transformative DEI change occurs is yet to be seen. We are however hopeful that there will be some change due to the implementation of the university-wide DEI strategic plan, which further calls for college level DEI strategic planning. It is our hope that after these are realized that there will be dialogue around, and implementation of, a structure, roles, and responsibilities plan.
Recommendations
The DEI Office sustainable structure presented here is meant to be a blueprint for advocating and advancing DEI systemic transformation in colleges and universities. As we discovered while conducting the review of structures at other universities, far too often DEI programs are not structurally tied to the organization. This leaves DEI in a vulnerable position where it is at the whim or mercy of the leadership at any given time. Although one could assume that Deans and Chairs have made DEI a priority, the reality, as we found, is that such assumption is not a guarantee. Even when it is expressed in words and slogans, it is not supported by sharing equal power and significant resources.
The eighth stage of Kotter’s organizational change framework affirms that to institute change, it is
18
important to “articulate the connections between the new behaviors and organizational success, making sure they continue until they become strong enough to replace old habits.” In our view developing a structure where DEI is ingrained and connected to the fabric of every major administrative stakeholder, brings more accountability and voice to the priorities necessary for transformative DEI. Beyond inclusion, the proposed blueprint demands that resources be allocated to recognize, reward, and support DEI as a major priority in colleges and universities. This blueprint also establishes legitimacy in DEI leadership through a structural and sustainable approach. Furthermore, this blueprint represents a sharp departure from the idea that DEI is only invoked but not invested. Given our changing and diversifying world and context within higher education, this blueprint also reinforces that leadership and accountability at all levels must also be invested in the transformative process. Finally, such investment advances beyond an institution’s forced commitment to demonstrate performative support of DEI during a time of societal unrest, moving toward transformative commitment and support which is at the heart and connective tissue of operations and decision-making across campus.
References
Ahmed, S. (2012). On being included: Racism and diversity in institutional life. Duke University Press: Durham and London.
Cahalan, M., Perna, L. W., Yamashita, M., Wright-Kim, J. & Jiang, N. (2019). 2019 Indicators of Higher Education Equity in the United States: Historical Trend Report. Washington, DC: The Pell Institute for the Study of Opportunity in Higher Education, Council for Opportunity in Education (COE), and Alliance for Higher Education and Democracy of the University of Pennsylvania (PennAHEAD).
Carnevale, A.P., Fasules, M.L., Quinn, M.C., and Peltier Campbell, K. (2019). Born to Win, Schooled to Lose: Why Equally Talented Students Don’t Get Equal Chances to Be All They Can Be. Georgetown University Center on Education and the Workforce. McCourt School of Public Policy. Downloaded on April 21, 2021 from College of Social Science (2017). Strategic Plan: Fall 2017-Fall 2022. https://socialscience.msu.edu/_assets/pdfs/StratPlan-web-lo.pdf
College of Social Science (SSC) Diversity Matters a (n.d.) Dean’s Diversity Board on Diversity and Inclusion. Retrieved from https://socialscience.msu.edu/diversity/DABDI1/index.html
College of Social Science (SSC) Diversity Matters b (n.d.) Dean’s Research Associate Postdoc Program. Retrieved from https://socialscience.msu.edu/diversity/DABDI1/index.html
College of Social Science (SSC) Diversity Matters c (n.d.) Dean’s Distinguished Scholars Program. Retrieved from https://socialscience.msu.edu/diversity/distinguished-senior-scholars.html
College of Social Science (SSC) Office of the Dean (n.d.). Strategic Plan: Fall 2017-Fall 2022. Retrieved from (https://socialscience.msu.edu/about/strat-plan.html).
Correa, C. & Louttit, M. (2018). More than 160 women say Larry Nassar sexually abused them. Here are his accusers in their own words. New York Times. Downloaded on March 19, 2021 from https://www.nytimes.com/interactive/2018/01/24/sports/larry-nassar-victims.html
19
Das, R. (2020). MSU President responds to display at Wharton Center that sparked outrage. WLNS.com. https://www.wlns.com/news/local-news/msu-president-responds-to-display-atwharton-center-that-sparked-outrage/ Evans, T., Alesia, M. & Kwiatkowski, M. (2018, January 24). Former USA Gymnastics doctor accused of abuse. The Indianapolis Star. https://www.indystar.com/story/news/2016/09/12/former-usagymnastics-doctor-accused-abuse/89995734/
Fischer, K. (2019). The Barriers to Mobility: Why Higher Ed’s Promise Remains Unfulfilled. The Chronicle of Higher Education. Downloaded on April 21, 2021 from https://www.chronicle.com/article/why-higher-ed-rsquo-s-promise-remains-unfulfilled/ Guzman, W. (2020). Racist comments in 'Ask President Stanley' online question platform. State News. https://statenews.com/article/2020/02/racist-comments-in-ask-stanley-online-questionplatform Harris, T.M. (2021). Dismantling the trifecta of diversity, equity, and inclusion: The illusion of heterogeneity. In H. Oliha-Donaldson (Ed.), Confronting equity and inclusion incidents on campus: Lessons learned and emerging practices (pp. 34-57). Routledge.
Hauser, C. & Zraick, K. (2018). Larry Nassar Sexual Abuse Scandal: Dozens of Officials Have Been Ousted or Charged. The New York Times. https://www.nytimes.com/2018/10/22/sports/larrynassar-case-scandal.html
Holzer, H., and Baum, S. 2017. “Making College Work: Pathways to Success for Disadvantaged Students.” Washington DC: Brookings Institution Press.
Institutional Research, Office of Planning & Budgets. (2021). MSU Data Digest - Faculty and Staff. [Tableau Dashboard]. https://opb.msu.edu/functions/institution/datadigest/. Last updated: 2021-09-09.
Kang, S.P., Chen, Y., Svihla, V., Gallup, A., Ferris, K. & Datye, A.K. (2020). Guiding change in higher education: an emergent, iterative application of Kotter’s change model. Studies in Higher Education, DOI: 10.1080/03075079.2020.1741540
Kotter, J. P. (2012). Accelerate! How the most innovative companies capitalize on today’s rapid-fire strategic challenges - and still make their numbers. Harvard Business Review, 90(11). Kotterinc.com (n.d.). The 8-Step Process for Leading Change. (https://www.kotterinc.com/8-stepsprocess-for-leading-change/)
Largent, M. (2019). Riding Tides and Closing Gaps. Report from the Associate Provost for Undergraduate Education at Michigan State University. Downloaded on November 4, 2021, from https://undergrad.msu.edu/news/view/id/215
Matias, J.N., Lewis, Jr., N. & Hope, E. (2021). Universities say they want more diverse faculties. So why is academia still so white? https://fivethirtyeight.com/features/universities-say-they-wantmore-diverse-faculties-so-why-is-academia-still-so-white/ MSU Worklife Office (2020). IDEA Coordinators. https://worklife.msu.edu/node/831
Michigan State University Office for Inclusion and Intercultural Initiatives. (2020). Diversity at MSU, 2019-2020 Annual Student and Workforce Data Report https://inclusion.msu.edu/about/datainformation/2019-20%20Diversity%20at%20MSU%20Student%20and%20Workforce%20Data %20Report.pdf
Office of the President (n. d). Committee Charge and Process. https://president.msu.edu/initiatives/dei-plan/dei-committee-charge.html [accessed March 28. 2021)
20
Office of the President (n.d.). Relationship Violence and Sexual Misconduct Plan. https://president.msu.edu/initiatives/rvsm-plan/index.html
Pendakur, V. (2016). Closing the Opportunity Gap: Identity-Conscious Strategies for Retention and Student Success. Stylus Publishing: Sterling, VA.
Stanley, C.A., Watson, K.L., Reyes, J.M., & Varela, K.S. (2019). Organizational change and the Chief Diversity Officer: A case study of institutionalizing a diversity plan. Journal of Diversity in Higher Education, 12(3): 255-265.
Thomas, J.M. (2020). Diversity regimes: Why talk is not enough to fix racial inequality at universities Rutgers University Press: New Brunsick, New Jersey.
Tidwell, S. (2019). ELPD investigating destruction of MSU Hillel's Sukkah over the weekend. The State News. Downloaded on March 19, 2021 from https://statenews.com/article/2019/10/msuhillel-sukkah-vandalism-over-the-weekend
UM LSA DEI Office (n.d.). LSA DEI Office. https://lsa.umich.edu/lsa/faculty-staff/lsa-dei-office.html
Walker, C. (2019). Students outraged over MSU response. Downloaded on March 19, 2021 from https://www.wilx.com/content/news/Students-outraged-over-MSU-response-563672791.html
21
Association of University Administrators. Permission to reprint for academic/scholarly purposes is unrestricted provided this statement appears on all duplicated copies. All other rights reserved.
Journal of Higher Education Management, 37(2), 22-38 (ISSN 2640-7515). © Copyright 2022 by the
Hearing Diverse Perspectives: Authentic Signaling in Faculty Recruitment
Brent S. Opall
University of Wisconsin-Eau Claire
Kranti Dugar
University of Wisconsin-Eau Claire
Kevin Hansen
Bellarmine University
Nancy Hanson-Rasmussen
University of Wisconsin-Eau Claire
Bridget Kurtenbach
University of Wisconsin-Eau Claire
Introduction
As modern workplace demographics evolve, issues of equity, diversity, and inclusion are important and timely. A global 2020 survey by McKinsey found that job seekers consider an organization's inclusive practices when making career decisions. Evidence shows workers who feel included are nearly three times more committed to their organization, and current discourse about social injustice has led institutional leadership to prioritize inclusion and diversity (Bailinson, Dechard, Ellsworth, & Guttman, 2020). The workforce is ever more diverse, especially with respect to women, Black, and underrepresented ethnic professionals (Muzio & Tomlinson, 2012; Stevens, Plaut, & Sanchez-Burks, 2008). The greater the differences among employees, the broader their perspectives, the stronger the teams, and the better their resources for problem resolution (Cox, 2001) and ethical decision making (Reidenbach & Robin, 1991). Additionally, Çelik and Çelik (2017) found that visible practices such as diversity policy and interventions can positively impact commitment, retention, and performance, and Singh and Selvarajan (2013) noted that inclusive, supportive climates motivate employees—especially underrepresented employees—to stay with the organization. The signaling or representation of an inclusive organization encourages underrepresented group members to join, and message consistency over time provides for an inclusive workplace. Universities, similarly, need to adapt to changing demographics and effectively signal inclusivity to ensure they serve the needs of more diverse students (Danowitz & Tuitt, 2011; Hurtado, Milem, Clayton-Pedersen, & Allen, 1998).
Diversity in Universities. Academic institutions are working to create cultures of inclusiveness for faculty, students, and leadership. Beyond the classroom, diversity initiatives can have positive behavioral effects for students after leaving the academic setting (Bowman, 2012). However, the question remains as to whether universities are adequately exposing students to the diverse climates and cultures they will encounter upon graduation. Work environments that graduates experience in their first employment opportunity are increasingly diverse (Hu & Kuh, 2003). Tienda (2013) found progress as to the “racial diversification of college campuses” (p. 467) at several universities, indicating improvement from prior studies, which found diversity efforts in early stages
22
American
of development (Clark, 2011; Umbach, 2006). Universities are increasingly expected to prepare students from different backgrounds to live and work in a diverse society (Hurtado, Milem, ClaytonPedersen, & Allen, 1999; Orfield & Whitla, 1999).
Defining diversity in a manner that is appropriately encapsulating is important to both identifying members of diverse groups and working to meet the needs of each group. For this study authors adopted, “the inclusion of people of different races” (Merriam-Webster, 2021). Additionally, deeplevel diversity has been defined as including “attitudes, opinions, information, and values” (Phillips & Loyd, 2006, p. 143). Tienda (2013) suggested that the term diversity could reflect “myriad dimensions – cultural, political, economic, and … racial” (p. 468).
For this study, underrepresented individuals come from minority groups such as people of color; people who identify as gay, lesbian, bisexual, or transgender; people with disabilities; people of a nondominant religion; and retirees (Allen, 2017). Women were considered as underrepresented if they self-identified as such in their profession, and the authors also considered veterans as underrepresented. This study intentionally focused on the perspectives of and feedback from diverse, prospective faculty members and did not compare and contrast responses to those from all prospective faculty members.
Efforts to Recruit Diverse Candidates. Universities are dynamic networks of people (Mea & Sims, 2019) that strive to prepare students for successful careers and provide a framework for conducting business through ethical practice. Because business prosperity is now recognized as occurring in a dynamic environment, academic institutions are working to employ faculty that reflect the demographics of contemporary businesses and are trying to increase efforts to hire diverse candidates. Historically, white faculty members have held most positions in higher education, as compared to diverse counterparts (Kayes, 2006). A 2017 National Center for Education Statistics study evaluating the racial and ethnic makeup of faculty found that 5% of college faculty members were Hispanic, 6% were Black, and 11% identified as a member of an Asian race (Davis & Fry, 2019). The same study also found only 19% of tenured professors were nonwhite (Black, Hispanic, Asian, Pacific Islanders, American Indians, Alaska Natives, and those of two or more races) whereas 27% of non-tenured faculty (i.e., tenure-track assistant professors) were nonwhite. Instructional staff and lecturers were 24% and 20% nonwhite, respectively (Davis & Fry, 2019). Fairlie, Hoffmann, and Oreopoulos (2014) found that only 9.6% of full-time instructional faculty are Black, Latino, or Native American, and gender disparities have previously been documented for faculty in universities (Danowitz & Tuitt, 2011). Savitz (2013) noted that having a workforce that mirrors the diversity of the communities served can aid university leadership in more successfully serving those communities. Increasing diversity among faculty has the additional potential to increase diversity within university leadership and university committees.
To improve diversity of faculty, administrators need to make concerted efforts to revamp recruitment, hiring, and retention programs (Clark, 2011). A 2016 case study found that half of the academic institutions surveyed viewed hiring diverse new faculty as a business case to better adapt to the multicultural work settings their students face upon graduation, no matter their academic discipline (Vos, Çelik, & de Vries, 2016). Increased diversity efforts at universities are also important because of competition across institutions (Teixeira, Rocha, Biscaia, & Cardoso, 2012), and such
23
efforts could procure a competitive edge. Kayes (2006) also noted the importance of university leadership in “attracting, hiring, and keeping faculty and staff of color” (p. 65), and these campus leaders need essential skills to recruit, mentor, and support diverse faculty (Moses, 2012). Having a diverse and inclusive university leadership team setting the direction and strategy of an academic institution can also have a positive effect on the retention of diverse students (Fincher, Katsinas, & Bush, 2010; Hitt, Ireland, & Hoskisson, 2001).
Theoretical Framework
As administrations work to diversify faculty and build inclusive environments, institutional values are communicated using overt and covert messages while recruiting. These communications signal the university’s values, intentions, and actions to candidates, as noted in signaling theory, and the receiver of the messages determines whether they match expectations or experiences (Cook & Glass, 2008; Rynes, Bretz, & Gerhart, 1991; Spence, 1973). If messages match, there is symmetry; but, if messages are in conflict, asymmetry results (Spence, 1973). A college that offers domestic partner benefits but does not have a nondiscrimination policy could signal asymmetry and lack of commitment to full diversity (Cook & Glass, 2008).
Most signaling occurs through messages that are intentionally positive and convey positive attributes (Connelly, Certo, Ireland, & Reutzel, 2011). Suazo, Martinez, and Sandoval (2009) suggested that signaling theory is evident when sending positive cues to applicants related to values and diversity efforts. Candidates interpret signals and draw inferences about the organization’s actions, especially when prospective candidates have imperfect, non-observable information (Rynes et al., 1991). When possible, a better condition for signaling is a realistic job preview, where candidates visit the organization and see true representations of working there (Rynes et al., 1991). Initial recruitment episodes expose applicants to signals at the individual level (e.g., recruitment interviews and word-of-mouth endorsements) and the organizational level (e.g., corporate advertising and recruitment advertising) (Celani & Singh, 2011). The signal forms a psychological contract, where the message received by an applicant is perceived as a reciprocal promise between themselves and the organization (Suazo et al., 2009).
Signaling a welcoming culture that is equitable, diverse, and inclusive is not enough to successfully recruit and hire underrepresented candidates. Many university degree programs, like that in business schools have historically had an underrepresentation of women and racial/ethnic faculty members (Milano, 2005), with faculty in many schools not representing the demographics of their students (Betancur & Livingstone, 2018). This discrepancy is problematic when research suggests students are better prepared for leadership and professional competitiveness when exposed to diverse perspectives in the classroom (Taylor, Apprey, Hill, McGrann, & Wang, 2010).
During recruitment efforts, many candidates consider a university’s retention rate of underrepresented faculty members. In the case of underrepresented instructors, “lack of fit” or “better opportunities elsewhere” are often part of the narrative in climate surveys (Dutt-Ballerstadt, 2020). However, the Higher Education Research Institute found these narratives inaccurate and members of marginalized or vulnerable groups report feeling stressed, discriminated against, and perceiving they must work harder than their colleagues to be viewed as legitimate scholars (Planas,
24
2019). Signaling a warm and inclusive culture when true reasons for turnover are not public may lead to inaccurate signals and eventual feelings of betrayal.
Methods
This study used a qualitative, descriptive, collective case study design (Yin, 2014) for empirical inquiry to evaluate recruitment efforts pertaining to one or more individuals (Stake, 2005). Recommendations from Yin (2014) were followed to ensure quality through construct validity and reliability. To overcome concerns of construct validity, two steps were taken: (a) study phenomena were explicitly defined and related to original objectives of the inquiry, and (b) operational measures were identified, matching said phenomena (Yin, 2014). For construct validity purposes, a detailed case study protocol was used, including definitions of key phenomena, a semi-structured interview template, and a coding manual. Researchers documented each step of the process according to the defined case study protocol for reliability. Interrater reliability was addressed by employing three researchers to code interviews and measure consistency across coding.
To better understand how universities can increase interest and recruit underrepresented faculty, this study used signaling theory to explore: (1) how academic institutions can generate interest in faculty positions among underrepresented groups, and (2) the best methods to accurately convey an commitment to diversity.
Recruitment and Participants
This study was conducted a regionally accredited university in the Midwest of the United States. Purposeful sampling utilized in qualitative research (Creswell, 2013; Miles & Huberman, 1994), allowing researchers to speak to people with first-hand knowledge of key questions explored, enabled information-rich cases (Palinkas et al., 2015) in the current study. Study participants selfidentified as underrepresented in their field, held or were pursuing advanced degrees, and indicated they would pursue a college faculty position. Participants were solicited through: (1) invitations to organizations whose membership included the target population (e.g., Prospanica, National Black MBA); (2) email invitations to alumni of the research university; and (3) invitations on social media sites (e.g., Facebook, LinkedIn). Invitations outlined the study, profile of desired interview participants, anticipated time commitment, and interview procedures. Participants selfselected by following a link embedded in the invitation to complete an online Qualtrics survey, which identified qualified participants and collected demographic (e.g., gender, race, ethnicity) and contact information.
Once identified, participants were then asked to indicate their specific field of work and self-identify as underrepresented based on their gender, race, ethnicity, sexual orientation, or any intersectionality; researchers did not apply demographic and occupational classifications to participants. Maximum variation sampling based on the predetermined criteria increased the likelihood of findings reflecting different perspectives related to equity, diversity, and inclusion. Additionally, negative cases were included in analyses, which demonstrated differing viewpoints with sharp contrasts to the major pattern or body of evidence. Including negative cases enhanced
25
initial analyses by enabling identification of new themes, providing alternative explanations (Charmaz, 2006), and aiding in data triangulation (Creswell, 2013).
Once the criteria for rigor were met, researchers conducted 45- to 60-minute interviews in person or by phone. Using a semi-structured format, questions covered topics such as perceived barriers to college-level teaching, ways in which participants evaluated a university’s diversity and inclusion, motives behind wanting to pursue a faculty position, and how colleges could support individuals in instructional roles.
Procedures
Forty-four subjects selected their preferred interview location. Interviews were not recorded; instead, the investigators took extensive, detailed field notes which were de-identified (e.g., subject name, employer). De-identified data were uploaded to NVivo, a qualitative data analysis tool, to be organized, coded, and analyzed for themes.
While subjectivity is an inherent part of qualitative research, Peshkin (1988) suggested this should be acknowledged and that researchers should systematically seek out their subjectivity during the research process, not retrospectively. In this study, researchers held reflexivity (Grigsby, 2004) as being central to strengthening the premise by acknowledging their own subjectivity, selfpositioning, and passion toward the topic of inquiry, manifested by their backgrounds, work experiences, life and cultural experiences, experiences of diversity, and history (Wolcott, 2010). Standards of rigor (Davies & Dodd, 2002) and strategies for trustworthiness (Creswell, 2013; Onwuegbuzie & Teddlie, 2002) were employed in analyses to increase reliability of results, including triangulation of methods and data, peer reviews and debriefing, member checking, rich and thick descriptions, audit trails, checking for representativeness of sources of data, detailed documentation, and referential adequacy.
Data Analysis. Data were analyzed through data reduction, data display, and conclusion-drawing and verification. To convert raw data into a valid structure (i.e., data reduction), an organized approach was implemented that involved preliminary sorting and coding during the uploading process. Qualifying interview transcripts were first organized by how the participants self-identified their underrepresentation (e.g., race, gender). Next, transcripts were titled following a naming hierarchy using colors and letters (e.g., Green C, Purple B) to avoid assumptions. This same hierarchy was used to report results (e.g., Orange B (OB), Yellow A (YA)). Finally, data were organized and checked for accuracy.
To complete data display, each interview transcript was individually coded for themes (e.g., identified barriers) using categorical aggregation. Pre-formulated codes rooted in the literature were developed based on the research questions and achieved from direct interpretation, leading to categorization of responses. When reviewing the data, unexpected themes emerged, consistent with qualitative case studies. Analyses included case contexts, descriptions, within-case theme analyses, cross-case theme analyses, assertions, and generalizations. Through multiple examinations, pre-assigned codes were assigned and additional codes were developed and placed
26
as themes emerged. After finalizing coding, patterns and relationships between the codes were expanded upon and clarified, ultimately leading to the development of overall themes.
Fleiss’ Kappa. Given multiple researchers collecting, transcribing, and coding the data, interrater reliability was considered as a measure of proportion of agreement beyond that expected from chance (Sim & Wright, 2005). Fleiss’ kappa (Fleiss & Cohen, 1973) was used to quantify reliability, as it applies to studies using multiple raters and is commonly used to measure raters’ agreement (Fleiss, Levin, & Paik, 2003). In contrast, Cohen’s kappa is a better fit for reliability between two researchers. Fleiss’ kappa was used to measure interrater reliability for identified themes from participants: (1) desire to share knowledge, (2) mentoring, (3) signs/signals of deep-level diversity, (4) diversity encompassing multiple traits, and (5) obstacles to employment inclusion. Three fixed coders were selected randomly from an available pool of six possible coders per assumptions in Fleiss’ kappa. To quantify results, the Fleiss et al. (2003) strength of agreement measures were used: <.4 = poor, .41 – .75 = fair to good, .75 – 1.0 = very good. For assessment of interrater reliability using Fleiss’ kappa, all 44 records were included.
Results
The demographic composition of study participants (n = 44), as self-identified by each participant from initial questionnaires, is displayed in Table 1. Additionally, one participant self-identified as not being underrepresented in their professional field. Final analyses included 44 interview transcripts and over 125 pages of text.
Using the Fleiss et al. (2003) categorizations for kappa, the “desire to share knowledge” and "mentoring” themes were found to be in the "fair to good” level (.41 - .75 range) for strength of agreement. "Signs/signals of deep-level diversity” and "diversity encompassing multiple traits” were found to be at the "very good” level (.75 – 1.0 range).
Why Participants Want to Teach: Messages and Signals. The most important attribute of a teaching role identified by participants in describing their interest in teaching was the importance of spreading knowledge (32% of participants). Additionally, participants emphasized the importance they placed on the work environment, their personal admiration for teachers, and enjoying the job.
Messages conveyed by participants spoke positively about their interest in transferring knowledge to others through teaching, using terms such as passion, guidance, and mentorship. Some participants considered imparting practical or experiential knowledge as the most important attribute of teaching, with one stating, “I would be able to impart wisdom in a sense of the realworld” (RE). Others spoke of their interest in transferring soft skills to develop overall wellroundedness in aspiring leaders of tomorrow, with one participant noting they would like to “expose students to real life situations and experiences, dealing with people, exposing them to practical concepts from experience” (YA).
Beyond sharing knowledge, some participants identified signals regarding quality of the university environment and the culture of an educational institution as important. The prospect of living in and experiencing committed diverse university communities was considered attractive to one
27
diverse participant, “I’m Jewish. I would hate to be the only Jewish person around. It’s about having community” (RE). Another participant echoed sentiments about community diversity, “the move would be based on the environment, the town, the politics, the diversity of both the city and university” (PG). Participants characterized commitment, work atmosphere, collegiality, support from colleagues, and the systems in place at the university as interests and bonding agents.
Table 1
Self-Identified Demographic and Diversity Characteristics of Study Participants
Characteristic % (n = 44)
Sex Female 59 Male 41 Racea Black/African American 9 Bi-racial 7 Asian 2 Chinese 2 Hispanic 2 Sikh 2 Other 13 Preferred not to answer 11 Ethnicityb European 54 Non-Hispanic 17 Hispanic 4 Jewish 4 Latino 2 Punjabi 2 Preferred not to answer 26 Sexual Orientation Heterosexual 80 Bisexual 9 Gay or Lesbian 2 Preferred not to answer 9
Note. a52% of participants did not respond to this identifier on the pre-survey questionnaire but responded to other demographic questions. bParticipants were able to self-identify as multiple ethnicities on the questionnaire.
28
Other Influences when Considering Teaching. To determine what leads underrepresented individuals in a particular profession to consider a university position, the study used three questions regarding motivations and desires, including (1) influencers on the decision to teach at a university, (2) desire for training and support, and (3) interest in other university activities outside of teaching. Emerging themes in the areas of ancillary considerations include courses taught, schedule flexibility, time in occupational life, freedom, delivery method, support, and university life.
With respect to factors that might influence their decision to teach, six subjects (14%) identified two themes: course selection or availability, and a part-time teaching status. Flexibility in scheduling teaching obligations received five mentions (11.4%), and other responses addressed time in occupational life (e.g., teaching in retirement), academic freedom, the school’s reputation, an opportunity to give back, and having a nine-month job.
Participants were also asked whether university location was a factor in their decision-making process, to identify potential obstacles or barriers. Twenty-two subjects (50%) said a teaching position would need to be near their home or their job location. Four subjects said location would not matter to them, four stressed the importance of a diverse city, three highlighted city size, and three cited the social or political diversity of the area. Two expressed an interest in the location’s cost-of-living and one participant said feeling safe and comfortable in the community was a significant consideration.
Perspectives on Diversity
To better understand what actions academic institutions can take to better signal their value for diversity and, therefore, increase the success of recruiting diverse faculty to teaching positions, several interview questions focused on definitions of diversity and its importance to participants. Responses emphasized multiple traits, including positive and negative attributions.
Diversity Encompasses Multiple Traits. This theme focuses on how prospective faculty view diversity and what characteristics are included within their definition of diversity. By understanding what prospective candidates (e.g., receiver) value, a university can better signal its shared values. Participants described numerous ways in which diversity encompasses multiple traits, such as:
I think a lot bigger than diversity of thought; I think race, culture, religion, sexual orientation, and economic class. I think of diversity work…not simply the traditional mix; I look to specifically include minorities and other underrepresented groups. (BC)
A second participant noted, “diversity and inclusion is the creation of an environment that embraces and supports individuals from diverse backgrounds, experiences, cultures, genders, to develop their full potential” (BF). Another participant stated, “Race, gender, sexual orientation, military status, disability are the main examples. Diversity is having a good mix of those, but also having a good mix of experiences and backgrounds, too” (GB).
29
Deep-Level Diversity. Diversity in an organization is more than what one observes through reading or hearing about the institution, requiring deeper analysis to determine commitment to deep-level diversity. To authentically signal positive attributes of deep-level diversity, academic institutions must understand how individuals characterize this phenomenon. One participant described deeplevel diversity as:
Built-in statements in the job offer, institution needs to work on why diversity is important in the job offer and how that is reflected in the hiring process Make it obvious why it is an important factor to them. (OA)
Another participant stated organizations are open to diversity, but they may not be as diverse as they would like. This participant said they like to see an organization actively recruiting people, to be more diverse, even if their efforts fall short at times. One participant asked, “are they walking the walk?” and noted that many universities “promote trendy terms and categories related to diversity but few are looking at diversity in a deeper manner” (OB).
Diversity Based on Life Experiences. Participants also described diversity as being focused on life experiences, with comments such as, “it’s also background experience of how people are born/raised, what part of the country/world they’re from, what their religious beliefs are, what their core values are…(e.g., political, religious, sexual orientation)” (PrC). In explaining the importance of a commitment to diversity in attracting potential faculty, the most common theme that emerged was employee-centric benefits, including advantages gained by the employee from a diverse employer. One participant characterized this benefit as, “Helps you grow if you’re surrounded by people with different points of view and engaging in conversations, debating issues, talking through issues with others who see things differently” (GD).
Another question focused on the sources of signals job seekers identified to evaluate the value and commitment an employer placed on diversity and inclusiveness. Several themes emerged (see Table 2), including evidence of valued deep-level diversity, presence of diversity content on university websites and social media, and simple onsite observations. Several participants expressed difficulty in assessing such diversity, with one noting:
You can look around at the present job force ... Who are the students? Who works there? … For instance, where I work, the percentage of Black faculty is extremely low, especially since a majority of our students are Black. You have to see the recruiting effort. Look at their outreach programs and efforts. (GC)
One participant said that the lack of diversity at the university in which she teaches is a factor that is unsatisfying to her as an instructor, stating:
[There are] many white women around the same age and it’s a disservice to our students because if they don’t see people like them doing what I do they may think they can’t do what I do, which is obviously not true. (RG)
30
Table 2
Sources Used to Evaluate Value of Diversity, With Number of Participants Contributing to Each
Major or supporting theme
Theme Supported in Interviews by: Number of Sourcesa Total Referencesb
Source for determining employer’s level of diversity and inclusiveness 44 60
Deep-level diversity 28 Company website, social media 13 Difficulty in assessing 12 Observation 7
Note. aNumber of unique interviews. bNumber of times theme is represented across all interviews.
Methods to Reach Diverse Candidates
To learn more about attracting and generating interest in open positions, participants were asked what methods an underrepresented candidate may use to search for a university position or a potential university employer. This information can aid in better understanding optimal methods an institution can use to send positive messages related to equity, diversity, and inclusion.
With respect to where participants looked to find job opportunities within higher education, 24 participants (54.5%) said they often started with LinkedIn, while eight participants (18.2%) stated they spoke with someone they knew. In using the internet, participants reviewed an institution’s website (36.4%); used an education-specific job website (e.g., Chronicle of Higher Education) (43.2%); or searched more broad job posting websites (e.g., Indeed.com, Monster.com) (70.5%). As one participant noted:
I am always aware that websites are a marketing tool...what are the statements made about EDI? What does the leadership say and what are they actually doing? How integrated is it? How strategic is it? How thoroughly is it integrated into courses, teaching, and learning pedagogy? What percentage are students of color? What percentage of faculty are of color, minorities, women? (PG)
Some participants (6.8%) used professional organizations they belong to (some were organizations for underrepresented members) for help in finding open positions, subscribed to an email listserv (4.5%) to receive job postings, or used trade publications to find postings. When researching a prospective university employer, some participants said they look at the institution’s website and social media to get an initial impression. Participants also indicated they would reach out to a current employee of the prospective organization for more detailed information, or they would reach out to people with a shared connection on LinkedIn to learn more, even if they did not already know that person. Participants noted that the institution’s mission statement, "about us" information, statements on inclusion and ethics, accreditation status, and human resources information would be important to review. One interviewee stated, “I would...read their mission,
31
vision, and values. I would also read the bios of faculty of the department where I was going to work, look at the institution size, student body” (RG).
Lastly, some participants said they would check third party sources, such as news organizations or, specifically, U.S. News and World Report, because they felt the institution portrays a certain image they want to project to the public. They wanted information about the school’s culture that would be authentic from sources perceived as unbiased. Participants stated that news sources would be reliable and paint a better picture of the university, including information that may be unflattering.
Discussion
The theoretical implications in this study lie in signaling theory. Several areas are highlighted where this study contributes to literature regarding creating an inclusive culture and the recruitment process. First, the role of signals during recruitment was identified to generate interest among underrepresented groups. Attracting and recruiting qualified diverse candidates is heavily dependent on symmetry between the cultural signals sent by the university and the reception of the signal by applicants. An administration that signals inclusive efforts through diverse hiring panels and a broad definition of diversity sends an authentic and welcoming signal. Participants indicated their desire to see a university “walking the walk,” including during onsite visits, and several participants noted the importance of “breadth” of diversity in addition to the “depth” (i.e., university commitment). The second research question explored ways to accurately convey a commitment to diversity, affecting how candidates receive signals. This study discovered the importance of university websites, LinkedIn, and Glassdoor in informing applicants of teaching positions, but seeing commitment in person gives a more accurate message of culture and trust. Applicants also need to feel that when they state or signal their interest in flexible scheduling, desired benefits, and freedom in courses, among other job attributes, the university values their request.
Universities must identify policies and procedures that signal exclusion and bias before successfully recruiting diverse candidates. The practical implications of the study reside in the preparation for recruiting. Extra time and effort could be placed in activities such as demonstrating the importance of culture by selecting and training a diverse hiring panel, identifying areas of bias, being transparent about bias incidents, and emphasizing mentorship opportunities. The authenticity of recruitment efforts and the reputation of the college are more important than placement of recruitment advertising and images of diverse people.
Defining Diversity and its Importance. Based on literature, it was expected there would be thematic differences based on ethnicity, thought, life experiences, and philosophies encompassing multiple diversity traits. Some participants made comments related to deep-level diversity, based on their experiences, but many talked about multiple traits as they pertain to diversity (e.g., age, race/ethnicity). Participants had difficulty articulating a consistent definition of diversity and many stated that diversity is a rather broad concept, which should lead universities to refrain from defining diversity too narrowly lest they discourage diverse candidates from applying to open positions.
32
Most participants’ comments were stated positively when defining diversity. Some noted the importance of university efforts to promote diversity in the workplace, and others indicated the value of social justice and inclusion. These responses help characterize the positive means by which participants described diversity and valued the importance of diversity and inclusion in employment settings.
With respect to the importance of diversity, participants also sought information regarding the culture and public perception of a potential employer. An employers’ online and social media presence were the primary methods that participants would use to ascertain organizational diversity, which presents a challenge in signaling a sincere commitment to diversity and inclusion. The implications for institutions are that they need to demonstrate their support for diversity beyond the social media platforms they own and into all aspects of the school’s work.
Hallmarks of an Inclusive Work Environment. Participants noted difficulty in assessing an employer’s level of diversity and inclusion, indicating it was often hard to judge internal efforts from the outside. While participants did seek out information available online, several indicated the need to visually observe an employer’s diversity or to hear evidence of inclusiveness from a trusted individual who has worked for the prospective employer. Detailed website information can impact recruitment trends prior to a campus visit but the websites are not as impactful after the visit or “experience” (Chang & Chin, 2018). This speaks to the need for the colleges to go beyond promoting their inclusivity on their websites or social media platforms and, instead, give prospective faculty an opportunity to experience the college’s deep-level diversity in person. How the university recruiter represents the organization from an employee standpoint is very important (Karasek & Bryant, 2012). This could include a networking opportunity where prospective employees can speak with current faculty about the university’s inclusive culture or could include interactions with a diverse hiring panel. When doing so, academic institutions should select sincere and authentic ambassadors to communicate inclusive university goals.
Deep-level diversity will signal a commitment by a university that can result in interest from underrepresented candidates. In line with signaling theory, study participants noted the authenticity of the inclusive signals being sent by the hiring institution. Signals were also being sent by the candidate when ascertaining the level of diversity commitment at the prospective university through questions asked during the hiring process. Participants wanted a culture of support to ensure the success of diverse faculty members. Based on study responses, this could include efforts by academic institutions to provide effective mentoring for newly hired diverse candidates and multiple professional development opportunities.
Future Research
Future research could utilize critical race theory (CRT) when exploring reasons for slow growth in changing the demographic makeup of university instructors. CRT focuses on institutional barriers to full inclusion for diverse individuals, which can result in negative signaling. Signaling and CRT utilized in tandem suggest the work that needs to be done to match a candidate’s desires and expectations with the reality of university culture. Based on existing literature and the value that diverse faculty
33
can bring to academic institutions, CRT could extend the investigation of qualities of a university that diverse faculty candidates value.
Implicit biases found within college recruitment practices could be the premise for future study. CRT could be used to explore barriers to full inclusion within these practices. For example, diverse candidates prefer to know: 1) they are likely not the only candidate from an underrepresented group being considered; therefore, they will be judged as an individual and not a stereotype, 2) that the search committee is made up of diverse members, and 3) experiences of diverse students are of key concern to the university (Gasman, Abiola, & Travers, 2015; Holvino, Ferdman, & Merrill-Sands, 2004). Looking at search committees and how they communicate with candidates regarding values and responsibilities, in addition to their potential to emphasize barriers through negative signals, therefore discouraging diverse candidates (Fraser & Hunt, 2011), could be a fascinating study.
Limitations
Even though the researchers believe their own subjectivity strengthened this study, other potential areas for limitations in this study include typical challenges found with case study methodology, such as the possibility of bias in interpreting data. Generally, case study methodology does not seek a generalizable outcome (Creswell, 2013). Therefore, case study methodology does not assure accuracy beyond the actual case. The results of this study are limited only to an understanding of what participants shared in their interviews.
The primary means of qualitative data collection for this study was personal, semi-structured interviews. There is some risk that the interviewees may not have a sound understanding of diversity and inclusion in universities. Additionally, the sample may not represent the full range of perspectives that apply to understanding this phenomenon. This is also supported given the sample size for the current study. Future studies could expand on a similar sample and potentially compare and contrast responses from diverse candidates with those candidates that are not typically diverse for a given profession or field of study.
Conclusions
Given the value diverse faculty bring to higher education, this study may aid universities in their attempts to build an inclusive workplace culture through effective recruitment initiatives. Additionally, the results from this study could support future efforts to generate interest from, recruit, and support diverse candidates for institutions of higher education. The current study can inform universities on where to post recruitment advertisements and where diverse candidates seek information, but it is important to reiterate that signals sent in recruitment materials must be authentic.
The unique story found in this study is that universities trying to generate interest in open faculty positions must signal their culture of inclusiveness early in the attraction and recruitment process. Equity, bias, and inclusiveness are not only topics to incorporate in the recruitment process but must be evident through underrepresented instructor retention and satisfaction. Universities must look at the symmetry between their recruitment messages and their policies, practices, and
34
demographics. Until this symmetry is achieved and a commitment to diversity is apparent, aligning the values and desires of underrepresented candidates will be difficult. The qualitative focus of this study reveals the personal nature of individuals’ definitions of and value for diversity and inclusiveness within a university setting. Study subjects expressed interest in diversity and inclusiveness as desirable, but they also broadly defined diversity. Their comments in this area encourage colleges to look at how they want to develop their inclusive practices and how to define diversity. With a better understanding of the desires of diverse candidates, supported by the results of this study, universities and the colleges and schools within, specifically, can further enhance their deep-level diversity efforts and build a work environment that attracts underrepresented job candidates by providing an authentic, inclusive culture for all faculty and students.
References
Allen, M. (2017). Underrepresented groups. The SAGE Encyclopedia of Communication Research Methods. doi:10.4135/9781483381411.n645
Bailinson, P., Dechard, W., Ellsworth, D., & Guttman, M. (2020). Understanding organizational barriers to a more inclusive workplace. McKinsey and Company. Retrieved from https://www.mckinsey.com/~/media/McKinsey/Business%20Functions/Organization/Our %20Insights/Understanding%20organizational%20barriers%20to%20a%20more%20inclusive %20workplace/Understanding-organizational-barriers-to-a-more-inclusive-workplace.pdf Betancur, B., & Livingstone, V. (2018). Increasing diversity in academic hiring. Inside Higher Ed. Retrieved from https://www.insidehighered.com/advice/2018/05/09/guidance-obtaining-morediverse-professoriate-opinion
Bowman, N. A. (2012). Promoting sustained engagement with diversity: The reciprocal relationships between informal and formal college diversity experiences. The Review of Higher Education, 36(1), 1-24. doi:10.1353/rhe.2012.0057
Celani, A., & Singh, P. (2011). Signaling theory and applicant attraction outcomes. Personnel Review, 40(2), 222-238. doi:10.1108/00483481111106093
Çelik, S. and Çelik, G. (2017). Aiming to connect: The business case for diversity in public organizations in The Netherlands. Public Money and Management, 37(7), 499-506. doi:10.1080/09540962.2017.1372108
Chang, E., & Chin, H. (2018). Signaling or experiencing: Commitment HRM effects on recruitment and employees' online ratings. Journal of Business Research, 84, 175-185. doi:10.1016/j.jbusres.2017.11.002
Charmaz, K. (2006). Constructing Grounded Theory: A Practical Guide through Qualitative Analysis. Thousand Oaks, CA: Sage.
Clark, C. (2011). Diversity initiatives in higher education: Just how important is diversity in higher education? Multicultural Education, 19(3), 57-59.
Connelly, B., Certo, S., Ireland, R., & Reutzel, C. (2011). Signaling theory: A review and assessment. Journal of Management, 37(1), 39-67. doi:10.1177/0149206310388419
Cook, A., & Glass, C. (2008). The impact of LGBT policies on ethnic/racial and gender diversity among business school faculty. Journal of Diversity in Higher Education, 1(3), 193-199. doi:10.1037/a0012987
Cox, T. (2001). Cultural Diversity in Organizations: Theory, Research, and Practice. San Francisco, CA: Berrett-Koehler.
35
Creswell, J. W. (2013). Qualitative Inquiry and Research Design: Choosing Among Five Approaches (3rd ed.). Thousand Oaks, CA: Sage.
Danowitz, M. A. & Tuitt, F. (2011). Enacting inclusivity through engaged pedagogy: A higher education perspective. Equity and Excellence in Education, 44(1), 40-56. doi:10.1080/10665684.2011.539474
Davies, D., & Dodd, J. (2002). Qualitative research and the question of rigor. Qualitative Health Research, 12(2), 279-289. doi:10.1177/104973230201200211
Davis, L., & Fry, R. (2019). College faculty have become more racially and ethnically diverse, but remain far less so than students. Pew Research Center Fact Tank. Retrieved from https://www.pewresearch.org/fact-tank/2019/07/31/us-college-faculty-student-diversity/ Dutt-Ballerstadt, R. (2020). In our own words: Institutional betrayals. Inside Higher Ed. Retrieved from https://www.insidehighered.com/advice/2020/03/06/underrepresented-facultymembers-share-real-reasons-they-have-left-various Fairlie, R. W., Hoffmann, F., & Oreopoulos, P. (2014). A community college instructor like me: Race and ethnicity interactions in the classroom. American Economic Review, 104(8), 2567-2591. doi:10.1257/aer.104.8.2567
Fincher, M., Katsinas, S., & Bush, V. B. (2010). Executive management team demography and minority student retention: Does executive team diversity influence the retention of minority students? Journal of College Student Retention: Research, Theory, and Practice, 11(4), 459-481. doi:10.2190/CS.11.4.b
Fleiss, J. L., & Cohen, J. (1973). Equivalence of weighted kappa and intraclass correlation coefficient as measures of reliability. Educational and Psychological Measurement, 33(3), 613-619. doi:10.1177/001316447303300309
Fleiss, J. L., Levin, B., & Paik, M. (2003). Statistical Methods for Rates and Proportions (3rd ed.). New York, NY: Wiley and Sons.
Fraser, G. J., & Hunt, D. E. (2011). Faculty diversity and search committee training: Learning from a critical incident. Journal of Diversity in Higher Education, 4(3), 185-198. doi:10.1037/a0022248
Gasman, M., Abiola, U., & Travers, C. (2015). Diversity and senior leadership at elite institutions of higher education. Journal of Diversity in Higher Education, 8(1), 1-14. doi:10.1037/a0038872
Grigsby, M. (2004). Buying Time and Getting By: The Voluntary Simplicity Movement. Albany, NY: State University of New York Press.
Hitt, M., Ireland, D., & Hoskisson, R. (2001). Strategic Management: Competitiveness and Globalization (4th ed.). South-Western College Publishing.
Holvino, E., Ferdman, B. M., & Merrill-Sands, D. (2004). Creating and sustaining diversity and inclusion in organizations: Strategies and approaches. In Stockdale, M. S., & Cosby, F. J. (Eds.), The Psychology and Management of Workplace Diversity (pp. 245-276). Oxford, UK: Blackwell Publishing.
Hu, S., & Kuh, G. D. (2003). Diversity experiences and college student learning and personal development. Journal of College Student Development, 44(3), 320-334. doi:10.1353/csd.2003.0026
Hurtado, S., Milem, J.F., Clayton-Pedersen, A.R., & Allen, W.R. (1998). Enhancing campus climates for racial/ethnic diversity: Educational policy and practice. The Review of Higher Education, 21(3), 279-302. doi:10.1353/rhe.1998.0003
Hurtado, S., Milem, J.F., Clayton-Pedersen, A.R., & Allen, W.R. (1999). Enacting Diverse Learning Environments: Improving the Climate for Racial/Ethnic Diversity in Higher Education. ASHE-ERIC
36
Higher Education Report, Vol. 26, No. 8. Washington, D.C.: Office of Educational Research and Improvement (ERIC Publications).
Karasek, R., III, & Bryant, P. (2012). Signaling theory: Past, present, and future. Academy of Strategic Management Journal, 11(1), 91-99.
Kayes, P. E. (2006). New paradigms for diversifying faculty and staff in higher education: uncovering cultural biases in the search and hiring process. Multicultural Education, 14(2), 65-69.
Mea, W. J., & Sims, R. R. (2019). Human dignity-centered business ethics: A conceptual framework for business leaders. Journal of Business Ethics, 160(1), 53-69. doi:10.1007/s10551-018-3929-8
Milano, B. J. (2005). The PhD project: Filling the academic pipeline with minority professors. Diversity Factor, 13(3), 30-33.
Miles, M. B., & Huberman, A. M. (1994). Qualitative Data Analysis: A Sourcebook of New Methods (2nd ed.). Thousand Oaks, CA: Sage.
Moses, Y. T. (2012). An institutional approach to recruiting and retaining a diverse faculty. On Campus with Women, 41(1).
Muzio, D., & Tomlinson, J. (2012). Editorial: Researching gender, inclusion and diversity in contemporary professions and professional organizations. Gender Work and Organization, 19(5), 455-466. doi:10.1111/j.1468-0432.2012.00608.x
Onwuegbuzie, A. J., & Teddlie, C. (2002). A framework for analyzing data in mixed methods research. In Tashakkori, A. and Teddlie, C. (Eds.), Handbook of Mixed Methods in Social and Behavioral Research (pp. 351-383). Thousand Oaks, CA: Sage.
Orfield, G., & Whitla, D. (1999). Diversity and legal education: Student experiences in leading law schools. University of California. Retrieved from https://files.eric.ed.gov/fulltext/ED456197.pdf
Palinkas, L. A., Horwitz, S. M., Green, C. A., Wisdom, J. P., Duan, N., & Hoagwood, K. (2015). Purposeful sampling for qualitative data collection and analysis in mixed method implementation research. Administration and Policy in Mental Health, 42(5), 533-544. doi:10.1007/s10488-013-0528-y
Peshkin, A. (1988). In search of subjectivity: One's own. Educational Researcher, 17(7), 17-21. doi:10.3102/0013189X017007017
Phillips, K. W., & Loyd, D. L. (2006). When surface and deep-level diversity collide: The effects on dissenting group members. Organizational Behavior and Human Decision Processes, 99(2), 143160. doi:10.1016/j.obhdp.2005.12.001
Planas, J. (2019). Discrimination and a struggle for legitimacy: Faculty of color and female faculty experience an uneven playing field. Higher Education Research Institute. Retrieved from https://heri.ucla.edu/news/press-releases/discrimination-and-a-struggle-for-legitimacy-facultyof-color-and-female-faculty-experience-an-uneven-playing-field/
Reidenbach, R., & Robin D. (1991). A conceptual model of corporate moral development. Journal of Business Ethics, 10, 273-284. doi:10.1007/BF00382966
Rynes, S. L., Bretz, R. D., & Gerhart, B. (1991). The importance of recruitment in job choice: A different way of looking. Personnel Psychology, 44(3), 487-521. doi:10.1111/j.17446570.1991.tb02402.x
Savitz, A. (2013). Talent, Transformation, and the Triple Bottom Line: How Companies Can Leverage Human Resources to Achieve Sustainable Growth. San Francisco, CA: Jossey-Bass.
Singh, B., & Selvaragan, T. (2013). Is it spillover or compensation? Effects of community and organizational diversity climates on race differentiated employee intent to stay. Journal of Business Ethics, 115, 259-269. doi:10.1007/s10551-012-1392-5
37
Sim, J., & Wright, C. C. (2005). The kappa statistic in reliability studies: Use, interpretation, and sample size requirements. Physical Therapy, 85(3), 257-268. doi:10.1093/ptj/85.3.257
Spence, M. (1973). Job market signaling. Quarterly Journal of Economics, 87(3), 355-374. doi:10.2307/1882010
Stake, R. E. (2005). Qualitative case studies. In Denzin, N. K., & Lincoln, Y. S. (Eds.), The Sage Handbook of Qualitative Research (3rd ed.) (pp. 443-466). Thousand Oaks, CA: Sage.
Stevens, F. G., Plaut, V. C., & Sanchez-Burks, J. (2008). Unlocking the benefits of diversity: Allinclusive multiculturalism and positive organizational change. Journal of Applied Behavioral Science, 44(1), 116-133. doi:10.1177/0021886308314460
Suazo, M. M., Martinez, P. G., & Sandoval, R. (2009). Creating psychological and legal contracts through human resource practices: A signaling theory perspective. Human Resource Management Review, 19(2), 154-166. doi:10.1016/j.hrmr.2008.11.002
Taylor, O., Apprey, C. B., Hill, G., McGrann, L. and Wang, J. (2010). Diversifying the faculty. Peer Review, 12(3), 15-18.
Teixeira, P. N., Rocha, V., Biscaia, R., & Cardoso, M. F. (2012). Competition and diversity in higher education: An empirical approach to specialization patterns of Portuguese institutions. Higher Education, 63(3), 337-352. doi:10.1007/s10734-011-9444-9
Tienda, M. (2013). Diversity not equal inclusion: Promoting integration in higher education. Educational Researcher, 42(9), 467-475. doi:10.3102/0013189x13516164
Umbach, P. D. (2006). The contribution of faculty of color to undergraduate education. Research in Higher Education, 47(3), 317-345. doi:10.1007/s11162-005-9391-3
Vos, M., Çelik, G., & de Vries, S. (2016). Making cultural differences matter? Diversity perspectives in higher education. Equality, Diversity and Inclusion, 35(4), 254-266. doi:10.1108/EDI-11-20150092
Wolcott, H. F. (2010). Ethnography Lessons: A Primer. Walnut Creek, CA: Left Coast Press.
Yin, R. K. (2014). Case Study Research: Design and Methods (6th ed.). Thousand Oaks, CA: Sage.
38
of Higher Education Management, 37(2), 39-48 (ISSN 2640-7515). © Copyright 2022 by
All other rights reserved.
Allyship Accountability in Academic Leadership: The Power and Responsibility in Privileged Roles
Jacob Bucher Dominican University
A paradox, if not a hypocrisy, of higher education is how our role as a thought leader and change agent for society is often pursued and fulfilled while social justice deficiencies persist within our own institutions. There has fortunately been extensive research and discourse about the decolonization of higher education as well as best practices for diversity, equity, and inclusion, however this is often centered on the student experience, and faculty and staff accountability for that experience. This then allows academic leaders to take a position of “these are things we should be doing” where the “we” is the institution as a whole, and not “we” as institutional leaders. This lack of critical introspection is essentially a lack of accountability, which ultimately leads to a lack of sustainable institutional change.
While it is true that academic leaders are accountable to a variety of stakeholders, many with differing positions on various issues, it does not necessarily follow that we must remain neutral on those issues. Furthermore it is not sufficient to defer to those “in the trenches” (students, staff, and faculty) of the fight for social justice as not only can we provide more clear direction and support for them, we can and should get in the trenches with them.
These notions of accountability and action are present in allyship. Allyship has been discussed in the context of those who are privileged by inequalities, specifically around racial, gender, and sexual identities (Gibson, 2014; Bishop, 2002; Spencer, 2008; among others). I am not suggesting, though nor am I denying, that there are any inequalities between roles within higher education, rather I am associating the privilege and power that is afforded to white, cis, male, heterosexual statuses with the privilege and power granted academic leadership titles. While in both cases the power provides the privilege to be silent, I suggest that in both cases the power provides the responsibility for active allyship. In this paper I will provide an aspirational definition of allyship for academic leaders, and will suggest how this approach will help leaders navigate past and current challenges to leading impactful change at their institutions.
Allyship and Leadership
Allyship is a process whereby a member of an in-group, or someone who is privileged or benefits from inequalities, works to advance general social justice and inclusivity efforts and specific interests of marginalized groups (Reason et al, 2005). Including allyship in social justice models is important as it can alleviate the burden of oppressed groups to resolve their own oppression. More specifically, those who benefit from inequalities are responsible for working alongside those who are disadvantaged to end the inequalities.
39
Journal
the American Association of University Administrators. Permission to reprint for academic/scholarly purposes is unrestricted provided this statement appears on all duplicated copies.
There is dialogue about whether the term allyship is sufficiently accurate and possibly problematic. In some cases, despite the best of intentions, those who consider themselves allies have perpetuated the very inequalities they are attempting to address (McKenzie 2014; Hughey, 2012; Bonilla-Silva 2006). There is also the potential for a delegitimizing and patronizing outcome, resulting in the ally receiving praise known as the “pedestal effect” (Macomber, 2015), or the heroization of leadership (Liu and Baker, 2016), and ultimately resulting with the inequalities persisting.
This criticism of allyship is particularly targeting what is known as “performative” or “optical” allyship. Performative allyship occurs when someone from a non-marginalized group professes support and solidarity with a marginalized group, but in a way that is not helpful (Spanierman and Smith, 2017). Performative allyship allows the ally to claim a commitment without taking any personal responsibility for impact or outcomes. The potential for performative allyship is high for academic leaders given the attention to optics and public relations by leaders, and as such for the purposes of this paper I will refer to active allyship as the goal for academic leadership. This term incorporates the base definition for allyship while reiterating that allyship is ongoing work alongside those with oppressed identities as opposed to an identity of someone who helps subordinate groups.
Critical Introspection and Critical Accountability
The use of “critical” to describe thinking, theory, and practice has received much political scrutiny recently, and I raise it here not to be provocative but rather to simply be clear on the power dynamics with status, rank, and title in higher education. Allyship for leaders requires us to draw on critical theories when engaging in leadership practices. Critical perspectives focus on the structural inequalities that define opportunities and experiences of members of society (Agger, 2013). Within that focus, critical perspectives question the fundamental assumptions that support a particular inequality in question. For the study of academic leadership, this involves questioning the assumptions about the need for noncommittal neutrality and the justification of self-preservation, as each supports inequalities in our institutions. For individual academic leaders, this involves questioning our identities, our decisions, our work, and our accountability at the expense of our own comfort and future mobility. We have seen research apply critical perspectives to broader contexts of leadership (Dugan, 2017; Western, 2013), though this discussion has unfortunately received less attention in academic leadership literature.
One contribution of critical perspective to academic leadership is from Garcia and Natividad (2018) and their discussion of decolonizing leadership practices at Hispanic Serving Institutions and critical applied leadership. While their findings are focused on broad practices across institutions, I will highlight two of their points that are useful in considering individual leader accountability. The authors discuss the importance of leaders working towards equity and justice for minoritized communities through reflecting on who they are and understanding their own racial privilege within a larger social system (p. 32). This critical introspection is key in continuous and long-term active allyship.
40
Next, Garcia and Natividad (2018) identify the importance of members of dominant groups accessing decolonization theory. Ignoring the colonizing frameworks that established and uphold higher education, including and especially access to leadership positions, prevents leaders from being impactful allies. In essence, leaders are called to “rethink their connection to the land and original peoples to fully understand the context of both the oppressed and oppressor” (p. 32), which if done with consideration of both personal status and the context of leadership roles, will shape their understanding of their accountability and opportunity in active allyship.
Challenges
If we acknowledge the ethical responsibility and the pragmatic value in active allyship from academic leaders, the question then is why it is not more universally or commonly deployed. The challenges to active allyship for academic leaders include a preference for neutrality, a desire to placate the dominant group(s), well-intentioned deference to specific groups or individuals, and anxiety or fear around disruption.
The Shield of Neutrality. In response to a question about why he was not speaking out on a political campaign with underlying issues of injustice, professional athlete Michael Jordan famously said “Republicans buy shoes too” (Smith, 1996). This approach to managing diverse stakeholders through neutrality is shared by many in academic leadership. We have students, faculty, staff, parents, donors, etc. who all feel differently about particular issues and rather than risk upsetting one or more groups, we argue that effective leadership is neutral or non-committal on certain issues. We even go so far as to laud neutral leadership as a sign of objectivity and integrity, but ultimately such a position frees us from the responsibility to lead on the issue, leaving the faculty, staff, and students most impacted by the issue without formal institutional support. The preference for neutrality is an obstacle to active allyship as active allyship inherently calls for us to not be neutral on issues of inequality.
It should be noted that another factor influencing a desire for neutrality is the current political and cultural climate, both the general vitriolic divisiveness and specifically regarding the perception many have that higher education lacks objectivity and is an activist institution. While this explains one motivation for neutrality, that being the desire to not perpetuate this stereotype of higher education, I would argue that this very political climate is motivation for more active allyship from academic leaders. Imbedded in the aforementioned climate is an effort to deny science and to disrupt our understanding of truth and empirical knowledge. If academic leaders attempt to avoid exacerbating this attack on knowledge by “keeping quiet”, the disease of misinformation will grow. As leaders of our own institutions and leaders within the larger social institution of education, we are called to stand up and stand against issues that threaten the vitality and integrity of those institutions.
The Fragility and Victimization of Privileged Groups. Connected to the desire to not upset some stakeholders is the simultaneous desire to appease all stakeholders. Many leaders are assessed by how much they are liked, or perhaps how little they are disliked, as much as they are evaluated on quantifiable metrics. As such, leaders feel compelled to be all things to all people, which is incompatible with active allyship. As Garcia and Natividad (2018) discuss with decolonizing
41
leadership, it is important to acknowledge the role of the oppressor in addressing oppression. Too often academic leaders pursue efforts of social justice with additional, or simultaneous, efforts to placate white, cis, male, heterosexual members of the campus community. In trying to make sure that members of these groups are not offended, do not feel guilty, and do not resist, the leaders dilute or subvert the change initiatives. This is an obstacle to an academic leader’s own allyship, and it prevents the leader from doing a key part of active allyship – and that is expanding allyship across the institution. The end result is a leader who is not accountable, in part, due to her/his inability to lead others to understand their own accountability. When we give equal attention to the personal insecurities of privileged voices we lessen the attention given to the structural inequalities articulated by minoritized voices, which aligns our allyship in the wrong direction.
Deferring Responsibility to Others. What often happens with issues of diversity, equity, and inclusion at academic institutions is that leaders will identify specific roles (e.g. Chief Diversity Officer), task-forces, human resources, and/or committees to lead efforts and initiatives. While all of those are important positions that do important work, it is a bit of an abdication of responsibility for social justice by academic leadership. It is an example of delegating work, which is certainly part of leadership, but it also delegates responsibility and accountability for change away from the leader.
The motivation of this delegating of allyship could be the aforementioned desire for neutrality (i.e. let someone else ruffle feathers) and/or it could be a genuine effort to have an inclusive approach to addressing issues of inequality by engaging more members of the community. Even then, the absence of traditional academic leadership (Department Chairs, Deans, Provosts, etc.) in allyship prevents sustainable systemic change at the institution. Both in policy and organizational culture, having academic leaders actively working in solidarity with members of the institution with minoritized identities will put ideas into practice. Deferring that work to others sends a symbolic message to the community and as the signatories for actionable policy, it risks that the work of others is superficial and fruitless.
Another challenge with deferring responsibility to others is the potential for tokenism. Often academic leaders will turn to faculty/staff/students of color to lead conversations about race and racism, and while oppressed voices should be uplifted and centered, the point of allyship is what those with power can do to eliminate inequalities, and that comes from standing with these colleagues and not leaving them to stand alone. This again is an abdication of responsibility, not to mention produces the myriad of problems that come with tokenism such as hidden and exploitive labor for people of color, trauma from isolating identities, and placing those individuals in combative situations (Flores Niemann, 2016). Part of allyship is risking one’s power and privilege, and relying on those with oppressed identities to lead efforts of change allows leaders to avoid that sacrifice. If we are not willing to risk our title by leveraging it through active allyship, we are not worthy of it or it is not worth having.
Fear of Disruption. All three of the above challenges can be grouped into a general fear and anxiety for disrupting the status quo of the institution. In other words, while leaders may be philosophically adamantly against inequalities, they foresee more problems from trying to change them than there
42
are in letting them persist. While few would say this out loud, academic leaders do find ways to justify the status quo, specifically by citing the democratic process and faculty governance. When it comes to passive allyship, academic leaders have directed attention to faculty governance and processes for implementing change. A Provost can point to a lack of faculty consensus around implementing measures of inclusivity for faculty evaluations, a Dean can point to academic freedom for why s/he has not employed an equity audit of syllabi or program learning outcomes, etc. This approach ends up failing students who obviously cannot influence faculty governance processes, and fails faculty from minoritized groups. To the latter, how can faculty of color or women change racist and sexist structures through faculty governance processes that are racist and patriarchal? When Garcia and Natividad (2018) discuss decolonizing leadership, they are not specifically addressing faculty leadership and until we see decolonization of faculty governance, it is imperative that administrative leadership leads through active allyship while still respecting the autonomy of faculty processes.
The fear of disruption creates space for passive allyship (Patton and Bondi, 2015). When teaching young sociologists about social change, I use the matrix below and have them attempt to fill in the cells. The learning or “light bulb” moment occurs when they realize there is no way to be passively anti-racist (or anti-injustice). You are either actively engaging in change efforts or you are a part of the problem. There is no room for passive allyship among academic leaders, as authorities within the institution we are either actively working against institutional inequities and inequalities, or we are complicit in perpetuating them. There is substantial literature on disrupting white supremacy, including in higher education (Fernandez, 2018; Cabrera, 2012), and among white allies (Harvey, 2008; Wilson, 2021), and academic leaders should see disrupting the status quo at their institutions as a tool for change and not as a reason for passivity.
Racism Anti-Racism
Active Hate Speech Discrimination Calling out racism Protests
Passive Micro-aggressions Implicit Bias ?
Recommendations
This paper itself is a call to action for academic leaders, and I offer three recommendations to inform action and achieve accountability: define and operationalize active allyship in your leadership portfolio, engage in comprehensive listening and radical empathy, and pursue visible and vocal advocacy in communication and written policy.
Evaluated on Allyship. Allyship is a constant and consistent process, one that requires intentional and deliberate solicitation and reflection of feedback, and a commitment to continuous growth and improvement (Becker, 2017). In thinking about allyship as ongoing work, McKenzie (2014) and others have even suggested substituting “allyship” with “operating in solidarity with” marginalized people (p. 140). This moves the goal from a claimed identity to an active effort. If inclusivity and
43
anti-injustice is a core value for the unit and institution, and we recognize allyship is a daily endeavor, it is appropriate to place metrics that track progress towards fulfilling that value and assess performance in that daily work.
One way of making academic leaders accountable for allyship as active work is to define measures of allyship that are included in the job description for the leadership position and that are measured as part of an evaluation and review process for leaders. For example, an institution can place “communicate anti-racist identity of unit” into a job description and then the leader is expected to comment on efforts for this measure in her or his annual evaluation and it will be included in any institutional (supervisor or 360-degree) evaluations of the leader. Typically job descriptions for academic leadership includes things such as budget management, program development, and accreditation among others, and reviews and evaluations of the individual assess performance in these areas. Adding demonstrable efforts of allyship to job descriptions and assessment criteria would provide “accountability teeth” that move the leader from claimed ally identity to measurable active allyship work.
Allyship cannot be viewed as an end unto itself. The creation of operational definitions for allyship in leadership portfolios can be informed by, and ultimately inform, allyship and social justice efforts across one’s unit and broader institution. The effort places leadership into the same accountability in assessment as academic programs, faculty, and staff have for diversity, equity, and inclusion. Distinguishing allyship from ally by focusing on work over identity, the amount and effectiveness of work can and should be evaluated.
Radical Empathy. In describing effective leaders and effective leadership, many point to the trait of being a good listener. Being a sounding board, or even being an active listener, is indeed a necessary part of allyship, but it is not sufficient. Wilkerson (2020) defines radical empathy as educating oneself on issues of inequality and marginalization, and listening with a “humble heart” (p. 386) to understand another’s experience from her/his perspective.
The first step in radical empathy is critical self-reflection, reflection of one’s own statuses and experiences, and reflection of one’s position in the organizational hierarchy of the institution. As discussed, allies can inadvertently perpetuate and reproduce inequalities (Bonilla-Silva 2006), and as such ally behavior needs to be first shaped by education and introspection. My personal journey with this has involved me investigating my Dean identity as much as my personal identities. Just as I need to be aware that I am not just me, but am my white, heterosexual, cis, male statuses, I am aware that I am not just me, I am my administrative title, and people experience and navigate that title as much as they do my individual traits and characteristics. Altogether, I am a white heterosexual cis-male Dean, and how that influences both the manifestation and reception of my allyship is different than it is for a leader with a different combination of identities.
Radical empathy for academic leaders is not just listening to faculty, staff, and students of color and from other minoritized communities, but hearing them. It means validating feelings and responses without resorting to defensiveness and dismissiveness that delegitimizes their experiences and consequently gaslights them. It means responding with action at the micro and macro levels, the former involves addressing the individuals involved and the latter involves addressing the
44
infrastructure elements that facilitated the experience. This balancing of listening and doing, or both listening more and speaking more, is a tensioned line that comes with allyship (Carlson et al, 2019), and academic leaders need to be intentional in determining when and how to do each. Academic leaders should pursue and accept roles as a confidant and actively seek sponsorship of efforts from faculty, staff, and students from minoritized groups. These individuals are often the “only” of their status in the room, and often experience feelings of being othered and of feelings of imposter syndrome (Melaku et al, 2020). Active allyship involves seeking out talented faculty, staff, and students from oppressed racial and cultural backgrounds and championing them and their efforts. Academic leaders should spend time getting to know these colleagues’ strengths and weaknesses, and mentoring and developing them as leaders – expanding both their opportunities and networks.
The use of “radical” provides an inherent challenge as it suggests that listening and empathy as commonly understood fail to advance efforts of social justice. Ideally the kind of listening and empathy needed in allyship would be a normal expectation for all leadership. However, as Melaku et al (2020) highlight, and as discussed throughout this paper, there is a risk to social capital in active and radical efforts. Academic leaders need to accept this risk as the power in academic leadership titles combined with intentional and active listening and empathy can create sustainable change.
Leveraging Titles and Roles. To elaborate and reiterate this notion of risk, it is imperative that academic leaders use their authoritative power by risking, and if needed sacrificing, it. Academic leaders can do this by “putting their name” on things. When communication comes from someone in a leadership position, it is not just coming from that individual – but also from their Office and from their Unit. If you want to lead from the front on issues of inequality through communications and initiatives, you have to put your name on it and put your office and title behind it. Beyond our utilizing our own names, academic leaders have to name things, we cannot be afraid to identify things as racist, sexist, homophobic or heteronormative, exploitive, and/or oppressive. Harper (2012) found that educational researchers and leaders rarely name inequality or oppression as problems at institutions. This colorblind ideology (Bonilla-Silva, 2006) perpetuates and reproduces inequalities and as such, it is imperative that leaders name and define the contexts of the oppressed and oppressors.
In thinking about leveraging (and risking) one’s title, Clemens’ (2017) discussion of allyship, specifically considering alternative terms such as “accomplice” and “co-conspirator” for allyship, is helpful. These terms both reiterate the active work in solidarity involved in allyship and carry a weight of implied risk-taking. This spirit of rule-breaking (Carlson et al, 2019), when used in conjunction with formal leadership titles/terms, leads to impactful change.
Discussion
I have spent much of this paper arguing that the responsibility for, and the value of, active allyship in academic leadership is straight-forward and necessary. As with most things however, there are layered contexts that make active allyship more nuanced and thus needing further discussion. The
45
first issue is the recognition of the importance of representation in leadership, and the second is acknowledging the impact of intersecting identities.
To truly address equity and inclusion in higher education, and to fully pursue the decolonization of higher education, there needs to be more leadership opportunities provided to individuals with minoritized/oppressed identities. This representation will not only influence the culture and work that happens in higher education, but it will provide measurable and intangible benefits for faculty, staff, and students. This paper is about how those in leadership positions should use their power as a tool in allyship, but an implied prefacing position explicitly argued here is that who is placed in leadership positions is a first step, and what allyship they pursue in those positions is the next step. In focusing specifically on the power and privilege afforded to those with administrative titles, we should expand the discussion to consider how that power and privilege intersects with other identities. For some, including myself as a white heterosexual cis-male, there are other privileged identities that influence the ability to pursue active allyship in leadership roles. One could argue that the entire section on risk-taking and disruption is an easier or safer idea for someone like me who has additional protections resulting from my other privileged identities. I recall an administrative colleague who is a woman of color telling me, after I called out some biased behaviors of faculty, “I could never say that”. I think this stacking of privilege makes active allyship even more necessary. For academic leaders with other privileged statuses, it is even more imperative that they engage in active allyship due to the opportunity they have to leverage all of those statuses in advocacy and solidarity work.
On the other side of intersecting privileged identities are academic leaders who have intersecting minoritized/oppressed identities. Many people are members of two or more marginalized groups and as other scholars (Collins and Bilge, 2016) have shown, it is important to acknowledge intersectional identities. For example, it can be suggested that perhaps this call to be accountable for allyship, to risk sacrificing one’s position of power in allyship efforts, is an unfair request. For a woman, person of color, and/or someone with a minoritized sexual or gender identity, just getting a leadership opportunity requires extensive work, both in excellence of performance and in emotional labor. For that person to then face stereotype threat due to allyship work, to be labeled as disruptive even though disruption is needed, and to risk a position that so few with similar identities and statuses achieve, one could argue that academic leaders should only be accountable for allyship if they have other identities that privilege them due to other social inequalities. While I do not ignore the reality of intersecting oppressed identities, nor would I suggest how those with such identities should navigate their careers or the world, I do return to the organizing variable of this paper, and that is the power and privilege that comes from administrative authority. Academic leaders are allowed the opportunity for silence, neutrality, and deference, but should use the power of their position for active allyship. We can also consider a similar enhanced accountability for leaders with marginalized identities. Similar to how leaders with other privileged identities should feel a greater accountability for leveraging their privileges in allyship, given the intersection of the privilege of the leadership position and the oppression of other identity(ies), there may be increased feelings of accountability to specific groups from leaders with minoritized identities. For example, in the context of allyship, perhaps it is insufficient to say that any academic leader is accountable to all marginalized/oppressed faculty, staff, and students as that ignores the
46
perceived obligation of leaders with minoritized identities to act in allyship/solidarity with marginalized/oppressed faculty, staff, and students.
In conclusion, as institutions continue work on diversity, equity, and inclusion, academic leadership needs to accept accountability for their own active allyship. If we are unwilling to put the weight of our titles behind efforts of social justice, we are derelict in our duties and an obstacle to sustainable institutional change.
References
Agger, B. (2013). Critical Social Theories. Oxford University Press.
Anderson, S. K., & Middleton, V. A. (Eds.). (2011). Explorations in Diversity: Examining Privilege and Oppression in a Multicultural Society. Belmont, CA: Brooks/Cole.
Becker, Jennifer (2017). Active Allyship. Public Services Quarterly, 13, 27-31.
Bishop, A. (2002). Becoming an ally: Breaking the Cycle of Oppression in People. Halifax, Nova Scotia: Fernwood Publishing.
Bonilla-Silva, E. (2006). Racism without Racists: Color-blind Racism and the Persistence of Racial Inequality in the United States. Lanham: Rowman & Littlefield Publishers.
Cabrera, Nicholas (2012). Working through Whiteness: White, Male College Students Challenging Racism. The Review of Higher Education, 35(3), 375-401.
Carlson, Juliana; Leek, Cliff; Casey, Erin; Tolman, Rich; & Allen, Christopher. What’s in a Name? A Synthesis of “Allyship” Elements from Academic and Activist Literature. Journal of Family Violence, 35, 889-898.
Clemens, Colleen (2017). Ally or Accomplice? The Language of Activism. Retrieved from https://www.learningforjustice.org/magazine/ally-or-accomplice-the-language-of-activism.
Collins, P. H., & Bilge, S. (2016). Intersectionality. Cambridge: Polity.
Dugan, J. P. (2017). Leadership Theory: Cultivating Critical Perspectives. San Francisco, CA: JosseyBass.
Fernandez, Jesica (2018). Decolonial Pedagogy in Community Psychology: White Students Disrupting White Innocence via a Family Portrait Assignment. American Journal of Community Psychology, 62(4), 294-305.
Flores Niemann, Yolanda (2016). The Social Ecology of Tokenism in Higher Education. Peace Review: A Journal of Social Justice, 28, 451-458.
Garcia, Gina & Natividad, Nicholas (2018). Decolonizing Leadership Practices: Towards Equity and Justice at Hispanic-Serving Institutions (HSIs) and Emerging HSIs (eHSIs). Journal of Transformative Leadership and Policy Studies, 7(2), 25-39.
Gibson, Priscilla Ann (2014). Extending the Ally Model of Social Justice to Social Work Pedagogy. Journal of Teaching in Social Work, 34(2), 199-214.
Harper, S. R. (2012). Race without Racism: How Higher Education Researchers Minimize Racist Institutional Norms. The Review of Higher Education, 36(1), 9-29.
Harvey, Jennifer (2008). Disrupting White Supremacy from Within. Cleveland, OH: The Pilgrim Press.
Hughey, M. (2012). White bound: Nationalists, Antiracists, and the Shared Meanings of Race. Stanford: Stanford University Press.
Liu, Helena & Baker, Christopher (2016). White Knights: Leadership as the Geroicisation of Whiteness. Leadership, 12(4), 420-448.
47
Macomber, K. (2015). “I’m sure as hell not putting any man on a pedestal”: Male Privilege and Accountability in Domestic and Sexual Violence Work. Journal of Interpersonal Violence, 33(9), 1491–1518.
McKenzie, M. (2014). Black Girl Dangerous: On Race, Queerness, Class and Gender. Oakland: BGD Press.
Melaku, Tsedale M.; Beeman, Angie; Smith, David G., & Johnson, W. Brad (2020). Be a Better Ally. Harvard Business Review, November-December 2020, retrieved from https://hbr.org/2020/11/be-a-better-ally Patton, L. D., & Bondi, S. (2015). Nice White Men or Social Justice Allies?: Using Critical Race Theory to Examine how White Male Faculty and Administrators Engage in Ally Work. Race Ethnicity and Education, 18(4), 488-514.
Reason, R. D., Scales, T. C., & Roosa Millar, E. A. (2005). Encouraging the Development of Racial Justice Allies. New Directions for Student Services, 110, 55–66.
Smith, Sam (1996). Second Coming: The Strange Odyssey of Michael Jordan. New York, NY: Harper Collins.
Spanierman, L.B., and Smith, L. (2017). Roles and Responsibilities of White Allies: Implications for Research, Teaching, and Practice. The Counseling Psychologist, 45, 606-617.
Spencer, M. (2008). A Social Worker’s Reflection on Power, Privilege, and Oppression. Social Work, 53(2), 99.
Western, S. (2013). Leadership: A Critical Text. Los Angeles, CA: Sage. Wilkerson, Isabel (2020). Caste: The Origins of our Discontents. New York, NY: Random House.
48
of Higher Education Management, 37(2), 49-67 (ISSN 2640-7515). © Copyright 2022 by the American Association of University Administrators. Permission to reprint for academic/scholarly purposes is unrestricted provided this statement appears on all duplicated copies. All other rights reserved.
Looking for the Dream School: Understanding the Lived Experience of the College Choice Process
Ryan Ladner John Brown University
The traditional college student segment in the United States is shrinking. Higher education enrollment has seen declines for the 8th consecutive year (National Student Clearinghouse, 2019). It’s not just one institution type; public, private, and two-year college enrollment have all declined. More than ever, marketing to this smaller population is critical. In order to be effective at reaching a smaller pool of students, it is essential to understand how potential students choose the college they will ultimately attend and how they consume various forms of information in the process.
College choice theories suggest that individuals move through a step-by-step process and evaluate various pieces of information to decide on a college of choice (Chapman, 1981; Chapman, 1986; Hossler & Gallagher 1987; Jackson, 1982; Litten, 1982). Quantitative studies featuring the relationship of college choice factors continue to tout the importance of top-ranked factors of choice, such as parental involvement, friends, interaction with college personnel, the college Web site, and campus visits (Forbes & Vespil, 2013; Pooja, Black, Berger, & Weinberg, 2012; Sago, 2013; Themba & Mulala, 2013; Wang, Yu, & Wei, 2012).
Few researchers have attempted to comprehend how prospective students consume marketed college information and use factors to evaluate matriculation decisions. Furthermore, technology has forced many colleges and universities to utilize different techniques to reach this generation. Whether new marketing efforts that colleges and universities use are truly affecting college choice processing, demonstrating an understanding of prospective students' lived experiences will help answer this question and give colleges and universities insight into how to assist prospective students as they progress through their college choice process. Therefore, this study explored the lived experiences of prospective students during their college decision-making process.
Literature Review
Conceptual models of college choice began to materialize during the 1980s (Chapman, 1981; Chapman, 1986; Hossler & Gallagher, 1987; Jackson, 1982; Litten, 1982). The various models of college choice can be organized into three different models: economic, sociological, and psychological (Bergerson, 2009; Kinzie et al., 2004; Paulsen, 1990).
The economic models place a strong emphasis on students selecting colleges based on the return the degree could provide post-graduation in the form of employment. Therefore, factors such as net costs, financial aid, and return on investment were the biggest indicators of the likelihood of student enrollment (Bergerson, 2009; Kinzie et al., 2004; Paulsen, 1990). Sociological models emphasized the desire to attend college was highly influenced by the individual factors and
49
Journal
characteristics of the student. (Bergerson, 2009; Paulsen, 1990). Finally, the psychological models focused on the relationship between the student and the institution and perceived fit. Emphasis was placed on institutional characteristics of to cost, location, curriculum, and other environmental factors.
Hossler and Gallagher (1987) synthesized these previous models into one comprehensive three phase model that became the most widely used model of college choice theory (Bergerson, 2009; Ceja, 2006; Cabrera & La Nasa, 2000; Hossler, Braxton, & Coppersmith, 1989; Teranishi et al., 2004). Hossler and Gallagher's model focuses on individual and organizational factors that lead to specific student outcomes in each phase of the three phases.
In the first phase of predisposition, the decision of whether to continue their education occurs. Socioeconomic factors, parent education, student ability, gender, ethnicity, and parent encouragement are all factors that strongly influence the predisposition phase (Desjardins, Dundar, & Hendel, 1999; Flint, 1992; Tierney, 2009; Weiler, 1994). Organizational factors are interacting with individual factors to influence the college choice decision of students. Paulsen (1990) found that high school curriculum, involvement, cost, and proximity to college all influence a student's decision to initially begin looking at college education.
The second phase of search occurs once a student decides they want to continue their education journey. The search for information begins, and a choice set is formulated. This choice set represents the colleges the prospective student will submit an application to (Hossler & Gallagher, 1987). Parents are highly involved in the search process by being the main sources of information collection and thus having high influence (Litten, 1982). There is also high reliance on campus visits and web sources to gather information (Barrnett & Das 2013, Hoyt & Brown, 2004). One of the challenges during this phase is attempting to organize lots of information and connect what is important to the overall search from web sources (Barnett & Das, 2013). Students usually consider three to five alternatives and use between eight to ten criteria to determine their college choice (Galotti, 1995; Stephenson, Hecken, & Yerger, 2016). These alternatives are chosen from a variety of factors: advice of friends and relatives, teachers, and high school counselors (Noel Levitz, 2012b). The final phase of choice occurs when a student has selected an institution by narrowing down the student’s choice set. Hossler and Gallagher (1987) describe the courtship procedure, use of awards, and strategies by the institution, as highly influential in this stage. The evaluation of net costs is important in the decision, and students often balance reputation, location, and program offerings with cost to get an idea of fit (Hossler, Schmit, and Vesper,1999; Huntington-Klein, 2018; Paulsen, 1990; Stephenson, Hecken & Yerger, 2016). The model recognizes the final decision being the students, Huntinton-Klein (2018) argue that parental encouragement plays a much more significant role in the final selection. While students don't place much weight on a parent's likes or dislikes or the school, the opposite is true. In the final choice, students have a stronger bargaining position than their parents, but they do not have full autonomy.
College choice theories indicate that students move through a sequential process where various pieces of information are consumed and used to decide on a college of choice (Chapman, 1981; Chapman, 1986; Hossler & Gallagher 1987; Jackson, 1982; Litten, 1982). Quantitative studies featuring the relationship of college choice factors continue to tout the importance of top-ranked
50
factors of choice, such as parental involvement, friends, interaction with college personnel, the college Web site, and campus visits (Forbes & Vespil, 2013; Pooja, Black, Berger, & Weinberg, 2012; Sago, 2013; Themba & Mulala, 2013; Wang, Yu, & Wei, 2012). Few researches have studied the process of college choice as it occurs and how prospective students make sense of the intersection between institutional efforts to communicate a value proposition through branding and the college choice process.
This study aimed to understand how residential first-year traditional undergraduate college students make sense of their lived experience in the choice process. This study attempts to address a gap in the literature on how prospective students are making sense of their lived experiences of the college choice process. The goal was to provide a better understanding of the factors influencing college choice and how participants react and understand information and advice in each phase of the process.
Methodology
Qualitative research is appropriate in this study because it is used to explore the meaning individuals assign to specific problems that are aspects of their individual lives (Creswell, 2009). Since this study focused on making sense of the lived experience of college choice, an interpretive phenomenological analysis (IPA)was used. IPA is a “qualitative research approach committed to the examination of how people make sense of their major life experiences” (Smith et al., 2009, p. 1). According to Smith et al. (2009), as people begin to experience something major in their lives, they reflect on the significance of what has happened. The experience of choosing a college is a major event in anyone’s life. It represents the first experience of being away from home, choosing a career, and providing for oneself without the aid and convenience of direct family intervention. At the core of this phenomenological research reflects the idea of everyday experience. IPA examines the subjective experience of a particular phenomenon that is connected to a much larger and more significant moment in the life of the individual person. Small everyday experiences become a larger, more significant event in the life of the individual being examined (Smith et al., 2009). The experience reflected to the researcher is what Smith et al. (2009) referred to as "experience close" (p. 33). Experience close describes the reflection of an individual's sense making after the event has occurred, rendering it the closest thing to witnessing its occurrence. Regarding the reflection of personal experience, IPA is committed to the human lived experience and the meaning that is imposed on that experience (Smith et al., 2009).
Sample
A sample of 15 participants was used for this study. To be consistent with qualitative research, the sample was chosen purposefully and will reflect an interpretation of the participants' lived experiences by the researcher. Participants were located through various gatekeepers who knew participants who could provide access to the college choice phenomenon of the study. Of the participants, eight were male and seven were female. Twelve of the participants were located in the state of Mississippi. Of those 12, 10 attended the same high school in the southern geographical region of the state. The other two attended a private high school located in the same region. These 12 participants considered many of the same colleges in Mississippi: the University of Mississippi,
51
the University of Southern Mississippi, Mississippi State University, Mississippi College, Milsaps College, and Belhaven University. Two of the participants from Mississippi were being recruited to play collegiate athletics and were speaking with various colleges throughout the United States. Two other participants out of the 12 from Mississippi were also looking at colleges throughout the United States, including the University of San Francisco, the University of Oregon, the University of Wisconsin (UW), Harvard University, and Vanderbilt University.
Data Collection
The researcher followed the process of college choice for each of the participants for six months. During those six months, data were collected through in-depth interviews, journaling, and in-themoment communication. According to Smith et al. (2009), the data collection method best suited for IPA research encourages the participants to offer a "rich, detailed, first-person account of their experiences" (p. 56). Smith et al. (2009) concluded that the best methods to access these firstperson accounts are in-depth interviews and the process of keeping a diary (journal). Even though very few IPA studies utilizing journaling as a method of data collection have been published, Smith et al. (2009) asserted that using diaries (journaling) combined with in-depth interviews would "facilitate the elicitation of stories, thoughts, and feelings about the phenomenon" (p. 56). Smith et al. (2009) also encouraged creative and imaginative work and stated that IPA benefits from a collection of data from more than one perspective at more than one point in time. Journal entries were being communicated in the moment with the researcher. When entries were received, the researcher encouraged more "in the moment" communication during important college choice events, such as campus visits, receipt of interesting mailings and acceptance and rejection letters, and major changes in participants' top five colleges. This allowed the researcher to be at the decision point of many of the participants' college choice decisions.
Data were analyzed using Smith et. al’s (2009) six steps for IPA. The researcher first read and reread the data making the participant the focal point of the study. Step two involved the process of initial noting where the researcher makes notes of anything of interest to allow for a deeper understanding of meaning in the way the participant communicates. Step three involved managing the data by decreasing the complexity of the transcript and exploratory notes. Step four involved theme connection and conceptual and textual themes were joined together. Step five involved completing steps one through four for each of the participants in the study. Finally, step six involved pattern identification across each of the participant cases to uncover common themes.
Results
This study chronicled the lives of 15 participants who were in the midst of making a decision regarding their future college choice. The emphasis of this study was to understand the progression and decision-making process in the lived experience of individuals. Through a careful analysis of iterative, phenomenological, and hermeneutical elements of the interview transcriptions, five major themes emerged related to participants' lived experiences of college choice: (1) who to consider, (2) a college of comfort or a college of adventure, (3) factors changing the choice set, (4) personal marketing matters, and (5) the importance of visualization.
52
Who to consider
While most participants generally knew they wanted to go to college, the choice of which schools to consider was complicated. The most significant factors in determining this were their choice of major, the reputation of the school, and location.
Major. College major was important to all participants. After all, many of them could not even recall a time when they did not consider going to college. Therefore, they often visualized their future jobs and knew those jobs required specific majors. The specificity of their future plans was critical in allowing the participants to decide which schools they should consider. For example, Sharon performed extensive research on which colleges offered her desired major: marine biology. Sharon identified early on that both the University of Southern Mississippi and Louisiana State University offered programs that were near her in marine biology: “They had a college fair at my school last year, and I went and asked every school I was interested in if they had a marine biology program”. She eliminated schools from consideration if they did not have her major, even if close friends went there: “I have a few friends that go there, and I’ve heard really good stuff, but they don’t really have what I want to go for, so it’s not an option” (Sharon, 9:85).
Reputation. As students formed their consideration sets, the reputations of the schools they were looking at were vital to them. They seemed to want to attend a school with a decent reputation for the major they held interest in. Most of the reputation information was derived from family, close friends, or even staff they spoke with at career fairs. Charles recalled his choice to rank the University of Mississippi (Ole Miss) number one in his consideration set: "Ole Miss, number one because it's a good university for finance majors, and it's affordable". Charles even mentioned that the two most important factors for him included both cost and quality components.
Parents were also involved in determining the reputation or quality of a college. Robert said, “my mom got online and researched a degree I could get for coaching. And they said the best opportunity or the best degree that was offered was sports studies from Mississippi State”.
Location. As participants decided which schools would make their final choice set, the location was a factor in determining which schools to research further. Regarding location, participants' default to choosing colleges, at least initially, was the following: (1) Are they closer to home? (2) Do I have some family ties? (3) Are they located where I desire to live or have dreamed about living? The school's distance from home was critical to both participants and their parents. Mary admitted, "Location is a big choice for why I chose these colleges". Donna considered the University of Southern Mississippi because "it's closer to home, and it's not like I have to drive forever to get there". As Edward was approaching the end of his senior year, he mentioned that "I used to be, get as far away as I can, I but I don't know, just as I've gotten further in high school, I've realized that it doesn't really bother me if I'm closer to home, and, you know, maybe would be better".
Participants considered schools a little further away if other family members lived in the area: "My parents don't mind me living in Jackson since my grandparents live there" (Laura). "Mississippi State because it was close to family and I had family that went there. My great uncle even coaches there” (Paul). If there was no family around, participants seemed to be okay with considering schools in
53
areas they viewed as desirable: “Well, I really like the campus a lot; it’s so pretty, right by the beach, and I love the beach” (Mary). Other participants, such as David, were fascinated with the northwest region and verbally admitted to choosing colleges because of the desire to be in that location: “I would also like to go to college in the northwest region, or by Washington or Oregon. I didn’t grow up in Seattle, but I lived in Seattle. Dad always talks about how much he loved Seattle, so I’ve always wanted go to there” (David).
Location, reputation, and major were big factors in participants' lives as they considered which colleges to begin placing on their lists. Each of these factors carries weight in determining where to submit college applications.
A college of comfort or adventure
As participants moved from consideration sets to choice sets, they were looking for a school that was either (1) comfortable for them or (2) offered them the traditional college experience. Interestingly, this decision seemed to play a significant role in determining the type of school participants were looking for, the final distance from the home of the school the participants desired, and the identification of what participants labeled as a "fallback" school.
College choice sets reflected the participants' personalities and even their closeness to and importance of their family dynamic. Laura's search for a college of comfort was rooted deeply in her home interactions with her parents. "My parents like the idea of a Christian university. They feel it is a little stricter and think I will stay more in line there. I think they feel a little more comfortable with [my] going there". Laura even went a step further than the safety and seemed to desire the boundaries set forth by Mississippi College: "I like how Mississippi College is so strict that you cannot really do much wrong there. I like the boundaries that it provides".
If participants were concerned with comfort or searching for a college that reminded them of their home life, they would often emphasize the location component and stay closer to home than those who searched for what they called their "dream school."
Dream school. The dream school was often formed from their childhood and teenage experiences with family. Most of the time, participants' families were highly connected with that school as sports fans, alma mater, or both. The dream school and the participant grew up together and supported one another. While the dream school was comfortable to them, it was very different from the comfort school. Its characteristics were ultimately unique to the participants' desired social atmosphere and upbringing. Some dream schools were small; some were large. Others were dream schools for some participants while being comfort schools for others. The dream school could be any type or kind of college, but it was well connected to the individual.
Some good examples of identification with a dream school came from the cases of David, Charles, Donna, and Mary. David’s dream school was the University of Oregon. When asked about the inclusion of Oregon in his choice set, David shared his family’s history with the school: “I love [the] football team. My room is actually painted in Oregon. Oregon is just kind of part of the family". David's comments shaped Oregon as an integral part of his family dynamic, which he was extremely familiar with. He admitted his excitement when a letter arrived from Oregon after he requested
54
information: "I got a letter today from Oregon and that really excited me just because it's Oregon”. The pattern is similar in Charles’s case. He admitted to including Louisiana State University on his list of potential schools because he was a fan, and it was also his father's dream school. Charles explained, "I like LSU just because, you know, I grew up cheering for LSU". Mary's dream school was North Carolina State University and she even described it as her "dream school." Once again, the desire to attend the "dream school" began early on and was tied deeply to family interactions and social events: "NC State is the main school that we go to and we attend all of the sports games and I am very used to the campus”. Edward’s dream school was Harvard University, yet he had written off consideration of this school until he found out that the financial burden of the school could actually be overcome.
A representative from Harvard came to visit and she used to attend Biloxi High School, near [my] high school, and she came and talked to us about Harvard and the experience and she started talking about financial aid, which previously, I had never thought of financial aid at least for me, because considering that my family is well off, but she said even with my financial situation I could get some money at Harvard. And Harvard is almost kind of a dream school of mine, and so now I really want to try [to] get in and see if I can actually afford it. (Edward, 3:3)
The "dream school" was present in many other cases with the emergence of the desire to attend being primarily family related and based on the early development of a fan-based following for the school. This school was comfortable and exciting for the participants, and they remained ingrained in the top five through their entire college choice process.
Fallback school. In addition to the "dream school," participants had what many called a "fallback school." This school was generally one that met their basic requirements, had easier admissions requirements than those of other selections, and included some of their friends from high school who often attended in large numbers. Donna summarized the idea of the fallback school in the following way: "If everything else falls through, there is always Southern Miss". The fallback school was often associated with the "13th grade" or a conglomerate of high school colleagues who took an easy route to the particular school. Mary describes Eastern Carolina University as this type of school:
ECU is only 30 to 40 minutes away, and a lot of my friends and people form high school go to ECU. I just kind of want something knew, not where everyone else goes. If ECU was my only option, I would go there; I just don’t want to be like everybody else though. (Mary, 7:7)
Even though Mary referred somewhat negatively to Eastern Carolina University, it was a school she was comfortable with and appreciative of being accepted to early on in her search process:
I already have one in my hand, you know; I already have one in my pocket and if none of the other ones work out, I'll be able to go to ECU. It's exciting, but it's not, you know, the one that I really want to go to. It's my last choice of the ones that I applied to, but it's good that I have one there.
55
The “fallback school” was not necessarily a choice that participants do not want to attend; it is an acceptable option that they seem confident in being able to gain acceptance into and attend. Edward’s fallback school was Millsaps College. He referred to it as his worst-case scenario option: “Like if nothing else works out, that’ll be the school that I know I can go to”. Edward did follow up his statement by saying, “It’s like my fallback and to me, I think that’s a great fallback school”.
College of adventure. The college of adventure. Rather than a search for something comfortable, some participants were looking for an experience that was the opposite. The search for a college experience created a heuristic that often eliminated smaller schools that did not offer a "traditional college experience." According to participants, the traditional college experience seemed to be a larger school where participants stay on campus, meet new people, and actively participate in social and sporting events. Even the word college was described by some of the participants as a "large school." Sharon elaborated on her thoughts of the word college: "When you think of college, I think of just a bunch of people, so I'm not saying I'm against a small college, that is just what I think about" (Sharon, 7:217). Sharon viewed large schools as more connected: "Northeastern and FSU [are] a little more connected" (Sharon, 7:225). The idea of a larger-sized school, when thinking about it early on in the participant’s consideration set, relates to a desire to be a part of the full “college experience.” Once the desire to search for and participate in the college experience has been established, small schools do not receive as much attention, nor do the participants exhibit extensive search behavior toward them. When discussing Charles’s consideration set, he admitted that a part of him desired to have the full college experience: “I guess because part of me wants to go to that big university and have that experience. I think I would kind of enjoy the atmosphere” (Charles, 8:327). He went on to mention that he “likes to try new things” (Charles, 8:348). It is definitely a picture of what the college experience should look like, possibly defined by social and media exposure.
When determining schools to place in their choice set, the three schools that were most present and most difficult for the participants to move were the dream school, the fallback school, and either the comfortable school or a school that offered the traditional experience. Characteristically, these three school types and schools that closely resemble or offer similar features made up the majority of the participants’ consideration and choice sets.
Factors changing the choice set
Even after participants were leaning in one direction or another toward a college of adventure or one of comfort, many key factors were present that could make significant changes in their choice sets. The factors are best illustrated in the following themes: (1) debt as a burden, (2) the emergence of the small college, and (3) parents as drivers in college choice.
Debt as a burden. All participants in this study mentioned the word cost or discussed the concept of affordability in one way or another during their search process. The idea of paying for college weighed heavily on many of them and was not something they wanted to do for a long time after graduation.
56
One of my goals when I entered high school was to get my college paid for so my parents wouldn’t have to like go through all of that. (Mark)
I mean, I’m limited to what I can afford, and I also don’t want to worry about having ridiculous amounts of student loans, so it’s definitely, kind of, based on the financial part. (Edward).
It’s a lot cheaper to stay in state, and that played a part in deciding what college I wanted to go to. (Linda)
I wouldn’t mind going to a four-year college whether public or private or wherever it’s at. The main factor is cost. (Charles)
I’m trying to avoid a school that will put me into debt after college. (David 16:68| 472)
As the participants illustrated, debt was seen as a burden, and they were aware of the costs of attending college. Many participants expressed sentiments about carrying debt after school and having to pay back loans when they graduated. They looked positively on college, but viewed a college degree with high debt as a burden to avoid.
Debt remained a factor participants wanted to avoid, which may be in relation to the inability of their parents or themselves to pay for school. Because of this desire, scholarships became powerful choice factors. Schools were even eliminated from consideration because of the bleak outlook on scholarships. David and his father spent some time going through all of the letters and brochures that he received from colleges and eliminated schools that “were too expensive, or scholarships, they didn’t have a [sufficient] scholarship” (David). Charles evaluated costs through research in the same manner:
I did some research into the Texas colleges, and I discovered how extremely hard it is for out-of-state students to get scholarship money because of the, um, they have a program for every student in the top 3% and Texas gets automatic admission. So they don’t really need a lot of out-of-state students. I knew it was expensive so I dropped it off the list. (Charles)
For several of the participants, cost was the ultimate heuristic used in the decision-making process. When asked if he would consider a dream school of his, Mark defaulted back to his main goal: "I'd still consider it probably, but mainly, just like I told you before, my main goal is just to go to college for free. So that's my main thing" (Mark). This sentiment was also illustrated in Mary's final evaluation criteria for her top two choices: "If I get more money, I'll go to NC State. If I get more money from Chapel Hill, I'll go there" (Mary). Charles admitted, "I am pretty open to anything, it just depends on, my financial, it just depends on like, my scholarships and things like that" (Charles). Edward even stated that "it might be better to consider somewhere nearby, just because I can get a better, a better scholarship. I don't know, I realized that I may be better off" (Edward). Cost was an influential factor in evaluative criteria.
57
The emergence of the small college. Throughout the process, participants wrestled with the thought of the small college versus the big college experience. Even if they were determined to attend a large college and get the full college experience, there was a point in their searches when a small college was introduced to them, and they entertained the idea of attendance. The barrier to small colleges seemed to be the financial burden they would face; however, this was usually presented differently when they spoke directly with representatives. Most of the interactions occurred at career or college fairs, but many of the participants actually considered a small college in their choice set even if it was not initially there. There were many reoccurring perceptions about large colleges and small colleges. The sentiment seemed that the participants liked the idea of small colleges. Dorothy said it best in the following statement:
I really like the idea of small colleges. Just to be able to know that even in the first couple years, I will still be good, that I won’t be overwhelmed with people and everything. But I also like the idea of big.
Just as Dorothy seemed to struggle with weighing the benefits of a small college and a large college, other participants did as well. A small college was seen as a place where participants would not be lost in a crowd and would be in a better learning environment because of small class sizes. Laura said,
“I like the idea of a smaller college. A place where I can just, I’m not so lost, I’m not so, thrown into a mass crowd” (Laura, 6:88). She elaborated by saying the following: I like the idea of a smaller atmosphere, the smaller classes; I really want smaller classes because I really get involved with my teachers and things so I want to have the ability to just be close with them and be able to ask questions and be known. (Laura, 8:86)
Edward had similar and more extensive comments about small colleges: I do like the private aspect because a lot of times those school have smaller classes so that’s sometimes more beneficial for students. . . . They have . . . more time with the teacher and more individual focus so I like that aspect about small colleges. I think the smaller setting . . . smaller [number] of students at a school is actually better probably just because you get more one-on-one time with faculty, and I feel like the professors would be able to help you more with making you a better student or help you more with understanding the material that you’re trying to learn, compared with going to a big university where you’re sitting in a big auditorium. (Edward).
In the end, participants weighed these concerns regarding college size. The draw of large colleges seemed to be the people and the college experience: "I like people, so I don't mind it[s] being a lot of people; I love getting to meet new people, and I just like the big games and having a whole bunch of people there and having the big stadiums and stuff" (Mary). As seen above, the small college attraction was class size and learning; however, participants had to weigh that with the idea of small schools' being too similar to high school. Therefore, what the participant deemed as most important, a college of comfort or one offering the college experience, determined their considerations in college size.
58
Parents as drivers in college choice. Parents played an essential role in most participants' college search processes. One of the first things uncovered was that parents were often the initiators at the beginning of the search process and remained active until the end. "[I] and my mom got online and researched, you know, the degree that I could get for coaching and stuff. And they said the best opportunity or best degree they offered was sports studies from Mississippi State" (Robert). David's father also initiated the college search process: "For the most part, I haven't looked too much into colleges; it's mainly my dad looking at it. I plan to start looking, but I just haven't been too interested in looking at colleges at the moment . . . My dad is really passionate about [my] going to college, so I usually look to him when it comes to school things” (David). Edward admitted that his father assisted in helping him decide what schools to consider and tour: “My dad . . . gives me advice for what I should do and how I should prepare with applying to colleges and also you know touring them and things like that” (Edward).
In addition to the initiation of the college choice set, some parents played a role in determining which schools should be added or removed. Charles mentioned his father's making changes to his choice set as well: "One of my dad's friends works at the University of Arkansas so he wants me to consider that school so I applied . . . I added the University of Maryland to my list, nagging dad was the influence”. David also received recommendations from his father: “My dad has always kind of looked at the University of Alabama because of [its] special program . . . My dad also added the University of Maryland because of a special program [it has] where you can earn your master’s in 4 years” (David). Linda’s father was also important in her consideration of schools in the state of Florida: “My dad was kind of saying that the schools in Florida are really good and that I should consider them” (Linda).
Personal marketing matters
Admissions staff. Admissions counselors and key college staff members played various roles in the college search process. For most participants, the information provided by these institutional workers was taken as truthful and processed in that manner. Furthermore, relationships with admissions counselors or staff members that were viewed as positive could alter the ranking of their college in the choice set of the participant or even get their college added to the participant's choice set.
David recalled a visit to a career fair where he evaluated recruiters based on their ability to answer questions about their specific colleges in a helpful manner: "Like Alabama, we could ask the girl a question and she could answer immediately. She didn't have to think about it or anything. Other colleges like the University of Colorado at Boulder, the guy had no idea" (David). David made a judgment on the school based on its representative: "The guy wasn't very informed, which I feel like kind of says something about the school, you know" (David). Edward also recognized when he felt like the admissions counselors were able to answer all of the questions he had for them: “Springhill, when I went to go talk to that representative, he was very helpful. He was very informative about, like the different programs, and he also talked about like his own story and how he ended up going to college there” (Edward). The Springhill counselor also was determined to get Edward to visit campus: “He was very true about the fact that you know you need to go visit the college to see if it’s where you want to be” (Edward). Deborah also had a very interesting conversation with some of
59
the admissions counselors at a small school at the college fair: “We had a college fair at my school and there was a very interesting school; it’s called Cottey or something” (Deborah). “Cottey was [an] all women[’s] college of like 350 students. The women at the table were basically owners and they paid for the college and they even had cookies . . . I still think it’s in my top 5” (Deborah).
Handwritten letters. Laura mentioned the only traditional marketing materials that stood out to her were "all the handwritten letters from the students, and everything was really good. I think that’s really cool" (Laura). Other participants were also enamored with the handwritten mail they received: "I got a handwritten letter from Ole Miss. It was in recognition of my high test scores. It made me feel like [the admissions officers] actually really noticed me, and it’s kind of what makes me want to go there” (Sharon). Even regarding athletic recruiting, Mark received some advice from his coach about what to make of handwritten letters: “If it’s just a typed up thing with your name on it, then they could’ve sent that to ten thousand players across the country and just changed the name” (Mark). David also received a handwritten letter from one of his schools after a visit: “I got a handwritten letter from Chadron that said, thanks for coming, and so that was kind of cool” (David). With the amount of traditional mail the participants were receiving, it was apparent that handwritten letters really stood out, as they were mentioned frequently during the interview process.
A visualization of college life
As participants began narrowing down their choices and ultimately making a selection, the visualization of life at college became important to them. Ultimately, they were attempting to get an idea of what it would be like to live on campus and in the surrounding area during their time of attendance. This visualization was dependent on emotion and common phrases that it just "feels right" to be there, and it was a good fit. Often it was the culmination of all of their desired factors of college choice. The ultimate choice, though influenced by many factors and individuals, must come from them. Even with outside influences, the participants were adamant that the final decision was theirs and often refused to communicate influences or failed to take notice of what they were. As participants began visualizing themselves at particular schools, they rationalized the fit with their desired factors and the offerings of their potential schools in the choice set. The campus visit was one of the activities participants engaged in when nearing their decision point; it was critical in understanding the idea of perceived fit. The idea of perceived fit uncovered during the campus visit was very visual and related heavily to the reoccurring campus theme of “beauty”:
I saw the campus when the sun was setting, and it just looked so beautiful there. We drove up there and we got there at like seven o’clock, and it was just so nice there.
… It’s a college campus and it was really, really great, and I could just really see myself there. (Linda).
The campus is gorgeous. (Robert)
It’s just a beautiful campus very nice and neat, and very pretty buildings. (Mary)
It’s just gorgeous over there; the campus is amazing. (David)
60
Atmosphere and social life were other factors that emerged as participants were beginning to get an idea of how they would fit at their institutions of choice:
I had a great time. It was a lot of fun and I really like the atmosphere of it. It still had the college atmosphere, but it was still really laid back and that’s what I kind of liked about it. (Sharon).
It really made a difference seeing campus life, and I think that was good that they invited you to that because I really enjoyed that. It wasn’t too crazy but it wasn’t old people laidback either. (Sharon)
We had a tour around campus once we got there, ate lunch, with, you know, all the students there. Pretty much they just told us the stats and the process and all that, and how daily life is. I just really fell in love with how it is over there. (Robert)
While comments of beauty, atmosphere, and the introduction of student life were attractive to the participants, it was this formation of their visual identity with the college of their choice as participants began this matching process.
Laura described her reaction to her visit to Mississippi State University and thoughts behind possible attendance there: “They’re happier (referring to the people) than [students at] other schools I have been to. They are more open and receiving of you and stuff. I think it is really true and says a lot that there [are] friendlier people at Mississippi State” (Laura). She also described the people she saw at the institution as those she wanted to “model herself after,” as she felt like they were “a better group of people to kind of grow up with” (Laura). Mary described the people at her desired institution as “more related. Everybody is nice”. Sharon also made comments regarding people at the institution as providing her with an idea of perceived fit:
Well, it was away from home but not too far away and just the people had really good attitudes there and they were really friendly. . . . It wasn’t a giant university but it wasn’t really small either so the size is really good for me. So that really drew me in, too. (Sharon)
Robert described the perceived fit as one of the most important factors to his decision: “Once I got there, I felt like I was at home, you know. Everyone treated me like family” (Robert). The participants experienced an emotional connection with the college of their choice and there was a perception of just “feeling right” to be there.
Discussion
Predisposition
In predisposition, the most widely used factors for deciding if college was right for the participant were economic and sociological. Economic factors in predisposition included the participants' SES
61
(combination of sociological and economic) and the concern of carrying debt after college. During predisposition, participants in this study worried their family income was inadequate to afford college. The find regarding economic factors was that even though their parents could afford to send them to college, participants were very driven to illustrate they contributed to college costs in some manner.
The predisposition stage is focused on understanding if they have the individual factors required to attend college. The participants were very involved in high school and took several advanced placement and dual enrollment classes to make them more competitive in the college admissions process. It is no surprise that their desire to attend college was higher, and these individual characteristics are consistent with both millennial characteristics and academic aptitude and achievement as predictors of the decision to go to college (Chapman, 1981; Jackson, 1982; Hossler & Gallagher, 1987; Paulsen 1990). Other individual factors, such as parental history with college, also supported previous models on college choice, which indicates the higher the attainment of the parents, the more likely their student is to attend college (Chapman, 1981; Jackson, 1982; Hossler & Gallagher, 1987).
Search
The search phase began with forming what Hossler and Gallagher (1987) referred to as student preliminary college values. Participants used limited information to develop a list of colleges they would attend based on their preliminary college values carried over from predisposition. Participants included their dream schools on their lists because they knew a great deal about these schools, often having attended athletic events, sports camps, or other activities at the institutions, and could easily visualize their life at this particular school. Therefore, the dream school was one of the first schools considered and remained fixed in their top five throughout their college choice processes. The dream school also matched many of the characteristics of college attractiveness that Paulsen (1990) put forth.
Hossler and Gallagher (1987) proposed that many of the students involved in the search process do not understand the net cost of attendance. While this was seen initially in the participants' interviews, as the progression through the search occurred, they were very much aware of the final cost of attending schools. Many of them ruled out private schools but did reconsider once they recognized the scholarship opportunities and the "true" net cost of attendance. As evidenced in previous studies on college choice, scholarships were seen as an influential factor in the participants' ultimate evaluation and narrowing down of their consideration sets (Chapman, 1981; Jackson, 1982; Hossler & Gallagher, 1987; Paulsen 1990).
If participants were searching for colleges of adventure, they relied heavily on sociological factors related to their overall academic and previous social backgrounds. Therefore, college characteristics that were desirable for them included a college that had their major, a decent reputation, and an excellent social life or an interesting surrounding town. If participants were searching for a college of comfort, social factors such as family income, proximity to home, and a positive view by their significant others were critical. Therefore, desirable college characteristics include having family
62
members nearby, offering their college majors, having high-quality faculty, and offering a more comfortable, smaller classroom environment.
Choice
According to Hossler and Gallagher (1987), the outcome of the choice stage is the evaluation and selection of an institution for enrollment for the student. The major factors present in this stage were economic and psychological. As participants had reached the final point in the process, economic and sociological factors gave way to psychological factors, which mingled with college characteristics to help participants make sense of their colleges of choice. For participants, this selection came down to a choice between a college that offered them a high-quality, economical college experience or a college that was comfortable for them in relation to cost, quality, size, location, and distance from home.
First, regarding programs, the participants in the study rarely veered from their ideas that a college should include the programs they wanted to study. In the choice phase, all of the participants' final choices had colleges with their intended majors. Second, the institution's size was generally based on whether they wanted the full college experience or something more comfortable. The top ranges of their choice sets included comfort colleges with fallback schools listed toward the bottom or vice versa for participants who wanted adventure. The selection of a college was ultimately between the same types of colleges forcing participants to default to other factors to use as top evaluative criteria. Fourth, in the final choice set, location had already been fleshed out from search, and the top choices of participants generally included a location that was comfortable to them, whether close to home or in a town that offered the college experience. Finally, the factors of social atmosphere, athletics, and quality were evaluated based on a visualization of their lives at college.
Participants would be expected to choose their dream school; however, many did not. Interestingly, when the dream school was not selected or did not select them, participants still felt connected and pledged their continued support. A denial of admission to the dream school often made the fallback school look more appealing to the participant. The fallback school was viewed as a way to remain close to home and fulfill their college education's basic needs or as an acceptable alternative to the dream school. On the rare occasion that participants visited their fallback school campus, perceptions were often changed, and comments related to the fallback school resembled the characteristics of the dream school. The most compelling development in this stage seemed to be the psychological factor of visualization of life at the school: picturing themselves living at the institution, interacting with the community, graduating from a program that provided quality education for their major, and being involved socially on campus. Comments of "It just feels right" and "I could really see myself here" were present in the final choice selection. Even participants who were being courted for athletics mentioned the importance of this visualizing process. Still, scholarship offers and college-courting activities of the institutions could persuade participants to make a choice. The decision of enrollment was a complicated one that seemed to rest on whether participants could see themselves attending the school in an affordable manner. Therefore, the visualization of college life was focused on how their personalities and attitudes reflected the perceived social environments and economic realities of the institutions. Thus, the personality of
63
the participant was a leading contributor in deciding which college was ultimately a better fit. Participants' personalities had to match up well with the social environments of economically attainable colleges. In addition, their attitudes on achievement and their outlooks on life were important in determining whether the colleges of comfort or the colleges of adventure best matched their characteristics and their understandings of perceived institutional fit.
Final Thoughts
Four additions or deviations from the traditional college choice model proposed by Hossler and Gallagher (1987) were uncovered in this study. First, participants visualized their careers and future very early. Each of them had a strong idea of what they wanted to do and accomplish after college graduation. From that point, each participant then matched sociological factors related to aptitude and the organizational factors of the institution (major offerings) to determine initial college options. This development was largely missing from college choice models and could be attributed to the millennial characteristics of achievement and optimism. Second, participants in this study did not give much consideration to college alternatives; however, they did formulate a fallback school as an alternative to going to their top college choices. The development of the fallback school is missing from Hossler and Gallagher's (1987) model of college choice, though fallback characteristics are consistent with college attractiveness as proposed by Paulsen (1990). Third, in predisposition, preliminary college values were formed based on individual and organizational (high school) factors. There was no mention of the early formation of college values based on previous experiences with colleges or universities. Each participant in this study had a dream school, and an idea of college life was partially derived from the connectedness to this school. Finally, in Hossler and Gallagher's (1987) model, some heavy reliance on viewbooks and traditional college publications as key sources of information exist; however, that was replaced by more in-depth conversations with admissions personnel and the very popular college Web site. This is likely a result of the tech-savvy characteristics of the millennial population and is consistent with Geyer and Merker’s (2011) findings on the desire for more technological consumption of information by prospective students.
Significance
The purpose of this study was to understand how juniors and seniors in high school make sense of their lived experiences with college choice. While extensive quantitative studies addressing the college choice process exist, few qualitative studies are available (Cooper, 2009; Gruber, 2004; Klein & Washburn, 2012). In addition, none of the qualitative studies looked directly at participants engaged in the process of college choice. Therefore, this study's approach was unique in how it approached the understanding of participants' college choice selections during the process rather than a reflection after selection. Furthermore, the study focused on a sample of the millennial generation, which was not of college age, during the formation and acceptance of Hossler and Gallagher’s (1987) model of college choice. This study is significant in that it provides avenues for colleges to target students based on the types of colleges they represent, and it further strengthens understanding of the most predominant factors used in processing information. Furthermore, the study reiterates the use of Hossler and Gallagher’s three-stage process while confirming what was foretold regarding Web sites and more technologically based consumption of information in college selection.
64
One of the big outcomes of this study was to uncover data from the participants that would help formulate a quantitative study on the meaning-making that occurs during the college choice process. The complexity of college choice is evident from this study. Still, future quantitative research on the relationship between search efforts of colleges by type (i.e., college of comfort, college of adventure, fallback, and dream school) and economic, psychological, and sociological evaluative criteria used by individuals could uncover results that could be generalized throughout the millennial population. A conjoint analysis could be conducted in partnership with a college to see how participants in various stages of the college decision-making process evaluate different featured attributes of marketing communication by colleges they are considering. Other quantitative research could focus on matriculation decisions based on types of marketing communication methods, such as handwritten letters or personal admissions counselor directives, to determine a cost-effective way to attract potential students. In addition, because of the important role of parents in the admissions process, future qualitative research could be conducted on the progression of students through the college process from the perspective of the parents.
References
Barnett, N. & Das, D. (2013). Unlocking the potential of the internet to improve college choice: A comparative case study of college-access web tools. Journal of Marketing for Higher Education, 23(1), 113-134.
Bergerson, A. (2009). Special issue: College choice and access to college: Moving policy, research and practice to the 21st century. ASHE Higher Education Report, 35(4), 1-141.
Bock, D., Pool, S., Joseph, M. (2014). Does branding impact student recruitment: A critical evaluation. Journal of Marketing for Higher Education, 24(1), 11-21.
Cabrera, A. & La Nasa, S. (2000). Understanding the college-choice process. New directions for institutional research, 107, 5-22.
Ceja, M. (2006, February 14). Understanding the role of parents and siblings as information sources in the college choice process of Chicana students. Journal of College Student Development, 47(1), 87-104.
Chapman, D. (1981). A model of student college choice. Journal of Higher Education, 52(5), 490-505. Chapman, R. G. (1986). Toward a Theory of College Selection: A Model of College Search and Choice Behavior. Advances in Consumer Research, 13(1), 246–250.
Clark, M. & Fine, M. (2016). Relationship quality in higher education marketing: The role of social media engagement. Journal of Marketing for Higher Education,27(1), 40-58.
Creswell, J. (2009). Research design: Qualitative, quantitative and mixed methods approaches.Thousand Oaks, CA: Sage.
DesJardins, S. L., Dundar, H., & Hendel, D. D. (1999). Modeling the college application decision process in a land-grant university. Economics of Education Review, 18(1), 117–132.
Flint, T. (1992). Parental and planning influences on the formation of college student choice sets. Research in Higher Education 33, 689-708.
Forbes L., & Vespil, E. (2013). Does social media influence consumer buying bhavior? An investigation of recommendations and purchases. Journal of Business & Economics Research, 11(2), 107-111.
65
Galotti, K. (1995). A longitudinal study of real-life decision making: Choosing a college. Applied Cognitive Psychology, 9(6), 459-484.
Hossler, D., & Gallagher, K. (1987). Studying student college choice: a three-phase model and the implications for policymakers. College & University, 62, 207-221.
Hossler, D., Braxonton, J. & Coppersmith, G. (1989). Understanding student college choice. In J. Smart (Ed.), Higher education: Handbook of theory and research, 231- 288. New York: Agathon Press.
Hossler, D., Schmit, J., & Vesper, N. (1999). Going to college: How social, economic, and educational factors influence the decisions students make. Baltimore, MD: John Hopkins Press.
Hoyt, J. & Brown, A. (2004). Marketing UVSC: How prospective students view the college. Retrieved 10/21/13 from www.uvu.edu/iri/documents/surveys_and_studies/collegechoice5.pdf
Huntington-Klein, N. (2018). College choice as a collective decision. Economic Inquiry, 56(2), 12021219.
Jackson, G. (1982). Public efficiency and private choice in higher education. Educational Evaluation and Policy Analysis, 4(2), 237-247.
Kinzie, J., Palmer, M, Hayek, J., Hossler, D., Jacob, S. & Cummings, H. (2004, September). Fifty years of college choice: Social, political, and institutional influences on the decision-making process. New Agenda Series, 5(3). Retrieved 10/18/2013 from http://www.luminafoundation.org/publications/Hossler.pdf
Litten, L.H. (1982). Different strokes in the applicant pool: Some refinements in a model of student college choice. Journal of Higher Education, 53(4), 383-402.
National Student Clearinghouse (2019). Fall 2019 current term enrollment estimates. Retrieved from https://nscresearchcenter.org/current-term-enrollment-estimates-2019/
Obermeit, K. (2012). Students' choice of universities in Germany: Structure, factors and information sources used. Journal of Marketing for Higher Education, 22(2), 206-230.
Paulsen, M. B. (1990). College Choice: Understanding Student Enrollment Behavior. ASHE-ERIC Higher Education Report No. 6. Retrieved from http://eric.ed.gov/?id=ED333855
Peruta, A., & Shields, A. B. (2017). Social media in higher education: Understanding how colleges and universities use Facebook. Journal of Marketing for Higher Education, 27 (1), 131 – 143.
Pooja, M., Black, J., Jiangmei, C., Berger, P., & Weinberg, B. (2012). The impact of social media usage on consumer buying behavior. Advances in Management, 5(1), 14-22.
Pringle, J., & Fritz, S. (2018). The university brand and social media: using data analytics to assess brand authenticity. Journal of Marketing for Higher Education, 29(1). 1 – 26. doi:10.1080/08841241.2018.1486345
Sago, Brad. (2010). The influence of social media message sources on millennial generation consumers. International Journal of Integrated Marketing Communications, 2(2), 7-18.
Shield, A., & Peruta, A. (2019). Social media and the university decision. Do prospective students even really care?. Journal of Marketing for Higher Education, 29(1), 67-83.
Smith, J., Flowers, P. & Larkin, M. (2009). Interpretive phenomenological analysis: Theory, method and research. London: Sage.
Stephenson, A., Heckert, D., & Yerger, D. (2015). College choice and the university brand: Exploring the consumer decision framework. Higher Education, 71(4), 489-503.
Teranishi, R., Ceja, M, Antonio, A., Recharde, W., Allen, P. & McDonough, M. (2004). The collegechoice process for Asian pacific americans: Ethnicity and socioeconomic class in context. The Review of Higher Education, 27(4), 527-551.
66
Themba, G., & Mulala, M. (2013). Brand-related eWOM and its effects on purchase decisions: An empirical study of university of Botswana students. International Journal of Business & Management, 8(8), 31-40.
Tierney, W. G., & Venegas, K. (2009). Finding Money on the Table: Information, Financial Aid, and Access to College. Journal of Higher Education, 80(4), 363–388.
Wang, X., Yu, C., & Wei, Y. (2012). Social media peer communication and impacts on purchase intentions: A consumer socialization framework. Journal of Interactive Marketing, 26, 198-208.
Weiler, W. C. (1994). Transition from consideration of a college to the decision to apply. Research in Higher Education, 35(6), 631–646. doi:10.1007/BF02497079
67
(2),
(ISSN 2640-7515).
John Griffith Emily Faulconer Embry Riddle Aeronautical University-Worldwide Campus
Introduction and Literature Review
This research has meaning to higher education learning institutions regarding faculty and staff motivation. Effectively motivating employees has captivated management theorists in search of higher morale and higher productivity. This study challenges the assumption by Hersey and Blanchard (1993) based on Lindahl’s (1949) study that supervisors do not know what their employees want from work.
Higher education has seen dramatic shifts in course delivery (more distance learning) organizational and economic structure in recent years, precipitated significantly by a global pandemic. Furthermore, there is a growing leadership bottleneck within higher education, with the average age of institution presidents increasing over the last few decades (Ebersole, 2014). This makes administrative focus on job satisfaction critical, both to improve faculty retention and bolster productivity. Effective leadership strategies can be critical to achieve this goal.
Herzberg’s two-factor theory of work motivation states that job satisfaction and dissatisfaction are affected by different factors and thus cannot be measured with a single scale (Hersey & Blanchard, 2008). In this theory, factors that influence feelings related to employment are divided into hygiene factors (e.g., supervisor quality and interpersonal relationships) and motivational factors (e.g., achievement and responsibility). Satisfaction of hygiene factors tend to decrease job dissatisfaction while satisfaction of motivation factors can increase job satisfaction. The basic tenets of this twofactor theory provide critical insight to managers so they can take targeted actions to increase the satisfaction and decrease dissatisfaction of employees. Theoretically, employers can use these factors to discover what each employee values, thus allowing them to customize motivation tactics. In fact, simply the act of collecting employee thoughts regarding hygiene and motivation factors can contribute to employee voice, improving job satisfaction (Alfayad, Arif, & Suriani, 2017; Hersey & Blanchard, 2008).
However, research suggests that supervisors may not really know what employees want from their jobs (Table 1), making it challenging for supervisors to properly motivate employees (Hersey and Blanchard 1993). All job aspects showed differences between what employees indicated they wanted from work and what supervisors thought employees wanted from work. This study was a springboard for the situational leadership model that focuses on the “readiness level of the employee” to determine how to motivate employees. A manager exercising situational leadership adjusts supportiveness and directiveness based on the situation and the motivation of the employee. This requires the manager to understand each employee’s characteristics to customize
Do Academic Supervisors Know What Their Employees Want from Work?
68
Journal of Higher Education Management, 37
68-79
© Copyright 2022 by the American Association of University Administrators. Permission to reprint for academic/scholarly purposes is unrestricted provided this statement appears on all duplicated copies. All other rights reserved.
the leadership style used in a situation. The situational leadership model has been applied to a variety of workplace settings, including the U.S. military, health care and information technology (Carlos Do Rego Furtado, et al., 2011; Irby, 2011). The implementation of situational leadership is strongly correlated with employee productivity (Silverthorne & Wang, 2001). Some research reports satisfaction as an intervening variable between situational leadership style and productivity (Setyorina, Yuesti, & Landra, 2018; Anggraini & Lo, 2020) while other research positively correlates situational leadership with satisfaction (Afshinpour, 2014).
Table 1
Assumed Rankings for Supervisors and Employees on What Workers Want from Their Jobs Supervisor
s
Workers Difference
Good working conditions 4 9 -5
Feeling “in” on things 10 2 8 Tactful disciplining 7 10 -3
Full appreciation for a job well done 8 1 7 Management loyalty to workers 6 8 -2
Good wages 1 5 -4 Promotion and growth with company 3 7 -4 Sympathetic understanding of personal problems 9 3 6 Job security 2 4 -2
Interesting work 5 6 -1 Note. Adapted from What Do Workers Want from Their Jobs”? (Hersey and Blanchard, 1993, p.50, Table 2-1) originally from Lindahl, “What Makes a Good Job?” Personnel, 25 January 1949). Because rankings were based on 1 being most important and 10 least important, positive numbers in the difference column mean that employees rated those factors more important than supervisors. Negative numbers in the difference column mean employees rated those areas as less important. Six of ten job aspects had differences of four or more between the two groups. The absolute value of change between the 1949 supervisor and employee survey respondents was 42.
Because higher education institutes have unique leadership structures (e.g. distributed hierarchy and shared governance), incentive schemes (e.g. tenure), and performance measures, situational leadership research from industry and service may not be generalizable to them (Black, 2015; Jones, Harvey, & Ryland, 2012). While higher education leadership frameworks (Astin & Astin, 2000; Bryman, 2007) can generally align with general leadership models (Kouzes & Posner,2007) some are exploring relevance of frameworks from other sectors, like wildlife conservation, to higher education (Black, 2015). Focusing on situational leadership in higher education, a study of 4 Pakistani universities reported that department heads tended to use selling and participating leadership styles and very rarely used telling and delegating leadership styles (Parveen & Tariq, 2014).
69
Leadership style in higher education influences employee perspectives (e.g. job satisfaction) and actions (e.g. leaving the institution). Leadership style has been correlated to employee satisfaction, with leader’s gender as a likely moderating variable (Parveen & Tariq, 2014). A separate study confirmed this relationship, noting that servant leadership style had the most positive impact on job satisfaction (Alonderiene, & Majauskaite, 2016). In a study specifically exploring dimensions of servant leadership, job satisfaction was strongly correlated to all six dimensions of servant leadership (Harris et al., 2016). Another study reported no relationship between the supervisor’s adaptability (range of leadership styles used) and employee turnover (Reed, 2021), supporting previous research that a wide style range does not guarantee leadership effectiveness. This study also reported a correlation between leadership effectiveness (selecting the appropriate leadership style for the situation and employee) and turnover. Pairing leadership style to employee needs is more important than demonstrating a wide range of leadership styles. It is important to note that employee age may be a moderating variable as a statistically significant relationship between age and overall job satisfaction (Saner & Eyüpoğlu, 2012).
Recognizing the need to develop leaders in academia, structured leadership development programs and conferences have been developed, including Higher Education Resource Services (HERS), which targets women faculty and administrators, and the Leadership in Higher Education Conference (White, 2011; Leadership, 2021). The question remains, though, whether these efforts have made a difference in supervisors’ ability to understand what their employees want from work. It can be argued that if such training and education can provide supervisors insight on what employees want from work, supervisors will have more knowledge and tools to help keep employees motivated and satisfied. This comparison uses data from the middle of the 20th century compared to survey data from 2019-2020 to determine if anything has really changed.
Hypotheses
Ha1. Supervisors will answer differently than employees regarding “Hygiene Factors” such as working conditions, good wages, tactful disciplining, management loyalty to workers and job security.
Ha2. Supervisors will answer differently than employees regarding “Motivators” such as feeling “in” on things, sympathetic understanding of personal problems, full appreciation for work well done interesting work, and promotion and growth.
Ha3. Supervisors who took the survey in 2019-20 will more closely align rankings with their employees than supervisors in 1949.
Methods
Participants. The population for this study were faculty and staff in supervisory and nonsupervisory positions within a college or university. About half of the respondents came from the “distance learning” campus of a university system. Data were gathered from participants and a university introductory leadership course and at an academic chairperson’s conference. Fifty survey
70
respondents self-reported their supervisory status as either supervisors or non-supervisors and completed the survey.
Demographic data. Survey respondents included 39 supervisors and 11 employees who worked in university settings. Seventeen respondents indicated they were faculty with 15 of those stating they were in supervisory roles. These responses were compared with data from a 1949 study by Lawrence Lindahl (1949) as reported by Hersey and Blanchard (1993) to determine if there were any differences in findings.
Design. The research design involved cross sectional survey data. Participants were assured of confidentiality. No remuneration was offered for their participating and that elect to opt out of the survey at any time. The survey design, distribution and data control were Institutional Review Board approved.
Treatment of the data. The first data analysis evaluated differences between supervisors and employee answers on 10 survey questions adapted from a Hersey Blanchard reported survey results (1993) of a 1949 study conducted by Lindahl. Rankings from the 1949 data were compared with the rank order determined by averaging scores for each job aspect from supervisors and employees of this study to identify if any differences existed.
2019-20 Survey data were also compared using a Mann-Whitney U statistic to determine if the two groups answered differently from each other on each job aspect to evaluate the hypothesis. Although a typical alpha for a study is .05, a Bonferroni corrected alpha (α=.005) was applied in testing the survey data gathered in this research because answers to each of the ten job aspects had an impact on how the remaining questions were answered. This adjustment was made to avoid any “Type 1” errors in hypothesis testing (Gay, Mills, & Airasian, 2009; Gould & Ryan, 2012). Comments of supervisors and employees were also examined to identify significant trends based on three open ended survey questions at the end of the survey.
Results
Quantitative
Data were evaluated to determine if supervisors and employees answered differently from each other on ranking 10 job aspects of working. The structure of the survey was that items raked lower were more important meaning the top ranked aspect of work was ranked 1 and the least important was ranked 10. The tables below show comparisons of different groups and how they ranked the 10 aspects of work.
Comparing Rankings. The difference column in tables 2, 3 and 4 show the difference in rankings. Table 2 shows how supervisors in 1949 ranked the 10 aspects of work compared to supervisors in this study’s 2019-2020 data. Aspects followed by an (H) are hygiene factors and those followed by (M) are motivators.
71
Table 2
1949 Results Compared to Rank Order of Supervisors In Current 2019-2020 Survey
Job Aspect Supervisors 1949 Supervisor s in 201920 Survey
Difference
Good working conditions (H) 4 2 2
Feeling “in” on things (M) 10 8 2
Tactful disciplining (H) 7 10 -3
Full appreciation for a job well done (M) 8 3 5
Management loyalty to workers (H) 6 7 -1
Good wages (H) 1 1 0
Promotion and growth with company (M) 3 4 -1
Sympathetic understanding of personal problems (M) 9 9 0
Job security (H) 2 5 -3
Interesting work (M) 5 6 -1
Note. 1949 supervisor rank – rank of supervisors who took the survey in this study summed in difference column. Because rankings were based on 1 being most important and 10 least important, positive numbers in difference column indicate supervisors in the 2019-20 study ranked the area as more important than supervisors in 1949. Negative differences in Rank indicate supervisors surveyed in this study rated the area as less important than supervisors in 1949.
Supervisors in the 2019-2020 survey ranked good working conditions, feeling “in” on things, and full appreciation for a job well done as more important job aspects than supervisors surveyed in 1949. Supervisors in the 2019-20 survey rated tactful disciplining, management loyalty to workers, promotion and growth with company, job security and interesting work as less important than supervisors in 1949. Nine of ten job aspects had differences of three or less between the two groups. The absolute value of changes between the 1949 and 2019-20 supervisor survey respondents was 18.
We also analyzed the differences between how employees in this study ranked the 10 job aspects and how employees in the Lindahl study responded in 1949. Aspects followed by an (H) are hygiene factors and those followed by (M) are motivators. Table 3 shows this comparison.
Employees surveyed in 2019-20 rated good working conditions, good wages, and promotion and growth with the company as more important than employees in 1949. 2019-20 survey takers rated feeling in on things, full appreciation for a job well done, sympathetic understanding of personal problems, job security and interesting work less important than employees in the 1949 study. It is interesting to note that in five job aspects had differences between four and six ranked places. The absolute value of rank changes between the 1949 and 2019-20 employee survey takers was 30.
72
We then compared how 2019-2020 survey respondents ranked the 10 aspects of work to determine what the differences were. These data are shown in Table 4.
Table 3
Employees in 1949 Compared to Employee Rank Order Surveyed in This Study Job Aspect Employee s 1949 Employees in 2019-20 Survey
Difference
Good working conditions (H) 9 3 6
Feeling “in” on things (M) 2 6 -4
Tactful disciplining (H) 10 10 0
Full appreciation for a job well done (M) 1 4 -3
Management loyalty to workers (H) 8 8 0
Good wages (H) 5 1 4
Promotion and growth with company (M) 7 2 5
Sympathetic understanding of personal problems (M) 3 7 -4
Job security (H) 4 5 -1
Interesting work (M) 6 9 -3
Note. 1949 employee rank – rank of employees who took the survey in this study summed in difference column. Because rankings were based on 1 being most important and 10 least important, positive numbers in difference column indicate employees in this study ranked the area as more important than employees in 1949. Negative differences in rank indicate employees surveyed in this study rated the area as less important than employees did in 1949.
Table 4
Employee and Supervisor Rank Order Comparison of Those Who Took the Survey in 2019-20
Job Aspect Supervisors Surveyed Employee s Surveyed Difference
Good working conditions (H) 2 3 -1
Feeling “in” on things (M) 8 6 2
Tactful disciplining (H) 10 10 0
Full appreciation for a job well done (M) 3 4 -1 Management loyalty to workers (H) 7 8 -1
Good wages (H) 1 1 0
Promotion and growth with company (M) 4 2 2
Sympathetic understanding of personal problems (M) 9 7 2
Job security (H) 5 5 0
Interesting work (M) 6 9 -3
Note. Supervisor rank order of those who took the survey in this study – rank order of employees who took the survey in this study summed in difference column. Because rankings were based on 1 being most important and 10 least important, positive numbers in difference column indicate employees in this study ranked the area as more important than supervisors in this survey. Negative differences in rank indicate employees surveyed in this study rated the area as less important than supervisors.
73
Employees ranked feeling in on things, promotion and growth with the company and sympathetic understanding of personal problems as more important aspects of work than supervisors. Employees ranked good working conditions, full appreciation for a job well done, management loyalty to workers and interesting work as less important job aspects than what was reported by supervisors. It is important to note that 9 of the 10 job aspects had rank differences of two or less with the highest difference being 3 places (interesting work). The absolute value of rank change between 2019-20 supervisors and employees was 12.
The final quantitative analysis evaluated the median differences of each job aspect between supervisors and employees who participated in the 2019-2020 survey. Aspects followed by an (H) are hygiene factors and those followed by (M) are motivators. These data are shown in table 5.
Table 5
Employee and Supervisor Survey Mann-Whitney U Test Results on Each Area
Job
Aspect
Estimated Difference in Median Rank
MannWhitney U
P Valu e
Good Working Conditions (H) 0 973.5 .628 Feeling “In” on Things (M) 1 1061 .119 Tactful Disciplining (H) 0 968.5 .646 Full Appreciation for a Job Well Done (M) 0 981 .759 Management Loyalty to Workers (H) 0 989.5 .915 Good Wages (H) 0 1013 .669 Promotion and Growth Within the Organization (M) 1 1029 .421 Sympathetic Understanding of Personal Problems (M) 1 1073 .064 Job Security (H) 0 1010 .723 Interesting Work (M) -1 960.5 .430 Note. N=50, (39 supervisors and 11 employees). Hypothesis was supervisor median – median of employees did not = 0. Positive differences in Estimated Median Rank indicate employees rated the area as more important than supervisors. Negative differences in Mean Rank indicate employees rated the area as less important than supervisors. None of the results were statistically significant (α=.005). There was not enough evidence to reject the any of the three null hypotheses evaluated in this study.
There were no statistically significant differences in median ranks between supervisors and employees when evaluated with the Mann-Whitney U statistic. Both research hypotheses were not supported. Responses from supervisors and employees regarding hygiene factors (working conditions, good wages, tactful disciplining, management loyalty to workers and job security) and motivators (feeling “in” on things, sympathetic understanding of personal problems, full appreciation for work well done, interesting work and promotion and growth) were statistically similar. Employees indicated a slightly higher importance (than supervisors) to feeling “in” on
74
things, promotion and growth within the organization and sympathetic understanding of personal problems. Employees rated interesting work as slightly less important than supervisors. However, none of the differences were statistically significant. These data suggest that supervisors in this study were well informed of the job aspects that were important to their employees.
Qualitative: Open ended survey results
Survey respondents were asked to comment on three areas: (1) Most important factor in their job, (2) Most important factor that would make a worker quit, and (3) Most important factor that would make most workers stay in their jobs. The three questions were answered by all 50 respondents. The top five responses on the most important factor for a job was respect, appreciation, security, working conditions and support. One respondent summed up this idea by saying:
“Acknowledgement of work done and accomplishments matter to workers. This is followed by growth” (Respondent 28). Another respondent (39) summed up their feeling by saying: “The most important factor a worker needs from their job is feeling like the work produced actually means something”.
The top four reasons why employees would leave their jobs were poor leadership or management (26 comments- by far the most comments for any of the three questions) followed by lack of respect or appreciation and working conditions. One respondent summed up this idea by writing:
When coping with work environment issues - unclear or inconsistent communication from management, hostility, or threatening tones between workers or from management, lack of cooperation towards a common goal, misalignment of stated goals/policy with practice - becomes unbearable (Survey Respondent 49).
The top five reasons a worker would stay at their current job were noted as, appreciation, good management, respect, support, and good working conditions. One respondent replied: “Feeling like they are appreciated, and their work is making a difference or an impact on the department and the goals that have been set forth” (Respondent 39). Another respondent stated: “In order for a worker to maintain the motivation and the drive to do good work for a company, they need to have a manager they believe in” (Respondent 4).
Discussion
A comparison of Tables 1 and 4 showed the ranks of supervisors in this study had a much better idea of what their employees wanted from work than supervisors in 1949. The absolute value of change between the 1949 supervisor and employee survey responses was 42 whereas the total difference in absolute value ranks was 12 for the 2019-20 survey respondents.
Tables 2 and 3 showed how views of supervisors and employees respectively changed over the past 70 years. When compared separately, supervisor ranks between the 1949 and 2019-20 survey results had an absolute value difference of 18, whereas employee ranks showed a difference of 30 between 1949 and 2019-20 survey responses. However, as mentioned earlier, 2019-20 survey
75
responses from supervisors and employees showed an absolute value difference of only 12 ranks. The Mann-Whitney U analysis on table 5 yielded no (statistically) significant differences between how employees ranked the 10 job aspects and how supervisors believed employees would rank those job aspects. The idea postulated by Hersey and Blanchard that supervisors did not know what employees wanted from work was supported in 1949 after Lindahl’s valuable study. However, results in this study indicate that current academic supervisors have a much better understanding than their 1949 counterparts. As such, the alternate hypotheses in this study were not supportedactually a positive is finding for supervisors and employees alike. Employee comments indicated that appreciation, respect, and good working conditions were the most important reasons to stay in a job. Respondents cited “poor management” as the number one reason why they would leave a job. Survey respondents indicated the main reasons to stay at an organization revolve around appreciation, respect, good management, and good working conditions. Most of these reflect arguments asserted by Hersey and Blanchard (1993) as a reason to explore management theories such as Herzberg’s two factor theory, the situational leadership model, servant leadership, and transformational vs transitional leadership theory.
Conclusions
The quantitative data indicated a shift in what employees wanted from work and a better understanding by supervisors of job aspects their employees value most. It was clear that supervisors in 1949 had less of an understanding of job aspects their employees valued than supervisors who completed the survey in this study in 2019 and 2020. The hallmark findings of the Hawthorne studies was employees improved performance because they knew someone (management) was watching them. The assumption is that management showed a “caring” for employees that translated into better performance. Employees continue to value appreciation and respect. Through education either at the university level, on the job or at conferences aimed at helping supervisors understand the job aspects their employees value can have great dividends on motivation. The lack of difference between the median ranks of employees and supervisors is in stark contrast to the results in Table 1 from the 1949 study. The words of the employees themselves in the open area comments reflect a desire for what Herzberg called “motivating factors” and what Maslow called “higher level needs”.
As seen in tables 2 and 3, employee assessment of the most important job aspects shift over time and there is no reason to expect that dynamic to change in the future. Leaders who continue to educate themselves and complete leadership training in their careers have a better chance of understanding what motivates their employees and will be more prepared to provide the correct support for their employees to be successful.
Limitations
Limitations of this study include the idea that the survey was given to academic leaders within either an introductory leadership course or an academic chairperson’s conference. In both instances it can be argued that supervisors in this study were exposed to current motivational theory which may have been reflected in their answers.
76
Generalization of these results should be made with caution due to the self-reporting nature of survey research. Although great care was taken to ensure objectivity, the results in this study reflect the views of the participants and should not be generalized beyond this group.
Factors employees desire in work environments may also be culture specific. Studies from other countries (other than the United States) may yield different results. For example, Bulgarian researchers found that academicians were more satisfied with salary, co-workers, promotion, operating procedures, and supervision, but dissatisfied with fringe benefits, contingent rewards, nature of work, and communication (Stankovska et al., 2017).
Recommendations
This study should be replicated in different college settings (community colleges, distance learning and primarily face to face universities) to determine if supervisors have a good understanding of what their employees want from work. The methodology of this study could be used on an expanded scale to determine if results can be replicated.
This study methodology could be useful in other industries beyond education. Motivating employees is a key part of management theory highlighting importance of such research. Gender and age should be a part of any research replications of this study. It is very conceivable that people of different genders may rank job aspects in a dissimilar way and have different points of view on what motivates employees.
References
Afshinpour, S. (2014). Leadership styles and employee satisfaction: A correlation study. International Letters of Social and Humanistic Sciences, 16, 156-169. https://www.ceeol.com/search/article-detail?id=111825
Alfayad, Z, Suriani, L. (2017). Employee voice and job satisfaction: An application of Herzberg’s twofactor theory. International Review of Management and Marketing, 7(1), 150-156. https://search-proquest-com.ezproxy.libproxy.db.erau.edu/docview/1875124226?pqorigsite=summon
Alonderiene, R., & Majauskaite, M. (2016) Leadership style and job satisfaction in higher education institutions. The International Journal of Educational Management, 30(1), 140-164. 10.1108/IJEM-08-2014-0106.
https://search-proquest-com.ezproxy.libproxy.db.erau.edu/docview/2105068970/7C028D800D E64E1DPQ/1?accountid=27203
Anggraini, D. A., & Lo, S. J. (2020) The role of Job satisfaction mediate the influence of situational leadership and career development on organizational citizenship behavior of BLU employees business capital management institutions marine and fisheries. Dinasti International Journal of Digital Business Management, 1(6). https://doi.org/10.31933/dijdbm.v1i6.592
Astin, A. W., & Astin, H. S. (2000). Leadership reconsidered: Engaging higher education in social change. Higher Education, 133. https://digitalcommons.unomaha.edu/slcehighered/133
Black, S. A. (2015). Qualities of Effective Leadership in Higher Education. Open Journal of Leadership, 4, 54-66. http://dx.doi.org/10.4236/ojl.2015.42006
77
Bryman, A. (2007). Effective Leadership in Higher Education: A Literature Review. Studies in Higher Education, 32, 693- 710. http://www.tandfonline.com/ http://dx.doi.org/10.1080/03075070701685114
Carlos Do Rego Furtado L., Da Graça Câmara Batista, M., & José Ferreira Silva, F. Leadership and job satisfaction among Azorean hospital nurses: An application of the situational leadership model. (2011). Journal of Nursing Management, 19, 1047–1057. https://onlinelibrary.wiley.com/doi/abs/10.1111/j.1365-2834.2011.01281.x
Ebersole, J. (2014). Top issues facing higher education in 2014. Forbs. https://www.forbes.com/sites/johnebersole/2014/01/13/top-issues-facing-higher-educationin-2014/?sh=3a4b981f7489
Gay, L. R., Mills, G. E., & Airasian, P. W. (2009). Educational research: Competencies for analysis and application (9th ed.). Pearson.
Gould, R. N., & Ryan, C. N. (2012). Introductory statistics. Pearson.
Harris, K., Hinds, L., Manansingh, S., Rubino, M., & Morote, S. (2016). What type of leadership in higher education promotes job satisfaction and increases retention? Journal of Leadership and Instruction, 15(1), 27-32. https://files.eric.ed.gov/fulltext/EJ1097552.pdf
Hersey, P., H., and Blanchard, K., H. (1993). Management of organizational behavior: Utilizing human resources (6th ed.). Prentice-Hall Inc.
Hersey, P., H., and Blanchard, K., H. (2008). Management of organizational behavior Utilizing human resources (9th ed.). Pearson Prentice-Hall Inc.
Irby, T. (2011). The situational leadership approach effects on employee motivation in multigenerational information technology organizations (3509273). [Doctoral Dissertation, University of Maryland]. ProQuest Dissertations Publishing. https://search.proquest.com/openview/4363bc032c863fcacc5563975f7301c3/1?pqorigsite=gscholar&cbl=18750&diss=y
Jones, S., Lefoe, G., Harvey, M., & Ryland, K. (2012). Distributed leadership: a collaborative framework for academics, executives and professionals in higher education. Journal of Higher Education Policy and Management, 34(1), 67-78. 10.1080/1360080X.2012.642334
Kouzes, J. M., & Posner, B. Z. (2007). The leadership challenge (4th ed.). Jossey-Bass Publishers. Leadership in Higher Education Conference. (2021). https://www.magnapubs.com/leadership-inhigher-education-conference/ Lindahl, L. (1949, January). What makes a good job? Personnel, 25, 263-266. Parveen & Tariq. (2014). Leadership style, gender, and job satisfaction, International Journal of Science and Research, 3(12), 1-6. https://www.ijsr.net/search_index_results_paperid.php? id=SUB14127
Reed, R. (2021). Higher education administrator turnover: An examination of situational leadership styles. College and University, 96(1), 2-12, 14-15. Retrieved from http://ezproxy.libproxy.db.erau.edu/login?url=https://www-proquestcom.ezproxy.libproxy.db.erau.edu/scholarly-journals/higher-education-administratorturnover/docview/2499098789/se-2?accountid=27203
Saner, T., & Eyüpoğlu, S. (2012). The age and job satisfaction relationship in higher education. Procedia, Social and Behavioral Sciences, 55(5), 1020-1026. https://doi.org/10.1016/j.sbspro.2012.09.593
Setyorini, R. W., Yuesti, A., & Landra, N. (2018). The Effect of Situational Leadership Style and Compensation to Employee Performance with Job Satisfaction as Intervening Variable at PT
78
Bank Rakyat Indonesia (Persero), Tbk Denpasar Branch. International Journal of Contemporary Research and Review, 9(08), 20974-20985. https://doi.org/10.15520/ijcrr/2018/9/08/570.
Silverthorne, C., Wang, T. (2001). Situational leadership style as a predictor of success and productivity among Taiwanese business organizations. The Journal of Psychology: Interdisciplinary and Applied, 135(4), 399-412. 10.1080/00223980109603707 https://www.tandfonline.com/doi/abs/10.1080/00223980109603707
Stankovska, G., Angelkoska, S., Osmani, F., Grncarovska, S., & Pandiloska, S. (2017, June). Job motivation and job satisfaction among academic staff in higher education. Annual International Conference of the Bulgarian Comparative Education Society (BCES) (15th) and the International Partner Conference of the International Research Centre (IRC) "Scientific Cooperation" (5th) (Borovets, Bulgaria. https://eric.ed.gov/?id=ED574225
White, J. S. (2012). HERS Institutes: Curriculum for advancing women leaders in higher education. Advances in Developing Human Resources, 14(1):11-27. 10.1177/1523422311429732.
79
Faculty Perceptions of the Essential Elements Of Leadership Across Generations and Sex
Seth Kastle Haley Moon Jeni McRay Fort Hays State University
Introduction
Higher education as an industry is in the midst disruptive change (Thompson & Miller, 2018). A turbulent environment coupled with the economic uncertainty of the last decade have left institutions with a diminished sense of security for the financial future (Hannay & Fretwell, 2011). This was true pre-Covid but is even more true now. To better confront the complex issues and problems facing contemporary institutions of higher education, it is important to understand how different stakeholders perceive effective leadership (Davis & Jones, 2014). It is widely accepted that leading in higher education simply isn’t the same as leading a Fortune 500 company (Buller, 2013). In fact, little research exists concerning the specific ways that faculty want to be led, so it is important to understand the range of opinions and experiences of faculty as they relate to perceptions of effective leadership, especially in terms of generational cohorts and biological sex.
Some research regarding generational expectations in the workplace exists in certain industries like health care, government agencies, hospitality, and manufacturing (Costanza, Badger, Fraser, Severt, & Gade, 2012; Gursoy et al., 2013; Joshi et al., 2011; Joshi, Dencker, Franz, & Matocchio, 2010) as does research measuring differences in perceptions of effective leadership between biological sexes (Cheng & Lin, 2012; Girard, 2010; Maxfield & Shapiro, 2010; Muchiri, Cooksey, Di Milia, & Walumbwa, 2011; Murray & Chua, 2012; Vezzosi, 2012; Walker, Ilardi, & McMahon, 1996). Higher education, however, has not been studied proportionally to other sectors in relation to leadership perceptions across the aforementioned demographics, especially among faculty. To assist in addressing this gap, an exploratory study was conducted at a Midwestern state university to measure the differences in faculty perceptions of essential elements of effective leadership between generational cohorts and biological sexes.
Currently, there are as many as four generations serving in faculty roles at institutions of higher education (Clark, 2017). A 2009 study indicated that the number of full-time faculty members at colleges and universities over the age of 70 increased three-fold since 1994 (Gilroy, 2009). Currently, institutions of higher education employ a greater proportion of persons over the age of 65 than do any other occupational group (Kaskie, 2016). As the number of female faculty members continues to rise, the cross section of diversity in the academy continues to expand (Shreffler, Shreffler, & Murfee, 2019). This increased diversity among faculty makes studying generational and gender perceptions of leadership an area in need of thorough investigation (Hannay & Fretwell, 2011; Heyns & Kerr, 2018).
80
Journal of Higher Education Management, 37(2), 80-96 (ISSN 2640-7515). © Copyright 2022 by the American Association of University Administrators. Permission to reprint for academic/scholarly purposes is unrestricted provided this statement appears on all duplicated copies. All other rights reserved.
Research has shown there are differences in leadership styles and workplace expectations across the generational spectrum (Salahuddin, 2010). Behaviors, attitudes, and values of generations are influenced by historical, economic, and social experiences (Angeline, 2011). Members of each generation enter the workforce with differing expectations of their employers in terms of what effective leadership means (Sujansky, 2004). This gap in behaviors, attitudes, and expectations is known as the generational divide (Teng, 2020). Leaders must engage followers in ways that align with their predisposed notions of effective leadership (Pierro, Kruglanski, & Raven, 2012).
Generational Cohort. The term generational cohort is explanatory terminology for particular age groupings with significant common experiences (Gilbaugh, 2009). Currently, researchers are able to define five generational cohorts: The Silent Generation, Baby Boomers, Generation X, Millennials, and Generation Z. The Silent Generation is comprised of the oldest individuals of all the generational cohorts ranging from those who were born in 1935 up through 1945 (Zickurh, 2010). Baby Boomers were born between 1946 and 1964 (Zickurh, 2010). Generation X includes individuals born between 1965 and 1976, followed by the Millennial cohort, born between 1977 and 1992. Finally, the youngest cohort is Generation Z, whose members include those born 1993 through present day (2021). Given the year in which this study was implemented, it is realistic to presume those in the Generation Z cohort are not employed as faculty members thus, this cohort was excluded.
Generational Cohorts and Leadership. The assessment of generational differences potentially affecting perceptions of leadership has been well documented (Busch, Venkitachalam, & Richards, 2008; Deal, Stawiski, Gentry, Graves, & Weber, 2013; Ferri-Reed, 2013; Gentry, Griggs, Deal, Mondore, & Cox, 2011; Gursoy, Geng-Qing Chi, & Karadag, 2013; Joshi, Dencker, & Franz, 2011; Murphy, 2012; Murray, 2011; Nelsey, & Brownie, 2012; Zickurh, 2010). In today’s multigenerational workforce, generations spanning from the Silent Generation to Millennials work side by side. This combination of generations and their expectations can be a significant source of organizational conflict. Generational cohorts typically hold differing perceptions of each other, potentially contributing to conflict and misunderstanding in the workplace (Meriac, Woehr, & Banister, 2010). Each generational cohort has established values and perceptions of leadership effectiveness (Gentry et al., 2011; Murray, 2011; Nelsey et al., 2012; Sessa, Kabacoff, Deal, & Brown, 2007; Taylor & Stein, 2014). An exploratory study conducted by Geng-Qing Chi et al. (2013) outlined the perceptions that hospitality employees have toward younger and older first line managers by generation cohort and job position across the generations. The findings supported the premise that there are significant differences in employees’ perceptions of younger and older managers.
A 2010 study by Meriac et al. which spanned 12 years and 1860 participants, reported different interpretations of similar experiences across generational cohorts. This study further demonstrated the differences and potential friction that can occur when multiple generations work together, especially in terms of communication style. Lack of knowledge concerning generational communication patterns can lead to confrontations and misunderstandings (Stevenson, 2020). Further, members of younger generations often hold high levels of ambition and desire to make a mark on the organization, which can be a source of conflict with older workers (Browne, 2021).
81
Biological Sex and Leadership Perceptions. Many attempts have been made to explain differences in leadership perceptions between males and females, but the findings have been equivocal (Murray & Chua, 2012). As leadership is a multifaceted process, it is exceedingly difficult to gauge the specific perceptions of different demographics (Crawford et al., 2005; Girard, 2010); therefore, the body of research is inconclusive and worthy of closer scrutiny.
Some studies have found males and females perceive elements of effective leadership differently (Muchiri, Cooksey, Di Milia, & Walumbwa, 2011). For example, studies on the use of authority show that males view authority as more critical to effective leadership as they are more likely to use positional power and authority than females (Rosner, 2011). Other studies found males to be more susceptible to influence and view its use in leadership as more necessary than do females (Girard, 2010; Vezzosi, 2012). In contrast, Cheng and Lin (2012) concluded that perceptions of emotional intelligence are not affected by biological sex. Maxfield and Shapiro (2010) conducted a study which resulted in similar findings but focused on perceptions of risk-taking.
A number of research studies have found biological sex differences consistent with differences in perceptions of leadership (Girard, 2010; Vezzosi, 2012; Walker et al., 1996). Other research found no notable differences in perceptions of leadership based on biological sex (Cheng & Lin, 2012; Maxfield & Shapiro, 2010). Currently, there is not agreement in published research regarding the role that biological sex plays in perceptions of effective leadership (Murray & Chua, 2012).
Essential Elements of Leadership
Leadership studies scholars have focused a great deal of attention on finding out what makes leadership effective. While it is difficult to name any elements of leadership as being essential to every situation, consistent themes across the discipline were identified for the purpose of this study. The construct of the essential elements of leadership used in this study was organically developed by analyzing textbooks and course materials currently being used by a leadership studies program at a regionally accredited institution as well as the National Leadership Education Research Agenda (NLERA) (Andenoro et.al, 2013; Boleman & Deal, 2008; Crawford et al., 2005; Carnegie, 1935; Chrislip & Larson, 1994; Goertzen, Kastle, Klaus, & Greenleaf, 2019; Hackman, 2002; Howell & Costley, 2006; Krzyzewski & Phillips, 2000; Lewis & D'Orso, 1999; Northouse, 2013).
All but one of the essential elements of leadership identified for this study can be found in the background/foundation of research priorities, the research priorities themselves, or in the applied outcomes of the NLERA. The only theme that was not included in the NLERA but included in this study was use of authority. It was included because of the autocratic nature embraced by members of the Silent Generation. This generation tends to value a top-down, chain-of-command style centered around use of authority (Kapoor & Solomon, 2011). This was a major part of the industrial leadership paradigm common during the Silent Generation’s formative years (Crawford et al., 2005). See Table 1 for an overview of the essential elements of leadership identified for this study.
82
Table 1
Essential Elements of Leadership – Overview Essential Element Definition Supporting Evidence
Influence
An interactive process in which people attempt to convince other people to believe and/or act in certain ways (Rost, 1993).
(Sassenberg & Hamstra, 2016); (Bélanger, Pierro, & Kruglanski, 2015); (Ahn et al., 2013); (Bode & Shah, 2014); (Yukl, 2008).
Promoting Teamwork
The ability to lead teams and the process of facilitation of teamwork (Hackman, 2002).
(Kootsookos, EdwardsHart, & Steiner, 2013); (Nelsey et al., 2012); (Sandoff & Nilsson, 2016)
Change
Facilitation
Refusing to accept the status quo, creation of a vision for future success, initiation of the change process, and sustaining the change (Crawford et al., 2005).
(Boleman & Gallos, 2011);(Kotter, 2012); (Mitchell, 2013); (Welch, 2005)
Use of Authority
A major element of Autocratic leadership. Autocratic leadership uses rules and regulations to control activities and relationships (Crawford et al., 2005).
(Kapoor & Solomon, 2011); (Northouse, 2012)
Collaborative Dialogue
Employee centered, participative, and socioemotionally oriented dialogue (Crawford et al., 2005).
Risk Taking Viewed through two different lenses: risk in demonstrating the will to confront and challenge and risk in empowerment and giving control for the purpose of
(Ferri-Reed, 2013); (Northouse, 2012); (Sassenberg & Hamstra, 2016)
(Maxfield & Shapiro, 2010); (Ridenour & Twale, 2005); (Everett, Homestead, & Drisko, 2007); (Brungardt & Crawford, 1999);
83
subordinate development (Crawford et al., 2005).
Followership An interactive role individuals play that compliments the leadership role and is equivalent to in importance for achieving organizational goals (Howell & Costley, 2006).
Emotional Intelligence
Ability, capacity, or skill to identify, assess, manage, and control the emotions of oneself, others, and groups (Ealais & George, 2012).
(Northouse, 2012)
(Rost, 1993); (Kouzes & Posner, 2007); (Cruz, 2014)
Ethical Behavior
Obeying the law and adhering to rules and regulations.
SelfAwareness
Understanding individual strengths and weaknesses in self (Rath & Conchie, 2008).
(Cooper, 1997); (Fitzgerald & Schutte, 2010); (Goleman, 1998)
(Crawford et al., 2005); (Rost, 1993); (Plinio, 2009)
(Maxwell, 2002); (Rath & Conchie, 2008); (Horowitz & Van Eeden, 2015)
Current Study
While there is a growing body of research regarding leadership across generational cohorts, very little exists that directly applies to faculty in higher education. Thus, the purpose of this study was to identify generational cohorts’ perceptions of essential elements of leadership held by faculty members at a Midwestern state university and bridge the defined gap between the study of generational perceptions of leadership and the specific vocation of teaching in higher education. Another focus of the study was to examine whether biological sex within each generational cohort of faculty affects perceptions of essential elements of leadership. This study provides a clearer understanding of the leadership perceptions of higher education faculty across the generational cohorts. Moreover, faculty and administrators who are perceived as leaders will benefit from understanding the perceptions of essential elements of leadership across the generation spectrum in the specific context of their vocation. In addition, researchers studying leadership will gain a better understanding of faculty perceptions of leaders. Those in leadership roles must understand their followers’ expectations if they are to fully engage their potential (Howell & Costley, 2006).
84
Research Questions
The difference in perceptions of essential elements of leadership crossing the generational spectrum is well documented (Busch et al., 2008; Deal et al., 2013; Dries & Peperman, 2008; FerriReed, 2013; Gentry et al., 2011; Gursoy et al., 2013; Joshi et al., 2011; Murphy, 2012; Murray, 2011; Nelsey & Brownie, 2012; Zickurh, 2010). The current study strived to examine the following research questions:
RQ1: What do faculty members at a Midwestern state university perceive to be essential elements of leadership?
RQ2: To what extent is there a difference in perceptions of essential elements of leadership across faculty generational cohorts (i.e., Baby Boomer, Generation X, and Millennial) at a Midwestern state university?
RQ3: To what extent are the differences in essential elements of leadership affected by biological sex among a Midwestern state university’s faculty of Baby Boomer, Generation X, and Millennial generations?
This quantitative study sought to identify the differences in perceptions of essential elements of leadership held by faculty members at a Midwestern state university. In addition, this study identified differences in perceptions of each of the three major generational cohorts to which faculty members belonged and examined the impact of biological sex within each of these generations on faculty members’ perceptions of essential elements of leadership.
Methods
Research Design. A quantitative methods research design was utilized in this study. Faculty members’ perceptions of the ten essential elements of leadership (influence, promoting teamwork, change facilitation, use of authority, collaborative dialogue, risk taking, followership, emotional intelligence, ethical behavior, and self-awareness) was identified as the dependent variable, with generational cohort (i.e., Baby Boomer, Generation X, and Millennial) and biological sex (male and female) acting as the independent variable. SPSS Statistics software was used to analyze these data. A Factorial Analysis of Variances (ANOVA) was used to investigate the research questions specific to this study.
Participants. Originally, 399 full time, domestic, on-campus faculty members at the Midwestern state university were recruited for this study. Following the screening procedures and excluding participants who completed less than or equal to 10% of the survey, the final sample include 105 individuals. Of these participants, 47 identified as male and 58 as female. In terms of generational cohorts, 43 were classified as Baby Boomers, 32 as Generation Xers, and 30 as Millennials. Finally, participants must have been teaching at least one face-to-face class on campus at the time of this study to qualify for participation.
85
Procedures. Following IRB approval, a link to The Essential Elements of Leadership Survey was sent to each eligible faculty member in a recruitment email using the Midwestern state university email system. Subjects were required to read the informed consent statement and acknowledge the voluntary nature of their participation prior to participating in the study. Participants were given a window of three weeks to participate in the study using the online assessment tool, Survey Monkey. During the survey window of availability, two additional emails were sent to all eligible participants reminding them of the survey and requesting their participation.
Materials. The Essential Elements of Leadership Survey consisted of two sections. The first section asked participants to convey perceptions of essential elements of leadership. The second section collected demographic information to ascertain the participant’s generational cohort and biological sex. Each of the participants self-identified the generational cohort to which he or she belonged, using the generational definitions from the Generations 2010 research study conducted by Zickurh (2010) of the Pew Research Center.
Additional demographic questions asked participants if they had ever served in the military and racial/ethnic background. These additional items were put in place to prevent participants from answering questions based on preconceived notions of how their generation or biological sex should behave. The first section of the Essential Elements of Leadership Survey used a 5-point-Likert scale (i.e., 5 = Strongly Agree, 4 = Agree, 3 = Neither Agree nor Disagree, 2 = Disagree, and 1 = Strongly Disagree) to measure participant responses. These responses allowed for a calculation of the average for each of the variables. Of the ten dependent variables in this study, seven required more than one survey item to measure the leadership element. Each time more than one survey item was used to measure a variable, an average was calculated.
To design the survey, the researcher consulted the NLERA and leadership textbooks currently being used by a leadership studies program at a regionally accredited institution (Boleman & Deal, 2008; Crawford et al., 2005; Carnegie, 1935; Chrislip & Larson, 1994; Goertzen, et al., 2019; Hackman, 2002; Howell & Costley, 2006; Krzyzewski & Phillips, 2000; Lewis & D'Orso, 1999; Northouse, 2010). The questions for the Essential Elements of Leadership Survey were developed using themes consistent across texts and the NLERA. All but one of the essential elements of leadership that were identified for this study can be found in the background/foundation of research priorities, the research priorities themselves, or in the applied outcomes of the NLERA. The only theme that was not included in the NLERA but included in this study was use of authority. It was included because of the autocratic nature largely embraced by members of The Silent Generation (Kapoor & Solomon, 2011).
Results
One sample t-tests were conducted to identify the extent to which faculty perceived each of the ten elements of effective leadership (p=.05), measured against a null value of 3. Results showed that all ten identified elements were deemed essential. See Table 2 for a complete list of descriptive information.
86
2
Leadership Element M SD
Self-Awareness 4.64 .45 Ethical Behavior 4.55 .65 Promoting Teamwork 4.54 .67 Followership 4.27 .51 Collaborative Dialogue 4.15 .80
Emotional Intelligence 4.14 .62 Change Facilitation 4.13 .68 Risk Taking 3.90 .73
Use of Authority 3.36 .65 Influence 3.20 .59
Note. M and SD represent mean and standard deviation, respectively.
Influence. A between subject’s 2x3 factorial ANOVA was conducted to assess all variables in this study. Two independent variables (generational cohort and biological sex) with two levels for the variable of biological sex (i.e., male and female) and three levels for the variable of generational cohort (i.e., Baby Boomer, Generation X, and Millennials) were tested to measure perceptions of influence as an essential element of leadership. Results indicate no significant main effect when examining generational cohort [F(2, 105) = 2.45, p = .09, partial η2 = .05] or biological sex [F(1, 105) = .05, p = .82, partial η2 = .001]. However, there was a significant interaction when examining the impact of generational cohort and biological sex on perception of influence as an essential element of leadership [F(2, 105) = 3.40, p = .04, partial η2 = .001]. Participants who identified as males and were part of the Millennial cohort (M=2.86, SD=.59) disagreed that influence was an essential element of leadership when compared to Millennial, female participants who remained neutral (M=3.17, SD=.37). See Table 3 for a complete list of descriptive information.
Promoting Teamwork. Two independent variables (generational cohort and biological sex) with two levels for the variable of biological sex (i.e., male and female) and three levels for the variable of generational cohort (i.e., Baby Boomer, Generation X, and Millennials) were tested to measure perceptions of promoting teamwork as an essential element of leadership. Results indicate no significant main effect when examining generational cohort [F(2, 105) = 1.13, p = .33, partial η2 = .02]. However, when examining biological sex, there was a significant main effect [F(1, 105) = 6.15, p = .02, partial η2 = .06] indicating those who reported they were female (M=4.76; N=58) indicated higher agreement with promoting teamwork as essential element of leadership when compared to male (M=4.52; N=47) participants. Although results indicate a statistically significant main effect, the difference between biological sex means are in close proximity of one another, suggesting the practical significance may be minimal. Moreover, these main effects were not qualified by a significant interaction [F(2, 105) = .33, p = .72, partial η2 = .01].
Table
87
Table 3
Means and standard deviations for influence as a function of a 2(biological sex) X 3(generational cohort) design Generational Cohort
Baby Boomer Generation X Millennial Biological Sex M SD M SD M SD
Male 3.22 .47 3.39 .51 2.86 .59
Female 3.32 .41 3.05 .59 3.17 .37
Note. M and SD represent mean and standard deviation, respectively.
Change Facilitation. Two independent variables (generational cohort and biological sex) with two levels for the variable of biological sex (i.e., male and female) and three levels for the variable of generational cohort (i.e., Baby Boomer, Generation X, and Millennials) were tested to measure perceptions of change facilitation as an essential element of leadership. Results indicate no significant main effect when examining generational cohort [F(2, 105) = 1.23, p = .30, partial η2 = .02] and biological sex [F(1, 105) = .55, p = .46, partial η2 = .01]. The lack of main effect on generational cohort and biological sex resulted in no significant interaction [F(2, 105) = .30, p = .74, partial η2 = .01].
Authority. Two independent variables (generational cohort and biological sex) with two levels for the variable of biological sex (i.e., male and female) and three levels for the variable of generational cohort (i.e., Baby Boomer, Generation X, and Millennials) were tested to measure perceptions of authority as an essential element of leadership. Results indicate no significant main effect when examining generational cohort [F(2, 105) = .45, p = .64, partial η2 = .01] and biological sex [F(1, 105) = 1.55, p = .22, partial η2 = .02]. The lack of main effect on generational cohort and biological sex resulted in no significant interaction [F(2, 105) = 1.40, p = .25, partial η2 = .03].
Collaborative Dialogue. Two independent variables (generational cohort and biological sex) with two levels for the variable of biological sex (i.e., male and female) and three levels for the variable of generational cohort (i.e., Baby Boomer, Generation X, and Millennials) were tested to measure perceptions of collaborative dialogue as an essential element of leadership. Results indicate no significant main effect when examining biological sex [F(1, 105) = .09, p = .77, partial η2 = .001]. However, there was a main effect when examining generational cohort [F(2, 105) = 3.68, p = .03, partial η2 = .07], indicating Baby Boomer participants (M=4.51; N=43) reported a higher level of agreement when viewing collaborative dialogue as an essential element of leadership when compared to Generation Xers (M=4.36; N=32) and Millennials (M=4.15; N=30). Although results do show there is a statistically significant main effect, the difference between generational cohort means are in close proximity of one another, suggesting the practical significance may be minimal. Finally, these main effects were not qualified by a significant interaction [F(2, 105) = 1.56, p = .22, partial η2 = .03].
88
Risk Taking. Two independent variables (generational cohort and biological sex) with two levels for the variable of biological sex (i.e., male and female) and three levels for the variable of generational cohort (i.e., Baby Boomer, Generation X, and Millennials) were tested to measure perceptions of risk taking as an essential element of leadership. Results indicate no significant main effect when examining generational cohort [F(2, 105) = 1.09, p = .34, partial η2 = .02] and biological sex [F(1, 105) = .96, p = .41, partial η2 = .01]. The lack of main effect on generational cohort and biological sex resulted in no significant interaction [F(2, 105) = .70, p = .50, partial η2 = .01].
Followership. Two independent variables (generational cohort and biological sex) with two levels for the variable of biological sex (i.e., male and female) and three levels for the variable of generational cohort (i.e., Baby Boomer, Generation X, and Millennials) were tested to measure perceptions of followership as an essential element of leadership. Results indicate no significant main effect when examining generational cohort [F(2, 105) = 2.16, p = .12, partial η2 = .04] and biological sex [F(1, 105) = 1.31, p = .26, partial η2 = .01]. The lack of main effect on generational cohort and biological sex resulted in no significant interaction [F(2, 105) = 1.20, p = .31, partial η2 = .02].
Emotional Intelligence. Two independent variables (generational cohort and biological sex) with two levels for the variable of biological sex (i.e., male and female) and three levels for the variable of generational cohort (i.e., Baby Boomer, Generation X, and Millennials) were tested to measure perceptions of emotional intelligence as an essential element of leadership. Results indicate no significant main effect when examining generational cohort [F(2, 105) = .03, p = .97, partial η2 = .001] and biological sex [F(1, 105) = .10, p = .76, partial η2 = .01]. The lack of main effect on generational cohort and biological sex resulted in no significant interaction [F(2, 105) = .36, p = .70, partial η2 = .01].
Ethical Behavior. Two independent variables (generational cohort and biological sex) with two levels for the variable of biological sex (i.e., male and female) and three levels for the variable of generational cohort (i.e., Baby Boomer, Generation X, and Millennials) were tested to measure perceptions of ethical behavior as an essential element of leadership. Results indicate no significant main effect when examining biological sex [F(1, 105) = .48, p = .49, partial η2 = .01]. However, there was a main effect when examining generational cohort [F(2, 105) = 3.58, p = .03, partial η2 = .07], indicating Baby Boomer participants (M=4.81; N=43) reported a higher level of agreement when viewing ethical behavior as an essential element of leadership when compared to Generation Xers (M=4.67; N=32) and Millennials (M=4.55; N=30). Although results do show there is a statistically significant main effect, the difference between generational cohort means are in close proximity of one another, suggesting the practical significance may be minimal. Finally, these main effects were not qualified by a significant interaction [F(2, 105) = 1.22, p = .30, partial η2 = .02].
Self-Awareness. Two independent variables (generational cohort and biological sex) with two levels for the variable of biological sex (i.e., male and female) and three levels for the variable of generational cohort (i.e., Baby Boomer, Generation X, and Millennials) were tested to measure perceptions of self-awareness as an essential element of leadership. Results indicate no significant main effect when examining generational cohort [F(2, 105) = 1.48, p = .23, partial η2 = .03] and
89
biological sex [F(1, 105) = .05, p = .83, partial η2 = .000]. The lack of main effect on generational cohort and biological sex resulted in no significant interaction [F(2, 105) = .43, p = .65, partial η2 = .01].
Discussion
Leadership is a highly contextual, multifaceted construct and is dependent on numerous situational factors (Arbinger Institute, 2010; Blanchard & Miller, 2009; Crawford et al., 2005; Kotter, 2012; Kouzes & Posner, 2007; Northouse, 2010). While this study was exploratory in nature and is limited in generalizability, results nonetheless provide valuable insight for those employed in institutions of higher education. Results assist in framing how administrators in higher education are trained as related to follower interaction. Staff and administrators at all institutional levels interact with faculty on a regular basis and therefore need to understand how faculty perceive elements of effective leadership. This can include onboarding, professional development workshops and mentorship programs, specifically in the context of the essential elements of leadership.
A key finding of this study was that generational cohort and biological sex have an extraordinarily minor impact on faculty perceptions of the essential elements of leadership. This is counter to current literature, which generally deals only with perceptions of generations or biological sexes, or it supports differences in perceptions between both generations and biological sexes (Browne, 2021; Girard, 2010; Stevenson, 2020; Vezzosi, 2012). There is a gap in literature specifically related to how generational cohorts and biological sexes of university faculty perceive leadership. This study also addresses a gap in the literature that relates to faculty perceptions of specific elements of leadership in higher education contexts and converges around which elements of leadership are deemed essential. This research will assist in guiding those who wish to explore similar variables as it relates to leadership perceptions.
As stated, results of this study affirmed that while marginally significant differences existed between generational cohorts of faculty members, and the difference between biological sexes within generational cohorts, all perceived leadership in a comparable way. These results can provide institutional trainers, current leaders, and mentors within institutions with insight into the population they are teaching, training, and mentoring. The application of this knowledge can assist in the continued pursuit of institutional effectiveness.
The practices of the most successful leaders involve gaining an in-depth understanding of their followers (Howell & Costley, 2006). Information gained from this study can assist in the leadership education process in higher education contexts. Sharing the results of this study with the state regents or other institutional governing bodies could work to benefit all state and regional universities The structure of the academic arm of institutions of higher education is in many cases similar. Faculty report to departmental chairs, deans, the provost, and then the president. These leaders can benefit from awareness of leadership elements faculty perceive as important.
Implications for Future Research
90
The findings of this study contribute to the literature surrounding effective leadership of faculty. No single study can investigate all facets of this topic. As such, the following recommendations for future research are provided.
1. Further development and validation of the Essential Elements of Leadership Survey to improve reliability, including allowing for qualitative responses to provide more in-depth analysis of faculty perceptions.
2. Replication studies comparing results across various Carnegie Classification in order to compare faculty perceptions from different institutions.
3. Replication across additional demographic areas (e.g. staff/administrator, geography, discipline, and/or learning modalities).
Conclusion
Higher education is experiencing massive shifts in a peri-COVID world, one of which includes the next generation of faculty members are beginning to emerge from terminal degree programs (Krishnamurthy, 2020). For leaders in contemporary higher education to thrive, understanding how followers perceive effective leadership today is as important as ever. Leadership is one of the most observed but least understood of all human behaviors and is contingent upon many situational factors (Burns, 1987; Fiedler, 1965). Generational cohort, biological sex, as well as education level, organizational context, and industry of employment all impact perceptions of leadership. Therefore, the results of this study must be considered within the context of the population studied.
Collectively, the three generations of faculty members studied asserted congruent perceptions, affirming the essential elements of leadership. In addition, there were minimal biological sex differences concerning perceptions of the essential elements of leadership. The population of this study represented a small contingent of the larger population of higher education faculty members. While the results of this study reflected similar perceptions about the importance of essential elements of leadership across generational cohorts and biological sexes, it is important that conclusions from the study be viewed within the context in which they were studied.
References
Ahn, J., Weng, C., & Butler, B. S. (2013). The dynamics of open, peer-to-peer learning: What factors influence participation in the P2P University? 46th Hawaii International Conference on System Sciences https://doi.org/10.1109/HICSS.2013.515
Andenoro, A. C., Allen, S. J., Haber-Curran, P., Jenkins, D. M., Sowcik, M., Dugan, J. P., & Osteen, L. (2013). National leadership education research agenda 2013-2018: Providing strategic direction for the field of leadership education. Association of Leadership Educators. http://leadershipeducators.org/ResearchAgenda
91
Angeline, T. (2011). Managing generational diversity at the workplace: Expectations and perceptions of different generations of employees. African Journal of Business Management, 5(2), 249–255. https://doi.org/10.5897/AJBM10.335
Bélanger, J. J., Pierro, A., & Kruglanski, A. W. (2015). Social power tactics and subordinates’ compliance at work: The role of need for cognitive closure. Revue Européenne de Psychologie Appliquée, 65(4), 163–169. https://doi.org/10.1016/j.erap.2015.05.001
Blanchard, K., & Miller, M. (2009). The Secret: What great leaders know and do (2nd ed.). BerretKoehler.
Bode, L., & Shah, D. V. (2014). Political influence across generations: partisanship and candidate evaluations in the 2008 election. Information Communication and Society, 17(2), 184–202. https://doi.org/10.1080/1369118X.2013.872162
Boleman, L., & Deal, T. (2008). Reframing organizations: Artistry, choice, and leadership. Jossey Bass.
Boleman, L., & Gallos, J. V. (2011). Reframing academic leadership. Jossey-Bass.
Browne, I. (2021). Exploring Reverse Mentoring; “Win-Win” Relationships in The Multi-Generational Workplace. International Journal of Evidence Based Coaching and Mentoring, 246–259. https://doi.org/10.24384/jkc9-2r51
Buller, J. L. (2013). Positive academic leadership. Jossey-Bass.
Burns, J. M. (1987). Leadership. Free Press.
Busch, P., Venkitachalam, K., & Richards, D. (2008). Generational differences in soft knowledge situations: Status, need for recognition, workplace commitment, and idealism. Knowledge and Process Management, 15(1), 45–58.
Carnegie, D. (1935). How to win friends and influence people. Simon & Scheuster.
Cheng, M., & Lin, Y. (2012). The effect of gender differences in supervisors’ emotional expression and leadership style on leadership effectiveness . African Journal of Business Management, 6(9), 3234–3245. https://doi.org/10.5897/AJBM11.1705
Chrislip, D. D., & Larson E., C. (1994). Collaborative Leadership: How Citizens and civic leaders can make a difference. Jossey-Bass.
Clark, K. R. (2017). Managing multiple generations in the workplace. Radiologic Technology, 88(4), 379–396.
Cooper, R. K. (1997). Applying emotional intelligence in the workplace. Training and Development, 51(12), 31–39.
Costanza, D. P., Badger, J. M., Fraser, R. L., Severt, J. B., & Gade, P. A. (2012). Generational differences in work attitudes: A meta-analysis. Journal of Business and Psychology, 27, 375–394. https://doi.org/10.1007/s10869-012-9259-4
Crawford, Brungardt, & Maughan. (2005). Understanding leadership: Theories & concepts. John Wiley & Sons.
Creswell, J. W., & Knight, V. (2014). Research design: qualitative, quantitative, and mixed methods approaches (4th ed.). Sage.
Cruz, J. (2014). Great leaders inspire great followership. Leadership Excellence, 31(8), 48.
Davis, H., & Jones, S. (2014). Letter from the guest editors The work of leadership in higher education management. 36(4), 367–370.
Deal, J. J., Stawiski, S., Gentry, W. A., Graves, L., & Weber, T. J. (2013). Motivation at work: Which matters more, generation or managerial level? Consulting Psychology Journal: Practice and Research, 65(1), 1–16. https://doi.org/10.1037/a0032693
92
Dries, N., & Peperman, R. G. (2008). Exploring four generations’ beliefs about career: Is “satisfied” the new “successful”? Journal of Managerial Psychology, 23(8), 907–928. https://doi.org/10.1108/02683940810904394
Everett, J. E., Homestead, K., & Drisko, J. (2007). Frontline worker perceptions of the empowerment process in community based organizations. Social Work, 52(2), 161–170. https://doi.org/10.1093/sw/52.2.161
Ferri-Reed, J. (2013). Leading a multi-generational workforce: Learning to leverage the uniqueness of each age group. The Journal For Quality and Participation, 35(1), 1–3.
Fiedler, F.E. (1965). Engineering the job to fit the manager. Harvard Business Review, 43(5), 115-122. http://psycnet.apa.org/psycinfo/1968-06217-001
Fitzgerald, S., & Schutte, N. S. (2010). Increasing transformational leadership through enhancing self-efficacy. Journal of Management Development, 29(5), 495–505. https://doi.org/10.1108/02621711011039240
Geng-Qing Chi, C., Maier, T. A., & Gursoy, D. (2013). Employees perceptions of younger and older managers by generation and job category. International Journal of Hospitality Management, 34, 42–50. https://doi.org/10.1016/j.ijhm.2013.01.009
Gentry, W. A., Griggs, T. L., Deal, J. J., Mondore, S. P., & Cox, B. D. (2011). A comparison of generational differences in endorsement of leadership practices with actual leadership skill level. Consulting Psychology Journal: Practice and Research, 63(1), 39–49. https://doi.org/10.1037/a0023015
Gilbaugh, P. (2009). Supervision of intergenerational dynamics. In University of Iowa School of Social Work (Ed.), National Resource Center for Family Centered Practice.
Gilroy, B. M. (2009). the Graying. The Education Digest, 18, 62–64.
Girard, T. (2010). The role of demographics on the susceptibility to social influence: A pretest study. Journal of Marketing Development and Competitiveness, 5(1), 9–22.
Goertzen, B.J., Kastle, S.D., Klaus, K., & Greenleaf, J. (2019). Discovering the leader within: Learning through service (2nd ed.). Avaialbe from: https://www.fhsu.edu/leadership/studentresources/discoveringtheleader
Goleman, D. (1998). Guidelines for best practice How to improve your emotional intelligence. Training and Development, 52(10), 28–30.
Gursoy, D., Geng-Qing Chi, C., & Karadag, E. (2013). Generational differences in work values and attitudes among frontline and service contact employees. International Journal of Hospitality Management, 32, 40–48. https://doi.org/10.1016/j.ijhm.2012.04.002
Hackman, R. J. (2002). Leading teams: Setting the stage for great performances. Harvard Business School Publishing.
Hannay, M., & Fretwell, C. (2011). The higher education workplace: Meeting the needs of multiple generations. Research in Higher Education Journal, 10, 1–12.
Heyns, M. M., & Kerr, M. D. (2018). Generational differences in workplace motivation. SA Journal of Human Resource Management, 16, 1–10. https://doi.org/10.4102/sajhrm.v16i0.967
Horowitz, D. S., & Van Eeden, R. (2015). Exploring the learnings derived from catalytic experiences in a leadership context. SA Journal of Human Resources Management, 13(1), 1–10. https://doi.org/10.4102/sajhrm.v13i1.598
Howell, J. P., & Costley, D. L. (2006). Understanding behaviors for effective leadership (2nd ed.). Pearson Education.
93
Hunziker, S., Johanson, A., Tschan, F., Semmer, N. K., Rock, L., Howell, M. D., & Marsch, S. (2011). Teamwork and Leadership in cardiopulmonary resuscitation. Journal of American College of Cardiology, 57(24), 2381–2388. https://doi.org/10.1016/j.jacc.2011.03.017
Joshi, A., Dencker, J. C., Franz, G., & Matocchio, J. J. (2010). Unpacking generational identities in organizations. Academy of Management Review, 35(3), 392–414.
Kapoor, C., & Solomon, N. (2011). Understanding and managing generational differences in the workplace. Worldwide Hospitality and Tourism Themes, 3(4), 308–318. https://doi.org/10.1108/17554211111162435
Kaskie, B. (2017). The academy is aging in place: Assessing alternatives for modifying institutions of higher education. The Gerontologist, 57(5), 816–823. https://doi.org/10.1093/geront/gnw001
Kootsookos, A., Edwards-Hart, T., & Steiner, T. (2013). Student design teams: How are teamwork and leadership negotiated? AAEE Annual Conference
Kotter, J. P. (2012). Leading change. Harvard Business School Press.
Kouzes, J., & Posner, B. (2007). The leadership challenge (4th ed.). John Wiley & Sons.
Krishnamurthy, S. (2020). The future of business education: A commentary in the shadow of the Covid-19 pandemic. Journal of Business Research, 117(May), 1-5. https://doi.org/10.1016/j.jbusres.2020.05.034
Krzyzewski, M., & Phillips, D. T. (2000). Leading with the heart: Coach K’s successful strategies for basketball, business, and life. Warner Business Books.
Lewis, J., & D’Orso, M. (1999). Walking with the wind: Memoir of a movement. Mariner Books.
Maxfield, S., & Shapiro, M. (2010). Gender and risk: women, risk taking and risk aversion. Gender in Management: An International Journal of Education Management, 25(7), 586–604. https://doi.org/10.1108/17542411011081383
Maxwell, J. C. (2002). Your roadmap for success workbook. Thomas Nelson Inc. Meriac, J. P., Woehr, D. J., & Banister, C. (2010). Generational differences in work ethic: An examination of measurement equivalence across three cohorts. Journal of Business Psychology, 25(2), 315–324. https://doi.org/10.1007/s10869-010-9164-7
Muchiri, M., Cooksey, R., Di Milia, L., & Walumbwa, F. (2011). Gender and managerial level differences in perceptions of effective leadership. Leadership and Organization Development Journal, 32(5), 462–492. https://doi.org/10.1108/01437731111146578
Murphy, W. M. (2012). Reverse mentoring at work: Fostering cross generational learning and developing millennial leaders. Human Resource Management, 51(4), 549–574. https://doi.org/10.1002/hrm.21489
Murray, A. (2011). Mind the gap: Technology, millennial leadership, and the cross generational workforce. The Australian Library Journal, 60(1), 54–65. https://doi.org/10.1080/00049670.2011.10722556
Murray, D., & Chua, S. (2012). Differences in leadership styles and motives in men and women: How generational theory informs gender role congruity. European Conference on Management, Leadership & Governance, 192–199.
Nelsey, L., & Brownie, S. (2012). Effective leadership, teamwork and mentoring: Essential elements in promoting generational cohesion in the nursing workforce and retaining nurses. Collegian, 19, 197–202. https://doi.org/10.1016/j.colegn.2012.03.002
Northouse, P. G. (2012). Introduction to leadership: Concepts and practice (2nd ed.). SAGE Publications.
Northouse, P. G. (2013). Leadership: Theory and practice (6th ed.). SAGE Publications.
94
Pierro, A., Kruglanski, A. W., & Raven, B. H. (2012). Motivational underpinnings of social influence in work settings: Bases of social power and the need for cognitive closure. European Journal of Social Psychology, 42(1), 41–52. https://doi.org/10.1002/ejsp.836
Plinio, A. J. (2009). Ethics and leadership. International Journal of Disclosure and Governance, 6(4), 277–283. https://doi.org/10.1057/jdg.2009.20
Rath, T., & Conchie, B. (2008). Strengths based leadership: Great leaders, teams, and why people follow. Gallup Press.
Ridenour, C. S., & Twale, D. J. (2005). Academic generations exploring intellectual risk taking in an educational leadership program. Education, 126(1), 158–164.
Robles, M. M. (2012). Executive Perceptions of the Top 10 Soft Skills Needed in Today’s Workplace. Business Communication Quarterly, 75(4), 435–465. https://doi.org/10.1177/1080569912460400
Rosner, J. B. (2011). Ways women lead. In Leadership, gender, and organization (pp. 19–29). Springer.
Rost, J. (1993). Leadership for the twenty-first century. Praeger Publishers.
Salahuddin, M. M. (2010). Generational differences impact on leadership style and organizational success. Journal of Diversity Management, 5(2), 1–6.
Sandoff, M., & Nilsson, K. (2016). How staff experience teamwork challenges in a new organizational structure. Team Performance Management: An International Journal, 22(7/8), 415–427. https://doi.org/10.1108/TPM-05-2016-0021
Sassenberg, K., & Hamstra, M. R. W. (2016). The intrapersonal and interpersonal dynamics of selfregulation in the leadership process. Advances in Experimental Social Psychology, 55(June). https://doi.org/10.1016/bs.aesp.2016.08.001
Sessa, V., Kabacoff, R., Deal, J., & Brown, H. (2007). Generational differences in leader values and leadership behaviors. The Psychologist Manager Journal, 10(1), 47–74. https://doi.org/10.1080/10887150709336612
Shreffler, M. B., Shreffler, J. R., & Murfree, J. R. (2019). Barriers to Advancement of female faculty in higher education: An examination of student evaluations of teaching, work-family conflict and perceived organizational support. Journal of Higher Education Theory and Practice, 19(8), 72–86. https://doi.org/10.33423/jhetp.v19i8.2673
Stevenson, C. N. (2020). Communicating across the generations: Implications for higher education leadership. In Five Generations and Only One Workforce: How Successful Businesses Are Managing a Multigenerational Workforce (pp. 93–122). IGI Global.
Sujansky, J. (2004). Leading a multigenerational workforce. Occupational Health & Safety, 73(4), 16–17.
Taylor, C. M., & Stein, L. (2014). Stories of generational leadership: Women higher education administrators voices. Advancing Women in Leadership, 34, 1–10.
The Arbinger Institute. (2010). Leadership and self deception: Getting out of the box (2nd ed.). Berrett-Koehler Publishers, Inc.
Thompson, S. A., & Miller, K. L. (2018). Disruptive trends in higher education: Leadership skills for successful leaders. Journal of Professional Nursing, 34(2), 92–96. https://doi.org/10.1016/j.profnurs.2017.11.008
Vezzosi, E. (2012). Gender, generations, leadership. Journal of American History, 99(3), 835–838. https://doi.org/10.1093/jahist/jas489
95
Walker, H., Ilardi, B., & McMahon, A. (1996). Gender, interaction, and leadership. Social Psychology Quarterly, 59(3), 255–272.
Welch, J., & Welch, S. (2005). Winning. HarperCollins.
Yukl, G. (2008). How leaders influence organizational effectives. The Leadership Quarterly, 19(6), 708–722. https://doi.org/10.1016/j.leaqua.2008.09.008
Yukl, G. (2012). Leadership in organizations (8th ed.). Prentice Hall.
Zickurh, K. (2010). Generations 2010. Pew Research Center. http://www.pewinternet.org/2010/12/16/generations-2010/
96
of Higher Education Management, 37(2), 97-102 (ISSN 2640-7515). © Copyright 2022 by the American Association of University Administrators. Permission to reprint for academic/scholarly purposes is unrestricted provided this statement appears on all duplicated copies. All other rights reserved.
Transferability to a Four-Year Institution: A Focus on An Urban Community College’s School of Business
Dan Hornick George Hummer Jeffery L. Wilson Virginia Commonwealth University
Introduction
In the realm of post-secondary educational institutions, community colleges are unique. They differ from four-year institutions in that they tend to enroll a rather diverse group of learners. These learners come from various economic and social backgrounds, have a host of different reasons for enrolling, and exhibit a wide range of academic skills (Ma & Baum, 2016). To achieve academic success, community college students often need additional attention and support (Wang, 2012). This reality can be difficult for community college faculty and staff to manage. Unfortunately, community college students’ difficulties sometimes increase when they decide to transfer to a fouryear institution (Lockwood, Hunt, Matlack, & Kelley, 2013).
A multitude of factors can adversely impact transfer students’ academic success at four-year schools. These factors include both internal and external forces. It is therefore imperative for community colleges to find ways to improve students’ transferability. In fact, community college students can have a successful transition to four-year institutions if they receive necessary supports (Ma & Baum, 2016). These supports include mentoring, academic advising, and remedial coursework (Crisp, 2010; Skinner, 2014; St, John, 2018). Additionally, transfer students also benefit from aligned instructional and assessment practices (Syed & Mojock, 2008).
Leaders at an urban community college, Unity Community College (UCC), recognize the impact highquality assessment practices can have on preparing students for the transition to NUU, a four-year institution. Yet they have identified the alignment of assessment and data-driven decision making as an area of concern in their School of Business. To help address this issue, the study sought to utilize assessment data for the purpose of improving instructional practices and, subsequently, student learning outcomes.
Literature
Students who choose to pursue post-secondary education often struggle with the transition to college. Researchers note that some students struggle with the academic expectations of postsecondary work.
97
Journal
Academic Skill Levels and Transfer Shock
A key theme that emerged from the interviews was the identification of UCC students’ academic skills levels. Research suggest that many community college students, due to a series of internal and external factors, lack certain academic skills to be successful at the four-year institution level. This theme was prevalent throughout the interview responses. NUU Professor 1 noted that the overwhelming majority of students who seek additional help or tutoring outside of regular class times are transfer students. In addition, Professor 1 stated that transfer students struggle mainly with “study habits certainly; but really a knowledge of how to study [and] how to learn…I found so many just don't know how to learn, don't know how to initiate their own learning.”
Supports for Transfer Students
In accordance with the literature review, the interview responses reinforced the premise that community college transfer students can be successful at four-year institutions if provided with appropriate supports. Supports for UCC transfer students currently being implemented include classroom and remedial supports, supports during the summer, and dissemination of information.
Classroom and remedial supports. NUU Professor 1 highlighted the importance of finding ways to help transfer students access classroom content. The professor stated that for “each individual student who takes the initiative to come ask for help…I give them the best in the way of time.” The professor also noted that “there are some fundamentals, [like] how to learn to learn…to gain mastery,” which are key to student success. To help achieve these goals, this professor holds special tutoring sessions outside of class time to help students access the curriculum.
Supports during the summer. A key theme in the literature review was that some community college students need to enroll in remedial coursework to improve their chances for academic success at the post-secondary level (Altbach et al., 2011). NUU Professor 2 echoed the importance of these classes by noting that NUU offers courses during the summer that are designed to help transfer students get prepared for the fall semester. The professor noted that these courses are primarily “filled with transfer students, which helps them…meet other transfer students [and] get a little bit more of an intimate setting because the classes are smaller.” Further, the instructor takes steps to ensure that transfer students “are engaged and active [and] getting some experience of learning.” The authors learned that a key outcome of the summer coursework was to improve transfer students’ communication skills. Specifically, NUU Professor 2 asserted that “we would use capstone courses to look at their writing, for example, and their presentation skills; so I think it's an interesting idea to align assessment practices from a community college to a four-year institution”
Improving Transfer Student Success
A number of interviewees discussed recommendations for supporting transfer students. These recommendations address the following areas: academics, self-efficacy, and summer program improvements.
98
Academics. It is not surprising that a key area in need of continued support is academic skills. A vital academic skill is the ability to effectively manage time. NUU Professor 3 noted that transfer students need specific guidance with time management because they often “seem particularly busy with work and sometimes families, and getting their time or attention is difficult.” On the other hand, NUU Professor 2 made a recommendation that centered on transfer students’ writing and presentation skills. The professor said, “I'd like to see a portfolio of their work…or have them take a placement…not a placement test, but write a placement essay, for example, so that I…get a sense of where they're strong [and] where they're not.” Additionally, NUU Professor 2 maintained that problem-based, capstone-style coursework can be used to improve students’ presentation skills. Essentially, this knowledge could help NUU faculty determine more targeted strategies for helping students develop their writing.
Another facet of academics is the importance of advising. As cited in the literature review, effective advising can help reduce transfer shock and improve student success rates. NUU Staff Member 1 noted that UCC students should be advised to complete as many credits as possible at the community college level that will transfer to a four-year institution. Specifically, this staff member highlighted the importance of UCC students completing their transfer degree before transferring to NUU. UCC Professor 1 discussed the importance of having up-to-date information when advising students. This professor noted that “it would be helpful if NUU had a little brochure describing the business fields [students] could major in once they transfer.” It is important to note that the UCC business administration transfer degree is a liberal arts program comprised of multiple general education courses and a few foundational business courses, particularly accounting and economics. Therefore, UCC Professor 1 said that “students have little idea of the fields they could branch out into at the university level such as management, marketing, finance, and other levels.” To help combat a lack of information, NUU introduced an idea called major maps in fall 2018. These maps highlight pathways students can access through each academic major. NUU Staff Member 1 indicated that the impetus for this program was the need to connect and engage transfer students before their first semester begins. Overall, the authors maintain that these recommendations are aligned with the researched-based practice of ensuring that transfer student have access to pertinent information.
Self-efficacy. Another key theme of the literature review was the importance of student selfefficacy. The main precept of self-efficacy is that students need to have confidence and resilience in order to persevere through difficulty (Bandura, 2012). NUU Professor 2 commented, “I really think that giving students emotional resilience and focusing on the idea of professionalism can really help them when they get here [NUU]…Students starting out as a transfer…come in thinking maybe I'm less than the four-year students.” To combat this sentiment, NUU Professor 2 asks students to interview a professional worker, in any field, with at least ten years of experience. Using the framework of the Hero’s Journey, the professor instructs students to “explore how adversity makes people grow and change; and they learn through these interviews that…everybody's gone through some…bumps in the road and it’s okay that they too have done the same thing.”
99
Assessment Development
The literature revealed that assessment development can play a vital role in transfer student success (Syed & Mojock, 2008). This sentiment aligned with interview responses, as many interviewees discussed assessment development. The development of assessments at NUU and UCC, and the impact of assessments on instruction are discussed in this section.
Vertical Articulation between UCC and NUU
Through the literature review process, many sources alluded to the fact that transfer student success rates can be improved when educators at community colleges and four-year institutions have open and consistent dialogue (Laanan et al., 2011). This type of vertical articulation between faculty members can facilitate greater alignment in curricula and assessments and help eliminate gaps in transfer students’ knowledge and skills. However, the interviewees indicated that vertical articulation is not currently happening. It is important to note that all respondents were open to the possibility of having more formalized dialogue between UCC and NUU educators.
Preparing for transfer. Through the literature review process, the authors found that high-quality assessments can help prepare transfer students for the rigors of coursework at four-year institutions. In all, 15 respondents discussed the role of assessments in preparing for transfer. Respondent 45 maintained that assessments at UCC have showed “me how hard and challenging a college can be but also helping me be ready.” Similarly, Respondent 31 asserted, “The assignments have prepared me with time management [and] prioritizing [skills]…I think these skills are…needed to continue my education at a 4-year university or college.”
Disconnect between high school and college expectations
In the transition from high school to college, there is a disconnect between the expectations of college professors and the content being taught at the high school level. In their five-year study of 4,500 community college students, Porchea, Allens, Robbins, and Phelps (2010) found that academic preparation in high school is key to post-secondary success. Because student academic success in high school is an accurate predictor of post-secondary preparedness, high school courses must be rigorous and challenging. Students do not benefit from courses that promote rote memorization, recall of facts, or low-level analysis of themes. Unfortunately, many high school classes fall into this category (Venezia & Jaeger, 2013). While it is true that some high school courses such as Advanced Placement or International Baccalaureate do push students to reason and think critically, a relatively small number of graduates enroll in these types of classes. It is therefore not surprising that many high school graduates do not qualify as being college ready on indicators such as the SAT, ACT, or National Assessment of Educational Progress (NAEP) (Venezia & Jaeger, 2013).
The impact of post-secondary structure on student performance
Another reason incoming students struggle is that college is, overall, less structured than what they had experienced in high school. Further, students are faced with the reality of having to
100
independently make decisions, enhance their abilities to manage time and money, and develop new social networks (Taylor, Doane, & Eisenberg, 2014). Students who decide to move away from home to attend college encounter additional challenges of having more autonomy and less parental or guardian oversight (Cleary et al., 2011). Essentially, many incoming college students are thrust into more of an adult role, often before they are ready. This reality can have adverse ramifications for students.
Specifically, the added stress that many college students feel increases the potential for mental health issues. These issues often stem from the pressure caused by time management, academic, and extracurricular responsibilities. Yet many post-secondary institutions do not have the necessary resources, such as counselors or strong parent-school connections, to provide sufficient assistance to these students (Cleary et al., 2011). Students are at an even greater risk of suffering mental health issues if they have not built a sufficient peer or social support network (Taylor et al., 2014). In light of the struggles and issues some college students will face, it is not surprising that the national 6-year graduation rate for 2011 college enrollees was only 56.9% (Shapiro et al., 2017). Unfortunately, community college students often face even more significant academic challenges; thus, it is imperative to discuss the basic profile of community college students.
References
Altbach, P.G., Gumport, P.J., & Berdahl, R.O. (2011). American higher education in the twenty first century: Social, political, and economic challenges. Baltimore, MD: John Hopkins University Press.
Bandura, A. (2012). “On the functional properties of perceived self-efficacy revisited.” Journal of Management. 38(1), 9-44.
Cleary, M., Walter, G., & Jackson, D. (2011). Not always smooth sailing: Mental health issues associated with the transition from high school to college. Mental Health Nursing, 32(4), 250254.
Crisp, G. (2010). Impact of mentoring on the success of community college students. The Review of Higher Education, 34(1), 39-60.
Laanan F.S., Starobin, S., & Eggleson, S.T. (2010). Adjustment of community college students at a four-year university: Role and relevance of transfer student capital for student retention. J. College Student Retention, 12(2), 175-209.
Lockwood, P., Hunt, E., Matlack, R. & Kelley, J. (2013). From community college to four-year institution: A model for recruitment and retention. Community College Journal of Research and Practice, 37(8), 613-619. DOI: 10.1080/10668921003677191.
Ma, J., & Baum, S. (2016). Trends in community colleges: Enrollment, prices, student debt, and completion. College Board Research, 1-23.
Porchea, S., Allen, J., Robbins, S. & Phelps, R. (2010). Predictors of long-term enrollment and degree outcomes for community college students: Integrating academic, psychosocial, sociodemographic, and situational factors. The Journal of Higher Education, 81(6), 680- 708. DOI: 10.1080/00221546.2010.11779077.
Shapiro, D., Dundar, A., Huie, F., Wakhungu, P.K., Yuan, X., Nathan, A. & Bhimdiwali, A. (2017). Completing college: A national view of student completion cates – fall 2011 Syed, S. & Mojock, C.R. (2008). Assessing community college student learning outcomes:
101
Where are we? What's next? Community College Journal of Research and Practice, 32(11), 843856. DOI: 10.1080/10668920802432691.
Taylor, Z.E., Doane, L.D., & Eisenberg, N. (2014). Transitioning from high school to college: Relations of social support, ego-resiliency, and maladjustment during emerging adulthood. Emerging Adulthood, 2(2), 105-115.
Venezia, A., & Jaeger, L. (2013). Transitions from high school to college. The Future of Children, 23(1), 117-136.
Wang, X. (2012). Factors contributing to the upward transfer of baccalaureate aspirants beginning at community colleges. The Journal of Higher Education, 83(6), 851-875. DOI: 10.1080/00221546.2012.11777272.
102
Journal of Higher Education Management, 37(2), 103-126 (ISSN 2640-7515). © Copyright 2022 by the American Association of University Administrators. Permission to reprint for academic/scholarly purposes is unrestricted provided this statement appears on all duplicated copies. All other rights reserved.
A Mixed Methods Approach to Understanding College Students’ Experiences Throughout the
COVID-19 Pandemic
Sarah Y. T. Hartzell Megan E. LaMotte Molly Hagen Paul Devereux University of Nevada, Reno
Mental health of college students is a complex issue and has been a major concern of researchers for decades. Since the late 1990s, rates of depression and suicidality have increased among college students (Howard et al., 2006) and recent research finds one in four students have a diagnosed mental illness (Chen et al., 2019). Many college students do not receive mental health treatment for their symptoms (Rosenthal & Wilson, 2008) so it is likely more have undiagnosed mental illness.
One causal factor to mental illness among college students may be exposure to stressors (e.g., academic, financial, or social stressors). High and/or chronic exposure to stressors can manifest into psychological distress, substance abuse problems, physical health issues and mental illness (Howard et al., 2006). The Stress Process Model (Pearlin et al., 1981; Turner, 2013) explains that mental health outcomes are largely impacted by the combination of stressors one is exposed to and the coping resources available to buffer the negative effects of stressors. However, the Stress Process Model is concerned with one other preceding factor: social status. The model predicts that people with socially disadvantaged statuses (e.g., racial/gender/sexual minorities and people with low SES) will have greater exposure to stressors, fewer coping resources, and subsequently worse mental health outcomes than people with socially advantaged statuses (Pearlin et al., 1981; Turner, 2013).
Although the Stress Process Model suggests racial differences should be evident in mental illness among college students, findings are mixed. Some results indicate black, indigenous, and students of color (BISOC) have the same or lower rates of common mental illnesses than White students (Chen et al., 2019; Eisenberg et al., 2007; Garlow et al., 2008; Liu et al., 2018). Although, important exceptions are apparent in these studies. For example, multiracial students tend to report higher levels of mental illness, suicidal ideation, and suicide attempts than Whites and Asian students have been found to report greater suicidal ideation and attempts than Whites (Chen et al., 2019; Liu et al., 2018). Another recent large-scale study found BISOC had higher rates of mental illness than White students (Hunt et al., 2019). Overall, these results indicate that race is an important factor to understanding the mental health of college students.
Impacts of the COVID-19 Pandemic
Current research on college student’s mental health is needed urgently as the coronavirus pandemic has caused widespread societal disruption, especially for universities. In Spring of 2020,
103
universities switched from in-person to remote instruction to reduce COVID-19 transmissions (Viner et al., 2020).
Early evidence indicates rates of mental health issues among U.S. college students such as stress and anxiety have increased at a faster rate compared to before the pandemic (Son et al., 2020). Students cited concerns of health-related stressors (health of their own and loved ones), academic stressors (concern over academic performance), and social stressors (decreased social interaction; Son et al., 2020). A large-scale national survey of college students in Fall 2020 found 40% of students had moderate or severe depression, 34% had clinical anxiety, and only half of those students had received therapy or treatment (Eisenberg et al., 2021). Further, 83% of the students reported that emotional and mental difficulties during the pandemic affected their academic performance (Eisenberg et al., 2021).
Clearly, being a college student through a pandemic is stressful, but it may be even more stressful for BISOC. In the U.S., COVID-19 has disproportionately affected black, indigenous, and people of color. CDC data from the early months of the pandemic revealed Black and Latino people were three times more likely to be infected by COVID-19 than White people, and two times more likely to die from COVID-19 than Whites (Oppel Jr. et al., 2020). The pandemic has also negatively impacted BISOC’s academic and financial lives. For example, Molock and Parchem (2021) found almost half of BISOC reported disruptive changes in their academic performance, educational plans, and financial situation since the beginning of the pandemic. Unfortunately, this research did not compare rates among BISOC to White students, so it is unclear whether BISOC are disproportionately impacted by these stressors. Gillis and Krull (2020), however, found barriers to online instruction were expressed more frequently among non-White and first-generation college students than White and non-firstgeneration students. Further, during the initial transition to online remote learning in the Spring 2020 semester, underrepresented minority students (i.e., African American, Native American/Alaska Native, and Hispanic/Latino) reported higher rates of issues such as lacking an effective/functional workspace, lacking access to necessary electronic devices, increased distractions from schoolwork, and negative impacts on education due to increase in family duties compared to other students (Hartzell et al., 2021). A longitudinal study found that Black and multiracial college students had the highest levels of perceived stress and general anxiety symptoms in July 2020 compared to White college students (Hoyt et al., 2020).
Rationale for the Current Study
Whereas stress and mental health among college students are highly researched topics, these topics have not been thoroughly examined in the context of a global pandemic. As summarized here, there has been research conducted on college students during the COVID-19 pandemic, but due to the nature of researching a current event, most is preliminary, largely descriptive, and subject to change. A gap in the literature remains pertaining to the relationships between stressors mental health outcomes during the pandemic, how they are experienced by students in their daily lives through this time, and how universities can intervene to positively impact students. Additionally, research thus far has focused more on students’ stress and mental health with less attention to how they are coping during this time, an equally important topic in understanding students’ experiences during the pandemic. Additionally, there needs to be more research to
104
determine recommendations on what universities can do to ease the negative consequences a pandemic can have on students’ stress and mental health.
Study Aims and Research Questions
Our mixed methods study aimed to better understand how COVID-19 impacted college students. We drew from the Stress Process Model (Pearlin et al., 1981; Turner 2013), which indicated key variables under study should be social status, exposure to stressors, coping resources, and mental health. Due to mixed evidence that racial disparities exist among college students’ mental health outcomes and the alarming racial disparities in COVID-19 outcomes, we focus on race rather than other social statuses (see Figure 1 for conceptual model).
The primary aim of the quantitative component was to measure the relationships between COVID19 stressors, mental health outcomes, and race at the beginning of the pandemic. The research questions were:
1. Is race associated with exposure to pandemic-related stressors?
2. Is race associated with mental health outcomes?
3. Is exposure to pandemic-related stressors associated with mental health outcomes?
The primary aim of the qualitative component was to better understand the lived experiences of college students throughout the pandemic. The research questions were:
1. What are college students’ struggling with during the pandemic and how do those things impact their mental health?
2. How are college students coping with those stressors and mental health impacts?
3. What are the potential racial disparities experienced in college life?
4. What are students’ opinions on the university administration’s actions and policies in response to the pandemic?
Methods Study Design
We conducted a sequential mixed methods design with two points of interface (Guest, 2012) and used integration between the quantitative and qualitative components to answer our study’s primary aim (See Figure 2 for a study timeline). The first point of interface involved consideration of the quantitative findings to determine the focus and implementation of the qualitative component. The second point of interface involved integrating the quantitative and qualitative results. This study received approval from the university’s Institutional Review Board.
Quantitative Component
Data Collection – The study site was a midsized Western public university that offers undergraduate, graduate, and medical academic programs. As previously mentioned, we used data
105
Figure 1. Conceptual model linking race/ethnicity, COVID-19 related stressors, coping resources, and mental health using the Stress Process Model

collected in May of 2020 by Hartzell et al. (2021) via a cross-sectional, online questionnaire (66 items) using Qualtrics (Qualtrics, Provo, UT). During this time, the university had transitioned to a completely online learning environment and students were not allowed on campus due to the pandemic. Students were randomly selected to participate, and the inclusion criteria required participants to be 18 years or older, currently enrolled at the university, and either graduate or undergraduate students. More details on how the data were collected can be found in Hartzell et al. (2021) and Hagen et al. (2021).
The survey collected information on student’s exposure to COVID-related stressors (academic, health and financial), mental health (depression and anxiety), other COVID-related variables (time spent researching COVID-19, knowledge of COVID-19-related information, social distancing behavior, and activity level) and demographics (age, household size, class standing, gender).
Stressors were all binary variables defined as either present or not present, therefore we created count variables of the number of academic, health, and financial stressors one was exposed to, as well as a total count variable (range 0-15). To assess the mental health of students, we measured presence and frequency of depressive symptoms and anxiety symptoms using the PHQ-8 (Kroenke & Spitzer, 2002; range 0-24) and GAD-7 (Spitzer et al., 2006; range 0-21), respectively. We also
106
Figure 2. Study timeline.

107
transformed these scores to binary variables indicating whether someone could be considered for clinical depression or clinical anxiety (scores of ≥ 10) or not (scores of < 10).
Students reported their race and were able to choose more than one racial identity, composing the “multi-racial” category. Post hoc, we dichotomized race as White vs. BISOC (including multiracial individuals who identify as white and any other race) consistent with our a-priori research questions and hypotheses. We considered examining differences among sub-groups of the non-white category, but small cell sizes precluded this analysis. Dichotomizing race allowed us to maintain adequate sample sizes for the statistical tests.
Analysis – We performed all analyses using SPSS software Version 28 (SPSS Inc, Chicago, IL, USA). We used independent sample t-tests and chi-square tests of independence for analyses of racial differences in exposure to stressors and mental health outcomes. We also tested for potential racial differences in demographic variables and other COVID-related variables to assess if they were needed as statistical controls in analyses. Most of these variables had non-normal distributions (COVID-19 knowledge, time spent researching COVID-19, social distancing behavior, age, and class standing) so we conducted Mann Whitney U tests. Pearson bivariate correlations defined the relationship between all continuous variables, such as the stressor scales (academic, health and total), depression scores, anxiety scores, other COVID-related variables, and some demographic variables. To gain a better understanding of how individual stressors impact mental health, we used independent sample t-tests to evaluate differences in depression and anxiety between students who experienced each individual stressor relative to those who did not experience it. Additionally, chi-square tests of independence tested whether dichotomous mental health outcomes (having clinical levels of anxiety and depression or not) were associated with exposure to individual stressors.
Due to the large number of significance tests being conducted, we used a Bonferroni adjusted alpha level of 0.002 to determine significance of the t-tests and chi-square analyses to control the overall Type I error rate (Field et al., 2012). Unfortunately, the repercussion of controlling the Type I error rate means we are more likely to miss a significant difference if one existed, i.e., Type II error rate is increased (Field et al., 2012).
Qualitative Component
Data Collection – During this time, there were some courses offering a hybrid option (a mix of online and in-person classes), all the buildings were open on campus, and students could be on campus if they abided by COVID-19 guidelines (e.g., wearing masks and socially distancing). Participants were recruited through a convenience sample by recruiting eight professors from three departments at the university to advertise the study to their classes with an option to include an incentive of extra credit for participation. Interested students filled out a brief questionnaire with their contact information, availability, and information needed to stratify the group interviews including race, academic well-being (copied from the original quantitative study) and mental wellbeing (K6 distress scale; Kessler et al., 2003). Students were stratified by both race (White or BISOC) and mental/academic well-being (struggling or thriving) resulting in the following categories for
108
group interviews: (1) White-struggling students, (2) White-thriving students (3) BISOC-struggling students, and (4) BISOC-thriving students.
We used Zoom (Zoom Video Communications Inc., San Jose, CA, USA) to record conversations with the students’ cameras turned off and full names removed (replaced with a nickname) in order protect their anonymity in the recordings. The group interviews lasted approximately 1 hour. We had difficulty with attendance, so four group interviews ended up being one-on-one interviews with individual students.
At least one researcher was present in the Zoom meetings to ask questions, use probes, take observational notes, and handle the Zoom technical features. Four main questions were asked: (1) Are there things you are struggling with when it comes to your education during this pandemic? (2) What has been helping you during this time? (3) Do you think the impacts from the COVID-19 pandemic have been harder for students of color than for White students? (4) What other resources do you think the university should provide to help you and other students during this time?
Analysis – Group and one-on-one interviews were recorded and transcribed by Zoom. We cleaned and coded the clean transcripts inductively by focusing on the emerging themes in the qualitative data: each author independently coded one transcript from a group interview and met afterwards to discuss the codes and come to full agreement to develop a codebook for the remaining transcripts. After the codebook was developed, each researcher was assigned transcripts systematically. The codebook was a living document and codes were added and further defined as they were interpreted in the coding process. We discussed any discrepancies and came to a consensus on the final assessment of the qualitative data.
Once coding was complete, we discussed themes that arose from the patterns of coding. During this process we used data and investigator triangulation, which are used in qualitative methods to increase validity (Carter et al., 2014). For data triangulation, we examined similarities in students’ experiences to create themes (Creswell & Creswell, 2018). This triangulation of the qualitative data was used to increase the validity of our findings because the shared experience between students increases our confidence that our themes are real and not just extrapolations of the researchers. For further confidence in the validity of our qualitative data, we implemented investigator triangulation in two ways: (1) all transcripts were first coded in duplicate by two researchers individually, results were compared, and any differences were discussed and resolved, and; (2) codes and the codebook were reviewed by all other authors. In the case of discrepancies, the findings were revised accordingly and presented back until full agreeance was achieved (Carter et al., 2014).
Mixed Methods Integration
We integrated the quantitative and qualitative findings to gain a more complete picture of college students’ mental health during the pandemic. We paid special attention to how the findings converge and diverge with each other. For example, what similarities and differences are observed in what students reported in the May 2020 survey to what students reported in group and one-onone interviews roughly a year into the pandemic? Additionally, we paid attention to how the results
109
complement each other. For example, what impactful stressors are revealed in the qualitative data that were not revealed in the quantitative data? Lastly, the findings from each data strand were integrated to recommend changes or considerations for higher education administrators.
Results
Quantitative Results
Survey Sample Characteristics – A total 186 students completed the majority of the survey, and the sample characteristics are presented in Table 1. The sample adequately represented the universitywide student population by age and class standing but slightly overrepresents females, Asian and Pacific Islanders, and multi-racial students, and underrepresents males, Hispanic/Latinos, and African Americans (Table 1).
Race and Stressors – Our first research question was, “Is race related to exposure to stressors (academic, health, and financial)?” Table 2 shows the comparisons of total number of stressors, academic stressors, and health stressors between the White students and BISOC. All results suggest no difference between groups (in all cases p > 0.002; Table 2). The chi-square tests on relationships between race and individual stressors (proportion present or not) also showed that no stressors significantly differed by racial group.
Race and Mental Health – Our second research question was, “Is race related to mental health outcomes during the pandemic?”. Table 2 also shows the results of comparisons of depression scores and anxiety scores between the White students and BISOC. Our results suggest White students and BISOC did not significantly differ in levels of depression or anxiety. Further, chi-square analyses of race and the dichotomous depression and anxiety variables suggested no differences of prevalence between racial groups (in all cases p > .002).
Stressors and Mental Health – Regardless of race, most students were experiencing a great deal of stress. Students on average reported being exposed to 7 out of 14 total stressors included in the survey. In terms of mental health indicators, students scored on average 9.95 on the PHQ-8 and 7.9 on the GAD-7. Upon dichotomizing those measures based on the recommended clinical cut-offs, almost half of the sample met criteria for depression and almost one-third met criteria for anxiety (Table 2). The two mental illnesses were also strongly correlated (r = 0.74, Table 3).
Bivariate correlations showed that the total number of stressors reported was significantly and positively associated to depression (r = 0.51) and anxiety (r = 0.39) scores (Table 3). Academic stressors had moderate, positive associations with both depression (r = 0.50) and anxiety (r = 0.38), but associations between health-related stressors and mental health outcomes were noticeably weaker (r = 0.16 for depression and r = 0.15 for anxiety).
The only stressor that was significantly associated with higher anxiety scores was the lack of a functional/effective workspace (p < 0.001, Table 4) while six stressors were associated with lower mean depression scores: when students that felt they were negatively impacted from the transition to online learning, less productive than before, concerned with their GPA, struggling to meet
110
deadlines, lacking a functional/effective workspace, and in a distracting environment (p < 0.001, Table 4).
Table 1
Quantitative Sample Demographics
Demographic Level
Age 18-24 years old 25-34 years old 35 years and older
Gender * Male Female Other
Race White Hispanic/Latino Asian/Pacific Islander Native American/Native Alaskan African American Multi-racial
Class Standing Freshman Sophomore Junior Senior Graduate/Medical Student
*Gender non-response: university
University % (n)
75.4 (13,494) 17.1 (3,059) 7.4 (1,332)
46.0 (8,226) 54.0 (9,652) 0.03 (7)
57.0 (9,631) 21.8 (3,684) 9.2 (1,550) 0.8 (129) 3.7 (617) 7.7 (1,298)
13.0 (2,330) 16.2 (2,897) 20.2 (3,619) 29.8 (5,333) 20.7 (3,706)
Quantitative Sample % (n)
76.3 (142) 18.3 (34) 5.3 (10)
26.9 (50) 71.5 (133) 0.5 (1)
56.5 (105) 9.6 (18) 17.7 (33) 0.5 (1) 1.6 (3) 14.1(26)
19.4 (36) 12.9 (24) 20.4 (38) 26.3 (49) 21 (39)
Regarding the dichotomized outcomes, presence of clinical depression was related to negative impact from the transition to online class, perceived loss in productivity, and lack of a functional workspace (p < 0.001, Table 4). Lack of a functional workspace and lack of necessary electronic devices were also significantly related to the presence of clinical anxiety (p = 0.002). Health related stressors and becoming unemployed seemed to have little to no relationship with presence of mental illness.
Qualitative Results
Qualitative Sample Characteristics – We conducted four group interviews and four one-on-one interviews with a total of fourteen individual students. Figure 3 describes the characteristics of participants in the group and one-on-one interviews and how students were categorized as struggling or thriving. Among the BISOC-struggling students, the group interview was comprised of two students, one Hispanic or Latino and one Asian or Pacific Islander and the one-on-one interview
111
Stressors
Rates of Stressors, Mental Health Outcomes, and Other Variables by Race Total White BISOC
†
Variable type Specific Variable Me an Pro p. Me an Pro p. Me an Pro p. p*
Total number of stressors 7 7.3 6.6 0.07
Academic Number of Academic Stressors 4.44 4.65 4.16 0.13 Negative impact from online learning 0.66 0.71 0.59 0.08 Believe they are less productive than before 0.66 0.77 0.52 0.00 5 Concerned with GPA 0.6 0.64 0.56 0.25 Struggling to meet deadlines 0.3 0.32 0.26 0.34 Without a functional workspace 0.34 0.37 0.31 0.37 Distracting environment 0.91 0.9 0.93 0.47 Struggles w/ internet access 0.29 0.3 0.27 0.62 Increase in family worktakes away from school 0.52 0.49 0.5 0.27 Does not have needed electronic devices 0.15 0.14 0.16 0.71
Health Number of Health Stressors 2.14 2.17 2.1 0.62 at-risk for COVID-19 0.48 0.48 0.49 0.26 someone close has/had COVID 0.33 0.33 0.32 0.86 someone close is at-risk of getting COVID 0.93 0.93 0.93 0.84 lives in same household as someone at-risk 0.48 0.4 0.37 0.68 Financial became unemployed 0.42 0.49 0.35 0.06
Mental Health PHQ9 scores 9.95 10.3 4 9.44 0.33
Table 2
112
GAD7 scores 7.9 8.38 5.78 0.21 Depressed (PHQ9>9) 0.48 0.48 0.47 0.88 Anxious (GAD7>9) 0.32 0.35 0.28 0.37
Other COVIDrelated variables COVID knowledge 6.26 6.21 6.33 0.44
Activity level 27.7 9 28.5 1 26.8 5 0.01
Time spent researching COVID 1.51 1.39 1.65 0.19
Social distancing behavior 4.31 4.25 4.38 0.42
Demographic Age 1.31 1.3 1.32 0.75
Household size 3.57 3.53 3.62 0.67
Class standing 3.17 3.1 3.25 0.51 Gender (Female and other) 0.73 0.71 0.75 0.56
*: Means comparisons by racial group were tested with independent t-tests or Mann-Whitney U Tests and proportions by race were compared with chi-square tests.
† BISOC stands for black, indigenous, and students of color
113
114
Table 3
Bivariate Correlations Table
1 2 3 4 5 6 7 8 9 10 11
1. Total Stressors
2. Academic Stressors 0.91**
3. Health Stressors 0.47** 0.1
4. PHQ8 (Depression) 0.51** 0.50** 0.16*
5. GAD7 (Anxiety) 0.39** 0.38** 0.15* 0.74**
6. COVID knowledge -0.1 -0.17* 0.13 -0.06 -0.1
7. Activity level -0.07 -0.15* 0.1 -0.15* -0.14 0.04
8. Time spent researching COVID 0.14 0.09 0.15* 0.13 0.20* * 0.11 0.02
9. Social distancing behavior -0.03 -0.09 0.14 0.1 -0.01 0.30* * 0.06 0.25* *
10. Age -0.27** -0.27** -0.03 -0.13 -0.06 0.12 0 0.09 .18 *
11. Household size 0.30** 0.23 0.28* * 0.05 0.07 -0.11 -0.11 0.06 -0.1 -0.27**
12. Class standing 0.07 0.09 -0.03 0.09 0.05 0.05 -0.12 0.01 -0.1 -0.1 -0.11
*Correlation is significant at the level p<0.05
**Correlation is significant at the level p<0.01
Table 4. Rates of Mental Health Outcomes by Presence of Stressors
115
Anxiety Depression
Mean p Prop. p Mean p Prop. p Academic Negative impact from online learning present 8.51 0.05 0.33 0.51 11.42 <0.001 0.58 <0.001 not present 6.75 0.29 7.1 0.27
Stressors
Believe they are less productive now present 8.83 0.003 0.37 0.01 11.54 <0.001 0.59 <0.001 not present 6.13 0.21 6.86 0.29
Concerned with GPA present 8.68 0.03 0.34 0.43 11.21 0.001 0.54 0.02 not present 6.74 0.28 8.05 0.36
Struggling to meet deadlines present 9.8 0.004 0.4 0.13 12.69 <0.001 0.64 0.004 not present 7.1 0.28 8.78 0.4
Without a functional workspace present 10.78 <0.001 0.47 0.002 13.13 <0.001 0.67 <0.001 not present 6.43 0.24 8.3 0.37
Distracting environment present 8.26 0.009 0.34 0.02 10.46 <0.001 0.5 0.004 not present 4.41 0.12 4.82 0.18
Struggles w/ internet access present 9.48 0.03 0.39 0.2 11.93 0.01 0.56 0.15 not present 7.26 0.29 9.13 0.44
Increase in family work-takes away from school present 8.99 0.008 0.37 0.1 10.9 0.03 0.51 0.36 not present 6.74 0.26 8.92 0.44
Lacks necessary electronic devices present 11.18 0.009 0.61 0.002 13.07 0.003 0.61 0.13 not present 7.32 0.27 9.39 0.45
Health at-risk for COVID-19 present 8.79 0.04 0.34 0.44 10.48 0.25 0.49 0.68 not present 7.07 0.29 9.44 0.46 someone close has/had COVID present 8.51 0.33 0.34 0.58 10.98 0.11 0.51 0.51 not present 7.61 0.3 9.44 0.46 someone close is at-risk of getting COVID present 8.11 0.09 0.33 0.19 10.18 0.06 0.48 0.52 not present 5.23 0.15 6.85 0.38 lives in same household as someone at-risk present 8.17 0.63 0.33 0.71 10.32 0.51 0.4 0.53 not present 7.74 0.31 9.71 0.52
Financial became unemployed present 8.35 0.37 0.49 0.21 11.16 0.02 0.52 0.28 not present 7.58 0.45 9.04 0.44
Means refer to the continuous PHQ8 (depression) and GAD7 (anxiety) scores. Prop refers to the proportion of those with anxiety or depression scores >9.
116
Figure 3. Qualitative sample characteristics.

117
was with a student who identified as Hispanic or Latino. For the students categorized as BISOCthriving, two students who both identified as Hispanic or Latino comprised the group interview and the one-on-one interview was with an Asian or Pacific Islander student.
Themes – The codebook included a total of 31 codes used to analyse the transcripts. From the codes, six overarching themes emerged: impacts on college life, impacts on mental health, impacts on social life, impacts on BISOC, ways to cope with impacts, and student recommendations.
▪ Impacts on College Life. Common impacts on college life consistent across all group and one-on-one interviews included themes of positive and negative experiences with college professors, the transition to online learning, experiences with the mode of instruction, and the feeling of a lack of accountability. One of the most common positive experiences with college professors that students brought up was they appreciated when professors would “check-in” with them. This is exemplified in a quote from a student in the BISOC-struggling group interview: “I have one teacher that just sometimes sends out announcements like “hey everybody I know we're all going through this pandemic together, but I just hope you're doing great and you know, keep up the great work” and that literally just makes your entire like month…sometimes you just need a pat on the back”. Other students mentioned they appreciated when professors would stay on the Zoom call after class had ended in case anyone had questions or needed to talk. Another common positive experience students mentioned was when the course was more organized, they felt the course was better.
One of the most reported negative experiences with college professors involved unrealistic expectations for students to understand all aspects of online learning: “I feel like this semester… we're expected to just get it because we've been online for a year, and so we should have it down by now, but it's not really the case. It's still a challenge” (quote is from a student in the Whitestruggling group interview). Several students also reported feeling that their professor(s) did not put in enough effort to adapt the course material from in-person to online instruction.
Multiple students pointed out a transition through the pandemic involving the amount of coursework. Students expressed professors seemed more lenient and understanding during Spring and Fall 2020, but became more strict by Spring 2021 as exemplified in the following quote from a student in the White-thriving group interview: “I think…when COVID first started… teachers were lenient on assignments because none of us really knew how to approach an online school transition so quickly, and then like fall semester was okay, and I’ve found that this semester it is a lot harder to keep my grades up and like be successful”.
All groups mentioned there was an overwhelming academic course load they were experiencing during COVID-19. One student in the White-struggling one-on-one interview commented, “It might just be because of the classes that I’m taking right now, or it could be because of COVID and how people are handling it, it just feels like I have no time. And it feels like my plate is overflowing and I don't have time to go exercise anymore and it's pretty much I go to work in the morning and then I come home, and I do schoolwork until I go to sleep”.
Students also mentioned struggles with the online mode of instruction and a mismatch of learning styles with the online learning environment. The student in the BISOC-struggling group interview
118
commented, “I think it's just hard to incorporate everyone has different learning abilities and so some people are in-person learners and that's what I am and so being online for me has been incredibly hard, because not being in person and not getting that, you know that teacher coming over to you and actually looking at your paper or actually writing down something for you”.
Another common impact on college life concerned students feeling a lack of accountability that corresponded with lack of motivation and self-discipline. Students noted struggling to pay attention in classes and easily succumbing to distractions. One student in the White-thriving group interview commented, “I find myself losing motivation a lot easier, especially knowing that I have access to a lot of PowerPoints or recorded lectures that I normally wouldn't have access to, so I find myself like not paying attention in the Zoom because I can just go back later, but more often than not, I don't go back”.
▪ Impacts on Mental Health. In all the transcripts, students mentioned negative mental health impacts experienced during the pandemic including feeling depressed, anxious, stressed, and overwhelmed. There were students who mentioned they had never experienced mental health issues like they were experiencing during the COVID-19 pandemic. The student in the Whitestruggling one-on-one interview commented “this last semester, for the last like month or so I’ve really been struggling. I mean I have like four mental breakdowns a week, and it could just be because the classes that I have, but it could be because of COVID. But it's definitely been hard to maintain my relationships with my friends. And yeah I’ve definitely struggled with a little bit of depression, anxiety this last semester, which is something that I’ve never struggled with before my whole life… I’ve always been a very happy, bubbly, like optimistic person and the last few months I’ve not felt like that person”. Additionally, students discussed how the negative mental health impacts can interfere with their learning especially in a virtual environment, as showcased in this quote from a student in the BISOC-thriving one-on-one interview: “If I think if workload is pretty heavy, I’m going to be more stressed so I’m not going to feel like putting my [Zoom] camera on”. This highlights how when students are experiencing negative mental health impacts, it can cause them to not participate as they normally would in class. It also highlights how if a professor cannot see the student on the Zoom class call, the professor may not recognize the student is struggling and cannot offer support.
There were other students who had pre-existing mental health conditions that experienced more adverse mental health impacts during this time. One student in the BISOC-struggling group interview commented “it was… mentally exhausting, and I know everyone probably is feeling the same too, but I think when you already are going to get help for mental health and then all of a sudden this happens it's just like *pshh* big explosion on you”.
▪ Impacts on Social Life. In all the transcripts students discussed feeling isolated and/or lonely during this time. There were students who discussed being isolated from their positive social network members, feeling alone, and struggling with not having the same level of social contact they had before. One student in the White-struggling one-on-one interview commented “I guess that you know my overall takeaway from COVID is, we have been forced into isolation, well not forced, a lot of us are choosing isolation. And it did prove over and over again that humans are social beings, and I think that a lot of all of the depression and the suicide rates and all of the mental illness rates that are skyrocketing right now is because we are not spending time together and
119
humans need humans it's just it's a thing that we need. So, for me, my biggest thing is, you know, we need each other and it's hard to have each other when we can't be around each other”. Another student in the White-thriving group interview commented “I think at one point I kind of felt like I didn't have anyone to talk to, so I was kind of like my own support”.
▪ Impacts on BISOC. There were various responses from all students on whether they thought there were differential impacts on BISOC due to the pandemic. In all the transcripts there were some students who mentioned they believed disparities were present. One student in the White-struggling group interview commented “I think it's extremely unfair and a lot of aspects and this maybe does have to do with being like a student, but as a public health major I’ve heard a lot about like healthcare disparities among racial groups, especially during COVID-19, and so that's kind of been like eye opening a little bit to hear about that, when I didn't realize that this was going on to this extent, and so I feel like maybe there is some advantages to being a certain race or disadvantages amongst minorities, right now, and I feel like it's definitely more apparent right now.” Through their social networks, students perceive that BISOC have more distracting environments at home, so they have a greater need for campus being open. They also perceive BISOC are more likely to have jobs and must support themselves financially while also trying to attend college classes. Further they that perceive BISOC have less access to necessary resources for online learning, like Wi-Fi and new laptops. A few of these observations directly diverge from our quantitative findings (which showed no difference in access to needed technology and no difference in perceived distracting home environment). Other students discussed differential impacts involving more awareness of having White privilege and concern over the hate crimes happening in the country. One student in the White-struggling group interview commented “it's probably just that there's a… there's a lack of negative experiences so... whatever that means I guess it's an advantage”.
Other students felt the pandemic equally impacted students of all race and ethnicities and did not notice disparities. A quote that summarizes the perspectives of these students is, “I felt like the pandemic really affected everyone” (from a student in the BISOC-struggling group interview). One student in the BISOC-thriving group interview perceived this lack of noticing disparities may be due to not having the same social interactions as in face-to-face classes: “I haven't really heard about too much, and I think it's mostly because people don't like to interact as much as they used to, and you're unable to have conversations with people. Like you used to like when you're in a classroom and for me personally there's nothing really changed, so I haven't seen any of that kind of impact me or anybody else because I just haven't talked to anybody who's gone through it”.
Students in the White-struggling group interview and White-thriving one-on-one interview also brought up other disparities not originally inquired upon, including disparities of gender, age, disabilities, documentation status, and socioeconomic status. The student in the White-thriving one-on-one interview commented “So undocumented students, I think…no, I know have a much more difficult time accessing the things that documented students take for granted, like knowing how to apply for scholarships. Or you know, knowing how to even just enroll in classes or apply because they have this constant fear of a deportation or having to reveal their status”.
▪ Ways to Cope with Impacts. Some of the coping behaviors students mentioned included: self-care routines (e.g., eating healthy, using face masks, exercising), religious/spiritual routines (e.g., praying), surrounding themselves with things they love, picking up new hobbies (e.g., learning
120
how to crochet), maintaining a normal routine, journaling, and charitable giving. One student in the BISOC-struggling group explained how charitable giving was a way for them to cope “so really what helped me out was like getting others to be happy so I would donate to a lot of charities and even St. Jude… And it really helped me out a lot too because, like I didn't want others to feel like the same things that I was going through”. Another student in the White-thriving group interview emphasized that maintaining a normal routine had been helpful for coping, saying, “I think, trying to like, keep a certain level of normalcy has helped. So, like, for me… I actually feel like even if I’m at home all day, I have to get up. I have to shower and get dressed and get ready like I would be going somewhere, in order to like be productive and like get the things done that I need to get done”.
In all the group and one-on-one interviews, students discussed personal coping skills that included personality traits they felt helped them through COVID-19. One student in the White-thriving group interview commented “a positive outlook has really helped me get through it, and I think a lot of determination like, “if I can just get this down” or “get through this and then it'll get better” and having that kind of a mindset has helped me a lot, kind of taking things one step at a time for sure”.
Social coping resources included engaging with social support systems and being on campus. Students described receiving social support during the pandemic from family, friends, animals, resident assistants (RAs), and work colleagues. The student in the White-thriving one-on-one interview commented “I would also say my friend group… I’m not naturally inclined to like take breaks or like do something fun, like, I have to like force myself to be like “okay relax you can stop doing this like let's go do something fun” so they kind of forced me to do that”. Other students mentioned using apps like GroupMe and Discord to help build a positive social support system within the courses they were currently taking during distance-learning due to the pandemic.
▪ Student Recommendations. Students gave several recommendations for higher education systems, such as universities better fostering a sense of community among the student body. Specifically, ideas included having more socially distanced events, encouraging students to have their cameras on as much as possible during online classes, and having a study group function on Canvas. Students said many of them use phone applications to connect with classmates (e.g., GroupMe), but these apps are not accessible to all, leaving them disconnected. In another focus group, a BISOC suggested communications regarding pandemic-related resources by the university should come from students rather than university officials (e.g., president, provost) because if communications were conveyed to them by other BISOC it would make the information much more approachable, make them more likely to use those resources, and would help create an overall sense of community.
Discussion
The purpose of this study was to investigate the relationships among COVID-19 pandemic stressors, mental health outcomes, race, and coping resources among college students. By integrating the quantitative and qualitative results, our study was able to provide an in-depth, nuanced perspective on students’ experiences over a year into the pandemic. Due to the novelty of a crisis such as the COVID-19 pandemic, research is limited on how college students are impacted. There is some evidence that mental health issues among college students is increasing during this stressful time (Son et al., 2020); rates of clinical depression and anxiety are estimated at 40%, and 33%,
121
respectively (Eisenberg et al., 2021) which makes this a critical group to investigate. Additionally, little research has been conducted on racial disparities in COVID-19 impacts among college students even though it is well documented that racial minorities are disproportionately affected by COVID19 in the general population (Oppel Jr. et al., 2020). Here we present the main integrated findings about COVID-19 impact on college students in general, BISOC in particular, and what universities should pay attention to if they want to better advocate for their students.
College Students’ Experiences
There were many shared experiences among the college students in our quantitative and qualitative samples, but the following integrations will be discussed: (1) the negative impact of academic stressors; (2) the transition in online learning from the beginning of the pandemic to a year later; (3) students’ use of coping behaviors during this time; and (4) the repercussions of closing college campus.
The quantitative findings revealed how academic stressors, more so than health related stressors, were related to poor mental health outcomes. Then, the qualitative findings confirmed the impact academic stressors can have on student’s mental health. This extends the research of Son and colleagues (2020) in which students cited struggling with academic stressors, health stressors, and social stressors. Our research did find students were struggling with all those types of stressors, but academic stressors were more strongly associated with mental health.
The quantitative results captured how students were impacted at the beginning of the pandemic and integrating the qualitative results, we were able to capture how experiences changed over time. This is a phenomenon not discussed in the literature thus far and is probably due to the use of cross-sectional study designs. Many students discussed a transition in their classes, in which professors’ expectations increased over time and negatively impacted students. Even though the pandemic was still happening, and lives were still being disrupted, the professors’ expectations were no longer as sensitive to these issues as compared to earlier semesters during the pandemic.
For student coping behaviors, the quantitative research did not specifically address coping strategies implemented by students, but there were questions regarding activities (e.g., how often did students exercise, watch TV, read, do arts and crafts, volunteer, garden, etc.) which students may have engaged in as a coping strategy. The qualitative results provided a wide range of personal coping resources, social coping resources, and coping behaviors. The variety found can guide future research on coping strategies during crises like the COVID-19 pandemic and their potential role in building resiliency. Investigation of resources college students use to cope with COVID-19 stressors is not a subject present in the literature so far but is a major variable of interest in the Stress Process Model (Pearlin et al., 1981; Turner, 2013). This study, to the best of our knowledge, is the first to apply the stress process framework to understand the COVID-19 stress process for college students.
The repercussions of closing campus were seen in the quantitative and qualitative results. The quantitative results revealed students forced to complete their coursework in a distracting environment were significantly more likely to have anxiety and/or depression. The qualitative results revealed similar impacts. Many students discussed missing campus, how campus was viewed
122
as their “quiet” place, and how campus is a safe place for some students. Some students discussed how closing campus has forced students into unhealthy living situations (e.g., domestic violence, toxic family relationships). For example, several students cited increased proximity to toxic and/or abusive people, such as having to move in with family members who were negative influences.
BISOC’s Experiences
Much like the mixed results in previous studies on racial disparities in mental health among college students (Chen et al., 2019; Eisenberg et al., 2007; Garlow et al., 2008; Hunt et al., 2019; Liu et al., 2018), our results do not give a straightforward answer to the question of the presences of racial disparities during the pandemic at this university. The null quantitative results can be interpreted in multiple ways. First, it may mean that at the beginning of the pandemic, the disruptive changes acted as an “equalizer” and stressors and mental health issues were experienced at similar rates among all racial groups. However, as the pandemic continued those rates could have changed and because this survey was cross-sectional, we cannot conclude much about temporal effects or experiences occurring later in the pandemic based on those results. Also, the analyses were adequately powered to find medium to large effects between race and stressors or race and mental health outcomes, but not small effects. It is possible small effects exist, but our study could not detect them.
The qualitative results provide more insight into differences and similarities in experiences between White and BISOC college students during the pandemic. For example, there were multiple White students and BISOC who don’t perceive racial disparities in COVID-19 impact among college students. One interesting caveat revealed by the qualitative analysis is that these perceptions may be in part due to the students’ reference groups. There were White students who would say they do not think racial disparities exist in that way, but they only have White friends so are unsure. Then there were BISOC saying the same thing; they do not perceive disparities, but they only have BISOC friends, so they are also unsure. Disparities are not as easily visible when one’s reference group is homogenous.
Implications for Higher Education
There is a significant amount of useful information for universities that can be gleaned from the mixed methods data. Both the quantitative and qualitative results make it clear that students are struggling during this time and there are ways universities and professors can help. Professors in particular hold a unique position to either better or worsen students’ lives. This was apparent through the contrasting messages from students; some reporting professors having a negative impact on them (e.g., assigning too much, changing class times, giving up on teaching, not recognizing “reading (non-class) days”, overall apathy), and others reporting professors’ having a positive impact on them (e.g., empathetic, being flexible on deadlines, motivating and engaging over Zoom). Professors’ instrumental role is also demonstrated through the quantitative results which show certain academic stressors, ones that professors can help students with (i.e., struggling to meet deadlines and concern over GPA), are significantly related to students’ depression. Therefore, we suggest universities leverage this unique role professors assume and take steps to ensure they are supported and trained in times of crisis so they can be a better source of support for students in return.
123
Lastly, because we did not find clear evidence for racial disparities in stress and mental health among these students, we cannot come to many recommendations on how universities can better serve their BISOC, although useful feedback for maintaining student diversity in general was provided. One student leader on campus who is White, but in their position advocates for students with diverse backgrounds and hears their stories, did explain that some groups of students have just “fallen through the cracks”, which should be alarming to universities. They were specifically referring to students with learning disabilities and undocumented students. Those students lack both physical and informational resources necessary to thrive in college during the pandemic and some have simply halted their education. Therefore, universities must not only ensure resources are available to students with diverse backgrounds and abilities, but ensure the information is easily accessible and received. Students are experiencing the pandemic in diverse ways that universities need to continue to better understand to help and this is exemplified in a quote from the qualitative findings: “I just think that like it's so different for every student. You know, when I read like research papers and stuff there's always the “here was the trends in what we found and everything”, but I think like it's important to like emphasize that, like every student is so different like some will be like “online learning is the best thing that ever happened to me” and then some will be like “this was the worst, This was the worst year of my life, like, I cannot wait till it's over”… I just think that it's so different for everyone and everyone's, you know, experiences are authentic but like, at the same time, like minute little things that just make a world of a difference.”
Limitations
There are three limitations important to discuss. First, the study sampled from one university, which impacts the generalizability of the findings. However, universities across the country experienced a similar event (the COVID-19 pandemic) and similar shutdowns of their college campuses so it is possible the experiences highlighted by this study are shared with students across the country. Further, qualitative data are inherently not generalizable to all college students in the country, and probably not generalizable to all college students at this specific university.
Second, 29 students expressed interest in participating in the qualitative component, but only 14 students participated in either the group or one-on-one interview (roughly 48% response rate). The students unable to participate may have experiences that if included would have enriched our study and enabled a better understanding of college students’ experiences during this time.
Third, the sampling frames for the quantitative and qualitative components were different and were done at different points in time. If the sampling and time frame were the same, it could have strengthened the study by further integrating the data. It would have also led to more in-depth understanding of how COVID-19 has impacted students over time. Future research would benefit from larger sample sizes, sampling from multiple universities, having students from more departments participate, and conducting a mixed methods study that uses the same sample during the same time period for the quantitative and qualitative components.
Conclusion
This mixed methods study aimed to better understand how the COVID-19 pandemic impacted college students. Findings from the integration of our mixed methods results revealed negative
124
impacts shared among college students regarding academic stressors and campus closing. The study captured alarmingly high rates of depression and anxiety among college students, symptoms that these students described as “explosive” and resulting in “multiple mental breakdowns a week”. The study did not find differences in exposure to stressors or mental health outcomes between White students and BISOC at the beginning of the pandemic, but a year later students did report some disparities in their virtual education. Lastly, students shared their ideas on how universities could do better in times of crisis to help support their students learning and mental health. It is important to consider how crises impact college students to determine ways universities can work to mitigate negative repercussions when a crisis hits.
References
Aucejo, E. M., French, J., Araya, M. P. U., & Zafar, B. (2020). The impact of COVID-19 on student experiences and expectations: Evidence from a survey. Journal of Public Economics, 191, 104271. https://doi.org/10.1016/j.pubeco.2020.104271
Carter, N., Bryant-Lukosius, D., DiCenso, A., Blythe, J., & Neville, A. J. (2014). The use of triangulation of qualitative research. Oncology Nursing Forum, 41(5), 545-547. Doi: 10.1188/14.ONF.545-547
Chen, J. A., Stevens, C., Wong, S. H. M., & Liu, C. H. (2019). Psychiatric symptoms and diagnoses among U.S. college students: A comparison by race and ethnicity. Psychiatric Services, 70(6), 442–449. https://doi.org/10.1176/appi.ps.201800388
Creswell, J. W., & Creswell, J. D. (2008). Research Design: Qualitative, Quantitative, and Mixed Methods Approaches (5th ed.). Thousand Oaks, CA: SAGE Publications, Inc.
Dennis, J. M., Phinney, J. S. and Chuateco, L. I. (2005). The role of motivation, parental support, and peer support in the academic success of ethnic minority first generation college students. Journal of College Student Development, 46(3), 223–236.
Eisenberg, D., Gollust, S. E., Golberstein, E., & Hefner, J. L. (2007). Prevalence and correlates of depression, anxiety, and suicidality among university students. American Journal of Orthopsychiatry, 77(4), 534–542. https://doi.org/10.1037/0002-9432.77.4.534
Eisenberg, D., Ketchen-Lipson, S., Heinze, J. and Zhou, S. (2021) The Healthy Minds Study: Fall 2020 data report. Healthy Minds Network.
Engle, J., & Tinto, V. (2008). Moving beyond access: College success for low-income, first-generation students. Pell Institute for the Study of Opportunity in Higher Education.
Field, A., Miles, J. and Field, Z. (2012). Discovering statistics using R. SAGE Publications.
Garlow, S. J., Rosenberg, J., Moore, J. D., Haas, A. P., Koestner, B., Hendin, H., & Nemeroff, C. B. (2008). Depression, desperation, and suicidal ideation in college students: Results from the American Foundation for Suicide Prevention College Screening Project at Emory University. Depression and Anxiety, 25(6), 482–488. https://doi.org/10.1002/da.20321
Gillis, A., & Krull, L. M. (2020). COVID-19 remote learning transition in Spring 2020: Class structures, student perceptions, and inequality in college courses. Teaching Sociology, 48(4), 283-299. DOI: 10.1177/0092055X20954263
Gloria, A. M., Robinson Kurpius, S.,E., Hamilton, K. D., & Willson, M. S. (1999). African American students' persistence at a predominantly white university: Influences of social support, university comfort, and self-beliefs. Journal of College Student Development, 40(3), 257.
Guest, G. (2013). Describing mixed methods research: An alternative to typologies. Journal of Mixed Methods Research, 7(2), 141–151. https://doi.org/10.1177/1558689812461179
125
Hagen, M. M., Hartzell, S. Y. T., & Devereux, P. G. (2021). Social media use and COVID-19: A crosssectional study examining health behaviors, knowledge, and mental health among University of Nevada, Reno students. Health Behavior Research, 4(2). https://doi.org/10.4148/25721836.1100
Hartzell, Y. T., Hagen, M. M., & Devereux, P. G. (2021). Disproportionate impacts of COVID-19 on university students in underrepresented groups: A quantitative and qualitative descriptive study to assess needs and hear student voices. Journal of Higher Education Management, 36(1), 142151.
Howard, D.E., Shiraldi, G., Pineda, A., & Campanelli, R. Landow, M. V. (2006). Stress and mental health of college students: Overview and promising prevention interventions. In M. Landow (Ed.) Stress and mental health of college students (p. 91-123). Nova Publishers.
Hoyt, L. T., Cohen, A. K., Dull, B., Maker Castro, E., & Yazdani, N. (2021). "Constant stress has become the new normal": Stress and anxiety inequalities among U.S. college students in the time of COVID-19. The Journal of Adolescent Health, 68(2), 270–276. https://doi.org/10.1016/j.jadohealth.2020.10.030
Hunt, J. B., Eisenberg, D., Lu, L., & Gathright, M. (2015). Racial/ethnic disparities in mental health care utilization among U.S. college students: Applying the institution of medicine definition of health care disparities. Academic Psychiatry, 39(5), 520–526. https://doi.org/10.1007/s40596014-0148-1
Kessler, R.C., Barker, P.R., Colpe, L.J., Epstein, J.F., Gfroerer, J.C., Hiripi, E., Howes, M.J, Normand, SL.T., Manderscheid, R.W., Walters, E.E., Zaslavsky, A.M. (2003). Screening for serious mental illness in the general population. Archives of General Psychiatry, 60(2), 184-189.
Kroenke, K. & Spitzer, R. L. (2002). The PHQ-9: A new depression diagnostic and severity measure. Psychiatric Annals, 32(9), 509–515. https://doi.org/10.3928/0048-5713-20020901-06
Liu, C. H., Stevens, C., Wong, S. H. M., Yasui, M., & Chen, J. A. (2019). The prevalence and predictors of mental health diagnoses and suicide among U.S. college students: Implications for addressing disparities in service use. Depression and Anxiety, 36(1), 8–17. https://doi.org/10.1002/da.22830
Molock, S. D., & Parchem, B. (2021). The impact of COVID-19 on college students from communities of color. Journal of American College Health, 1–7. https://doi.org/10.1080/07448481.2020.1865380
Musu-Gillette, L., De Brey, C., McFarland, J., Hussar, W., Sonnenberg, W., & Wilkinson-Flicker, S. (2017). Status and trends in the education of racial and ethnic groups 2017 (Report No. NCES 2017-051). U.S. Department of Education, National Center for Education Statistics. http://nces.ed.gov/pubsearch
Patterson Silver Wolf, D., Taylor, F., Maguin, E., & Asher BlackDeer, A. (2019). You are college material—You belong: An underrepresented-minority student retention intervention without deception. Journal of College Student Retention: Research, Theory & Practice. doi: 10.1177/1521025119848749
Pearlin, L. I., Menaghan, E. G., Lieberman, M. A., & Mullan, J. T. (1981). The stress process. Journal of Health and Social Behavior, 22(4), 337–356. JSTOR. https://doi.org/10.2307/2136676
Porter, S. R., & Umbach, P. D. (2006). Student survey response rates across institutions: Why do they vary?. Research in Higher Education, 47(2), 229-247.
Rosenthal, B., & Wilson, W. (2008). Mental health services: Use and disparity among diverse college students. Journal of American College Health : J of ACH, 57, 61–68. https://doi.org/10.3200/JACH.57.1.61-68
126
Son, C., Hegde, S., Smith, A., Wang, X., & Sasangohar, F. (2020). Effects of COVID-19 on college students’ mental health in the United States: Interview survey study. Journal of Medical Internet Research, 22(9), e21279. doi: 10.2196/21279
Spitzer, R. L., Kroenke, K., Williams, J. B. W., & Löwe, B. (2006). A brief measure for assessing generalized anxiety disorder: The GAD-7. Archives of Internal Medicine, 166(10), 1092–1097. https://doi.org/10.1001/archinte.166.10.1092
Turner, R. J. (2013). Understanding health disparities: The relevance of the stress process model. Society and Mental Health, 3(3), 170–186. https://doi.org/10.1177/2156869313488121
Viner, R. M., Russell, S. J., Croker, H., Packer, J., Ward, J., Stansfield, C., ... & Booy, R. (2020). School closure and management practices during coronavirus outbreaks including COVID-19: A rapid systematic review. The Lancet Child & Adolescent Health, 4(5), 397-404.
127
(2),
(ISSN 2640-7515).
Resource Allocation Concerns: Matching Teaching and Research Needs with Financial Management at University Farms
Justin W. Rickard Maria A. Boerngen Illinois State University
Introduction and Background
Over the past several decades, many collegiate agriculture programs have experienced a changing student dynamic that has included a shift from “traditional” farm students to a student body that is largely made up of students from urban or non-farm settings (Rickard and Boerngen, 2017; Rickard, 2016; Sterle and Tyler, 2015). Although the number of students without “traditional” farm backgrounds has increased, many traditional skills associated with the occupation of farming are still desired by employers in the agriculture industry (Malone et al., 2016). Therefore, the importance of experiential learning opportunities in agriculture programs has continued to increase based on employer demand for traditional skills in crop and livestock production. Experiential learning is described as “learning through participation in experiences, [and] is often cited as a foundational tenant of teaching agriculture, food, and natural resources content” (McKim et al, 2017). In many agriculture programs, experiential learning may be made possible through the existence of a university farm.
University farms, occasionally referred to as “student farms,” are working farms associated with university agriculture programs. These farms range in size, scope, and purpose (i.e., teaching vs. research vs. outreach), and may be defined as farms that provide hands-on educational experiences in agriculture (Ratasky et al., 2015; Leis et al., 2011). In other words, university farms may act as laboratories for agriculture students. Similar to other campus laboratories, university farms may also be faced with issues regarding limited funding and administrative support (Leis et al., 2011). This may be exacerbated by downturns in the agriculture economy. Depending on budgetary structures within a given university setting, a university farm may not have the opportunity to adequately market its commodities and apply those earnings to on-farm improvements. Interestingly, a university farm is tasked with maintaining current crop and livestock production techniques in order to support undergraduate education and modern faculty research programs, but may have minimal input into its own financial stability. In addition, being a part of a university campus may include compliance aspects such as occupational health and animal care programs that are not seen on a working farm in the private sector.
As faculty in many agriculture programs are required to maintain both teaching and research programs utilizing university farms, often farm employees may view both of these focuses as a hindrance to production. Teaching and research programs may be costly to university farms as they
128
Journal of Higher Education Management, 37
128-135
© Copyright 2022 by the American Association of University Administrators. Permission to reprint for academic/scholarly purposes is unrestricted provided this statement appears on all duplicated copies. All other rights reserved.
are inherently expensive to accomplish. Costs associated with equipment, buildings, maintenance, and maintaining livestock are challenging to cover by university farms; this is especially evident in animal science programs and has long been documented (Tomhave, 1925). More recently, maintaining consistent funding was identified as the greatest challenge associated with operating a university farm (Ratasky et al., 2015). Another study identified budget limitations as the greatest challenge (Leis et al., 2011). These challenges may be exacerbated for non-land-grant institutions who do not receive the ongoing federal funding support accorded to land-grant universities under provisions such as the Hatch Act of 1887 and the Smith-Lever Act of 1914 (United States 1887, 1914).
While university farms face funding and budgetary difficulties, overall funding for higher education poses challenges of its own. According to the SHEF 2017: State Higher Education Finance report, while full-time equivalent university enrollment increased by 36% between 1992 and 2017, state and local appropriations for higher education declined 8% per FTE (inflation-adjusted) during those same years (State Higher Education Executive Officers Association, 2018). As funding for higher education continues to decline, university farms will likely continue to face funding challenges that make it difficult for these farms to provide the hands-on learning experiences students need. However, student demographics and backgrounds continue to move away from “traditional” farm students and the role of a university farm in providing educational experiences may be even more important now than it was a century ago. Yet minimal information exists regarding the role of university farms. Colleges and universities with agriculture programs may benefit from information describing the role, structure, and financial implications of university farms at various institutions. Therefore, the objectives of this study were to determine the number of NARRU (Non-land-grant Agriculture and Renewable Resources Universities) member institutions that have university farms, to determine the size and scope of those farms, to identify the challenges associated with operating and managing a university farm, and to identify common funding sources and financial structures of university farms.
Materials and Methods
Following Illinois State University (ISU) Institutional Review Board approval (IRB-2021-250), a 15question survey was designed and administered in Qualtrics to address the challenges associated with operating and managing a non-land grant university farm. After reviewing the websites of the 46 NARRU-member institutions (Association of Public & Land Grant Universities, n.d.), the survey was sent to 41 NARRU-member institutions whose websites suggest or indicate the presence of a college or university farm. Using publicly available contact information, the survey was distributed via email directly to individuals identified as the farm manager, farm coordinator, or administrator believed to be the person most directly responsible for making decisions related to that institution’s farm, using an anonymous Qualtrics survey link. The survey included 5 general farm overview questions, 5 questions pertaining to the types of enterprises and activities present on the farm, 3 questions addressing on-farm labor, and 2 questions related to the farm’s funding sources and operational challenges. A follow-up email was sent to all recipients approximately three weeks later. The survey was closed 40 days after the initial emails were sent. Completed surveys were analyzed using SPSS Version 27.
129
Results and Discussion
A total of 24 recipients consented to participate in the survey out of a total recipient pool of 41, for a response rate of 59%. However, four respondents indicated that their institution does not have a farm, and five additional respondents noted that while their institution does have a farm, they are not a primary decision-maker on that farm. The following discussion is based on the remaining 15 responses. Of those responses, 46% indicated the title of “Farm Manager,” with 54% reporting other titles including Dean, Director, or Chair. Table 1 provides an overview of respondents’ institutional farms, indicating that the majority of these farms are long-standing, having been in operation for more than 75 years. Farm size varies widely, with 100-199 acres and 1,000-1,999 acres being the most frequently selected ranges. Half of respondents indicated that their institution employed 5 or fewer full-time non-student farm employees.
Table 1
Overview of Institutional Farms Characteristic Number %
Age of university farm(s) (n=14)
Fewer than 25 years 0 0 25-50 years 1 7 51-75 years 5 36 More than 75 years 8 57
Approximate total size of university farm(s) (n=11) 49 or fewer acres 0 0 50-99 acres 2 18 100-199 acres 1 9 200-499 acres 3 27 500-999 acres 2 18 1000-1,999 acres 3 27 2000 acres or more 0 0
Approximate full-time (non-student) employees (n=14) 1-5 7 50 6-10 6 43 11-15 1 7
Farm enterprises and activities. Table 2 summarizes the categories of enterprises present on these university farms. Livestock production (including dairy equine, and fish/shellfish in addition to traditional livestock such as beef cattle, sheep, and hogs) was the most frequently reported category (86%), with crop production (both agronomic and horticultural) indicated by 71% of respondents. The survey allowed for including up to two additional enterprises beyond the categories listed, with three respondents indicating other enterprises including fiber hemp, cover crops, honey, and meat processing. Four respondents (29%) indicated the presence of just one type of enterprise on their institution’s farm (three reported livestock only, and one reported large-scale composting only). The majority of respondents (71%) indicated from two to six enterprises on their
130
institutional farms. The most frequently reported combination was crops and livestock, reported by 29% of respondents.
Table 2
Types of Enterprises and Activities on Institutional Farms. Enterprise (n=14) Number %
Livestock production 12 86 Crop production 10 71 Large-scale composting 5 36 Other 3 21 Feed milling 3 21 Activity (n=11) Faculty research 11 100 Teaching 10 91 Outreach/extension 8 73 Industry research 6 55
Nine respondents provided additional information about the crops found on their university farms. The most frequently selected crop enterprises were corn, hay/forage, and soybeans, reported by 7, 6, and 5 respondents, respectively, with an average of 74 corn acres, 215 hay/forage acres, and 72 soybean acres among those farms reporting the production of those crops. Other crops included wheat and fruits (each reported by 3 institutions); and grain sorghum, other small grains such as oats, and vegetables (each reported by 2 institutions). Eight respondents provided additional information about the types of livestock produced on their university farms. Cow/calf production was reported by 8 institutions, with an average of 122 head of beef cows. Reported swine enterprises differentiated between animals being grown specifically for the purpose of slaughter (grow/finish) or animals kept specifically for breeding purposes. In the current study, 6 institutions indicated having pigs, and averaged 56 grow/finish hogs and 14 breeding hogs. Overall, cattle and pigs were the most frequently selected species, but breeding sheep and equine were each reported by 5 institutions, with an average of 24 breeding sheep and 35 horses per institution. Livestock operation type and size (number of animals) is a noteworthy component of university farm evaluation due to costs associated with raising livestock as well as the labor requirement associated with production. Unlike some crops that may not require hands-on attention on a daily basis during the growing season, livestock require daily feeding, watering and daily health checks. Breeding animals require more attention be given during parturition (the process of giving birth). These tasks result in an increased labor requirement. The need for additional labor requirements, especially those that do not fall in line with traditional 8-hour workday schedules may be challenging to explain to university administrators. It is difficult to plan for increased labor needs when there is a livestock component due to the lack of predictability associated with a biological system. In university systems that may not provide overtime compensation for farm employees, filling labor needs may be problematic. When compared to the U.S. livestock industry, the results of this study are similar in that beef cattle and swine enterprises constitute the greatest reported numbers, followed by sheep. However, the number of animals on each farm does not necessarily mirror the number of animals on farms in the U.S. For example, the average beef cow herd size reported in
131
this study was more than twice the size reported in the 2017 U.S. Census of Agriculture (USDA, 2019). Based on this, a university farm with twice the typical number of animals may be faced with managing them with a much smaller labor force than what would be found on a typical nonuniversity farming operation.
Eleven respondents provided information about the types of activities (teaching, extension/outreach, faculty research, and/or industry research) that take place on their institution’s farms. As illustrated in Table 2, faculty research is conducted on all of these farms, with teaching activities (animal and/or crop production courses), outreach/extension, and industry research such as seed company field trails reported by 10, 8, and 6 respondents, respectively.
Farm labor. Fourteen respondents reported on the number of full-time non-student workers are employed by their institutional farms. Half of these farms (n=7) have five or fewer full-time employees. There is no clear pattern between the size of the full-time farm labor force and the size of the institution’s farm. However, it is interesting to note that just one respondent selected 11-15 full-time farm workers (the largest category), on an institutional farm that is between 50 and 99 total acres in size (the smallest category). Looking a little more closely at farm labor, fifteen respondents provided information about the percent of total farm labor provided by groups such as farm staff, faculty, students, administrators, and volunteers. As presented in Table 3, each institution employs dedicated farm staff, who on average provide the majority of total farm labor. For the institutions whose faculty and undergraduate students are involved with their farms, these groups each provide approximately one-fifth of total farm labor on average, followed by administrators, volunteers, and graduate students. Farms that employ students report an average of 11 and 3 undergraduate and graduate student employees, respectively. Although not the focus of our study, anecdotal information suggests that university farms may also struggle to find skilled, full-time labor to hire. This may not be surprising as the percent of the U.S. population involved in production agriculture has declined to levels below 2% over the last century, and therefore there is a smaller pool of available labor already possessing production skills. Additional research into this specific area of university farm labor needs is warranted.
Table 3
Farm Labor Provided by Different Groups
Number reporting Average % of labor provided Farm staff 15 61 Faculty 10 19 Undergraduate students 12 19 Administrators 2 18 Volunteers 2 15 Graduate students 9 11
2 20 132
Group (n=15)
Other
Operational funding and challenges. Fourteen respondents provided detailed information about the funding sources for their institution’s farming operations. Every institution funds at least a portion of its farm with revenue generated by selling what is produced on that farm, with three respondents indicating that farm products sales provide 100% of their institutional farm’s operating budget. Alumni donations, institutional budgets, external grants, industry donations, and departmental budgets were also indicated as funding sources, as shown in Table 4. Additionally, respondents were asked to rank a series of 8 factors that could impact the operation of their institution’s farm, from the most challenging to the least challenging. Budgetary limitations and funding were ranked as the most challenging factors overall, followed by bureaucracy/red tape; balancing the farm’s production, research, and educational focuses; gaining administrative/institutional support; staff burnout/turnover; student turnover; and working around student schedules.
Table 4
Sources of Operating Funds for Institutional Farms
Funding source (n=14) Number reporting Average % of funding provided Farm product sales 14 63.2 Alumni donations 2 30 Institutional budget 10 24 External grants 4 10 Departmental budget 10 8.5 Industry donations 4 12.5%
The most frequently identified enterprises on institutional farms come with a hefty price tag. For example, in 2021 the per-acre cost of producing corn in Illinois was estimated between $609 and $631/acre, with soybeans projected to cost $350-$393/acre (Schnitkey 2021). These figures account for all operating inputs such as seed, fertilizer, and pesticides, along with fixed costs including machinery, facilities, and labor. Per-acre land costs are not included, and assuming that a university farm is not being charged by its institution for the use of university-owned farmland, this suggests that these values represent the cost structure faced by a typical institutional farm in the production of these crops. Production costs are projected to rise from 20% to 28% in 2022 (Schnitkey 2021), driven largely by increases in fertilizer prices. University budget timelines do not necessarily align smoothly with farm budget planning. For example, in Illinois the fiscal year begins on July 1, with campus units submitting budget requests to their administration in the first quarter of the calendar year. This means that any farm operating funds provided by the institution are requested more than a year before a crop is planted, and several months before inputs are purchased for that crop. These budgetary timelines and often unpredictable cost fluctuations, in addition to the higher labor requirements for livestock enterprises previously discussed, present unique challenges in the management and operation of institutional farms.
133
Beyond basic production budgets, teaching and research needs placed on university farms present additional constraints on budgets. Innovation and discovery, while both pillars of research, come at a price. For example, in a basic crop research scenario in which there are two treatments (one control treatment representing a standard practice and another treatment representing a new technique), one treatment may not perform as well as the other. In a university farm setting where the sale of crops is heavily relied on for income, an experiment that results in lower than desirable yields (less crop to sell) is problematic. In a teaching environment students may be called on to assist in production tasks as part of their coursework. The impact of experiential learning pedagogy is well documented in agriculture programs (e.g., Ford Ramsey and Isengildiner-Massa 2020, Honeyman and Christian 1999, Malone et al. 2016, Marshall et al. 1998, Rhykerd et al. 2006). However, what is less documented is the impact that student learning experiences may have on farm production efficiencies. This may potentially place additional strain on academic programs as they seek to balance student learning with faculty needs and university farm production requirements.
Summary and Conclusions
University farms are a critical component of agricultural programs that provide an opportunity for hands-on learning experiences and training opportunities for students. In addition, they provide university faculty the facilities required for involvement in research programs. Each of these areas may not fit easily within the production environment of a university farm. As budgetary constraints continue to be placed on academic units, a thorough assessment of the role(s) university farms play in helping achieve the mission of higher education in agriculture is needed to enhance program sustainability. All three areas (teaching, scholarship, and production) are essential components of agriculture programs and because of that additional information that examines the most effective ways for these areas to work together in a symbiotic way is warranted.
References
Association of Public & Land Grant Universities. (n.d.) NARRU Members. Retrieved July 1, 2021, from https://www.aplu.org/members/commissions/food-environment-and-renewableresources/board-on-agriculture-assembly/narru/narru-members.html
Ford Ramsey, A. & Isengildina-Massa, O. (2020). Evaluation of learning outcomes from participation in a student-managed commodity investment fund. Appl. Econ. Teaching Resources s(6):1-13.
Honeyman, M.S. & Christian, A.E. (1999). Learning and teaching swine stockmanship to undergraduates: a laboratory approach. NACTA Journal 43(3), 35-39.
Leis, A., Whittington, M.S., Bennett, M., & Kleinhenz, M. (2011). Student farms at United States colleges and universities: insights gained from a survey of the farm managers. NACTA Journal 55(1): 9-15
Malone, C.J., Rickard, J.W., & Tudor, K.W. (2016). Integrating experiential learning into animal science curriculum through a hands-on beef cattle management and marketing contest. J. of Anim. Sci. 93(E-Suppl. 2).
Marshall, T.T., Hoover, T.S., Reiling,B.A., & Downs, K.M. (1998). Experiential learning in the animal sciences: effect of 13 years of a beef cattle management practicum. J. Anim. Sci. 76(11):294752.
134
McKim, A.J., Greenhaw, L., Jagger, C., Redwine, T., & McCubbins, O. (2017). Emerging opportunities for interdisciplinary application of experiential learning among colleges and teachers of agriculture. NACTA Journal 61(4): 310-316.
Ratasky, S., Schroeder-Moreno, M., Jayaratne, J., Bradley, L.K., Grossman, J., & Orr D. (2015). Identifying key characteristics for student farm successes through a national Delphi study. NACTA Journal 59(2): 96-103.
Rhykerd, R.L., Tudor, K.W., Wiegand, B.R., Kingman, D.M., & Morrish, D.G. (2006). Enhancing experiential learning through a hands-on crop production and marketing contest. NACTA Journal 50(4):25-30.
Rickard, J.W. (2016). Changing animal science curriculum at a non-land grant university. J. of Anim. Sci. 93(E-Suppl. 2).
Rickard, J.W., Boerngen, M.A., Lorenz, S.M., & Baker, E. (2017). Assessing student demographics in a non-land grant university. Natural Sciences Education 46:170021.
Schnitkey, G. (2021). Revenue and costs for Illinois grain crops, actual for 2015 through 2020, projected for 2021 and 2022. Department of Agricultural and Consumer Economics, University of Illinois. https://farmdoc.illinois.edu/handbook/historic-corn-soybeans-wheat-and-doublecrop-soybeans
State Higher Education Executive Officers Association (2018). SHEF: FY 2017 State Higher Education Finance. http://www.sheeo.org/sites/default/files/project-files/SHEEO_SHEF_FY2017_FINAL.pd f.
Sterle, J.A., & Tyler, H.D. (2015). The next generation of animal science students: Changing demographics dictate curriculum changes. J. of Anim. Sci. 93(E-Suppl. 2).
Tomhave, W.H. (1925). Problems in animal husbandry teaching and research. J. of Anim. Sci. 1925(1): 71-77.
United States. Cong. Senate. 1887. Hatch Act of 1887, 7 U.S.C. § 361a.
United States. Cong. Senate. 1914. Smith-Lever Act of 1914, 7 U.S.C. §343 (1914).
135
Journal of Higher Education Management, 37(2), 136-147 (ISSN 2640-7515). © Copyright 2022 by the American Association of University Administrators. Permission to reprint for academic/scholarly purposes is unrestricted provided this statement appears on all duplicated copies. All other rights reserved.
The Nexus Between Corporate Governance and Leadership In The Post Covid-19 Era: The Context of Public Sector
Oluwaseun Titi Adeosun Bamidele Olumilua University of Education, Science and Technology (Nigeria)
Introduction
The covid-19 pandemic created a crisis that the global world has been battling. The pandemic created turbulent problems such as inconsistency, unpredictability, and uncertainty of events that have disrupted the global social structure and challenged both the public and private sectors (Dunlop et al., 2020; Madueke et al., 2021). The public sector is indeed now stretched to the limit by the effects of the COVID-19 pandemic with its impact felt among several economies globally. Nigeria, a developing economy with a poor social system, high poverty, and unemployment rate, poor education system, and security experienced a huge negative impact from the spread of the pandemic (Mcmullin & Raggo, 2020). The negative impact exacerbates the economic recession previously encountered by the nation coupled with inflation and other series of crisis such as the Academic Staff Union of University (ASUU) strike, end SARS protest, Lekki toll gate shooting, kidnapping, banditry, attack on citizens’ life and agricultural products by Fulani herdsmen (Adeosun & Adebowale, 2022), and the fight for Yoruba and Biafra nation. Although several strategies were deployed in dealing with the pandemic, the turbulent problems and the aftermath crisis caused by the pandemic pose a challenge to the sustainability and administration of the public sector. To curb this, robust corporate governance and leadership styles need to be adopted in the public sector (Ansell et al., 2020; Sá & Serpa, 2020). Effective corporate governance and leadership are important tools to manage emerging public sector crises herald by the residues of the COVID-19 pandemic.
Result-oriented governance arrangement and leadership styles have played different roles in global economies in responding to the COVID-19 crisis which is crucial to the recovery, sustainability, and building systems in dealing with the aftermath of the pandemic (Kniffin et al., 2020; Salvioni et al., 2016). In the education sector, there is a global switch to virtual learning and conferences to continue teaching and learning that was disrupted by COVID-19 lockdown restrictions. In Nigeria, public tertiary institutions made a late adoption of this strategy due to a lack of finances, preparation and sustainability plan (Ozili, 2020). This has resulted in the cancellation of academic calendars and extra curriculum activities in Nigeria’s elementary, secondary, and tertiary schools.
In the midst of the COVID-19 pandemic, the defunct College of Education in Ikere transits into the Bamidele Olumilua University of Education, Science and Technology, Ikere Ekiti with the forty-five courses presented to the National University Commission (NUC) resource accreditation team approved after resource verification visit. It is against this background, this study investigates the nexus between corporate governance and leadership in the Bamidele Olumilua University of Education, Science and Technology, Ikere Ekiti (BOUESTI) in the post-COVID-19 era. Specifically, the
136
study investigates corporate governance practices, and the leadership styles employed by administrators in the sustainable transitioning of BOUESTI in the post COVID-19 era
A Brief History of BOUESTI. BOUESTI was founded after a bill was passed by the Ekiti State House of Assembly on October 14, 2020. The bill allows the defunct College of Education Ikere Ekiti to become a university. The defunct college was established on December 5, 1977, as the Ondo State College of Education, Ikere Ekiti, and was affiliated with the former University of Ife (now Obafemi Awolowo University) to offer its program respectability and acceptability. Obafemi Awolowo University approved the college courses and also sponsored them for approval by the National Joint Consultative Committee on Education (JCCE) in February 1979. As a result, all of the college's programs were moderated by the university.
Prior to the colleges’ transition into a university, the institution experienced a change in leadership in 2019, shortly before the spread of the Covid-19 pandemic. Professor Olufemi Victor Adeoluwa, the university's former new provost and the new founding vice-chancellor, faced financial difficulties as a result of previous leadership's poor management and declining student enrolment. This challenge inspires him to set the goal of transitioning for the college, which he has been pursuing since 2019. Despite the institution's financial difficulties, the transition was successful in the midst of the pandemic, with the verification of the resource performed on February 26, 2021, and the forty-five courses approved after three weeks of verification on 19th March 2021. Presently, the University is proposing an additional thirty-three courses for approval by the Nigeria University Commission (NUC). The University in collaboration with Joint Admission Matriculation Board (JAMB) opens the application portal of the school on 19th April 2021 for prospective students to apply for a change of institution to the University for their choice of degrees.
Corporate Governance and Leadership/ Corporate governance and leadership are interwoven in that successful leadership styles are directive, supportive, participative, and achievement-oriented which takes its root from effective corporate governance. Most importantly in times of crisis such as the Covid-19 pandemic, a good leadership style coupled with excellent corporate governance serves as important and efficient tools in the sustainability of organizations and public sector institutions (Madueke et al., 2021).
Corporate governance is the structure of rules, practices, and processes used to direct and manage an institution. It is the system in which institutions and organizations are controlled and managed for sustainability (Chukwujioke, 2018; Matei & Drumasu, 2015). It represents the relationship between the management of an institution and employees in order to monitor and achieve set goals, successful accomplishment of responsibilities, efficient allocation of resources with respect to the right of all the parties involved (Eze & Chiamaka, 2016; Madueke et al., 2021; Sá & Serpa, 2020) and the authority, administration, responsibility, guidance, management and control within an organization (Ansell et al., 2020; Atoyebi et al., 2012). Corporate governance in public administration according to Mcmullin and Raggo (2020) entails selflessness, integrity, objectivity, accountability, openness, honesty, and leadership.
As noted by Budiarso and Mir (2012), leadership is an act of leading a group of people for the promotion and achievement of set goals through effective governance practices. It is an instrument of goal achievement which enables followers in accomplishing set goals. Leadership is the
137
combination of traits, characteristics, and behaviour possessed by a leader in order to institute change (Jaimes-valdez & Jacobo-hernandez, 2016; Muojgbo, 2013). An effective leadership style demonstrated in an environment of excellent corporate governance enables transformation and sustainability in an institution through goal setting, path clarification, coaching, directing, assisting subordinates to overcome obstacles most especially in times of crisis and the active involvement of the leader (Chigudu et al., 2020; Dunlop et al., 2020).
Theoretical Framework: Path-Goal Theory
This study is anchored on path-goal theory as popularized by Robert House in 1971 and revised in 1996. The theory posits that a leader’s style is reliant on the motivation, performance, and satisfaction of his or her subordinates. In particular, the theory argues that a leader engages in behaviours that complement subordinates’ abilities and compensate for deficiencies in achieving the designated goals. It stresses the relationship between leadership style and characteristics of subordinates by suggesting that subordinates are motivated for performance in an environment that provides encouragement in the midst of challenges. The leader is expected to define goals, clarifies paths, provide encouragement or assistance to overcome obstacles, adapt styles that suit the motivation of each subordinate, and provide supports to the subordinate in order to ensure goal productivity. Northouse (2001) states that leaders generate motivation for their subordinates by clarifying the path to goals through coaching and direction by making the work personally satisfying to the subordinate and provide a system of reward in the work environment.
Ansel et al. (2020) expressed that effective corporate governance coupled with good leadership styles is paramount in subordinate motivation and goal achievement. Leadership styles such as directive, supportive, participative, and achievement-oriented with excellent corporate governance often yield a positive motivation for subordinates’ performance in a time of crisis. According to Lefton and Buzzotta (2004), a leader set clear standards for performance, provides guidance, establish a timeframe for goal achievement, attends to the well-being of subordinates and treats them as his equal, consult with subordinates and integrate their suggestions into decision making and also challenge subordinates for performance at the highest possible level. These leadership styles form the basis of effective corporate governance. According to Northouse (2016), the criticisms of the theory is that it is complex to determine the exact motivation that suits different subordinate, lacks empirical evidence, fails to explain the correlation between leadership styles and subordinates’ motivation and the theory is directed towards subordinates by removing the possibility of their ability to influence the leader. Nonetheless, this theory effectively explains the relationship between corporate governance and leadership.
Reviews of Empirical Literatures
With the aim of assessing the influence of corporate governance and leadership in the sustainability of organizations in the post Covid-19 era, Ansell et al. (2020) stated that turbulent problems in public administration call for robust governance and leadership solutions that are sufficiently adaptable, agile, and pragmatic to upheld goals in the midst of continuous disruption. Using content analysis, Sá and Serpa (2020) revealed that the Covid-19 pandemic serves as an opportunity to foster sustainability of teaching in higher education through the redefinition of leadership model. Similarly, the explorative study of Madueke et al. (2021) stated that transformational leadership
138
with good corporate governance will bring about the development and sustainability of public institutions. Likewise, Atoyebi et al. (2012) made use of correlation analysis to show that effective leadership and good corporate governance determine the success of organizations. In addition, the explorative study of Eze and Chiamaka (2016) revealed that companies desiring sustainability need to embrace good leadership and sound corporate governance such as transparency, accountability, and probity. Futhermore, Matei and Drumasu (2015) stated in their explorative study that corporate governance aids in developing, improving management, and sustainability of public sector administration which enables public personalities (politicians, public servants) to gain the trust of the citizens.
Research Setting and Study Population
The study was carried out in Bamidele Olumilua University of Education, Science, and Technology, Ikere Ekiti. The institution, the defunct College of Education, Ikere Ekiti, now offers degree programmes with about 5,000 students as a new public University in Ekiti State, established on October 14, 2020. The University has gone through resource verification by NUC on February 26, 2021, has facilities to offer degree programmes with 297 teaching staff, 578 Senior Administrative and Technical Staff, and 125 Junior Administrative and Technical Staff, which amounts to 1000 staff of the University. The study population, however, for this study is 703 staff of both senior and junior administrative staff.
Methodology
The study employed an exploratory-descriptive research design. It is exploratory because it is a novel study that exposed Bamidele Olumilua University of Education, Science, and Technology, Ikere Ekiti, adopted corporate governance and leadership during post COVID-19. It is also descriptive as it describes the type of corporate governance and leadership of the institution and the relationship between the institution’s corporate governance and leadership. For the sampling of the University, Administrative and Technical Staff who dictate, moderate, monitor, and evaluate the activities of the institution, a triangulation of stratified, simple random, and purposive sampling were engaged to choose staffs with their heads from four (4) departments in the Administrative and Technical Buildings of the institution. Yaro Yamane formula was used to calculate and arrive at 351 staff from a total number of 703 Administrative and Technical Staff Questionnaires and Key Informant interviews were engaged for data collection and elicited responses were analyzed.
Result and Discussion
The following findings reflect the responses from the questionnaires distributed and interviews done among the 351 BOUESTI Administrative and Technical staff. The data collection took a month due to the busy schedule of the staff and only 173 questionnaires out of the questionnaire distributed and four (4) interviews out of 5 interviews conducted were analyzed and discussed below. Some questionnaires that were not filled and not properly filled were exempted from the analysis.
Table 1 interprets that a little above a quarter, 27.5%, of the non-academic staffs of Bamidele Olumilua University of Education, Science, and Technology were between the ages of 40 to 45years,
139
21.4% were between 50 years and above, 15.6% were between 35 to 40 years of age, 30-35 years and 25-30 years represented 12.7% of the staffs respectively and 10.4% were between 45-50 years. Thus, it could be inferred that the non-academic staff represented Nigeria’s active working population which is from 15 to 65 years of age. The marital section interprets that almost all the non-academic staffs of Bamidele Olumilua University of Education, Science, and Technology, 83.2%, were married, 14.5% were single, 1.7% were divorced and 0.6% were widowed. Thus, it could be inferred that the majority of the non-academic staff were married. Also, the gender section interprets that a little above half of the non-academic staff of Bamidele Olumilua University of Education, Science and Technology were male and 45.7% were female. Thus, it could be inferred that the majority of the non-academic staff were male and the working population accommodates both genders at a favorable proportion, the religion section interprets that almost all the nonacademic staffs of Bamidele Olumilua University of Education, Science and Technology were Christians, 17.9% were Islam and 1.2% were practicing other religion. Thus, it could be inferred that the majority of the non-academic staff were Christians and this validates that the most practiced religion in Ekiti state is Christianity while the education status section interprets that 46.2% of the non-academic staff of Bamidele Olumilua University of Education, Science, and Technology were B.Sc. holders, 26.6% were NCE/OND holders, 9.2% holds professional qualification, 8.7% holds a master degree, 7.5% were SSCE holders and 1.7% were Ph.D. holders. Thus, it could be inferred that the status of the institution as a research community employs more degree holders of different disciplines to carry out supporting or adjunct administrative duties.
Table 2 statements results- 1, 2, 3, 4, 5, 6, 7, and 8 which are above the calculated mean cut off score of 3.0. are accepted have the following individual mean scores of 3.99, 3.91, 4.02, 3.95, 3.72, 3.82, 4.20 and 4.22. This infers that Bamidele Olumilua University of Education, Science and Technology, Ikere Ekiti, corporate governance has helped in the sustainable transitioning of BOUESTI in the Post COVID-19 era. The findings of this study are validated by the study of Ansell et al. (2020), Madueke et al. (2021), Matei and Drumasu (2015), Atoyebi et al. (2012), and Eze and Chiamaka (2016) which states that sustainability in the public sector requires good and robust governance and most especially in the postCOVID-19 era as stated by Ansell et al. (2020) and Madueke et al. (2021). The qualitative responses also express that the school managements adopt rules and policies that have aid the sustainable transitioning of BOUESTI in the financing, the relationship between the management and staffs, the modality of work during and after COVID-19, and the adherence to the COVID-19 policies set out by the government. A participant explains thus:
The policies and practices of the university have actually helped in its successful transitioning. The school is known for its disciplined attitude. The workers are disciplined, respectful, cooperative, and respect authority. During the COVID-19, things were hard and the university was unable to pay the salary of their staff fully, but the staff endured believing that the management needs their cooperation. From January to December of 2020, only a percentage of staff salary was paid. The relationship between the management and staff has been good and that is why the staff has been cooperative. The management dialogue with the staff makes them to be more cooperative (Admin. staff/BOUESTI/Bursar’s Office/23 years of experience).
140
Table 1
Percentage Distribution of Respondents by Socio-Demographic Characteristics of Respondents
Variable Groupings Frequency (N=173) percentage (%)
Age 25-30 30-35 35-40 40-45 45-50 50 and above
22 22 27 47 18 37
12.7 12.7 15.6 27.2 10.4 21.4
Total 173 100.0
Marital status Single Married Divorced Widowed
14.5 83.2 1.7 0.6 Total 173 100.0
25 144 3 1
Gender Male Female 94 79 54.3 45.7
Total 173 100.0
Religion Christianity Islam Other
140 31 2
80.9 17.9 1.2
Total 173 100.0
Educational status SSCE NCE/OND B.Sc. and Equivalent M.Sc. Ph.D. Professional Qualification
14 46 80 15 3 16
7.5 26.6 46.2 8.7 1.7 9.2
Total 173 100.0
Source: Field Survey, 2021
141
Table 2
Percentage distribution of Participants by the influence of corporate governance in the sustainable transitioning of BOUESTI in the post COVID-19 era
5 4 3 2 1 X
Questions SA A UN SD D Mean
The policies, rules and practices used to manage BOUESTI has helped in its sustainable transitioning in the post Covid-19 era.
The relationship between the management of BOUESTI and the employees (non-administrative staffs) has been cordial and satisfactory.
The relationship between the management of BOUESTI and the employees (non-administrative staffs) has helped in its sustainable transitioning goal.
The relationship between the management of BOUESTI and the employees at all levels has aids the successful accomplishment of responsibilities towards the transitioning.
The management of BOUESTI has taken into consideration the rights, security and welfare of employees in its resources allocation during and after Covid-19.
The management of BOUESTI provided enough guidance to employees throughout the course of the transitioning exercise.
The vice-chancellor exercises selflessness, integrity and objectivity in the sustainable transitioning of BOUESTI.
The vice-chancellor exercises accountability, openness and honesty in the financial management of BOUESTI for its sustainable transitioning.
Source: Field Survey, 2021
60 76 21 5 10 3.99
52 82 20 10 9 3.91
65 71 20 10 7 4.02
55 86 13 9 9 3.95
38 92 16 12 14 3.72
41 98 10 12 11 3.82
85 59 15 8 6 4.20
85 61 14 8 4 4.22
Similarly, another participant affirms that Post COVID-19 has made sustainable transitioning of BOUESTI possible:
The policies, rules, and practices adopted by the present leadership have been helpful because it is a transparent one. The leader called upon all the members of staff, union leaders, students and carry them along in its administration. He sells his idea to them and once they buy it, it will be implemented. The leadership makes all staffs, unions, and students understand the benefit of the transitioning and what they stand to gain. The leadership was plain and truthful to the people by telling them that they need to make sacrifices for the school to move forward. Everyone
142
was happy and ready to make the sacrifice. The staff, management and students, unions were all indirectly involved in setting policies, rules, and practices of BOUESTI. This has actually aided the sustainable transitioning of the school in the midst of the pandemic (Admin. staff/BOUESTI/Vice Chancellor’s Office/18years of experience).
One of the administrative staff succinctly expresses thus: The school has good leadership. The vice-chancellor has adhered to the rules and policies guiding the school and that makes it easy for the staff to follow suit thereby making the relationship between the staff and the management to be cordial. There was no friction in the relationship between the management and staff as the staff easily and willingly obeys the rules given by the management (Admin. staff/BOUESTI/ Salary, Pension and Advances/26 years of experience).
The above responses expose that the corporate governance adopted by the University has aided the sustainable transitioning of BOUESTI. This is validated by the study of Sá and Serpa (2020) that the Covid-19 pandemic serves as an opportunity to foster sustainability of teaching in higher education through the redefinition of the leadership model. The authorities at the helm of affairs of BOUESTI have shown that the COVID-19 pandemic is not a barrier to effective administration and sustainable transitioning of the school academic and extra-curricular activities.
Table 3 statements results- 9, 10, 11, 12, 13, 14, 15, 16, 17, and 18 which are above the calculated mean cut off score of 3.0 are accepted have the following individual mean scores of 4.15, 4.16, 3.92, 3.67, 3.95, 3.75, 3.90, 3.95, 4.10, 4.19. This infers that Bamidele Olumilua University of Education, Science, and Technology, Ikere Ekiti, leadership style has helped in the sustainable transitioning of BOUESTI in the post-COVID-19 era. The findings of this study are affirmed by the study of Sa and Serpa (2020), Madueke et al. (2021), Atoyebi et al. (2012), and Eze and Chiamaka (2016) which states that effective leadership is vital in the sustainability of the public sector and a redefinition of leadership model is needed in the post-COVID-19 era. The qualitative responses also express that the leadership styles adopted by the BOUESTI have positively affected the school because it has brought innovation to the activities and improve the relationship between the staff and management. A participant explains thus:
The change of leadership has actually affected the school positively because the vice-chancellor is innovative. He is pro-active, always working, creative and considerate towards the staff. The staffs are satisfied with the leadership style adopted by the vice-chancellor (Admin. staff/ BOUESTI/ Deputy Vice-Chancellor’s office/ 14 years of experience).
Likewise, another participant posits that the COVID-19 pandemic has been a blessing in disguise to the school:
The Covid-19 has indirectly improved the leadership and management of BOUESTI. Although it left the school with some negativity, it improved the school because an innovative way of learning (e-learning) was brought to the school by the leadership.
143
Table 3
Percentage distribution of Participants by the implication of leadership style on the sustainable transitioning of BOUESTI in the post COVID-19 era 5 4 3 2 1 X
Questions SA A UN SD D Mean
The vice-chancellor has demonstrated a good leadership style which has aid the sustainable transitioning of BOUESTI in the post-covid-19 era.
The vice-chancellor has excellent characteristics and behaviour which has aid the sustainable transitioning of BOUESTI.
My direct superior provided enough direction and responsibility clarification to me throughout the transitioning exercise.
My direct superior provided assistant and motivation to me during and after the covid-19 crisis.
79 65 14 7 8 4.15
73 79 5 8 8 4.16
51 89 11 13 9 3.92
53 70 11 20 18 3.67
My direct superior is actively involved in the sustainable transitioning of BOUESTI. 61 79 12 6 15 3.95
My direct superior encourages me during and after the covid-19 crisis. 52 76 13 14 18 3.75
I am satisfied with the leadership style adopted by my direct superior 58 77 17 6 15 3.90
The vice-chancellor consults with employees and integrates their suggestions into the decision-making process.
The vice-chancellor challenges employees for performance at the highest possible level.
BOUESTI has strong corporate governance and leadership which has assisted in the sustainable transitioning in the post-covid19 era.
Source: Field Survey, 2021
50 91 13 13 6 3.95
57 94 9 10 3 4.10
68 86 9 3 6 4.19
The staffs that were not technologically inclined improve their technical skills including the students. The negative impact Covid-19 brought to the school was the area of finances. There was no payment of school fees because students were not in school. The leadership also gave the students the opportunity to pay their fee twice (70% first and 30% second). The school fee of students happens to be the major
144
source of IGR to the school and till present, the school is still facing the issue of finance. However, the management tried all they could to keep the school running. The management has been considerate as regards students’ and staff’s welfare and the pandemic has been a blessing in disguise by bringing innovation to the school. The leadership has been friendly, transparent, understanding, has a listening ear, relates with all staff individually. This has made the staff to become open-minded. The leadership style patiently corrects any staff with a wrong view. The leadership bows to intellectual argument because if it sees that another person’s idea either young or old is greater than his, he will adopt such idea. This makes the staffs feel wanted, embraced, and have a sense of belongings (Admin. staff/ BOUESTI/ ViceChancellor’s office/ 18 years of experience).
In support of the above response, another participant extensively explains that:
There has been a lot of positive changes in the area of relationship. The members of the staff are free to the management including the union. This is due to the way the vice-chancellor handled the staff under him. Every staff accepted the vice-chancellor when he came on board as the provost of the defunct college because of the way he accepted everybody despite their weakness. He is very accommodating. The staffs were all happy when the defunct college transition into university because they know that it is going to assist them most especially in the area of their finances, believing that the salary scale will soon change from that of college to university. The number of enrollment into college has been dwindling and I believe that with the transition, the school will be able to attract more students which will aid the finances of the school. The leadership style adopted by the vice-chancellor has been satisfactory to the staff which has actually aid the successful transitioning of the school. The vice-chancellor runs an open administration (Admin. staff/ BOUESTI/ Salary, Pension and Advances/ 26 years of experience).
The above responses justify that the leadership style adopted by BOUESTI has aided its sustainable transitioning. This is authenticated by the study of Madueke et al. (2021) that transformational leadership with good corporate governance will bring about the development and sustainability of public institutions. The vice-chancellor of BOUESTI and other administrators in their respective discharge of duties have shown that the COVID-19 pandemic is an innovative way of responding to difficult situations.
Conclusion and Recommendations
Based on the findings of the study, it is concluded that the rules, policies, and practices adopted by Bamidele Olumilua Univeristy of Education, Science and Technology have improved the relationship between the management and staff and set a structure for the modality of responsibility performance among staffs during and after the COVID-19 pandemic. Also, the leadership style adopted has brought about series of innovation, part of which include the transitioning of the defunct college of education to university. The daring attitude of the Vice-Chancellor has enabled the forty-five courses presented to the NUC accreditation team to be accepted. In addition, the University’s management has adhered to the rules guiding COVID-19 set out by the government which has aided the welfare of staff. All these have contributed to the sustainable transitioning of
145
the school in the post-COVID-19 era and will continue to aid the sustainability of the University in the future. The study, therefore, recommends that management of BOUESTI in post COVID-19 era should further employ innovative ways of improving the school’s internally generated revenue (IGR) in order to cater for staffs’ welfare and for the sustainable running of the school, empower staffs with information technology that will aid the sustainable performance of their daily activities and invest in staffs training in terms of research and teaching in order to position the university as one of the 21st century emerging leading university in the post COVID-19 era university rating.
References
Adeosun, O. T., & Adebowale, I. O. (2022). Property tax and sustainable development in Ekiti State: citizens’ perspective. Central European Journal of Public Policy, 16(2), 1-12. Doi:10.2478/cejpp2022-0006
Ansell, C., Sørensen, E., & Torfing, J. (2020). The COVID-19 pandemic as a game changer for public administration and leadership? The need for robust governance responses to turbulent problems. Public Management Review, 1–12. Doi:10.1080/14719037.2020.1820272
Atoyebi, K. O., Adekunjo, F. O., Kadiri, k. I., Ogundeji, M. O., & Falana, A. A. (2012). The impact of corporate governance and leadership on entrepreneurship development in Nigeria. Journal of Humanities and Social Science, 6(2), 46–68.
Budiarso, A., & Mir, M. (2012). The role of leadership in sustainable public sector performance. ACRN Journal of Enterprenuership Perspectives, 1(2), 1–24. https://www.researchgate.net/publication/233208704
Chigudu, D., Prasad, D. A., & Lim, A. F. (2020). The impact of corporate governance and leadership on organizational success. The International Journal of Business and Management, 7(5), 2–14. https://doi.org/10.24940/theijbm/2019/v7/i5/BM1905-059
Chukwujioke, K. (2018). Effect of ethical leadership on corporate governance , performance and social responsibility : a study of selected deposit money banks in Benue State, Nigeria. International Journal of Community Development and Management, 2, 19–35. http://ijcdms.org/Volume02/v2p019-035Agbim4291.pdf
Dunlop, C. A., Ongaro, E., & Baker, K. (2020). Researching COVID-19: A research agenda for public policy and administration scholars. Public Policy and Administration, 35(4), 365–383. https://doi.org/10.1177/0952076720939631
Eze, N. M., & Chiamaka, E. P. (2016). Corporate governance and leadership : Is there a nexus ? Journal of Business and Management, 18(4), 1–8. https://doi.org/10.9790/487X-1804010108
Jaimes-valdez, M. A., & Jacobo-hernandez, C. A. (2016). Sustainability and corporate governance : Theoretical Development and Perspectives. Journal of Management and Sustainability, 6(3), 44–56. https://doi.org/10.5539/jms.v6n3p44
Kniffin, K. M., Ansell, F., Ashford, S. P., Bakker, A. B., Choi, V. K., Creary, S. J., Flynn, F. J., Gelfand, M. J., Klein, P. G., Petriglieri, J. L., Rothbard, N. P., Rudolph, C. W., Shaw, J. D., Wanberg, C. R., Wilmot, M. P., Vugt, M. Van, Kniffin, K. M., Petriglieri, J. L., Flynn, F. J., Lee, S. Y. (2020). COVID19 and the workplace : Implications ,issues , and insights for future research and action.
Lefton, R. E., & Buzzotta, V. R. (2004). Leadership through people skills. USA. McGraw-Hill Madueke, O., Iheonu, A., & Emmanuel, O. E. (2021). Post Covid-19 Pandemic Nigeria : Implications for good governance and development. Journal of Public Administration and Social Welfare Research, 5(2), 1–13. https://doi.org/10.2139/ssrn.3632039
Matei, A., & Drumasu, C. (2015). Corporate governance and public sector entities. Procedia
146
Economic and Finance, 26(15), 495–504. https://doi.org/10.1016/S2212-5671(15)00879-5
Mcmullin, C., & Raggo, P. (2020). Leadership and governance in times of crisis : A balancing act for nonprofit boards. Nonprofit and Voluntary Sector Quarterly Symposium Issue, 49(6), 1–9. https://doi.org/10.1177/0899764020964582
Muo]gbo, U. S. (2013). The impact of value-based leadership and corporate governance on organisational performance : A study of some selected firm in South-East Nigeria. International Journal of Business and Management Invention, 2(1), 47–55.
Northouse, P. G. (2001). Leadership theory and practice (2nd ed.). London. Sage Publishers, Inc. Northouse, P. G. (2016). Leadership theory and practice (7th ed.). London, United Kingdom: SAGE Publications, Inc.
Ozili, P. K. (2020). COVID-19 Pandemic and economic crisis: The Nigerian experience and structural causes. SSRN Electronic Journal, September. https://doi.org/10.2139/ssrn.3567419
Sá, M. J., & Serpa, S. (2020). The COVID-19 pandemic as an opportunity to foster the sustainable development of teaching in higher education. Sustainability, 12(20), 1–16. https://doi.org/10.3390/su12208525
Salvioni, D. M., Franzoni, S., & Gennari, F. (2016). Corporate governance systems and sustainability : Corporate social responsibility as a factor of convergence between outsider and insider systems. Corporate Ownership and Control, 14(1), 139–150.
Acknowledgment
I acknowledge Ayomide Augustine Ilori for his assistance with the data collection, his guidance in the analysis and proof reading of the study.
147
DIRECTIONS FOR CONTRIBUTORS
The Journal of Higher Education Management is published by the American Association of University Administrators. The Journal’s purpose is to promote and strengthen the profession of college and university administration. The Journal provides a forum for: (a) a discussion of the current issues, problems and challenges facing higher education; (b) an exchange of practical wisdom and techniques in the areas of higher education leadership, policy analysis and development, and institutional management; and (c) the identification and explication of the principles and standards of college and university administration.
Manuscripts should be written for the college or university administrator who has the general responsibilities of educational leadership, policy analysis, staff development, and/or institutional management. Practical as well as scholarly-oriented submissions are welcome. Only original manuscripts that have not been published elsewhere are considered.
Authors should be guided by the following submission requirements:
Manuscripts must be submitted as MSWord documents, using the following layout specifications. ▪ Page Layout: 8½ x 11” paper; 1 inch margins; avoid special layout options— do not use headers or footers, do not insert page or section breaks, do not include page numbers. ▪ Font: Times New Roman (size 12, regular). ▪ Paragraph Layout: do not include any special spacing either both before or after paragraphs (set before and after spacing at 0pt.); use double line spacing; begin each paragraph with a ¼” indentation, indent extended quotations ½”, do not indent anything else.
All charts, tables, figures, etc. should be placed at the end of the manuscript. Authors should provide directions to the editor regarding placement of these items by including a comment in the text (i.e., “INSERT TABLE #1 ABOUT HERE.”) All such insertions must be able to fit horizontally within the margins, must be set vertically on the page, and must fit on a single page (no page-over breaks to multiple pages). Care should be taken to ensure visual clarity. All items must be in black-and-white; no color illustrations.
At the top of the manuscript (before the title), provide each author’s name, institutional affiliation, and preferred email address. (These will be removed before the manuscript is sent out for review.)
Manuscripts are not restricted to a single style format, but they must conform to the latest standards of a recognized style manual (e.g., APA, Chicago, MLA, etc.).
Manuscripts are blind reviewed and are published only upon the favorable recommendation of three reviewers. (Over the past ten years, evaluative standards for publication in the journal have risen significantly. For the period of 2017-2021, fewer than 45 percent of submitted manuscripts have been published.)
The Journal charges no publishing or page-cost fees; nor are authors remunerated for their work. Authors are required to assign their copyright entitlements to the Journal. All manuscripts should be submitted electronically to the Editor-in-Chief at EDITOR@AAUA.ORG.
148
Publication of the Journal of Higher Education Management is sponsored by the American Association of University Administrators (AAUA)
AAUA Officers and Board of Directors
Board Executive Committee
Chairperson: William Hill, Assistant Dean, College of Education, Wayne State University.
Chairperson-elect: Dean Hoke, Managing Partner, Edu Alliance Group.
Vice Chairperson—Awards: Jerome E. Neuner, Associate Vice President for Academic Affairs (retired), Canisius College.
Vice Chairperson—Membership: Elizabeth A. Gill, Vice President for Academic Affairs, Austin College.
Vice Chairperson—Professional Development: Greg Paveza, Consultant/Owner, Thunderbird Higher Education Consulting.
Vice Chairperson—Publications: Sr Ann M Heath, IHM, Director of Doctoral Program in Higher Education, Immaculata University.
Vice Chairperson and Treasurer: Thomas J Botzman, President (retired), University of Mount Union.
Immediate Past Chairperson: Christine K Cavanaugh, President and Executive Coach, Pathseekers II, Inc.
Dan L King, President and Chief Executive Officer, American Association of University Administrators.
Board of Directors
Sandra Affenito, Vice Chancellor for Academic Affairs, Johnson & Wales University.
Damon P. S. Andrew, Dean, College of Education, Florida State University.
Raymond Bandlow, Director of Doctoral Programs in Education, Gwynedd Mercy University.
Joe Bertolino, President, Southern Connecticut State University.
(2022-23)
Eve Krahe Billings, Dean of Research and Innovation, University of Phoenix.
Christopher Blake, President, Middle Georgia State University.
Santarvis Brown, Chief Academic & Operating Officer, Kenner University.
Lynn M Burks, Executive Director, Jacobson Institute, Grand View University.
Daniel Campbell, Director of Institutional Research, University of Alaska, Anchorage.
John C. Cavanaugh, President and Chief Executive Officer (retired), Consortium of Universities of the Washington Metropolitan Area.
Ruma Chopra, Professor of History and Interim Director of the Honors Program, San Jose State University.
Kathleen Ciez-Volz, Associate Provost for Curriculum and Instruction, Florida State College at Jacksonville.
Juanita Cole, Dean of the College of Arts, Humanities and Social Sciences, California State University, Monterey Bay.
Colin M Coyne, Vice President for Finance, Business Affairs and Strategy, Samford University.
Judson C Edwards, Dean, Sorrell College of Business, Troy University.
Kenneth England, Executive Vice President and Chief Financial Officer, Spring Hill College.
Henry Findlay, Assistant Dean (retired), School of Education, Tuskegee University.
L. Dean Fisher, President, College of Southern Idaho.
Tymon M. Graham, Associate Vice President for Student Services, Edward Waters
Chris Hubbard Jackson, Director of Institutional Research, Saint Charles Community College.
149
C. Eric Kirkland, Rector, Zetta University (Romania).
Jeffrey B. Leak, Professor of English and Director of American Studies, University of North Carolina at Charlotte.
Karen M Lee, Associate Vice President for Academic Administration, University of Detroit Mercy.
Pedro Martinez, Professor of Education, Central State University.
Scott E Miller, Senior Vice President for Academic Affairs and Provost, Pennsylvania Western University.
Tye V Minckler, independent higher education consultant.
Roland W Mitchell, Dean, College of Human Sciences and Education, Louisiana State University.
David Nickel, independent higher education consultant.
James M. Owston, Associate Provost, Alderson Broaddus University.
Rose Rossi, Associate Dean for Academic Affairs, School of Nursing, Widener University.
Lance E Tatum, Senior Vice Chancellor for Academic Affairs, Troy University.
Neil Trotta, Assistant Dean, School of Graduate Studies, Fisher College.
Clara Wajngurt, Professor of Mathematics, Queensborough Community College—City University of New York.
Shelley B. Wepner, Dean, School of Education, Manhattanville College.
Helen Easterling Williams, Dean, Graduate School of Education and Psychology, Pepperdine University.
Julie E. Wollman, Professor of Practice in Higher Education, University of Pennsylvania.
150