haematologica


VOL. 107 NOVEMBER 2022Journal of the Ferrata Storti Foundation ISSN 0390 - 6078haematologica.org

2527 Images from the Haematologica Atlas of Hematologic Cytology: Gaucher disease Rosangela Invernizzi https://doi.org/10.3324/haematol.2022.281777
2528
What doesn’t kill you makes you stronger – bcl-2 promotes survival independent of proliferation Aaron D. Schimmer https://doi.org/10.3324/haematol.2022.281644
2530
NOX2: a determinant of acute myeloid leukemia survival Courtney L. Jones https://doi.org/10.3324/haematol.2022.280677
2532 A sheep in wolf's clothing? Wild-type P53 disguises as mutant to promote leukemogenesis Margaret A. Ferris and John S. Welch https://doi.org/10.3324/haematol.2022.280671
2534 Mature T-cell neoplasms and stem cell transplant: the never-ending story Emmanuel Bachy https://doi.org/10.3324/haematol.2022.280658
2536
Thrombosis in multiple myeloma: risk stratification, antithrombotic prophylaxis, and management of acute events. A consensus-based position paper from an ad hoc expert panel
Valerio De Stefano et al. https://doi.org/10.3324/haematol.2022.280893
2548
Acute Myeloid Leukemia
Pseudo-mutant P53 is a unique phenotype of DNMT3A-mutated pre-leukemia
Amos Tuval et al. https://doi.org/10.3324/haematol.2021.280329
2562
Acute Myeloid Leukemia
The NADPH oxidase NOX2 is a marker of adverse prognosis involved in chemoresistance of acute myeloid leukemias
Rosa Paolillo et al. https://doi.org/10.3324/haematol.2021.279889
2575
Acute Myeloid Leukemia
Persistent DNA damage and oncogenic stress-induced Trem1 promotes leukemia in mice Xue Li et al. https://doi.org/10.3324/haematol.2021.280404
2589
Acute Myeloid Leukemia
Interplay between hypertriglyceridemia and acute promyelocytic leukemia mediated by the cooperation of peroxisome proliferator-activated receptor-a with the PML/RAR a fusion protein on super-enhancers Shishuang Wu et al. https://doi.org/10.3324/haematol.2021.280147
2601 Acute Myeloid Leukemia
Meis1 supports leukemogenesis through stimulation of ribosomal biogenesis and Myc Maria-Paz Garcia-Cuellar et al. https://doi.org/10.3324/haematol.2022.280831
2617 Cell Therapy & Immunotherapy
Phenotypic and functional characterization of the CD6-ALCAM T-cell co-stimulatory pathway after allogeneic cell transplantation
Benedetta Rambaldi et al. https://doi.org/10.3324/haematol.2021.280444
2630 Chronic Lymphocytic Leukemia
A clinical practice comparison of patients with chronic lymphocytic leukemia with and without deletion 17p receiving first-line treatment with ibrutinib Anthony R. Mato et al. https://doi.org/10.3324/haematol.2021.280376
2641 Chronic Myeloid Leukemia
Patient- and physician-reported pain after tyrosine kinase inhibitor discontinuation among patients with chronic myeloid leukemia
Kathryn E. Flynn et al. https://doi.org/10.3324/haematol.2021.280377
2650 Coagulation & its Disorders
Evidence of protective effects of recombinant ADAMTS13 in a humanized model of sickle cell disease Paolo Rossato et al. https://doi.org/10.3324/haematol.2021.280233
2661 Coagulation & its Disorders
Relapse of immune-mediated thrombotic thrombocytopenic purpura following mRNA COVID-19 vaccination: a prospective cohort study Gaetano Giuffrida et al. https://doi.org/10.3324/haematol.2022.280702
2667 Histiocytosis
Erdheim-Chester disease: look it in the eye. An orbital magnetic resonance imaging study Julien Haroche et al. https://doi.org/10.3324/haematol.2021.280510
2675 Non-Hodgkin Lymphoma
Autologous stem-cell transplantation as consolidation of first-line chemotherapy in patients with peripheral T-cell lymphoma: a multicenter GELTAMO/FIL study Alejandro Martín García-Sancho et al. https://doi.org/10.3324/haematol.2021.279426
2685 Non-Hodgkin Lymphoma
Resistance to PI3Kd inhibitors in marginal zone lymphoma can be reverted by targeting the IL-6/PDGFRA axis Alberto J. Arribas et al. https://doi.org/10.3324/haematol.2021.279957
2698
Quality of Life
Total late effect burden in long-term lymphoma survivors after high-dose therapy with autologous stem-cell transplant and its effect on health-related quality of life
Knut Smeland et al. https://doi.org/10.3324/haematol.2021.280413
2708
Red Cell Biology & its Disorders
Assessment of functional shunting in patients with sickle cell disease
Liza Afzali-Hashemi et al. https://doi.org/10.3324/haematol.2021.280183
2720
Inflammation in Waldenström macroglobulinemia is associated with 6q deletion and need for treatment initiation
Nathalie Forgeard et al. https://doi.org/10.3324/haematol.2022.281053
2725
Histological and genetic characterization and follow-up of 130 patients with chronic triple-negative thrombocytosis
Sandrine Lemoine et al. https://doi.org/10.3324/haematol.2022.280917
2732
Extranodal presentation in limited-stage diffuse large B-cell lymphoma as a prognostic marker in three SWOG trials S0014, S0313 and S1001
Deborah M. Stephens et al. https://doi.org/10.3324/haematol.2022.281004
2737
Lack of efficacy of direct oral anticoagulants compared to warfarin in antiphospholipid antibody syndrome
Igor Giarretta et al. https://doi.org/10.3324/haematol.2022.281586
2742
A phase I/II multicenter, open-label, dose escalation and randomized trial of BI 836858 in patients with low- or intermediate-1-risk myelodysplastic syndrome
Rami S. Komrokji et al. https://doi.org/10.3324/haematol.2021.280500
2748
Minnesota acute graft versus-host disease risk score predicts survival at onset of graft versus-host disease after post-transplant cyclophosphamide prophylaxis
Federica Ardizzoia et al. https://doi.org/10.3324/haematol.2022.281269
2752
Pulmonary function testing for fitness assessment in asymptomatic adults with newly diagnosed acute myeloid leukemia
Raffaele Palmieri et al. https://doi.org/10.3324/haematol.2022.281445
2756
Pseudo-progression of adult T-cell leukemia-lymphoma after cord blood transplantation
Shigeo Fuji et al. https://doi.org/10.3324/haematol.2022.281175
2760
Maintaining osteoclastogenesis following allogeneic hematopoietic stem cell transplantation for osteopetrosis: evidence from in vitro testing
Süreyya Savaşan et al. https://doi.org/10.3324/haematol.2022.280895
Rosangela Invernizzi
University of Pavia, Pavia, Italy
E-mail: rosangela.invernizzi@unipv.it https://doi.org/10.3324/haematol.2022.281777
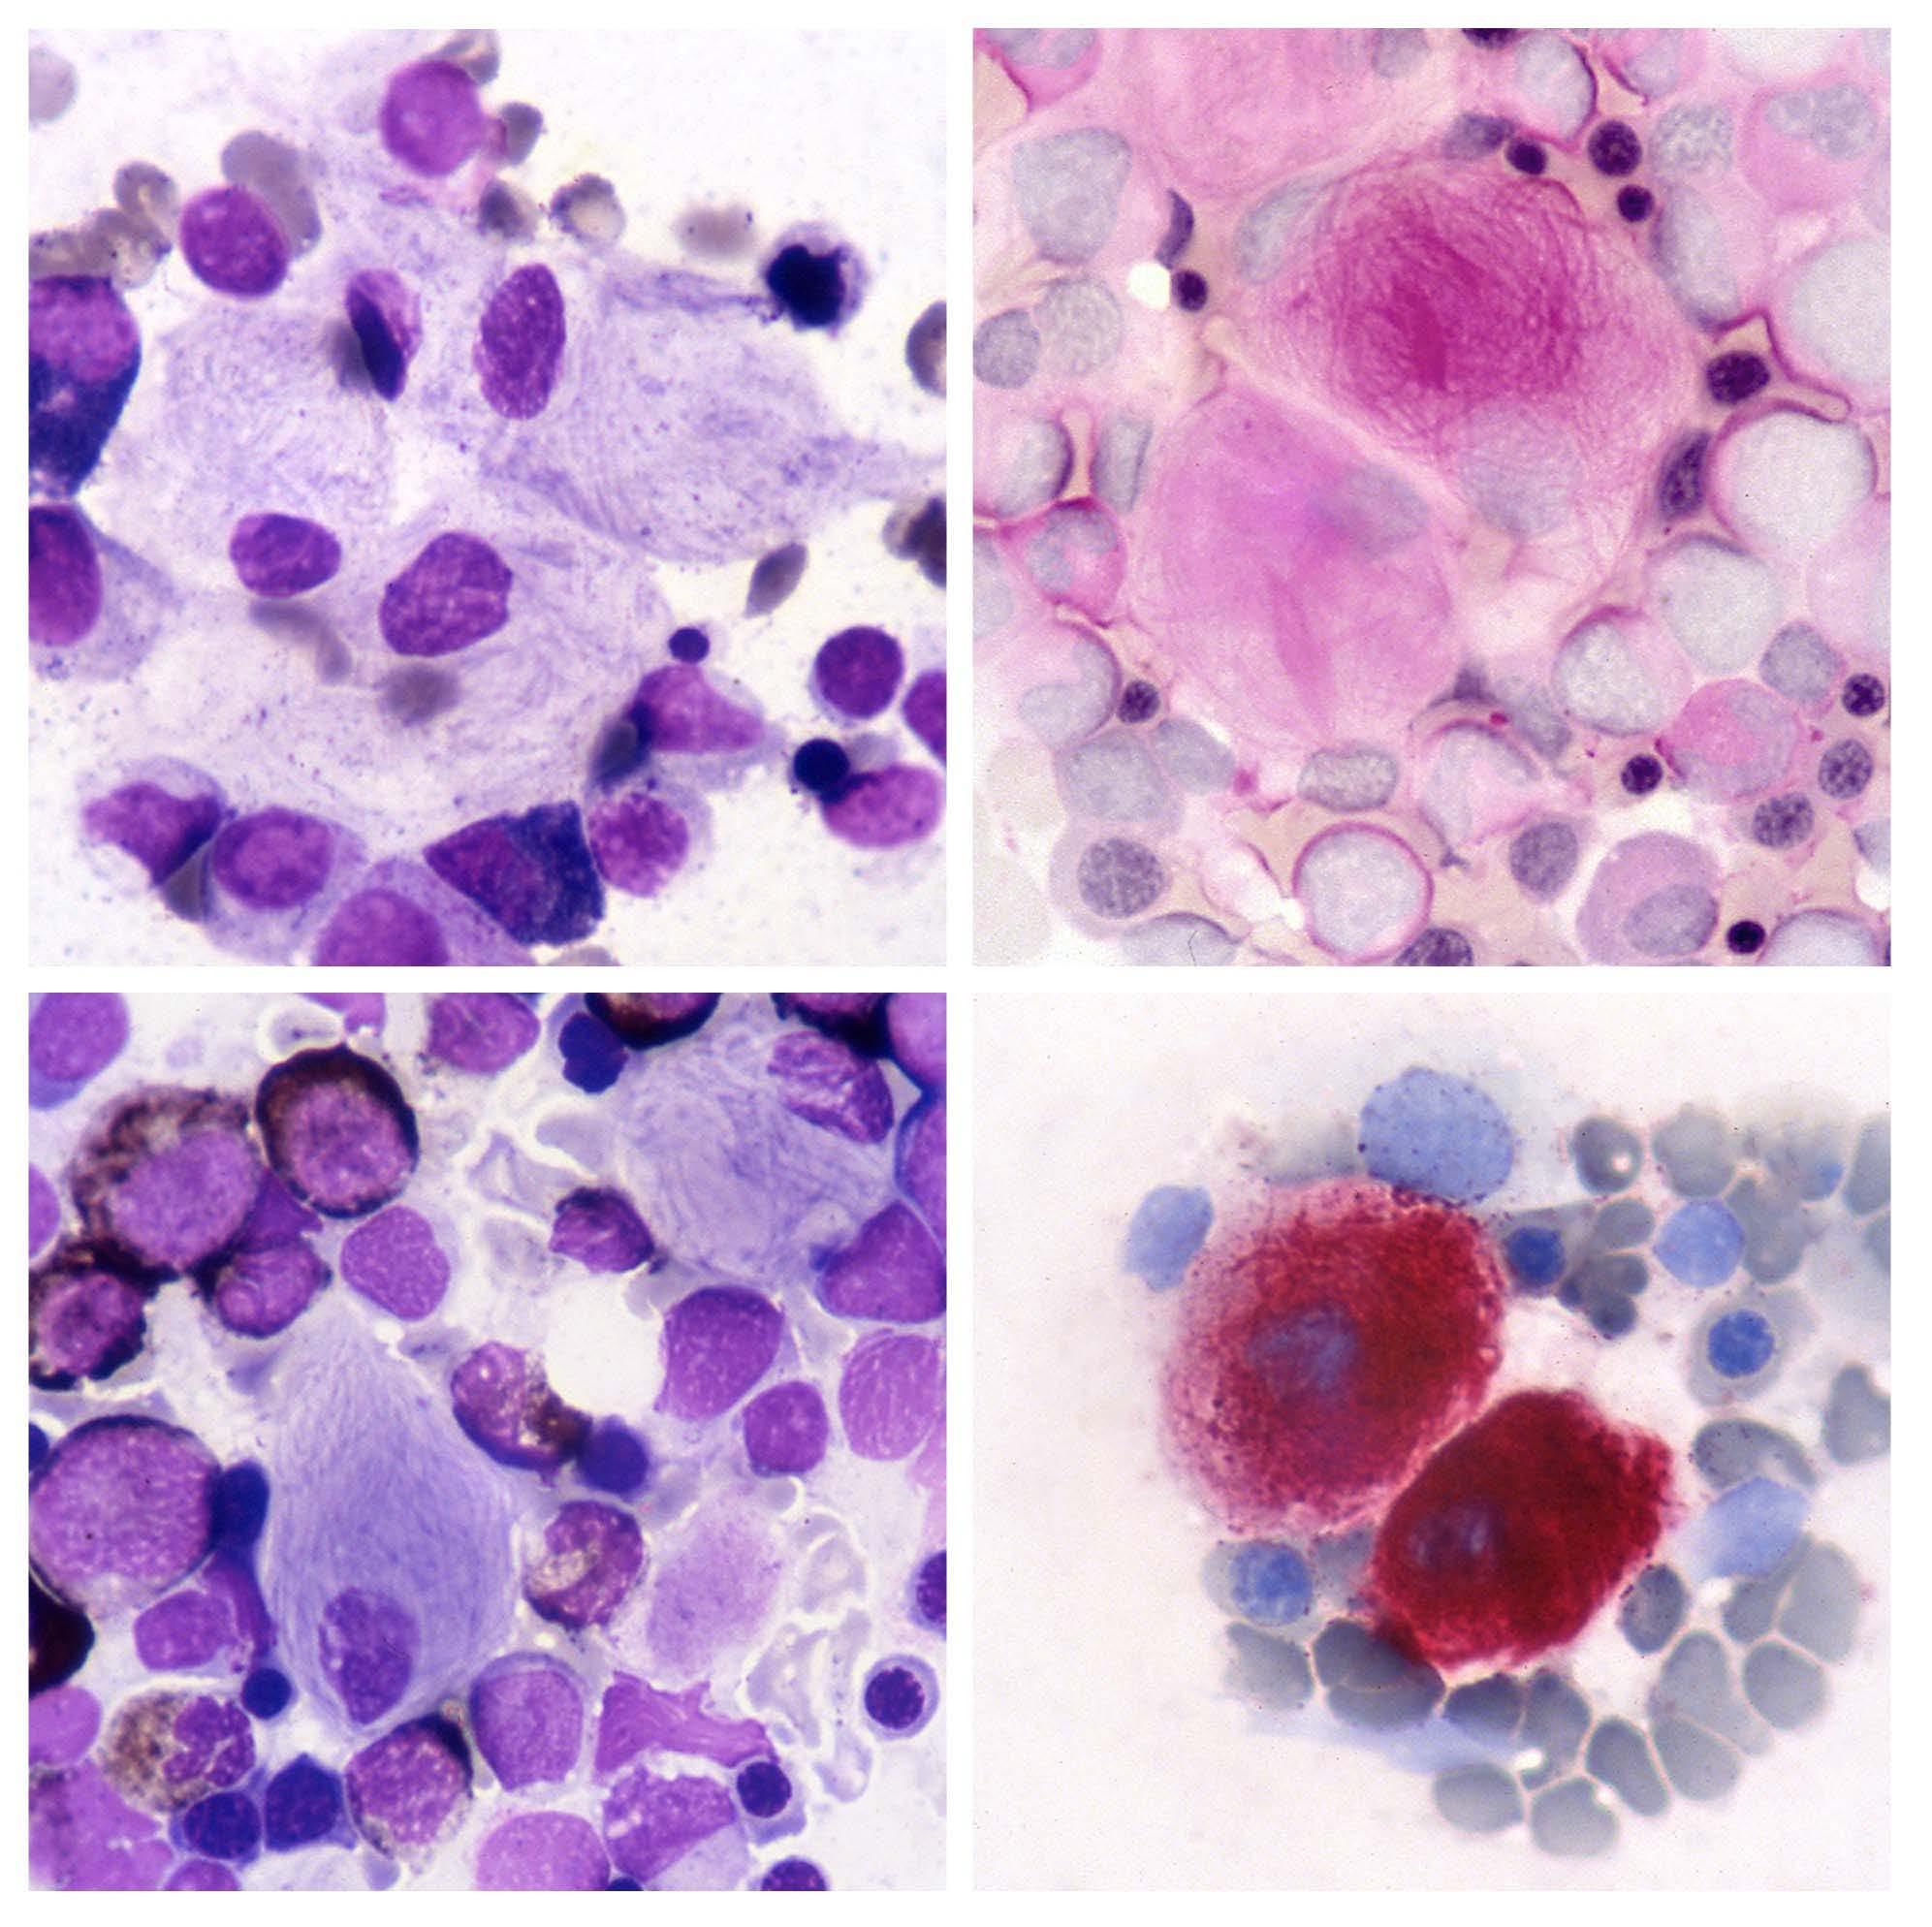
Gaucher disease is an inherited lysosomal storage disease characterized by the accumulation of glucocerebrosides (glu cosylceramide), in macrophages of liver, spleen, and bone marrow. This metabolic disorder results from a defect in the lysosomal β glucocerebrosidase enzyme due to gene mutations. The morphological features of pathological macrophages in the bone marrow are shown in the figure: they are distinctive and important for the diagnosis. Gaucher cells are large cells with a small, round, usually eccentric nucleus and abundant weakly basophilic cytoplasm with a fibrillar or 'onionskin' appearance (top left). The fibrillar appearance is due to the fact that lysosomes are elongated for lipid accumulation. Gaucher cells have a tendency to occur in groups. They are best seen in the thicker portions of bone marrow smears, i.e. at the ends and margins. Periodic acid Schiff (PAS) staining for polysaccharides shows strong positivity in Gaucher cells and highlights the fibrillar pattern of the cytoplasm (top right); normal PAS positivity is observed in neutrophils. Myeloid cells are normally positive for Sudan black stain, whereas Gaucher cells are negative (bottom left). They exhibit strong re activity for acid phosphatase (bottom right) that is tartrate-resistant. The diagnosis of Gaucher disease, suggested by morphological findings, should, however, be confirmed by assay of peripheral blood leukocytes for the β glucocerebrosi dase enzyme that is absent or very reduced. Measurement of enzyme levels may then be supplemented by mutational analysis.1
No conflicts of interest to disclose.
Princess Margaret Cancer Centre, University Health Network,

Ontario,
Combination therapy with the BCL-2 inhibitor, venetoclax, and hypomethylating agents produces high response rates in elderly patients with acute myeloid leukemia unfit for induction chemotherapy, setting a new standard of care for these patients.1 These clinical results build on decades of fundamental, translational, and clinical research into BCL-2 and apoptosis.
The bcl-2 gene (now known as BCL2) was originally disco vered in 1984 by Yoshihide Tsujimoto in Croce’s laboratory; he identified it as the fusion partner with the immunoglo bulin heavy chain locus in patients with B-cell malignan cies and the t(14;18) translocation.2 Subsequently, Reed et al. reported that bcl-2 was an oncogene, the first onco gene identified without a viral counterpart. However, the biological function and mechanism by which bcl-2 pro moted malignancy remained unknown.
In a landmark paper published in 1988, Drs. Vaux, Cory and Adams described the first cellular mechanism of action of bcl-2. 3 In their letter to Nature, a paper with three figu res and neither supplementary material nor volumes of extended data, they showed that overexpression of bcl-2 prevented cell death. Interleukin (IL)-3-dependent FDCP1 myeloid cells were transduced with human bcl-2 cDNA and then IL-3 was withdrawn. All control and c-myc-tran sduced FDC-P1 cells died 4 days after IL-3 withdrawal. In contrast, 60% of the cells overexpressing bcl-2 remained viable. Although viable, cells overexpressing bcl-2 did not proliferate and did not become tumorigenic when injected into mice. The authors concluded that bcl-2 functions as an oncogene by promoting prolonged cell survival, inde pendent of its effects on cell proliferation. Subsequently, bcl-2 was shown to protect cells from a specific mecha nism of cell death, called apoptosis. Over the following years and decades, a clearer picture of the mechanisms of action of bcl-2 emerged. A family of pro- and anti-apoptotic proteins structurally related

to BCL-2 were identified. BCL-2 and its family members were localized to the mitochondrial outer membrane where they regulated mitochondrial membrane poten tial. Inhibiting BCL-2 led to a collapse of mitochondrial membrane potential and release of mitochondrial pro teins, including cytochrome c, which triggered apopto
Figure 1. Overexpression of bcl-2 protects cells from cell death. Interleukin (IL)-3-dependent FDC-P1 myeloid cells were transduced with bcl-2 cDNA. After transduction, cells were washed to remove IL-3 from the culture media. Cell viability was measured by flow cytometry. Overexpression of bcl-2 protected cells from death after IL-3 withdrawal.

sis. However, the book on bcl-2 is not yet closed. Even 30 years later, new functions for bcl-2 continued to be identified, including its ability to regulate T-cell immune function.
In 2001, the three-dimensional structure of BCL-2 was solved, paving the way for the identification of small mo lecules that bind BCL-2 and block its interaction with in hibitory pro-apoptotic proteins. Through iterative rounds of structure-guided medicinal chemistry, the selective BCL-2 inhibitor venetoclax was identified. Thirty-six years after the original identi fication of bcl-2 by Tsujimoto, a randomized clinical trial demonstrated the superiority of venetoclax in combination with azacitidine over azaciti dine alone in elderly patients with newly diagnosed acute myeloid leukemia.1
Until Vaux’s discovery, the prevailing opinion was that mu
1. DiNardo CD, Jonas BA, Pullarkat V, et al. Azacitidine and venetoclax in previously untreated acute myeloid leukemia. N Engl J Med. 2020;383(7):617-629.
2. Tsujimoto Y, Yunis J, Onorato-Schowe L, Erikson J, Nowell PC, Croce CM. Molecular cloning of the chromosomal breakpoint of
tations in cancer-associated genes promoted malignancy by causing uncontrolled cellular proliferation. For the first time, Vaux et al. showed that oncogenes could act by blocking cell death. This discovery provided a new hall mark of cancer – the ability of cancer cells to resist cell death. It helped spark research into cell death mecha nisms of cancer, and strategies to selectively target cell death pathways in cancer cells.
ADS has received research funding from Takeda Pharma ceuticals, BMS and Medivir AB, and consulting fees/hono raria from Takeda, Novartis, Jazz, BMS, Astra Zeneca, and Otsuka Pharmaceuticals. ADS is named on a patent appli cation for the use of DNT cells to treat AML. ADS holds the Ronald N. Buick Chair in Oncology Research.
B-cell lymphomas and leukemias with the t(11;14) chromosome translocation. Science. 1984;224(4656):1403-1406.
3. Vaux DL, Cory S, Adams JM. Bcl-2 gene promotes haemopoietic cell survival and cooperates with c-myc to immortalize pre-B cells. Nature. 1988;335(6189):440-442.
Courtney L. Jones1,2
1Princess Margaret Cancer Centre, University Health Network, Toronto and 2Department of Medical Biophysics, University of Toronto, Toronto, Ontario, Canada
E-mail: courtney.jones@uhnresearch.ca
https://doi.org/10.3324/haematol.2022.280677
In this issue of Haematologica, Paolillo et al. investigate mechanisms of chemotherapy resistance in acute myeloid leukemia (AML).1 While AML therapy is evolving rapidly, many patients will receive conventional induction chemotherapy which consists of a 7-day continual infusion of cytarabine accompanied by infusions of an anthracycline, such as daunorubicin, on the first 3 days of treatment. Many patients receiving this therapy will respond but it is common for patients to develop disease recurrence and succumb to this disease. This is in part due to the development of resistance to chemotherapy. To understand the mechanistic underpinnings of therapy resistance in AML cells, Paolillo et al. generated cytarabine- and daunorubicin-resistant HL-60 cells and measured changes in gene expression. They discovered that NADPH oxidase 2 (NOX2) subunit expression was greatly elevated in daunorubicin-resistant cells and subunit CYBB was significantly increased in cytarabineresistant cells. Importantly, this correlated with an increase in NOX2 activity in daunorubicin-resistant cells. NOX2 has been well characterized in normal and malignant hematopoiesis. Indeed, NOX2 has been shown to be the most predominant oxidase expressed in human and murine AML.2 Interestingly, it is also highly expressed in hematopoietic stem cells and is functionally important for proper myelopoiesis.2 However, NOX2 had not previously been shown to promote chemotherapy resistance in AML cells. Elevated NOX2 levels result in increased reactive oxygen species (ROS) which have been shown to promote AML cell proliferation during leukemia development.3,4 In contrast, no changes in proliferation were observed in daunorubicin-resistant lines compared to daunorubicinsensitive cells or upon knockout of the NOX2 subunit
CYBB in daunorubicin-resistant lines, demonstrating that NOX2-mediated daunorubicin resistance was not a result of a proliferative advantage. However, knockout of the NOX2 subunit CYBB did re-sensitize cells to daunorubicin, demonstrating that NOX2 was directly contributing to daunorubicin resistance in AML. Furthermore, treatment with a pan-NOX inhibitor restored sensitivity of daunorubicin-resistant cells to daunorubicin, indicating the potential for NOX2-targeted pharmacological interventions to restore chemotherapy sensitivity in therapy-resistant patients. However, as the authors note most NOX inhibitors lack specificity which raises toxicity concerns. In addition, reduction in NOX2derived ROS re-sensitized cells to daunorubicin showing that elevated ROS production was also an essential component of NOX2-mediated therapy resistance (Figure 1A). It is important to note that the relationship between ROS and cancer is very complex and an important area of tumor biology that continues to evolve. ROS can promote tumor formation and have been shown to be a potential therapeutic target.5 In AML, elevating ROS levels within the mitochondria can increase sensitivity to targeted AML therapies including FLT3 inhibitors.6 As eloquently described in a review by Harris and DeNicola, it is likely that these contradictory findings can be explained by nuanced differences in types of ROS, cellular localization of ROS, and the tissues being examined.5
Gene expression in AML can vary based on several factors, including mutational and differentiation status. To interrogate the potential heterogeneity of NOX2 expression in AML, Paolillo et al. quantified NOX2 subunit gp91phox protein expression in 74 AML specimens by flow cytometry and gene expression in a cohort from The Cancer Genome Atlas (TCGA). Notably, gp91phox levels
Figure 1. Graphical representation of the key findings of Paolillo et al.1 (A) Elevated levels of NADPH oxidase 2 (NOX2) promote chemotherapy resistance in acute myeloid leukemia (AML) through increased production of reactive oxygen species. (B) A high NOX2 score predicts poor outcomes for AML patients. Figure created with BioRender.com.

correlated with the French, British, American (FAB) M4 and M5 classification compared to M0, M1, and M2 at the protein and mRNA levels. In contrast, NOX2 subunit expression did not correlate with European LeukemiaNet status, or mutations in NPM1 or FLT3. These findings are particularly intriguing, as AML cases classified as M5 have been shown to exhibit increased resistance to the BCL-2 inhibitor venetoclax in combination with hypomethylating agents;7 however, NOX2 activity did not contribute to venetoclax resistance in these models. Furthermore, gp91phox levels and NOX2-derived ROS were higher in CD34 leukemic blasts compared to CD34+ leukemic stem cells (LSC). Importantly, LSC did display a basal level of NOX2 activity, consistent with NOX2 being essential for LSC function.2
Strikingly, Paolillo et al. demonstrated that a NOX2 gene expression score, which was developed by combining gene expression of each NOX2 subunit, was predictive of survival of AML patients (Figure 1B). Specifically, a higher NOX2 score correlated with decreased survival in three independent cohorts (Verhaak, Metzeler, and TCGA). Other gene expression scores containing NOX2 subunits have also been shown to be predictive of AML patient survival,8 highlighting the potential importance of NOX2 as a predictive biomarker in AML. Interestingly, the NOX2 score was higher for patients with a M4 or M5 FAB classification; however, the predictive value of the NOX2
1. Paolillo R, Boulanger M, Gâtel P, et al. The NADPH oxidase NOX2 is a marker of adverse prognosis involved in chemoresistance of acute myeloid leukemias. Haematologica. 2022;107(11):2562-2575.
2. Adane B, Ye H, Khan N, et al. The hematopoietic oxidase NOX2 regulates self-renewal of leukemic stem cells. Cell Rep. 2019;27(1):238-254.e6.
3. Hole PS, Zabkiewicz J, Munje C, et al. Overproduction of NOXderived ROS in AML promotes proliferation and is associated with defective oxidative stress signaling. Blood. 2013;122(19):3322-3330.
4. Reddy MM, Fernandes MS, Salgia R, Levine RL, Griffin JD, Sattler M. NADPH oxidases regulate cell growth and migration in myeloid cells transformed by oncogenic tyrosine kinases. Leukemia. 2011;25(2):281-289.
5. Harris IS, DeNicola, GM. The complex interplay between
score was independent of FAB classification. Therefore, the NOX2 score may have broad implications as a predictive biomarker for AML patients. Since NOX2 levels were higher in leukemic blasts than in LSC in the future it would be interesting to determine the overlap or potential combinatorial power of the NOX2 score with LSC-specific scores, such as the LSC17.9 Finally, in the past decade AML therapy has changed dramatically with the approval of therapies such as the BCL-2 inhibitor venetoclax, FLT3 inhibitor midostaurin, and IDH1 and IDH2 inhibitors ivosidenib and enasidenib. It will be particularly interesting and clinically important to determine whether gene expression signatures that predict resistance to chemotherapy, such as the NOX2 gene expression score, have prognostic value for other AML therapies. Overall, Paolillo et al. defined a new mechanism of therapy resistance in AML, NOX2 overexpression. Mechanistically, NOX2 overexpression leads to elevated ROS levels which contribute directly to therapy resistance. Importantly NOX2 overexpression has prognostic value for AML patients treated with chemotherapy. This work provides the foundation for future studies aimed at determining the applicability of the NOX2 score as a predictive biomarker in the clinical setting.
No conflicts of interest to disclose.
antioxidants and ROS in cancer. Trends Cell Biol. 2020;30(6):440-451.
6. Gregory MA, D'Alessandro A, Alvarez-Calderon F, et al. ATM/G6PD-driven redox metabolism promotes FLT3 inhibitor resistance in acute myeloid leukemia. Proc Natl Acad Sci U S A. 2016;113(43):E6669-E6678.
7. Pei S, Pollyea DA, Gustafson A, et al. Monocytic subclones confer resistance to venetoclax-based therapy in patients with acute myeloid leukemia. Cancer Discov. 2020;10(4):536-551.
8. Ijurko C, González-García N, Galindo-Villardón P, HernándezHernández Á. A 29-gene signature associated with NOX2 discriminates acute myeloid leukemia prognosis and survival. Am J Hematol. 2022;97(4):448-457.
9. Ng SW, Mitchell A, Kennedy JA, et al. A 17-gene stemness score for rapid determination of risk in acute leukaemia. Nature. 2016;540(7633):433-437.
 Margaret A. Ferris1 and John S. Welch2
1Department of Pediatrics, Washington University and 2Department of Internal Medicine, Washington University, St Louis, MO, USA E-mail: jwelch@wustl.edu https://doi.org/10.3324/haematol.2022.280671
In this issue of Haematologica, Tuval and colleagues1 describe misfolded P53 (pseudo-mutant P53) as a marker of preleukemic cells in patients with DNMT3A-mutated acute myeloid leukemia (AML). TP53 is mutated across human cancers, including AML. P53 functions to protect genomic stability; interestingly, this can be achieved by activating distinct pro- and anti-apoptotic pathways. To add to this complexity, multiple TP53 isoforms can be expressed and post-translational modifications further influence P53 function within specific cellular contexts.2 Thirty years ago, Gannon and colleagues identified a monoclonal antibody (PAb240) that distinguished mutant P53 from wild-type, and theorized that this antibody recognized an epitope that was protected in the wild-type conformation.3 Zheng and colleagues later found a series of TP53 wild-type AML cell lines that express P53 in the mutant conformation, referred to as “pseudo-mutant P53”.4 Since then, the pseudo-mutant conformation has been observed in alternative splice forms of wild-type P53, and these can decrease MDM2 binding, preventing degradation of activated P53.5 The current study expands on these findings, comparing expression of this pseudomutant conformation in different leukemia subpopulations in patients without TP53 mutations.
AML is a clonal disease associated with subclonal heterogeneity within individual patient samples. Two separate models of leukemic hierarchy have emerged. Mutation analysis suggests the presence of a founding clone, subsequent cooperating mutations in subclones,6 and a related preleukemic state, clonal hematopoiesis (CH), associated with clonal mutations but retained normal hematopoietic maturation.7 Second, immunophenotypic analysis separates hematopoietic stem cells from progenitors and from more mature cells. Recent studies have sought to harmonize these two models, demonstrating that within a patient, immunophenotypic preleukemic-hematopoietic stem/progenitor cells (preLHSPC) can be identified with driver mutations (DNMT3A) but not cooperating mutations found in the AML blasts (e.g., NPM1c); in contrast to leukemic blasts, these preLHSPC retain their capacity for multi-lineage differentiation. Xenograft experiments show that these preL-HSPC have a growth advantage over non-mutated HSPC.8 Somatic TP53 mutations have been found at the preL-HSPC stage in ~20% of cases, conferring a selective advantage in xenograft models.9
The current study examines P53 protein conformations in preL-HSPC from AML patients. Importantly, the use of AML cases with DNMT3A and NPM1 mutations again allowed for separation of leukemic blasts (both mutations present) from preL-HSPC (DNMT3A-mutated, NPM1 WT). The authors then assessed P53 for pseudo-mutant conformation. Similar to the findings in AML cell lines,4 Tuval and colleagues found expression of the pseudomutant P53 in TP53 wild-type primary AML patient samples. Using mass cytometry, the samples were further separated into leukemic blasts (immunophenotype defined at diagnosis) and preL-HSPC (CD34+CD33-CD15-CD11bCD19-CD79b-CD3-CD16-CD45RA-), and the ratio of pseudo-mutant to wild-type conformation P53 (PM/WTCR) was examined in each individual cell. Interestingly, heterogeneity in P53 conformations was identified: within blasts the wild-type conformation was dominant (PM/WTCR = 0.53), but in the less abundant preL-HSPC, the pseudo-mutant confirmation was enriched (PM/WT-CR = 3.06) (Figure 1). The high PM/WT-CR appears specific to the preL-HSPC and was not observed in normal stem cells (cord blood PM/WT-CR = 1.22) or cells from a patient with DNMT3A-mutated clonal hematopoiesis (DNMT3AR882H-CH PM/WT-CR = 0.53) (Figure 2).
The authors go on to use a xenotransplant model to determine whether the high PM/WT-CR leads to a selective
Figure 1. In this issue Tuval and colleagues demonstrate that wild-type TP53 may take on folding patterns similar to mutant TP53 (pseudo-mutant), and this may contribute to leukemic transformation.
growth advantage of the preL-HSPC. The variability of engraftment potential of patient-derived xenografts limited the power of these studies as only one of the nine AML samples lead to engraftment of preL-HSPC (#160005); the other samples engrafted the immunodeficient mouse marrow with leukemic blasts or non-leukemic stem cells (DNMT3A WT). Tumor #160005 had one of the more modest PM/WT-CR (~1.3). However, treatment with a P53stabilizing peptide, pCAP-250, decreased the engraftment potential of the preL-HSPC, but not of the non-preLHSPC, suggesting that the balance of wild-type and pseudo-mutant P53 contributed to the engraftment and expansion capacity of the preL-HSPC (Figure 3). Single cell RNA sequencing analysis of engrafted cells showed pCAP-250 treatment was associated with a reduction in specific subsets of cells. However, mass cytometric analysis of the engrafted cells did not correlate PM/WTCR level on susceptibility to pCAP-250, suggesting heterogeneity of pCAP-250 effects or pseudo-mutant P53 dependency that remain uncharacterized (Figures 5 and 6). Therefore, P53 may contribute to early transformational programs through both mutant and non-mutant effects. TP53 missense mutations are present in clonal hematopoiesis patients,10 are expressed at the preL-HSPC stage, and are associated with expressed proteins that alter sensitivity to chemotherapy and early transformation.9 Likewise, during transformation of induced pluripotent stem cells, overexpression of the D133p53α isoform inhibits wild-type P53-inducible cellular senescence pathways, augmenting the reprogramming capacity.5 Now Tuval and colleagues demonstrate the heterogenous presence of pseudo-mutant P53 protein in TP53 wild-type hematopoietic cells, and the potential of pseudo-mutant P53 to influence transformation potential in preL-HSPC,
1. Tuval A, Brilon Y, Azogy H, et al. Pseudo-mutant P53 as a targetable pheneotype of DNMT3A-mutated pre-leukemia. Haematologica. 2022;107(11):2548-2561.
2. Anbarasan T, Bourdon JC. The emerging landscape of p53 isoforms in physiology, cancer and degenerative diseases. Int J Mol Sci. 2019;20(24):6257.
3. Gannon JV, Greaves R, Iggo R, Lane DP. Activating mutations in p53 produce a common conformational effect. A monoclonal antibody specific for the mutant form. EMBO J. 1990;9(5):1595-1602.
4. Zheng A, Castren K, Säily M, Savolainen ER, Koistinen P, Vähäkangas K. p53 status of newly established acute myeloid leukaemia cell lines. Br J Cancer. 1999;79(3-4):407-415.
5. Fujita K. p53 isoforms in cellular senescence- and ageingassociated biological and physiological functions. Int J Mol Sci. 2019;20(23):6023.
distinguishing them from cells of clonal hematopoiesis where pseudo-mutant P53 does not appear dominant or active.
These provocative findings are thus far limited to small sample sizes and within DNMT3A-mutant/NPM1-wild-typedefined preL-HSPC, which were cleverly chosen to distinguish preL-HSPCS from leukemic blasts. Additional cases and types of mutations in preL-HSPCs will need to be examined to further define the frequency, distribution, and phenotypes of pseudo-mutant P53 in hematopoietic transformation. Knowing that P53 can have anti- and proapoptotic effects and that non-R882 DNMT3A mutationdriven CH is less likely to progress to AML, it will be interesting to determine the distribution and phenotypes of pseudo-mutant P53 in additional forms of preL-HSCP and CH. The mechanisms enabling pseudo-mutant folding in hematopoietic cells also remain uncharacterized, although splice variation and posttranslational modifications have influenced P53 folding patterns in other cellular contexts. This study serves as a starting point for defining the role of wild-type P53 modifications in leukemogenesis, and suggests that in the right context, wild-type P53 might put on wolf clothing to unexpectedly contribute to leukemic transformation.
No conflicts of interest to disclose.
MAF and JSW wrote the manuscript.
JSW receives research funding from Janssen Pharma ceuticals and from Notable Labs.
6. Welch JS, Ley TJ, Link DC, et al. The origin and evolution of mutations in acute myeloid leukemia. Cell. 2012;150(2):264-278.
7. Jaiswal S, Fontanillas P, Flannick J, et al. Age-related clonal hematopoiesis associated with adverse outcomes. N Engl J Med. 2014;371(26):2488-2498.
8. Shlush LI, Zandi S, Mitchell A, et al. Identification of preleukaemic haematopoietic stem cells in acute leukaemia. Nature. 2014;506(7488):328-333.
9. Lal R, Lind K, Heitzer E, et al. Somatic TP53 mutations characterize preleukemic stem cells in acute myeloid leukemia. Blood. 2017;129(18):2587-2591.
10. Chen S, Liu Y. p53 involvement in clonal hematopoiesis of indeterminate potential. Curr Opin Hematol. 2019;26(4):235-240.
Emmanuel Bachy
Department of Hematology, Lyon Sud Hospital & Lymphoma Immuno-Biology Team, International Center for Infectiology Research (CIRI), Lyon, France
E-mail: emmanuel.bachy@chu-lyon.fr https://doi.org/10.3324/haematol.2022.280658
Among all controversies in hematology, the role of autologous stem cell transplant (ASCT) in first-line treatment for patients with peripheral T-cell lymphoma (PTCL) is one of the most long-lasting. Several hurdles have prevented a definitive solution being found to the problem. First, and compared to its B-cell lymphoma counterpart, no significant progress, except for brentuximab vedotin (BV) in ALK-positive or -negative anaplastic large cell lymphoma, has convincingly and significantly altered the course of PTCL during the last two decades.1 Such questions as to whether CHOP (cyclophosphamide, doxorubicin, vincristine and prednisone) alone or with etoposide (CHOEP) should be used frontline or whether stem cell transplant should be performed as first- or second-line treatment (if at all) are still hot topics in the field, whereas they might be considered completely outdated in other lymphoma subtypes. Second, despite tremendous efforts to better characterize the disease from molecular and pathological points of view, PTCL is still a highly heterogeneous disease. Combined with its rarity, this makes clinical research very difficult to conduct in order to conciliate the need for sufficient numbers of patients to be treated with homogeneous enough subtypes to be considered as one single disease. As a result and to date, more than five prospective trials and more than 20 retrospective studies have tried to address the benefit of ASCT in the first-line setting for PTCL.2-7 Let’s break the suspense: the study published in this issue of Haematologica by Garcia-Sancho and colleagues does not definitely answer the questions, but it does add a significant brick to the wall.8 Compared to historical and more recent series showing a poor median progression-free survival of approximately 10 to 12 months in PTCL,9,10 the results from a prospective trial by d’Amore et al. published in 2012 convincingly demonstrated that six courses of CHOEP followed by ASCT in cases of partial or complete responses could yield progression-free survival of up to 44% at 5 years.3 Since then, numerous retrospective studies have produced conflicting results. For example, data from the Swedish registry were in favor of ASCT in multivariate analysis (for both progression-free survival and overall survival; number of patients in the analyses ~250) but were not adjusted for response status at the end of induction.11 A study by Cederleuf and colleagues based on Swedish and Danish patients (n=232), and limited to those reaching a complete
response at the end of induction, did not find any survival advantage for ASCT in multivariate analysis.12 Our study from the Lymphoma Study Association (LYSA) also did not find any benefit associated with ASCT in patients (n=269) reaching a partial or complete response after six CHOP-like cycles of therapy when populations were matched based on a propensity-score.13 On the contrary, results based on patients in the prospective American COMPLETE registry (n=119) found a superiority of ASCT for patients in complete response.14 Similarly, Savage and colleagues recently reported on the outcome of patients with CD30+ PTCL in complete response following first-line treatment with BVCHP (BV plus CHOP without vincristine) in the ECHELON-2 trial. Although ASCT consolidation was at the discretion of the treating investigator, post-hoc analysis showed a significantly longer progression-free survival for patients who received ASCT than for those who did not.15
In fact, numerous irreducible statistical biases hamper proper retrospective comparisons of patients’ outcomes when it comes to stem cell transplant in general. Positive biases in favor of the procedure are that patients are usually younger, fitter, in better response at the end of induction, and have experienced lesser toxicity before ASCT; conversely, patients usually exhibit a more aggressive disease at diagnosis. As a result, positive and negative biases in favor and against ASCT make it very difficult to balance comparisons in retrospective studies. Usually, ways to control for those statistical biases are to perform matched-population comparisons, to conduct multivariate analyses, to use intent-to-treat groups (i.e., not comparing patients who actually receive ASCT or not; but comparing those for whom the physician decided before any treatment to go for stem cell transplant or not, information which is usually accessible through a review of medical charts), and to consider patients only in response after induction. The study by Garcia-Sancho et al. uses most of those approaches to try to avoid the usual pitfalls of retrospective comparisons when dealing with the procedure of stem cell transplantation. Imbalances in patients’ characteristics are “flattened” by using Cox multivariate analysis, only patients in complete response are considered for comparisons and, most importantly, the response must last at least 3 months to be considered. This circumvents another common problem of many studies since patients who can proceed to ASCT usually benefit from the so-called “guarantee-time
bias”, i.e., that a patient needs to be in response until the transplant in the ASCT group, but not necessarily for so long in the non-ASCT group. However, the study is not performed based on an intent-to-treat decision by the local physician before any treatment, meaning that there might still be some uncontrolled biases between the two treatment groups. Finally, positron emission tomography/computed tomography is now frequently used for response assessment in PTCL, especially at the end of induction, but metabolic response was not considered in the study by Garcia-Sancho et al.
Nevertheless, the authors report here on one of the largest retrospective cohort of patients (n=174) in first complete response from Spanish and Italian centers and show in multivariate analyses that ASCT is associated with better outcomes (both significantly prolonged progression-free and overall survival). Of note, a sensitivity analysis is performed to show that the benefit still exists when only ALK-negative anaplastic large cell lymphoma, angioimmunoblastic T-cell lymphoma and PTCL-not otherwise specified are taken into account, which are the usual histologies for which the role of ASCT has been extensively debated. In the next months, the LYSA academic group will enroll the first patients in the TRANSCRIPT (TRANSplantation after
1. Horwitz S, O'Connor OA, Pro B, et al. The ECHELON-2 trial: 5-year results of a randomized, phase III study of brentuximab vedotin with chemotherapy for CD30-positive peripheral T-cell lymphoma. Ann Oncol. 2022;33(3):288-298.
2. Corradini P, Tarella C, Zallio F, et al. Long-term follow-up of patients with peripheral T-cell lymphomas treated up-front with high-dose chemotherapy followed by autologous stem cell transplantation. Leukemia. 2006;20(9):1533-1538.
3. d'Amore F, Relander T, Lauritzsen GF, et al. Up-front autologous stem-cell transplantation in peripheral T-cell lymphoma: NLG-T01. J Clin Oncol. 2012;30(25):3093-3099.
4. Mercadal S, Briones J, Xicoy B, et al. Intensive chemotherapy (high-dose CHOP/ESHAP regimen) followed by autologous stemcell transplantation in previously untreated patients with peripheral T-cell lymphoma. Ann Oncol. 2008;19(5):958-963.
5. Reimer P, Rudiger T, Geissinger E, et al. Autologous stem-cell transplantation as first-line therapy in peripheral T-cell lymphomas: results of a prospective multicenter study. J Clin Oncol. 2009;27(1):106-113.
6. Rodriguez J, Conde E, Gutierrez A, et al. Frontline autologous stem cell transplantation in high-risk peripheral T-cell lymphoma: a prospective study from the Gel-Tamo study group. Eur J Haematol. 2007;79(1):32-38.
7. Wilhelm M, Smetak M, Reimer P, et al. First-line therapy of peripheral T-cell lymphoma: extension and long-term follow-up of a study investigating the role of autologous stem cell transplantation. Blood Cancer J. 2016;6(7):e452.
8. García-Sancho AM, Bellei M, López-Parra M, et al. Autologous stem cell transplantation as consolidation of first-line chemotherapy in patients with peripheral T-cell lymphoma: a multicenter GELTAMO/FIL study. Haematologica.
Complete Response In Patients with T-cell lymphoma) trial. This study will randomize 204 transplant-eligible patients (before any treatment) to six cycles of CHOP-like regimens (CHOP, CHOEP or BV-CHP) followed (n=102) or not (n=102) by ASCT for those in complete metabolic response. Only ALKnegative anaplastic large cell lymphoma, T follicular helperphenotype PTCL and PTCL-not otherwise specified will be considered. Randomization will ensure theoretically similar baseline characteristics, ASCT allocation before induction will ensure intent-to-treat decision, and the positron emission tomography/computed tomography evaluation will ensure robust response assessment. The primary endpoint will be progression-free survival. Will the study finally put an end to an endless story in hematology? Will new therapeutic developments in first-line PTCL make the question obsolete by the time of the final analysis? Time will tell.
EB has received honoraria from Kite, a Gilead Company, Bristol Myers Squibb, Novartis, Pfizer, Incyte; acted in a consultancy role for Takeda, Roche, and Gilead/Kite; received personal fees from Kite, a Gilead Company, Bristol Myers Squibb, Novartis, Pfizer; and received research funding from Amgen.
2022;107(11):2675-2684.
9. Bachy E, Camus V, Thieblemont C, et al. Romidepsin plus CHOP versus CHOP in patients with previously untreated peripheral Tcell lymphoma: results of the Ro-CHOP phase III study (conducted by LYSA). J Clin Oncol. 2022;40(3):242-251.
10. Simon A, Peoch M, Casassus P, et al. Upfront VIP-reinforced-ABVD (VIP-rABVD) is not superior to CHOP/21 in newly diagnosed peripheral T cell lymphoma. Results of the randomized phase III trial GOELAMS-LTP95. Br J Haematol. 2010;151(2):159-166.
11. Ellin F, Landstrom J, Jerkeman M, Relander T. Real-world data on prognostic factors and treatment in peripheral T-cell lymphomas: a study from the Swedish Lymphoma Registry. Blood. 2014;124(10):1570-1577.
12. Cederleuf H, Hjort Jakobsen L, Ellin F, et al. Outcome of peripheral T-cell lymphoma in first complete remission: a DanishSwedish population-based study. Leuk Lymphoma. 2017;58(12):2815-2823.
13. Fossard G, Broussais F, Coelho I, et al. Role of up-front autologous stem-cell transplantation in peripheral T-cell lymphoma for patients in response after induction: an analysis of patients from LYSA centers. Ann Oncol. 2018;29(3):715-723.
14. Park SI, Horwitz SM, Foss FM, et al. The role of autologous stem cell transplantation in patients with nodal peripheral T-cell lymphomas in first complete remission: report from COMPLETE, a prospective, multicenter cohort study. Cancer. 2019;125(9):15071517.
15. Savage KJ, Horwitz SM, Advani RH, et al. An exploratory analysis of brentuximab vedotin plus CHP (A+CHP) in the frontline treatment of patients with CD30+ peripheral T-cell lymphomas (ECHELON-2): impact of consolidative stem cell transplant. Blood. 2019;134(Suppl_1):464.
Valerio De Stefano,1* Alessandra Larocca,2* Monica Carpenedo,3 Michele Cavo,4 Francesco Di Raimondo,5 Anna Falanga,6,7 Massimo Offidani,8 Maria Teresa Petrucci,9 Marco Ruggeri,10 Roberto Mario Santi11 and Giovanni Barosi12
1Section of Hematology, Department of Radiological and Hematological Sciences, Catholic University, Fondazione Policlinico “A. Gemelli” IRCCS, Rome; 2SSD Clinical Trial in Oncoematologia e Mieloma Multiplo, Division of Hematology, University of Torino, Azienda Ospedaliero-Universitaria Città della Salute e della Scienza di Torino, Torino; 3Hematology and Transplant Unit, ASST Ospedale San Gerardo di Monza, Monza; 4IRCCS Azienda OspedalieroUniversitaria di Bologna, Istituto di Ematologia “Seràgnoli”, Dipartimento di Medicina Specialistica, Diagnostica e Sperimentale, Università degli Studi, Bologna; 5Section of Hematology, Department of General Surgery and Medical Specialties, University of Catania, and Division of Hematology, Policlinico “Rodolico”, Catania; 6Department of Medicine and Surgery, University of Milan Bicocca, Milan; 7Department of Immunohematology and Transfusion Medicine, Hospital Papa Giovanni XXIII, Bergamo; 8Clinica di Ematologia Azienda OspedalieroUniversitaria, Ospedali Riuniti di Ancona, Ancona; 9Hematology, Azienda Policlinico Umberto I, Sapienza University, Rome; 10Hematology Department, San Bortolo Hospital, Vicenza; 11SSD Thrombosis and Hemostasis Center, Azienda Ospedaliera “SS Antonio e Biagio e C. Arrigo”, Alessandria and 12Center for the Study of Myelofibrosis, IRCCS Policlinico S. Matteo Foundation, Pavia, Italy
*VDS and AL contributed equally to this work as co-first authors.
Correspondence: V. De Stefano valerio.destefano@unicatt.it
Received: February 19, 2022.
: July 12, 2022.
: July 21, 2022.
The introduction of new therapeutic agents for multiple myeloma (MM), including proteasome inhibitors, immunomodulatory drugs, and monoclonal antibodies, has improved the outcomes of patients but, in parallel, has changed the frequency and epidemiology of thrombotic events. Thrombosis is now a significant cause of morbidity and mortality in MM patients, and optimal thromboprophylaxis is far from being reached. Moving from the recognition that the above issue represents an unmet clinical need, an expert panel assessed the scientific literature and composed a framework of recommendations for improving thrombosis control in patients who are candidates for active treatment for MM. The panel generated key clinical questions using the criterion of clinical relevance through a Delphi process. It explored four domains, i.e., thrombotic risk factors and risk stratification, primary thromboprophylaxis, management of acute thrombotic events, and secondary thromboprophylaxis. The recommendations issued may assist hematologists in minimizing the risk of thrombosis and guarantee adherence to treatment in patients with MM who are candidates for active treatment.
Patients with multiple myeloma (MM) are at high risk of venous thromboembolism (VTE). The incidence of VTE has been estimated to be more than 10% during the course of the disease.1 Since the introduction of new therapeutic agents, including proteasome inhibitors, immunomodula tory drugs and monoclonal antibodies, thrombosis has become one of the major causes of morbidity and mor
tality. In particular, the immunomodulatory drugs thalido mide and lenalidomide are well known to be associated with increased risk of thrombosis, especially when com bined with high-dose steroids and other chemotherapy, with the incidence of thrombosis approaching 26% in some studies.2-4 In MM patients, VTE and arterial throm bosis are associated with a higher risk of death than that in patients without thrombosis.5,6 Hence, the great strides in the indications for and use of new treatments need
Thrombosis in multiple myeloma: risk stratification, antithrombotic prophylaxis, and management of acute events. A consensus-based position paper from an ad hoc expert panel
parallel progresses in the best approach to prophylaxis and supportive treatment for thrombosis. The Inter national Myeloma Working Group (IMWG) and the Ameri can Society of Clinical Oncology published guidance on the prevention of immunomodulatory drug-associated thrombosis in MM.7,8 These guidelines recommended that all patients should be risk assessed and offered aspirin or low molecular weight heparin (LMWH) thromboprophyla xis. However, in contrast with improvements in MM treat ment, there has been little progress regarding VTE prevention, with a stable overall rate of events. A metaanalysis published in 2011 computed a rate of VTE in MM patients ranging from 3% to 12%, according to the drug employed and the phase of disease.3 An analysis pub lished in 2020 of patients enrolled in the phase III ran domized controlled Myeloma XI trial reported that, in patients treated with immunomodulatory drugs, the rate of VTE was still as high as 11.8%, despite 87.7% of the pa tients being on thromboprophylaxis at the time of throm bosis.9 This highlights that the optimal strategy for preventing thrombosis in patients with MM remains an unmet clinical need.
Many additional challenging problems complicate the choice of thromboprophylaxis in MM. It is not clear how well the guidelines are implemented in daily clinical prac tice, since most physicians tend to apply thromboprophy laxis based mostly on clinical experience.10 A further problem is the definition of an effective and easy-to-use thrombosis risk stratification. Furthermore, emerging data suggest that direct oral anticoagulants (DOAC) may be an option in MM thromboprophylaxis, but their use is a matter of uncertainty.11
In view of these considerations, a panel of experts was convened to provide recommendations for the manage ment of thrombotic risk in MM, with the intent of offering indications to minimize thrombotic events, thereby im proving quality of life and ensuring a better adherence to treatment. The present publication represents a consen sus document from email correspondence and a series of meetings held during 2020-2021.
Two chairmen (VDS and AL) appointed an expert panel of eight members, selected from among individuals who had previously published and/or expressed an interest in thrombotic complications in MM. A clinician with expertise in clinical epidemiology (GB) ensured the methodological correctness of the process. During an initial meeting, the panel of experts agreed on the areas of major concern in the risk of thrombosis by generating and rank-ordering key clinical questions using the criterion of clinical relevance, that is, impact on the management of patients and risk of
inappropriateness, through a Delphi process.12 The candi date key questions that ranked highest formed the set of questions considered in the present document. During a second meeting, the panel examined the current state of knowledge regarding thrombosis risk in MM. In the last phase of the project, each panelist drafted statements that addressed the preliminarily identified key questions. Subsequently, each panelist scored his agreement with the statements made by other panelists and provided suggestions for rephrasing. To exploit this phase of the process, the expert panel was convened, and two consen sus conferences were held. During the consensus meet ings, participants were first asked to comment in a round-robin fashion on their preliminary votes and then to propose a new vote. If at least a ≥80% consensus on the statement was not achieved, the choices were dis cussed, and a second vote taken. If a ≥80% consensus was still not attained, the issue was declared undecidable, and no further attempt was made. It was determined that formal evidence grading could not be provided for indi vidual recommendations due to a paucity of high-grade evidence in this field.
Thrombo-hemorrhagic risk factors and risk stratification (Box 1)
Thrombogenicity in MM is multifactorial, being the result of a combination of patient-, disease-, and treatment-re lated factors. Patient-related factors include advanced age, a history of VTE, comorbidities (such as heart failure, hypertension, liver, renal impairment, chronic obstructive pulmonary disorder, diabetes mellitus, chronic inflamma tory bowel disease, autoimmune diseases, multiple scler osis, and neurological disease with limb paresis), immobility, presence of a central venous catheter, acute infection, hospitalization, blood clotting disorders, race (being Caucasian is a risk factor), surgery, and hormone therapy.1
Genetic thrombophilia as a risk factor for thrombosis in MM has been investigated in two observational studies. In a series of 190 patients younger than 65 years with newly diagnosed MM, genetic thrombophilic abnormalities were found in 5.3% of individuals, 3.2% carrying factor V Leiden (FVL) and 2.1% a prothrombin gene polymorphism (FII G20210A), with an incidence similar to that found in the general Caucasian population. The relative risk for VTE as sociated with inherited thrombophilia was 2.25 (95% con fidence interval [95% CI]: 0.51-9.84) providing a small and not significant increase of risk in carriers versus non-car riers.13 A series of 200 consecutive, unselected MM pa tients treated with lenalidomide-based regimens had a VTE incidence of 6%: none of them had common genetic
variants that are associated with an increased risk of VTE in the general population, such as FVL and FII G20210A.14
Disease-related factors associated with a risk of throm bosis in MM include newly diagnosed disease, hypervis cosity, inhibition of natural anticoagulants and hypercoagulability induced by inflammatory cytokines, in creased microparticle-associated tissue factor, elevated levels of von Willebrand factor, fibrinogen, or factor VIII, decreased protein S, acquired activated protein C resis tance, hypofibrinolysis, and increased plasminogen acti vator inhibitor-1.4
Treatment-related factors are key components of the thrombotic risk in MM: immunomodulatory drugs (thalido mide, lenalidomide, pomalidomide), in particular, have been associated with the rise in VTE occurrence in the MM population. Thalidomide or lenalidomide monotherapy does not contribute significantly to the baseline VTE risk, reported to be around 3%-4%.15-17 However, the risk in creases up to 26% with the addition of dexamethasone or multiagent chemotherapy or anthracyclines.18-26 Several studies demonstrated that the incidence of VTE is almost three times higher in patients being treated with lenali domide and dexamethasone than in those receiving dexa methasone alone.18-23 Lenalidomide-related VTE was also influenced by the dose of dexamethasone: the incidence of VTE in patients treated with lenalidomide plus lowdose dexamethasone (<480 mg/month) was 12%, whereas it was 26% in those treated with lenalidomide plus highdose dexamethasone (>480 mg/month).18-23 In other studies, the incidence of VTE among patients treated with lenalidomide in combination with doxorubicin was 9% while it was 14% among patients treated with other forms of chemotherapy.24-26
Fewer data exist regarding the thrombogenic potential of pomalidomide. In a multicenter, open-label, randomized phase II study of pomalidomide with and without lowdose dexamethasone in patients with relapsed/refractory MM, the incidence of VTE was lower (2%) with pomalido mide plus low-dose dexamethasone than with pomalido mide alone (3%).27 In a phase II multicenter, open-label study with pomalidomide-dexamethasone in early refrac tory or resistant MM patients with del(17p) and/or t(4;14) only one pulmonary embolism was reported in 50 treated patients; the use of thromboprophylaxis was mandatory in this study.28
With older conventional therapies such as melphalan and prednisone, the incidence of VTE during frontline therapy was 1-2%.29 In a meta-analysis comparing the efficacy of melphalan, prednisone, and thalidomide versus melphalan and prednisone, with five prospective randomized con trolled trials identified, the odds ratio for VTE was 2.4 in favor of melphalan-prednisone.30
The first-generation proteasome inhibitor bortezomib was associated with a very low rate of VTE, as demonstrated
by the randomized VISTA31 and APEX trials,32,33 as well as preclinical studies.34
There does not seem to a risk of VTE linked to the use of the monoclonal antibodies elotuzumab, daratumumab, and belantamab, or the proteasome inhibitor ixazomib,1,35,36 while VTE events have been reported in patients who re ceived the proteasome inhibitor carfilzomib. In the ASPIRE trial, the incidence of VTE in the patients treated with car filzomib, lenalidomide and dexamethasone was 13%, whereas the incidence in those treated only with lenali domide and dexamethasone was 6%.37 In a retrospective study of 223 newly diagnosed MM patients receiving as pirin thromboprophylaxis, VTE rates in those treated with carfilzomib, lenalidomide and dexamethasone or bortezo mib, lenalidomide, and dexamethasone were significantly different (16.1% vs. 4.8%), confirming a higher incidence of VTE when using carfilzomib, lenalidomide and dexameth asone induction.38
As far as the role of the disease phase, a recent metaanalysis reported that the rate of VTE was comparable in trials of newly diagnosed and refractory/relapsed MM.39 In phase III trials of lenalidomide maintenance, thromboem bolic complications were reportedly more frequent in the lenalidomide group than in the placebo group (6% vs. 2%, P=0.01).40 Within the maintenance phase of the Myeloma XI trial significantly more patients in the lenalidomide maintenance group than in the observation group had a VTE (4.1% vs. 0.6%, P<0.0001). Arterial events were also more frequent in those receiving lenalidomide mainten ance than in those under observation (1.3% vs. 0.3%, P=0.022).9
The importance of risk assessment models for the predic tion of thrombosis in cancer patients is well established. The Khorana risk score, based on the site of the cancer, hemoglobin <10 g/dL, use of an erythropoietin-stimulating agent, platelet count >350x109/L, leukocyte count >11x109/L, and body mass index >35 kg/m2, accurately pre dicted cancer-associated thrombosis in non-hematologic malignancies.41
Retrospective cohort analyses of newly diagnosed MM pa tients documented that the Khorana score is not predic tive of VTE in MM patients. In a cohort of 2,870 MM patients, 128 patients developed VTE within 6 months of MM diagnosis (4.4%). The Khorana score did not discrimi nate between patients who did and did not develop VTE at 3 or 6 months.42 In a recent study of 332 MM patients, 32 patients (9.6%) were diagnosed with VTE, 39% of them (9 of the 23 patients with available data) suffered VTE dur ing their induction chemotherapy. When individual vari ables from the Khorana score were subjected to univariate and multivariate analyses, the white blood cell count was the only variable that retained predictive significance.43 Some MM-specific risk models have been published. In 2008, the IMWG developed an MM-specific risk assess
ment model based on the presence of individual-, dis ease- and therapy-related risk factors (Table 1).7
In 2018, Swan et al.11 proposed an amended risk stratifi cation starting from the IMWG model and proposed an ad ditional group of very high risk patients (patients with a previous thrombosis, and those with antithrombin defi ciency) and focused on special patient populations such as patients with renal disease, recurrent thrombosis, and spinal cord compression. However, in the Myeloma XI trial the IMWG risk assessment model did not predict the risk of thrombosis efficiently: before VTE, 54.7% had been as signed to the high-risk group and 45.3% to the low-risk group.9
Two MM-specific risk assessment models were published in 2019.44,45 Sanfilippo and coworkers published the IMPEDEVTE clinical risk score based on data from 4,446 patients in the Veterans Administration Central Cancer Registry.44 The IMPEDE-VTE score included therapy with an immunomodu
Table 1. International Myeloma Working Group risk assessment model.7
Obesity (BMI ≥30 kg/m2)
Previous venous thromboembolism
Central venous catheter or pacemaker
Associated diseases
Cardiac disease
Chronic renal disease
Diabetes
Acute infection
Immobilization
Blood clotting disorders
Surgery
General surgery
Any anesthesia Trauma
Medications
Erythropoietin
Myeloma-related risk factors
Diagnosis
Hyperviscosity
Myeloma therapy
High-dose dexamethasone (≥480 mg/month)
Doxorubicin
Recommendations from the IMWG:
If no risk factor or any one risk factor is present: Aspirin 81-325 mg once daily
If two or more risk factors are present: LMWH (enoxaparin 40 mg once daily)
Full-dose warfarin (target INR 2-3)
BMI: body mass index; IMWG: International Myeloma Working Group; LMWH: low molecular weight heparin; INR: International Normalized Ratio.
latory drug, body mass index, pathological fractures, treat ment with an erythropoiesis-stimulating agent, dexameth asone or doxorubicin therapy, ethnicity, history of VTE, the presence of an indwelling tunneled line and existing thromboprophylaxis (Table 2). Three risk groups were identified. The 6-month cumulative incidence of VTE fol lowing treatment initiation was 3.3% for the low-risk group (scores ≤3), 8.3% for the intermediate-risk group (scores of 4-7), and 15.2% for the high-risk group (scores ≥8). The score was externally validated using the Surveillance, Epi demiology, End Results (SEER) Medicare database and 4,256 MM patients.44
A second group developed the SAVED risk assessment model for MM patients who receive immunomodulatory drug-based regimens using the SEER Medicare database to extract data retrospectively on 2,397 patients with MM.45 The data were subsequently validated using the Vet erans registry. Five variables were included in the SAVED score risk assessment model (prior surgery, Asian race, VTE history, age ≥80 years old, and dexamethasone dose) (Table 3). Patients were grouped into either low risk (score of 0-1) or high risk (score of ≥2) using this risk assessment model, and the model stratified approximately 30% of pa tients in both the derivation and the validation cohorts as high risk. The hazard ratios reported for high versus low VTE risk were 1.85 (P<0.01) and 1.98 (P<0.01) in the deriva tion and validation cohorts, respectively. Recently 575 patients with newly diagnosed MM were in cluded in an analysis to validate the IMPEDE score.46 The 6-month cumulative incidence of VTE was 5.0% (95% CI: 2.1-7-9) in the low-risk group, compared to 12.6% (95% CI:
Table 2. IMPEDE VTE risk assessment model.45
Immunomodulatory drug I + 4
Body Mass Index ≥ 25 kg/m2 M + 1
Pelvic, hip or femur fracture P + 4
Erythropoiesis-stimulating agent E + 1
Doxorubicin D + 3
Dexamethasone
High-dose (>160 mg/month) + 4
Low-dose (≤160 mg/month) + 2
Ethnicity/race = Asian/Pacific Islander E 3
History of Venous thromboembolism before MM V + 5
Tunneled line/central venous catheter T + 2
Existing thromboprophylaxis: therapeutic LMWH or warfarin E - 4
Existing thromboprophylaxis: prophylactic LMWH or aspirin - 3
MM: multiple myeloma; LMWH: low molecular weight heparin.
8.9-16.4%) and 24.1% (95% CI: 12.2-36.1) in the intermedi ate- and high-risk groups (P<0.001 for both). In addition, a higher proportion of patients in the VTE cohort had an Eastern Cooperative Oncology Group performance status of ≥2 as compared to the cohort without VTE (33% vs. 16%, P=0.001).
From these findings the IMPEDE score and SAVED score were recommended to be utilized as a VTE risk stratifica tion tool.47 Moreover, they should be employed in prospec tive studies investigating VTE prophylaxis strategies in MM patients.
Data about prophylaxis of thromboembolic events in MM patients are limited. In a recent systematic review by the Cochrane Collaboration, four randomized controlled trials with 1,042 participants were appraised.48
Two of these trials compared aspirin to LMWH at 6 months of follow-up (Table 4). One compared aspirin, fixed low-dose warfarin (1.25 mg/day), and LMWH (enoxa parin 40 mg/day) in 667 newly diagnosed MM patients who received thalidomide. This trial did not demonstrate a sig nificant difference among the three agents with regard to the composite primary endpoint including serious throm boembolic events, acute cardiovascular events, or sudden deaths. The rate of VTE was 4.5% in the aspirin group, 8.2%
in the warfarin group, and 2.7% in the LMWH group.49 In another randomized controlled trial, aspirin 100 mg/day was compared to the LMWH enoxaparin 40 mg/day in MM patients receiving lenalidomide-based induction regimens. The incidence of VTE was not significantly different with aspirin (2.2%) with respect to the LMWH (1.2%). Pulmonary embolism was observed in 1.7% of patients in the aspirin group and none in the LMWH group.50 However, in these trials, patients at very high risk (those with a previous his tory of arterial or venous thromboembolism) were ex cluded.
The pooled data did not confirm or exclude a beneficial or detrimental effect of aspirin relative to LMWH on symp
Table 3. SAVED risk assessment model.46
Predictor Acronym Score
Surgery (within 90 days)
Asian race
History of venous thromboembolism
Eighty (age ≥80 years)
Dexamethasone
S + 2
A - 3
V + 3
E + 1
D
High dose (>160 mg/cycle) + 2
Standard dose (120-160 mg/cycle) + 1
Box 1. Recommendations regarding thrombo-hemorrhagic risk factors and risk stratification in patients with multiple myeloma.
All patients with multiple myeloma who are candidates for active anti myeloma treatment need evaluation for risk• of thrombosis in order to prevent thromboembolic complications appropriately Patient-, disease- and treatment related factors should be evaluated
•
Patient related factors include advanced age, personal and family history of venous thromboembolism, obesity,
• immobility, central venous catheter, acute infection or hospitalization, comorbidities, race (being Caucasian is a risk factor), recent surgery, and ongoing hormone therapy.
There is no evidence to recommend universal laboratory testing for inherited thrombophilia. However, in the presence
• of a strong family history of venous thromboembolism, i.e. with one first degree relative <50 years with one episode of venous thromboembolism or two first degree relatives with one episode of venous thromboembolism, laboratory investigation for genetic thrombophilia should be considered, i e deficiency of antithrombin, protein C, protein S, factor V Leiden mutation, prothrombin G20210A mutation
• pelvis, femur or spine conditioning immobilization or requiring surgery
Disease related factors include: active multiple myeloma, evidence of hyperviscosity, pathological fracture of the
Treatment related factors include immunomodulatory drugs, especially in combination with high dose dexameth
asone, multiagent chemotherapy, or exposure to erythropoietin stimulating agents.
Even though risk assessment models such as the International Myeloma Working Group model and the IMPEDE and
SAVED scores were validated for use in clinical prospective studies, the panel of experts agreed that there are not sufficient data to recommend one specific risk assessment model in clinical practice. The panel recommended that application of a risk assessment model should be consistent in a single center for all the patients
Besides thrombotic risk, it is recommended that bleeding risk is also assessed before anti myeloma therapy is
started An accurate history should be collected from the patient and bleeding history investigated; prothrombin time, partial thromboplastin time, platelet count and fibrinogen level should be evaluated
Patients with alterations of first line diagnostic tests indicative of a bleeding predisposition, or with a history of
bleeding should be carefully evaluated by second line diagnostic tests in cooperation with an expert in coagulation.
Table 4. Primary antithrombotic prophylaxis in multiple myeloma: results of two randomized clinical trials49,50 and of studies addressing the use of apixaban or rivaroxaban.38,54-57
220 New diagnosis
Thal ASA 100 mg od 6 10 (4.5) [ATE, 1 (0.4)] NR 3 (1.3) 6 (2.7)
Palumbo et al., 201149 (RCT)
219 New diagnosis
220 New diagnosis
176 New diagnosis
Thal Enoxaparin 40 mg od 6 6 (2.7) [ATE 3, (1.4)] NR 0 3 (1.4)
Thal Warfarin 1.25 mg od 6 18 (8.2) NR 0 1 (0.5)
Larocca et al., 201250 (RCT)
Lena ASA 100 mg od 6 4 (2.2) 4 (2.2) 0 0
166 New diagnosis Lena Enoxaparin 40 mg od 6 2 (1.2) 0 0 1 (0.6)
Storrar et al., 201954 70 New diagnosis [prev. PE in 2] Thal (78.5%) Lena (21.5%)
Apixaban 2.5 mg bid 6 0 [ATE 2, (2.8)] 0 1 (1.4) 0
Pegourie et al., 201955 104 Relapse (89.4%) [prev. VTE in 15] Thal or Lena Apixaban 2.5 mg bid 6 2 (1.9) 0 1 (0.9) 10 (9)
Cornell et al., 202056 50 All stages (relapse 18%) Lena (58%) Poma (42%) Apixaban 2.5 mg bid 6 0 0 0 3 (6)
Piedra et al., 202138
Sayar et al., 202257
124 New diagnosis Lena (RVD) ASA 81 mg od 3 6 (4.8) NR 0 1 (0.8)
99 New diagnosis Lena (KRD) ASA 81 mg od 3 16 (16.1) NR 0 5 (5)
82 New diagnosis Lena (KRD) Rivaroxaban 10 mg od 3 4 (4.8) NR 0 1 (1.2)
98 Relapse (81%) IMID ASA 75 mg od NR 4 (4) 0 1 (1) 4 (4) 82 Apixaban 2.5 mg bid NR 0 0 1 (1.2) 7 (8.5)
MM: multiple myeloma; DVT: deep vein thrombosis; PE: pulmonary embolism; SVT: superficial vein thrombosis; MB: major bleeding; RCT: randomized controlled trial; ATE: arterial thrombotic event; ASA: aspirin; Thal: thalidomide; Lena: lenalidomide; Poma: pomalidomide; IMID: immunomodulatory drugs (thalidomide, lenalidomide or pomalidomide); RVD: lenalidomide, bortezomib, dexamethasone; KRD: lenalidomide, carfilzomib, dexamethasone; od: once daily; bid: twice daily; NR: not reported.
tomatic deep vein thrombosis (relative risk, 1.23; 95% CI: 0.49-3.08). The appraisal resulted in very low-certainty evidence.48
Further evidence on the efficacy of the most commonly used thromboprophylactic agents in MM relies on nonrandomized observational studies. In a systematic review of studies comparing aspirin versus other interventions in patients with MM, ten studies were included with 1,964 participants (1,257 treated with aspirin, 640 with LMWH and 67 with no thromboprophylaxis).51 Patients treated with aspirin had a significantly lower risk of VTE compared to those who did not receive any thromboprophylaxis (odds ratio = 0.20; 95% CI: 0.07-0.61). The use of aspirin was associated with a higher VTE risk compared to LMWH in longitudinal studies (odds ratio = 2.60; 95% CI: 1.086.25). However, the authors claimed that the data were in sufficient to confirm the superiority of LMWH over aspirin as thromboprophylaxis in MM patients.
In the prospective observational MELISSE study, VTE oc curred in 7% of patients on aspirin versus 3% on LMWH prophylaxis, and none on vitamin K antagonists among pa tients being treated with immunomodulatory drugs.52
Current thrombosis guidelines recommend primary VTE prophylaxis with aspirin, warfarin or LMWH. In 2008, the IMWG recommended primary thromboprophylaxis for MM patients and specifically aspirin for patients with one or no risk factors for VTE and LMWH (equivalent to enoxapa rin 40 mg/day) for those with two or more individual/mye loma-related risk factors and for all patients receiving concurrent high-dose dexamethasone or doxorubicin (Table 1). Full-dose warfarin to maintain a therapeutic In ternational Normalized Ratio of 2–3 is an alternative to LMWH.7
In 2015, the European Myeloma Network provided recom mendations for the management of the most common complications of MM. It was recommended that patients
who are due to start immunomodulatory drug therapy should receive appropriate anticoagulation for the dur ation of the treatment. In these patients, aspirin (100 mg) is considered sufficient for VTE prophylaxis in low-risk pa tients (i.e., without risk factors, or only one myeloma/in
dividual risk factor present), unless contraindicated. Otherwise, LMWH or full-dose warfarin should be used. The use of LMWH should be continued for at least 4 months and then patients may be switched to aspirin pro phylaxis.53
Box 2. Recommendations regarding primary antithrombotic prophylaxis in patients with multiple myeloma.
• for thromboprophylaxis
All patients with multiple myeloma who are candidates for active anti myeloma treatment should be considered
• thrombotic and hemorrhagic risk profiles.
The type, intensity and duration of thromboprophylaxis should be tailored according to the individual’s baseline
Severe thrombocytopenia (platelet count <20x109/L), active bleeding, congenital bleeding disorders (hemophilia,
• von Willebrand disease, severe deficiency of coagulation factors), and acquired coagulopathy that cannot be corrected (e g severe liver disease) are absolute contraindications to thromboprophylaxis
• of correction are relative contraindications to thromboprophylaxis
Mild thrombocytopenia (platelet count <50x109/L), a history of bleeding, and acquired coagulopathy with a chance
• thrombotic complications, it is recommended that the drug drug interactions of antithrombotic agents and anti myeloma drugs are considered.
To ensure appropriate, safe and effectiv e thromboprophylaxis and to avoid the risks of bleeding and potential
• tients should be adequately informed about their thrombotic risk.
Patients’ compliance and patients’ preferences should be considered in the choice of thromboprophylaxis, and pa
• tures, a central venous catheter, or co morbidities and not planned to receive therapy with immunomodulatory drugs, should not be given thromboprophylaxis or can be given thromboprophylaxis with low dose aspirin The criterion for the choice is the individual hemorrhagic risk
•
Patients at low risk of thrombosis, i.e. those aged less than 75 years, with a normal body mass index, without frac
All other patients should receive thromboprophylaxis, with low molecular weight heparin as the first choice
Patients without other risk factors for thrombosis except for a planned therapy containing an immunomodulatory• drug and with a contraindication, strong aversion or documented poor compliance to low molecular weight heparin therapy, could be given aspirin as thromboprophylaxis.
Preliminary data on the efficacy and safety of apixaban and rivaroxaban as primary thromboprophylaxis in patients• receiving immunomodulatory drugs are promising. However, there is no strong evidence in favor of direct oral anti coagulants instead of a low molecular weight heparin
• molecular weight heparin (e g., for allergy) should be considered
Off label prescription of apixaban as primary antithrombotic prophylaxis in patients with contraindications to low
• evolving risk factors. Prophylaxis should continue as long as a thrombotic risk is present (e.g., active disease or as sumption of drugs with a thrombotic risk).
The duration of thromboprophylaxis should be modulated according to the length of anti myeloma treatment and
Patients with relapsed multiple myeloma should receive thromboprophylaxis during the treatment according to the• indications recommended for newly diagnosed patients.
For patients under lenalidomide maintenance, thromboprophylaxis is indicated even if thromboembolic events are• less frequent than during newly diagnosed disease In these patients, prophylactic aspirin 100 mg/day is recom mended
In patients with renal insufficiency, the most appropriate prophylaxis should be chosen according to the degree of• renal function For patients with a creatinine clearance below 30 mL/min, low molecular weight heparin with dose adjustments is the preferred prophylaxis. Dose adjustments of low molecular weight heparin according to creatinine clearance value are recommended (Table 5).
During antithrombotic prophylaxis, the platelet count should be monitored, particularly in patients receiving anti• myeloma therapeutic combinations that are at high risk of causing thrombocytopenia.
• should be applied when the platelet count is 30-50x109/L Full dose thromboprophylaxis can be used when the pla telet count is over 50x109/L
Thromboprophylaxis should be stopped if the platelet count decreases to less than 20-30x109/L. Dose reductions
Primary thromboprophylaxis should be stopped in the case of clinically relevant or major bleeding In this circum
stance, the cause of bleeding should be evaluated and eventually corrected before restarting thromboprophylaxis
The National Comprehensive Cancer Network guidelines included guidance on the prevention of VTE in MM pa tients. The recommended VTE prophylaxis for patients with an IMPEDE score of ≤3 points or a SAVED score of <2 points is aspirin at a dose of 81 to 325 mg once daily. For those with an IMPEDE score of ≥4 points or a SAVED score of ≥2 points, the recommendation is enoxaparin (40 mg/day subcutaneously), warfarin (target International Normalized Ratio, 2.0–3.0), fondaparinux (2.5 mg/day sub cutaneously), or a DOAC, such as rivaroxaban at a dose of 10 mg/day orally or apixaban at a dose of 2.5 mg orally twice daily.47 Thus, alternative thromboprophylaxis strat egies for MM under consideration at present include the use of a DOAC licensed for the treatment of cancer-as sociated thrombosis. These drugs are inhibitors of clotting factor Xa, are administered orally, do not require blood monitoring at standard doses, and have fewer drug-drug interactions compared to warfarin. Data are accumulating regarding the use of apixaban in primary VTE prevention in MM patients treated with im munomodulatory drugs (Table 4).54-57
Four recent studies comprising 306 patients in total have evaluated VTE and bleeding rates with the use of apixaban at 2.5 mg twice daily for at least 6 months, with only two recorded VTE events (0.6%): an asymptomatic proximal deep vein thrombosis and a symptomatic distal deep vein thrombosis. In the latter case, apixaban had been stopped 14 days before the event. The pooled data revealed three episodes of major hemorrhage (1%).54-57 This bleeding fre quency seems comparable to that reported in a popu lation of 1,605 MM patients with an incident VTE requiring treatment. The cumulative incidence of major bleeding was 4.8% in the warfarin group and 3.2% in the LMWH and DOAC groups. The incidence rate of bleeding was 25.7, 20.1, and 25.2 per 1,000 person-years for patients treated with warfarin, LMWH, and a DOAC, respectively.58
A retrospective study of 305 newly diagnosed MM patients showed that the use of low-dose rivaroxaban thrombopro phylaxis can mitigate the risk of deep vein thrombosis with out an observable increase in bleeding rates (Table 4).38
Early treatment of acute thrombotic events, secondary antithrombotic prophylaxis, and re-exposure to anti-myeloma drugs (Box 3)
Treatment of acute VTE in the setting of cancer is well es tablished. LMWH has been the standard of care for treat ment of acute VTE for many years although there has recently been a slow transition to DOAC as evidence sug gests that these newer drugs can be safe and effective. DOAC (apixaban, edoxaban, rivaroxaban, and dabigatran) have emerged as the preferred treatment option for VTE in the general population.59 Recently, factor Xa-inhibitors (the so-called xabans: edoxaban, apixaban, and rivaroxaban) have been tested head-to-head against LMWH in four
Table 5. Dose adjustments of low molecular weight heparin and fondaparinux in renal insufficiency.
CrCl ≥30 mL/min: no dose adjustments
CrCl <30 mL/min: dose reduction of 25-30%
Dialysis: dose reduction of 50% Fondaparinux
CrCl <20 mL/min: use not recommended
CrCl 20-50 mL/min: 1.5 mg/day
CrCl >50 mL/min: no dose adjustments
CrCl: creatinine clearance.
studies on the treatment and secondary prevention of VTE in patients with cancer.60-63 A meta-analysis of these four trials, which included 2,894 cancer patients, showed that the xabans significantly reduced the incidence of recurrent VTE compared to that in patients treated with LMWH (5.2% vs. 8.2%; relative risk, 0.62; 95% CI: 0.43-0.91), but were as sociated with a non-significant increase in major bleeding (4.3% vs. 3.3%; relative risk, 1.31; 95% CI: 0.83-2.08) and a statistically significant increase in clinically relevant nonmajor bleeding (10.4% vs. 6.4%; relative risk, 1.65; 95% CI: 1.19-2.28).64 However, less than 10% of the patients in these studies had hematologic malignancies.
Current thrombosis and oncology guidelines recommend treatment of VTE in cancer for 3 to 6 months or longer if cancer therapy is ongoing or the malignancy remains pres ent.65 As for VTE in patients receiving cancer therapy in general, for VTE occurring in the context of anti-MM ther apy, patients should be on anticoagulants for at least 6 months provided they do not have a high bleeding risk. The choice of anticoagulant medication depends on the individual patient’s renal function and ability to perform subcutaneous self-injections when using LMWH, as well as public or private funding for DOAC.
In the light of new therapies for MM, key clinically relevant questions regarding MM-associated thrombosis were identified, and recommendations were formulated by a panel of experts in the field. Although several scientific bodies have provided guidance on how to optimize throm boprophylaxis in MM patients, the panel highlighted the high degree of uncertainty regarding risk stratification and thromboprophylaxis in MM patients. Since the existing scientific literature about thromboprophylaxis in MM does not allow evidence-based recommendations, consensus was a critical part of the production of the present re commendations.
Box 3. Recommendations regarding early treatment of acute thrombotic events, secondary antithrombotic prophylaxis, and re-exposure to anti-myeloma drug in patients with multiple myeloma.
Patients with multiple myeloma on secondary prophylaxis with long term oral anticoagulation with vitamin K an
• tagonists or direct oral anticoagulants, should continue with their anticoagulation treatment during anti myeloma therapy.
Patients on anti platelet therapy (single or double agents) because of previous arterial ischemic events should con
• tinue their ongoing anti platelet prophylaxis. They should add a low molecular weight heparin after a careful eva luation of the risk benefit ratio during anti myeloma treatment The use of low molecular weight heparin should be considered as long as the myeloma disease burden remains high
Patients with a history of provoked venous thromboembolism or of thrombosis of superficial veins not receiving
• oral anticoagulation should receive a short term course of prophylactic low molecular weight heparin (4-6 months) followed by aspirin 100 mg/day during anti myeloma treatment.
Patients with a history of unprovoked venous thromboembolism not receiving oral anticoagulation who have normal
• renal function may be treated with a low molecular weight heparin, vitamin K antagonist or a direct oral anticoagulant (apixaban). The choice should be based on pharmacological interactions and risk of bleeding.
In patients with a history of unprovoked venous thromboembolism who have started low molecular weight heparin
• or oral anticoagulation as thromboprophylaxis after a diagnosis of multiple myeloma, the decision to change to aspi rin after 6 months or to continue with oral anticoagulation during long term treatment with immunomodulatory drugs should be evaluated case by case
• from that usually recommended.
In general, the treatment of acute thrombosis during active treatment for multiple myeloma should not be different
• modulatory drugs should continue the therapy and receive long term anticoagulation.
Patients with multiple myeloma and non life threatening venous thromboembolism during therapy with immuno
In the case of life threatening venous thromboembolism or arterial thrombosis during treatment with immunomo
• dulatory drugs, a careful case by case evaluation should be made, considering the response of the multiple myeloma disease to immunomodulatory drugs, the severity of the thrombosis, and the patient’s risk profile for future events
In multiple myeloma patients with acute venous thromboembolism, the duration of anticoagulant treatment should• be at least 6 months or indefinite in the case of ongoing treatment with immunomodulatory drugs
• even after 6 months until response of the myeloma disease.
In active multiple myeloma with a high burden of disease, patients should continue the anticoagulant treatment
As regards the platelet count during secondary thromboprophylaxis, the same recommendations as for primary• thromboprophylaxis should be followed.
• vena cava filter is suggested until safe anticoagulation is possible, and the filter can be removed
In the case of acute venous thromboembolism and severe thrombocytopenia, the placement of a retrievable inferior
In patients with renal insufficiency (with or without ongoing dialysis) the most appropriate secondary antithrombotic• prophylaxis after venous thromboembolism is adjusted dose low molecular weight heparin or a vitamin K antago nist
During the discussion to formulate the recommendations on thromboprophylaxis, the panel highlighted that two is sues on treatment-emergent thrombotic events in MM require further investigation. The definition of the level of risk for thrombosis, particularly that during therapy with immunomodulatory drugs, is a critical determinant in thromboprophylaxis in MM. Understanding the complex procoagulant profile of the MM patient was recognized by the expert panel as critical for a personalized risk stratifi cation. To date, the underlying causes that lead to en hanced coagulation in the MM patient have not been delineated. It has been shown that serum levels of the anticoagulant cofactor thrombomodulin decrease in people treated with thalidomide.66 Moreover, extremely high levels of von Willebrand factor antigen and factor VIII
have been documented in people with MM receiving thal idomide, dexamethasone, and chemotherapy.67 Most groups have reported multiple abnormal parameters of the thrombin generation assay in patients with MM com pared to those in healthy controls.68,69 However, bio markers that accurately reflect prothrombotic risk in these patients and can be combined with clinical factors to enhance risk stratification have not been identified. The panel argued that the search for a useful biomarker is a prime objective in MM research through exploration of the complex mechanism of coagulation in this disease.
The results with xabans in MM are encouraging; however, no definite recommendation on their use has been pro vided. The panel agreed that new evidence on the benefits and risks of xabans for prevention of VTE recurrence in
patients with MM needs to be acquired through direct clinical experimentation. The major issue for clinical trials with DOAC in MM patients is trial feasibility. In the setting of MM the panel agreed that a pragmatic pivotal random ized comparison of DOAC to the standard-treatment con trol could facilitate trial feasibility.
VDS has received honoraria for participation in speakers bureau and advisory boards from AbbVie, Alexion, Amgen, AOP Health, BMS Celgene, Grifols , GSK, Leo Pharma, No vartis, Sanofi, Sobi, and Takeda, and has received research grants from Novartis. AL has received honoraria for partici pation in speakers bureau and advisory boards from Amgen, BMS Celgene, GSK, Janssen-Cilag, Oncopeptides, Sanofi, and Takeda. MoC has received honoraria for par ticipation in speakers bureau and advisory boards from Amgen, Argenx, Novartis, and Sobi. MiC has received hon oraria from AbbVie, Adaptative, Amgen, BMS Celgene, GSK, Janssen-Cilag, Sanofi, and Takeda, and has served on speakers bureau for BMS Celgene and Janssen-Cilag. FDR has received honoraria for participation in speakers bureau and advisory boards from Amgen, BMS Celgene, GSK, Janssen-Cilag, and Takeda. AF has received honoraria for participation in speakers bureau and advisory boards from Bayer, Instrumentation Laboratory, Kedrion, Leo Pharma, Pfizer, Sanofi, and Stago, and has received a research grant from Italfarmaco. MO has received honoraria for participa tion in speakers bureau and advisory boards from AbbVie, Amgen, BMS, Celgene, GSK, Janssen-Cilag, Sanofi, and Takeda. MTP has received honoraria for participation in speakers bureau and advisory boards from Amgen, BMSCelgene, GSK, Janssen-Cilag, Karyopharm, Roche, Sanofi,
1. Fotiou D, Gavriatopoulou M, Terpos E. Multiple myeloma and thrombosis: prophylaxis and risk prediction tools. Cancers (Basel). 2020;12(1):191.
2. Falanga A, Marchetti M. Venous thromboembolism in the hematologic malignancies, J Clin Oncol. 2009;27(29):4848-4857.
3. Carrier M, Le Gal G, Tay J, Wu C, Lee AY. Rates of venous thromboembolism in multiple myeloma patients undergoing immunomodulatory therapy with thalidomide or lenalidomide: a systematic review and meta-analysis. J Thromb Haemostas. 2011;9(4):653-663.
4. De Stefano V, Za T, Rossi E. Venous thromboembolism in multiple myeloma. Semin Thromb Hemost. 2014;40(3):338-347.
5. Kristinsson SY, Pfeiffer RM, Björkholm M, Schulman S, Landgren O. Thrombosis is associated with inferior survival in multiple myeloma. Haematologica. 2012;97(10):1603-1607.
6. Schoen MW, Carson KR, Luo S, et al. Venous thromboembolism in multiple myeloma is associated with increased mortality. Res Pract Thromb Haemost. 2020;4(7):1203-1210.
7. Palumbo A, Rajkumar SV, Dimopoulos MA, et al. Prevention of thalidomide- and lenalidomide-associated thrombosis in
and Takeda, and has received support for attending meet ings and/or travel from Amgen, BMS, Celgene, JanssenCilag, Sanofi, and Takeda. RMS has received honoraria for participation in speakers bureau and advisory boards from Amgen, Boheringher, Kedrion, Novartis , and Roche. MR and GB declare no conflicts of interest. Furthermore, some authors have received honoraria from companies that pro duce drugs used to treat multiple myeloma, including Amgen (carfilzomib), BMS Celgene (elotuzumab, thalido mide, lenalidomide, pomalidomide), GSK (belantamab ma fodotin), Janssen-Cilag (bortezomib, daratumumab), Sanofi (isatuximab), and Takeda (ixazomib).
VDS, AL, and GB conceived and designed the study, and prepared and edited the manuscript. VDS and AL acquired the data. GB was responsible for the quality control of the data and algorithms. VDS, AL, MoC, MiC, FDR, AF, MO, MTP, MR, RS, and GB were responsible for analyzing and inter preting the data. MoC, MiC, FDR, AF, MO, MTP, MR, and RS reviewed the manuscript. All authors approved the final version of the manuscript for submission.
The authors would like to thank Bristol Myers Squibb Cel gene for an unrestricted contribution supporting the pro ject. The funding sources had no role in identifying statements, abstracting data, synthesizing results, grad ing evidence, or preparing the manuscript or in the deci sion to submit the manuscript for publication. The assistance of Springer Healthcare Communications in supporting consensus meetings is gratefully acknowl edged.
myeloma. Leukemia. 2008;22(2):414-423.
8. Lyman GH, Bohlke K, Khorana AA, et al. Venous thromboembolism prophylaxis and treatment in patients with cancer: American Society of Clinical Oncology clinical practice guideline update 2014. J Clin Oncol. 2015;33(6):654-656.
9. Bradbury CA, Craig Z, Cook G, et al. Thrombosis in patients with myeloma treated in the Myeloma IX and Myeloma XI phase 3 randomized controlled trials. Blood. 2020;136(9):1091-1104.
10. Leclerc V, Karlin L, Herledan C, et al. Thromboembolic events and thromboprophylaxis associated with immunomodulators in multiple myeloma patients: a real-life study. J Cancer Res Clin Oncol. 2022;148(4):975-984.
11. Swan D, Rocci A, Bradbury C, Thachil J. Venous thromboembolism in multiple myeloma - choice of prophylaxis, role of direct oral anticoagulants and special considerations. Br J Haematol. 2018;183(4):538-556.
12. Williams PL, Webb C. The Delphi technique: a methodological discussion. J Adv Nurs. 1994;19(1):180-186.
13. Cini M, Zamagni E, Valdré L, et al. Thalidomide-dexamethasone as up-front therapy for patients with newly diagnosed multiple
myeloma: thrombophilic alterations, thrombotic complications, and thromboprophylaxis with low-dose warfarin. Eur J Haematol. 2010;84(6):484-492.
14. Bagratuni T, Kastritis E, Politou M, et al. Clinical and genetic factors associated with venous thromboembolism in myeloma patients treated with lenalidomide-based regimens. Am J Hematol. 2013;88(9):765-770.
15. Richardson P, Jagannath S, Hussein M, et al. Safety and efficacy of single-agent lenalidomide in patients with relapsed and refractory multiple myeloma. Blood. 2009;114(4):772-778.
16. Palumbo A, Palladino C. Venous and arterial thrombotic risks with thalidomide: evidence and practical guidance. Ther Adv Drug Saf. 2012;3(5):255-266.
17. Fouquet G, Tardy S, Demarquette H, et al. Efficacy and safety profile of long-term exposure to lenalidomide in patients with recurrent multiple myeloma. Cancer. 2013;119(20):3680-3686.
18. Rajkumar SV, Hayman SR, Lacy MQ, et al. Combination therapy with lenalidomide plus dexamethasone (Rev/Dex) for newly diagnosed myeloma. Blood. 2005;106(13):4050-4053.
19. Zonder JA, Barlogie B, Durie BG, McCoy J, Crowley J, Hussein MA. Thrombotic complications in patients with newly diagnosed multiple myeloma treated with lenalidomide and dexamethasone: benefit of aspirin prophylaxis. Blood. 2006;108(1):403.
20. Dimopoulos M, Spencer A, Attal M, et al. Lenalidomide plus dexamethasone for relapsed or refractory multiple myeloma. N Engl J Med. 2007;357(21):2123-2132.
21. Weber DM, Chen C, Niesvizky R, et al. Lenalidomide plus dexamethasone for relapsed multiple myeloma in North America. N Engl J Med. 2007;357(21):2133-2142.
22. Rajkumar SV, Jacobus S, Callander NS, Fonseca R, Vesole DH, Williams ME. Lenalidomide plus high-dose dexamethasone versus lenalidomide plus low-dose dexamethasone as initial therapy for newly diagnosed multiple myeloma: an open-label randomised controlled trial. Lancet Oncol. 2010;11(1):29-37.
23. Zonder JA, Crowley J, Hussein MA, et al. Lenalidomide and highdose dexamethasone compared with dexamethasone as initial therapy for multiple myeloma: a randomized Southwest Oncology Group trial (S0232). Blood. 2010;116(26):5838-5841.
24. Baz R, Walker E, Karam MA, et al. Lenalidomide and pegylated liposomal doxorubicin-based chemotherapy for relapsed or refractory multiple myeloma: safety and efficacy. Ann Oncol. 2006;17(12):1766-1771.
25. Knop S, Langer C, Engelhardt M, et al. Lenalidomide, adriamycin, dexamethasone for induction followed by stem-cell transplant in newly diagnosed myeloma. Leukemia. 2017;31(8):1816-1819.
26. Morgan GJ, Schey SA, Wu P, et al. Lenalidomide (Revlimid), in combination with cyclophosphamide and dexamethasone (RCD), is an effective and tolerated regimen for myeloma patients. Br J Haematol. 2007;137(3):268-269.
27. Richardson PG, Siegel DS, Vij R, et al. Pomalidomide alone or in combination with low-dose dexamethasone in relapsed and refractory multiple myeloma: a randomized phase 2 study. Blood. 2014;123(12):1826-1832.
28. Leleu X, Karlin L, Macro M, et al. Pomalidomide plus low-dose dexamethasone in multiple myeloma with deletion 17p and/or translocation (4;14): IFM 2010-02 trial results. Blood. 2015;125(9):1411-1417.
29. Palumbo A, Bringhen S, Caravita T, et al. Oral melphalan and prednisone chemotherapy plus thalidomide compared with melphalan and prednisone alone in elderly patients with multiple myeloma: randomised controlled trial. Lancet. 2006;367(9513):825-831.
30. Kapoor P, Rajkumar SV, Dispenzieri A, et al. Melphalan and prednisone versus melphalan, prednisone and thalidomide for elderly and/or transplant ineligible patients with multiple myeloma: a meta-analysis. Leukemia. 2011;25(4):689-696.
31. San Miguel JF, Schlag R, Khuageva NK, et al. Bortezomib plus melphalan and prednisone for initial treatment of multiple myeloma. N Engl J Med. 2008;359(9):906-917.
32. Richardson PG, Sonneveld P, Schuster MW, et al. Bortezomib or high-dose dexamethasone for relapsed multiple myeloma. N Engl J Med. 2005;352(24):2487-2498.
33. Lonial S, Richardson PG, San Miguel J, et al. Characterisation of haematological profiles and low risk of thromboembolic events with bortezomib in patients with relapsed multiple myeloma. Br J Haematol. 2008;143(2):222-229.
34. Zangari M, Guerrero J, Cavallo F, Prasad HK, Esseltine D, Fink L. Hemostatic effects of bortezomib treatment in patients with relapsed or refractory multiple myeloma. Haematologica. 2008;93(6):953-954.
35. Wang J, Park C, Arroyo-Suarez R. Venous thromboembolism in patients with multiple myeloma receiving daratumumab-based regimens: a post hoc analysis of phase 3 clinical trials. Leuk Lymphoma. 2021;62(9):2219-2226.
36. Lonial S, Lee HC, Badros A, et al. Longer term outcomes with single-agent belantamab mafodotin in patients with relapsed or refractory multiple myeloma: 13-month follow-up from the pivotal DREAMM-2 study. Cancer. 2021;127(22):4198-4212.
37. Stewart AK, Rajkumar SV, Dimopoulos MA, et al. Carfilzomib, lenalidomide, and dexamethasone for relapsed multiple myeloma. N Engl J Med. 2015;372(2):142-152.
38. Piedra K, Peterson T, Tan C, et al. Comparison of venous thromboembolism incidence in newly diagnosed multiple myeloma patients receiving bortezomib, lenalidomide, dexamethasone (RVD) or carfilzomib, lenalidomide, dexamethasone (KRD) with aspirin or rivaroxaban thromboprophylaxis. Br J Haematol. 2022;196(1):105-109.
39. Chakraborty R, Bin Riaz I, Malik SU, et al. Venous thromboembolism risk with contemporary lenalidomide-based regimens despite thromboprophylaxis in multiple myeloma: a systematic review and meta-analysis. Cancer. 2020;126(8):1640-1650.
40. Attal M, Lauwers-Cances V, Marit G, et al. Lenalidomide maintenance after stem-cell transplantation for multiple myeloma. N Engl J Med. 2012;366(19):1782-1791.
41. Khorana AA, Kuderer NM, Culakova E, Lyman GH, Francis CW. Development and validation of a predictive model for chemotherapy-associated thrombosis. Blood. 2008;111(10):4902-4907.
42. Sanfilippo KM, Carson KR, Wang TF, et al. Evaluation of the Khorana score for prediction of venous thromboembolism in patients with multiple myeloma. Res Pract Thromb Haemost. 2022;6(1):e12634.
43. Barrett A, Quinn J, Lavin M, et al. Validation of risk-adapted venous thromboembolism prediction in multiple myeloma patients. J Clin Med. 2021;10(16):3536.
44. Sanfilippo KM, Luo S, Wang TF, et al. Predicting venous thromboembolism in multiple myeloma: development and validation of the IMPEDE VTE score. Am J Hematol. 2019;94(11):1176-1184.
45. Li A, Wu Q, Luo S, et al. Derivation and validation of a risk assessment model for immunomodulatory drug-associated thrombosis among patients with multiple myeloma. J Natl Compr Canc Netw. 2019;17(7):840-847.
46. Covut F, Ahmed R, Chawla S, et al. Validation of the IMPEDE VTE score for prediction of venous thromboembolism in multiple
myeloma: a retrospective cohort study. Br J Haematol. 2021;193(6):1213-1219.
47. Callander NS, Baljevic M, Adekola K, et al. NCCN Guidelines® insights: multiple myeloma, version 3.2022. J Natl Compr Canc Netw. 2022;20(1):8-19.
48. Kahale LA, Matar CF, Tsolakian I, et al. Antithrombotic therapy for ambulatory patients with multiple myeloma receiving immunomodulatory agents. Cochrane Database Syst Rev. 2021;9(9):CD014739.
49. Palumbo A, Cavo M, Bringhen S, et al. Aspirin, warfarin, or enoxaparin thromboprophylaxis in patients with multiple myeloma treated with thalidomide: a phase III, open-label, randomized trial. J Clin Oncol. 2011;29(8):986-993.
50. Larocca A, Cavallo F, Bringhen S, et al. Aspirin or enoxaparin thromboprophylaxis for patients with newly diagnosed multiple myeloma treated with lenalidomide. Blood. 2012;119(4):933-939.
51. Zoppellaro G, Veronese N, Granziera S, Gobbi L, Stubbs B, Cohen AT. Primary thromboembolic prevention in multiple myeloma patients: an exploratory meta-analysis on aspirin use. Semin Hematol. 2018;55(4):182-184.
52. Leleu X, Rodon P, Hulin C, et al. MELISSE, a large multicentric observational study to determine risk factors of venous thromboembolism in patients with multiple myeloma treated with immunomodulatory drugs. Thromb Haemost. 2013;110(4):844-851.
53. Terpos E, Kleber M, Engelhardt M, et al. European Myeloma Network guidelines for the management of multiple myelomarelated complications. Haematologica. 2015;100(10):1254-1266.
54. Storrar NPF, Mathur A, Johnson PRE, Roddie PH. Safety and efficacy of apixaban for routine thromboprophylaxis in myeloma patients treated with thalidomide- and lenalidomide-containing regimens. Br J Haematol. 2019;185(1):142-144.
55. Pegourie B, Karlin L, Benboubker L, et al. Apixaban for the prevention of thromboembolism in immunomodulatory-treated myeloma patients: Myelaxat, a phase 2 pilot study. Am J Hematol. 2019;94(6):635-640.
56. Cornell RF, Goldhaber SZ, Engelhardt BG, et al. Primary prevention of venous thromboembolism with apixaban for multiple myeloma patients receiving immunomodulatory agents. Br J Haematol. 2020;190(4):555-561.
57. Sayar Z, Gates C, Bristogiannis S, et al. Safety and efficacy of apixaban as thromboprophylaxis in myeloma patients receiving chemotherapy: a prospective cohort study. Thromb Res. 2022;213:27-29.
58. Herrera DA, Lutsey PL, Giorgio K, Zakai NA. Bleeding risk in
patients with multiple myeloma treated for venous thromboembolism. Blood. 2021;138(Suppl 1):3023.
59. Kearon C, Akl EA, Ornelas J, et al. Antithrombotic therapy for VTE disease: CHEST guideline and expert panel report. Chest. 2016;149(2):315-352.
60. Raskob GE, van Es N, Verhamme P, et al. Edoxaban for the treatment of cancer-associated venous thromboembolism. N Engl J Med. 2018;378(7):615-624.
61. Young AM, Marshall A, Thirlwall J, et al. Comparison of an oral factor Xa inhibitor with low molecular weight heparin in patients with cancer with venous thromboembolism: results of a randomized trial (SELECT-D). J Clin Oncol. 2018;36(20):2017-2023.
62. McBane RD 2nd, Wysokinski WE, Le-Rademacher JG, et al. Apixaban and dalteparin in active malignancy-associated venous thromboembolism: the ADAM VTE trial. J Thromb Haemost. 2020;18(2):411-421.
63. Agnelli G, Becattini C, Meyer G, et al. Apixaban for the treatment of venous thromboembolism associated with cancer. N Engl J Med. 2020;382(17):1599-1607.
64. Moik F, Posch F, Zielinski C, Pabinger I, Ay C. Direct oral anticoagulants compared to low-molecular-weight heparin for the treatment of cancer-associated thrombosis: updated systematic review and meta-analysis of randomized controlled trials. Res Pract Thromb Haemost. 2020;4(4):550-561.
65. Key NS, Khorana AA, Kuderer NM, et al. Venous thromboembolism prophylaxis and treatment in patients with cancer: ASCO clinical practice guideline update. J Clin Oncol. 2020;38(5):496-520.
66. Corso A, Lorenzi A, Terulla V, et al. Modification of thrombomodulin plasma levels in refractory myeloma patients during treatment with thalidomide and dexamethasone. Ann Hematol. 2004;83(9):588-591.
67. Minnema MC, Fijnheer R, De Groot PG, Lokhorst HM. Extremely high levels of von Willebrand factor antigen and of procoagulant factor VIII found in multiple myeloma patients are associated with activity status but not with thalidomide treatment. J Thromb Haemost. 2003;1(3):445-449.
68. Petropoulou AD, Gerotziafas GT, Samama MM, Hatmi M, Rendu F, Elalamy I. In vitro study of the hypercoagulable state in multiple myeloma patients treated or not with thalidomide. Thromb Res. 2008;121(4):493-497.
69. Crowley MP, Kevane B, O'Shea SI, et al. Plasma thrombin generation and sensitivity to activated protein C among patients with myeloma and monoclonal gammopathy of undetermined significance. Clin Appl Thromb Hemost. 2016;22(6):554-562.
Amos Tuval,1,2 Yardena Brilon,1 Hadas Azogy,1,3 Yoni Moskovitz,1 Dena Leshkowitz,4 Tomer M Salame,4 Mark D Minden,5,6,7,8 Perry Tal,9 Varda Rotter,9 Moshe Oren,9 Nathali Kaushansky1 and Liran I Shlush1,10,11
1Department of Immunology, Weizmann Institute of Science, Rehovot, Israel; 2Department of Hematology, Meir Medical Center, Kfar Saba, Israel; 3Department of Pathology, Sackler Faculty of Medicine, Tel Aviv University, Tel Aviv, Israel; 4Department of Life Sciences Core Facilities, Weizmann Institute of Science, Rehovot, Israel; 5Princess Margaret Cancer Center, University Health Network (UHN), Toronto, Ontario, Canada; 6Department of Medicine, University of Toronto, Toronto, Ontario, Canada; 7Division of Medical Oncology and Hematology, University Health Network, Toronto, Ontario, Canada; 8Department of Medical Biophysics, University of Toronto, Toronto, Ontario, Canada; 9Department of Molecular Cell Biology, Weizmann Institute of Science, Rehovot, Israel; 10Division of Hematology, Rambam Health Care Campus, Haifa, Israel and 11Molecular Hematology Clinic, Maccabi Healthcare Services, Tel Aviv, Israel
Correspondence: L. I. Shlush liran.shlush@weizmann.ac.il
Received: November 9, 2021.
Accepted: January 19, 2022.

Prepublished: February 24, 2022. https://doi.org/10.3324/haematol.2021.280329
©2022 Ferrata Storti Foundation
Published under a CC BY-NC license
Pre-leukemic clones carrying DNMT3A mutations have a selective advantage and an inherent chemoresistance, however the basis for this phenotype has not been fully elucidated. Mutations affecting the gene TP53 occur in pre-leukemic hema topoietic stem/progenitor cells (preL-HSPC) and lead to chemoresistance. Many of these mutations cause a conformational change and some of them were shown to enhance self-renewal capacity of preL-HSPC. Intriguingly, a misfolded P53 was described in AML blasts that do not harbor mutations in TP53, emphasizing the dynamic equilibrium between wild-type (WT) and “pseudo-mutant” conformations of P53. By combining single cell analyses and P53 conformation-specific mono clonal antibodies we studied preL-HSPC from primary human DNMT3A-mutated AML samples. We found that while leu kemic blasts express mainly the WT conformation, in preL-HSPC the pseudo-mutant conformation is the dominant. HSPC from non-leukemic samples expressed both conformations to a similar extent. In a mouse model we found a small subset of HSPC with a dominant pseudo-mutant P53. This subpopulation was significantly larger among DNMT3AR882H-mutated HSPC, suggesting that while a pre-leukemic mutation can predispose for P53 misfolding, additional factors are involved as well. Treatment with a short peptide that can shift the dynamic equilibrium favoring the WT conformation of P53, spe cifically eliminated preL-HSPC that had dysfunctional canonical P53 pathway activity as reflected by single cell RNA se quencing. Our observations shed light upon a possible targetable P53 dysfunction in human preL-HSPC carrying DNMT3A mutations. This opens new avenues for leukemia prevention.
Although acute myeloid leukemia (AML) is preceded by clonal hematopoiesis (CH), most CH clones are not “pre-leukemic” and do not transform to AML.1 When referring to the most common mutated gene in CH, DNMT3A, the main discrimi native characteristics between pre-AML and CH are larger clones and more accompanying mutations, reflecting the se lective advantage of these clones.2 Experimental and clinical studies have demonstrated that DNMT3A-mutated pre-leu kemic clones have also an inherent chemoresistance and the ability to reconstitute the bone marrow following AML chemotherapeutic treatments.3-5 The mechanisms behind this pre-AML phenotype remain unclear.
Mutations affecting TP53 occur during the pre-leukemic stage of AML.6. Some of these mutations cause a con formational change7 that can be detected using con formation-specific monoclonal antibodies.8 In a heterozygous state, the mutant protein can have a domi nant negative effect over the wild-type (WT) protein that leads to chemoresistance and P53 dysfunction as re flected by a reduced expression of downstream target genes of P53.9 Moreover, TP53 mutations can enhance the self-renewal capacity of murine hematopoietic stem/pro genitor cells (HSPC).10
Interestingly, a dynamic equilibrium was described be tween the WT and the mutant conformations of P53. The WT protein can acquire a ”pseudo-mutant” conformation
rendering it dysfunctional, with a reduced transcriptional ac tivity11. The pseudo-mutant conformation was found in TP53 WT AML blasts,12 and was correlated with growth factor stimulation.13
In this report we investigated whether P53 conformational changes occur during early evolutionary stages of DNMT3A mutated (TP53 WT) AML, similar to the stages during which TP53 mutations appear. Furthermore, we tested the in fluence of a short peptide, that stabilizes the WT conforma tion of P53 and restores its transcriptional activity,14 on the fitness of DNMT3A-mutated pre-leukemic HSPC (preLHSPC) in vivo. This was performed by assessing its influence on their engraftment capacity in immuno-deficient mice.
Primary samples were received from Princess Margaret Cancer Center, University Health Network (UHN), Canada (UHN IRB protocol 01-0573) and from Rambam Health Care Campus, Israel (IRB protocol #283-1). Clinical characteristics of each sample are presented in the Online Supplementary Table S1.
We analyzed primary AML samples with mass cytometry using a panel of metal-conjugated monoclonal antibodies targeting surface markers (Online Supplementary Table S2A) and P53 conformation-specific monoclonal antibodies that were conjugated to heavy metals: PAb1620 (for the WT con formation) and PAb240 (for the mutant conformation). The antibody staining concentrations were determined by titra tion on positive and negative control cell populations. Spe cifically, intra-nuclear antibody concentrations were calibrated using MCF 7 cells line (TP53 WT) and RXF 393 cell line (TP53R175H) (Online Supplementary Figure S1). Absence of false positive staining was validated using HL-60 cell line (TP53 null). All samples were stained and recorded at least in duplicates (except for the mobilized peripheral blood mononuclear cell [PBMC] donations, due to paucity of avail able cells). See the Online Supplementary Appendix for de tails.
All experiments were performed in accordance with Insti tutional Guidelines approved by the Weizmann Institute of Science Animal Care Committee (11790319-2) and as de scribed previously3. Primary CD3-depleted AML samples were injected to immune-deficient mice (see the Online Supplementary Appendix for additional information). Five weeks after the injection of human cells, when engraftment was established, we treated some of the mice for 2 weeks
with pCAP-250 (myr- RRHSTPHPD)14. Other mice were treated with a scrambled, control peptide. Mice were sacri ficed on day 56. We evaluated human engraftment by flow cytometry and sorted the main sub-populations for deep targeted DNA sequencing according to the mutations of the original injected pool, thus identifying their stem cell of ori gin (Figure 4A) (see the Online Supplementary Appendix).
Following mice sacrifice and bone marrows retrieval (from the injected and non-injected bones), cells from all mice of each treatment cohort were pooled together. Human cells were separated according to the expression of human CD45 (EasySep™, StemCell Technologies, Vancouver, Canada) (Fig ure 5). The lack of murine cells was validated by flow cyto metry using human-specific antibodies (Online Supplementary Table S3). Alignment of single cell RNA se quencing (scRNA-seq) data to murine genome excluded any contamination with murine cells (see see the Online Sup plementary Appendix). Viable cells (Trypan Blue negative) were divided as follows: 5x10⁶ cells from each cohort were taken for mass cytometry and 100,000 cells from each co hort were taken for scRNA-seq. 40,000 cells of CD3 depleted cells of the original, injected, sample (PBMC) were also taken for scRNA-seq alongside the engrafting cells. Mass cyto metry was performed using antibody panel shown in the On line Supplementary Tables S2B and S2C. scRNA-seq libraries were prepared using 10X Genomics technology (see the On line Supplementary Appendix).
Mass cytometry of DNMT3AR882H mouse model of clonal hematopoiesis
Following mice sacrifice, bone marrows were extracted and enriched for Lin- cells (EasySep™, StemCell Technologies, Vancouver, Canada). Mass cytometry was performed using antibody panel shown in the Online Supplemental Table S2D, using the same staining protocol. PAb1620 and PAb240 de tect both murine and human P53.
Comparisons between two groups, were performed using the two-tailed, non-paired, non-parametric Wilcoxon rank sum test with 95% confidence interval (CI) and continuity correction.
P53 conformations in DNMT3A-mutated, TP53 wild-type leukemic blasts and pre-leukemic hematopoietic stem/progenitor cells
In order to determine P53 conformations in leukemic blasts and in preL-HSPC we analyzed by mass cytometry nine
DNMT3A-mutated, TP53 WT, NPM1c human AML samples. We chose this AML subtype because it is the most common subtype representing 15% of AML clones15 and because the ability to clearly distinguish between leukemic blasts (har boring both DNMT3A and NPM1 mutations) and pre-leukemic cells (harboring only DNMT3A mutations).
All samples underwent deep sequencing to verify that they do not carry TP53 mutations even at low variant allele fre quencies (VAF). Leukemic blasts from each AML sample were gated according to the immune-phenotype that was originally reported by the clinical laboratory of the medical center where patients were diagnosed (which appears next to each sample in the Online Supplementary Table S1).
Phenotypic preL-HSPC were defined as cells that are negative for CD33, CD15, CD11b, CD19, CD79b, CD3, CD16 and CD45RA and are CD34-positive. When identified in primary AML samples, a portion of the cells with this immune-phe notype were shown to be pre-leukemic (harboring only DNMT3A mutation, without NPM1 mutation).3
We found that blasts expressed high levels of P53, most of it in its WT conformation (Figure 1A). Nonetheless, the pseudo-mutant conformation was present as well as pre viously described.12
Next, we calculated the ratio between the intensity of the two conformations of P53 in each individual cell. We termed
this ratio the “pseudo-mutant to WT conformation ratio”, PM/WT-CR. We found that, although there is wide variability with regard to the expression of the two conformations of P53, leukemic blasts express mainly the WT conformation (with a median PM/WT-CR of 0.53) while phenotypic preLHSPC express mainly the pseudo-mutant conformation of P53 (a median PM/WT-CR of 3.06) (Figure 1B). Since staining with PAb240 and PAb1620 is mutually exclusive,16,17 the sum of their intensities gives an estimate of the total P53 ex pression in each cell. PreL-HSPC with a high PM/WT-CR had higher levels of total P53 when compared with PreL-HSPC with a low PM/WT-CR (Online Supplementary Figure S2), similar to TP53-mutated cells in myelodysplastic syndromes.18
The misfolded conformation of P53, that reacts with the monoclonal antibody PAb240, can be induced by cyto kines,13 temperature19 or hypoxia.20 We therefore, studied cells that were frozen immediately after they were col lected from peripheral blood, without exposing them to culture media or cytokines. All staining procedures and sample handling were performed in a temperature of 20°C (lower than the temperature range that can cause p53 misfolding19) and not under hypoxic conditions. Since the PAb240 antibody we used, can react also with a denatured P53, we verified that our staining procedure does not

Figure 1. Mass cytometry of primary human acute myeloid leukemia samples. Single cell analysis of primary human acute myeloid leukemia (AML) samples was performed by mass cytometry. P53 conformation-specific monoclonal antibodies were used to measure the level of expression of each P53 conformation: PAb1620 for the wild-type (WT) conformation and PAb240 for the mutant (or misfolded) conformation. Sub-populations that reside in the samples were identified by a panel of monoclonal anti bodies targeting surface markers. Hematopoietic stem/progenitor cells (HSPC) were defined as having CD45RA CD33 CD19 CD79b CD15 CD16 CD11b CD3 immuno-phenotype. (A) A representative viSNE analysis of mass cytometry single cell data showing CD33 staining (left panel) in the peripheral blood of a DNMT3AR882H , NPM1c AML patient. As expected, most cells are leu kemic blasts (circled in red). The high resolution of mass cytometry allowed the identification of rare phenotypic pre-leukemic HSPC as well (circled in blue). P53 staining superimposed on the same viSNE analysis (middle and right panels) demonstrate that blasts express mainly the WT conformation of P53, while the dominant conformation in pre-leukemic cells is the pseudomutant conformation. (B) The ratio between the intensity of the pseudo-mutant conformation and that of the WT conformation of P53 was calculated for each cell of 9 AML samples. Each dot represents a single cell. n denotes the number of cells analyzed in each cell population. The dashed line represents equal intensities of both conformations (ratio of 1). In each of these cell populations there is variability with regard to the expression of the two conformations of P53. However, in the leukemic blasts (red), the dominant conformation is the WT with a median ratio of 0.53. In the pre-leukemic cells (blue) the dominant conforma tion of P53 is the pseudo-mutant, with a ratio of 3.06. Box plot centers, hinges and whiskers represent the median, first and third quartiles and 1.5 X interquartile range, respectively. Boxes are drawn with widths proportional to the square-roots of the number of observations in each group. The two-tailed, non-paired, non-parametric Wilcoxon rank sum test was used with 95% confidence interval and continuity correction. tSNE: t-distributed stochastic neighbor-embedding.
cause significant denaturation of P53 by testing it in TP53 WT cell line (Online Supplementary Figure S1). The fact that different samples and different cells within samples presented with different levels of PAb240 staining (with some being negative for this staining), attest for lack of P53 denaturation during the staining process. Other re ports, that have identified almost exclusively the pseudomutant conformation in AML blasts,12 used a less gentle intra-cellular staining protocol than us.
P53 conformations in cord blood and in DNMT3A-mutated non-pre-leukemic hematopoietic stem/progenitor cells
In order to understand whether the high expression level of the pseudo-mutant conformation of P53 is part of a more general stem cell phenotype, we used the same im mune-phenotypic criteria and analyzed CD34+-enriched cells of a healthy cord blood sample. Both conformations of P53 were detected in all subpopulations, however in contrast to preL-HSPC, cord blood HSPC expressed them to a similar extent (Online Supplementary Table S14). At the single cell level, cord blood HSPC had a significantly lower PM/WT-CR (a median PM/WT-CR of 1.22 in cord blood HSPC compared with a median PM/WT-CR of 3.06 in preL-HSPC, P<0.00001, Wil coxon rank sum test, Figure 2A).
We further analyzed two samples of mobilized PBMC do nated by individuals with DNMT3AR882H-mutated CH with high VAF of 19.7% and 34% (Online Supplementary Table S1). Both samples had no other additional mutations as assessed by our sequencing panel. Here too, we noticed variability at the single cell level, however HSPC from these non-leukemic DNMT3AR882H-mutated samples were found to have a median PM/WT-CR of 0.53, significantly lower than in preL-HSPC (P<0.00001, Wilcoxon rank sum test, Figure 2A). Figure 2B emphasizes the inter-sample and intra-sample heterogeneity. In most primary AML samples, preL-HSPC have a high PM/WT-CR.
P53 conformations in non-DNMT3A-mutated pre-leukemic hematopoietic stem/progenitor cells
We studied a TP53R248Q-mutated AML sample (#161632) without any DNMT3A mutations. R248Q substitution causes destabilization of P537 and disrupts P53’s tran scriptional activity.21,22 However, it causes only a partial misfolding of P5319 and was found to have a relatively weak reactivity with PAb240.16,21,23 As expected, most CD33+ blasts had a stronger reactivity with PAb1620 (Online Sup plementary Figure S3). These blasts have lost their WT TP53 allele (having del(17) by conventional G-band analy sis, and TP53R248Q VAF of 94%, Online Supplementary Table S1), confirming the weak reactivity of TP53R248Q with PAb240. In contrast, phenotypic preL-HSPC had a stronger reactivity with PAb240 than with PAb1620 (median PAb1620 to PAb240 ratio of 2.1, Figure 2B far right). It is conceivable that these cells have a residual WT TP53 al lele,24,25 emphasizing that their increased reactivity with PAb240 might reflect the presence of a “pseudo-mutant” P53.
P53 conformations in LSK cells of a DNMT3AR882H clonal hematopoiesis mouse model
We studied Lin Sca-1+ cKit+ cells (analogous to human HSPC) derived from a rodent model of DNMT3AR882H clonal hematopoiesis. We crossed the human DNMT3AR882H knock-in mice26 with mice carrying a Cre recombinase al lele under the regulation of Vav promotor which is ex pressed only in the hematopoietic system27 to create hematopoietic-specific human DNMT3A mutant mice (hDNMT3AR882H). C57Bl x Vav-Cre mice were used as a con trol group (Cre-control). We also used DNMT3A haplo-in sufficient mice (mDnmt3a haploinsufficiency) that model DNMT3A frameshift mutations. All mice were males. We sacrificed four male mice (one of each genotype) at 11.5 months (“wild-type” [WT]) to 22 months of age (“mDnmt3a haploinsufficiency”).
Figure 2. Mass cytometry of human hematopoietic stem/progenitor cells from leukemic and non-leukemic samples. Immuno phenotypic hematopoietic stem and progenitor cells (HSPC) from a cord blood sample and from two DNMT3AR882H-mutated mobi lized peripheral blood mononuclear cell (PBMC) samples were analyzed by mass cytometry. All cells that are CD45RA CD33 CD19 CD79b CD15 CD16 CD11b CD3 were included. The ratio between the intensity of the pseudo-mutant conformation and that of the wild-type (WT) conformation of P53 was calculated for each cell. Each dot represents a single cell. (A) The pseudomutant to WT conformation ratio was around or below 1 in non-leukemic HSPC, significantly lower than that measured in preleukemic HSPC (preL-HSPC) (n denotes their number in each sample cohort). The dashed line represents equal intensities of both conformations (ratio of 1). Box plot centers, hinges and whiskers represent the median, first and third quartiles and 1.5 X interquartile range, respectively. Boxes are drawn with widths proportional to the square-roots of the number of observations in each group. The two-tailed, non-paired, nonparametric Wilcoxon rank sum test was used with 95% confidence interval and continuity correction. (B) Because of the variability at the single cell level with regard to the expression of the two conformations of P53, data for each individual sample are presented separately. The specific DNMT3A or TP53 variant appears above each sample. From left to right: HSPC from a cord blood sample, HSPC from 2 samples of TP53-WT, DNMT3AR882H -mutated clonal hematopoiesis (all in black), HSPC from 9 TP53-WT, DNMT3A-mutated AML samples (blue), HSPC from a DNMT3A-WT, TP53R248Q mutated AML sample (light blue). In 8 of 9 preL-HSPC samples the dominant conformation of P53 is the pseudo-mutant. Although the TP53R248Q variant has low reactivity with PAb240, pre-leukemic cells of this sample demonstrated a high PAb240 to PAb1620 intensity ratio, similar to other preL-HSPC, implying the possible presence of a “pseudo-mutant” conformation of their residual TP53-WT allele (see text for details). The median and 1.5 X interquartile range are presented for each sample. The medians are drawn proportional to the square-roots of the number of observations in each cohort.
We found that although the median values of the PM/WTCR in all mouse genotypes were less than 1 (P53 is mainly in its WT conformation), hDNMT3AR882H mice had signifi cantly more LSK cells with an extremely high PM/WT-CR. 82 cells (4.9%) of hDNMT3AR882H LSK cells had a PM/WTCR greater than 10, significantly more than the 17 (0.9%) WT LSK cells with this high ratio (P<0.0001, Chi-square test of independence with Yates continuity correction, Figure 3).

All LSK cells were found to be in G0 (as assessed by combined cyclin B1 and KI-67 staining, Online Supple mentary Table S2D), even those with this extremely high PM/WT-CR.
We speculated that the high PM/WT-CR can contribute to the enhanced selective advantage of preL-HSPC10,28 and that reverting this ratio might reduce their fitness. We
chose to explore this by using patient-derived xenograft models. In these models, the human cells are injected to and engraft immuno-deficient mice. The murine environ ment exerts a selective pressure on the injected cells, ex posing different stem cells that reside in them. In about a third of mice, that are injected with PBMC donated by AML patients at the time of diagnosis, the engrafting human cells are enriched with progeny of preL-HSPC (determined by sequencing the engrafting cells).3,6 This model can be utilized also to assess the sensitivity of the engrafting cells (as reflected by their engraftment and differentiation ca pacities) to various therapeutic interventions (Figure 4A). As a model for an intervention that can target a high PM/WT-CR, we used a short peptide (myr-RRHSTPHPD, named: pCAP-250) that can shift the balance between the WT and the mutant conformations of P53 by stabilizing the WT conformation. This peptide was shown to restore the downstream transcriptional activity of P53.14
Figure 3. P53 conformations in murine LSK cells. Immunophenotypic LSK cells of a mouse model of human DNMT3AR882 clonal hematopoiesis. Samples were analyzed by mass cytometry. The ratio between the intensity of the pseudo-mutant conformation and that of the wild-type (WT) conformation of P53 was calculated for each cell. Each dot represents a single cell. n denotes the number of cells in each sample. The dashed lines at ratios 1 and 10 represent equal intensities of both conformations and high levels of the pseudo-mutant conformation, respectively. 82 cells (4.9%) of hDNMT3AR882H-mutated LSK cells had a con formation ratio greater than 10, significantly more than the 17 (0.9%) WT LSK cells with this high ratio (P<0.0001, Chi-square test of independence between genotype and number of LSK cells with a conformation ratio greater than 10, with Yates continuity correction). Comparisons between total LSK cells retrieved from the different mice were performed using a two-tailed, nonpaired, non-parametric Wilcoxon rank sum test with 95% confidence interval and continuity correction. Medians values are: WT: 0.7; Cre control: 0.61; mDnmt3a haplo-insufficient: 0.41; hDNMT3AR882H: 0.81. The median and 1.5 X interquartile range are presented for each sample. The medians are drawn proportional to the square-roots of the number of observations in each cohort.
We tested the influence of pCAP-250 on the engraftment capacity of the above-mentioned DNMT3A, NPM1 mutated AML samples (that their preL-HSPC express pseudo-mu tant P53). Most samples resulted in non-pre-leukemic human grafts (either leukemic engraftments or non-preleukemic, multi-lineage engraftments). However, one sample (sample #160005) that its preL-HSPC express mainly the pseudo-mutant conformation of P53 (Figure 2B), gave rise to a multi-lineage graft (Online Supplemen tal Figure S4) that was composed of pre-leukemic cells harboring only the pre-leukemic DNMT3A mutation (Online Supplementary Table S7). The engraftment capacity of these cells decreased significantly following treatment with pCAP-250 in three independent experiments (Figure 4B). pCAP-250 treatment did not affect the engraftment capacity of cord blood, non-preL-HSPC from an AML sample, DNMT3AR882H CH or of leukemic stem cells (Figure 4C to F, Online Supplementary Tables S8 to S10).
We wanted to explore P53 conformations and its tran scriptional activity in the engrafting pre-leukemic cells by studying them with mass cytometry and scRNA-seq, re spectively. In order to achieve this, we injected the AML sample that gave rise to a pre-leukemic graft (sample
#160005) into recipient mice, treated the mice with a single dose of pCAP-250 at 8 weeks, sacrificed the mice 12 hours later and analyzed the engrafting human cells by both methodologies (Figure 5).
We performed unbiased clustering of the mass cytometry data of engrafting cells (100,000 cells of each treatment cohort) according to their surface markers. We found that there was no qualitative difference between the two treatment cohorts: mice treated with pCAP-250 and mice treated with the control peptide engrafted with the same human sub-populations (clusters) as shown in Figure 6A. However, in accordance with the decreased engraftment observed in Figure 4B, some clusters decreased quanti tatively in the treated mice. This quantitative difference was significantly dependent on treatment cohort (P<0.000001, chi square test of independence). Performing a post hoc standardized residuals analysis (with a Bonfer roni correction for multiple comparisons) revealed that among the clusters that decreased quantitatively in treated mice, clusters 1, 3, 4, 8, 9, 14 and 19 (Figure 6B), are the source of that difference (Online Supplementary Table S15). Most cells that belong to these clusters were eliminated in the pCAP-250 treated mice. It is therefore possible that cells extracted from pCAP-250 treated mice represent resistant cells. In order to characterize cells that are sensitive to pCAP-250 treatment, we decided to

Figure 4. Xenotransplantation assays and in vivo pharmacologic treatment. (A) Schematic of the experimental setup. The pool of peripheral blood mononuclear cells (PBMC) of acute myeloid leukemia (AML) patients contains mainly blasts (red circles) .but also rare pre-leukemic hematopoietic stem and progenitor cells, preL-HSPC (blue circles). Sorting and sequencing the engrafting cells allowed us to determine whether they originate from preL-HSPC (having only a DNMT3A mutation) or from leukemic stem cells (having both DNMT3A and NPM1 mutations). This experimental model enabled us to explore the sensitivity of the different cells to P53-directed treatment. (B to F) Engraftment of the different injected samples as assessed by flow cytometry according to treatment cohort: control peptide (green) and pCAP-250 treated (peptide, red). Each dot represents a mouse and the dashed line represents the threshold for engraftment (presence of 0.1% of human cells out of all cells extracted from the bone marrow) The origin of the engrafting cells was determined by sequencing. Below each plot appear the medians of the allele frequency of DNMT3A and NPM1 mutations in the injected sample (patient) and in the engrafting cells retrieved from mice in each cohort (control peptide and peptide) attesting for their stem cell of origin. CH: clonal hematopoiesis (detailed sequencing results are presented in the Online Supplementary Tables S7 to S10). Box plot centers, hinges and whiskers represent the median, first and third quartiles and 1.5 X interquartile range, respectively. Boxes are drawn with widths proportional to the square-roots of the number of observations in each cohort. All comparisons were performed using a two-tailed, non-paired, non-parametric Wilcoxon rank sum test with 95% confidence interval and continuity correction.
examine the median intensities of surface markers and of P53 conformations in cells that belong to these clusters and that were extracted from the control peptide treated mice. These clusters showed mainly a myeloid/monocytic differ entiation pattern although some had low expression of B cell lineage markers (Online Supplementary Table S11). The ratio between the two conformations of P53 in most en grafting cells was lower than that measured in the injected HSPC and was around 1 (Figure 6C). There was no correla tion between clusters of cells that quantitatively decreased following pCAP-250 treatment and the PM/WT-CR of their cells. However, cells in the clusters that were quantitatively affected the most by pCAP-250 treatment (clusters 14 and 19, Online Supplementary Table S15) had a high PM/WT-CR (Figure 6C) and these clusters contained 90% and 79% such cells, respectively (Online Supplementary Table S11). Our scRNA-seq data validated the pre-leukemic stem cell origin of the engrafting cells: unbiased clustering that was performed for all samples together (patient PBMC and en
grafting cells) presented the monomorphic nature of the leukemic blasts (represented by only 4 clusters, none of which was found among the engrafting cells) in contrast to the 22 different clusters that represent the engrafting cells (Online Supplementary Figure S5). Additionally, so matic variant calling of the scRNA-seq data identified only the DNMT3AR882H mutation in the engrafting cells, without the NPM1c mutation.
Similar to the mass cytometry data, the scRNA-seq data revealed that engrafting cells from both treatment co horts contained the same subpopulations (clusters) and that not all clusters decreased quantitatively to a similar extent in the treated cohort. Clusters 0,2,5,13 and 20 de creased quantitatively (Online Supplementary Table S12), and this decrease from 46.4% to 29.6%, was found to be significantly dependent on treatment cohort (P<0.021) (Figure 7A).
Gene expression of these clusters was found to be en riched with genes that are related to B cell differentiation

Figure 5. P53 conformations and transcriptional activity in engrafting pre-leukemic cells. Schematic of the experimental setup for P53 conformation analyses by mass cytometry and for gene expression profiling by single cell RNA sequencing (scRNA-seq) of engrafting human cells. Acute myeloid leukemia (AML) sample #160005 that contains mainly blasts (red circles) but also rare pre-leukemic hematopoietic stem/progenitor cells (preL-HSPC) (blue circles) was injected to NSG immune-deficient mice. This sample produces pre-leukemic human grafts harboring the DNMT3A mutation without the mutation in NPM1. At 8 weeks a single dose of pCAP-250 or the control peptide (16.6 mg/kg) was administered intravenously (IV) to the recipient mice and mice were sacrificed 12 hours later. Cells retrieved from bone marrows of all mice in each treatment cohort were pooled together and murine hematopoietic cells (black circles) were depleted using human CD45 enrichment kit. Human pre-leukemic cells (blue circles) were divided between downstream analyses methodologies (as detailed in the Online Supplementary Appendix and the methods sections). tSNE: t-distributed stochastic neighbor-embedding.

A B C
Figure 6. Mass cytometry of engrafting cells. All positively stained surface markers were used for unbiased clustering (FlowSOM analysis) of the mass cytometry data of engrafting cells. WT: wild-type; HSPC: hematopoietic stem and progenitor cells. (A) All clusters. (B) Clusters with a significant quantitative decrease following treatment with pCAP-250 (Online Supplementary Table S15). (C) Ratio of the median intensities of the pseudo-mutant and WT conformations of P53 (PM/WT-CR) in engrafting cells and in the injected HSPC. Engrafting cells (from control peptide treated mice) are categorized by the clusters shown in (A). Data about injected HSPC were obtained from sample #160005 as shown in Figure 2B.

(cluster 0), to MAPK and NFkB pathways (cluster 2), and to monocyte differentiation and Interferon signaling path way (cluster 13) (similar to the mass cytometry data, On line Supplementary Table S11).
Gene expression of less affected clusters was found to be enriched with genes that are related to B-cell differenti
ation (clusters 1), to macrophage/monocyte differentiation (cluster 6), to mast cell/basophil differentiation (cluster 18) and to plasmacytoid/dendritic differentiation (cluster 21) (Online Supplementary Table S13). The similarities in expression of differentiation markers and genes between affected clusters and less-affected clusters mean that
pCAP-250 treatment did not cause a differentiation bias. Analyzing the cell cycle score of the clusters that were af fected by pCAP-250 treatment revealed that they are mainly in G1 phase (Figure 7B). This means that the treat ment was not specifically affecting proliferating cells. Cells in the clusters that decreased quantitatively follow ing treatment with pCAP-250 had a significantly reduced expression of CDKN1A (P21), relative to their TP53 ex pression level (P<0.006, Figure 7C). Apart from this reduc tion in CDKN1A expression, we did not identify any additional reduced expression of other P53-regulated genes,29 thus a pseudo-mutant P53 could have a partial P53-transcriptional dysfunction, similar to other TP53 mu tants.30 In summary, cells affected by pCAP-250 were not characterized by their differentiation or proliferation sig natures, but rather by their P53 function. We tried to understand how the cells were eliminated in the pCAP-250 treated mice. We did not find an increase in apoptosis, necroptosis (RIPK1 or RIPK3) or ferroptosis pathway genes in pCAP-250 treated samples when com pared to control samples. Nonetheless, the clusters that decreased following pCAP-250 treatment had a reduced
expression of CD44 and of GPX4 when compared with other clusters.
In order to test the sensitivity of TP53-mutant cells to pCAP-250, we injected peripheral blood mononuclear cells of the TP53R248Q-mutated AML sample described above (#161632), to immune-deficient mice and then treated them with pCAP-250 (single dose at week 8). The overall engraftment capacity of the human cells was not influenced by the treatment (Figure 8A). When we ana lyzed by flow cytometry the engrafting sub-populations, we found that most engrafting cells have a myeloid im mune-phenotype (Figure 8B, green and brown colors) similar to the injected blasts, suggesting that most of them originate in leukemic stem cells. Nevertheless, we did see small subpopulations of engrafting cells with a non-myeloid immune-phenotype, mainly in the control cohort (Figure 8B, blue colors). Although not verified by targeted sequencing, this points to engraftment of preleukemic stem cells, preferentially in the control cohort. We therefore speculated that pCAP-250 specifically elim
Figure 7. Single cell RNA sequencing of engrafting cells. (A) tSNE (t-distributed stochastic neighbor-embedding) analyses of single cell RNA sequencing (scRNA-seq) data of engrafting cells. Each dot represents a cell. Both treatment cohorts contain the same sub-populations, however, some clusters (0, 2, 5, 13 and 20 that are circled in purple) decreased quantitatively following treatment with pCAP-250. This decrease from 46.4% to 29.6%, was found to be significantly dependent on treatment cohort (P<0.021, chi square test of independence with Yates continuity correction). (B) Cell cycle score of engrafting cells from both the “control peptide” and “peptide” cohorts superimposed on the tSNE analyses shown in (A). Most cells in pCAP-250-affected clusters belong to the “control peptide” cohort. (C) tSNE analyses of scRNA-seq data of engrafting cells with the expression of TP53 (left) and of CDKN1A (P21, right). We calculated the difference between the logarithmic fold change of the expression of CDKN1A and that of TP53 in pCAP-250-affected cells (clusters 0, 2, 5, 13) and compared it to the same difference that was cal culated for less affected cells (clusters 1, 6-9, 12,1 4-19, 21-23). We found that affected cells had a significantly reduced expression of CDKN1A relative to their TP53 expression, when compared to other clusters of cells (P=0.006, Wilcoxon rank sum test).

inated these subpopulations in the treated cohort. In order to test this, we pooled together engrafting cells from all mice in each cohort (as described in the methods section) and analyzed them by mass cytometry using the antibody panel shown in the Online Supplementary Table S2C. This panel included two anti-mouse monoclonal antibodies that allowed us to “gate out” any residual murine cells. We then performed an unbiased clustering of 247,300 engraft ing cells from each treatment cohort, according to their surface markers. A significant difference that was depend ent on treatment cohort was found between the control sample and the treated sample (P<0.000001, chi square test of independence). Performing a post hoc standardized residuals analysis (with a Bonferroni correction for multiple testing) revealed that clusters 4,5,6,7,9,10,11 and 15 that quantitatively decreased in the treated mice (sensitive to pCAP-250), and clusters 1, 8, 12, 13, 14, 16, 17, 18, 19 and 20 that quantitatively increased in the treated mice (resistant to pCAP-250) are the source of that difference. While all the resistant clusters had a leukemic immune-phenotype (Figure 8C, green colors), the non-myeloid clusters (clusters 4 and 11 in the Online Supplementary Table S16, Figure 8C, purple and blue, respectively) were found to be sensitive to pCAP-250 treatment (Online Supplementary Table S16 and S17), consistent with our flow cytometry analysis (Figure 8B). Indeed, some of the sensitive clusters have a myeloid immune-phenotype (Figure 8C, green), however, these too might have a pre-leukemic origin (as shown in the Online Supplementary Table S7, peptidetreated cohort, mouse #5).

In this work, we studied P53 conformations in human cells representing several steps along AML evolutionary trajec tory. We focused on the most common pre-leukemic mu tation, in the DNMT3A gene1,2 and therefore our conclusions are limited to DNMT3A-mutated pre-leukemic cells. We ob served that DNMT3A-mutated preL-HSPC had significantly higher PM/WT-CR in comparison to AML blasts, to normal cord blood and to HSPC of DNMT3A-mutated CH (Figures 1B and 2A). Next, we demonstrated that preL-HSPC carrying DNMT3A mutations were sensitive to treatment with a small peptide targeting the dynamic equilibrium between P53 conformations (pCAP-250)14 (Figure 4B). Single cell RNA-sequencing analyses of treated cells suggested that human preL-HSPC that are sensitive to pCAP-250 had a re duced expression of P21, the major canonical downstream target of P53. Altogether, these findings suggest that the dominant conformation of P53 in preL-HSPC carrying DNMT3A mutations is the pseudo-mutant conformation and at least some of them, that exhibit dysfunctional P53 transcriptional activity, could be sensitive to perturbations in the balance between P53 conformations.
While our study provides evidence for a dominant pseudomutant P53 conformation in DNMT3A-mutated preL-HSPC, and to some degree dysfunctional P53 transcriptional ac tivity, it remains unclear whether these phenotypes func tionally contribute to chemo-resistance and increased fitness (the hallmarks of DNMT3A-mutated preL-HSPC3-5,3136). In order to answer this question, we used patient-de
Figure 8. pCAP-250 treatment of a TP53R248Q acute myeloid leukemia patient-derived xenograft model. NSG-SGM3 mice were injected with TP53R248Q acute myeloid leukemia (AML) (#161632) sample and treated by a single dose of pCAP-250 8 weeks later. (A) Engraft ment of human cells (percentages of human CD45+ cells as assessed by flow cytometry) according to treatment cohort: control peptide (green) and pCAP-250-treated (peptide, red). The overall engraftment was not affected by pCAP-250 treatment. Each dot represents a mouse and the dashed line represents the threshold for engraftment (presence of 0.1% of human cells out of all cells extracted from the bone marrow). Box plot centers, hinges and whiskers represent the median, first and third quartiles and 1.5 X in terquartile range, respectively. Boxes are drawn with widths proportional to the square-roots of the number of observations in each cohort. All comparisons were performed using a two-tailed, non-paired, non-parametric Wilcoxon rank sum test with 95% confidence interval and continuity correction. (B) Flow cytometry analyses of the engrafting sub-populations in the control (upper panel) and treated (lower panel) cohorts. Injected peripheral blood mononuclear cells (PBMC) appear in the right bars (Patient PB). Only human CD45+ cells that were extracted from the right femurs of the mice are presented. PB: peripheral blood. Most engrafting cells are myeloid (green and brown colors), similar to the injected blasts (right bars), reflecting their leukemic origin. Some non-myeloid subpopulations are seen as well (blue colors), reflecting their differentiation capacity and their non-leukemic origin. The control cohort is enriched with these, non-myeloid, sub-populations when compared with the treated cohort. (C) Immunophenotype of engrafting clusters following FlowSOM analysis (unbiased clustering) of the mass cytometry data of the engrafting human cells. Clusters are grouped according to their sensitivity to pCAP-250 treatment: “resistant” clusters are clusters with a quantitative increase following pCAP-250 treatment and “sensitive” clusters are clusters with a quantitative decrease following pCAP-250 treatment. The number of clusters in each group is presented. All 10 resistant clusters have a leukemic immunophenotype (green colors, similar to the leu kemic blasts). Of note, one of the resistant clusters (cluster 8 in the Online Supplementary Table S17) has a CD33+CD38+CD34+ im munophenotype (light green). It probably represents leukemic cells because among the injected blasts a small sub-population with these markers was identified (panel B, right bars). The non-myeloid clusters (clusters 4 and 11 in the Online Supplementary Table S16, purple and blue, respectively) are present only among the sensitive clusters, in line with our flow cytometry analyses (panel B). Six of 8 sensitive clusters have a myeloid immunophenotype (green), however, it is possible that they have a pre-leukemic origin (as in the Online Supplementary Table S7, peptide-treated cohort, mouse #5).
rived xenograft experiments and treatment with pCAP250.
These experiments revealed that treatment with pCAP250 diminished the engraftment capacity of preL-HSPC (Figure 4B) reflecting a reduction in self-renewal capacity at the stem or progenitor cell level. Most of the sensitive cells were eliminated, and therefore could not be studied directly. In order to overcome this, we performed unbi ased clustering analyses for both the pCAP-250-treated and the control peptide-treated cells together. By doing so, we were able to characterize the sensitive cells using data from the control-peptide cohort. We identified clusters of cells that were influenced by pCAP-250 treat ment (clusters 14 and 19, Figure 6B and C; Online Supple mentary Table S15) and demonstrated that the vast majority of their cells (80-90%) expressed P53 predomi nantly in its pseudo-mutant conformation. Engrafting cells that were selectively eliminated by pCAP-250 treat ment had a high ratio between their P53 expression and their P21 expression levels (Figure 7A and C). Since P21 is the major canonical TP53-regulated gene, these cells had a partially dysfunctional P53 canonical pathway and as mentioned above, some of them had a high PM/WT-CR. These results can be explained by additional factors in fluencing the conformation equilibrium of P53 or by other mechanisms by which pCAP-250 eliminates cells, however they could also point to possible functional consequences of a high PM/WT-CR of P53 that should be further ex plored in the future.
Non-R882 DNMT3A variants are more prevalent in CH than in AML,37 and when such clones transform to AML, they are accompanied by a lower number of cooperating mu tations.38 This implies that single mutant clones carrying
non-R882 DNMT3A mutations have enhanced self-renewal when compared with single mutant clones carrying DNMT3AR882 mutations (that undergo rapid clonal expan sion after they acquire additional mutations). Figure 2B demonstrates that DNMT3AR882-mutated cells might have a lower PM/WT-CR when compared with cells harboring non-R882 variants of DNMT3A, and although our study is not statistically powered to draw any definite conclusions, this does support a possible correlation between a high PM/WT-CR and increased self-renewal capacity. In order to gain more support to our claim that increased PM/WT-CR and dysfunctional P53 activity are associated with the increased fitness and progression of DNMT3A mutated preL-HSPC we treated with pCAP-250 both cord blood samples and HSPC from healthy individuals carrying DNMT3A mutations (CH). We could not identify reduced engraftment after treatment with pCAP-250. Furthermore, the PM/WT-CR of both CH and cord blood derived HSPC was lower than preL-HSPC. In this regard it is important to stress that preL-HSPC derived from AML patients might be phenotypically different from HSPC carrying DNMT3A from the CH stage. While we know that individuals with large clones (with a variant allele frequency of more than 10%, reflecting their enhanced fitness) have high (50%) chances to evolve to AML,2 we do not understand the evol utionary trajectory (epigenetically due to accumulation of methylation changes and phenotypically) of the HSPC that eventually transform to AML. Altogether, we were able to demonstrate that P53-directed treatment, that is capable of stabilizing the WT conforma tion of P53,14 specifically targeted DNMT3A-mutated human preL-HSPC and possibly also TP53-mutated preL-HSPC. This was demonstrated in two samples, thus we cannot
generalize our conclusions, but it suggests that at least some of the fitness advantage of preL-HSPC is correlated with the presence of pseudo-mutant P53. Despite this limitation it is clear from our study that DNMT3A-mutated preL-HSPC have a high PM/WT-CR. Our hDNMT3AR882H mouse model data emphasize that a pre-leu kemic mutation (DNMT3AR882H in this case) predisposes P53 in a subpopulation of HSPC to acquire a pseudo-mutant conformation. Similar to our observations of a high PM/WTCR among cells that belong to an early developmental stage of malignancy, high levels of pseudo-mutant P53 were reported in other pre-malignant states,39 and P53 dysfunction was detected in DNMT3A-mutated pre-malig nant thymocytes.40 Future studies might shed light on the molecular mechanisms that underlie this phenotype. It was recently shown that DNMT3A-mutated HSPC have enhanced self-renewal under inflammatory conditions.41 Previous studies have demonstrated that cytokines,13 and inflammation39 can modulate P53’s folding and that a mis folded P53 characterizes leukemic blasts with enhanced self-renewal.28 An inflammatory environment, as present in the serum of AML patients,42 might modify P53 conforma tions and lead to a higher PM/WT-CR. However, we found that leukemic blasts that share the same cytokine-rich en vironment have the lowest levels of pseudo-mutant P53. It was previously suggested that mutant conformation of P53 is correlated with cell proliferation.43 Our data (pro duced by using methodologies with a higher resolution and including more cells) do not support this claim (Figure 7B, DNMT3AR882H murine LSK cells with a high PM/WT-CR being in G0). Other factors besides inflammation or the muta tional profile of the clone (as implied by our findings in TP53R248Q-mutated preL-HSPC) could also induce a pseudomutant P53. For example: the cellular proteomic composi tion,11 P53’s interactions with other proteins,44,45 zinc chelation,46 oxidative stress,47 P53’s ubiquitination (PAb240 recognizes an MDM2-bound P53)48 the silencing of Hippo tumor suppressor pathway49 were all implicated in the conformational switch of P53. It is possible that inter actions between the environment and the pre-leukemic clone are responsible for the higher PM/WT-CR observed in DNMT3A-mutated preL-HSPC, and future studies can ex pose such an etiology.
In summary, our observations in human preL-HSPC high light a unique phenotype that characterizes part of the preleukemic clone. Interestingly, DNMT3A-mutated primary AML do not present with a classical TP53-mutated pheno type (namely, a complex karyotype) suggesting that the pseudo-mutant P53 is not equivalent to a mutated P53.
Realizing that the enhanced self-renewal of pre-leukemic cells could be correlated with their P53 protein folding and not only with their mutational profile calls for studying the physiological and pathological mechanisms that induce this conformational change (whether cell-intrinsic or micro-en vironmental factors). It remains unclear whether this phe nomenon can be generalized to other (non-DNMT3A) pre-leukemic mutations or other pre-malignant conditions and whether it could be exploited for targeting these premalignant clones. However, it can potentially open new av enues for both AML prediction and for its prevention.
PT, VR and MO are founders of Quintrigen.
Contributions
VR, MO and LS initiated the project; AT, NK and LS designed the research, and wrote the paper with input from other authors; AT, NK, HA and YM performed the research; AT, YB, DL and TMS analyzed the data; MDM contributed clinical samples; PT contributed reagents and cell lines.
The authors would like to thank Andrea Arruda for providing the clinical information of the primary samples and to Merav Kedmi from the Department of Life Sciences core facilities at the Weizmann Institute of Science for technical guidance.
This research was supported by the EU horizon 2020 grant project MAMLE ID: 714731, LLS and rising tide foundation grant ID: RTF6005-19, ISF-NSFC 2427/18, ISF-IPMP-Israel Precision Medicine Program 3165/19, BIRAX 713023, the Er nest and Bonnie Beutler Research Program of Excellence in Genomic Medicine, awarded to LIS. LIS is an incumbent of the Ruth and Louis Leland career development chair. NK is an incumbent of the Applebaum Foundation Research Fellow Chair. This research was also supported by the Sagol Insti tute for Longevity Research, the Barry and Eleanore Reznik Family Cancer Research Fund, Steven B. Rubenstein Re search Fund for Leukemia and Other Blood Disorders, the Rising Tide Foundation and the Applebaum Foundation.
The dataset generated and analyzed during the current study are available in the NCBI Sequence Read Archive (SRA; https://www.ncbi.nlm.nih.gov/sra/) under access numbers. Code is available on GitHub under https://github.com/ShlushLab
1. Jaiswal S, Fontanillas P, Flannick J, et al. Age-related clonal hematopoiesis associated with adverse outcomes. N Engl J Med. 2014;371(26):2488-2498.
2. Abelson S, Collord G, Ng SWK, et al. Prediction of acute myeloid leukaemia risk in healthy individuals. Nature. 2018;559(7714):400-404.
3. Shlush LI, Zandi S, Mitchell A, et al. Identification of preleukaemic haematopoietic stem cells in acute leukaemia. Nature. 2014;506(7488):328-333.
4. Guryanova OA, Shank K, Spitzer B, et al. DNMT3A mutations promote anthracycline resistance in acute myeloid leukemia via impaired nucleosome remodeling. Nat Med. 2016;22(12):1488-1495.
5. Jongen-Lavrencic M, Grob T, Hanekamp D, et al. Molecular minimal residual disease in acute myeloid leukemia. N Engl J Med. 2018;378(13):1189-1199.
6. Lal R, Lind K, Heitzer E, et al. Somatic TP53 mutations characterize preleukemic stem cells in acute myeloid leukemia. Blood. 2017;129(18):2587-2591.
7. Bullock AN, Henckel J, Dedecker BS, et al. Thermodynamic stability of wild-type and mutant p53 core domain. Proc Natl Acad Sci USA. 1997;94(26):14338-14342.
8. Gannon JV, Greaves R, Iggo R, et al. Activating mutations in p53 produce a common conformational effect. A monoclonal antibody specific for the mutant form. EMBO J. 1990;9(5):1595-1602.
9. Boettcher S, Miller PG, Sharma R, et al. A dominant-negative effect drives selection of TP53 missense mutations in myeloid malignancies. Science. 2019;365(6453):599-604.
10. Chen S, Wang Q, Yu H, et al. Mutant p53 drives clonal hematopoiesis through modulating epigenetic pathway. Nat Commun. 2019;10(1):5649.
11. Trinidad AG, Muller PAJ, Cuellar J, et al. Interaction of p53 with the CCT complex promotes protein folding and wild-type p53 activity. Mol Cell. 2013;50(6):805-817.
12. Zheng A, Castren K, Säily M, et al. p53 status of newly established acute myeloid leukaemia cell lines. Br J Cancer. 1999;79(3/4):407-415.
13. Zhang W, Deisseroth AB. Conformational change of p53 protein in growth factor-stimulated human myelogenous leukemia cells. Leuk Lymphoma. 1994;14(3-4):251-255.
14. Tal P, Eizenberger S, Cohen E, et al. Cancer therapeutic approach based on conformational stabilization of mutant P53 protein by small peptides. Oncotarget. 2016;7(11):11817-11837.
15. Papaemmanuil E, Gerstung M, Bullinger L, et al. Genomic classification and prognosis in acute myeloid leukemia. N Engl J Med. 2016;374(9):2209-2221.
16. Chen S, Wu JL, Liang Y, et al. Arsenic trioxide rescues structural p53 mutations through a cryptic allosteric site. Cancer Cell. 2021;39(2):225-239.
17. Milner J. Flexibility: the key to p53 function? Trends Biochem Sci. 1995;20(2):49-51.
18. Saft L, Karimi M, Ghaderi M, et al. p53 protein expression independently predicts outcome in patients with lower-risk myelodysplastic syndromes with del(5q). Haematologica. 2014;99(6):1041-1049.
19. Bullock AN, Henckel J, Fersht AR. Quantitative analysis of residual folding and DNA binding in mutant p53 core domain: definition of mutant states for rescue in cancer therapy. Oncogene. 2000;19(10):1245-1256.
20. Gogna R, Madan E, Kuppusamy P, Pati U. Chaperoning of mutant
p53 protein by wild-type p53 protein causes hypoxic tumor regression. J Biol Chem. 2012;287(4):2907-2914.
21. Ory K, Legros Y, Auguin C, Soussi T. Analysis of the most representative tumour-derived p53 mutants reveals that changes in protein conformation are not correlated with loss of transactivation or inhibition of cell proliferation. EMBO J. 1994;13(15):3496-3504.
22. Kotler E, Shani O, Goldfeld G, et al. A systematic p53 mutation library links differential functional impact to cancer mutation pattern and evolutionary conservation. Mol Cell. 2018;71(1):178-190.
23. Rodrigues NR, Rowan A, Smith ME, et al. p53 mutations in colorectal cancer. Proc Natl Acad Sci U S A. 1990;87(19):7555-7559.
24. Wong TN, Ramsingh G, Young AL, et al. Role of TP53 mutations in the origin and evolution of therapy-related acute myeloid leukaemia. Nature. 2015;518(7540):552-555.
25. Bernard E, Nannya Y, Hasserjian RP, et al. Implications of TP53 allelic state for genome stability, clinical presentation and outcomes in myelodysplastic syndromes. Nat Med. 2020;26(10):1549-1556.
26. Scheller M, Ludwig AK, Göllner S, et al. Hotspot DNMT3A mutations in clonal hematopoiesis and acute myeloid leukemia sensitize cells to azacytidine via viral mimicry response. Nat Cancer. 2021;2:527-544.
27. Joseph C, Quach JM, Walkley CR, Lane SW, Lo Celso C, Purton LE. Deciphering hematopoietic stem cells in their niches: a critical appraisal of genetic models, lineage tracing, and imaging strategies. Cell Stem Cell. 2013;13(5):520-533.
28. Zhu YM, Bradbury D, Russell N. Expression of different conformations of p53 in the blast cells of acute myeloblastic leukaemia is related to in vitro growth characteristics. Br J Cancer. 1993;68(5):851-855.
29. Andrysik Z, Galbraith MD, Guarnieri AL, et al. Identification of a core TP53 transcriptional program with highly distributed tumor suppressive activity. Genome Res. 2017;27(10):1645-1657.
30. Van Nguyen T, Puebla-Osorio N, Pang H, Dujka ME, Zhu C. DNA damage-induced cellular senescence is sufficient to suppress tumorigenesis: a mouse model. J Exp Med. 2007;204(6):1453-1461.
31. Cole CB, Russler-Germain DA, Ketkar S, et al. Haploinsufficiency for DNA methyltransferase 3A predisposes hematopoietic cells to myeloid malignancies. J Clin Invest. 2017;127(10):3657-3674.
32. Lindsley RC, Mar BG, Mazzola E, et al. Acute myeloid leukemia ontogeny is defined by distinct somatic mutations. Blood. 2015;125(9):1367-1376.
33. Wong TN, Miller CA, Klco JM, et al. Rapid expansion of preexisting nonleukemic hematopoietic clones frequently follows induction therapy for de novo AML. Blood. 2016;127(7):893-897.
34. Höllein A, Meggendorfer M, Dicker F, et al. NPM1 mutated AML can relapse with wild type NPM1: persistent clonal hematopoiesis can drive relapse. Blood Adv. 2018;2(22):3118-3125.
35. Krönke J, Bullinger L, Teleanu V, et al. Clonal evolution in relapsed NPM1-mutated acute myeloid leukemia. Blood. 2013;122(1):100-108.
36. Chen J, Matatall KA, Feng X, et al. Dnmt3a-null hematopoietic stem and progenitor cells expand after busulfan treatment. Exp Hematol. 2020;91:39-45.
37. Buscarlet M, Provost S, Feroz Zada Y, et al. DNMT3A and TET2
dominate clonal hematopoiesis, demonstrate benign phenotypes and different genetic predisposition. Blood. 2017;130(6):753-762.
38. Miles LA, Bowman RL, Merlinsky TR, et al. Single-cell mutation analysis of clonal evolution in myeloid malignancies. Nature. 2020;587(7834):477-482.
39. Kodama M, Murakami K, Okimoto T, Sato R, Watanabe K, Fujioka T. Expression of mutant type-p53 products in H pyloriassociated chronic gastritis. World J Gastroenterol. 2007;13(10):1541-1546.
40. Haney SL, Upchurch GM, Opavska J, et al. Dnmt3a Is a Haploinsufficient Tumor Suppressor in CD8+ Peripheral T Cell Lymphoma. PLoS Genet. 2016;12(9):e1006334.
41. Liao M, Chen R, Yang Y, et al. Aging-elevated inflammation promotes DNMT3A R878H-driven clonal hematopoiesis. Acta Pharm Sin B. 2022;12:678-691.
42. Sanchez-Correa B, Bergua JM, Campos C, et al. Cytokine profiles in acute myeloid leukemia patients at diagnosis: Survival is inversely correlated with IL-6 and directly correlated with IL-10 levels. Cytokine. 2013;61(3):885-891.
43. Bi S, Lanza F, Goldman JM. The Involvement of "tumor suppressor" p53 in normal and chronic myelogenous leukemia
hemopoiesis. Cancer Res.1994;54(2):582-586.
44. Hainaut P, Milner J. Interaction of heat-shock protein 70 with p53 translated in vitro: evidence for interaction with dimeric p53 and for a role in the regulation of p53 conformation. EMBO J. 1992;11(10):3513-3520.
45. Rivlin N, Katz S, Doody M, et al. Rescue of embryonic stem cells from cellular transformation by proteomic stabilization of mutant p53 and conversion into WT conformation. Proc Natl Acad Sci USA. 2014;111(19):7006-7011.
46. Hainaut P, Milner J. A structural role for metal ions in the "wildtype" conformation of the tumor suppressor protein p53. Cancer Res. 1993;53(8):1739-1742.
47. Hainaut P, Milner J. Redox modulation of p53 conformation and sequence-specific DNA binding in vitro. Cancer Res. 1993;53(19):4469-4473.
48. Sasaki M, Nie L, Maki CG. MDM2 binding induces a conformational change in p53 that is opposed by heat-shock protein 90 and precedes p53 proteasomal degradation. J Biol Chem. 2007;282(19):14626-14634.
49. Furth N, Bossel Ben-Moshe N, Pozniak Y, et al. Down-regulation of LATS kinases alters p53 to promote cell migration. Genes Dev. 2015;29(22):2325-2330.
Rosa Paolillo,1,2 Mathias Boulanger,1,2 Pierre Gâtel,1,2 Ludovic Gabellier,1,2,3 Marion De Toledo,1,2 Denis Tempé,1,2 Rawan Hallal,1,2 Dana Akl,1,2 Jérôme Moreaux,4 Hayeon Baik,1,2 Elise Gueret,5 Christian Recher,6,7 Jean-Emmanuel Sarry,7 Guillaume Cartron,3 Marc Piechaczyk1,2 and Guillaume Bossis1,2
1IGMM, Univ Montpellier, CNRS, Montpellier; 2Equipe labellisée Ligue Contre le Cancer, Paris; 3Département d’Hématologie Clinique, CHU de Montpellier, Montpellier; 4IGH, Univ Montpellier, CNRS, Montpellier; 5MGX, Univ Montpellier, CNRS, INSERM, Montpellier; 6Service d’Hématologie, CHU de Toulouse, Toulouse and 7CRCT, University of Toulouse, INSERM, CNRS, Toulouse, France
Correspondence: G. Bossis
27, 2021.
Resistance to chemotherapeutic drugs is a major cause of treatment failure in acute myeloid leukemias (AML). To better characterize the mechanisms of chemoresistance, we first identified genes whose expression is dysregulated in AML cells resistant to daunorubicin or cytarabine, the main drugs used for induction therapy. The genes found to be activated are mostly linked to immune signaling and inflammation. Among them, we identified a strong upregulation of the NOX2 NAPDH oxidase subunit genes (CYBB, CYBA, NCF1, NCF2, NCF4 and RAC2). The ensuing increase in NADPH oxidase expression and production of reactive oxygen species, which is particularly strong in daunorubicin-resistant cells, participates in the acquisition and/or maintenance of resistance to daunorubicin. Gp91phox (CYBB-encoded Nox2 catalytic subunit), was found to be more expressed and active in leukemic cells from patients with the French-American-British (FAB) M4/M5 subtypes of AML than in those from patients with the FAB M0-M2 ones. Moreover, its expression was increased at the surface of patients’ chemotherapy-resistant AML cells. Finally, using a gene expression based score we demonstrated that high expression of NOX2 subunit genes is a marker of adverse prognosis in AML patients. The prognostic NOX score we defined is independent of the cytogenetic-based risk classification, FAB subtype, FLT3/NPM1 mutational status and age.
Acute myeloid leukemias (AML) are a heterogeneous group of hematologic malignancies resulting from the transformation of hematopoietic stem- or progenitor cells. Prognosis is poor, in particular for old patients (>60 years).1 For fit patients, the standard treatment generally relies on intensive chemotherapy combining 3 days of an anthracycline (daunorubicin [DNR] or idarubicin) and 7 days of cytarabine (Ara-C) (the “3+7” regimen)2. Resistance to chemotherapy remains the main cause of relapse and death. However, the mechanisms responsible for the acquisition and maintenance of chemoresistance are not fully elucidated. Those described include changes in drug uptake/efflux,3 modulation of the pro-drug activa tion process,4,5 greater resistance to apoptosis,6 enhanced DNA repair abilities7 and modulation of energy and redox
metabolism.8,9 A better characterization of the pathways dysregulated in chemoresistant AML would be instrumen tal to find new therapeutic targets to overcome chemo resistance. This could also provide new biomarkers allowing improvement of AML risk stratification, which is currently mostly based on the number and nature of the cytogenetic abnormalities.2 Such prognostic biomarkers might help clinicians in their therapeutic decisions. This is all the more important considering that new therapies, such as those targeting mutated FLT3 and IDH1/2 or BCL2, are emerging as promising alternatives to standard chemotherapies.10 Here, we have addressed the mechanisms underlying AML resistance through the identification of genes whose ex pression is dysregulated in AML cells resistant to DNR or Ara-C. We found that chemoresistant AML cells mostly activate genes related to the inflammatory response. In
particular, we identified strong upregulation of the different subunits of the NADPH oxidase NOX2. NADPH oxidases constitute a seven-member family of multi-subunit oxi dases, whose sole function is the production of reactive oxygen species (ROS).11 NOX2 is the main NOX isoform ex pressed in myeloid cells and was found to be over expressed in AML.12 In line with their overexpression, we found a large increase in NOX-derived ROS production in chemoresistant AML cells, particularly in those resistant to DNR. This activation of NOX2 and the subsequent increase in ROS production participate in the acquisition/mainten ance of the resistant phenotype. In addition, we found that NOX2 expression increases at the surface of chemother apy-resistant AML blasts. Finally, we provide evidence that NOX2 is a marker of both chemoresistance and adverse prognosis in AML patients.
Additional details of the methods can be found in the On line Supplementary Material.
Bone marrow aspirates were collected at diagnosis or after induction chemotherapy (15 to 45 days after the be ginning of the chemotherapeutic regimen comprising a combination of DNR and Ara-C). Written informed consent to participation in the study was obtained from patients after approval of the protocol by the institutional “Sud Méditerranée 1” Ethical Committee (ref-2013-A00260-45; HemoDiag collection). Immediately after collection, leu kocytes were purified by density-based centrifugation using Histopaque 1077 (Sigma Aldrich) and submitted to flow cytometry analysis. The clinical characteristics of the patients are provided in Online Supplementary Table S3 When indicated, cells were sorted after CD45/SSC gating13 with a CD45-Pacific-Blue antibody (Beckman Coulter) and CD34-PerCP-Vio700 (Miltenyi Biotec) using an Aria IIU cell sorter (Becton Dickinson).
Cells were washed in phosphate-buffered saline contain ing 2% fetal bovine serum and incubated at 4°C for 30 min in the presence of FITC-conjugated gp91phox antibodies (D162-4; MBL), then washed and analyzed using an LSR Fortessa flow cytometer (Becton Dickinson). For the pa tients’ samples, leukemic cells were identified using CD45/SSC gating13 (see Online Supplementary Figure S6 for an example of gating). The median fluorescence inten sities for gp91phox on the red blood cells present in the samples (negative control) were subtracted from the mean fluorescence intensities for gp91phox on the leukemic cells.
Total RNA was purifi ed using the GenElute Mammalian Total RNA kit (Sigma-Aldrich), treated with DNase I (4 U, New England Biolabs) and RNasin (2.5 U, Promega) and repurified. RNA quality was assessed using a BioAnalyzer Nano 6000 chip (Agilent). Three independent experiments were performed for each cell line. Libraries were prepared using a TruSeq® Stranded mRNA Sample Preparation kit (Illumina). Libraries were sequenced using an Illumina Hiseq 2500 sequencer as single-end 125 base reads. Image analysis and base calling were performed using HiSeq Control Software, real-time analysis and bcl2fastq. The RNA-sequencing data are available on the Gene Ex pression Omnibus repository under accession number GSE193094
Generation of a prognostic score based on the expression of NOX2 genes
Gene expression data from three independent cohorts of adult patients diagnosed with AML were used.14–16 Patients without available survival data, with a diagnosis of mye lodysplastic syndrome, or not treated with conventional chemotherapy were excluded. The first cohort (the Ver haak cohort)15 consisted of 504 patients. The second (the Metzeler cohort)16 comprised 242 patients with a normal karyotype (CN-AML). The third cohort (from The Cancer Gene Atlas [TCGA])14 included 148 patients. Gene Ex pression Omnibus accession numbers are GSE6891, GSE12417 and GSE68833. FLT3/NPM1 statuses for the Met zeler cohort of patients were kindly provided by Metzeler et al. 16 Because data normalization was different, ex pression levels were normalized using the standard nor mal cumulative distribution (X’ = (X-μ)/σ) for each gene. In the first cohort, cutpoints were determined for the six genes of interest (CYBA , CYBB, NCF1, NCF2, NCF4, and RAC2) using MaxStat analysis, therefore defining β coef ficients. The first cohort was then randomly divided into two sub-cohorts of 252 patients each (training and test sets). As previously described,17–20 we created a risk score based on the levels of expression of all NOX2 constituent genes in the training set. It was defined for each patient as the sum of the β coefficients for all these genes weighted by +1 or -1 according to whether the patient’s sample signal was above or below/equal to the probeset MaxStat value. Thus, overexpression of genes associated with a poor prognosis increased the NOX score while overexpression of those associated with a good prognosis decreased it. Patients from the training cohort were ranked according to increased NOX score and, for a given score value Y, the difference in survival of patients with a NOX score ≤Y or >Y was computed using MaxStat. The NOX score was then individually computed for patients in the test set, using the cutoff value determined in the training
cohort. Finally, we transposed our model in the validation cohorts (Metzeler and TCGA cohorts), using both cut points defined for each probeset and the cutoff score de termined in the training set. Survival analyses were assessed using the Kaplan-Meier method and survival curves were compared using the log-rank test. Univariate and multivariate analyses were performed using the Cox proportional hazard model.
Chemoresistant acute myeloid leukemia cells activate inflammation-related transcriptional programs
To study AML chemoresistance, we performed RNA-se quencing in the AML model cell line HL-60, using parental cells and DNR-resistant (DNR-R) or Ara-C-resistant (ARAR) cell populations.21 We identified 989 differentially ex pressed genes between drug-resistant and parental HL-60 cells (Figure 1A and Online Supplementary Table S1). Some were upregulated in resistant cells (452 for DNR-R and 283 for ARA-R) and others were downregulated (312 for DNR-R and 146 for ARA-R). One hundred thirty-two genes were commonly upregulated and 38 downregulated in both types of resistant cells compared to parental cells (Figure 1A). In general, the most deregulated genes showed the same trend of up- or down-regulated ex
pression in both DNR-R and ARA-R cells (Figure 1B, C). However, many genes were preferentially modulated upon acquisition of resistance to one of the two drugs (594/764 for DNR-R and 259/429 for ARA-R) (Figure 1A and Online Supplementary Figure S1A).

Ontological analysis of the genes upregulated in both ARA-R and DNR-R cells showed a strong enrichment for immune signaling and inflammation (Figure 1D). Enrich ment of a few pathways involved in the regulation of tran scription was found for the genes downregulated in DNR-R cells, and no enrichment for specific pathways was found for the genes downregulated in ARA-R cells (Online Supplementary Table S2). Gene set enrichment analysis (GSEA) further showed enrichment of an inflammatory signature for the genes upregulated in resistant versus parental HL-60 cells (Figure 1E). This signature included various cytokines and chemokines, which are upregulated in both types of resistant cells, with, however, stronger induction in DNR-R cells (Online Supplementary Figure S1B).
We then wondered if the inflammatory signature could also be enriched in patients relapsing after chemotherapy. We thus used publicly available transcriptomic data ob tained from nine patients at diagnosis and relapse.22 GSEA revealed that the inflammatory signature was enriched at relapse in the three patients with the French-AmericanBritish (FAB) M2 subtype of leukemia (Figure 1F), but not
Figure 1. Transcriptional reprogramming upon acquisition of chemoresistance by HL-60 acute myeloid leukemia cells. RNA-se quencing was performed on mRNA purified in three independent experiments conducted with HL-60 cells and their derived cy tarabine-resistant (ARA-R) and daunorubicin-resistant (DNR-R) populations. (A) Venn diagram for upregulated (>2 fold, false decision rate [FDR] <0.05) and downregulated (>2 fold, FDR <0.05) genes in ARA-R and DNR-R cells compared to parental HL60 cells. (B) Volcano plot for differentially expressed genes (DEG) between DNR-R and HL-60 cells. Blue dots correspond to the DEG in DNR-R but not in ARA-R cells, red dots to DEG in DNR-R cells that are upregulated in ARA-R cells and green dots to DEG that are downregulated in ARA-R cells. (C) Volcano plot for DEG between ARA-R and HL-60 cells. Blue dots correspond to the DEG in ARA-R but not in DNR-R cells, yellow dots to DEG in ARA-R cells that are upregulated in DNR-R cells and purple dots to DEG in ARA-R cells that are downregulated in DNR-R cells. (D) Gene ontology analysis of genes upregulated in both DNR-R and ARA-R cells compared to parental HL-60 cells. (E) Gene set enrichment analysis (GSEA) was performed using RNA sequencing data from ARA-R, DNR-R and parental HL-60 cells. The enrichment for the “inflammatory response” signature (175 genes) is shown. The normalized enrichment score (NES), nominal P-value and FDR are presented. (F) The inflammatory signature (175 genes) identified in (E) was used in GSEA with RNA-sequencing data from three patients from the FAB M2 subtype obtained from a publicly available cohort.22

in those from the M1 and M4 subtypes ( Online Supple mentary Figure S2A, B). Accordingly, a signature containing all genes upregulated in both ARA-R and DNR-R HL-60 cells was found to be enriched at relapse in M2 patients, but not in M1 and M4 patients (Online Supplementary Fig ure S2C), suggesting that the mechanisms underlying chemoresistance differ depending on the degree of matu ration of the leukemic clone. Finally, the genes upregu lated specifically in DNR-R cells were also enriched in genes involved in inflammation while those enriched only in ARA-R cells were not enriched for any specific pathway (Online Supplementary Table S2). Thus, our data suggest that AML resistance to chemotherapies, in particular DNR, can be associated with transcriptional reprogramming in volving the induction of an inflammatory response.
Resistance to daunorubicin is associated with strong overexpression and activation of the NAPDH oxidase NOX2
At the top of the list of genes upregulated in the inflam matory response signature of resistant cells, in particular
those resistant to DNR, we identified CYBB (Online Sup plementary Figure S1B). This gene encodes the gp91phox protein, the catalytic subunit of NOX2, the NADPH oxidase (NOX) family member principally expressed in the hema topoietic system and in AML.23 Two of the NOX2 subunits, gp91phox and p22phox, are associated with the plasma mem brane (Figure 2A). Upon activation, the cytosolic subunits (p67phox, p47phox and p40phox) and the small GTPase Rac2 are recruited to the membrane and activate the oxidase.24 This leads to the production of extracellular superoxides, which can freely diffuse across the plasma membrane. Further pointing to a link between NOX2 and DNR resis tance, a NADPH oxidase signature was found to be en riched in DNR-R cells compared to parental cells (Online Supplementary Figure S2D). Indeed, although CYBB was upregulated in both ARA-R and DNR-R cells, the other NOX2 subunits were specifically upregulated in DNR-R as compared to parental HL-60 cells (Figure 2B). Quantitative reverse transcriptase polymerase chain reaction (RTqPCR) analysis confirmed that CYBB is strongly upregu lated in DNR-R cells and, to a lesser extent, in ARA-R
cells, as compared to parental HL-60 cells (Figure 2C). The NCF2 gene (encoding p67phox) was also overexpressed in DNR-R but not in ARA-R cells (Figure 2C). To assess whether higher gene expression translates into higher
NADPH oxidase activity, we measured extracellularly pro duced superoxides ( O2 ). Basal NADPH oxidase activity is low under standard growth conditions because the cyto solic subunits are not bound to the membrane. We there
Figure 2. NOX2 expression and activity are increased in daunorubicin-resistant HL-60 cells. (A) The NAPDH oxidase NOX2 is composed of two membrane-associated proteins, gp91phox and p22phox. Upon activation, the cytosolic subunits p67phox, p47phox and p40phox translocate to the membrane together with the small GTPase Rac2 to form the full oxidase complex. (B) Heatmap of the RNA-sequencing data in parental, daunorubicin-resistant (DNR-R) and cytarabine-resistant (ARA-R) cells showing the expression of the genes encoding the NOX2 subunits (CYBB, CYBA, NCF1, NCF2, NCF4, and RAC2). (C) The expression of CYBB and NCF2 was analyzed by quantitative reverse transcriptase polymerase chain reaction (RT-qPCR) on mRNA purified from parental, ARA-R and DNR-R cells and normalized to S26 mRNA levels. Data are presented as percentages of the HL-60 condition (n=5, mean ± standard deviation [SD]). (D, E) Parental, ARA-R and DNR-R HL-60 (D) or U937 (E) cells were treated or not with phorbol myristate acetate (PMA) and the production of reactive oxygen species was measured by following L-012 luminescence over 2 h (n=4 for HL-60, n=3 for U937, a representative experiment is shown). (F) The expression of CYBB and NCF2 was analyzed by RT-qPCR on mRNA purified from parental, ARA-R and DNR-R cells and normalized to S26 mRNA levels. Data are presented as percentages of the U937 condition (n=4, mean ± SD). gp91phox surface expression was measured by flow cytometry in parental, DNR-R and ARA-R U937 cells. The median fluorescence intensity (MFI) obtained with isotypic controls was subtracted from the gp91 MFI and nor malized to the parental cells (n=6, mean ± SD). RLU: relative light units

fore treated cells with phorbol myristate acetate (PMA), a well-known activator of NADPH oxidases. No superoxide production was detected in HL-60 cells, which are known to have low or no NADPH oxidase activity when not dif ferentiated.25,26 Strong ROS production was measured in PMA-treated DNR-R but not in ARA-R cells (Figure 2D). To confirm these results, we used another cell line, U937, rendered resistant to Ara-C or DNR.21 DNR-R but not ARAR U937 cells had increased NOX activity (Figure 2E), over expressed CYBB and NCF2 and expressed higher levels of gp91phox at their surface compared to parental cells (Figure 2F).
We then cloned the chemoresistant HL-60 cell popu lations. All DNR-R clones showed a strong increase in both CYBB (Figure 3A) and NCF2 (Figure 3B) mRNA levels (above 10 to more than 1000-fold compared to HL-60 cells). Ac cordingly, PMA-induced extracellular ROS production was increased in all DNR-R clones compared to parental HL60 (Figure 3C). Although the ARA-R population showed no significant increase in ROS production (Figure 2E), a frac tion of the ARA-R clones showed an increase in CYBB and NCF2 expression and high NOX activity in comparison to parental HL-60 cells (Figure 3A-C). The mean increase in NOX activity was however around 7-fold lower in ARA-R-

compared to DNR-R clones, which might explain why it was not detected within the ARA-R population. In addi tion, ARA-R clones with high NOX activity might have a survival advantage during the cloning process. To exclude the possibility that increased NOX2 expression and activity were due to the cloning procedure, we cloned the par ental HL-60 cells. None of the HL-60 clones showed an increase in NADPH oxidase-derived ROS production (On line Supplementary Figure S3). To determine if high NOX activity was sufficient to confer DNR resistance, we measured the IC50 for DNR of two ARA-R clones, one with low NOX activity (15138) and one with high NOX activity (15144). None of the ARA-R clone was resistant to DNR, indicating that high NOX expression in ARA-R cells is not sufficient to confer cross-resistance to DNR (Online Sup plementary Figure S4A). In addition, higher NOX activity did not confer resistance to venetoclax, a BCL2 inhibitor now used in the treatment of AML patients (Online Sup plementary Figure S4B). Finally, for both DNR-R and ARAR clones, increased NOX activity was not correlated with a significant increase in the differentiation of the chemo resistant clones (Online Supplementary Figure S4C). We then measured gp91phox membrane expression using flow cytometry of two high ROS-producing clones (15165
Figure 3. Overexpression of NADPH oxidase components is responsible for increased production of reactive oxygen species in chemoresistant acute myeloid leukemia cells. (A-C) Daunorubicin-resistant (DNR-R) and cytarabine-resistant (ARA-R) HL-60 cell populations were cloned and 14 clones for each were used to measure mRNA expression for CYBB (A) and NCF2 (B) using quantitative reverse transcriptase polymerase chain reaction analysis. Data were normalized to S26 mRNA levels and are pres ented as ratios to parental HL-60 cells (n=3, mean ± standard deviation [SD]). (C) Reactive oxygen species (ROS) production was measured after addition of phorbol myristate acetate (PMA) using L-012 luminescence. The area under the curve (AUC) was cal culated after plotting L-012 luminescence over 1 h (n=3, mean ± SD). (D) gp91phox surface expression was measured by flow cyto metry in parental HL-60 cells as well as in two DNR-R clones showing high NADPH oxidase activity (15165 and 15176) and two clones with low NADPH oxidase activity (15160 and 15169). (E) DNR-R clones 15165 and 15176 were stimulated or not with PMA with or without VAS2870 and ROS production was measured by luminometry (n=3, a representative experiment is shown).
and 15176) and two low ROS-producing clones (15160 and 15169) from DNR-R cells. Overexpression of gp91phox at the cell surface was found to be high only in the clones pro ducing high levels of ROS (15165 and 15176) (Figure 3D). VAS2870, a pan-NADPH oxidase inhibitor with preferential activity against NOX2,27 strongly reduced PMA-induced ROS production in DNR-R clones (Figure 3E), further dem onstrating that increased ROS production in chemoresis tant AML cells is due to NADPH oxidase activation.
Collectively, our data suggest that acquisition of chemo resistance, in particular to DNR, is associated with in creased expression of the subunits of the NOX2 NADPH oxidase, its cell surface expression and activity in AML cells.
gp91phox overexpression does not affect the proliferation of chemoresistant cells but participates in their resistance to daunorubicin
To address the role of NOX2 activation in chemoresistant cells, we measured the proliferation of four DNR-R and two ARA-R clones (one high and one low NOX2-expressing

clone). No differences were observed in their proliferation compared to that of the parental HL-60 cells (Online Sup plementary Figure S4D), suggesting that high NOX2 is not conferring a proliferative advantage to the chemoresistant cells. Then, using CRISPR/Cas9 technology, we knocked out the CYBB gene in the DNR-R clone showing the high est level of gp91phox expression (clone 15165). This led to a strong decrease in gp91phox cell surface expression (Figure 4A) and abolished NADPH oxidase activity (Figure 4B). No difference was observed between the proliferation rates of parental HL-60 and DNR-R cells expressing or not gp91phox (Figure 4C). DNR-R cells CRISPRed for gp91phox re gained sensitivity to DNR compared to control CRISPRed cells (Figure 4D and Online Supplementary Figure S5C). To further demonstrate the involvement of NOX2-derived ROS production in the maintenance of DNR resistance, we cultured the parental HL-60 cells and two DNR-R clones (15165 and 15176) for 3 weeks in medium supplemented with superoxide dismutase (SOD), which transforms superoxide anions to H2O2 and catalase, which degrades H2O2 to H2O.28,29 This efficiently removed NOX2-produced
Figure 4. NOX2 overexpression participates in the acquisition and/or maintenance of resistance to daunorubicin. (A) gp91phox sur face expression was measured by flow cytometry in parental HL-60 cells, in daunorubicin-resistant (DNR-R) clones (15165) as well as 15165 cells subjected to CRISPR/Cas9 KO for gp91Phox and 15165 cells subjected to mock CRISPR/Cas9 mutagenesis. (B) NADPH oxidase activity was detected by measurement of reactive oxygen species (ROS) in the cells presented in (A) after addition of phorbol myristate acetate (PMA) using L 012 luminescence.(n=3, a representative experiment is shown). (C) Cell proliferation was measured using MTS (n=3, mean ± standard deviation [SD]). (D) IC50 for daunorubicin (DNR) was measured after 24 h of treatment using MTS (n=4, mean ± SD). (E, F) HL60 and two DNR-R clones (15165 and 15176) were cultured in the presence of SOD (30 U/mL) and catalase (25 µg/mL) for 3 weeks. (E) The number of cells was then measured using MTS and represented as a ratio to the mock-treated cells (n=5, mean ± SD). (F) IC50 for DNR was measured after 24 h of DNR treatment using MTS (n=4, mean ± SD). All P-values were calculated with one-way analysis of variance and the Tukey multiple comparison test.
ROS from the medium (Online Supplementary Figure S5A, B). Although this did not affect the proliferation of the DNR-R clones (Figure 4E), it did decrease their resistance to DNR (Figure 4F). Similarly, long-term treatment of the DNR-R clones with the NOX inhibitor VAS2870 re-sensi tized the clones to DNR (Online Supplementary Figure S5D). This suggests that overexpression of gp91phox and the ensuing increase in ROS production contribute to the ac quisition and/or the maintenance of resistance to DNR in our model.
gp91phox expression and NOX2 activity are higher in FAB M4/M5 acute myeloid leukemia subtypes and increase on chemotherapy-resistant patients’ cells

To further characterize the importance of NOX2 in AML patients, we used flow cytometry to assay the expression of gp91phox on the surface of primary AML cells from 74 pa tients at diagnosis. Differences in gp91phox levels were neither associated with a specific group from the Euro pean LeukemiaNet 2017 classification2 (favorable, inter
mediate or adverse), nor with NPM1 or FLT3 mutational status (Online Supplementary Figure S7 and Online Sup plementary Table S3). However, gp91phox levels were sig nificantly higher in the M5 AML subtype than in normal CD34+ cells and leukemic blasts from the M0, M1 and M2 subtypes of the FAB classification (Figure 5A and Online Supplementary Table S3). Using transcriptomic data from the TCGA cohort,14 we confirmed that CYBB mRNA ex pression is higher in the M4/M5 subtypes (Figure 5B). To assess whether increased gp91phox cell surface expression is linked to higher NAPDH oxidase activity, we measured PMA-stimulated ROS production using sorted AML cells (bulk CD34 leukemic cells and leukemic stem cells [LSC]containing CD34+ cells) from one patient with low gp91phox (M1 subtype, patient #17215) and another with high gp91phox cell surface expression (M4 subtype, patient #17226) (Fig ure 5C). Weak PMA-induced ROS production was detected in the low gp91phox-expressing patient’s cells, which con trasted with high production in the high gp91phox-express ing patient’s cells (Figure 5D). For the M4 patient’s cells,
Figure 5. NOX2 expression and activity are higher in patients with FAB M4/M5 acute myeloid leukemia. (A) gp91phox expression was measured by flow cytometry on the leukemic cells (CD45/SSC gating) present in bone marrow aspirates taken at diagnosis from 74 patients with acute myeloid leukemia (AML). Patients are classified according to the French-American-British classifi cation. The median is represented as a horizontal line for each group. P=0.0057 in one-way analysis of variance (Kruskal-Wallis test) (B) mRNA expression for the CYBB gene was measured by RNA-sequencing in The Cancer Genome Atlas cohort comprising 198 AML patients. (C) gp91phox surface expression was measured by flow cytometry on AML cells from two patients sorted using CD45/SSC gating and separated according to their level of expression of the CD34 marker. (D) Sorted AML cells (CD34+ and CD34 ) for each patient were used to measure production of reactive oxygen species after stimulation with phorbol myristate acetate (PMA) (10 nM). (E) gp91phox expression (MFI) was measured by flow cytometry on leukemic cells (CD45/SSC gating) present in bone marrow aspirates taken at diagnosis and after the induction chemotherapy (between 15 and 45 days after the beginning of the treatment) from eight AML patients (Online Supplementary Table S3, ID numbers of the patients indicated on the figure). Four of the patients reached complete remission (CR) after induction chemotherapy (16119, 16127, 16185, and 17235), two reached CR after allografting (14056 and 16126) and two never reached CR (17202 and 17217). All patients but one (17235, who was allo grafted) relapsed. MFI: mean fluorescence intensity, FAB: French-American-British; TCGA: The Cancer Genome Atlas.
Table 1. List of the six probe sets included in the NOX score.
229445_at CYBA -1.121 0.0104 0.673 -0.3964 Good 203922_s_at CYBB -0,619 0.0511 1.263 0.2331 NS 204961_s_at NCF1 1.108 0.0172 0.677 -0.3898 Good 209949_at NCF2 -0,291 0.0208 1.303 0.2647 Poor 205147_x_at NCF4 0,718 0.0169 1.359 0.3066 Poor 207419_s_at RAC2 -0,590 0.0058 1.490 0.3987 Poor
Gene symbol, adjusted P-value, hazard ratio and prognosis significance are provided for each gene, as determined in the Verhaak cohort (n=504).
gp91phox level (Figure 5C) and ROS production (Figure 5D) were much higher in the bulk of leukemic cells (CD34 ) than in the LSC-containing compartment (CD34+). Finally, for eight patients of our cohort, we compared the mean gp91phox expression on leukemic blasts taken at di agnosis with that on blasts that resisted induction ther apy in the same patients. An increase in gp91phox labeling after chemotherapy was found in seven of the eight pa tients (Figure 5E and Online Supplementary Table S3 ). This supported the idea that, similarly to the chemore sistant cell lines, chemotherapy-resistant AML cells gen erally express higher levels of gp91phox at their surface.
To study the link between NOX2 and AML response to treatments, we determined the individual prognostic value of the genes coding for the six NOX2 subunits (CYBB, CYBA , NCF1, NCF2, NCF4, and RAC2) using publicly available data from the Verhaak cohort.15 Increased ex pression was associated with a poor prognosis for four of them (CYBB, NCF2, NCF4, and RAC2) and with a good prognosis for the other two (CYBA and NCF1) (Table 1). To take into account the expression and prognostic value of all NOX2 subunits instead of individual ones, we devel oped a NOX2-subunit gene expression-based score. The contribution of individual NOX2 genes and the cutpoint were determined using a training cohort comprising 252 patients (Verhaak training set).15 Patients with a high “NOX score” had a worse prognosis with a hazard ratio of 1.85 in univariate Cox analysis (Figure 6A and Table 2). The prognostic significance of the NOX score was then confirmed in a test set (n=252) from the Verhaak cohort (Figure 6B and Table 2) as well as in two independent validation cohort: the Metzeler16 (Figure 6C, Table 2 and Online Supplementary Table S4) and TCGA cohorts14 (Fig ure 6D, Table 2 and Online Supplementary Table S6). The
poor prognostic-based NOX score remained statistically significant in a multivariate Cox analysis including the cytogenetic-based classification, NPM1/FLT3 mutational status (for the normal karyotype cohort), and age (Table 2). The NOX score strongly correlated with the expression of subunits associated with poor prognosis (CYBB, NCF2, NCF4 and RAC2 ) while the correlation with CYBA and NCF1 was less significant (Online Supplementary Figure S8). Finally, in line with the higher expression of CYBB in M4/M5 FAB subtypes, the NOX score was generally higher in the M4/M5 compared to the other FAB subtypes (On line Supplementary Figure S9 ). Nevertheless, the prog nostic value of the NOX score was independent of the FAB subtype, which did not have prognostic value on its own in any of the cohorts (Table 2).
To determine if the worse prognosis of high NOX score patients could be associated with higher chemoresis tance, we selected the 10% of patients with the highest NOX score and compared their transcriptome to those of the 50% of patients with the lowest NOX scores. We then used the 50 most upregulated genes in the high NOX score patients ( Online Supplementary Table S4 ) as a gene-set in a GSEA analysis of the upreguleted RNA-se quencing data from parental and chemoresistant HL-60 cells. The high NOX score gene set was significantly en riched in the chemoresistant compared to parental HL60 cells (Figure 6E). Interestingly, the most upregulated gene in the high NOX score patients is NAMPT, encoding a critical enzyme in the recycling of NAD, an essential co-factor for NADPH oxidase activity. Accordingly, we found that NAMPT expression is highly correlated to that of the CYBB, NCF1 and NCF2 genes in AML patients (Fig ure 6F).
Together, these data suggest that the overexpression of the NOX2 NADPH oxidase is a marker of adverse progno sis in AML associated with enhanced chemoresistance of the leukemic cells.
Figure 6. Identification of a NOX score with prognostic value in acute myeloid leukemia. (A) Patients (n=252) of the Verhaak train ing cohort were ranked according to increasing NOX score. The cutpoint of 0.41 was selected using the MaxStat R function to obtain a maximum difference in overall survival between the two groups. Kaplan-Meier survival curves were established using the cutpoint value of 0.41 in the training cohort. (B-D) The NOX-score was validated in three independent cohorts using the 0.41 cutpoint. (E) Gene set enrichment analysis was performed using RNA sequencing data from chemoresistant cells compared to parental HL-60 cells. The gene list comprises the 50 most upregulated genes in the 10% of patients with the highest NOX score, compared to the 50% patients with the lowest NOX score in the Verhaak cohort. Normalized enrichment score and nominal P value are presented. (F) Expression of CYBB, NCF1, NCF2 and NAMPT in 200 patients’ samples from The Cancer Genome Atlas co hort. R represents the Pearson rho correlation coefficient between the expression of NCF1, NCF2 or NAMPT and CYBB. TCGA: The Cancer Genome Atlas; NES: normalized enrichment score; FDR: false discovery rate.

Our work unveiled that NOX2 expression increases in chemoresistant AML and could participate in the acquisi tion and/or maintenance of chemoresistance. Moreover, NOX2 was found to be a marker of adverse prognosis in AML patients. NOX2 is the main NADPH oxidase complex expressed in the hematopoietic system. It is responsible for the respiratory burst, a release of superoxides ( O2 ) in the phagosome, which is used to eliminate engulfed pa thogens.30 In addition to their essential role in host pro tection, ROS produced by NADPH oxidases also function as second messengers in the regulation of numerous sig naling pathways.31 Dysregulation of the expression and ac
tivity of NADPH oxidases has been linked to various cancers, including AML.32 NOX2 expression was found to be generally higher in leukemic blasts from AML patients than in normal CD34+ hematopoietic progenitors and in volved in leukemic cell proliferation.12 NOX2 was shown to be mostly expressed in M4 and M5 subtypes of leukemia according to the FAB classification and rarely on leukemic blasts from M1 or M2 subtypes.26,33 By analyzing gp91phox, the catalytic subunit of NOX2, at the surface of blasts from 74 AML patients, we confirmed that NOX2 expression is higher in the M4/M5 subtypes than in the M0, M1 and M2 subtypes. In addition, within a given patient’s sample, gp91phox expression and NOX2 activity were higher in the bulk of leukemic cells (CD34 ) than in the LSC-containing
Table 2. Cox analysis of overall survival in the Verhaak training set (n=252), the Verhaak test set (n=252), the Metzeler validation set (n=240) and The Cancer Genome Atlas validation set (n=148) according to NOX score, cytogenetic prognosis, age and French-American-British classification.
NOX score (Reference : low NOX score)
Cytogenetic & molecular prognosis (Reference : Good)
High NOX score 1.85 < 0.001 1.76 0.003
Intermediate 2.85 < 0.001 2.54 < 0.001
Poor 3.97 < 0.001 3.02 < 0.001
Age (per year) 1.02 0.008 1.01 0.111
FAB classification (Reference : M4 or M5)
NOX score (Reference : low Nox score)
Cytogenetic & molecular prognosis (Reference : Good)
Not M4 or M5 0.77 0.125 0.885 0.506
High NOX score 1.59 0.003 1.75 0.003
Intermediate 1.32 0.242 1.20 0.450
Poor 2.78 < 0.001 2.53 0.001
Age (per year) 1.01 0.095 1.01 0.381
FAB classification (Reference : M4 or M5)
Metzeler validation cohort
NOX score (Reference : low Nox score)
Cytogenetic & molecular prognosis (Reference : Good)
Not M4 or M5 1.09 0.639 1.38 0.088
High NOX score 1.53 0.009 1.41 0.04
Intermediate 2.62 < 0.001 2.77 < 0.001 Poor 3.31 < 0.001 3.61 < 0.001
Age (per year) 1.02 < 0.001 1.03 < 0.001
FAB classification (Reference : M4 or M5)
TCGA validation cohort
NOX score (Reference : low Nox score)
Cytogenetic & molecular prognosis (Reference : Good)
Not M4 or M5 1.30 0.145 0.91 0.632
High NOX score 1.81 0.007 1.57 0.047
Intermediate 3.50 < 0.001 2.98 0.003 Poor 5.04 < 0.001 4.14 < 0.001
Age (per year) 1.02 0.004 1.02 0.040
FAB classification (Reference : M4 or M5)
Not M4 or M5 0.93 0.765 1.02 0.923
Hazard ratios and P-values are shown for each parameter in univariate and multivariate Cox analysis. HR: hazard ratio; FAB: FrenchAmerican.British; TCGA: The Cancer Genome Atlas.
CD34+ compartment, which nevertheless showed basal activity. This is congruent with the fact that NOX2 is required for LSC self-renewal and, in turn, leukemogen esis.23 Moreover, our results indicate that the increase in NOX2 activity in chemoresistant cell lines is linked with the transcriptional activation of most, if not all, of its six subunits. Interestingly, their expression, in particular those of CYBB, NCF1 and NCF2, is highly correlated.
Increased NOX2 expression could confer a selective ad vantage to the chemoresistant clones. Supporting this hy pothesis, we could demonstrate, in patients, that therapy-resistant cells remaining after induction chemo therapy express higher levels of gp91phox at their surface. Moreover, preventing NOX2 activation in DNR-R cells through the deletion of CYBB, ROS scavenging or NADPH oxidase inhibition re-sensitized them to DNR. This indi
cates that NOX2 overexpression could be involved in the acquisition and/or maintenance of resistance. The under lying molecular mechanisms remain to be characterized. They might involve the regulation of specific signaling pathways through the reversible oxidation of cysteines present in the catalytic site of enzymes such as kinases and phosphatases34 or, as we showed previously, of SU MOylation enzymes.35,36 Their modulation would partici pate in the transcriptional reprogramming observed in chemoresistant AML cells and in the acquisition and/or maintenance of chemoresistance. NOX-derived ROS were also shown to promote AML cell proliferation,12,37 possibly by activating genes involved in glycolysis38 or through metabolic reprograming.39 In addition, oncogenes such as mutated RAS40,41 or FLT3-ITD42 activate NADPH-oxidase de rived ROS production, which increases hematopoietic cell
proliferation and leukemic transformation. Finally, NOX2derived ROS stimulate the transfer of mitochondria from bone marrow stromal cells to the AML blasts, increasing their metabolic activity and proliferation.43 In our study, high NOX-expressing chemoresistant clones did not pro liferate faster than chemosensitive parental cells and deletion of CYBB or ROS scavenging did not affect their doubling time. Thus, although the pro-proliferative effect of NOX-derived ROS might be involved in leukemogenesis, it does not seem to confer a proliferative advantage to chemoresistant cells. Finally, NADPH-oxidase-derived ROS are also involved in the interaction between leukemic cells and the immune system. They can induce apoptosis of natural killer cells and T cells33 and prevent the matu ration of dendritic cells.44 Whether or not such an inactiv ation of antitumor immune cells could also confer a selective advantage to the chemoresistant AML cells that overexpress NOX2 remains an open question. When analyzing the prognostic value of the individual NOX2 subunits, we found that four were associated with a poor prognosis (gp91phox, p67phox, p40phox and Rac2) and, more surprisingly, two with a good prognosis (p22phox and p47phox). The association of CYBA (p22phox) and NCF1 (p47phox) with a good prognosis might be due to NOX2-independent functions of these proteins. In particular, p22phox is also involved in the assembly of NOX1, NOX3 and NOX411 and p47phox can activate both NOX145 and NOX3.46 We thus de veloped the NOX score to take into account the ex pression and the prognostic value of all subunits. Patients with a high NOX score showed overexpression of CYBB, NCF2, NCF4 or RAC2. A high NOX score was associated with a poor prognosis in three independent AML cohorts. The NOX score was found to be independent of other prognostic factors such as age, cytogenetic risk or NPM1/FLT3 mutational status in normal karyotype AML. Consistent with a higher expression of CYBB in FAB M4/M5 subtypes, we found that the NOX score was higher in these subtypes. However, the NOX score was found to be independent of the FAB classification in multivariate analysis, indicating that its prognostic value is not linked to the FAB subtype. Although patients with a high NOX score showed enrichment in the chemoresistance signa ture, the prognostic value of the NOX score might not only be linked to the role of NOX2 in chemoresistance. The NOX score should now be validated in a prospective cohort to confirm its prognostic value. NAPDH-oxidase inhibitors have been proposed as anticancer drugs. Histamine, which inhibits NADPH-oxidase-derived ROS production, is already approved, in combination with interleukin-2, to prevent relapse in AML.47 This treatment was found to be more effective in M4/M5 patients.48 The NOX score might constitute another biomarker to select patients eligible for such therapy. Many other molecules targeting NADPH oxidases have been developed in the past few years.49
However, most of them suffer from a lack of specificity
Interestingly, we found that NAMPT, the gene coding for a rate-limiting enzyme in the recycling of NAD, is the most upregulated gene in patients with a high NOX score and its expression is highly correlated to NOX2 subunit levels in AML patients. In addition, NAMPT was more expressed in chemoresistant HL-60 cells than in parental cells, in line with recent findings showing its overexpression in chemoresistant versus chemosensitive LSC.52 Inhibitors of NAMPT have shown antileukemic activity in preclinical models52–54 and some of them are being tested in clinical trials (NCT02702492, NCT04281420). Even though the NADP/NADPH cycle relies on the activity of various enzymes, targeting NAMPT in patients with a high NOX score might represent another option to inhibit NOX2 ac tivity in AML cells, by decreasing NADPH supply. In con clusion, our work points to a link between NOX2 and AML chemoresistance. Targeting NOX2 might constitute a new therapeutic strategy to overcome AML chemoresistance and improve the prognosis of patients.
CR has received research funding from AbbVie, Amgen, No vartis, Celgene, Jazz Pharmaceuticals , Agios, Chugai, MaatPharma, Astellas, Roche, Iqvia, and Daiichi-Sankyo; and acted in a consultancy/advisory role for AbbVie, Janssen, Jazz Pharmaceuticals, Novartis, Celgene, Otsuka, Astellas, Daiichi-Sankyo, Macrogenics, Roche, Takeda, and Pfizer. GC has provided consultancy for Roche, Celgene, MabQi, and MedXcell; and received honoraria from Abbvie, Janssen, Novartis, Milteny, Roche, and Gilead.
RP, PG, MdT, RH, DA, and HB performed the cell biology ex periments and analyzed the data. MB and DT analyzed the RNA-sequencing data. LG and JM created and validated the NOX prognostic score. EG sequenced the RNA. GC pro vided patients’ samples. CR, JS, MP and GB designed the study and obtained funds for the project. GB supervised the study. PG and LG contributed equally to this work.
We are grateful to the IGMM "Ubiquitin Family in Hemato logical Malignancies" group members for fruitful dis cussions and critical reading of the manuscript. We thank the Montpellier Ressources Imagerie (MRI) platforms for technical assistance.
Funding was provided by the CNRS, the Fondation ARC pour la Recherche sur le Cancer, Ligue Nationale contre le Cancer (Programme Equipe Labellisée), the INCA (ROSAML), the ANR (“Investissements d’avenir” program; ANR-16IDEX-0006), the Fondation pour la Recherche Médicale
(FRM) to LG and the Ligue Nationale contre le Cancer to MB. The HEMODIAG_2020 collection of clinical data and patients’ samples was funded by the Montpellier University Hospital, the Montpellier SIRIC and the Languedoc Rous sillon Region. MGX acknowledges financial support from the France Génomique National infrastructure, funded as part of “Investissements d’Avenir” program managed by the
1. Döhner H, Weisdorf DJ, Bloomfield CD. Acute myeloid leukemia. N Engl J Med. 2015;373(12):1136-1152.
2. Döhner H, Estey E, Grimwade D, et al. Diagnosis and management of AML in adults: 2017 ELN recommendations from an international expert panel. Blood. 2017;129(4):424-447.
3. Marin JJG, Briz O, Rodríguez-Macias G, Díez-Martín JL, Macias RIR. Role of drug transport and metabolism in the chemoresistance of acute myeloid leukemia. Blood Rev. 2016;30(1):55-64.
4. Galmarini CM, Thomas X, Graham K, et al. Deoxycytidine kinase and cN-II nucleotidase expression in blast cells predict survival in acute myeloid leukaemia patients treated with cytarabine. Br J Haematol. 2003;122(1):53-60.
5. Ax W, Soldan M, Koch L, Maser E. Development of daunorubicin resistance in tumour cells by induction of carbonyl reduction. Biochem Pharmacol. 2000;59(3):293-300.
6. Sillar JR, Enjeti AK. Targeting apoptotic pathways in acute myeloid leukaemia. Cancers (Basel). 2019;11(11):1660.
7. Pearsall EA, Lincz LF, Skelding KA. The role of DNA repair pathways in AML chemosensitivity. Curr Drug Targets. 2018;19(10):1205-1219.
8. Hosseini M, Rezvani H, Aroua N, et al. Targeting myeloperoxidase disrupts mitochondrial redox balance and overcomes cytarabine resistance in human acute myeloid leukemia. Cancer Res. 2019;79(20):5191-5203.
9. Farge T, Saland E, de Toni F, et al. Chemotherapy resistant human acute myeloid leukemia cells are not enriched for leukemic Stem cells but require oxidative metabolism. Cancer Discov. 2017;7(7):716-735.
10. Fiorentini A, Capelli D, Saraceni F, Menotti D, Poloni A, Olivieri A. The time has come for targeted therapies for AML: lights and shadows. Oncol Ther. 2020;8(1):13-32.
11. Moghadam ZM, Henneke P, Kolter J. From flies to men: ROS and the NADPH oxidase in phagocytes. Front Cell Dev Biol. 2021;9:628991.
12. Hole PS, Zabkiewicz J, Munje C, et al. Overproduction of NOXderived ROS in AML promotes proliferation and is associated with defective oxidative stress signaling. Blood. 2013;122(19):3322-3330.
13. Brahimi M, Saidi D, Touhami H, Bekadja MA. The use of CD45/SSC dot plots in the classification of acute leukemias. J Hematol Thromb Dis. 2014;2:e107.
14. Cancer Genome Atlas Research Network. Genomic and epigenomic landscapes of adult de novo acute myeloid leukemia. N Engl J Med. 2013;368(22):2059-2074.
15. Verhaak RGW, Wouters BJ, Erpelinck CAJ, et al. Prediction of molecular subtypes in acute myeloid leukemia based on gene expression profiling. Haematologica. 2009;94(1):131-134.
16. Metzeler KH, Hummel M, Bloomfield CD, et al. An 86-probe-set gene-expression signature predicts survival in cytogenetically
Agence Nationale pour la Recherche (contract ANR-10INBS-09).
Sequencing data were deposited in the Gene Expression Omnibus with accession number GSE193094.
normal acute myeloid leukemia. Blood. 2008;112(10):4193-4201.
17. Combès E, Andrade AF, Tosi D, et al. Inhibition of ataxiatelangiectasia mutated and RAD3-related (ATR) overcomes oxaliplatin resistance and promotes antitumor immunity in colorectal cancer. Cancer Res. 2019;79(11):2933-2946.
18. Gabellier L, Bret C, Bossis G, Cartron G, Moreaux J. DNA repair expression profiling to identify high-risk cytogenetically normal acute myeloid leukemia and define new therapeutic targets. Cancers. 2020;12(10):2874.
19. Herviou L, Kassambara A, Boireau S, et al. PRC2 targeting is a therapeutic strategy for EZ score defined high-risk multiple myeloma patients and overcome resistance to IMiDs. Clin Epigenetics. 2018;10(1):121.
20. Kassambara A, Hose D, Moreaux J, et al. Genes with a spike expression are clustered in chromosome (sub)bands and spike (sub)bands have a powerful prognostic value in patients with multiple myeloma. Haematologica. 2012;97(4):622-630.
21. Gâtel P, Brockly F, Reynes C, et al. Ubiquitin and SUMO conjugation as biomarkers of acute myeloid leukemias response to chemotherapies. Life Sci Alliance. 2020;3(6):e201900577.
22. Christopher MJ, Petti AA, Rettig MP, et al. Immune escape of relapsed AML cells after allogeneic transplantation. N Engl J Med. 2018;379(24):2330-2341.
23. Adane B, Ye H, Khan N, et al. The hematopoietic oxidase NOX2 regulates self-renewal of leukemic stem cells. Cell Rep. 2019;27(1):238-254.
24. Schröder K. NADPH oxidases: current aspects and tools. Redox Biol. 2020;34:101512.
25. Levy R, Rotrosen D, Nagauker O, Leto TL, Malech HL. Induction of the respiratory burst in HL-60 cells. Correlation of function and protein expression. J Immunol. 1990;145(8):2595-2601.
26. Dakik H, El Dor M, Leclerc J, et al. Characterization of NADPH oxidase expression and activity in acute myeloid leukemia cell lines: a correlation with the differentiation status. Antioxidants. 2021;10(3):498.
27. Dao VT, Elbatreek MH, Altenhöfer S, et al. Isoform-selective NADPH oxidase inhibitor panel for pharmacological target validation. Free Radic Biol Med. 2020;148:60-69.
28. Yamamoto T, Sakaguchi N, Hachiya M, Nakayama F, Yamakawa M, Akashi M. Role of catalase in monocytic differentiation of U937 cells by TPA: hydrogen peroxide as a second messenger. Leukemia. 2009;23(4):761-769.
29. Chamulitrat W, Schmidt R, Tomakidi P, et al. Association of gp91phox homolog Nox1 with anchorage-independent growth and MAP kinase-activation of transformed human keratinocytes. Oncogene. 2003;22(38):6045-6053.
30. Thomas DC. The phagocyte respiratory burst: historical perspectives and recent advances. Immunol Lett. 2017;192:88-96.
31. Holmström KM, Finkel T. Cellular mechanisms and physiological consequences of redox-dependent signalling. Nat Rev Mol Cell Biol. 2014;15(6):411-421.
32. Sillar JR, Germon ZP, De Iuliis GN, Dun MD. The role of reactive oxygen species in acute myeloid leukaemia. Int J Mol Sci. 2019;20(23):6003.
33. Aurelius J, Thorén FB, Akhiani AA, et al. Monocytic AML cells inactivate antileukemic lymphocytes: role of NADPH oxidase/gp91phox expression and the PARP-1/PAR pathway of apoptosis. Blood. 2012;119(24):5832-5837.
34. Moloney JN, Cotter TG. ROS signalling in the biology of cancer. Semin Cell Dev Biol. 2018;80:50-64.
35. Bossis G, Sarry J-E, Kifagi C, et al. The ROS/SUMO axis contributes to the response of acute myeloid leukemia cells to chemotherapeutic drugs. Cell Rep. 2014;7(6):1815-1823.
36. Bossis G, Melchior F. Regulation of SUMOylation by reversible oxidation of SUMO conjugating enzymes. Mol Cell. 2006;21(3):349-357.
37. Reddy MM, Fernandes MS, Salgia R, Levine RL, Griffin JD, Sattler M. NADPH oxidases regulate cell growth and migration in myeloid cells transformed by oncogenic tyrosine kinases. Leukemia. 2011;25(2):281-289.
38. Robinson AJ, Hopkins GL, Rastogi N, et al. Reactive oxygen species drive proliferation in acute myeloid leukemia via the glycolytic regulator PFKFB3. Cancer Res. 2020;80(5):937-949.
39. Robinson AJ, Davies S, Darley RL, Tonks A. Reactive oxygen species rewires metabolic activity in acute myeloid leukemia. Front Oncol. 2021;11:632623.
40. Hole PS, Pearn L, Tonks AJ, et al. Ras-induced reactive oxygen species promote growth factor–independent proliferation in human CD34+ hematopoietic progenitor cells. Blood. 2010;115(6):1238-1246.
41. Aydin E, Hallner A, Grauers Wiktorin H, Staffas A, Hellstrand K, Martner A. NOX2 inhibition reduces oxidative stress and prolongs survival in murine KRAS - induced myeloproliferative disease. Oncogene. 2019;38(9):1534-1543.
42. Jayavelu AK, Müller JP, Bauer R, et al. NOX4-driven ROS formation mediates PTP inactivation and cell transformation in FLT3ITD-positive AML cells. Leukemia. 2016;30(2):473-483.
43. Marlein CR, Zaitseva L, Piddock RE, et al. NADPH oxidase-2 derived superoxide drives mitochondrial transfer from bone marrow stromal cells to leukemic blasts. Blood. 2017;130(14):1649-1660.
44. Martner A, Wiktorin HG, Lenox B, et al. Histamine promotes the development of monocyte-derived dendritic cells and reduces tumor growth by targeting the myeloid NADPH oxidase. J Immunol. 2015;194(10):5014-5021.
45. Youn JY, Gao L, Cai H. The p47phox- and NADPH oxidase organiser 1 (NOXO1)-dependent activation of NADPH oxidase 1 (NOX1) mediates endothelial nitric oxide synthase (eNOS) uncoupling and endothelial dysfunction in a streptozotocininduced murine model of diabetes. Diabetologia. 2012;55(7):2069-2079.
46. Cheng G, Ritsick D, Lambeth JD. Nox3 regulation by NOXO1, p47phox, and p67phox.. J Biol Chem. 2004;279(33):34250-34255.
47. Brune M, Castaigne S, Catalano J, et al. Improved leukemia-free survival after postconsolidation immunotherapy with histamine dihydrochloride and interleukin-2 in acute myeloid leukemia: results of a randomized phase 3 trial. Blood. 2006;108(1):88-96.
48. Aurelius J, Martner A, Brune M, et al. Remission maintenance in acute myeloid leukemia: impact of functional histamine H2 receptors expressed by leukemic cells. Haematologica. 2012;97(12):1904-1908.
49. Altenhöfer S, Radermacher KA, Kleikers PWM, Wingler K, Schmidt HHHW. Evolution of NADPH oxidase inhibitors: selectivity and mechanisms for target engagement. Antioxid Redox Signal. 2015;23(5):406-427.
50. El Dor M, Dakik H, Polomski M, et al. VAS3947 induces UPRmediated apoptosis through cysteine thiol alkylation in AML cell lines. Int J Mol Sci. 2020;21(15):5470.
51. Sun Q-A, Hess DT, Wang B, Miyagi M, Stamler JS. Off-target thiol alkylation by the NADPH oxidase inhibitor 3-benzyl-7-(2benzoxazolyl)thio-1,2,3-triazolo[4,5-d]pyrimidine (VAS2870). Free Radic Biol Med. 2012;52(9):1897-1902.
52. Jones CL, Stevens BM, Pollyea DA, et al. Nicotinamide metabolism mediates resistance to venetoclax in relapsed acute myeloid leukemia stem cells. Cell Stem Cell. 2020;27(5):748-764.
53. Gerner RR, Macheiner S, Reider S, et al. Targeting NAD immunometabolism limits severe graft-versus-host disease and has potent antileukemic activity. Leukemia. 2020;34(7):1885-1897.
54. Mitchell SR, Larkin K, Grieselhuber NR, et al. Selective targeting of NAMPT by KPT-9274 in acute myeloid leukemia. Blood Adv. 2019;3(3):242-255.
Xue Li,1,2,3 Srinivas Chatla,4 Andrew F. Wilson,2 Limei Wu,1,5 Neha Atale1,5 and Wei Du1,5
1Division of Hematology and Oncology, University of Pittsburgh School of Medicine, Pittsburgh, PA, USA; 2Cincinnati Children’s Hospital Medical Center, Cincinnati, OH, USA; 3Institute for Brain Research and Rehabilitation, South China Normal University, Guangzhou, People’s Republic of China; 4Fels Cancer Institute for Personalized Medicine, Lewis Katz School of Medicine at Temple University, Philadelphia, PA, USA and 5UPMC Hillman Cancer Center, Pittsburgh, PA, USA
22, 2021.
8, 2022.
21, 2022.
The immune receptor TREM1 (Triggering receptor expressed on myeloid cells 1) is a master regulator of inflammatory response. Compelling evidence suggests important pathological roles for TREM1 in various types of solid tumors. However, the role of TREM1 in hematologic malignancies is not known. Our previous study demonstrated that TREM1 cooperates with diminished DNA damage response to induce expansion of pre-leukemic hematopoietic stem cells (HSC) in mice deficient for the Fanconi anemia gene Fanca. Here we investigated TREM1 in leukemogenesis using mouse models of the DNA repair-deficient Fanca-/- and the oncogenic MLL-AF9 or KrasG12D. We found that Trem1 was highly expressed in preleukemic HSC and leukemia stem cells (LSC). By selective deletion of the Trem1 gene in the hematopoietic compartment, we showed that ablation of Trem1 reduced leukemogenic activity of the pre-leukemic HSC and LSC in mice. Trem1 was required for the proliferation of the pre-leukemic HSC and LSC. Further analysis revealed that Trem1 expression in preleukemic HSC and LSC was associated with persistent DNA damage, prolonged oncogenic stress, and a strong inflammatory signature. Targeting several top Trem1 inflammatory signatures inhibited the proliferation of pre-leukemic HSC and LSC. Collectively, our observations uncover previously unknown expression and function of TREM1 in malignant stem cells, and identify TREM1 as a driver of leukemogenesis.
Triggering receptor expressed on myeloid cells 1 (TREM1, also known as CD354) is a member of the super immuno globulin family initially found expressed on a select group of myeloid cells.1,2 Compelling evidence suggests important pathological roles for TREM1 not only in acute infection-in duced reactions but also in chronic inflammatory disorders including various types of cancers.2 In fact, TREM1 is found overexpressed in a variety of cancers,3 including colorectal cancer,4 hepatocellular carcinoma,5 lung cancer,6 and pros tate tumors.7 Recent studies showed that TREM1 ex pression in patients with non-small cell lung cancer is associated with cancer recurrence and poor survival, sug gesting that TREM1 may play an important role in cancer progression.6 Furthermore, pharmacological inhibition of TREM1 attenuates tumor growth and prolongs survival in experimental pancreatic cancer8 and lung cancer.9 Analysis of transcriptome data of 33 cancers from The Cancer Ge nome Atlas using UALCAN (http://ualcan.path.uab.edu/)10
showed that TREM1 is upregulated in at least 14 types of cancers, especially kidney renal clear cell carcinoma, cer vical squamous cell carcinoma and glioblastoma, and that TREM1 expression is closely correlated with poor prognosis in kidney renal clear cell carcinoma and cervical squamous cell carcinoma. Overexpression of TREM1 is also found in hematologic malignancies, and it was shown that a high level of TREM1 expression was correlated with poor prog nosis in five subsets of acute myeloid leukemia (AML) cells (BloodSpot). However, the underlying mechanisms of action of TREM1 in cancer development are poorly understood. DNA damage response/repair (DDR) is a complex signal transduction network that is required for the preservation of the integrity of the genome and for ensuring its accu rate transmission through generations. To counteract DNA damage, DDR machinery orchestrates DNA damage checkpoint activation and facilitates the removal of DNA lesions. Unrepaired damage results in cellular senescence or apoptosis while erroneously repaired DNA lesions can lead to mutations.11
of the DDR and repair
systems can cause human disorders, which are associ ated with susceptibility to cancer, accelerated aging, and developmental abnormalities.12 Given the enormous re generative potential coupled with lifetime persistence of hematopoietic stem cells (HSC) in the body, tight control of HSC genome stability is demanded. In fact, the DDR has been considered as an evolutionary trade-off between blood regeneration and leukemia suppression.13 Indeed, failure to accurately repair DNA damage in HSC is associ ated with bone marrow (BM) failure and leukemogenesis.13
Using a mouse model deficient for the major Fanconi ane mia (FA) gene Fanca, our recent studies demonstrated a temporal correlation of diminished DDR with elevated im mune response in Fanca-/- pre-leukemic HSC and argued for the effectiveness of DDR as the cellular machinery preventing the transition of the initiating pre-leukemic HSC population into a leukemia stem cell (LSC) population with transformed properties.14
It is known that oncogene-driven proliferation must be associated with inhibition of apoptosis and senescence to allow malignant outgrowth.15,16 In response to oncogenic activation, normal cells induce genetically encoded pro grams, mainly growth arrest, apoptosis and senescence, which prevent deregulated proliferation and thus protect multicellular organisms from cancer progression.17,18 Mixed lineage leukemia (MLL) is an H2Kme3-depositing protein active during early development.19 MLL-rearrangements are present in about 10% of acute leukemias. Among these, the translocation t(9;11)(p22;q23) is mainly associ ated with AML and fuses AF9 to MLL (MLL-AF9).20 Onco genic Ras mutations (mutations of NRAS and KRAS genes) also occur in various leukemias,21 including AML,22 chronic myelomonocytic leukemia23 and juvenile myelomonocytic leukemia.24 However, the underlying mechanisms by which these oncogenes promote malignant transformation in leukemia remains controversial.
In this study, we investigated the role of TREM1 in leuke mogenesis and show that persistent DNA damage and prolonged oncogenic stress induces the expression of Trem1 in pre-leukemic HSC and LSC. This aberrant Trem1 expression promotes leukemic development and is as sociated with enhanced proliferation and inflammatory response.
Trem1 conditional knockout mice (Trem1-floxed) were gen erated by the Transgenic core facility at Cincinnati Children’s Hospital Medical Center using CRISPR-Cas9 technology. Mutant mice were produced on a C57BL/6J background. To generate Trem1flox/+ mice, guide RNA (gRNA) targeting exon 2 of the mouse Trem1 locus (5’ gRNA
[GTGGAGGTTGAAGGTCCTCA] and 3’ gRNA [AGAGGTGG GAAGGGCCAAA]), along with Cas9 were injected into single-cell embryos to create the conditional knockout al lele. To genotype the Trem1flox/+ mouse line, forward primer, 5’- ATCTTTGGCAGGGACAAGATAGTC-3’ and reverse primer, 5’- AGGGGAATCGACGCACAGGAAC-3’ were used to detect the Exon2 wild-type allele (156 bp) or Exon2 floxed allele (173 bp). Gender- and age-matched littermates were selected and used for the following experiments. Fanca+/- mice were provided by Dr. Madeleine Carreau (Laval University).25 MLL-AF9 transgenic mice20 were ob tained from Jackson Laboratory (Stock #: 009079) and in terbred with Trem1fl/flVav1Cre mice. LSL-KrasG12D mice (Jackson Laboratory, Stock #: 008179)26 were crossed with a tamoxifen-inducible deleter strain (CreER; Jackson Lab oratory, Stock #: 008463)27 to generate LSL-KrasG12D;CreER offspring. For Cre-mediated gene deletion, animals were injected intraperitoneally with 100 μ L of tamoxifen (20 mg/mL; 80 mg/kg body weight; Sigma-Aldrich, St. Louis, MO, USa) once every 24 h for a total of 5 consecutive days.28
The DNA damage-induced Fanca-/- pre-leukemia model was established as previously described.14 Briefly, 6- to 8week-old mice were intraperitoneally injected with 0.3 mg/kg of mitomycin C (MMC; Sigma-Aldrich, St Louis, MO, USA) weekly for 6 weeks. All the animals, including BoyJ (C57BL/6: B6, CD45.1+) recipient mice, were maintained in the animal facility at the Hillman Cancer Center at the University of Pittsburgh. All experimental procedures con ducted in this study were approved by the Institutional Animal Care and Use Committee of the University of Pitts burgh.
One thousand freshly isolated BM LSK cells from Fanca-/;Trem1 fl / flVav1Cre mice and the Fanca-/-;Trem1 fl / fl control mice, 3,000 BM c-Kit+ cells from MLL-AF9;Trem1fl/flVav1Cre mice and the MLL-AF9;Trem1 fl / fl control mice, or 3,000 green fluorescent protein (GFP)-sorted virus-transduced BM c-Kit+ cells from 2-month-old MLL-AF9 mice (CD45.2+), along with 2X10⁵ protector cells from congenic BoyJ mice (CD45.1+), were transplanted into lethally ir radiated (11.75 Gy) BoyJ mice. Recipients were subjected to total body irradiation at the indicated time points. For serial bone marrow transplantation (BMT), 1-3x10⁶ whole BM cells from primary recipients were pooled and in jected into sublethally irradiated (7.0 Gy) BoyJ recipients. Donor-derived chimera were detected by flow cytometry at 16 weeks after transplantatiion using antibodies against CD45.1 and CD45.2.
For Trem1+ and Trem1 cell transplantation, 100 sorted Trem1+SLAM (Lin Sca1+c-kit+CD150+CD48 cells) and Trem1 SLAM cells from Fanca-/- pre-leukemic mice, along with 2x10⁵ protector cells from congenic BoyJ mice (CD45.1+),
were transplanted into lethally irradiated BoyJ recipients. Donor-derived chimera were detected by flow cytometry at 16 weeks after transplantation. For secondary trans plants, 1x10⁶ CD45.2+ cells from the primary recipients at 4 months after BMT were transplanted into sublethally ir radiated BoyJ recipients. Donor-derived chimerism and myeloid expansion were determined by flow cytometry. Cytological and morphological analyses were conducted using Wright-Giemsa staining. Survival of the recipients was plotted using the Kaplan-Meier curve method.
A paired or unpaired Student t-test was used for twogroup comparisons, and one-way analysis of variance was used for comparisons of more than two groups. P values less than 0.05 were considered statistically significant. Re sults are presented as mean ± standard deviation. In the figures, * indicates P<0.05; ** indicates P<0.01 and *** in dicates P<0.001.
Trem1 is expressed in pre-leukemic hematopoietic stem cells and leukemic stem cells
We previously showed that the immune receptor TREM1 cooperates with a diminished DDR to induce pre-leukemic HSC expansion using a mouse model deficient for the Fanca gene.14 To further understand the role of Trem1 in leukemogenesis, we employed two leukemic models (Fig ure 1A) to investigate the underlying mechanisms in vivo: (i) the DNA damage-induced Fanca-/- pre-leukemic model; and (ii) the MLL-AF9 (MA9) transgenic model, in which the expression of the oncogenic MLL-AF9 fusion protein re sults in development of AML beginning around 5 months of age.20 We first established pre-leukemic and leukemic Fanca-/- mice as previously described,14 and measured the levels of Trem1 expression in the pre-leukemic HSC and LSC by quantitative polymerase chain reaction (qPCR). We found that Trem1 mRNA level was significantly elevated in the SLAM (LSKCD48 CD150+ cells; enriched for HSC; Online Supplementary Figure S1A) cells of the pre-leukemic Fanca -/- mice, as compared to those in wild-type (WT) mice (Figure 1B). This was accompanied by a 40-50% in crease in Trem1+SLAM cells in the pre-leukemic mice over the number of such cells in WT controls (Figure 1C). Trem1 expression and the percentage of Trem1+SLAM cells were even higher in the Fanca-/- leukemic mice than in the Fanca -/- pre-leukemic mice (Figure 1D, E). We also ob served a progressive increase in Trem1 expression in BM c-Kit+ cells (enriched for MA9 LSC)29 of the MA9 mice over the period of 5 months (Figure 1F). Leukemia was con firmed by accumulation of Mac1+Gr1+ cells in peripheral blood by flow cytometry (Online Supplementary Figure
S1B) and Wright-Giemsa staining of peripheral blood (On line Supplementary Figure S1C) from the Fanca-/- and MA9 leukemic mice. Thus, these data indicate that Trem1 is ex pressed in pre-leukemic HSC and LSC.
To further investigate the role of Trem1 in leukemogenesis, we employed CRISPR-Cas9 technology to generate a con ditional Trem1 knockout mouse strain (Trem1 fl/fl) (Online Supplementary Figure S2A). By using a previously de scribed Vav1Cre deleter strain,30 we were able to select ively ablate Trem1 expression in the hematopoietic compartment at both mRNA and protein levels (Online Supplementary Figure S2B-D).
To determine whether ablation of Trem1 affected normal hematopoiesis, we first analyzed blood counts, BM cellu larity, the frequency, and absolute numbers of total hema topoietic stem and progenitor cells (HSPC: LSK [Lin Sca1+c-Kit+] cells) and HSC (SLAM) in Trem1fl/flVav1Cre mice. We found no significant differences between Trem1fl/flVav1Cre mice and the Trem1fl/fl controls under ho meostatic conditions, as evidenced by comparable com plete blood counts (Figure 2A), total BM cell counts (Figure 2B) and flow cytometry-based phenotypic analysis of BM LSK and SLAM populations (Figure 2C). These data suggest that Trem1 is not required for the maintenance of normal hematopoiesis.
To determine HSPC proliferation, we sorted LSK cells from Trem1fl/flVav1Cre and the Trem1fl/fl control mice and per formed colony-forming-unit-cell (CFU-C) assays. We found that HSPC from Trem1fl/flVav1Cre and Trem1fl/fl control mice produced comparable CFU-C colonies (Figure 2D). Competitive in vivo transplantation assays showed no sig nificant differences in repopulating capacity between Trem1fl/flVav1Cre HSC and the Trem1fl/fl control HSC (Figure 2E). Contributions to myeloid and lymphoid lineages were also similar between Trem1fl/flVav1Cre and Trem1fl/fl HSC (Figure 2F). However, we observed that the repopulating capacity of Trem1fl/flVav1Cre HSC in secondary recipients was significantly higher than that of Trem1fl/fl HSC (Figure 2G). These data suggest that Trem1 deletion does not in fluence hematopoiesis under homeostatic conditions.
Trem1 expression in pre-leukemic hematopoietic stem cells and leukemic stem cells promotes leukemogenesis
To determine the role of Trem1 in leukemia development in vivo, we established three leukemogenic models (Figure 3A): (i) Fanca-/- leukemia expressing the conditional Trem1fl/fl; (ii) MA9 leukemia expressing the conditional Trem1fl/fl; and (iii) MA9 leukemia expressing the Trem1 pro tein. We then analyzed LSC expansion and leukemia de velopment in the transplanted recipients in the context of Trem1 expression. We found that deletion of Trem1 signifi
cantly reduced LSC-enriched donor
cells in the re cipient mice transplanted with LSK cells from Fanca-/;Trem1

Trem1 markedly prolonged the survival of the recipients transplanted with Fanca-/-;Trem1
controls
Consistently, ablation
Vav1Cre mice compared to those from the Fanca-/-;Trem1
Vav1Cre cells compared to those transplanted with the Fanca-/-;Trem1
control
Similar results were obtained with the re
Figure 1. Trem1 is expressed in pre-leukemic hematopoietic stem cells and leukemic stem cells. (A) Schematic presentation of the experimental design. (B) Aberrant Trem1 expression in Fanca-/- pre-leukemic hematopoietic stem cells (HSC). Wild-type (WT) and Fanca-/- mice were injected intraperitoneally with 0.3 mg/kg of mitomycin C (MMC) weekly for 6 weeks. RNA was extracted from SLAM cells isolated from the indicated mice followed by quantitative polymerase chain reaction (qPCR) analysis using the primers listed in Online Supplementary Table S1 (n=8-10 mice/group). (C) Increased Trem1-expressing HSC in Fanca-/- preleukemic mice. Left: representative flow cytometry analysis of percentages of bone marrow Trem1+ SLAM cells in the mice described in (B). Right: quantification (n=8-10 mice/group). (D) Increased Trem1 expression in leukemia stem cells (LSC) from Fanca-/- leukemic mice. FACS-isolated LSK cells from the mice described in (B) were subjected to two rounds of bone marrow transplantation (BMT) to establish Fanca-/- leukemia in secondary transplanted recipient mice. Donor-derived SLAM cells were isolated from the secondary recipients and subjected to qPCR analysis for Trem1 expression (n=12 mice/group). (E) Quantification of flow cytometry analysis of percentages of bone marrow Trem1+ SLAM cells in the secondary recipients (n=12 mice/group). (F) Progressive increase in Trem1 expression in MLL-AF9 (MA9) LSC. Bone marrow c-Kit+ cells from 1- to 5-month-old MA9 mice were subjected to qPCR for Trem1 expression. WT mice were used as controls (n=6 mice/group).
cipients transplanted with donor cells from leukemic MA9 mice at the age of 5 months old (when the mice develop AML),29 in which deletion of Trem1 significantly reduced LSC-enriched CD45.2+c-Kit+ cells in the recipients trans planted with cells from 5-month-old MA9;Trem1fl/flVav1cre mice compared to those in the recipients transplanted with cells from age-matched MA9;Trem1fl/fl mice (Figure 3D). Consequently, ablation of Trem1 greatly extended la tency in the recipients of MA9;Trem1fl/flVav1cre cells com pared to those of MA9;Trem1fl/fl cells (Figure 3E).
To compare the ability of Trem1+ and Trem1 pre-leukemic HSC to induce leukemia, we purifi ed Trem1+SLAM and Trem1 -SLAM cells from Fanca-/- pre-leukemic mice (On line Supplementary Figure S3A), and performed serial BMT. We found that although all primary recipients survived for more than 12 months without signs of leukemia, the re cipients transplanted with Trem1+ HSC exhibited donor BM hypercellularity (Online Supplementary Figure S3B) and in creased accumulation of donor-derived phenotypic HSC in the BM (Online Supplementary Figure S3C). Furthermore,

Figure 2. Deletion of Trem1 does not alter steady-state hematopoiesis. (A) Complete blood count of 8-week-old Trem1
Vav1Cre mice and the Trem1
controls (n=7-8 mice). (B) Whole bone marrow cell (WBMC) counts (n=7-8 mice). (C) Bone marrow LSK and SLAM cell counts (n=7-8), and (D) colony-forming cell (CFC) counts are shown for the Trem1
Vav1Cre mice and the Trem1
controls (n=6 mice). (E) Deletion of Trem1 does not affect hematopoietic repopulation in primary transplant recipients. One hundred SLAM cells from Trem1
controls were transplanted, along with 2x10⁵ competitor cells from congenic mice, into lethally irradiated BoyJ recipients. Donor-derived chimerism was determined by flow cytometry of peripheral blood (PB) at different time points after bone marrow transplantation (BMT) (n=10 mice). (F) Deletion of Trem1 does not affect multi-lineage reconstitution in primary transplant recipients. Percentages of donor-derived myeloid, T, and B cells were measured by flow cytometry 16 weeks after BMT (n=10 mice). (G) Deletion of Trem1 increases long-term hematopoietic repopulation. One to three million WBMC from the primary recipients were pooled and injected into sublethally irradiated BoyJ recipients. Donor-derived chimerism was determined by flow cytometry at different time points after BMT (n=12 mice).
Vav1Cre mice and Trem1
the secondary recipients of Trem1+ cohorts gave rise to lethal leukemias within 100 days, while the majority of re cipients transplanted with Trem1 cells survived over 100 days after BMT (Online Supplementary Figure S3D). Leuke mia was confirmed by accumulation of Mac1+Gr1+CD45.2+ cells in peripheral blood (Online Supplementary Figure S3E) and Wright-Giemsa staining of peripheral blood (On line Supplementary Figure S3F). These data indicate that Trem1+ pre-leukemic HSC have greater leukemogenic po tential than that of Trem1 pre-leukemic HSC.

To substantiate the observation that Trem1 promotes leukemia, we transduced c-kit+ cells from MA9 mice at the age of 2 months, at which time Trem1 expression is not detectable (see Figure 1F above), with a lentiviral vec tor expressing eGFP or eGFP-Trem1 (Figure 3A). We achieved >5-fold higher Trem1 expression in GFP-Trem1 cells than in eGFP control cells (Online Supplementary Fig ure S4A, B). Remarkably, overexpression of Trem1 greatly increased LSC-enriched CD45.2+c-Kit+ cells in the recipi ents transplanted with eGFP-Trem1-transduced MA9 cells
Figure 3. Trem1 expression in pre-leukemic hematopoietic stem cells and leukemic stem cells promotes leukemogenesis. (A) Schematic presentation of the experimental design. (B) Deletion of Trem1 suppresses Fanca-/- leukemic stem cell (LSC) expansion in transplant recipient mice. LSK cells from Fanca-/-;Trem1
Vav1Cre mice and the Fanca-/-;Trem1fl/
controls subjected to 6 weeks of treatment with mitomycin C (MMC) were transplanted, along with 2x10⁵ competitor cells from congenic mice, into lethally irradiated BoyJ recipients. Donor-derived CD45.2+ SLAM cells were analyzed by flow cytometry 4 weeks after bone marrow transplantation (BMT) (n=10 mice). (C) Deletion of Trem1 extends the latency of Fanca-/- leukemia. Survival of the recipient mice groups described in (B) was monitored and plotted by the Kaplan-Meier method (n=9-10 mice/group). (D) Ablation of Trem1 suppresses MLL-AF9 LSC expansion in transplant recipients. Bone marrow c-Kit+ cells from MLL-AF9;Trem1
Vav1Cre mice and the MLL-AF9;Trem1
controls were transplanted, along with 2x10⁵ competitor cells from congenic mice, into lethally irradiated BoyJ recipients. Donor-derived CD45.2+c-Kit+ cells were analyzed by flow cytometry 4 weeks after BMT (n=10 mice). (E) Ablation of Trem1 extends the latency of MLL-AF9 leukemia. Survival of the recipient mice groups described in (D) was monitored and plotted by Kaplan-Meier method (n=10-11 mice/group). (F) Forced expression of Trem1 increases MLL-AF9 LSC expansion in transplant recipients. Bone marrow c-Kit+ cells from 2-month-old MLL-AF9 mice were transduced with lentiviral vector expressing eGFP-Trem1 or eGFP alone. The transduced GFP+ cells were transplanted, along with 2x10⁵ competitor cells from congenic mice, into lethally irradiated BoyJ recipients. Donor-derived GFP+ c-Kit+ cells were analyzed by flow cytometry 4 weeks after BMT (n=10 mice). (G) Forced expression of Trem1 shortens the latency of MLL-AF9 leukemia. Survival of the recipient mice groups described in (F) was monitored and plotted by the Kaplan-Meier method (n=10-13 mice). (B & C): the Fanca-/leukemia model; (D & E) the MA9 model; and (F & G) the MA9+ Trem1 model.
compared to the recipients transplanted with eGFP con trol cells (Figure 3F). Consistently, overexpression of Trem1 markedly shortened latency in the recipients of GFPTrem1-transduced MA9 cells compared to the latency in recipients of eGFP control cells (Figure 3G). Together,
these data suggest that Trem1 expression in pre-leukemic HSC and LSC promotes leukemogenesis.

Figure 4. Trem1 expression in pre-leukemic hematopoietic stem cells and leukemic stem cells is associated with increased proliferation. (A) Deletion of Trem1 reduces myeloid colony formation by Fanca-/- leukemia stem cell (LSC)-enriched donor LSK cells. LSK cells from Fanca-/-;Trem1
Vav1Cre mice and the Fanca-/-;Trem1
controls subjected to 6 weeks of treatment with mitomycin C (MMC) were transplanted, along with 2x10⁵ competitor cells from congenic mice, into lethally irradiated BoyJ recipients. Donor-derived CD45.2+LSK cells were subjected to colony-forming unit (CFU) assays 4 weeks after bone marrow transplantation (BMT) (n=6 mice). (B) Deletion of Trem1 reduces Ki67+ proliferating Fanca-/- LSC-enriched donor LSK cells. The CD45.2+LSK cells from the recipient mice in (A) were gated for Ki67-positive nuclear stain. Representative flow cytometry (left) and quantification (right) are shown (n=6 mice). (C) Ablation of Trem1 reduces myeloid colony formation by MLL-AF9 LSCenriched donor c-Kit+ cells. Bone marrow c-Kit+ cells from MLL-AF9;Trem1fl/flVav1Cre mice and the MLL-AF9;Trem1fl/fl controls were transplanted, along with 2x10⁵ competitor cells from congenic mice, into lethally irradiated BoyJ recipients. Donor-derived CD45.2+c-Kit+ cells were subjected to CFU assays 4 weeks after BMT (n=6 mice). (D) Ablation of Trem1 reduces Ki67-positive proliferating MLL-AF9 LSC-enriched donor c-Kit+ cells. The CD45.2+c-Kit+ cells from the recipient mice in (C) were gated for Ki67positive nuclear stain (n=8-9 mice). (E) Deletion of Trem1 does not increase apoptosis in Fanca-/- LSC-enriched donor LSK cells. The CD45.2+LSK cells from the recipient mice in (A) were gated for annexin V-positive staining. Representative flow cytometry (left) and quantification (right) are shown (n=6 mice). (F) Deletion of Trem1 does not increase apoptosis in MLL-AF9 LSC-enriched donor c-Kit+ cells. The CD45.2+c-Kit+ cells from the recipient mice in (C) were gated for annexin V-positive staining (n=7-8 mice). (G) Ablation of Trem1 does not render Fanca-/- LSC-enriched donor LSK cells or MLL-AF9 LSC-enriched donor c-Kit+ cells more sensitive to growth factor-deprived conditions. The CD45.2+LSK cells from the recipient mice in (A) or the CD45.2+c-Kit+ cells from the recipient mice in (C) were cultured in serum-free StemCell medium supplemented with stem cell factor, Flt3 ligand and thrombopoietin for 72 h followed by factor withdrawal. Cell viability was determined by absorbance using a CellTiter 96 Aqueous One Solution Cell Proliferation (MTS) assay after factor withdrawal for 24 h (n=6-8 assays).
Trem1 expression in pre-leukemic hematopoietic stem cells and leukemic stem cells is associated with increased proliferation but has no effect on sensitivity to apoptosis To explore the underlying mechanism by which Trem1 promotes leukemogenesis, we next examined the rates of proliferation and apoptosis in the LSC-enriched donor cells from the leukemic mice transplanted with cells from Fanca -/- ;Trem1 fl/flVav1Cre or MA9;Trem1 fl/flVav1Cre mice, 4 weeks after transplantation. We found that dele tion of Trem1 significantly reduced myeloid colony forma tion by CD45.2 + LSK cells from the leukemic mice transplanted with the Fanca-/-;Trem1fl/flVav1Cre cells com pared to those of Fanca-/-;Trem1fl/fl control cells, as de termined by CFU assay (Figure 4A). Furthermore, there was a lower percentage of proliferating (Ki67-positive) CD45.2+LSK cells from the leukemic mice transplanted with the Fanca-/-;Trem1fl/flVav1Cre cells compared to those of Fanca-/-;Trem1fl/fl control cells, as determined by nu clear Ki67 staining (Figure 4B). We obtained similar re sults in the experiments with the MA9;Trem1 fl/flVav1Cre and MA9;Trem1 fl/fl leukemic cells, in which ablation of Trem1 significantly inhibited the proliferation of the LSCenriched CD45.2 + c-kit + cells (Figure 4C, D). However, deletion of Trem1 did not significantly increase apoptosis in the leukemia from Fanca -/- ;Trem1 fl/flVav1Cre pre-leu kemic cells or MA9;Trem1 fl/flVav1Cre leukemic cells, as compared to those from Fanca-/-;Trem1fl/fl or MA9;Trem1fl/fl control cells, respectively (Figure 4E, F). Furthermore, ablation of Trem1 did not render either Fanca-/- or MA9 leukemic cells more sensitive to growth factor-deprived culture conditions, as detected by MTS assay (Figure 4G). Taken together, these results indicate that Trem1 pro motes leukemic cell proliferation but has limited effect on apoptosis sensitivity.
Trem1 expression in pre-leukemic hematopoietic stem cells and leukemic stem cells is associated with persistent DNA damage and prolonged oncogenic stress Since our previous studies demonstrated that Trem1 co operates with diminished DDR in pre-leukemic HSC ex pansion,14 we asked whether Trem1 expression in Fanca-/pre-leukemic HSC was associated with persistent DNA damage. To this end, we treated the SLAM cells from WT and pre-leukemic Fanca-/- mice with MMC in culture for 2 h and performed flow cytometry analysis for g -H2AX, an established marker of double-strand breaks,31 at dif ferent times after treatment. We found that MMC induced robust expression of g-H2AX at 4 h after treatment in both Fanca -/- and WT cells; however, WT cells efficiently re paired double-strand breaks, as evidenced by a progress ive decline of g -H2AX within 16 h after MMC treatment (Figure 5A). In contrast, the MMC-treated Fanca-/- cells re tained high levels of g-H2AX throughout the 16-h period (Figure 5A), indicative of persistent DNA damage. Cor related with this DNA damage kinetics, Trem1 expression was persistently elevated during the 8- to 16-h period of observation in Fanca-/- cells, whereas Trem1 expression re mained undetectable in WT cells (Figure 5B). Next, we investigated whether prolonged oncogenic stress could also lead to aberrant expression of Trem1 in LSC. We utilized two leukemia models, MLL-AF9 and KrasG12D, to in duce prolonged oncogenic stress in vitro. For the MLL-AF9 model, we infected WT LSK cells with a retroviral vector expressing eGFP-MLL-AF9 or eGFP alone, and subjected the transduced cells to culture in growth factor-supple mented medium for different periods of time. We ob served persistent elevation of Trem1 expression during 4 to 12 days of culture in cells expressing MLL-AF9, whereas Trem1 expression remained undetectable in those ex pressing eGFP alone (Figure 5C). For the KrasG12D model,
Figure 5. Trem1 expression in pre-leukemic hematopoietic stem cells and leukemic stem cells is associated with persistent DNA damage and prolonged oncogenic stress. (A) Persistent DNA damage in Fanca-/- pre-leukemic hematopoietic stem cells (HSC). LSK cells from wild-type (WT) and pre-leukemic Fanca-/- mice were treated with mitomycin C (MMC) in culture for 2 h and analyzed by flow cytometry for g-H2AX at different time points after treatment. Representative flow plots (left) and mean fluorescence intensity (MFI) kinetics (right) are shown. 0 h: untreated control (n=6 experiments). (B) Trem1 expression is specifically induced by persistent DNA damage in Fanca-/- pre-leukemic HSC. RNA was then extracted from the cells described in (A) and subjected to quantitative polymerase chain reaction (qPCR) analysis for Trem1 expression using the primers listed in Online Supplementary Table S1. Samples were normalized to the level of GAPDH mRNA (n=6 assays/group). **MMC vs. untreated control (0 h). (C) Prolonged oncogenic stress induces Trem1 expression in MLL-AF9 leukemic stem cell (LSC)-enriched cells. WT LSK cells were transduced with retroviral vector expressing eGFP-MLL-AF9 or eGFP alone, and the transduced cells were subjected to culture in growth factor-supplemented medium. RNA was then extracted from the sorted GFP+ LSK cells at different time points followed by qPCR analysis for Trem1 expression. Samples were normalized to the level of GAPDH mRNA (n=6 assays). (D) Prolonged oncogenic stress induces Trem1 expression in KrasG12D LSC-enriched cells. LSK cells from KrasG12DCreER and KrasG12D control mice were cultured in growth factors-supplemented medium in the presence of 4-OHT. RNA was then extracted from the sorted LSK cells at different time points followed by qPCR analysis for Trem1 expression. Samples were normalized to the level of GAPDH mRNA (n=6 assays).
we isolated LSK cells from KrasG12DCreER mice and cul tured the cells in growth factor-supplemented medium in the presence of 4-hydroxytamoxifen (4-OHT; to induce Cre-mediated expression of KrasG12D) for different periods of time. We found that prolonged treatment of the KrasG12DCreER cells with 4-OHT induced a persistent in crease in Trem1 expression during 3 to 9 days of culture, as compared to negligible Trem1 expression in the cells cultured in the absence of 4-OHT (Figure 5D). These re sults indicate that prolonged oncogenic stress induces aberrant expression of Trem1 in LSC-enriched leukemic cells.

Trem1 expression in pre-leukemic hematopoietic stem cells and leukemic stem cells is associated with enhanced inflammation
Inflammation is a key feature of leukemia.32,33 TREM1 is known to trigger and amplify inflammatory responses.1,2 To
explore the relationship between Trem1, inflammation and leukemia progression, we measured 248 inflammation-re lated genes using an nCounter Mouse Inflammation multi plex panel. We observed 20 significantly dysregulated genes in LSK cells of pre-leukemic Fanca-/-;Trem1fl/fl mice compared to those from LSK cells from Fanca-/;Trem1
/flVav1Cre mice (Figure 6A); and in 5-month-old MA9;Trem1
mice compared with those of age-matched MA9;Trem1
Vav1Cre mice (Figure 6A).
Among the top five upregulated inflammatory genes, we noted that Ccr1, Il1r1, Nlrp3 and Tlr2 were upregulated in both Fanca-/- and MA9 cells (Online Supplementary Figure S5A, B). CCR1 and its ligand CCL3 have recently been shown to promote leukemogenesis.34 IL1R1 and NLRP3 are key components of the NLPR3 inflammasome, which plays important roles in hematologic malignancies.35 Increased expression of Toll-like receptor 2 (TLR2) and its functional binding partners, TLR1 and TLR6, is found in patients with
Figure 6. Trem1 expression in pre-leukemic hematopoietic stem cells and leukemic stem cells is associated with enhanced in
ammation.
In
ammatory gene
mice compared with those of Fanca-/-;Trem1fl/
NanoString
LSK cells of pre-leukemic Fanca-/-;Trem1
(Trem1WT
assays;
and LSK cells of MA9;Trem1
Trem1-WT
with
expressed
Fanca-/-;Trem1
assays; right). Heatmap of in
ammatory genes (log2 fold change;
Fanca-/-;Trem1
Vav1Cre cells or MA9;Trem1
and MA9;Trem1
Vav1Cre cells.
Blockade of CCR1, IL1R1, NLPR3, or TLR2 reduces colony formation of Fanca-/- and MA9 leukemic cells. LSK cells from Fanca-/- pre-leukemic mice or 5-month-old MA9 mice were cultured in the presence of BX471, AF12198, oridonin, or anti-TLR2 antibodies for 5 days after which colony-froming unit-cell (CFU-C) assays were performed (n=6 assays). (C) Blockade of CCR1, IL1R1, NLPR3, or TLR2 suppresses the expansion of Fanca-/- and MA9 leukemic stem cells (LSC). The cultured cells described in (B) were transplanted, along with 2x10⁵ protector cells from congenic mice, into lethally irradiated recipients. Donor-derived CD45.2+LSK cells from the recipient mice were analyzed 4 months after bone marrow transplantation (BMT) by
ow cytometry (n=10 mice). (D) Blockade of CCR1, IL1R1, NLPR3, or TLR2 inhibited the proliferation of Fanca-/- and MA9 LSC. The recipient mice described in (C) were analyzed for Ki67+ CD45.2+LSK cells 4 months after BMT by flow cytometry (n=10 mice).

myelodysplastic syndromes.36 Recent studies showed that overall survival of AML patients with higher TLR2 ex pression was significantly shorter than that of patients with lower expression.37 To investigate the functional rel evance of these TREM1-inflammation signatures in the ex pansion of Fanca-/- and MA9 leukemic cells, we performed blockade experiments using the CCR1 antagonist, BX471,38 the IL-1R antagonist, AF12198,39 the covalent inhibitor for NLRP3,40 or the neutralizing antibody against TLR2.41 LSK cells of pre-leukemic Fanca-/- mice and 5-month-old MA9 mice were cultured in growth factor-supplemented medium in the presence of neutralizing antibodies for 5 days, followed by CFU and BMT assays. We found that blockade of CCR1, the NLPR3 inflammasome, or TLR2 sig nificantly reduced myeloid colony formation of both Fanca-/- and MA9 leukemic cells (Figure 6B), indicating that these Trem1 inflammation signatures promote the prolif eration of Fanca-/- and MA9 leukemic cells. To substantiate these findings, we transplanted the cul tured cells, along with 2x10⁵ protector cells from congenic mice, into lethally irradiated recipients. We observed sig nificant reduction of LSC-enriched donor cells in the re cipient mice transplanted with Fanca-/- and MA9 leukemic cells cultured in the presence of neutralizing antibodies, compared to those cultured in the absence of neutralizing antibodies (Figure 6C). Furthermore, there were signifi cantly fewer proliferating (Ki67-positive) donor-derived LSC-enriched CD45.2+LSK cells in the recipient mice transplanted with Fanca-/- and MA9 leukemic cells treated with neutralizing antibodies compared to the untreated control cells (Figure 6D). These data suggest that targeting Trem1 inflammation signatures could suppress the expan sion of Fanca-/- and MA9 LSC.
The immune system, consisting of immune cells, immune factors, and the immune microenvironment, plays essential roles in tumorigenesis.42 The multifaceted effects of tumorrelated immunity include destroying genome stability, gen erating genetic modification, promoting the proliferation of cancer cells, stimulating angiogenesis, and shaping the tumor microenvironment.43 In this study, we showed that one such immune factor, Trem1, is induced by persistent DNA damage and oncogenic stress and promotes leukemo genesis. Using our established Fanca-/- pre-leukemic model and the MLL-AF9 AML model, we demonstrated that Trem1 is highly expressed in pre-leukemic HSC and LSC. More over, we generated an innovative conditional Trem1 knock out mouse model to show that selective ablation of Trem1 in the hematopoietic compartment significantly extended leukemic latency in mice, and that Trem1 was required for the proliferation of the pre-leukemic HSC and LSC. Our
study thus provides new insights into the role of TREM1 in leukemogenesis.
TREM1 is constitutively expressed on a select group of mye loid cells including macrophages, monocytes and neutro phils in peripheral blood.44,45 It has also been identified on airway epithelial cells, hepatic endothelial cells and liver résident macrophages, natural killer cells, dendritic cells, as well as B and T cells.5,45-47 TREM1 belongs to the immu noglobulin superfamily and is engaged in amplifying inflam matory cascades.48,49 It can be induced at high levels on neutrophils and monocytes and further amplifies TLR-initi ated responses against microbial challenges, potentiating the secretion of pro-inflammatory cytokines with the help of DAP12 adaptor protein in response to bacterial and fun gal infections.50-52 Although high-mobility group box 1 (HMGB1) and peptidoglycan recognition protein 1 (PGLYRP1) were shown to associate with TREM1, the ligand for TREM1 remains to be characterized.53,54 A growing body of evidence suggests that TREM1 plays critical pathological roles in chronic inflammatory disorders including cancer.2 In fact, novel TREM1 inhibitors are being shown to attenuate tumor growth and prolong survival in experimental cancer models.8 By employing three leukemogenic mouse models (a DNA damage-induced Fanca-/- pre-leukemic model, an oncogenic MLL-AF9 transgenic model, and a KrasG12DCreER model) we showed that Trem1 was highly expressed in preleukemic HSC and LSC, and dysregulated expression of Trem1 in these malignant stem cells, enhancing their leuke mogenic potential. Conversely, deletion of Trem1 in these pre-leukemic HSC and LSC compromised proliferation and delayed leukemia development in vivo. It is in this context that our study provides new insights into the current understanding of a pathological role for TREM1 in cancer. One intriguing finding of our current study is the observa tion that Trem1 expression is induced both by persistent DDR and oncogenic stress. Genomic instability, found in most cancers, is considered one of the hallmark character istics of cancer cells. It is regarded as a major driver of tu morigenicity.55 The FA DNA repair pathway consists of a protein core complex that recognizes damage caused by inter-strand crosslinks, and a multi-subunit ubiquitin ligase that monoubiquitinates downstream DNA repair factors.56 Our previous studies showed that chronic DNA damage stress could transform Fanca-/- HSC into pre-leukemic stem cells possessing leukemogenic activity in trans planted recipients.14 Oncogene-induced replication stress and its role in cancer development have been studied com prehensively. Oncogene activation is an endogenous source of replication stress, disrupting replication regulation and inducing DNA damage.55 Our current study shows that both could induce the expression of Trem1, which is required for maintaining the leukemogenic activity of the pre-leukemic HSC and LSC. Although further mechanistic investigation remains needed, it is in this context that our study unveils
for the first time an immune receptor linking leukemogen esis to multiple detrimental cellular stresses; that is, per sistent DNA damage, prolonged oncogenic stress and an aberrant immune response.
Another notable finding of the present study is that the up regulated Trem1 expression in pre-leukemic HSC and LSC is associated with enhanced inflammation. Certain chronic inflammatory conditions have long been known to be linked to cancer.32,33 Mounting evidence supports that chronic in flammation increases the risk of various human cancers.5761 In these pathological conditions, unresolved inflammation provokes cell turnover coupled with the generation of re active oxygen species at the sites of inflammation, leading to chromosomal DNA mutations and malignant transforma tion.62, 63 Our current studies established a link between persistent DNA damage, prolonged oncogenic stress and enhanced inflammation. While awaiting further mechanistic insights, our finding that upregulated Trem1 expression en hances inflammation in pre-leukemic HSC and LSC, high lights the crucial role of inflammation in leukemia development.
No conflicts of interest to disclose.
XL performed the research and analyzed the data; SC, AW, LW, and NA performed some of the research and assisted with the data analysis. WD designed the research, analyzed the data, and wrote the paper.
We thank Dr. Madeleine Carreau (Laval University) for the Fanca+/- mice, and the Transgenic core facility at Cincinnati Children’s Hospital Medical Center for generating the Trem1fl/fl mice. We thank Fabliha Chowdhury for technical support for some supplementary figures.
This work was supported by an NIH/National Heart, Lung, and Blood Institute grant (R01HL151390 to WD). This project used the Hillman Animal Facility that is supported in part by award P30CA047904. WD is a 2021-2022 Hillman Senior Fellow for Innovative Cancer Research at the University of Pittsburgh.
1. Roe K, Gibot S, Verma S. Triggering receptor expressed on myeloid cells-1 (TREM-1): a new player in antiviral immunity? Front Microbiol. 2014;5:627.
2. Yuan Z, Mehta HJ, Mohammed K, et al. TREM-1 is induced in tumor associated macrophages by cyclo-oxygenase pathway in human non-small cell lung cancer. PLoS One. 2014;9(5):e94241.
3. Zou W. Immunosuppressive networks in the tumour environment and their therapeutic relevance. Nat Rev Cancer. 2005;5(4):263-274.
4. Saurer L, Zysset D, Rihs S, et al. TREM1 promotes intestinal tumorigenesis. Sci Rep. 2017;7(1):14870.
5. Wu J, Li J, Salcedo R, Mivechi NF, Trinchieri G, Horuzsko A. The proinflammatory myeloid cell receptor TREM-1 controls Kupffer cell activation and development of hepatocellular carcinoma. Cancer Res. 2012;72(16):3977-3986.
6. Ho CC, Liao WY, Wang CY, et al. TREM-1 expression in tumorassociated macrophages and clinical outcome in lung cancer. Am J Respir Crit Care Med. 2008;177(7):763-770.
7. Cioni B, Zaalberg A, van Beijnum JR, et al. Androgen receptor signalling in macrophages promotes TREM-1-mediated prostate cancer cell line migration and invasion. Nat Commun. 2020;11(1):4498.
8. Shen ZT, Sigalov AB. Novel TREM-1 inhibitors attenuate tumor growth and prolong survival in experimental pancreatic cancer. Mol Pharm. 2017;14(12):4572-4582.
9. Sigalov AB. A novel ligand-independent peptide inhibitor of TREM-1 suppresses tumor growth in human lung cancer xenografts and prolongs survival of mice with lipopolysaccharide-induced septic shock. Int Immunopharmacol. 2014;21(1):208-219.
10. Chandrashekar DS, Bashel B, Balasubramanya SAH, et al. UALCAN: a portal for facilitating tumor subgroup gene expression and survival analyses. Neoplasia. 2017;19(8):649-658.
11. Ciccia A, Elledge SJ. The DNA damage response: making it safe to
play with knives. Mol Cell. 2010;40(2):179-204.
12. Pan MR, Li K, Lin SY, Hung WC. Connecting the dots: from DNA damage and repair to aging. Int Mol Sci. 2016;17(5):685.
13. Biechonski S, Yassin M, Milyavsky M. DNA-damage response in hematopoietic stem cells: an evolutionary trade-off between blood regeneration and leukemia suppression. Carcinogenesis. 2017;38(4):367-377.
14. Du W, Amarachintha S, Wilson A, Pang Q. The immune receptor Trem1 cooperates with diminished DNA damage response to induce preleukemic stem cell expansion. Leukemia. 2017;31(2):423-433.
15. Blasco RB, Francoz S, Santamaría D, et al. c-Raf, but not B-Raf, is essential for development of K-Ras oncogene-driven non-small cell lung carcinoma. Cancer Cell. 2011;19(5):652-663.
16. Braig M, Pällmann N, Preukschas M, et al. A ‘telomere-associated secretory phenotype’ cooperates with BCR-ABL to drive malignant proliferation of leukemic cells. Leukemia. 2014;28(10):2028-2039.
17. Halazonetis TD, Gorgoulis VG, Bartek J. An oncogene-induced DNA damage model for cancer development. Science. 2008;319(5868):1352-1355.
18. Strasser A, Harris AW, Bath ML, Cory S. Novel primitive lymphoid tumours induced in transgenic mice by cooperation between myc and bcl-2. Nature. 1990;348(6299):331-333.
19. Prange KHM, Mandoli A, Kuznetsova T, et al. MLL-AF9 and MLL-AF4 oncofusion proteins bind a distinct enhancer repertoire and target the RUNX1 program in 11q23 acute myeloid leukemia. Oncogene. 2017;36(23):3346-3356.
20. Corral J, Lavenir I, Impey H, et al. An Mll-AF9 fusion gene made by homologous recombination causes acute leukemia in chimeric mice: a method to create fusion oncogenes. Cell. 1996;85(6):853-861.
21. Hamarsheh S, Osswald L, Saller BS, et al. Oncogenic KrasG12D causes myeloproliferation via NLRP3 inflammasome activation. Nat Comm. 2020;11(1):1659.
22. Neubauer A, Dodge RK, George SL, et al. Prognostic importance of mutations in the ras proto-oncogenes in de novo acute myeloid leukemia. Blood. 1994;83(6):1603-1611.
23. Merlevede J, Droin N, Qin T, et al. Mutation allele burden remains unchanged in chronic myelomonocytic leukaemia responding to hypomethylating agents. Nat Commun. 2016;24:10767.
24. Farr C, Gill R, Katz F, Gibbons B, Marshall CJ. Analysis of ras gene mutations in childhood myeloid leukaemia. Br J Haematol. 1991;77(3):323-332.
25. Wong JC, Alon N, Mckerlie C, Huang JR, Meyn MS, Buchwald M. Targeted disruption of exons 1 to 6 of the Fanconi anemia group A gene leads to growth retardation, strain-specific microphthalmia, meiotic defects and primordial germ cell hypoplasia. Hum Mol Genet. 2003;12(16):2063-2076.
26. Johnson L, Mercer K, Greenbaum D, et al. Somatic activation of the K-ras oncogene causes early onset lung cancer in mice. Nature. 2001;410(6832):1111-1116.
27. Ventura A, Kirsch DG, McLaughlin ME, et al. Restoration of p53 function leads to tumour regression in vivo. Nature. 2007;445(7128):661-665.
28. Madisen L, Zwingman TA, Sunkin SM, et al. A robust and highthroughput Cre reporting and characterization system for the whole mouse brain. Nat Neurosci. 2010;13(1):133-140.
29. Somervaille TCP, Cleary ML. Identification and characterization of leukemia stem cells in murine MLL-AF9 acute myeloid leukemia. Cancer Cell. 2006;10(4):257-268.
30. Ma Z, Xu J, Wu L, et al. Hes1 deficiency causes hematopoietic stem cell exhaustion. Stem Cells. 2020;38(6):756-768.
31. Li X, Sipple J, Pang Q, Du W. Salidroside stimulates DNA repair enzyme Parp-1 activity in mouse HSC maintenance. Blood. 2012;119(18):4162-4173.
32. Craver BM, Alaoui KE, Scherber RM, Fleischman AG. The critical role of inflammation in the pathogenesis and progression of myeloid malignancies. Cancers (Basel). 2018;10(4):104.
33. Vilchis-Ordonez A, Ramirez-Ramirez D, Pelayo R. The triad inflammation-microenvironment-tumor initiating cells in leukemia progression. Curr Opin Physiol. 2021;19:211-218.
34. Baba T, Naka K, Morishita S, Komatsu N, Hirao A, Mukaida N. MIP1α/CCL3-mediated maintenance of leukemia-initiating cells in the initiation process of chronic myeloid leukemia. J Exp Med. 2013;210(12):2661-2673.
35. Zhong C, Wang R, Hua M, et al. NLRP3 inflammasome promotes the progression of acute myeloid leukemia via IL-1β pathway. Front Immunol. 2021;12:661939.
36. Wei Y, Dimicoli S, Bueso-Ramos C, et al. Toll-like receptor alterations in myelodysplastic syndrome. Leukemia. 2013;27(9):1832-1840.
37. Rybka J, Butrym A, Wróbel T, et al. The expression of toll-like receptors in patients with acute myeloid leukemia treated with induction chemotherapy. Leuk Res. 2015;39(3):318-322.
38. Strasly M, Doronzo G, Cappello P, et al. CCL16 activates an angiogenic program in vascular endothelial cells. Blood. 2004;103(1):40-49.
39. Li S, Kang P, Zhang W, et al. Activated NLR family pyrin domain containing 3 (NLRP3) inflammasome in keratinocytes promotes cutaneous T-cell response in patients with vitiligo. J Allergy Clin Immunol. 2020;145(2):632-645.
40. He H, Jiang H, Chen Y, et al. Oridonin is a covalent NLRP3 inhibitor with strong anti-inflammasome activity. Nat Commun. 2018;9(1):2250.
41. Komai-Koma M, Li D, Wang E, Vaughan D, Xu D. Anti-Toll-like receptor 2 and 4 antibodies suppress inflammatory response in mice. Immunology. 2014;143(3):354-362.
42. Sima P, Vannucci L, Vetvicka V. Immunity in cancer and
atherosclerosis. Ann Transl Med. 2019;7(9):204
43. Gonzalez H, Hagerling C, Werb Z. Roles of the immune system in cancer: from tumor initiation to metastatic progression. Genes Dev. 2018;32(19-20):1267-1284.
44. Bouchon A, Facchetti F, Weigand MA, Colonna M. TREM-1 amplifies inflammation and is a crucial mediator of septic shock. Nature. 2001;410(6832):1103-1107.
45. Matesanz-Isabel J, Sintes J, Llinas L, de Salort J, Lazaro A, Engel P. New B-cell CD molecules. Immunol Lett. 2011;134(2):104-112.
46. Chen CH, Liao H, Chen HA, Liang TH, Wang CT. Soluble triggering receptor expressed on myeloid cell-1 (sTREM-1): a new mediator involved in early ankylosing spondylitis. J Rheumatol. 2008;35(9):1846-1848.
47. Rigo I, McMahon L, Dhawan P, et al. Induction of triggering receptor expressed on myeloid cells (TREM-1) in airway epithelial cells by 1,25(OH)2 vitamin D3 Innate Immun. 2012;18(2):250-257.
48. Bouchon A, Dietrich J, Colonna M. Cutting edge: inflammatory responses can be triggered by TREM-1, a novel receptor expressed on neutrophils and monocytes. J Immunol. 2000;164(10):4991-4995.
49. Fu L, Han L, Xie C, et al. Identification of extracellular actin as a ligand for triggering receptor expressed on myeloid cells-1 signaling. Front Immunol. 2017;8:917.
50. Bouchon A, Facchetti F, Weigand MA, Colonna M. TREM-1 amplifies inflammation and is a crucial mediator of septic shock. Nature. 2001;410(6832):1103-1107.
51. Colonna M, Facchetti F. TREM-1 (triggering receptor expressed on myeloid cells): a new player in acute inflammatory responses. J Infect Dis. 2003;187(Suppl 2):S397-401.
52. Dower K, Ellis DK, Saraf K, Jelinsky SA, Lin LL. Innate immune responses to TREM-1 activation: overlap, divergence, and positive and negative crosstalk with bacterial lipopolysaccharide. J Immunol. 2008;180(5):3520-3534.
53. Wu J, Li J, Salcedo R, et al. The proinflammatory myeloid cell receptor TREM-1 controls Kupffer cell activation and development of hepatocellular carcinoma. Cancer Res. 2012;72(16):3977-3986.
54. Read CB, Kuijper JL, Hjorth SA, et al. Cutting edge: identification of neutrophil PGLYRP1 as a ligand for TREM-1. J Immunol. 2015;194(4):1417-1421.
55. Sarni D, Kerem B. Oncogene-induced replication stress drives genome instability and tumorigenesis. Int J Mol Sci. 2017;18(7):1339.
56. Walden H, Deans AJ. The Fanconi anemia DNA repair pathway: structural and functional insights into a complex disorder. Annu Rev Biophys. 2014;43:257-278.
57. Kuper H, Adami HO, Trichopoulos D. Infections as a major preventable cause of human cancer. J Intern Med. 2000;248(3):171-183.
58. Mackay IR, Rose NR. Autoimmunity and lymphoma: tribulations of B cells. Nat Immunol. 2001;2(9):793-795.
59. Suematsu N, Tsutsui H, Wen J, et al. Oxidative stress mediates tumor necrosis factor-alpha-induced mitochondrial DNA damage and dysfunction in cardiac myocytes. Circulation. 2003;18;107(10):1418-1423.
60. Umeda T, Hino O. Molecular aspects of human hepatocarcinogenesis mediated by inflammation: from hypercarcinogenic state to normo- or hypocarcinogenic state. Oncology. 2002;62 (Suppl 1):38-42.
61. Ekbom A, Helmick C, Zack M, Adami HO. Ulcerative colitis and colorectal cancer. A population-based study. N Engl J Med. 1990;323(18):1228-1233.
62. Ames BN, Gold LS, Willett WC. The causes and prevention of cancer. Proc Natl Acad Sci U S A. 1995;92(12):5258-5265.
63. Coussens LM, Werb Z. Inflammation and cancer. Nature. 2002;420(6917):860-867.
Shishuang Wu,1* Shufen Li,1* Peng Jin,1* Yi Zhang,1* Li Chen,1 Wen Jin,1,2 Junmin Li1# and Kankan Wang1,2#
1Shanghai Institute of Hematology, State Key Laboratory of Medical Genomics, National Research Center for Translational Medicine at Shanghai, Ruijin Hospital Affiliated to Shanghai Jiao Tong University School of Medicine and 2CNRS-LIA Hematology and Cancer, Sino-French Research Center for Life Sciences and Genomics, Ruijin Hospital Affiliated to Shanghai Jiao Tong University School of Medicine, Shanghai, China.
*SW, SL, PJ and YZ contributed equally as co-first authors.
#JL and KW contributed equally as co-senior authors.
Correspondence: K. Wang kankanwang@shsmu.edu.cn
Received: October 8, 2021.
Accepted: May 3, 2022.
Prepublished: May 12, 2022.
ps://doi.org/10.3324/haematol.2021.280147
©2022 Ferrata Storti Foundation
Published under a CC BY-NC license
Patients with newly diagnosed acute promyelocytic leukemia (APL) are often obese or overweight, accompanied by meta bolic disorders, such as dyslipidemia. However, the link between dyslipidemia and leukemia is obscure. Here, we conducted a retrospective study containing 1,412 cases (319 newly diagnosed APL patients, 393 newly diagnosed non-APL acute mye loid leukemia patients, and 700 non-tumor controls) and found that APL patients had higher triglyceride levels than nonAPL and control groups. Using clinical data, we revealed that hypertriglyceridemia served as a risk factor for early death in APL patients, and there was a positive correlation between triglyceride levels and leukocyte counts. RNA sequencing analysis of APL patients having high or normal triglyceride levels highlighted the contribution of peroxisome proliferatoractivated receptor-α (PPARα), a crucial regulator of cell metabolism and a transcription factor involved in cancer devel opment. The genome-wide chromatin occupancy of PPARα revealed that PPARα co-existed with PML/RARα within the super-enhancer regions to promote cell proliferation. PPARα knockdown affected the expression of target genes respon sible for APL proliferation, including FLT3, and functionally inhibited the proliferation of APL cells. Moreover, in vivo results in mice having high fat diet-induced high triglyceride levels supported the connection between high triglyceride levels and the leukemic burden, as well as the involvement of PPARα mediated-FLT3 activation in the proliferation of APL cells. Our findings shed light on the association between APL proliferation and high triglyceride levels and provide a genetic link to PPARα mediated hyperlipidemia in APL.
Clinical epidemiological studies have demonstrated that being overweight or obese is a risk factor for developing cancers, including leukemia.1 Cohort studies further pro vide evidence that patients with acute promyelocytic leukemia (APL), a subtype of acute myeloid leukemia (AML), are more obese than patients with other subtypes of AML.2-4 Dyslipidemia, resulting from abnormal lipid and fatty acid metabolism, is an essential link between obesity and certain types of malignancies.5-7 Numerous studies have demonstrated that lipids act as messengers for tumor growth signal transmission.8,9 Different composi
tions of lipids, including triglycerides and cholesterol, have varied cancer type-specific effects on cancer devel opment. For instance, a higher high-density lipoprotein (HDL-C) level is associated with a higher risk of breast cancer.10 Higher serum triglycerides are significantly cor related with an increased prevalence of colorectal ade nomas,11 and cholesterol esters are growth regulators of lymphocytic leukemia cells.12 The lipid status of APL pa tients has not been fully elucidated, and the mechanisms underlying the effects of dyslipidemia on APL devel opment need to be investigated in detail.
Obesity-associated microenvironmental alterations, such as dyslipidemia, have emerged as potential cooperating
events, along with genetic and epigenetic variations pro moting and sustaining leukemogenesis. The initiating fac tor of APL, the oncogenic fusion protein promyelocytic leukemia/retinoic acid receptor-α (PML/RARα) generated by the (15;17) translocation, is indispensable but insuffi cient for disease development.13,14 Genetically, an internal tandem duplication (ITD) of the fms-like tyrosine kinase 3 (FLT3) gene, FLT3-ITD, is prevalent in APL and is associ ated with high white blood cell (WBC) counts.15 Indeed, FLT3-ITD overexpression in murine bone marrow cells ac celerates the APL transformation in a mouse model, pro viding direct support for the cooperating effects of FLT3-ITD in APL development.16 However, obesity-driven cooperating events remain under-explored, and the role of dyslipidemia in the pathogenesis of APL is still unclear. Peroxisome proliferator-activated receptor-α (PPARα), a nuclear receptor superfamily member, participates in multiple physiological and pathological processes. Exten sive studies have shown the regulatory role of PPARα in various cancer cells, in addition to the canonical effect on lipid metabolism in liver cells.17 For instance, the activation of PPARα in breast cancer cells promotes proliferation.18 In cholangiocarcinoma, PPARα activation, induced by an alteration in bile acid metabolism, has a tumorigenic ef fect through ERK activation.19 These studies indicate the role of PPARα in cancer development. Here, we investi gated the association between dyslipidemia and APL. The results showed that APL patients had higher triglyceride levels than non-APL AML and non-tumor controls. Mech anistic studies demonstrated that PPARα co-existed with PML/RARα within the super-enhancer regions, and PPARα mediated-FLT3 activation interfered with the proliferation of APL cells.
The study was approved by the Ethics Review Committee of Ruijin Hospital affiliated to Shanghai Jiao Tong Univer sity School of Medicine. We collected patient medical rec ords from July 2012 to September 2019, including 319 newly diagnosed APL patients, 393 newly diagnosed nonAPL AML patients, and 700 non-tumor controls between 18 and 75 years of age (at hospital admission). Body mass index (BMI), which is calculated as weight (kg)/height (m)2, greater than or equal to 25, is defined as overweight. Cases with underlying diseases that affect BMI or blood lipids, including diabetes, hypertension, coronary heart diseases, and hyperlipidemia, were excluded from the analysis. Non-tumor controls were from patients in de partments other than the Department of Hematology, in cluding Traumatology, Gynecology, Dermatology, Breast surgery, Otolaryngology, and Orthopedics.
NB4 and HEK-293T cells were authenticated before ex periments. Detailed information can be found in the On line Supplementary Appendix.
Knockdown experiments, quatitative ploymerase chain reaction, RNA sequencing, Cleavage Under Targets and Tagmentation (CUT&Tag) sequencing, and functional experiments
Primers used for referred experimental assays are listed in the Online Supplementary Table S4, and details are available in the Online Supplementary Appendix. ìCUT&Tag was supported by Jiayin Biotechnology Ltd.
The mouse experiments were conducted following the in stitutional animal protocols provided by the Institutional Animal Care and Use Committee of Ruijin Hospital affili ated to Shanghai Jiao Tong University School of Medicine. Details are available in the Online Supplementary Appen dix.
Bioinformatics and statistical analysis Bioinformatics and statistical analysis are detailed in the Online Supplementary Appendix
The datasets are available in NCBI's GEO with the access numbers GSE195776 (CUT&Tag) and GSE195777 (RNA se quencing).
Acute promyelocytic leukemia patients had a higher over weight prevalence and a higher triglyceride tendency. We
rst retrospectively analyzed the demographics and clinicopathological data of 1,412 adult cases, including 319 newly diagnosed APL patients, 393 newly diagnosed nonAPL AML patients, and 700 non-tumor controls (Figure 1). There were 26, 82, and 315 patients excluded from the APL, non-APL AML, and non-tumor control categories, re spectively, owing to diabetes, hypertension, and coronary heart disease. Among the remaining cases, BMI was cal culated for 293, 311, and 385 patients, and blood lipids were tested for 189, 213, and 363 patients in the three groups, respectively. The baseline characteristics of pa tients are provided in Table 1, and the dispositions of pa tients are illustrated in Figure 1. The APL patients were younger (mean age 39.0 years) than the non-APL AML pa tients (mean age 46.6 years), consistent with the epidemi ological observation that the APL incidence is constant over the lifespan, whereas other AML-subtype incidences increase with age.20
Table 1. Baseline characteristics of the study participants.
Figure 1. Flow chart showing the inclusions and exclusions of the primary data set. *For the body mass index (BMI) analysis, cases with underlying diseases that may affect BMI or lipid, e.g., diabetes, hypertension, coronary heart disease, and hyperlipidemia, were excluded.
Age in years, mean ± SD 39.4 ± 12.3 46.6 ± 14.6 45.7 ± 15.8 < 0.001
Sex
0.232
Male, N (%)
Female, N (%) 147 (50.2) 146 (49.8) 166 (52.5) 150 (47.5) 179 (47.4) 199 (52.6)
Height, cm, mean ± SD 165.9 ± 7.3 166.2 ± 7.8 165.9 ± 7.8 0.585
Weight, kg, mean ± SD 64.7 ± 12.7 64.0 ± 10.5 63.4 ± 11.1 0.060
BMI, kg/m2 mean +/- SD BMI <25, N (%) BMI ≥25, N (%)
23.4 ± 3.2 203 (69.3) 90 (30.7)
23.1 ± 3.1 241 (77.5) 70 (22.5)
23.0 ± 3.3 299 (77.7) 86 (22.3)
0.115 0.022
WBC 10 ×109/L, median (IQR) ≥10 ×109/L, N (%) 4.6 (1.6-8.9) 65 (23.8) 12.1 (2.6-42.3) < 0.001
PLT ≤10 ×109/L, median (IQR) 46 (22-119) 56 (22-110.5) < 0.001
TG, mmol/L* ± SD TG ≥1.71, N (%)
2.3 ± 1.3 116 (61.4) 1.5 ± 0.8 65 (30.7) 1.4 ± 0.7 91 (25.8) < 0.0001 < 0.0001
TC, mmol/L* ± SD 4.3 ± 1.1 3.5 ± 0.9 4.5 ± 1.1 < 0.0001 LDL-C, mmol/L* ± SD 2.5 ± 0.9 2 ± 0.7 1.7 ± 0.9 < 0.0001 HDL-C, mmol/L* ± SD 1.1 ± 0.7 0.9 ± 0.3 2.3 ± 0.9 < 0.0001
APL: acute promyelocytic leukemia; non-APL AML: acute myeloid leukemia excluding APL; BMI: body mass index; WBC: white blood cell; PLT: platelet; TG: triglyceride; TC: total cholesterol; LDL-C: low-density lipoprotein cholesterol; HDL-C: high-density lipoprotein cholesterol; IQR: interquartile range. *For TG, TC, LDL-C, and HDL-C analysis, the numbers of APL, non-APL AML, and non-tumor controls are 189, 213, and 363.
First, in order to investigate the associations between obesity and leukemia, we used BMI to divide the three groups, i.e., APL, non-APL AML, and non-tumor controls, into two categories: underweight/normal weight (BMI <25.0 kg/m2) and overweight/obese (BMI ≥25.0 kg/m2). As shown in Figure 2A, the proportion of overweight patients in the APL group (30.7%) was significantly higher than that in non-tumor control (22.3%, P<0.05) and non-AML APL groups (22.5%, P<0.05). The data suggested that APL pa tients had a higher overweight prevalence. Second, we analyzed the blood lipids of the patients mentioned
above. As shown in Figure 2B, the triglyceride levels of APL patients were 2.3 mmol/L, which were significantly higher than those of non-APL AML patients (1.5 mmol/L, P<0.0001) and non-tumor controls (1.4 mmol/L, P<0.0001). In the APL group, 61.4% (116/189) patients had triglycerides greater or equal to the normal value (1.71 mmol/L), which was significantly higher than that in AML (30.7%, 65/213) and control (25.8%, 91/363) groups, respectively (P<0.0001). There was no difference in triglyceride levels between the control and non-APL AML groups. The APL group had a higher total cholesterol level (4.3 mmol/L)

than the non-APL AML group (3.5 mmol/L, P<0.0001) (Fig ure 2C), but it was less than the reference value of 5.18 mmol/L. For the low-density lipoprotein cholesterol (LDLC), the APL group’s level (2.5 mmol/L) was higher than those of non-APL AML (2.0 mmol/L) and control groups (1.7 mmol/L) (both P<0.0001; Figure 2D). The APL group had a lower high-density lipoprotein cholesterol (HDL-C) level (1.1 mmol/L) than the control group (2.3 mmol/L, P<0.0001; Figure 2E). Thus, the data showed that APL pa tients had a higher overweight prevalence and a higher triglyceride tendency.
The triglyceride level was positively associated with white blood cells counts and was a risk factor for early death in acute promyelocytic leukemia patients. Despite the advances in APL treatment due to the intro duction of all-trans retinoic acid (ATRA) and arsenic tri oxide,21,22 the rate of early death, defined as death within 30 days from diagnosis, remains high.23 There were 13 early-death patients in our cohort, among which 11 died of intracranial hemorrhage, one died of respiratory failure, and one died of differentiation syndrome. APL with high triglycerides had a higher incidence of early death than

APL with normal triglycerides (10.3% vs. 1.4%). High WBC count is an independent predictor of early death in APL.24 APL patients having higher triglyceride levels were ob served to have higher WBC counts at diagnosis compared with patients having normal triglyceride levels (Figure 3A). Additionally, we explored the relationship between triglyc erides and WBC using a linear regression analysis. As shown in Figure 3B, there was a positive correlation be tween triglycerides and WBC. These data indicated that a high triglyceride level was associated with leukemic cell proliferation. We then investigated whether high triglyc erides might have an impact on the occurrence of early death in APL patients. We first performed a univariate analysis to determine the impact of the four lipid factors on early death in APL. We included WBC and platelet (PLT) counts in the analysis because WBC >109/L and PLT ≤109/L are known unfavorable levels associated with early death.25 As shown in Table 2, WBC count >10x109/L (odds ratio [OR]=5.25; P=0.006), PLT count ≤10x109/L (OR=8.83; P=0.002), triglyceride level >1.995 mmol/L (OR=6.37, P=0.018), and HDL-C level ≤0.655 (OR=4.79, P=0.022) were associated with early death. Furthermore, the multivariate logistic analysis found that WBC count >10x109/L, PLT
Figure 2. Comparison of blood lipid levels in acute promyelocytic leukemia, non-acute promyelocytic leukemia acute myeloid leukemia patients, and non-tumor controls.
acute promyelocytic leukemia (APL), non-APL acute mye loid leukemia (AML), and control groups with body mass index (BMI)
to E) Serum triglyceride (B) total cholesterol (C) low-density lipoprotein (D) and high-density lipoprotein (E) concentrations in the APL, non-APL AML, and non-tumor control groups. TG: triglyceride; TC: total cholesterol; LDL-C: low-density lipoprotein cholesterol; HDL-C: high-density lipoprotein cho lesterol; ULN: upper limit of normal; LLN: lower limit of normal. Clinical reference ranges:TG, normal 0.34-1.71 mmol/L; TC, normal 3-5.18 mmol/L; LDL-C <3.37 mmol/L;
mmol/L.
cant.
count ≤10x109/L, and triglyceride level > 1.995 mmol/L were early death-associated risk factors (Table 2). The de tection reliability is usually judged by the area under the curve (AUC). Consequently, we constructed ROC curves for the risk model using the combination of these risk fac tors. The three-parameter risk model, i.e., WBC, PLT plus triglyceride (AUC: 0.868; 95% confidence interval [CI]: 0.781–0.954), presented better sensitivity and specificity levels in predicting early death than WBC plus PLT. The Delong test showed that the AUC of the two risk models were significantly different. These results demonstrated that the triglyceride level was a risk factor for early death in APL patients (Figure 3C).
The PPAR signaling pathway was enriched in APL patients with higher triglyceride levels. In order to explore the mechanisms underlying the impact of the triglyceride level on APL cell proliferation, we per formed RNA sequencing (RNA-seq) to compare gene ex pression profiles between APL patients with high and normal triglyceride levels (Online Supplementary Table S1). Firstly, we employed the gene set variation analysis (GSVA) algorithm to perform pathway-centric analyses and com prehensively measured the pathway activity changes be tween the two groups based on the KEGG pathway signatures. As shown in Figure 4A, the activated pathways in APL with high triglyceride levels included those related to cell metabolism, e.g., glucose metabolism, amino acid metabolism, folate metabolism, and fatty acid metab olism. The PPAR signaling pathway was the most signifi cantly activated among the metabolic pathways (Figure 4A and B). Furthermore, we conducted the gene-centric
differentially expressed analysis and the gene set enrich ment analysis (GSEA) on the differentially expressed genes between the two patient groups. The results revealed the upregulation of the PPAR signaling pathway in APL pa tients with high triglyceride levels (Figure 4C).
PPAR have three subtypes (PPARα, PPARβ/δ, and PPARg) and possess ligand-activated transcriptional abilities. Be cause different PPAR elicit distinct biological activities,26 the expression level of each PPAR subtype was compared in the two groups of patients. PPARα expression was sig nificantly higher in the higher triglyceride APL patients than in the normal triglyceride patients (Figure 4D), whereas the expression levels of PPARδ and PPARg were not statistically different between the two groups. Collec tively, these data indicated that the PPARα pathway was enriched in APL patients having high triglyceride levels.

PPARα and PML/RARα co-existed within the superenhancer regions to promote cell proliferation
Since PPARα is a transcription factor belonging to the nu clear receptor superfamily,27 we further investigated ge nome-wide PPARα binding sites using a newly developed assay for chromatin occupancy, Cleavage Under Targets and Tagmentation (CUT&Tag) with a PPARα specific anti body, followed by sequencing (details in the Online Sup plementary Appendix). Accordingly, 9,829 PPARα binding sites were identified in NB4 cells. PPAR α binding sites were mainly distributed in promoter regions (68.88%), in trons (14.64%), and distal intergenic regions (13.81%) (On line Supplementary Figure S1A). By comparing PPAR α binding sites in NB4 cells with those in a neuroblastoma cell line SKNSH from the ENCODE,28 we found that PPARα
Figure 3. A high triglyceride level was associated with higher white blood cell counts and was a risk factor for early death in acute promyelocytic leukemia patients. (A) Acute promyelocytic leukemia (APL) patients with high triglyceride levels had higher white blood cell (WBC) counts than APL patients with normal triglyceride levels. (B) Linear regression analysis indicated a positive correlation between triglyceride levels and WBC counts at diagnosis. (C) The ROC curves analysis of early death prediction using factors described in Table 2. TG: triglyceride; PLT: platelets; AUC: area under the curve.
Table 2. Logistic regression analysis of early death prognostic factors in acute promyelocytic leukemia.
OR (95% CI) P-value
Multivariable analysis
OR (95% CI) P-value
Sex 1.08 (0.35-3.34) 0.896 1.64 (0.38-7.05) 0.504
Age 1.01 (0.97-1.06) 0.541 1.03 (0.97-1.10) 0.346
WBC (>10×109/L) 5.25 (1.62-16.98) 0.006 5.60 (1.52-20.59) 0.009
PLT (≤10×109/L) 8.83 (2.23-34.95) 0.002 10.79 (2.09-55.69) 0.004
TG (>1.955 mmol/L) 6.37 (1.37-29.58) 0.018 5.30 (1.09-25.86) 0.047
HDL-C (≤0.655 mmol/L) 4.79 (1.26-18.29) 0.022 1.83 (0.36-9.85) 0.572 (removed)
*The regression model included 189 acute promyelocytic leukemia (APL) patients (including 13 early deaths). CI: confidence interval; OR: odds ratios; TG: triglyceride; TC: total cholesterol; HDL-C: high-density lipoprotein cholesterol; clinical reference ranges: TG, normal 0.34-1.71 mmol/L; HDL-C >1.04 mmol/L; WBC, normal 4-10×109/L; PLT, normal 100-300×109/L.
binding sites were cell type-specific (Online Supplemen tary Figure S1B), suggesting that PPARα might participate in determining the identity of APL cells. Since APL is initiated by the oncogenic PML/RARα fusion protein and our recent study has shown that PML/RARα mediated super-enhancer formation shapes the identity of APL cells,29,30 we then investigated whether PPARα is in volved in the transcriptional dysregulation driven by PML/RARα. Through an integrative analysis of PPARα and PML/RARα binding sites in NB4 cells, we found that PPARα and PML/RAR α co-occupied 2,621 binding sites, cor responding to 2,305 genes (Figure 5A; Online Supplemen tary Figure S1C). When PPARα binding sites were divided into those bound by PPARα only and those shared with PML/RARα, the former, but not the latter, revealed a sig nificant enrichment of canonical PPAR-responsive el ements (PPRE, DR1) (Online Supplementary Figure S1D, detailed in the Online Supplementary Appendix). The en richment of PPRE suggested that PPARα might function as a cofactor with PML/RARα. We then investigated whether PPAR α and PML/RAR α are collaboratively involved in super-enhancer regulation. Interestingly, we found that PPARα tended to be enriched in super-enhancer regions of APL, ranked by H3K27ac in APL cells, similar to PML/RAR α (Figure 5B). More importantly, a significant overlap existed between PPARα- and PML/RARα mediated super-enhancer regions (84.54%) (Figure 5C; Online Sup plementary Table S2), suggesting an interplay between PPARα and PML/RARα in APL cells. The functional enrich ment analysis of target genes co-regulated by PPARα and PML/RARα mediated super-enhancers showed transcrip tional dysregulation (e.g., GFI1, MYB, and FLT3, Online Sup plementary Figure S1C), the MAPK signaling pathway and the RAS signaling pathway were significantly enriched (Figure 5D).
In order to validate the role of PPARα in the activation of target genes associated with PML/RARα mediated superenhancer regions, especially those crucial for proliferation,
we knocked down PPARα expression using small interfer ing RNA (siRNA) or inhibited PPAR α with its antagonist GW6471. As shown in Figure 5E and the Online Supple mentary Figure S2, the expression of these target genes, e.g., FLT3, MYB, and BCL2, was significantly downregu lated. Because FLT3 is closely related to APL leukemogen esis,31 we further examined the expression of the FLT3 protein and STAT5, a gene downstream of FLT3. As shown in Figure 5F, PPARα knockdown also showed decreased levels of phosphorylated FLT3 and phosphorylated STAT5, the activated forms, in APL cells, suggesting that PPARα contributed to the abnormal proliferation of APL cells by activating FLT3 and the downstream STAT5. Furthermore, we performed the CCK-8 assay and found that PPAR α downregulation (through either knockdown or GW6471 treatment) indeed inhibited the proliferation of NB4 cells (Figure 5H; Online Supplementary Figure S3). Additionally, we also treated NB4 cells with the PPAR α activator GW7647. The expression levels of these target genes were upregulated (Figure 5H) and the cell proliferation was in creased (Online Supplementary Figure S4).
PML/RARα-transgenic mice with high triglyceride levels had increased tumor burdens and exhibited increased levels of PPARα and FLT3
In order to acquire the in vivo evidence of the effects of high triglycerides on APL, we used PML/RARα transgenic APL transplantable mouse model fed with either a highfat diet (HFD) or a normal diet (ND). The serum lipid levels were examined in mice after 6 weeks. Mice in the HFD group were significantly more massive than in the ND group (Figure 6A), and the serum triglyceride and total cholesterol levels in the HFD mice were higher than those in the ND mice (Figure 6B). The WBC counts and the leukemia cell percentage (GFP-positive) of the two groups were regularly compared. Interestingly, we found that the WBC counts in the HFD group were significantly higher than that in the ND group beginning on day 13, and the
difference was more significant on day 17 (Figure 6C). More importantly, the leukemia cell percentage in the HFD group was statistically higher than that in the control
group, indicating that the expansion of leukemia cells in the former was more rapid than in the latter group (Figure 6D). Further statistical analysis of survival curves showed

B
D
Figure 4. The PPAR-signaling pathway was enriched in hypertriglyceridemia acute promyelocytic leukemia samples. (A) Volcano plot of differential pathways in APL patients with high triglycerides vs. normal triglycerides. The 2 horizontal dashed lines denote a P-value cutoff of 0.05 and a false discovery rate (FDR) cutoff of 0.3. Two-sided P-values were adjusted for multiple hypothesis testing using the Benjamini-Hochberg correction. (B) The top 10 significantly enriched Kyoto Encyclopedia of Genes and Genomes (KEGG) pathways in APL patients with high triglycerides levels compared with APL with normal triglycerides levels. (C) Gene set enrichment analysis plot of the PPAR signaling signature genes in patients with high triglycerides levels vs. patients with normal triglycerides. (D) Violin plots showing the expression levels of PPAR in patients with high triglycerides and normal triglyceride levels. TG: triglyceride.
PPAR
was required for the proliferation of acute promyelocytic leukemia cells by co-existing with PML/RAR
to con trol super-enhancer regulation. (A) Heatmap shows the binding sites of PPAR
and PML/RAR
PPAR
tended to bind at en hancers with higher H3K27ac signals. (C) Venn diagram of the binding sites of PML/RAR
and super-enhancer (SE). (D) Bubble diagram of enriched GO terms. (E) Downregulation of target genes co-bound by PML/RAR
and PPAR
upon PPAR
knock down using small interfering RNA (siRNA). (F) Repression of the protein levels of FLT3 expression and its downstream gene STAT5 upon PPARα knockdown. (G) Inhibition of cell growth in NB4 cells upon PPAR
knockdown using siRNA. (H) Upregulation of target genes co-bound by PML/RAR

and PPARα upon PPARα activation with GW7647 treatment. Data are shown as the means ± stan dard deviation of triplicates.
P<0.05;
P<0.01;
P<0.001 ****P<0.0001; NC: negative control.
that mice in the HFD group had shorter survival times (Figure 6E). Spleen size and weights also revealed that the leukemia cells grew faster in the HFD group (Figure 6F). Furthermore, we found that the expression of PPARα and FLT3 were significantly elevated in the HFD group than that in the ND group (Figure 6G, consistent with the RNAseq data of patients in Figure 4D.) Together, the tumor burdens of high-triglyceride mice was increased com pared with those of normal-triglyceride mice, confirming the population's epidemiological results.3,32
Despite robust evidence connecting obesity with cancer development,1,33 the molecular mechanisms underlying this correlation remain ambiguous. In this study, we con ducted a retrospective observational study that included 1,412 clinical cases and revealed the APL lipid profile char acteristic of a higher triglyceride tendency. We found that the triglyceride level was a risk factor for early death. We compared the differentially expressed genes in APL pa tients with high triglyceride and normal triglyceride levels and found that the PPARα pathway was enriched in the former. Moreover, mechanistic studies revealed that PPAR α and PML/RAR α co-existed within the super-en hancer regions to promote cell proliferation. In vivo evi dence showed that high triglyceride mice had increased tumor burdens. Our findings provide clinical and biological evidence demonstrating how PPARα drives hypertriglyce ridemia/obesity-associated APL.
There is an association between obesity and APL,2-4 and obesity is often a risk factor for clinical outcomes in APL. Our study showed that the overweight/obese prevalence in APL patients was greater than that in non-APL AML and non-tumor controls. Abnormal lipid metabolism might be a reason for the correlation between obesity and cancer development.34 Among the four detected lipid profiles, i.e., triglycerides, total cholesterol, HDL-C, and LDL-C, we found that the APL patients' triglyceride levels were higher than those of the non-APL AML and those of non-tumor control groups, and they were also higher than the upper limits of normal. In contrast, the total cholesterol and LDL-C levels of the APL patients were still within the nor mal range, although a high tendency was observed com pared with the two control groups. More importantly, our study showed a 61.4% incidence of hypertriglyceridemia in newly diagnosed APL patients, which is consistent with recent reports that 55.8% of APL patients have hypertrig lyceridemia32,35 and supports evidence of dyslipidemia in APL patients.
Our data showed that the PPARα signaling was activated in APL patients having high triglyceride levels. It is deduc ible that PPARα might be activated by endogenous fatty
acids produced by the decomposition of triglycerides. More importantly, the mechanistic investigation using CUT&Tag analysis further indicated that PPARα interplayed with PML/RARα within the super-enhancer regions of APL cells. Indeed, we found that PML/RARα transgenic mice with higher triglyceride levels due to HFD showed high PPAR α expression levels and increased tumor burdens (Figure 6C to G).
Over two decades ago, Jansen et al. provided a prelim inary clue that PML/RARα interferes with the PPAR signal ing pathways.36 PPAR form a nuclear receptors superfamily that regulates genes important in cell differentiation and various metabolic processes, especially lipid and glucose homeostasis. The different isoforms of PPAR and different distribution and expression profiles ultimately lead to dif ferent clinical outcomes.37 PPARα is highly expressed in hepatocytes, cardiomyocytes, intestinal epithelial cells, and renal proximal tubule cells.38 Long-term administra tion of a PPARα agonist causes hepatocellular carcinoma in rodents,39 and PPARα activation promotes proliferation in breast cancer cells.18 The highest expression of PPARβ/δ is found in the small intestine, colon, and skin epithe lium.40 In the hematopoietic system, studies have shown that PPARδ plays an important role in maintaining hema topoietic stem cells (HSC) by regulating mitochondrial phagocytosis and promoting the asymmetric cell division of HSC.41 PPARg is highly expressed in adipose tissue. Li et al. demonstrated that PPAR g is a direct target of PML/RARα. PML/RARα overexpression increases the ubi quitination of PPARg and inhibits the PPARg activity by dis rupting the PPAR g /RXR heterodimer.32 The relationship between PML/RARα and PPAR signaling deserves further study, at the transcription, post-transcription, translation, and post-translational modification levels.
Our study demonstrated that PPARα and PML/RARα coexisted within the super-enhancer regions in APL cells. Considering the recent study that PML/RARα transactiv ates target genes largely through super-enhancer regula tion,30 we speculated that PPARα might participate in the activation of target genes associated with PML/RARα me diated super-enhancer regions. Indeed, the expression of the three representative genes well-known for promoting leukemogenesis, such as FLT3, MYB, and BCL2, was up regulated. FLT3, which is activated mainly due to FLT3ITD, is known to work synergistically with PML/RARα to hasten APL development.42 Overexpression of wild-type FLT3 has also been reported to promote AML in mice.43,44 MYB acts as a protooncogene in AML and is decisive in regulating the hematopoiesis, including the proliferation and differentiation of blood cells.45 BCL2 is critical in in hibiting apoptosis in AML.46 Therefore, PPAR α and PML/RARα might be collaboratively involved in super-en hancer regulation in APL pathogenesis.
Early death remains a major obstacle in the successful
Figure 6. PML/RARα transgenic mice with high triglyceride levels had increased tumor burden and exhibited increased levels of PPARα and FLT3. (A) Body weights of mice fed with a high-fat diet (HFD) or a normal diet (ND). (B) Serum triglyceride and total cholesterol concentrations were measured in mice fed with HFD or ND for 6 weeks. (C) Relative leukocyte counts (x109/L) in the HFD and ND groups of FVB/APL mice at 6, 13, and 17 days after transplantation. (D) GFP-positive ratios in peripheral blood cells of HFD and ND groups of FVB/APL mice at 6, 13, and 17 days after transplantation. (E) High triglyceride mice were more likely to develop acute promyelocytic leukemia (APL). We used a Kaplan-Meier analysis to estimate the survival of FVB/APL mice. (F) The spleen/body weight ratios showed that the spleens of the HFD group were swollen. (G) quantitative polymerase chain reaction showing the expression of PPARα and FLT3 in mice fed with HFD and ND for 6 weeks.

treatment of APL. In our data, the early death rate was 6.9%, and most patients (11/13) died of intracerebral hemorrhage, consistent with previous reports.21,47,48 In order to remove confounding factors from the analysis, we compared the treatment supportive care, and timeto-treatment initiation between the normal triglyceride group and high triglyceride group. Patients with normal and high triglyceride levels received the same treatment regimen, i.e., ATRA plus ATO with or without chemotherapy according to Sanz risk stratification in the induction course. As shown in the Online Supplementary Table S3, there was no statistical difference in the Sanz risk strat ification between the patients with normal and high tri glyceride levels (P=0.219). Regarding the time-to-treatment initiation, there was no difference between the two groups. Patients were treated with ATRA immediately when a di agnosis of APL was suspected. The length of hospital stay can be partially used to assess the effects of supportive care.49 The median length of hospital stay was similar be tween the two groups, i.e., 30 days (interquartile range, 27 to 34 days) for patients with normal triglyceride levels and 30 days (interquartile range, 25 to 33 days) for patients with high triglyceride levels.
The limitations of this study are as follows. Firstly, this is a single-center, retrospective study. In the non-tumor con trols, we included patients with heterogeneous diseases
other than hematologic tumors and cardiovascular dis eases (or patients using drugs that affected blood lipids). Multi-center and multi-ethnic studies with more precise inclusion and exclusion criteria may help reduce selection bias. Secondly, we showed that PPARα and PML/RARα coexisted within the super-enhancer regions to promote pro liferation. A previous study showed that PML/RARα drives oncogenesis through chromatin conformation at the superenhancer region and through the recruitment of cofactors.30 Whether PPARα interacts with other cofactors requires further investigation. In addition, due to the limitations of the mouse model itself, it is difficult to determine whether hypertriglyceridemia or obesity contributes to the tumor development in preleukemic cells or at later stages once leukemia has already developed. It is also possible that obesity affects all these processes. More studies, in vitro or in vivo, are needed to address these issues. Because the current knowledge underlying the dyslipide mia-cancer association is diverse, our findings provide a possible mechanism by which PPARα serves as a link be tween dyslipidemia and APL. The results expand our knowledge of the mechanisms responsible for the obesity–cancer association. Our study also emphasizes the in fluence of obesity/dyslipidemia on APL proliferation and potentially confers a rationale for treating APL with the PPAR activators.
No conflicts of interest to disclose.
KW, SL, and SW conceived and designed the study; SW, SL, and YZ performed the experiments; PJ and YZ conducted bioinformatic analyses; LC and WJ analyzed clinical data; KW, JL, and SL supervised the study; KW, SW, and SL wrote and revised the manuscript; and all authors discussed the results and implications and reviewed the manuscript.
1. Bhaskaran K, Douglas I, Forbes H, dos-Santos-Silva I, Leon DA, Smeeth L. Body-mass index and risk of 22 specific cancers: a population-based cohort study of 5.24 million UK adults. Lancet. 2014;384(9945):755-765.
2. Castillo JJ, Mulkey F, Geyer S, et al. Relationship between obesity and clinical outcome in adults with acute myeloid leukemia: A pooled analysis from four CALGB (alliance) clinical trials. Am J Hematol. 2016;91(2):199-204.
3. Estey E, Thall P, Kantarjian H, Pierce S, Kornblau S, Keating M. Association between increased body mass index and a diagnosis of acute promyelocytic leukemia in patients with acute myeloid leukemia. Leukemia. 1997;11(10):1661-1664.
4. Mazzarella L, Botteri E, Matthews A, et al. Obesity is a risk factor for acute promyelocytic leukemia: evidence from population and cross-sectional studies and correlation with flt3 mutations and polyunsaturated fatty acid metabolism. Haematologica. 2020;105(6):1559-1566.
5. Currie E, Schulze A, Zechner R, Walther Tobias C, Farese Robert V, Jr. Cellular fatty acid metabolism and cancer. Cell Metab. 2013;18(2):153-161.
6. Nomura DK, Long JZ, Niessen S, Hoover HS, Ng S-W, Cravatt BF. Monoacylglycerol lipase regulates a fatty acid network that promotes cancer pathogenesis. Cell. 2010;140(1):49-61.
7. Snaebjornsson MT, Janaki-Raman S, Schulze A. Greasing the wheels of the cancer machine: the role of lipid metabolism in cancer. Cell Metab. 2020;31(1):62-76.
8. Schulze A, Harris AL. How cancer metabolism is tuned for proliferation and vulnerable to disruption. Nature. 2012;491(7424):364-373.
9. Han H, Qi R, Zhou JJ, et al. Regulation of the hippo pathway by phosphatidic acid-mediated lipid-protein interaction. Mol Cell. 2018;72(2):328-340.e8.
10. Martin LJ, Melnichouk O, Huszti E, et al. Serum lipids, lipoproteins, and risk of breast cancer: a nested case-control study using multiple time points. J Natl Cancer Inst. 2015;107(5):djv032.
11. Yang MH, Rampal S, Sung J, et al. The association of serum lipids with colorectal adenomas. Am J Gastroenterol. 2013;108(5):833-841.
12. Mulas MF, Abete C, Pulisci D, et al. Cholesterol esters as growth regulators of lymphocytic leukaemia cells. Cell Prolif. 2011;44(4):360-371.
13. Cicconi L, Fenaux P, Kantarjian H, Tallman M, Sanz MA, Lo-Coco F. Molecular remission as a therapeutic objective in acute promyelocytic leukemia. Leukemia. 2018;32(8):1671-1678.
14. de Thé H, Chen Z. Acute promyelocytic leukaemia: novel insights into the mechanisms of cure. Nat Rev Cancer.
This study was supported by the National Natural Science Foundation of China (81890994, 81770153, 31801176) and the National Key R&D Program of China (2019YFA0905902).
All datasets in the study are available in GEO. The access numbers are listed in the Methods section.
2010;10(11):775-783.
15. Esnault C, Rahmé R, Rice KL, et al. FLT3-ITD impedes retinoic acid, but not arsenic, responses in murine acute promyelocytic leukemias. Blood. 2019;133(13):1495-1506.
16. Sohal J, Phan VT, Chan PV, et al. A model of APL with FLT3 mutation is responsive to retinoic acid and a receptor tyrosine kinase inhibitor, SU11657. Blood. 2003;101(8):3188-3197.
17. Kersten S, Desvergne B, Wahli W. Roles of PPARs in health and disease. Nature. 2000;405(6785):421-424.
18. Suchanek KM, May FJ, Robinson JA, et al. Peroxisome proliferator-activated receptor alpha in the human breast cancer cell lines MCF-7 and MDA-MB-231. Mol Carcinog. 2002;34(4):165-171.
19. Manieri E, Folgueira C, Rodríguez ME, et al. JNK-mediated disruption of bile acid homeostasis promotes intrahepatic cholangiocarcinoma. Proc Natl Acad Sci U S A. 2020;117(28):16492-16499.
20. Vickers M, Jackson G, Taylor P. The incidence of acute promyelocytic leukemia appears constant over most of a human lifespan, implying only one rate limiting mutation. Leukemia. 2000;14(4):722-726.
21. Sanz MA, Fenaux P, Tallman MS, et al. Management of acute promyelocytic leukemia: updated recommendations from an expert panel of the European LeukemiaNet. Blood. 2019;133(15):1630-1643.
22. Tallman MS, Nabhan C, Feusner JH, Rowe JM. Acute promyelocytic leukemia: evolving therapeutic strategies. Blood. 2002;99(3):759-767.
23. Lehmann S, Ravn A, Carlsson L, et al. Continuing high early death rate in acute promyelocytic leukemia: a populationbased report from the Swedish Adult Acute Leukemia Registry. Leukemia. 2011;25(7):1128-1134.
24. Mantha S, Goldman DA, Devlin SM, et al. Determinants of fatal bleeding during induction therapy for acute promyelocytic leukemia in the ATRA era. Blood. 2017;129(13):1763-1767.
25. Cai P, Wu Q, Wang Y, Yang X, Zhang X, Chen S. An effective early death scoring system for predicting early death risk in de novo acute promyelocytic leukemia. Leuk Lymphoma. 2020;61(8):1989-1995.
26. Michalik L, Desvergne B, Wahli W. Peroxisome-proliferatoractivated receptors and cancers: complex stories. Nat Rev Cancer. 2004;4(1):61-70.
27. Vamecq J, Latruffe N. Medical significance of peroxisome proliferator-activated receptors. Lancet. 1999;354(9173):141-148.
28. An integrated encyclopedia of DNA elements in the human genome. Nature. 2012;489(7414):57-74.
29. de The H, Pandolfi PP, Chen Z. Acute promyelocytic leukemia: a
paradigm for oncoprotein-targeted cure. Cancer Cell. 2017;32(5):552-560.
30. Tan Y, Wang X, Song H, et al. A PML/RARα direct target atlas redefines transcriptional deregulation in acute promyelocytic leukemia. Blood. 2021;137(11):1503-1516.
31. Meshinchi S, Appelbaum FR. Structural and functional alterations of FLT3 in acute myeloid leukemia. Clin Cancer Res. 2009;15(13):4263-4269.
32. Li K, Wang F, Yang Z-N, et al. PML-RARα interaction with TRIB3 impedes PPARγ/RXR function and triggers dyslipidemia in acute promyelocytic leukemia. Theranostics. 2020;10(22):10326-10340.
33. Li D, Morris JS, Liu J, et al. Body mass index and risk, age of onset, and survival in patients with pancreatic cancer. JAMA. 2009;301(24):2553-2562.
34. Liu Q, Luo Q, Halim A, Song G. Targeting lipid metabolism of cancer cells: A promising therapeutic strategy for cancer. Cancer Lett. 2017;401:39-45.
35. Sun J, Lou Y, Zhu J, et al. Hypertriglyceridemia in newly diagnosed acute promyelocytic leukemia. Front Oncol. 2020;10:577796.
36. Jansen JH, Mahfoudi A, Rambaud S, Lavau C, Wahli W, Dejean A. Multimeric complexes of the PML-retinoic acid receptor alpha fusion protein in acute promyelocytic leukemia cells and interference with retinoid and peroxisome-proliferator signaling pathways. Proc Natl Acad Sci U S A. 1995;92(16):7401-7405.
37. Grygiel-Górniak B. Peroxisome proliferator-activated receptors and their ligands: nutritional and clinical implications - a review. Nutr J. 2014;13:17.
38. Guerre-Millo M, Gervois P, Raspé E, et al. Peroxisome proliferator-activated receptor alpha activators improve insulin sensitivity and reduce adiposity. J Biol Chem. 2000;275(22):16638-16642.
39. Reddy JK, Azarnoff DL, Hignite CE. Hypolipidaemic hepatic peroxisome proliferators form a novel class of chemical carcinogens. Nature. 1980;283(5745):397-398.
40. Girroir EE, Hollingshead HE, He P, Zhu B, Perdew GH, Peters JM.
Quantitative expression patterns of peroxisome proliferatoractivated receptor-beta/delta (PPARbeta/delta) protein in mice. Biochem Biophys Res Commun. 2008;371(3):456-461.
41. Ito K, Turcotte R, Cui J, et al. Self-renewal of a purified Tie2+ hematopoietic stem cell population relies on mitochondrial clearance. Science. 2016;354(6316):1156-1160.
42. Kelly LM, Kutok JL, Williams IR, et al. PML/RARalpha and FLT3ITD induce an APL-like disease in a mouse model. Proc Natl Acad Sci U S A. 2002;99(12):8283-8288.
43. Palmqvist L, Argiropoulos B, Pineault N, et al. The Flt3 receptor tyrosine kinase collaborates with NUP98-HOX fusions in acute myeloid leukemia. Blood. 2006;108(3):1030-1036.
44. Reindl C, Quentmeier H, Petropoulos K, et al. CBL exon 8/9 mutants activate the FLT3 pathway and cluster in core binding factor/11q deletion acute myeloid leukemia/myelodysplastic syndrome subtypes. Clin Cancer Res. 2009;15(7):2238-2247.
45. Arsura M, Luchetti M, Erba E, Golay J, Rambaldi A, Introna M. Dissociation between p93B-myb and p75c-myb expression during the proliferation and differentiation of human myeloid cell lines. Blood. 1994;83(7):1778-1790.
46. Naumovski L, Cleary ML. Bcl2 Inhibits apoptosis associated with terminal differentiation of HL-60 myeloid leukemia Cells. Blood. 1994;83(8):2261-2267.
47. Chen L, Zhu HM, Li Y, et al. Arsenic trioxide replacing or reducing chemotherapy in consolidation therapy for acute promyelocytic leukemia (APL2012 trial). Proc Natl Acad Sci U S A. 2021;118(6):e2020382118.
48. Jillella AP, Kota VK. The global problem of early deaths in acute promyelocytic leukemia: a strategy to decrease induction mortality in the most curable leukemia. Blood Rev. 2018;32(2):89-95.
49. Burnett AK, Russell NH, Hills RK, et al. Arsenic trioxide and alltrans retinoic acid treatment for acute promyelocytic leukaemia in all risk groups (AML17): results of a randomised, controlled, phase 3 trial. Lancet Oncol. 2015;16(13):1295-1305.
Correspondence:
R. K. Slanyrobert.slany@fau.de
Received: February 9, 2022.
Accepted: May 5, 2022.
Prepublished: May 12, 2022.
h
ttps://doi.org/10.3324/haematol.2022.280831
©2022 Ferrata Storti Foundation
Published under a CC-BY-NC license
The homeobox transcription factors HoxA9 and Meis1 are causally involved in the etiology of acute myeloid leukemia. While HoxA9 alone immortalizes cells, cooperation with Meis1 is necessary to induce a full leukemic phenotype. Here, we applied degron techniques to elucidate the leukemogenic contribution of Meis1. Chromatin immunoprecipitation experiments revealed that Meis1 localized mainly to H3K27 acetylated and H3K4 mono-methylated enhancers preactivated by HoxA9. Chromatin association of Meis1 required physical presence of HoxA9 and all Meis1 DNA interactions were rapidly lost after HoxA9 degradation. Meis1 controlled a gene expression pattern dominated by Myc, ribosome biogenesis and ribosomal RNA synthesis genes. While Myc accounted for the cell cycle stimulating effect of Meis1, overexpression of this oncogene alone did not accelerate leukemogenesis. Besides its effect on Myc, Meis1 induced transcription of ribosomal biogenesis genes. This was accompanied by an elevated resistance against inhibition of ribosomal RNA synthesis and translation, but without affecting steady-state protein synthesis. Finally, we demonstrate that HoxA9 and Meis1 proteins are stabilized by post-translational modification. Mutation of HoxA9/Meis1 phosphorylation sites or inhibition of casein kinase 2 lead to rapid protein degradation suggesting a potential pathway for pharmacological intervention.
Besides their function during embryogenesis, Hox-homeo box transcription factors are well established oncoproteins in acute leukemia. Particularly, HOXA9 is frequently over expressed in hematopoietic malignancies and HOXA9 ex pression is an independent negative prognostic factor.1,2 Reflecting the tendency of homeobox proteins to form het eromultimers, overexpression of HOXA9 in leukemia is al most always accompanied by equally elevated levels of MEIS1 and PBX3, two members of the “three amino acid loop extension” (TALE) homeobox family. Biochemical evi dence showed that the PBX/MEIS interaction is required for nuclear import of the dimers.3 In addition, Pbx3 protects Meis1 from proteosomal degradation.4 As a consequence of this molecular cooperation experimental introduction of HoxA9 immortalizes hematopoietic precursor cells, but HoxA9 alone does not induce aggressive disease. Full leukemogenesis requires addition of Meis1 and can be ex acerbated further by increasing Pbx3.4-8 While known for a
long time a detailed molecular explanation for this en hancer effect is still missing. Previous attempts to clarify this phenomenon concentrated on a steady-state comparison of HoxA9 versus HoxA9/Meis1-expressing cells. This approach makes it hard to distinguish primary effects of Meis1 from subordinate events. Nevertheless, the gene for the receptor tyrosine ki nase Flt3 could be identified as a target gene of Meis1.9 Ab normally active FLT3 signaling is clearly involved in the etiology of acute myeloid leukemia as demonstrated by the presence of activating FLT3 mutations in patients.10 Yet, Flt3 overexpression could be ruled out as a reason for the Meis1-dependent leukemic enhancer effect. A complete genetic ablation of Flt3 in animals did neither alter the inci dence nor the kinetics of leukemia experimentally induced by HoxA9/Meis1 or by MLL fusions that induce strong tran scription of HoxA9/Meis1 as target genes.11,12 Hence, while Flt3 is a suitable sentinel gene for Meis1 activity, other mechanisms must be responsible for the phenotypic out come. A recent study13 found increased Syk signaling in
HoxA9/Meis1-transformed myeloid cells. Increased Syk ac tivity indirectly recapitulated part of the Meis1 phenotype. Mechanistically, Syk activity was controlled by a PU.1/miRNA loop that was more active in Meis1-containing cells, how ever Meis1 did not control Syk transcription. Meis1 has also been shown to affect hypoxia signaling in hematopoietic and leukemic stem cells by controlling HIF1α expression,14,15 a feature important for survival and proper development of these cells.16,17 Yet, in essence, a comprehensive study identifying direct and immediate Meis1 target genes is still missing, mainly, because suitable conditional Meis1 expression systems were not available. Strikingly, hematopoietic development is especially sensi tive towards perturbation of ribosomal biogenesis. This is best exemplified by the well characterized congenital ane mias caused by inherited mutations in ribosomal proteins and also in ribosome biogenesis factors like DiamondBlackfan-Anemia, Dyskeratosis Congenita, and Shwach man-Diamond Syndrome (for a review Sulima et al.18). While initially characterized by a paucity of blood cells (anemia) many patients later go on to develop acute leukemia. This is elicited by secondary mutations occuring in hemato poietic precursors that are under continuous proliferative stress to supply the necessary number of blood cells. The conspicuous involvement of ribosomal proteins and ribo some biogenesis factors, including small nucleolar RNA, in these syndromes has led to the general designation of “ri bosomopathy” to summarize these pathologies. The list of genes involved in this disease etiology is growing with DDX41, a protein necessary for ribosome production, as the most recent addition.19 It should be noted that there is no evidence that hematopoietic cells would contain more ri bosomes or display a generally higher protein synthesis ac tivity than other cells. Rather, the rapid supply of sufficient ribosomes in a short time frame is essential for rapid cell division that sustains the extraordinary proliferative activity of hematopoietic precursors. Here we demonstrate that Meis1 boosts HoxA9 activity through two major mechan isms. First, Meis1 amplifies a Myc program that is known to be pre-initiated by HoxA920,21 and second, Meis1 en hances ribosomal production as prerequisites for efficent leukemogenesis.
A detailed description of the methods applied can be found in the Online Supplementary Appendix.
Transformed primary cells were maintained in RPMI1640 supplemented with 10% fetal calf serum, penicillin-strep tomycin, 5 ng/mL recombinant murine interleukin 3 (IL-3), IL-6, granulocyte macrophage colony-stimulating factor
(GM-CSF), and 50 ng/mL recombinant murine stem cell factor (SCF). Hematopoietic stem and precursor cells (HPSC) were isolated either from wild-type (wt) or C57/BL6 mice with a triple knockout (ko) for Elane, Prtn3, and Ctsg. 22
Chromatin immunoprecipitation sequencing, cell lysis, nascent RNA isolation, sequencing Chromatin immunoprecipitation (ChIP) was performed as previously described in 23. Nascent RNA isolation was done exactly as described in 24. Next generation sequencing (NGS) libraries were generated with NEBNext® Ultra™ II DNA Library Prep Kit reagents and NEBNext® Single Cell/Low Input RNA Library Prep kits, respectively. Sequencing was done in house with an Illumina standard pipeline.
Data were mapped with BWA mem (0.7.17)25 to the Mus musculus mm10 genome. For visualization the IGV browser package26 was used. Peak finding, motif analysis and peak annotation was done with Homer (4.9.1).27 BAM files were converted to bigwig and plots were created by Deeptools (3.0.0, bamCoverage).28 RNA derived reads were aligned to the reference genome mm10 with STAR (v020201)29 and reads derived from repetitive sequences were excluded by samtools (view)1.8.30
Transplants were syngenic with donor cells and recipients of C57/BL6 background. Animals were sublethally irradiated (6 Gy) before receiving 0.5x10⁶ transduced cells and 0.5x10⁶ total bone marrow cells for radiation protection. All proce dures were approved by the Institutional and State Review Boards (IRB) and license numbers are available on request.
Raw NGS reads were submitted to the European Nucleotide Archive under accession number ERP134562/PRJEB50012.
Where appropriate two-tailed t-test statistics were ap plied.
In order to determine genome-wide binding patterns by ChIP we generated myeloid precursor cell lines by retrovi rally transducing primary HSPC with a combination of HoxA9, Meis1, and Pbx3, where one of the three proteins was individually HA-epitope tagged for each experiment (Figure 1A). In addition, HSPC were also transduced with a combination of HoxA9 and a HA-tagged Meis1 fused to a mutated (F36V) FKBP. FKBPF36V is a “degron” sequence
allowing controlled elimination of the fusion protein by ad ding the PROTAC (proteolysis targeting chimera) dTAG13 that bridges FKBPF36V and the endogenous E3 ubiquitin ligase cereblon, thus allowing rapid proteasomal degradation of the targeted protein.31

For ChIP HSPC were derived from animals with a complete ko of the myeloid granule proteases elastase, proteinase 3 and cathepsin G (EPC mice).22 This was necessary because preliminary experiments (Online Supplementary Figure S1A) showed that Meis1 is subject to rapid degradation by these proteases if they are released by cell lysis similar to what we have described previously for HoxA9.21 This proteolysis can only be stopped by rapid SDS-based denaturation of proteins but it is not inhibited by commercial protease in
hibitors. Because cell disruption is required for ChIP, this method liberates granule proteases and efficient precipi tation of Meis1-bound chromatin requires a protease negative environment (Online Supplementary Figure S1B). Expression of individual proteins in the resulting precursor cell lines as well as functional degradation of Meis1-FKBPF36V after addition of dTAG13 was checked by western blot (Fig ure 1B) indicating that 8 hours (h) after addition of dTAG13 no Meis1-FKBPF36V was detectable any more. ChIP for Meis1 was performed with an anti-HA antibody in a duplicate util izing “constitutive” cell lines, and additionally, with cells containing degradable Meis1-FKBPF36V before and 8 h after dTAG13 was added. NGS of ChIP precipitates revealed highly efficient enrichment of Meis1 bound chromatin with low
D
Figure 1. Meis1 binds preferentially to enhancers. (This figure is supplemented by the Online Supplementary Figure S1). (A) Strategy to generate primary transformed cell lines for chromatin immunoprecipitation (ChIP) experiments: hematopoietic stem and precursor cells (HSPC) were isolated from animals with a genetic knockout of myeloid granule proteases elastase, proteinase 3, and cathepsin G to allow for efficient ChIP. (B) Expression of ChIP targets and induced degradation of Meis1FKBPF36V. Extracts from transformed primary cells were probed by HA-specific western for constitutive expression (left panel) of ChIP targets and for induced degradation of Meis1-FKBPF36V after addition of dTAG13 (a “proteolysis targeting chimera”; PROTAC) (right panel). (C) Meis1 ChIP is reproducible and peaks can be verified by Meis1 degradation. Integrated genomics viewer (IGV) panels showing Meis1 binding patterns at 2 typical Meis1 loci, Myb and its major enhancer (top panel) and the known Meis1responsive gene Flt3 (lower panel). Tracks correspond to a replicate obtained with constitutively expressed Meis1 as well as Meis1-FKBPF36V before and 8 hours after initiation of degradation as labeled. An input track is added as control. (D) Meis1 localizes predominantly to putative enhancer locations. Pie chart of Meis1 peak distribution across functionally annotated genetic elements. Analysis was done for the 10,000 top scoring peaks.
background and good congruency between individual samples (Figure 1C). A preliminary pass of a peak-finding algorithm resulted in more than 24,000 identifiable binding sites. For further analysis we decided to concentrate on the top-scoring 10,000 peaks with highest read density, be cause these encompassed those with the best correlation between replicates (spearman correlation 0.84 between replicates and 0.74 between Meis1 and Meis1-FKBPF36V, On line Supplementary Figure S1C). Reassuringly, correlation broke down (Spearman correlation 0.16) after addition of dTAG13, indicating that these peaks correspond to highconfidence Meis1 binding sites.
Functional annotation revealed that nearly 90% of peaks
(8,838/10,000)
localized to introns or intergenic regions with only 791 binding sites (~8%) annotated as “promoter” (Fig ure 1D). As this strongly suggested a mainly enhancer-cen tered distribution, we determined enhancer-typical chromatin modifications H3K27ac and H3K4me1 in the same cell lines (Figure 2A and B). As expected, these en hancer marks were highly enriched around Meis1 binding sites with Meis1 localizing to typical modification “valleys”. Generally, higher scoring Meis1 peaks corresponded also to higher H3K27ac modification levels whereas the activation independent enhancer mark H3K4me1 was present around Meis1 sites but did not correlate to Meis1 binding strength. A de novo motif search of Meis1 bound sequences revealed
D
Figure 2. Meis1 binding sites colocalize with enhancer-typic chromatin modifications. (A) Meis1 co-localizes with enhancer modifications. Meta-gene plots showing the distribution of enhancer-typical chromatin modifications H3K27ac (active enhancer) and H3K4me1 (putative enhancer) around the top 10,000 Meis1 peaks with best reproducibility. The plot is peak-centered and ordered top to down according to Meis1 binding density. (B) Meis1 homes in on enhancer centers. Exemplary integrative genome viewer (IGV) panels demonstrating localization of Meis1 at the center of active enhancer modifications. (C) Meis1 marks typical hematopoietic enhancers. De novo motif search results of sequences +/-150 bp of Meis1 peaks yields putative binding sites for known hematopoietic transcription factors. (D) Distribution of identified binding motifs supports Meis1 or Meis1/HoxA9 composite binding at the center of identified chromatin immunoprecipitation peaks.

that either Meis or Meis/Hox composite consensus binding sites were present predominantly at the center of the ma jority of ChIP-enriched peaks (Figure 2C and D). These were accompanied by consensus sites for typical hematopoietic transcription factors like Cebp, Ets- and Runt-domain con taining proteins. In summary, these results point to Meis1 as a transcription factor that localizes preferentially to ac tive enhancers in myeloid precursor cells.
HoxA9 is epistatic to Meis1 In order to further elucidate the functional relationship be tween HoxA9, Meis1 and Pbx3 we recorded ChIP profiles for HoxA9 and Pbx3 in the newly generated Hox/Meis/Pbx lines and compared those to previously established21 HoxA9 binding patterns in the absence of Meis1 (Figure 3A and B). We and others have shown4,7 that Pbx3 forms physical het erodimers with Meis1 that are stable also in the absence of DNA. This was reflected in ChIP binding patterns with a nearly absolute congruency of Meis1 and Pbx3. Peaks cor related not only in location but also in binding density. As suggested by motif analysis, Meis1/Pbx3 peaks co-localized with areas of high HoxA9 occupancy and no “Meis-only” peaks were detected (Figure 3C, Online Supplementary Fig ure S2). Despite ChIP experiments being generated in par allel by exactly the same protocol in cell lines of identical etiology, HoxA9 binding was less sharp. We noticed this phenomenon before21 and this likely reflects the fact that HoxA9 has a more relaxed binding specificity, preferring ATrich sequences. AT-rich stretches occur more frequently than the more defined Meis1 binding sites. Overall, HoxA9 binding was remarkably unaffected by the presence of Meis1. Binding profiles of HoxA9 from cells either in the ab sence or presence of Meis1 were superimposable and had a very good spearman correlation of 0.70 in global analysis (Figure 3B). This clearly suggested that HoxA9 binding is in dependent of Meis1, a molecular correlate to the fact that HoxA9 alone is able to immortalize hematopoietic cells. In order to explore the reciprocal binding dependency we created a degradable HoxA9-FKBPF36V fusion and used this construct to transform HSPC alone and in combination with Meis1. Western blots (Figure 3D, upper panel) con firmed the rapid destruction of HoxA9 in the resulting cell lines within 2 h after addition of the PROTAC while Meis1 levels were not affected. Phenotypically, degradation of HoxA9 did not cause cell death but led to a rapid differ entiation of the precursor lines forming mature granulo cytes and macrophages within 96 h (Figure 3D, lower panel). The presence of Meis1 did not alter this behavior in dicating that Meis1 alone cannot maintain the undifferenti ated, transformed state. At the molecular level the loss of HoxA9 was immediately followed by a loss of Meis1 from chromatin, with more than 90% of Meis1 disappearing in ChIP 2 h after initiating HoxA9 degradation (Figure 3E). This process did not alter Meis1 localization but rather affected
the occupation density of all Meis1 peaks (Figure 3F). In summary, these results are best reconcilable with a role for Meis1 and Pbx3 to “sharpen” enhancer activity on chromatin pre-occupied by HoxA9.
The Meis1-induced genetic program is dominated by Myc and ribosomal biogenesis. Next, we wanted to identify the genes under immediate control of Meis1 by nascent RNA sequencing. This procedure (Figure 4A) allows specific labeling, isolation, and sequenc ing of newly synthesized RNA through puls labeling of cells with 4-thiouridine reflecting thus RNA synthesis rates and transcription factor activity. Stable RNA, as determined by classical RNA sequencing, is subject to additional control mechanisms e.g., RNA export and degradation. In order to obtain a second independent experimental setup, we cre ated an additional doxycylcine-inducible (dox-inducible) Meis1 expression system (Figure 4B, upper panel). Because dox-based retroviral expression often suffers from varie gated expression, we used a fusion of a truncated LNGFR (low affinity nerve growth factor receptor) and Meis1 sep arated by a 2A “peptide bond breaker” (also called “selfcleavage” peptide) thus allowing for bicistronic expression. In this way, membrane-displayed LNGFR can be used to select and enrich properly expressing Meis1 cells. Western blots demonstrated the successful expression of Meis1 next to a minor amount of non-separated LNGFR-Meis1 fusion (Figure 4B, lower panel). EPC protease ko animals have no hematopoietic abnormality22 and there is no indication that the absence of cytoplasmic granule proteases affects HSPC specific genetic programs. Nevertheless, we set up the doxinducible system in wt cells to call only those Meis1 target genes that are concordantly regulated in both genetic backgrounds.
The doxycycline-inducible and degron constructs were tested for biological activity, checking their reversible ability to modulate transcription of the Meis1 sentinel gene Flt3 (Figure 4C). Both Meis1 derivatives induced Flt3 strongly, in dicating their proper function.
Guided by the Flt3 expression kinetics, nascent RNA was generated before and 24 h after degradation of Meis1FKBPF36V with dTAG13 at a time point when expression changes of this known primary target reached a maximum while keeping secondary effects to a minimum. Because of the considerable slower response of the dox system, reac tion time was extended to 72 h for dox addition. Transcrip tion rates in Meis1-on and Meis1-off states were determined in both systems by NGS followed by mapping against the mm10 reference database. Genes with RPKM >1 were con sidered expressed and included in further analysis. We cal culated the log2-fold changes between the Meis-on and Meis-off states for each gene in the dTAG-degradation and dox-inducible system and defined a gene as overall signifi cantly changing if the sum of the respective log2-fold

Figure 3. HoxA9 is epistatic to Meis1. (This figure is supplemented by the Online Supplementary Figure S2). (A) Meis1 and Pbx3 bind in a more defined pattern than HoxA9. Integrative genomics viewer (IGV) plots detailing binding of Meis1, Pbx3 and HoxA9 either in cells co-expressing Meis1 (HoxA9 + Meis1) or in cells in the absence of Meis1 (HoxA9_noMeis1). Sharp colocalized peaks for Meis1 and Pbx3 are different from more diffuse HoxA9 binding characteristics. (B) HoxA9 binding does not change after introduction of Meis1. Global comparison of HoxA9 binding in the vicinity of Meis1 peaks in cells transformed by HoxA9 or by HoxA9 in combination with Meis1 as indicated. (C) Meis1 and Pbx3 co-localize in areas of high HoxA9 density. Metagene plots depicting binding intensity of HoxA9, Meis1, and Pbx3 around identified Meis1 peaks. Heatmaps are ordered top to down according to decreasing Meis1 binding strength. Plotted are the 10,000 top-scoring Meis1 peaks as before. (D) Meis1 by itself cannot maintain the transformed state of precursor cells. Upper panel: western blot demonstrating rapid degradation of HoxA9FKBPF36V after addition of dTAG13 without affecting Meis1 protein levels. Lower panel: May-Grünwald-Giemsa stained cytospin preparations of hematopoietic stem and precursor cells (HPSC) lines generated after transduction either with HoxA9-FKBPF36V alone or a combination of HoxA9-FKBPF36V with Meis1. Cells are shown before and 96 hours (h) after induction of HoxA9 degradation by the addition of dTAG13. Differentiation with generation of mature granulocytic cells and macrophages is observed in both cases. (E) Meis1 rapidly leaves chromatin after HoxA9 degradation. IGV plots demonstrating Meis1 occupancy at Myb and Flt3 loci in the presence of HoxA9 and 2 h after induction of HoxA9 degradation. (F) Meis1 exits from chromatin rather than changes localization after loss of HoxA9. Global Meis1 read density comparison in the presence and after degradation of HoxA9. A global left shift of Meis1 densities combined with a relative maintenance of correlation indicates loss from chromatin rather than redistribution.
changes was larger than one for induced genes or smaller than minus one for repressed genes [(log2(0 h/24 h))degron + (log2(72 h/0 h)dox >1 or <-1] (Online Supplementary Table S1). In total this yielded 492 induced genes (corresponding to 725 different GeneBank accession numbers) and 198 re pressed genes (312 accession numbers) suggesting that Meis1 acts predominantly as activator. For visual represen tation in Figure 4D (Online Supplementary Figure S3A for repressed genes) RPKM values obtained in the individual experiments (dTAG-degradable, dox-inducible) were added. Because Meis1 recognizes pre-activated enhancers rather than creating de novo transcription, relative expression changes were mostly moderate. Of all Meis1-induced genes Myc was highest expressed. A Myc dominance was also corroborated by gene set enrichment analysis (GSEA). The Meis1-induced gene expression program showed an un usually good match with the Myc-expression profile de posited in the molecular signature database (MSigDB) (Figure 4D, inset and Online Supplementary Figure S3B). This fit well with strong Meis1/Pbx3 binding occuring at the known32 long-range Myc enhancer (Online Supplementary Figure S3C). A further conspicuous feature of Meis1 con trolled expression was the upregulation of a large number of genes coding for ribosomal and ribosomal biogenesis components. This included ribonucleoproteins, ribosome biogenesis regulator 1, nucleolar proteins, small nucleolar RNA and/or their respective host genes and also subunit D of RNA polymerase I (Polr1d), the sum of which we label “ri bosomal cloud”. This feature was also corroborated by GSEA (Online Supplementary Figure S3D). Regulation of ri bosomal genes by Meis1 was supported by direct Meis1 binding in the vicinity of the respective genes as exemplary shown for the top ten genes that characterize the molecu lar signature “KEGG_ribosome” in GSEA (Online Supplemen tary Figure S4A and B). In primary acute myeloid leukemia (AML) samples generated from 562 patients,33 Pearson cor relation between MEIS1 and these ribosomal genes gen erally amounted to between 0.2 and 0.3 (Online
Supplementary Figure S4C). In order to put this in perspec tive, the well established Meis1 target FLT3, with a much larger regulatory amplitude (several orders of magnitude) compared to ribosomal genes, reached a correlation of 0.42 in this data set. Therefore we conclude that Meis1 is likely also involved in ribosomal transcription in human AML. Re flecting the precursor nature of HSPC transformed by HoxA9/Meis1, genes repressed by Meis1 encompassed dif ferentiation promoting factors like Ngp (neutrophil granule protein), Cebpe (CAAT enhancer binding protein epsilon) and Id2 (inhibitor of DNA binding 2). In line with a physically largely overlapping binding pattern of HoxA9 and Meis1 about 40% (175/461) of all Meis1 targets, including Myc, have been also found to be positively controlled by HoxA9 in our previous study21 (Figure 4D, inset). This overlap was even greater for Meis1 repressed transcripts with 111/198 genes also showing a similar response to HoxA9 (Online Supple mentary Figure S3A, inset). This supports a role of Meis1 as amplifier of a transformative state pre-established by HoxA9.
In order to elucidate individual contribution of down stream targets to the overall Meis1 phenotype we decided to further investigate the known oncogenes Myc , and JunB as the two most strongly expressed Meis1 targets and the regulatory outlier Angptl4 that codes for a soluble growth factor involved in the etiology of various solid tu mors.34 After confirming their Meis1-dependent transcrip tion (Figure 5A), these genes were individually transduced into HoxA9 pre-transformed primary HSPC. Reverse tran scription quantitative real-time polymerase chain reac tion (RT-qPCR) confirmed that their expression exceeded the levels observed in HoxA9/Meis1 cells (Figure 5B). In addition, we verified that these targets do not feed back and induce Meis1 expression themselves (Online Supple mentary Figure S5). We recorded proliferation, cell cycle

Figure 4. The Meis1 induced gene expression program is dominated by Myc and ribosome biogenesis. (This figure is supplemented by the Online Supplementary Figure S3 and S4 and the Online Supplementary Table S1). (A) The primary Meis1 controlled gene expression program can be determined by nascent RNA sequencing. Overview of experimental strategy. (B) Meis1 expression can be positively induced in a doxycycline (dox)-controlled system. Schematic depiction of an “all-in-one” inducible expression system based on a self-inactivating (SIN) retroviral backbone. LTR: long terminal repeat, self-inactivating after proviral integration; LNGFR: truncated low affinity growth factor receptor displayed on membrane for antibody-based (anti human CD271) cell selection; 2A: viral-derived “self-cleaving” peptide, blocking peptide bond formation during translation and thus allowing expression of two proteins from fusion sequence; rtTA3: reverse tetra/dox-inducibel transactivator of 3rd generation; IRES: internal ribosomal entry site, puro: puromycin resistance. The western blot shows expression of HA-Meis before and 72 hours (h) after addition of dox in transduced hematopoietic stem and precursor cells (HPSC). Small amounts of full length LNGFR-2A-Meis1 fusion are also visible. The western was done with hot SDS extracts as the dox-inducible Meis1 system was introduced in wild-type (wt) cells. (C) The conditional Meis1 expression constructs are biologically active. The amount of RNA coding for the Meis1 sentinel gene Flt3 was determined by reverse transcription quantitative real-time polymerase chain reaction (RT-qPCR) in a time series either after induction of Meis1 expression by dox addition or after induction of Meis1-FKBPF36V degradation by supplementation with dTAG13. In order to demonstrate reversibility inducers were washed out after 48 h and re-added again after 120 h. Values were normalized to actin transcripts and starting amounts before treatment were defined as one unit. (D) Meis1 induces a Myc and ribosome-synthesis dominated gene expression program. Transcription rates in inducible Meis1 cells were determined in the Meis_on (72 h dox-added or dTAG13 absent) and in the Meis_off state (doxabsent or 24 h dTAG13 present) by nascent RNA sequencing. For graphical representation
RPKM expression values for each gene bank accession number were added and plotted in Meis_on and Meis_off states. Shown are values (collapsed to individual genes) for all genes with a significant induction defined as log2(RPKMMeis_on/RPKMMeis_off)dox + log2(RPKMMeis_on/RPKMMeis_off)dTAG > 1.0. Red dots denote the top 30 outliers in gene expression change. The top 100 expressed accessions are colored orange (aggregated to gene names). Red labels identify genes investigated further. The left inset shows a Venn-diagram displaying overlap of primary Meis1 induced transcripts with HoxA9 targets identified previously21 by a similar approach. The right inset depicts the top-scoring result of a gene set enrichment analysis demonstrating a strong similarity of the Meis1-induced expression pattern to the known Myc-regulated program.
distribution and colony forming cell (CFC) numbers of doubly transduced cells. In these experiments Myc fully mimicked the cell cycle and proliferation stimulation by Meis1 (Figure 5C and D) but neither JunB nor Angptl4 re corded any effect. High Myc levels also increased CFC numbers, but due to the replicate variability in replating assays, the moderate effect of the other genes remained insignificant (Figure 5E).
Transformed cells derived from primary HSPC need high levels of cytokines (SCF, IL-3, GM-CSF, and IL6) for viabil ity and growth. Recording cytokine dependency in MTT vi ability/growth tests allows judging if Meis1 or any of its target genes influence cellular signaling. In these experi ments only Myc showed a tendency to alleviate depend ency on cytokines (Figure 6A). All others including Angpltl4 coding for a known signaling molecule were inactive, thus largely ruling out an impact on signal pro cessing as crucial for enhanced leukemogenesis. Next, we probed the influence of Meis1 and the selected target genes on cellular differentiation. HoxA9 transformed cells can be forced to differentiate in vitro by replacing the growth cytokine mixture by G-CSF. Morphologically Meis1 and Myc expression retarded differentiation (Figure 6B, upper panel) with no effect recorded for JunB and Angptl4 (not shown). The concomitant downregulation of surface Kit (CD117) was slower for Meis1 co-expressing cells (Figure 6B, lower panel) with CD117 still detectable after 72 h of GCSF treatment.
Finally, we tested if Myc accelerates leukemogenesis similar to Meis1 in syngenic transplantation experiments (Figure 6C). Whereas HoxA9/Meis1-transduced cells caused rapid and fully penetrant disease in the recipient animals this
was clearly not the case for HoxA9/Myc cells. This result was additionally supported by a recent report of Miyamoto et al.20 that performed comparable experiments with longer follow-up. Thus two independent studies confirmed that Myc does not fully substitute for Meis1 in leukemogensis despite the fact that Myc can explain the proliferative as pect of Meis1 expression. Therefore, Meis1 clearly has func tions beyond a simple Myc enhancer.
The salient abundance of ribosomal biogenesis com ponents under Meis1 control led us to check if Meis1 also influences rRNA transcription. For this purpose we quanti fied 18s rRNA by RT-qPCR in the Meis-FKBPF36V degron sys tem during a cycle of addition/withdrawal/addition of dTAG13 (Figure 7A). As ribosomal loci are not annotated in the mouse genome (version mm10) it is difficult to calcu late rRNA transcriptional rates from the sequencing data. Yet, qPCR confirmed that 18s rRNA concentrations clearly followed Meis1 activity. The Meis1-dependent stimulation of rRNA transcription translated to a significantly higher resistance of Meis1-containing cells against CX5461, an in hibitor of RNA polymerase I (Figure 7B). Importantly, this was not observed with Myc-overexpressing cells thus underscoring this fact as unique property of Meis1. The presence of Meis1 also conferred higher resilience to pu romycin treatment in MTT viability assays (Figure 7C). Pu romycin is a translation chain terminator that incapacitates actively transcribing ribosomes. Cells that are able to replace stalled ribosomes at a faster pace are expected to be more puromycin resistant. This was clearly observed for Meis1 but much less pronounced after sole
Figure 5. Myc controls the proliferative aspect of Meis1 activity (This figure is supplemented by the Online Supplemental Figure S5). (A) Myc, JunB, and Angptl4 are direct targets of Meis1. Transcription rates of Myc, JunB, and Angptl4 were determined by reverse transcription quantitative real-time polymerase chain reaction (RT-qPCR) on nascent RNA isolated in a time series after induction/degradation of Meis1. The response kinetics suggest direct control by Meis1. (B) Individual expression of single target genes. RT-qPCR after transduction of HoxA9-transformed cells with individual Meis1 target genes demonstrates higher expression than in HoxA9 + Meis1 cells. (C) Myc and Meis1 accelerate cell proliferation. Individual cell lines, transduced as labeled were cultivated under identical conditions and cell proliferation was determined by counting triplicates. *P<0.05 in two-sided t test. (D) Myc and Meis1 induce cell cycle. Propidium-iodide staining of test cell lines demonstrates more cells in cell cycle (S/M and G2 phases) as consequence of Meis1 or Myc coexpression. Values correspond to averages and standard deviations of triplicate experiments. **P<0.05 in two-sided t-test. (E) Myc increases colony forming cell (CFC) numbers. CFC capacity was tested for all test lines by seeding 5,000 cells in triplicate into semi solid methylcellulose medium and by counting resulting colonies after 4 to 6 days of incubation. Average and standard deviation is given. *P<0.05 in two-sided t-test.
expression of Myc. Notably, Meis1 did not simply induce a general tolerance against toxins because treatment of cells with the DNA-intercalating agent doxorubicine did not reveal a differential sensitivity of the respective cells (Figure 7D).

We also checked the concentration of ribosomal protein S6, its phosphorylation status, as well as overall protein synthesis rates by short-term incorporation of a fluor escently labeled puromycin derivative (OPP-puro assay). These assays did not indicate a significantly elevated number of ribosomes or an increase in overall protein syn thesis capacity. A slight increase of S6 induced by Meis1 and Myc was counteracted by a concomitant reduction in phospho-S6 (Figure 7E). As a consequence the overall pro tein synthesis activity was unchanged between the indi vidual cell lines (Figure 7F). This indicates that Meis1 enhances the synthesis rate of ribosomes rather than their final activity under steady state conditions.
During the normal trajectory of hematopoietic devel opment, cells must exit the highly proliferative precursor state and therefore they need to curb the pro-proliferative activity of HoxA9 and Meis1 at some point. Previously, we have shown that Meis1 stability is regulated by Pbx3. Pbx3 interacts with Meis1 blocking access to an ubiquitination site and as a consequence it inhibits proteasomal degra dation.4 This mechanism has a slow response rate, as it requires the cessation of Pbx3 transcription and the loss of remaining Pbx3 protein. In an attempt to identify faster act ing regulatory mechanisms, we scanned the PhosphoSite Plus database (www.phosphosite.org) for known post-translational modifications of Meis1. Strong phos phorylation of Meis1 has been detected at a serine stretch between amino acids (aa) 192 and aa 200 with the highest modification density occurring on S196 (Figure 8A). Because
Figure 6. Myc does not substitute for Meis1. (A) Meis1 does not influence cytokine signaling. Test cell lines were plated in medium supplemented with a serial dilution of cytokines (1-fold =100 ng/mL stem cell factor [SCF] plus 10 ng/mL each of interleukin 3 [IL-3], IL-6, and granulocyte macrophage colony-stimulating factor [GM-CSF]). Proliferation/viability was tested after 72 hours (h) by a standard MTT test in triplicates and plotted relative to the value in 1-fold cytokines that was set to one unit. Averages and standard deviations are plotted. Only Myc-overexpressing cells showed a significant effect (P<0.05, two sided t-test) for some values. (B) Upper panel: Meis1 and Myc differentially retard morphological differentiation. May-Grünwald-Giemsa stained cytospin preparations of primary hematopoietic cells as indicated. If grown in cytokine mix (SCF, IL3, IL6, GM-CSF) HoxA9 transformed cells have myeloid precursor morphology independent of the co-transduced gene. HoxA9 + vector cells are shown as representative example. Switching cytokine substitution to 10 ng/mL G-CSF for 72 h forces cells into differentiation with Meis1 and Myc retarding this process. Lower panel: surface CD117/Kit expression was determined in test lines as indicated. Data were recorded in normal conditions supplemented with four cytokines and 72 h after induction of forced differentiation by replacement of normal cytokine supplementation by G-CSF showing that Meis1 acts stronger than Myc. (C) Myc does not accelerate leukemia development. Kaplan-Meier graph depicting disease free survival of sublethally irradiated syngenic animals transplanted with cell lines transduced as indicated.

this is immediately downstream of the Pbx3 interaction site, we decided to study the influence of phosphorylation on Meis1 stability and Pbx3 binding. For this purpose, we constructed a phosphomutant version replacing three ser ines against alanine (Meis_AKADA) and a phosphomimetic version (Meis_DKDD) introducing two negatively charged as partic acid (D) residues. The effect of the mutations on sta bility was tested first by transfection of wt Meis1 and the respective phospho-mutants together with Pbx3 into 293T cells. A Meis1 deletion eliminating Pbx3 binding served as additional control (Figure 8B). Phosphorylation site mutants
and Pbx3 co-expression had independent effects on Meis1 stability. Co-expression of Pbx3 increased detectable Meis1 protein for each mutant derivative and this effect was in verted upon deletion of the Pbx3 interaction domain an ef fect that we have observed earlier.4 However, phospho-site mutations had a clear Pbx3-independent effects on Meis1 stability. The phosphomimetic Meis-DKDD accumulated to much higher levels than wt-Meis1 whereas the phosphodefective Meis-AKADA showed reduced stability. A similar reduction of phospho-defective Meis1 amounts was also seen after transduction of HSPC with HoxA9 and the re
Figure 7. Meis1 boosts ribosomal biogenesis capacity. (A) Ribosomal RNA (rRNA) transcription correlates with Meis1 activity. Total RNA was isolated from cells transformed by HoxA9 and Meis1-FKBPF36V in a time series after induction of Meis1, degradation, recovery, and a second degradation phase. Concentrations of 18S rRNA were determined by reverse transcription quantitative real-time polymerase chain reaction (RT-qPCR) and are plotted relative to the starting value. (B) Meis1 increases resistance against RNA polymerase I inhibition. Cells transduced as indicated were subjected to treatment with increasing concentrations of the RNA polymerase I inhibitor CX5461 and viability was determined by MTT assay. Values are plotted based on untreated cells set to one unit. Averages and standard deviation of a triplicate are shown. (C) Meis1 cells increases resilience towards puromycin. Experiment done as above. (D) Co-expression of Meis1 or Myc does not alter sensitivity towards doxorubicine. (E) Meis1 and Myc have a minor influence on steady state and phosphorylation levels of ribosomal protein S6. Cells transduced as indicated were lysed, and the equivalent of 40,000 cells were loaded per lane on a SDS PAGE for detection with S6 and phospho-S6 specific antibodies. (F) Meis1 and Myc do not alter steady-state protein synthesis rate. Cells were incubated with O-propargyl-puromycin (OPP) for 30 minutes, fixed and then OPP was conjugated with Alexa-Fluor 488 and chain-terminated translation products were recorded by fluorescence-activated cell sorting.

F
Figure 8. Meis1 and HoxA9 stability is controlled by caseine kinase 2-mediated phosphorylation. (A) Meis1 contains a phosphorylation site closely downstream of the Pbx3 binding domain. Schematic depiction. (B) Pbx3 and phosphorylation control Meis1 stability independently. Wild-type Meis1 (Wt-Meis1), a phosphodefective mutant (AKADA) exchanging respective serines against alanines, as well as a phosphomimetic version (DKDD) mimicking modification by introduction of negative charges were transfected with and without Pbx3 in 293T cells. Meis1 stability was recorded by western blot. Meis1 with a deletion of the Pbx3 binding domain was added as additional control. (C) Meis1_AKADA is unstable in primary myeloid cells. Hematopoietic stem and precursor cells (HPSC) were transduced as indicated and the resulting cell lines were tested for Meis1 and HoxA9 expression by western blot. (D) Inhibition of caseine kinase 2 reduces Meis1 and HoxA9 concentrations and phosphomimetic mutants are resistant. Primary cells transduced with wt HoxA9 and either wt-Meis1 or Meis1_DKDD were treated for 4 hours (h) with increasing concentrations of the caseine kinase 2 inhibitor CX4945 as indicated. Cell extracts were probed by western blotting for Meis1 and HoxA9. (E) HoxA9 is regulated by casein kinase 2. Upper panel: schematic location of the known HoxA9 phosphorylation site. Lower panel: western blots made with extracts from cells transduced with phosphomimetic versions of HoxA9 (HoxA9_DGGD) and Meis1 (Meis1_DKDD) probed for HoxA9 and Meis1 after treatment with CX4945. (F) Left panel: densitometric evaluation of protein stability under casein kinase 2 inhibition. Protein amounts of HoxA9 and Meis1 wt and phosphomimetic versions were determined by densitometric analysis and normalization to actin levels corresponding to western blots shown in (D), left and (E). Right panel: introduction of phosphomimetic HoxA9 and Meis1 mutants does not significantly increase overall resistance of cells against casein kinase 2 inhibition. Cells transduced either with wt versions or with phosphomimetic variants of HoxA9 and Meis1 as indicated were subject to varying concentrations of the caseine kinase inhibitor CX4945 for 72 h and viability/proliferation was tested by MTT assay. Relative values are plotted with untreated cells set to one unit.

spective Meis1 derivatives (Figure 8C). In contrast to the transient system where the large amounts of protein likely cannot be fully modified, in primary cells wt-Meis1 was as stable as phosphomimetic Meis-DKDD suggesting that Meis1 is fully phosphorylated in these cells. Next, we determined the responsible kinase for this modi fication. As the respective serines are embedded in a caseine kinase 2 (CK2) consensus site, we treated wt-Meis1 and phosphomimetic Meis-DKDD-transduced HSPC with increasing concentrations of a specific CK2 inhibitor (CX4945) and determined short term effects on HoxA9 and Meis1 concentrations after 4 h by western blot (Figure 8D). In these experiments CK2 activity correlated closely with Meis1 concentrations (Figure 8D, left panel) and introduc tion of the phosphomimetic changes conferred resistance to CK2 inhibition (Figure 8D, right panel). Unexpectedly, we noted that also HoxA9 responded to a block of CK2 func tion. According to the PhosphoSite database HoxA9 is phosphorylated at serine 183 that is located within another CK2 consensus site (Figure 8E, upper panel). Alteration of this serine to aspartic acid to create a phosphomimetic HoxA9-DGGD and introduction of this mutant together with Meis1-DKDD into HSPC yielded cells where both, HoxA9 and Meis1 were resistant to CK2 inhibition (Figure 8E, lower panel and see Figure 8F, left panel for a summarized den sitometric evaluation). Therefore we conclude that CK2 is an important natural regulator of Hox/Meis activity in pri mary cells. With respect to application in patients, the cur rent general CK2 inhibitors are suboptimal. It has been estimated that CK2 phosphorylates up to 20% of all pro teins in a cell.35 Therefore, CK2 inhibitors may have a small therapeutic window. This was reflected by the fact that cells transformed with either wt-HoxA9/wt-Meis1 or with a combination of their phosphomimetic counterparts showed a nearly identical response towards CK2 inhibition by CX4945 (Figure 8F, right panel) indicating that other, un known CK2 targets also limit overall viability in these cells.
Here we provide the molecular correlate of the experi mental observation that Meis1 enhances leukemogenesis in combination with HoxA9 while on its own it has no dis cernible effect on hematopoietic development. Despite the fact that Meis1 and its binding partner Pbx3 contain autonomous homeobox DNA binding domains, HoxA9 is epistatic in hematopoietic cells. In the absence of HoxA9, Meis1 cannot maintain a stable DNA interaction and exits from chromatin. While an increased avidity for DNA of HoxA9/Meis1 dimers and HoxA9/Meis1/Pbx3 trimers was suggested previously by in vitro co-precipitation experi ments4,36 the rapid loss of Meis1 at its binding sites in vivo was unexpected. Previous experiments37 insinuated that
dimerization of transcription factors would modify binding site specificity i.e., directing dimers to different binding sites compared to monomers. Instead, the presence of Meis1 endows enhancers pre-bound by HoxA9 with addi tional activity without altering HoxA9 distribution itself. This makes HoxA9 a bona fide pioneering transcription factor, a fact that is strongly supported by the finding that HoxA9 can induce de novo enhancers.38 HoxA9 by itself appears to have a more relaxed in vivo DNA binding spe cificity, characterized by a “diffuse” distribution. In com bination with Meis1, chromatin areas are demarcated that define the center of functional enhancers. Meis1 peaks de lineate the “valleys” of regions with high levels of enhancer modifications H3K27ac and H3K4me1. Thus, Meis1 focuses and concentrates enhancer activity, an effect that we call “enhancer sharpening”. It is easy to see how this process may aid to develop an increasingly active and novel en hancer architecture from previously inactive chromatin during differentiation of HSC into highly proliferative pre cursors.
The effect of enhancer sharpening rather than the creation of completely new transcriptional elements fits well to the gene expression changes that we observed after induction of Meis1. Mainly, Meis1 intensified a pre-existing and pri marily HoxA9-dependent gene expression pattern. Still, amplification of Myc action and the strong stimulation of ribosome biogenesis are crucial and contribute to the phenotypic manifestation of Meis1 expression. Myc, as a predominantly proliferative driver has been shown to be a major factor in the HoxA9-dependent gene expression program.20,21 Cell division, however, is strongly regulated at several levels, and besides cell cycle stimulation, it requires previous cell growth i.e., an increase in cellular mass. As ribosomal proteins constitute the most abun dant proteins in a cell and rRNA is responsible for >90% of all RNA, synthesis of new ribosomes as preparation for actual cell division is a major bottleneck.39 Details about ribosome biogenesis checkpoint regulation are not yet completely clarified but it is clear that cell division cannot be executed without sufficient ribosomes. As a con sequence cells with high expression of cell cycle drivers, like Myc become addicted to high ribosomal biogenesis rates, a fact that has been recently also shown for Myc in duced lymphoma.40 The extraordinary sensitivity of hema topoietic development towards perturbation in ribosome biogenesis is underscored by the hematopoietic pheno type of ribosomopathies. Meis1 expression helps to satisfy ribosomal biosynthesis requirements of normal hemato poietic precursors and obviously also as prerequisite for efficient leukemogenesis. Strikingly, an essential step dur ing ribosome maturation, the snoRNA guided modification of rRNA, has been recently shown to be a crucial hallmark also of the AML-ETO-induced leukemogenic gene ex pression program.41
It is still difficult to target transcription factor activity for therapeutic purposes. Elucidating how normal cells regu late transcriptional activity may reveal possible solutions to this problem. We show that posttranscriptional phos phorylation of HoxA9 and Meis1 by caseine kinase 2 is one mechanism how cells regulate activity of these two fac tors. This process is highly conserved during evolution as there is evidence that the insect homolog of caseine ki nase 2 controls activity of the fly homeobox protein an tennapedia during embryogenesis.42 Caseine kinase 2 is constitutively active, yet that pertains to cells in culture that are permanently cycling. It is not completely clear if this is also true for mostly non-cycling primary cells. CK2 inhibitors are tested in early clinical trials for various ad vanced solid and hematopoietic tumors. Results have not been published yet and it will be seen if an exploitable therapeutic window exists. The finding that CK2 acts ex tremely pleiotropic is a caveat, but the rapid and direct response of HoxA9 and Meis1 to a small molecule treat ment of an orally available inhibitor at least hints to a promising starting point for further drug development.
1. Collins CT, Hess JL. Deregulation of the HOXA9/MEIS1 axis in acute leukemia. Curr Opin Hematol. 2016;23(4):354-361.
2. Collins EM, Thompson A. HOX genes in normal, engineered and malignant hematopoiesis. Int J Dev Biol. 2018;62(11-12):847-856.
3. Berthelsen J, Kilstrup-Nielsen C, Blasi F, Mavilio F, Zappavigna V. The subcellular localization of PBX1 and EXD proteins depends on nuclear import and export signals and is modulated by association with PREP1 and HTH. Genes Dev. 1999;13(8):946-953.
4. Garcia-Cuellar MP, Steger J, Fuller E, Hetzner K, Slany RK. Pbx3 and Meis1 cooperate through multiple mechanisms to support Hox-induced murine leukemia. Haematologica. 2015;100(7):905-913.
5. Dickson GJ, Liberante FG, Kettyle LM, et al. HOXA/PBX3 knockdown impairs growth and sensitizes cytogenetically normal acute myeloid leukemia cells to chemotherapy. Haematologica. 2013;98(8):1216-1225.
6. Li Z, Chen P, Su R, et al. PBX3 and MEIS1 Cooperate in hematopoietic cells to drive acute myeloid leukemias characterized by a core transcriptome of the MLL-rearranged disease. Cancer Res. 2016;76(3):619-629.
7. Li Z, Zhang Z, Li Y, et al. PBX3 is an important cofactor of HOXA9 in leukemogenesis. Blood. 2013;121(8):1422-1431.
8. Thorsteinsdottir U, Kroon E, Jerome L, Blasi F, Sauvageau G. De
ning roles for HOX and MEIS1 genes in induction of acute myeloid leukemia. Mol Cell Biol. 2001;21(1):224-234.
9. Wang GG, Pasillas MP, Kamps MP. Meis1 programs transcription of FLT3 and cancer stem cell character, using a mechanism that requires interaction with Pbx and a novel function of the Meis1 C-terminus. Blood. 2005;106(1):254-264.
10. Ambinder AJ, Levis M. Potential targeting of FLT3 acute myeloid leukemia. Haematologica. 2021;106(3):671-681.
11. Morgado E, Albouhair S, Lavau C. Flt3 is dispensable to the Hoxa9/Meis1 leukemogenic cooperation. Blood.
No conflicts of interest to disclose.
MPGC, and RKS performed and analyzed experiments; AP cloned and tested degron constructs; RKS performed NGS data analysis, conceived and supervised experiments; RKS wrote the manuscript. All authors read and discussed the manuscript.
We thank Renate Zimmermann for technical assistance.
This work was supported by research funding from Deutsche Krebshilfe grant 70114166 and in part by the Deutsche For schungsgemeinschaft grant SL27/9-2 both awarded to RKS.
NGS reads are available with the European Nucleotide Archive under accession number ERP134562/PRJEB50012.
2007;109(9):4020-4022.
12. Staffas A, Arabanian LS, Wei SY, et al. Upregulation of Flt3 is a passive event in Hoxa9/Meis1-induced acute myeloid leukemia in mice. Oncogene. 2017;36(11):1516-1524.
13. Mohr S, Doebele C, Comoglio F, et al. Hoxa9 and Meis1 cooperatively induce addiction to Syk signaling by suppressing miR-146a in acute myeloid leukemia. Cancer Cell. 2017;31(4):549-562.e11.
14. Kocabas F, Zheng J, Thet S, et al. Meis1 regulates the metabolic phenotype and oxidant defense of hematopoietic stem cells. Blood. 2012;120(25):4963-4972.
15. Simsek T, Kocabas F, Zheng J, et al. The distinct metabolic profile of hematopoietic stem cells reflects their location in a hypoxic niche. Cell Stem Cell. 2010;7(3):380-390.
16. Wang Y, Liu Y, Malek SN, Zheng P, Liu Y. Targeting HIF1alpha eliminates cancer stem cells in hematological malignancies. Cell Stem Cell. 2011;8(4):399-411.
17. Yusuf RZ, Wang YH, Scadden DT. The secrets of the bone marrow niche: Metabolic priming for AML. Nat Med. 2012;18(6):865-867.
18. Sulima SO, Hofman IJF, De Keersmaecker K, Dinman JD. How ribosomes translate cancer. Cancer Discov. 2017;7(10):1069-1087.
19. Chlon TM, Stepanchick E, Hershberger CE, et al. Germline DDX41 mutations cause ineffective hematopoiesis and myelodysplasia. Cell Stem Cell. 2021;28(11):1966-1981.e6.
20. Miyamoto R, Kanai A, Okuda H, et al. HOXA9 promotes MYCmediated leukemogenesis by maintaining gene expression for multiple anti-apoptotic pathways. Elife. 2021;10:e64148.
21. Zhong X, Prinz A, Steger J, et al. HoxA9 transforms murine myeloid cells by a feedback loop driving expression of key oncogenes and cell cycle control genes. Blood Adv. 2018;2(22):3137-3148.
22. Guyot N, Wartelle J, Malleret L, et al. Unopposed cathepsin G, neutrophil elastase, and proteinase 3 cause severe lung damage
and emphysema. Am J Pathol. 2014;184(8):2197-2210.
23. Milne TA, Zhao K, Hess JL. Chromatin immunoprecipitation (ChIP) for analysis of histone modifications and chromatinassociated proteins. Methods Mol Biol. 2009;538:409-423.
24. Garcia-Cuellar MP, Buttner C, Bartenhagen C, Dugas M, Slany RK. Leukemogenic MLL-ENL fusions induce alternative chromatin states to drive a functionally dichotomous group of target genes. Cell Rep. 2016;15(2):310-322.
25. Li H, Durbin R. Fast and accurate short read alignment with Burrows-Wheeler transform. Bioinformatics. 2009;25(14):1754-1760.
26. Robinson JT, Thorvaldsdottir H, Winckler W, et al. Integrative genomics viewer. Nat Biotechnol. 2011;29(1):24-26.
27. Heinz S, Benner C, Spann N, et al. Simple combinations of lineage-determining transcription factors prime cis-regulatory elements required for macrophage and B cell identities. Mol Cell. 2010;38(4):576-589.
28. Ramirez F, Ryan DP, Gruning B, et al. deepTools2: a next generation web server for deep-sequencing data analysis. Nucleic Acids Res. 2016;44(W1):W160-165.
29. Dobin A, Davis CA, Schlesinger F, et al. STAR: ultrafast universal RNA-seq aligner. Bioinformatics. 2013;29(1):15-21.
30. Li H, Handsaker B, Wysoker A, et al. The Sequence Alignment/Map format and SAMtools. Bioinformatics. 2009;25(16):2078-2079.
31. Wu T, Yoon H, Xiong Y, Dixon-Clarke SE, Nowak RP, Fischer ES. Targeted protein degradation as a powerful research tool in basic biology and drug target discovery. Nat Struct Mol Biol. 2020;27(7):605-614.
32. Bahr C, von Paleske L, Uslu VV, et al. A Myc enhancer cluster regulates normal and leukaemic haematopoietic stem cell hierarchies. Nature. 2018;553(7689):515-520.
33. Tyner JW, Tognon CE, Bottomly D, et al. Functional genomic landscape of acute myeloid leukaemia. Nature. 2018;562(7728):526-531.
34. Fernandez-Hernando C, Suarez Y. ANGPTL4: a multifunctional protein involved in metabolism and vascular homeostasis. Curr Opin Hematol. 2020;27(3):206-213.
35. Spinello Z, Fregnani A, Quotti Tubi L, Trentin L, Piazza F, Manni S. Targeting protein kinases in blood cancer: focusing on CK1alpha and CK2. Int J Mol Sci. 2021;22(7):3716.
36. Ryoo HD, Marty T, Casares F, Affolter M, Mann RS. Regulation of Hox target genes by a DNA bound Homothorax/Hox/Extradenticle complex. Development. 1999;126(22):5137-5148.
37. Jolma A, Yin Y, Nitta KR, et al. DNA-dependent formation of transcription factor pairs alters their binding specificity. Nature. 2015;527(7578):384-388.
38. Sun Y, Zhou B, Mao F, et al. HOXA9 reprograms the enhancer landscape to promote leukemogenesis. Cancer Cell. 2018;34(4):643-658.e5.
39. Lessard F, Brakier-Gingras L, Ferbeyre G. Ribosomal proteins control tumor suppressor pathways in response to nucleolar stress. Bioessays. 2019;41(3):e1800183.
40. Domostegui A, Peddigari S, Mercer CA, et al. Impaired ribosome biogenesis checkpoint activation induces p53-dependent MCL-1 degradation and MYC-driven lymphoma death. Blood. 2021;137(24):3351-3364.
41. Zhou F, Liu Y, Rohde C, et al. AML1-ETO requires enhanced C/D box snoRNA/RNP formation to induce self-renewal and leukaemia. Nat Cell Biol. 2017;19(7):844-855.
42. Jaffe L, Ryoo HD, Mann RS. A role for phosphorylation by casein kinase II in modulating Antennapedia activity in Drosophila. Genes Dev. 1997;11(10):1327-1340.
Benedetta Rambaldi,1,2 Haesook T. Kim,3 Yohei Arihara,1,4 Takeru Asano,1,5 Carol Reynolds,1 Mariah Manter,1 Max Halpern,1 Augustine Weber,1 John Koreth,1 Corey Cutler,1 Mahasweta Gooptu,1 Sarah Nikiforow,1 Vincent T. Ho,1 Joseph H. Antin,1 Rizwan Romee,1 Jeanette Ampudia,6 Cherie Ng,6 Stephen Connelly,6 Robert J. Soiffer1 and Jerome Ritz1
1Department of Medical Oncology, Dana-Farber Cancer Institute and Harvard Medical School, Boston, MA, USA; 2Ph.D. Program in Translational and Molecular Medicine (DIMET), University of Milano-Bicocca, Monza, Italy; 3Department of Data Science, Dana-Farber Cancer Institute, Harvard T H Chan School of Public Health, Boston, MA, USA; 4Department of Medical Oncology, Sapporo Medical University, Sapporo, Japan; 5Department of Hematology and Oncology, Himeji Red Cross Hospital, Hyogo, Japan and 6Equillium, La Jolla, CA, USA
Correspondence: J. Ritz
jerome_ritz@dfci.harvard.edu
Received: December 8, 2021.
Accepted: April 15, 2022.
Prepublished: April 28, 2022.
https://doi.org/10.3324/haematol.2021.280444
©2022 Ferrata Storti Foundation
Published under a CC-BY-NC license
CD6 is a co-stimulatory receptor expressed on T cells that binds activated leukocyte cell adhesion molecule (ALCAM), expressed on antigen presenting cells, epithelial and endothelial tissues. The CD6-ALCAM pathway plays an integral role in modulating T-cell activation, proliferation, and trafficking. In this study we examined expression of CD6 by reconstituting T cells in 95 patients after allogeneic cell transplantation and evaluated the effects of itolizumab, an antiCD6 monoclonal antibody, on T-cell activation. CD6 T cells reconstituted early after transplant with CD4 regulatory T cells (Treg)-expressing lower levels of CD6 compared to conventional CD4 T cells (Tcon) and CD8 T cells. After onset of acute graft-versus-host disease (aGvHD), CD6 expression was further reduced in Treg and CD8 T cells compared to healthy donors, while no difference was observed for Tcon. ALCAM expression was highest in plasmacytoid dendritic cells (pDC), lowest in myeloid dendritic cells (mDC) and intermediate in monocytes and was generally increased after aGvHD onset. Itolizumab inhibited CD4 and CD8 T-cell activation and proliferation in preGvHD samples, but inhibition was less prominent in samples collected after aGvHD onset, especially for CD8 T cells. Functional studies showed that itolizumab did not mediate direct cytolytic activity or antibody-dependent cytotoxicity in vitro. However, itolizumab efficiently abrogated the costimulatory activity of ALCAM on T-cell proliferation, activation and maturation. Our results identify the CD6-ALCAM pathway as a potential target for aGvHD control and a phase I/II study using itolizumab as first line treatment in combination with steroids for patients with aGvHD is currently ongoing (clinicaltrials gov. Identifier: NCT03763318).
Acute graft-versus-host disease (aGvHD) continues to be an important cause of morbidity and mortality after al logeneic hematopoietic cell transplantation (HCT).1 Ste roids provide effective treatment, but most patients with severe aGvHD do not achieve a complete response. 2,3 Moreover, steroid treatment is often associated with se vere toxicities. Novel therapeutic options are needed and different strategies to selectively modulate alloreactive T cells and antigen-presenting cells (APC) have been studied for the treatment of steroid refractory GvHD. Various approaches are currently being evaluated in clinical trials including: i) targeting key inflammatory mediators (IL-6, siltuximab or tocilizumab), ii) selective
depletion of alloreactive T cells (ricin-conjugated antiCD3/CD7, anti-CD30 brentuximab, post-transplant cyclo phosphamide), iii) modulation of cytokine-driven signal transduction (ruxolitinib), iv) inhibition of target organ homing (anti-integrin α 4 β 7, vedolizumab) and v) in hibition of costimulatory signals (abatacept).4 Despite these advances, treatment of steroid refractory GvHD re mains a challenge.5
The co-stimulatory receptor CD6 is a 105-130 kDa type I transmembrane glycoprotein belonging to the highly con served scavenger receptor cysteine-rich superfamily (SRCR-SF).6 CD6 is expressed on the majority of T cells and minor populations of B and natural killer (NK) cells.7,8 CD166, activated leukocyte cell adhesion molecule (ALCAM) is the primary ligand for CD6.9 ALCAM is ex
pressed on APC and various epithelial and endothelial cells.10,11 Upon ligation, the CD6-ALCAM complex helps sta bilize the immunological synapse between the T cell and the APC. In this context, CD6-ALCAM binding promotes Tcell activation, proliferation, maturation, and trafficking from the intravascular space into tissues, including the central nervous system.12–17 Early studies by Soiffer and colleagues demonstrated that ex vivo depletion of CD6+ donor T cells prior to transplantation markedly decreased the incidence of aGvHD, highlighting the importance of CD6+ T cells in pathogenesis of GvHD.18–21 Itolizumab, a humanized IgG1 anti-CD6 monoclonal anti body, has been shown to block CD6 signaling, leading to a reduction in T-cell activation and proliferation.22 Itolizu mab therapy has been evaluated for treatment of different autoimmune disorders,9 such as severe chronic plaque psoriasis23 and COVID-19 cytokine-release syndrome with promising results.24 However, it is not known whether blocking the CD6-ALCAM pathway with itolizumab can modulate T-cell responses after allogeneic HCT in the set ting of aGvHD.
In the present study, we characterized the expression of CD6 and ALCAM by reconstituting immune cells in a co hort of 95 patients who underwent allogeneic HCT and examined the effects of itolizumab on T-cell responses in vitro in the setting of aGvHD. Our results show that T cells and dendritic cells (DC) expressed CD6 and ALCAM, re spectively early after HCT and surface expression of both structures is maintained during aGvHD. Then, we demon strated the ability of itolizumab to inhibit in vitro T-cell proliferation and activation in peripheral blood (PB) ob tained from patients with aGvHD, in an ALCAM-dependent manner without causing T-cell depletion. Our results pro vide new insights into the mechanisms of action of itol izumab and suggest that targeting the CD6-ALCAM co-stimulatory pathway represents a novel approach for prevention and treatment of aGvHD.
This study included 95 patients who underwent allogeneic HCT at the Dana-Farber Cancer Institute and Brigham and Woman’s Hospital (Boston, MA) between September 2018 and January 2020. Blood samples were obtained at 1, 2, 3 and 6 months after transplant for analysis of CD6 and ALCAM expression. Samples from nine healthy donors (HD) were used as controls. Samples from nine additional patients and nine HD were used for in vitro functional as says (Online Supplementary Table S1). Written informed consent was obtained from all patients and HD prior to sample collection, in accordance with the Declaration of Helsinki. Protocol approval was obtained from the Human
Subjects Protection Committee of the Dana-Farber/Har vard Cancer Center.
Monitoring CD6 and ALCAM immune reconstitution
Immune reconstitution was evaluated by flow cytometry using fresh whole blood samples. For analysis, both per centages of positive cells and median fluorescence inten sity (MFI) were considered. Two panels of directly conjugated monoclonal antibodies (Online Supplementary Table S2) were used to define the expression of CD6 and ALCAM on functionally distinct T-cell and APC subsets, re spectively. After staining, cells were acquired on a For tessa LSR flow cytometer (BD Biosciences) and analyzed using FlowJo and Cytobank software. Cell gating strategy and markers used for cell subset definition are described in the Online Supplementary Figure S1 and S2
Functional activity of itolizumab in vitro
Frozen peripheral blood mononuclear cells (PBMC) ob tained from patients who developed aGvHD after trans plant (Online Supplementary Table S1) were stimulated using anti-CD3/CD2/CD28 beads in the presence of itol izumab or isotype control cetuximab. T-cell proliferation, activation and maturation were evaluated after 72 hours of culture using the flow cytometry panel in Online Sup plementary Table S3. An example of the gating strategy used in this analysis is shown in the Online Supplementary Figure S3. Detailed description of the protocol is provided in the Online Supplementary Appendix.
Complement-dependent cytotoxicity, antibody direct cytotoxicity and antibody-dependent cellular cytotoxicity assays
The ability of itolizumab to induce complement-dependent cytotoxicity (CDC), antibody direct cytotoxicity (ADC) or antibody-dependant cytotoxicity (ADCC) was measured as the percentage of cell lysis in the presence of itolizumab compared to alemtuzumab as positive control or cetuximab as negative control. For ADCC evaluation we also measured the percent CD107a+ cells on NK cells after 6 hours of cul ture.25 Detailed descriptions of CDC, ADC and ADCC proto cols are provided in the Online Supplementary Appendix
Recombinant human ALCAM Fc chimera (ALCAM-Fc) and anti-CD3 antibody were resuspended in phospahte-buf fered saline overnight at 4°C in flat bottom 96-well plate. The day after, HD CD3+ T cells were added and cultured in media with itolizumab or cetuximab for 96 hours. Cells were analyzed using flow cytometry (Online Supplemen tary Table S4). Detailed description of the protocol is pro vided in the Online Supplementary Appendix and Online Supplementary Figure S3
In order to investigate the expression of CD6 and its ligand ALCAM during immune reconstitution after allogeneic HCT, we prospectively studied a homogeneous population of 95 adult patients with hematological malignancies. Clinical characteristics of these patients are summarized in Table 1. Median patient age at the time of transplant was 61 years (range, 19-76 years). All patients received pretrans plant conditioning with busulfan and fludarabine and
Table 1. Patient characteristics.
N (%)
Total 95 (100)
Patient age in years at HCT, median (range) 61 (19-76)
Patient sex, male 55 (57.9)
Donor age in years, median (range) 29 (18-67)
Donor sex, male 57 (60)
HLA matched related donor 26 (27.4)
HLA matched unrelated donor 63 (66.3)
Partially HLA mismatched unrelated donor 6 (6.3) Female donor for male recipient 17 (18) Patient or donor CMV serostatus, positive 64 (67.4)
Disease
ALL 6 (6.3)
AML 52 (54.7)
MDS 12 (12.6)
MPD
(8.4)
(8.4)
Others† 9 (9.6)
Disease status at transplant
Complete remission 2 (2.1)
GvHD prophylaxis with tacrolimus and methotrexate. Half of the patients received a myeloablative conditioning regimen (50.5%) and almost all patients received PB stem cell (PBSC) grafts (97.9%). A matched unrelated donor (MUD) was used in 63 patients (66.3%). Median follow-up among survivors was 12 months (range, 4-20 month).
Median donor T-cell chimerism was 76% 1 month after HCT and 96% at 6 months (Table 2). Acute GvHD occurred in 42 patients (44.2%) at a median of 50 days after transplant (range, 20-294 days).
CD6 is expressed on T cells early after transplant but expression levels vary in different T-cell populations
We first examined the percent of T cells expressing CD6 as well as the level of CD6 expression on different T-cell populations measured by MFI. While almost all T cells ex pressed CD6, expression level was highest in conventional CD4 T cells (Tcon) and lowest in CD4 regulatory T cells (Treg) while CD8 T cells displayed intermediate levels of CD6 expression (Figure 1A and B). CD6 expression was maintained at all time points after HCT and both percen tage of CD6+ cells and CD6 MFI were comparable between HD and patients at the different time points analyzed. The only exception was a reduction of CD6 MFI in Treg cells after transplant compared to HD. We also divided T cells into five maturation stages based on the expression of CD45RA, CCR7 and CD95: naïve (CD45RA+, CCR7+, CD95 ), stem cell memory (SCM, CD45RA+, CCR7+, CD95+), central memory (CM, CD45RA , CCR7+), effector memory (EM,
Table 2. Engraftment, chimerism and acute graft-versus-host disease outcomes.
N (%)
ANC ≥ 500 cells/mm3 95 (100)
% Donor T-cell chimerism, median (range)
+30 76 (14-100) Day +100 86 (24-100) Day +180 96 (45-100)
Acute GvHD
(44.2)
remission
(69.5) Active disease /untreated 27 (28.4)
Cell source
Bone marrow
Peripheral blood stem cells
Conditioning intensity
Myeloablative
intensity
to acute GvHD onset, median (range)
Maximum Grade
(2.1)
(97.9)
(50.5)
(49.5)
HCT: hematopoietic cell transplantation; CMV: Cytomegalovirus; ALL: acute lymphoid leukemia; AML: acute myeloid leukemia; MDS: myelodysplastic syndrome; MPN: myeloproliferative neoplasm; NHL: non-Hodgkin lymphoma; †chronic myeloid leukemia (CML, n=2); chronic lymphocytic leukemia (CLL, n=1); chronic myelomonocytic leukemia (CMML, n=3) and mixed myelodysplastic/ myeloproliferative neoplasm (mixed MDS/MPN, n=3).
Acute GvHD Sites
Acute GvHD patients treated systemically
refractory acute GvHD
(20-294)
(38.1)
(40.5)
(7.1)
(14.3)
(73.8)
(14.3)
(40.5%)
(81%)
(11.8%)
GvHD: graft-versus-host disease; ANC: absolute neutprophil count.
Figure 1. CD6 expression on T cells after hematopoietic cell transplantation. (A) Percentage of CD6-positive cells and (B) CD6 median fluorescence intensity (MFI) on regulatory CD4 T cells (Treg, red boxes), conventional CD4 T cells (Tcon, blue boxes) and CD8 T cells (CD8, green boxes) in healthy donors (HD) and in patients at 1, 2, 3 and 6 months after hematopoietic cell transplantation (HCT). Box plots indicate median, Q1 and Q3 and min and max. (C) Representative gating strategy used to define T-cell subsets, based on the expression of CD45RA, CCR7 and CD95 markers. (D) Heat map summarizes the median CD6 MFI values in the different T-cell subsets in HD and in patients at 1, 2, 3 and 6 months after HCT. White stars show statistically significant differences between HD and samples after transplant (any P<0.05). (E) CD6 MFI on Treg, Tcon and CD8 T cells based on the expression of PD-1 in HD and in patients at 1, 2, 3 and 6 months after HCT. Statistically significant differences are noted: ****P<0.0001; ***P< 0.001; **P<0.01; *P<0.05; Wilcoxon rank-sum test.

CD45RA , CCR7 ) and terminally differentiated effector memory (TEMRA, CD45RA+, CCR7 ) (Figure 1C). As shown in the heat map in Figure 1D, Tcon subsets displayed the highest CD6 MFI. In both Tcon, Treg and CD8 T cells, CM T cells have the highest expression of CD6, while EM T cells express the lowest levels. CD6 expression was maintained after transplant at levels similar to HD, with the exception
of lower CD6 MFI in CM and EM Treg in patients compared to HD. Finally, we examined whether CD6 was differentially expressed on PD-1 positive T cells, since PD-1 represents a marker of T-cell activation and exhaustion that is up regulated after T-cell receptor (TCR) engagement.26 For all three T-cell populations, we observed that PD-1-positive T cells expressed signi

cantly lower levels of CD6 com
Figure
ALCAM expression on monocytes and dendritic cells
hematopoietic cell transplantation.
Representative gating strategy used to
dentritic cell (DC) subsets, based on the expression of CD11c and CD123 in
ow cytometry. (B) Percentage of ALCAM-positive cells and (C) levels of ALCAM expression (MFI) on CD14+ monocytes (grey boxes), myeloid DC (mDC, light-blue boxes) and plasmacytoid DC (pDC, green boxes) in healthy donors (HD) and in patients at 1, 2, 3 and 6 months after hematopoietic cell transplantation (HCT). Correlation of PD-L1 and ALCAM expression on (D) mDC and (E) pDC. Statistically signi
cant differences are
<0.01;
<0.05; Wilcoxon rank-sum test.
pared to PD-1-negative T cells in both HD and patients after transplant (Figure 1E).
In order to examine whether the CD6-ALCAM pathway represents a suitable target for aGvHD treatment, we also analyzed ALCAM expression on monocytes and DC. DC were divided into two major populations based on the ex pression of CD11c and CD123: myeloid DC (mDCs, CD11c+ and CD123 ) and plasmacytoid DCs (pDs, CD11c and CD123+, Figure 2A). In HD, almost all monocytes and pDC expressed ALCAM, but significantly fewer mDC expressed ALCAM. After transplant, significantly fewer monocytes and pDC expressed ALCAM compared to HD but the mag nitude of this difference was relatively small (Figure 2B). ALCAM expression (MFI) was highest on pDC, relatively low on mDC and intermediate on monocytes (Figure 2C). ALCAM MFI on pDC after transplant was similar to HD con trols whereas ALCAM MFI on monocytes was significantly elevated compared to HD in the first month after trans plant. In contrast, ALCAM MFI was lower in mDC after transplant compared to HD. We also examined whether ALCAM expression on mDC and pDC was correlated with expression of PD-L1. As shown in Figure 2D and E, there was a weak positive correlation between ALCAM and PDL1 expression on mDC, while no correlation was observed for pDC, where almost all cells uniformly express high levels of ALCAM.
CD6 and ALCAM expression are maintained during acute graft-versus-host disease
In order to examine whether CD6 and ALCAM expression were affected by the development of aGvHD, we com pared CD6 and ALCAM MFI in samples obtained before (preGvHD) and after aGvHD onset (postGvHD) with samples from HD and from patients that did not develop aGvHD (noGvHD). Based on the median time of aGvHD onset, preGvHD samples were compared to noGvHD samples collected at 1 and 2 months after transplant while postGvHD samples were compared with noGvHD samples collected at 3 and 6 months after transplant. As shown in Figure 3A, Tcon expressed high levels of CD6 in both pre- and postGvHD samples that were similar to HD and patients who did not develop aGvHD. CD6 expression by Treg and CD8 T cells in aGvHD samples was signifi cantly decreased compared to HD but was similar to noGvHD samples. When compared to HD, ALCAM ex pression was increased on CD14 monocytes preGvHD but there were no differences in expression by mDC and pDC (Figure 3B). Despite small differences, ALCAM expression was generally maintained at similar levels in monocytes, mDC and pDC in patients with and without aGvHD. We only observed a slightly increased ALCAM MFI on mDC in
postGvHD samples compared to noGvHD samples (Figure 3B).
We also compared samples from patients who developed aGvHD with patients who did not at specific time points after transplant. We observed a small decrease of CD6 MFI in Tcon and CD8 T cells in the GvHD cohort at 1 month, compared with the noGvHD group. For ALCAM we ob served a higher ALCAM MFI and percentage of ALCAMpositive cells on mDC in the GvHD cohort compared to noGvHD at 3 months after transplant (Online Supplemen tary Figures S4 and S5). In order to address the impact of systemic aGvHD treatment (steroids) on CD6 and ALCAM expression, we compared samples from patients with low grade aGvHD who only received topical therapy with pa tients with higher grade aGvHD who received systemic steroids. With the limitation of a low number of samples, we did not observe significant differences for CD6 ex pression on T cells and no clear trend was observed for ALCAM expression on monocytes and DC (data not shown).
Itolizumab inhibits in vitro T-cell proliferation, activation and maturation after T-cell receptor engagement
In order to test the ability of itolizumab to modulate T-cell responses after TCR stimulation, cryopreserved PBMC ob tained from nine patients before (preGvHD, median time between GvHD and sample collection -24; range, -32 to -7 days) and after GvHD onset (postGvHD, median time be tween GvHD and sample collection 20; range, 0-64 days) were stimulated with antiCD3/CD2/CD28 in the presence of itolizumab or isotype control antibody (cetuximab). Clinical characteristics of these patients are summarized in the Online Supplementary Table S1. Of note, postGvHD samples were collected from patients who were receiving aGvHD treatment (steroids) and one patient was also re ceiving ruxolitinib at the time of sample collection. Only one sample was collected at aGvHD onset prior to starting treatment for aGvHD. T-cell proliferation, activation and maturation were evaluated 72 hours after stimulation using flow cytometry. Prior to GvHD onset, itolizumab in hibited CD4 and CD8 T-cell proliferation in a similar fashion to HD control. This effect was less prominent in CD8 T cells collected after GvHD onset (Figure 4A). Similar results were observed for CD25 expression, as a marker of T-cell activation and CD45RO expression, as a marker of T-cell maturation into memory subsets (Figure 4B and C). Itolizumab inhibited these other measures of T-cell ac tivation in both CD4 and CD8 T cells from HD and from patients prior to aGvHD. However, increased expression of CD25 and CD45RO on T cells in postGvHD samples were no longer inhibited by itolizumab. After TCR stimulation, we also observed increased ALCAM expression on both CD4 and CD8 T cells from HD and transplant patients. However, except for CD8 T cells collected preGvHD, no
Figure 3. Expression of CD6 and ALCAM in patients after hematopoietic cell transplantation with and without acute graftversus-host disease. (A) Levels of CD6 expression (median fluorescence intensity [MFI]) in Treg, Tcon and CD8 T cells. (B) Levels of ALCAM expression (MFI) in CD4 regulatory T cells (Treg), conventional CD4 T cells (Tcon) and CD8 T cells. Before graft-versus host disease (preGvHD) samples (green boxes) and after GvHD (postGvHD) samples (red boxes) from patients who developed acute GvHD are compared with noGvHD samples obtained at different times after transplant (grey boxes) and healthy donors (HD) (blue boxes). Statistically significant differences are noted: ***P<0.001; **P<0.01; *P<0.05; Wilcoxon rank-sum test. HD n=9, preGVHD n=30, postGVHD n=20, noGVHD 1 month (1m) n=38, 2 months (2m) n=40, 3 months (3m) n=43 and 6 months (6m) n=21.
statistically significant inhibition was observed using itol izumab (Figure 4D).
Comparisons of inhibition achieved by itolizumab for each of these assays in CD4 and CD8 T cells from HD and pa tients after transplant are shown in Figure 4E. In all as says, the level of inhibition induced by itolizumab in preGvHD T cells was similar to that achieved in HD. Itol izumab induced less inhibition of proliferation in both CD4 and CD8 T cells collected after GvHD onset. Less inhibition was also noted for CD25 expression in CD8 T cells postGvHD but there were no differences in the ability of itolizumab to inhibit CD45RO and ALCAM expression in both CD4 and CD8 T cells in any groups.

Itolizumab does not induce complement-dependent cytotoxicity, antibody-dependent cytotoxicity or antibody direct cellular cytotoxicity
In order to test the ability of itolizumab to induce direct or indirect killing of target cells we evaluated the effects
of itolizumab in CDC, ADC and ADCC assays. Cell lysis in the presence of itolizumab was compared to alemtuzu mab as positive control or cetuximab as negative control. The gating strategy used to measure target cell lysis is shown in the Online Supplementary Figure S6. Itolizumab did not mediate CDC or ADC at 6 or 24 hours. After 6 hours of incubation, itolizumab did not induce ADCC measured either by direct lysis of target cells or degranulation of CD107a on NK cells (Figure 5).
Itolizumab activity is dependent on the presence of ALCAM
In order to test whether the inhibitory activity of itolizu mab was dependent on the presence of ALCAM, T cells from HD were stimulated with anti-CD3 antibody with or without ALCAM-Fc for 96 hours. Itolizumab or isotype control cetuximab were added at the start of each culture. As shown in Figure 6A, the addition of cetuximab or itol izumab did not induce proliferation of CD4 or CD8 T cells

Figure 4. Inhibition of T-cell proliferation, activation and differentiation by itolizumab. Cryopreserved peripheral blood mononuclear cells (PBMC) obtained from healthy donors (HD) and patients before or after acute graft-versus-host disease (aGvHD) onset were stimulated with anti-CD3/CD2/CD28 beads in the presence of itolizumab or isotype control (cetuximab). (A) Proliferation of CD4 and CD8 T cells measured by CFSE dye dilution; (B) Activation of CD4 and CD8 T cells measured by expression of CD25; (C) maturation of CD4 and CD8 T cells measured by expression of CD45RO; (D) ALCAM expression is absent in resting T cells and is an additional marker of T-cell activation. (E) Percent inhibition induced by itolizumab, comparing activity against HD, pre- and postGvHD samples in CD4 and CD8 T cells. Percentage inhibition was calculated using the following formula: (% cells in isotype control - % cells in itolizumab)/% cells in isotype control. If no difference was observed between isotype control and itolizumab the percentage of itolizumab inhibition equals 0%. Statistically significant differences are noted: **P<0.01; *P<0.05; Wilcoxon rank-sum test. HD n=9, preGvHD n=7, postGvHD n=8.
alone, and anti-CD3 induced proliferation of CD4 or CD8 T cells was not inhibited by the addition of either antibody. The addition of ALCAM-Fc to anti-CD3 further enhanced CD4 and CD8 T-cell proliferation. The addition of itolizu mab significantly impaired this increased proliferation when compared to the addition of cetuximab. When T cells were monitored for activation (expression of CD25, Figure 6B) and maturation (expression of CD45RO, Figure 6C), itolizumab had similar effects on both CD4 and CD8 T cells and inhibitory activity was only detected in the presence of both anti-CD3 and ALCAM-Fc. As shown Fig ure 6D, activation of CD4 and CD8 T cells with anti-CD3 also induces expression of ALCAM and this is further en hanced in the presence of ALCAM-Fc. In this setting, the presence of itolizumab inhibits increased expression of ALCAM even if ALCAM-Fc is not present.

Acute GvHD remains a frequent cause of non-relapse
mortality and contributes to poor quality of life in patients who have undergone allogeneic HCT. Corticosteroids are administered as first line therapy, but steroid treatment fails to achieve complete responses in up to 50% of cases and is also associated with short and long term toxicities.5 Ideally, new treatment approaches for GvHD should be aimed at specific modulation of donor T-cell alloreactivity and induction of tolerance rather than nonspecific T-cell depletion or broad inhibition of T-cell functions which can increase risk of tumor immune escape as well as oppor tunistic infections.27 In this study we demonstrate that blocking the CD6-ALCAM co-stimulatory pathway inhibits T-cell activation and proliferation thus representing a new potential target for GvHD prevention and treatment. In deed, CD6 is highly expressed on Tcon after HCT, and its expression is maintained at the onset of aGvHD. Moreover, expression of ALCAM, the primary ligand for CD6, is in creased in DC and monocytes in patients who develop aGvHD. In contrast, Treg express lower levels of CD6,28–30 and targeting CD6 with itolizumab could preferentially af fect Tcon while sparing Treg, thus promoting a more tole
Figure 5. Testing itolizumab for complement-dependent cytotoxicity, antibody-dependent cytotoxicity and antibody direct cellular cytotoxicity. For complement-dependent cytotoxicity (CDC) and antibody-dependent cytotoxicity (ADC), CD3+ T cells were isolated from cryopreserved peripheral blood mononuclear cells (PBMC) from healthy donors (HD) and cultured in the presence of medium + antibody + 25% of human serum (HS) and medium + antibody, respectively. Percentage cell lysis was calculated by combining the percentage of positive cells for 7-AAD or Annexin V or both. CDC activity was calculated by subtracting the values obtained in medium + antibody from the values obtained in the culture with medium + antibody + HS. ADC activity was calculated by subtracting the values obtained in the culture with medium alone from the values obtained in the culture with medium + antibody. CDC and ADC were assessed after 6 and 24 hours of culture. For antibody direct cellular cytotoxicity (ADCC) PBMC from HD were cultured in the presence of antibody for 6 hours. Both percentage cell lysis and CD107a expression on NK cells were evaluated after 6 hours of culture. The effects of itolizumab (red boxes) were compared to alemtuzumab (green boxes - positive control) and cetuximab (blue boxes - negative control). Values are expressed as mean and standard deviation (SD), paired t-test, 2 tails was used. Statistically significant differences are noted: ****P<0.0001; ***P<0.001; **P<0.01; *P<0.05; paired t-test. HD n=5.
Figure 6. Itolizumab activity is dependent on the presence of ALCAM. T cells from healthy donors (HD) were stimulated with anti-CD3 antibody with or without recombinant human ALCAM Fc chimera (ALCAM-Fc) for 96 hours. Itolizumab or isotype control cetuximab were added at the start of each culture. (A) Proliferation of CD4 and CD8 T cells; (B) expression of CD25; (C) expression of CD45RO; (D) expression of ALCAM after stimulation with anti-CD3 antibody alone or in combination with ALCAM-Fc, in the presence of cetuximab (blue boxes) or itolizumab (red boxes). Statistically significant differences are noted: **P<0.01; *P<0.05; Wilcoxon rank-sum test. HD n=10.

rogenic state. CD6 expression also varies as T cells undergo maturation.31 Naïve and central memory T cells express high levels of CD6 compared to more mature ef fector memory T cells. Previous studies have suggested that GvHD is primarily mediated by naïve T cells and these cells may also be preferentially affected by itolizumab.32–39 Similarly, we observed that PD-1 positive T cells, that are already exposed to TCR activation,26 express lower levels of CD6 compared to PD-1 negative cells. Therefore, targeting the CD6-ALCAM pathway could potentially spare
tolerogenic T-cell subsets (Treg) and more mature (EM) pathogen specific T cells, leading to a more favorable bal ance between GvHD control and maintenances of graftversus-leukemia (GvL) and anti-infection capabilities. This hypothesis is supported by previous clinical studies using T12, the first anti-CD6 monoclonal antibody used in the transplant setting. T12, an IgM antibody, induced pro found ex vivo depletion of CD6+ T cells when donor grafts were manipulated ex vivo in the presence of complement.18 Patients in these trials received myeloablative condition
ing and did not receive any prophylactic immune sup pressive medications. CD3+CD6 T cells recovered rapidly after transplantation with CD6-depleted allogeneic stem cell products with very low incidence of acute or chronic GvHD.19 Functional immune recovery was not delayed and there was no increase in viral reactivation after transplant. There was also a very low incidence of graft failure and GvL activity appeared to be preserved.20,21,40 Taken to gether, these previous clinical trials suggested that in vivo blockade of CD6 function might also be an effective ap proach for selective modulation of alloreactive T cells without affecting other critical T-cell functions. As expected, in our cohort of HCT patients, we observed mixed donor-recipient T-cell chimerism in the early posttransplant period with a median donor T-cell chimerism of 76% at 1 month. We are not able to distinguish CD6 ex pression on individual donor versus recipient T cells, but we found that CD6 expression on T cells in patients with >95% T-cell donor chimerism was similar to levels of ex pression in patients with <95% T-cell donor chimerism. Similarly, no difference was observed for ALCAM ex pression on monocytes, mDC and pDC (Online Supplemen tary Table S5). This suggests that CD6 and ALCAM are equally expressed on recipient and donor cells after trans plant.
Our studies also found that ALCAM expression was in creased on both DC and monocytes in patients with aGVHD compared to patients without aGVHD. In myeloid DC, ALCAM expression was positively correlated with PDL1 expression. ALCAM is expressed at high levels on all pDC, and this did not change when aGVHD developed. These observations support the concept that ALCAM is upregulated when DC are activated.41 ALCAM expression on DC is important for the promotion and maintenance of the immunological synapse and this is one of the mech anisms whereby ALCAM promotes T-cell activation.13 Since immune reconstitution varies depending on the transplant setting, the expression of CD6 and ALCAM should also be explored in patients with haploidentical donors and with different GvHD prophylaxis regimens such as ATG or posttransplant cyclophosphamide. Itolizumab, an IgG1 anti-CD6 monoclonal antibody has been evaluated in different autoimmune disorders,9 in cluding psoriasis,23 rheumatoid arthritis,42 Sjogren syn drome43 and in COVID-19 infection.24,44 Using PBMC from patients with aGvHD, itolizumab inhibited T-cell prolifer ation, activation, and maturation of both CD4 and CD8 T cells. This was most evident with T cells obtained just prior to development of aGvHD and less inhibition was ob served in postGvHD T cells obtained from patients receiv ing immune suppressive medications. These findings suggest that itolizumab may be more effective in early stages of GvHD in combination with steroids or as GvHD prophylaxis. Even though these ex vivo experiments lack
GvHD target tissues and do not perfectly recapitulate aGvHD in vivo, using whole PBMC, we were able to mimic the alloreactive activation of T cells in the presence of ALCAM expressed on circulating APC (monocytes and B cells) and demonstrate the inhibitory activity of itolizu mab.
Infusion of itolizumab in patients with autoimmune dis eases has resulted in only transient reduction of CD6+ circulating T cells, suggesting that this antibody does not induce profound T-cell depletion.45 This is consistent with our results demonstrating that itolizumab does not di rectly eliminate T cells in vitro in CDC, ADC or ADCC as says. Thus, the mechanism by which itolizumab inhibits T-cell function in vivo is likely through its ability to prevent the interaction between CD6 on T cells and ALCAM on APC.22 This is consistent with our in vitro results showing that the addition of itolizumab to activated CD3 T cells in the absence of ALCAM did not inhibit T-cell proliferation, activation, or maturation. However, in the presence of ALCAM, itolizumab efficiently abrogates the co-stimula tory effects of this interaction and is able to suppress Tcell proliferation, activation, and maturation. In contrast to other pan-T-cell antibodies that either activate T cells (anti-CD3) or deplete T cells (ATG, anti-CD52), itolizumab only inhibits T-cell activation in the presence of ALCAM and has no direct or indirect depleting functions. While ruxolitinib, a JAK1/2 inhibitor, is currently the only drug approved for the treatment of steroid refractory aGvHD,46 several drugs that target different T-cell costimulatory molecules are currently being tested in pre clinical models and in patients with aGvHD.4,27 In this setting, itolizumab may be a promising agent for either prevention or treatment of aGvHD, due to higher ex pression of CD6 on naïve and central memory Tcon cells, while sparing more tolerogenic Treg and effector memory T cells, important for control of both tumor cells and op portunistic infections after transplant.37 Moreover, itolizu mab may not inhibit responses to viral infections or reactivation. Indeed, different NK- and T-cell populations are involved in responses to Cytomegalovirus infection (NKG2C+CD8+ T cells) and these cells have low expression of CD6.47
Recently, Ruth and colleagues demonstrated that targeting CD6 may also be a novel approach to enhance cancer im munotherapy.48 This study utilized UMCD6, an anti-CD6 monoclonal antibody that binds the same CD6 domain (Do main 1) as itolizumab. UMCD6 upregulated the expression of the activating receptor NKG2D and downregulated ex pression of the inhibitory receptor NKG2A on both NK cells and CD8 T cells, with concurrent increased expression of perforin and granzyme-B.48 The combined capabilities of an anti-CD6 monoclonal antibody to control autoimmunity through effects on CD4 T cells and the enhanced killing of cancer cells through distinct effects on CD8 T cells and NK
cells, may represent a new approach to induce tolerance without suppressing GvL activity after HCT. In conclusion, our studies demonstrate that functional in hibition of the CD6-ALCAM co-stimulatory pathway may be a novel therapeutic strategy for prevention or treat ment of aGvHD. On the basis of these biological proper ties, a phase I/II study using itolizumab as first line treatment in combination with steroids for patients with aGvHD is currently ongoing (clinicaltrials gov. Identifier: NCT03763318). Future clinical studies may also test the feasibility and clinical efficacy of itolizumab for prevention of GvHD.
BR received research funding from Equillium; HTK, YA, TA, CR, MM, MH, AW, MG, VTH. and RR have nothing to disclose; JK has receieved research support from Clinigen, Miltenyi Biotec, BMS, Regeneron Scientific , sits on the advisory board for Therakos/Mallinckrodt, Cugene, and consults for Biolojic Design, EMD Serono/Merck, Equillium, Gentibio and Moderna; CC has a consultancy and membership on an entity's board of directors or advisory committees for In cyte, Kadmon, Jazz, Medsenic, Generon and Mesoblast; SN has membership on an entity's Board of Directors or advis ory committees for Kite, Novartis, Nkarta and Iovance; JHA serves on a Data Safety Monitoring Committee for CSL Behring; JA has current employment at Equillium; CN has current employment and is a current equity holder in a pri vate company at Equillium; SC has current employment and is a current equity holder in a private company at Equillium; RJS has a membership on an entity's board of directors or advisory committees for Kiadis and BMS and
1. Zeiser R, Blazar BR. Acute Graft-versus-host disease - biologic process, prevention, and therapy. N Engl J Med. 2017;377(22):2167-2179.
2. MacMillan ML, Weisdorf DJ, Wagner JE, et al. Response of 443 patients to steroids as primary therapy for acute graft-versushost disease: Comparison of grading systems. Biol Blood Marrow Transplant. 2002;8(7):387-394.
3. Levine JE, Braun TM, Harris AC, et al. A prognostic score for acute graft-versus-host disease based on biomarkers: a multicentre study. Lancet Haematol. 2015;2(1):e21-e29.
4. Watkins B, Qayed M, McCracken C, et al. Phase II trial of costimulation blockade with abatacept for prevention of acute GVHD. J Clin Oncol. 2021;39(17):1865-1877.
5. Toubai T, Magenau J. Immunopathology and biology-based treatment of steroid-refractory graft-versus-host disease. Blood. 2020;136(4):429-440.
6. Martínez VG, Moestrup SK, Holmskov U, Mollenhauer J, Lozano F. The conserved scavenger receptor cysteine-rich superfamily in therapy and diagnosis. Pharmacol Rev. 2011;63(4):967-1000.
7. Aruffo A, Melnick MB, Linsley PS, Seed B. The lymphocyte glycoprotein CD6 contains a repeated domain structure
Be the Match/ National Marrow Donor Program, and con sultancy for Gilead, Rheos Therapeutics, Cugene, Precision Bioscience, VOR Biopharma, Novartis, Jazz and Takeda; JR receives research funding from Amgen, Equillium, Kite/Gi lead and Novartis; serves on Data Safety Monitoring Com mittees for AvroBio and Scienti
Advisory Boards for Akron Biotech, Clade Therapeutics, Garuda Therapeutics, Life Vault Bio, Novartis, Rheos Medicines, Talaris Therapeutics and TScan Therapeutics.
BR designed research studies, conducted experiments, ac quired and analyzed data, and wrote the manuscript; HTK analyzed data, performed statistical analysis, and wrote the manuscript; CR, MM, MH and AW acquired data; YA and TA helped in the design of functional experiments; MG, JK, CC, SN, VTH, JHA, RR, JA, CN, SC and RJS analyzed data and edited the manuscript; JR designed research studies, analyzed data, and wrote the manuscript.
We thank the staff of the Pasquarello Tissue Bank in Hema tologic Malignancies for processing all of the clinical samples analyzed in this study.
This work was supported by Equillium Inc and NIH grant PO1CA229092.
For data sharing, contact the corresponding author: je rome_ritz@dfci.harvard.edu
characteristic of a new family of cell surface and secreted proteins. J Exp Med. 1991;174(4):949-952.
8. Braun M, Müller B, ter Meer D, et al. The CD6 scavenger receptor is differentially expressed on a CD56dim natural killer cell subpopulation and contributes to natural killer-derived cytokine and chemokine secretion. J Innate Immun. 2011;3(4):420-434.
9. Consuegra-Fernández M, Lin F, Fox DA, Lozano F. Clinical and experimental evidence for targeting CD6 in immune-based disorders. Autoimmun Rev. 2018;17(5):493-503.
10. Bowen MA, Patel DD, Li X, et al. Cloning, mapping, and characterization of activated leukocyte-cell adhesion molecule (ALCAM), a CD6 ligand. J Exp Med. 1995;181(6):2213-2220.
11. Chappell PE, Garner LI, Yan J, et al. Structures of CD6 and its ligand CD166 give insight into their interaction. Structure. 2015;23(8):1426-1436.
12. Cayrol R, Wosik K, Berard JL, et al. Activated leukocyte cell adhesion molecule promotes leukocyte trafficking into the central nervous system. Nat Immunol. 2008;9(2):137-145.
13. Zimmerman AW, Joosten B, Torensma R, Parnes JR, van Leeuwen FN, Figdor CG. Long-term engagement of CD6 and ALCAM is essential for T-cell proliferation induced by dendritic
cells. Blood. 2006;107(8):3212-3220.
14. Hassan NJ, Barclay AN, Brown MH. Frontline: optimal T cell activation requires the engagement of CD6 and CD166. Eur J Immunol. 2004;34(4):930-940.
15. Hassan NJ, Simmonds SJ, Clarkson NG, et al. CD6 regulates T-cell responses through activation-dependent recruitment of the positive regulator SLP-76. Mol Cell Biol. 2006;26(17):6727-6738.
16. Nair P, Melarkode R, Rajkumar D, Montero E. CD6 synergistic costimulation promoting proinflammatory response is modulated without interfering with the activated leucocyte cell adhesion molecule interaction. Clin Exp Immunol. 2010;162(1):116-130.
17. Oliveira MI, Gonçalves CM, Pinto M, et al. CD6 attenuates early and late signaling events, setting thresholds for T-cell activation. Eur J Immunol. 2012;42(1):195-205.
18. Rohatiner A, Gelber R, Schlossman SF, Ritz J. Depletion of T cells from human bone marrow using monoclonal antibodies and rabbit complement. A quantitative and functional analysis. Transplantation. 1986;42(1):73-80.
19. Soiffer RJ, Bosserman L, Murray C, Cochran K, Daley J, Ritz J. Reconstitution of T-cell function after CD6-depleted allogeneic bone marrow transplantation. Blood. 1990;75(10):2076-2084.
20. Soiffer RJ, Murray C, Mauch P, et al. Prevention of graft-versushost disease by selective depletion of CD6-positive T lymphocytes from donor bone marrow. J Clin Oncol. 1992;10(7):1191-1200.
21. Soiffer RJ, Weller E, Alyea EP, et al. CD6+ donor marrow T-cell depletion as the sole form of graft-versus-host disease prophylaxis in patients undergoing allogeneic bone marrow transplant from unrelated donors. J Clin Oncol. 2001;19(4):1152-1159.
22. Bughani U, Saha A, Kuriakose A, et al. T cell activation and differentiation is modulated by a CD6 domain 1 antibody Itolizumab. PLoS One. 2017;12(7):e0180088.
23. Krupashankar DS, Dogra S, Kura M, et al. Efficacy and safety of itolizumab, a novel anti-CD6 monoclonal antibody, in patients with moderate to severe chronic plaque psoriasis: results of a double-blind, randomized, placebo-controlled, phase-III study. J Am Acad Dermatol. 2014;71(3):484-492.
24. Kumar S, De Souza R, Nadkar M, et al. A two-arm, randomized, controlled, multi-centric, open-label phase-2 study to evaluate the efficacy and safety of Itolizumab in moderate to severe ARDS patients due to COVID-19. Expert Opin Biol Ther. 2021;21(5):675-686.
25. Bologna L, Gotti E, Manganini M, et al. Mechanism of action of type II, glycoengineered, anti-CD20 monoclonal antibody GA101 in B-chronic lymphocytic leukemia whole blood assays in comparison with rituximab and alemtuzumab. J Immunol. 2011;186(6):3762-3769.
26. Nishimura H, Agata Y, Kawasaki A, et al. Developmentally regulated expression of the PD-1 protein on the surface of double-negative(CD4–CD8–) thymocytes. Int Immunol. 1996;8(5):773-780.
27. Hill GR, Koyama M. Cytokines and costimulation in acute graftversus-host disease. Blood. 2020;136(4):418-428.
28. Koreth J, Matsuoka K, Kim HT, et al. Interleukin-2 and regulatory T cells in graft-versus-host disease. N Engl J Med. 2011;365(22):2055-2066.
29. Pierini A, Ruggeri L, Carotti A, et al. Haploidentical age-adapted myeloablative transplant and regulatory and effector T cells for acute myeloid leukemia. Blood Adv. 2021;5(5):1199-1208.
30. Garcia Santana CA, Tung JW, Gulnik S. Human treg cells are
characterized by low/negative CD6 expression. Cytom A. 2014;85(10):901-908.
31. Carrasco E, Escoda-Ferran C, Climent N, et al. Human CD6 down-modulation following T-cell activation compromises lymphocyte survival and proliferative responses. Front Immunol. 2017;8:769.
32. Anderson BE, McNiff J, Yan J, et al. Memory CD4+ T cells do not induce graft-versus-host disease. J Clin Invest. 2003;112(1):101-108.
33. Zhang Y, Joe G, Zhu J, et al. Dendritic cell–activated CD44hiCD8+ T cells are defective in mediating acute graftversus-host disease but retain graft-versus-leukemia activity. Blood. 2004;103(10):3970-3978.
34. Chen BJ, Cui X, Sempowski GD, Liu C, Chao NJ. Transfer of allogeneic CD62L– memory T cells without graft-versus-host disease. Blood. 2004;103(4):1534-1541.
35. Dutt S, Tseng D, Ermann J, et al. Naive and memory T cells induce different types of graft-versus-host disease. J Immunol. 2007;179(10):6547-6554.
36. Chen BJ, Deoliveira D, Cui X, et al. Inability of memory T cells to induce graft-versus-host disease is a result of an abortive alloresponse. Blood. 2006;109(7):3115-3123.
37. Zheng H, Matte-Martone C, Li H, et al. Effector memory CD4+ T cells mediate graft-versus-leukemia without inducing graftversus-host disease. Blood. 2008;111(4):2476-2484.
38. Zheng H, Matte-Martone C, Jain D, McNiff J, Shlomchik WD. Central memory CD8+ T cells induce graft-versus-host disease and mediate graft-versus-leukemia. J Immunol. 2009;182(10):5938-5948.
39. Bleakley M, Heimfeld S, Loeb KR, et al. Outcomes of acute leukemia patients transplanted with naive T cell–depleted stem cell grafts. J Clin Invest. 2015;125(7):2677-2689.
40. Soiffer RJ, Fairclough D, Robertson M, et al. CD6-depleted allogeneic bone marrow transplantation for acute leukemia in first complete remission. Blood. 1997;89(8):3039-3047.
41. Figdor CG. Molecular characterization of dendritic cells operating at the interface of innate of acquired immunity. Pathol Biol. 2003;51(2):61-63.
42. Rodriguez PC, Torres-Moya R, Reyes G, et al. A clinical exploratory study with itolizumab, an anti-CD6 monoclonal antibody, in patients with rheumatoid arthritis. Results Immunol. 2012;2:204-211.
43. Le Dantec C, Alonso R, Fali T, et al. Rationale for treating primary Sjögren’s syndrome patients with an anti-CD6 monoclonal antibody (Itolizumab). Immunol Res. 2013;56(2):341-347.
44. Loganathan S, Athalye SN, Joshi SR. Itolizumab, an anti-CD6 monoclonal antibody, as a potential treatment for COVID-19 complications. Expert Opin Biol Ther. 2020;20(9):1025-1031.
45. Aira LE, López-Requena A, Fuentes D, et al. Immunological and histological evaluation of clinical samples from psoriasis patients treated with anti-CD6 itolizumab. MAbs. 2014;6(3):782-792.
46. Zeiser R, von Bubnoff N, Butler J, et al. Ruxolitinib for glucocorticoid-refractory acute graft-versus-host disease. N Engl J Med. 2020;382(19):1800-1810.
47. Sottile R, Panjwani MK, Lau CM, et al. Human cytomegalovirus expands a CD8+ T cell population with loss of BCL11B expression and gain of NK cell identity. Sci Immunol. 2021;6(63):eabe6968.
48. Ruth JH, Gurrea-Rubio M, Athukorala KS, et al. CD6 is a target for cancer immunotherapy. JCI Insight. 2021;6(5):e145662.
Anthony R. Mato,1 Boxiong Tang,2 Soraya Azmi,2 Keri Yang,2 Xiaojuan Zhang,3 Jennifer C. Stern,4 Eric Hedrick,4 Jane Huang,5 and Jeff P. Sharman6
1Memorial Sloan Kettering Cancer Center, New York, NY, USA; 2BeiGene, Ltd., Emeryville, CA, USA; 3BeiGene (Beijing) Co., Ltd, Beijing, China; 4BeiGene, Ltd., Cambridge, MA, USA; 5BeiGene USA, Inc., San Mateo, CA, USA and 6Willamette Valley Cancer Institute / US Oncology Research, Eugene, OR, USA
Correspondence: A. R. Mato
November 29, 2021.
8, 2022.
21, 2022.
Among patients with chronic lymphocytic leukemia (CLL) with deletion 17p (del[17p]), evidence from clinical trials for the effectiveness of single-agent ibrutinib as first-line therapy is limited. This retrospective analysis compared real-world clinical outcomes among patients with CLL, with and without del(17p), treated with first-line ibrutinib monotherapy. Overall survival, time to next treatment, time to treatment discontinuation, and reasons for ibrutinib discontinuation were evaluated. Using data from a real-world database, patients included were aged ≥18 years, had been diagnosed with CLL between January 1, 2011 and December 31, 2019, had undergone cytogenetic testing, and had received first-line ibrutinib monotherapy. A total of 1,069 patients were included in the analysis (62.7% male; median age 69 years); 23.8% (n=254) had del(17p). The median overall survival was significantly shorter in patients with del(17p) than in patients without (57.7 months vs. not reached; P=0.0006). Similar results were observed for median time to next treatment (49.4 months vs. not reached, P=0.0330). The median time to treatment discontinuation was non-significantly shorter in the group of patients with del(17p) (32.5 months vs. 42.9 months, P=0.3370). Results of an adjusted Cox proportional hazards model showed that the group with del(17p) was at significantly higher risk of death than was the group without del(17p) (hazard ratio=1.70, P=0.0031). Event rates for switching to new treatment and discontinuation were higher but not statistically significantly so. The most common reason for discontinuing ibrutinib treatment in both groups was toxicity, but discontinuation due to progression was significantly more frequent among patients with del(17p) (20% vs. 6%; P<0.0001). This study identifies an unmet need for more effective first-line therapeutic options in patients with CLL/small lymphocytic lymphoma and del(17p), despite the advent of ibrutinib.
In patients with chronic lymphocytic leukemia (CLL), the presence of molecular-cytogenetic lesions such as dele tion 17p (del[17p]), TP53 mutations, and/or expression of unmutated immunoglobulin heavy chain variable region (IGHV) confers a negative prognostic outcome.1-3 Among these, del(17p) and TP53 mutations are the least favorable, with patients considered at very high risk of having a poor response to initial chemoimmunotherapy or earlier re lapse after achieving remission.1,2 This unfavorable prog nosis has been attributed to the del(17p)-mediated loss of one allele of TP53, a tumor suppressor that plays a cru cial role in apoptosis, cell cycle arrest, and DNA repair in
response to genotoxic insults.4 Del(17p) is more common in relapsed/refractory CLL, but it does occur in treatmentnaïve patients, albeit at lower rates.5,6
Overall, the prognosis for patients with CLL and small lymphocytic lymphoma (SLL) has improved with the ad vent of Bruton tyrosine kinase (BTK) inhibitors. The first drug in this class, ibrutinib, was approved by the US Food and Drug Administration (FDA) in February 2014 for the treatment of patients with relapsed/refractory CLL. This approval was based on results from the pivotal RESON ATE trial, which showed that ibrutinib had efficacy in a heavily pretreated cohort of patients. However, this study included only patients with relapsed/refractory disease, and found that overall survival at 18 months was 86% and
progression-free survival was 76% in the ibrutinib arm, while in patients with del(17p) the corresponding values were 83% and 71%, respectively.7,8 Following this, the RES ONATE-2 trial was performed in the front-line setting and showed that ibrutinib was effective for treatment-naïve patients. Based on these data, FDA approval for ibrutinib was extended to first-line therapy.9 However, RESONATE2 excluded two key groups of patients: individuals younger than 65 years and those with del(17p).10 Therefore, findings from this trial do not directly reflect and may not be gen eralizable to these high-risk patients.11,12 Additional research has shown favorable outcomes for pa tients with del(17p) CLL/SLL treated with ibrutinib, but has largely focused on patients with relapsed/refractory dis ease. The phase II RESONATE-17 trial was a single-arm open-label study including 144 patients with del(17p) CLL/SLL; it showed an estimated 24-month overall survival of 75% with ibrutinib monotherapy for this population of patients.13 Likewise, an integrated analysis of three studies of ibrutinib in patients with relapsed/refractory del(17p) CLL/SLL found an estimated 12-month overall survival of 85%.14 The Alliance trial provided some insight into frontline ibrutinib use in older patients.15 However, the trial was not powered to compare results between patients with and without del(17p). Meanwhile, the phase II National Heart, Lung, and Blood Institute (NHLBI) trial investigating ibruti nib use in front-line treatment of CLL patients with TP53 alterations is ongoing.16 As such, options for front-line treatment of del(17p) CLL/SLL are largely extrapolated from experience in the relapsed/refractory setting. While ibruti nib has shown convincing data in this population to date, gaps still exist within the available data.
The aim of this observational retrospective study was to compare outcomes of patients with CLL/SLL, with and without del(17p), who received first-line ibrutinib mono therapy, in terms of the following outcomes: overall sur vival, time to next treatment, time to treatment discontinuation, and reasons for ibrutinib discontinuation. The study used information from the Flatiron Health elec tronic health record derived database, one of the largest electronic datasets of community oncology practices in the USA.
Study objectives were to (i) describe and compare base line characteristics among patients with CLL/SLL with and without del(17p) receiving first-line ibrutinib mono therapy, (ii) compare real-world overall survival, time to next treatment, and time to treatment discontinuation, and (iii) evaluate the reasons for ibrutinib discontinuation in the two groups.
De-identified patients’ data were obtained from the Flati ron Health electronic health record derived database. The initial cohort of patients was selected based on CLL/SLL codes (ICD-9: 204.10-12, or ICD-10: C91.1x, C83.0x). Patients also had to have had two or more clinic encounters and one or more antineoplastic therapy order between Janu ary 1, 2011 and December 31, 2019, along with cytogenetic testing confirming del(17p) status at or before initiation of first-line ibrutinib therapy. Patients were included in the final analysis cohort only after manual chart review, in cluding physician confirmation of diagnosis. Patients who initiated CLL/SLL treatment before entering the Flatiron Health network were excluded. Figure 1 illustrates the steps for selecting the patients.
The index date was defined as the start of first-line ibruti nib monotherapy. Patients’ characteristics of interest were: disease subtype; Rai stage at diagnosis; Eastern Co operative Oncology Group (ECOG) status at index date; del(17p), del(11q), del(13q), trisomy 12, and IGHV mutation status; and time from diagnosis to, and follow-up from, index date.
Overall survival was defined as the time between the index date and death, with patients otherwise censored at their last date of confirmed electronic health record activity. Time to next treatment was the time from the index date to initiation of a subsequent non-ibrutinib line of therapy, or to date of death (patients with no sub sequent line of therapy). Time to treatment discontinu ation was the time from the index date to discontinuation of ibrutinib for any reason; discontinuation was defined as an abstraction-confirmed discontinuation episode, death, or lack of prescription despite structured activity within the Flatiron Health network in ≥120 days after the last ibrutinib treatment. Additional details regarding the definition of a discontinuation event are provided in the Online Supplementary Material (section 1). Reasons for ibrutinib discontinuation were classified as due to disease progression, toxicity, patient’s request, financial reasons, disease-related symptoms not due to therapy, treatment completion, or other (including death).
Institutional Review Board approval of the study protocol was obtained prior to conducting the study and included a waiver of informed consent.
Descriptive statistics were used to summarize patients’ characteristics. Between-group comparisons were based on the Kruskal-Wallis test for medians and the t-test for means.
Overall survival and time to next treatment were esti mated using Kaplan-Meier curves, along with median dur ations and 95% confidence intervals (95% CI). Time to treatment discontinuation was modeled using non-para metric maximum likelihood estimator due to interval cen soring. Outcomes were compared using log-rank testing or the Sun log-rank test (2-sided significance level, 0.05). The Online Supplementary Material (section 2) contains additional details regarding these statistical tests. Cox proportional hazards model comparisons (unadjusted and adjusted) were also conducted, with adjustments made for index year; sex; age; ECOG status; Rai stage; practice type; 11q, 13q, trisomy 12 deletion; and IGHV status. De scriptive statistics were used to summarize reasons for ibrutinib discontinuation, with comparisons made using the c 2 or Fisher exact test (2-sided significance level, 0.05).
The analysis cohort consisted of 1,069 patients; of these, 254 (23.8%) had a del(17p) and 815 (76.2%) patients did not have del(17p). The baseline characteristics of the patients, categorized by the presence or absence of del(17p), are shown in Table 1. The median age at diagnosis was similar for both groups of patients (70 years for those with del[17p]; 69 years for those without del[17p]). In terms of index year, only one patient entered the study in 2013, while the largest proportion of study patients (26.7%) ene tered the study in 2018. Most patients were treated in community practices (94.6%), with the remainder (5.4%) treated in an academic setting.
At diagnosis, patients with del(17p) were more likely to be at a later Rai stage (P=0.0002); 9.1% and 10.2% of patients with del(17p) were at Rai stage 3 and 4, respectively, com pared to 5.3% and 6.6% of patients without del(17p). Pa tients with del(17p) also received first-line ibrutinib sooner after diagnosis, with a median 0.8 years from diagnosis to index date, compared to 2.3 years for patients without del(17p) (P<0.0001). Overall, the median follow-up was 17.5 months. Meanwhile, the median follow-up was longer in the group with del(17p) (20.4 months) than in the group without del(17p) (16.3 months, P=0.0001). A majority of pa tients (58.2%) had ECOG performance status ≤1 at entry into the study, with no significant differences between the two groups. In terms of other genetic prognostic factors, as shown in Table 2, there was a statistically significant difference between the percentages of patients with and without del(17p) who also had deletion 11q (P<0.0001), deletion 13q (P=0.0238), trisomy 12 (P<0.0001), or IGHV mutated status (P=0.0227).

Outcomes of interest, including median overall survival, time to next treatment, and time to treatment discontinu
ation, are summarized in Table 3. For the overall cohort, median overall survival and median time to next treatment were not reached, while the median time to treatment discontinuation was 38.6 months (95% CI: 33.4, 42.9). The
Figure 1. Selection of the study population. *One patient started ibrutinib in 2013, prior to its approval; the remainder started ibrutinib therapy between 2014-2019. CLL: chronic lymphocytic lymphoma; Del(17p): 17p deletion; FISH: fluorescence in situ hybridization; SLL: small lymphocytic lymphoma.
median overall survival was shorter in the group with del(17p) (57.7 months) than in the group without del(17p), in which the median was not reached (P=0.0006) (Table 3; Figure 2A). The median time to next treatment was also significantly shorter in the group with del(17p) than in the group without del(17p) (49.4 months vs. not reached; P=0.0330). The median time to treatment discontinuation
1. Description and comparison of patients’ characteristics.
Patients’ characteristics
Sex, n (%)
was shorter in the group with del(17p) than in the group without del(17p); however, this difference was not statis tically significant (32.5 months vs. 42.9; P=0.3370). In terms of event rates in the overall cohort, the rates of death, switching to a new treatment, and treatment discontinuation were 15.0%, 24.2%, and 32.1%, respectively (data not shown). As shown in Table 4, the rate of death
Del(17p) present
Del(17p) absent
P value
0.5331Female 399 (37.3) 99 (39.0) 300 (36.8)
Male 670 (62.7) 155 (61.0) 515 (63.2)
Age in years at diagnosis
0.2214Median (IQR) 69 (61-76) 70 (62-78) 69 (61-76)
Range 31-85 35-85 31-85
Disease subtype, n (%)
CLL 884 (82.7) 211 (83.1) 673 (82.6)
CLL/SLL 122 (11.4) 29 (11.4) 93 (11.4)
SLL 63 (5.9) 14 (5.5) 49 (6.0)
Rai stage at diagnosis, n (%)
0 301 (28.2) 46 (18.1) 255 (31.3)
I 171 (16.0) 39 (15.4) 132 (16.2)
II 53 (5.0) 18 (7.1) 35 (4.3)
III 66 (6.2) 23 (9.1) 43 (5.3)
IV 80 (7.5) 26 (10.2) 54 (6.6)
Unknown 398 (37.2) 102 (40.2) 296 (36.3)
ECOG PS at index date, n (%)
0 347 (32.5) 72 (28.3) 275 (33.7)
1 275 (25.7) 66 (26.0) 209 (25.6)
2+ 92 (8.6) 18 (7.1) 74 (9.1)
Unknown 355 (33.2) 98 (38.6) 257 (31.5)
Year of index date, n (%)
2013 1 (0) 0 1 (0)
2014 26 (2.4) 12 (4.7) 14 (1.7)
2015 53 (5.0) 37 (14.6) 16 (2.0)
2016 183 (17.1) 46 (18.1) 137 (16.8)
2017 246 (23.0) 55 (21.6) 191 (23.4)
2018 286 (26.7) 63 (24.8) 223 (27.4)
2019 274 (25.6) 40 (15.7) 234 (28.7)
Years from diagnosis to index date
0.9569
0.0002
0.1364
<0.0001
Median (IQR)
1.9 (0.3-4.8) 0.8 (0.1-3.0) 2.3 (0.4-5.5) <0.0001 Mean (SD) 3.5 (4.7) 2.5 (4.7) 3.8 (4.7) 0.0002
Range 0.0-38.4 0.0-36.4 0.0-38.4
Follow-up in months from index date
Median (IQR) 17.5 (8.3-31.1) 20.4 (10.4-36.7) 16.3 (8.1-29.4) 0.0001 Mean (SD) 20.7 (14.9) 24.5 (16.8) 19.5 (14.0) <0.0001 Range 0.2-72.1 0.3-72.1 0.0-70.5 Practice type, n (%) 0.4815
Academic 58 (5.4) 16 (6.3) 42 (5.2)
Community 1011 (94.6) 238 (93.7) 773 (94.8)
CLL: chronic lymphocytic lymphoma; Del(17p): 17p deletion; ECOG: Eastern Cooperative Oncology Group; IQR: interquartile range; PS: performance status; SD: standard deviation; SLL: small lymphocytic lymphoma.
Table 2. Mutation status based on fluorescence in situ hybridization and classical cytogenetic testing.
Mutation status
Deletion 11q, N (%)
Deletion 13q, N (%)
Trisomy 12, N (%)
IGHV status, N (%)
All N=1,069
Del(17p) present N=254 Del(17p) absent N=815 P value*
Present 190 (17.8) 44 (17.3) 146 (17.9) <0.0001
Absent 856 (80.1) 193 (76.0) 663 (81.3)
Unknown 23 (2.2) 17 (6.7) 6 (0.7)
Present 502 (47.0) 122 (48.0) 380 (46.6) 0.0238
Absent 549 (51.4) 123 (48.4) 426 (52.3)
Unknown 18 (1.7) 9 (3.5) 9 (1.1)
Present 286 (26.8) 49 (19.3) 237 (29.1) <0.0001
Absent 757 (70.8) 191 (75.2) 566 (69.4)
Unknown 26 (2.4) 14 (5.5) 12 (1.5)
Mutated 174 (16.3) 31 (12.2) 143 (17.5) 0.0227
Unmutated 271 (25.4) 65 (25.6) 206 (25.3)
Indeterminate 33 (3.1) 3 (1.2) 30 (3.7)
Unknown 591 (55.3) 155 (61.0) 436 (53.5)
*Evaluates comparison of distribution between groups in which del(17p) is present and absent. Del(17p): 17p deletion; IGHV: immunoglobulin heavy chain variable.
Table 3. Median overall survival, time to next treatment, and time to treatment discontinuation.
Outcome Group
Number of patients
Number of events Median months 95% CI months Log-rank P value
OS All 1,069 160 NR 63.2-NR
Del(17p) present 254 64 57.7 51.8-NR 0.0006
Del(17p) absent 815 96 NR NR-NR
TTNT All 1,069 259 NR 49.4-NR Del(17p) present 254 86 49.4 38.0-NR 0.0330 Del(17p) absent 815 173 NR NR-NR
TTD* All 1,069 343 38.6 33.4-42.9 Del(17p) present 254 95 32.5 24.0-39.4 0.3370† Del(17p) absent 815 248 42.9 38.1-48.4
*Time to treatment discontinuation was estimated using non-parametric maximum likelihood estimator. †Calculated with the Sun log-rank test for interval censoring. CI: confidence interval; Del(17p): 17p deletion; NR: not reached; OS: overall survival; TTNT: time to next treatment; TTD: time to treatment discontinuation.
among patients with del(17p) was higher at 25.2% versus 11.8%, as were rates of starting a new treatment and dis continuation (33.9% vs. 21.2% and 37.4% vs. 30.4%, re spectively). Cox proportional hazard models showed that the hazard ratios (HR) for overall survival, time to next treatment, and time to treatment discontinuation were consistent with these findings. In the adjusted analysis, patients in the group with del(17p) were significantly more likely to die than those without del(17p) (HR=1.7; 95% CI: 1.20, 2.42; P=0.0031). Additionally, although not statistically significant, patients with del(17p) were 1.3 times more likely to receive subsequent therapy (95% CI: 0.97, 1.71; P=0.0784). At 1 year of treatment, patients with and with
out del(17p) had overall survival rates of 88% (95% CI: 83.1, 91.6) and 92% (95% CI: 89.7, 93.8), respectively (data not shown).
As shown in Table 5, out of 1,069 patients, 37% (n=395, in cluding 52 with interval censorings) discontinued ibrutinib treatment for any reason. A significantly higher proportion of patients with del(17p) than without del(17p) discontinued ibrutinib treatment due to disease progression (20% vs. 6%; P<0.0001). When considering all other reasons for discon tinuation (except for disease progression) overall discon tinuation rates were higher in the group without del(17p) (81% vs. 94%; P<0.0001). Among all individual reasons given for discontinuation, toxicity was the most common (44% in
the overall group). Meanwhile, toxicity rates in patients with del(17p) were significantly lower than in those without del(17p) (35% vs. 48%; P=0.0357). Although numbers were small, our results indicate that patients without del(17p) were also more likely to discontinue ibrutinib treatment based on patients’ request or disease-related symptoms not due to therapy. Both interval- and right-censored data effects existed in the discontinuation analysis. The Online Supplementary Material provides detailed outputs for the discontinuation analysis conducted using non-parametric maximum likelihood estimator. Online Supplementary Table S1 shows sample distributions by censoring status, while Online Supplementary Table S2 details quantile estimates for the population, stratified by del(17p) status.
The initial management of patients with CLL/SLL with del(17p) requires special attention as they are at higher risk of rapid disease progression. Chemotherapy is no longer the standard of care in this population of patients, and the

optimal treatment strategy for them is still evolving.12 While BTK inhibitors are currently considered a standard of care for these patients in the first-line setting, there is still room for improvement in defining the best approach.13,17 This retrospective cohort analysis was conducted to im prove clinical understanding of the impact of first-line ibrutinib monotherapy for patients with CLL/SLL, particu larly those with del(17p), in the real-world setting. As ex pected, our study showed that patients with del(17p) had poorer outcomes than those without del(17p). Specifically, the median overall survival and time to next treatment were significantly shorter for patients with del(17p) than for those without, while time to treatment discontinuation was non-significantly shorter with discontinuation mostly due to progression and toxicity. Furthermore, while the median overall survival and time to next treatment were not reached among patients without del(17p), among pa tients with the deletion, median survival following discon tinuation of ibrutinib was relatively short (approximately 8 months) inferred from a median time to next treatment in this group of 49.4 months while the overall survival was 57.7 months.
A
B
C
Figure 2. Kaplan-Meier curves for study outcomes. (A) Overall survival, (B) time to next treatment, and (C*) time to treatment discontinuation. *Censor marks are not shown as the non-parametric maximum likelihood estimator survival function and interval censoring method were used. With interval censoring, the event is assumed to occur within a time interval rather than at a specific time.
Table 4. Cox proportional hazards model results: del(17p) present vs. del(17p) absent.
OS Del(17p) present 25.2 1.74 1.27-2.40 0.0007 Del(17p) absent 11.8 (reference)
TTNT Del(17p) present 33.9 1.33 1.02-1.72 0.0336 Del(17p) absent 21.2 (reference)
TTD Del(17p) present 37.4 1.08 0.87-1.34 0.4720 Del(17p) absent 30.4 (reference)
OS Del(17p) present 25.2 1.70 1.20-2.42 0.0031 Del(17p) absent 11.8 (reference)
TTNT Del(17p) present 33.9 1.29 0.97-1.71 0.0784 Del(17p) absent 21.2 (reference)
TTD Del(17p) present 37.4 1.11 0.88-1.39 0.3960 Del(17p) absent 30.4 (reference)
*The following covariates are included in the adjusted analyses: sex, age at index date, practice type, Rai stage at diagnosis, Eastern Cooperative Oncology Group performance status at index date, year of index date, deletion 11q status, deletion 13q status, trisomy 12 status, and IGHV mutation status. CI: confidence interval; Del(17p): 17p deletion; OS: overall survival; TTD: time to treatment discontinuation; TTNT: time to next treatment.
The current results support findings from a 2018 retro spective cohort analysis of treatment-naïve patients with CLL/SLL (n=391) who received first-line ibrutinib. The study utilized the eligibility criteria of the RESONATE-2 trial while expanding the inclusion criteria to two key groups: patients with del(17p) and individuals younger than 65 years. Overall, at 1 year, the overall survival and pro gression-free survival were 95% and 92%, respectively, and 81% of surviving patients remained on ibrutinib. How ever, patients with del(17p) (n=110; 28% of the study popu lation) had inferior 1-year overall survival (89%, HR=3.9; P=0.001) and progression-free survival (87%, HR=1.9; P=0.04) compared to those without the deletion.11 The study reported a 1-year overall survival that was very simi lar to the current results at 1 year (88%). The consistency of this finding is noteworthy for several reasons. First, the Flatiron Health electronic health record derived database primarily represents patients from community practice settings, as opposed to academic centers, which were predominant in the earlier study, thus reflecting a con sistency between both types of practices. In addition, these results may be somewhat more representative of the US population with CLL/SLL, a majority of whom would likely be treated in community practice.18,19 This analysis also includes data that extend through 5 years of follow-up and is current through to the end of 2019. Finally, this research was based on real-world clinical practice patterns and was not limited by eligibility criteria
applied in prior clinical trials. Thus, compared with the findings of previous research, these results are represen tative of a broader patient experience with first-line ibruti nib.
Among all patients, toxicity was reported as the most common reason for ibrutinib discontinuation in 35% of pa tients with del(17p) and 48% without the deletion, which is comparable to findings in previously published studies.20,21 It was notable that patients without del(17p) were more likely to discontinue due to toxicity than those with del(17p). On the other hand, patients with del(17p) were more likely to discontinue because of disease pro gression than were patients without the deletion. This could be explained by the fact that patients with del(17p) progress more quickly than those without, as demon strated by the time to next treatment, a surrogate for pro gression-free survival, which was shorter in patients with del(17p). It may also reflect an unmet need as it is unlikely that patients with del(17p) experienced fewer toxicities than those without. Rather, this may reflect a choice by clinicians and patients to maintain treatment due to li mited viable options within the timeframe of the study. Reducing discontinuations due to toxicity could help to improve overall outcomes. In the ongoing ELEVATE-RR head-to-head trial, acalabrutinib appears to cause lower rates of cardiac adverse events than ibrutinib. 22 In an interim analysis of the head-to-head phase III AL PINE study in patients with relapsed/refractory CLL/SLL,
Table 5. Reasons for discontinuation of ibrutinib treatment.
Reasons for discontinuation of ibrutinib episode*, N (%)
All N=1,069
Del(17p) present N=254 Del(17p) absent N=815 P-value
Discontinued for any reason† (% of subgroup) 395 (37) 113 (44) 282 (35) 0.0044
Progression 40 (10) 23 (20) 17 (6) <0.0001
All reasons except progression†† 357 (90) 91 (81) 266 (94) <0.0001
Toxicity 174 (44) 39 (35) 135 (48) 0.0357
Patient request
Financial reasons
Disease-related symptoms not due to therapy
Completed treatment
(5) 2 (2) 19 (7) 0.0360
(1) 1 (1)
(2)
(0)
Other 163 (41)
(1)
(0)
(0)
(1) 0.1610
(3) 0.0286
(0) 0.1203
(44) 113 (40) 0.4460
(0)
(1) 0.1101
*Patients could have multiple discontinuation episodes. The first discontinuation episode was used to define time to discontinuation.
52 interval censored patients. ††Combined data for toxicity, patient request, financial reasons, disease-related symptoms, completed treatment, other, and unknown. Del(17p): 17p deletion.
zanubrutinib-treated patients had a lower rate of atrial fi brillation/flutter compared to those treated with ibrutinib, as well as a superior response rate and an improved pro gression-free survival.23 Despite improved tolerability with next-generation BTK inhibitors, we believe there is still a need to define the best therapeutic approach to treating patients with del(17p). Ongoing trials investigating combination therapy with tar geted agents, including BTK inhibitors, B-cell lymphoma 2 (Bcl-2) antagonists, and/or anti-CD20 monoclonal anti bodies may provide insight into improved therapeutic ap proaches for patients with del(17p). The SEQUOIA study (arm D - zanubrutinib plus venetoclax), the phase II AVO study (cohort 2 - acalabrutinib, venetoclax, and obinutu zumab), the BOVen trial (zanubrutinib, venetoclax, obinu tuzumab), and the German CLL Study Group trial CLL-2 GIVe (ibrutinib, venetoclax, obinutuzumab) are directed at or have dedicated del(17p) cohorts.24-27 These studies could help to distinguish the potential for overlapping toxicities while better defining effective first-line treatments for the management of high-risk CLL, but more time is needed to obtain follow-up data.28 Single-agent ibrutinib is currently the most frequently utilized BTK inhibitor as initial treatment for del(17p)-posi tive patients with CLL/SLL,2,17 despite a paucity of data specific to this population of patients. In the past year, there has been an increasing number of patients treated with acalabrutinib following its approval in CLL although there are less data available for this agent in patients with del(17p).29 Nevertheless, we believe that the differences in outcomes of patients with and without del(17p) described
in this study may be applicable to BTK inhibitors as a class and suggest that future randomized clinical studies li mited to patients with del(17p) are needed to best define the ideal treatment for this high-risk population. As more treatments and combination regimens appear on the hor izon to treat CLL, such as zanubrutinib and other novel agents,30 opportunities to leverage data from real-world experience and ongoing clinical studies should continue to be taken to answer some of these key questions. The question remains as to what regimen may work best in the del(17p) population.3 Anti-CD20 monoclonal anti bodies, including rituximab, ublituximab, and obinutuzu mab, are under investigation for use in combination with BTK inhibitors, and have shown mixed results. In a ran domized trial, the addition of rituximab to ibrutinib did not improve outcomes in previously untreated patients with del(17p).15,31 However, in a single-arm study, the addition of ublituximab to ibrutinib was shown to safely produce high overall response rates among patients with relapsed/re fractory del(17p) CLL/SLL.32 The subsequent phase III GENUINE trial evaluated ublituximab plus ibrutinib versus ibrutinib alone in patients with high-risk relapsed/refrac tory CLL, de
ned as the presence of del(17p) and/or del(11q) deletions and/or the TP53 mutation. Although this study was not powered to evaluate endpoints specific to individual mutation pro
rmed that pa tients with del(17p) treated with ibrutinib alone showed inferior progression-free survival as compared to that of patients without the mutation, and that the addition of ublituximab to the treatment regimen improved these pa tients’ outcomes.33 In the phase III ELEVATE-TN trial, im
les, the authors af
provements in efficacy (assessed as progression-free sur vival) with the second-generation BTK inhibitor acalabruti nib, used with or without obinutuzumab, were observed in previously untreated patients with del(17p) compared to those receiving chemoimmunotherapy. In the del(17p) subset, there was no progression-free survival advantage from acalabrutinib-obinutuzumab versus acalabrutinib alone.29 Combining ibrutinib and venetoclax in patients with del(17p) may address these inferior outcomes, while second-generation BTK inhibitors may be associated with fewer toxicity-related treatment discontinuations. Some limitations of this study must be acknowledged. A key limitation is that this was a real-world study and re sults are not easily comparable to those of prospective clinical trials. Endpoints that are standard in trials may be lacking in real-world data. For example, our dataset did not contain information on progression in the same way as it is defined in clinical trials. Because progression-free survival data were not available, time to next treatment was used as an imperfect proxy. As mentioned above, our results were in line with those of an earlier retrospective study;11 however, we note that the survival time after next treatment of 8 months in our study may seem poorer than anticipated based on the ongoing NHLBI phase II trial (n=34 patients with TP53 alterations),16 which reported a median post-progression survival of 25 months. In addi tion to differences in study approach, other factors, such as age (median 69 years in this study vs. 63 years in the NHBLI trial), may have led to differences in survival. Popu lation differences in comorbid conditions and presence of other cytogenetic markers may also have shortened tailend survival.
Other limitations of this study are the possibilities of in accurate or incomplete data, similar to any retrospective database analysis,34 and, potentially, the inclusion of pa tients with index dates that preceded the approval of ibrutinib for CLL. The possibility of inaccurate data is miti gated by the Flatiron Health cohort selection method, which combines structured and abstracted data to ensure accurate selection of patients. Our study included patients diagnosed from 2011 onward, while ibrutinib was not ap proved to treat CLL until 2014. This choice was made to allow the capture of community practice patterns while also ensuring the inclusion of all patients and maximum follow-up duration. Despite this, the analysis cohort con tained only one patient who began treatment in 2013 while the others had index dates from 2014 onwards.
The rate of del(17p) has been reported as being between 5% to 7% in most populations of patients with previously untreated CLL/SLL.18,35,36 Since our current study was fo cused on patients with del(17p) we note that the propor tion of patients in this group may appear relatively high at 23.8%. This was due to selection criteria into the analysis cohort requiring availability of information on cytogenetic
testing (including fluorescence in situ hybridization) (Fig ure 1). This was necessary in order to enable a meaningful comparison between patients with and without del(17p) and address the research question of interest. A similar rate of del(17p) positivity (29%) was observed in the pros pective, USA-based, InformCLL Registry among previously untreated patients who had undergone fluorescence in situ hybridization testing.19 A final study limitation is that this study did not assess presence or absence of the TP53 mutation as a risk factor. TP53 and del(17p) are closely linked (treatment resistance in patients with del[17p] has been attributed to the presence of a variant in a TP53 al lele),6 and high concordance exists between these measures.37 However, the Flatiron Health database does not routinely capture TP53 mutation status and an effort to obtain TP53 data would have been prohibitive. Similarly, there are several variables that have a high level of un known status or missing data, such as IGHV status (>50%), ECOG score at index date (>33%), and Rai stage at diag nosis (>37%). Although these rates may seem relatively high, we believe this is consistent and not unexpected from data captured directly from day-to-day clinical prac tice patterns in the community as opposed to academic centers.18,19 Despite these limitations, we believe these re sults are highly meaningful. In conclusion, this real-world retrospective analysis of first-line treatment with ibrutinib suggests that patients with CLL/SLL with del(17p) had inferior survival and were more likely to discontinue treatment due to disease pro gression than were patients without del(17p) in this study population. Despite the advent of ibrutinib, which has changed the overall outlook for patients with CLL/SLL, there remains an unmet need among those with del(17p). The ideal treatment regimen for this group of high-risk patients is yet to be determined. Randomized clinical trials comparing novel agent-based therapies designed specifically for this high-risk patient population are needed.
ARM has a consultancy/advisory role with AbbVie, Acerta, Adaptive, AstraZeneca, BeiGene, DTRM Biopharma, Genen tech, Curio, Dava, Octopharma, Janssen, Johnson and Johnson, LOXO, Nuruix, Genmab, BMS , Pharmacyclics LLC, an AbbVie Company, Sunesis, and TG Therapeutics; receives research funding from AbbVie, Octopharma, Acerta, Adap tive, BeiGene, DTRM Biopharma, Genentech, Genmab, Nurix, Genmab, Genentech, Janssen, Johnson and Johnson, LOXO, Pharmacyclics LLC, an AbbVie Company, Sunesis, and TG Therapeutics; and has other relationship(s) with TG Thera peutics (data safety monitoring board). BT, SA, KY, XZ, JCS, and EH are currently employed by and are current equity holders in BeiGene, Ltd. JH is currently employed by, is a current equity holder in, and receives travel accommoda
tions and expenses from BeiGene, Ltd.; is a current equity holder in and ended employment in the last 24 months with Agios Pharmaceuticals Inc.; and is a current equity holder in Vertex. JPS provides consultancy for and receives re search funding from Genentech, AstraZeneca, Pharmacyc lics LLC (an AbbVie Company), Pfizer, AbbVie, TG Therapeutics, Acerta, Roche, Celgene, and BMS; and re ceives research funding from BeiGene, Ltd.
All authors made substantial contributions to the research design, or the acquisition, analysis or interpretation of data, drafted the paper or revised it critically, and approved the submitted and final versions.
Medical writing and editorial assistance were provided by Caitlin Rothermel, MA, MPH, of MedVal Scientific Informa tion Services, LLC, and were funded by BeiGene, Ltd.
1. Tausch E, Schneider C, Robrecht S, et al. Prognostic and predictive impact of genetic markers in patients with CLL treated with obinutuzumab and venetoclax. Blood. 2020;135(26):2402-2412.
2. Eichhorst B, Robak T, Montserrat E, et al. Chronic lymphocytic leukaemia: ESMO Clinical Practice Guidelines for diagnosis, treatment and follow-up. Ann Oncol. 2021;32(1):23-33.
3. Hallek M. Chronic lymphocytic leukemia: 2020 update on diagnosis, risk stratification and treatment. Am J Hematol. 2019;94(11):1266-1287.
4. Yu L, Kim HT, Kasar S, et al. Survival of del17p CLL depends on genomic complexity and somatic mutation. Clin Cancer Res. 2017;23(3):735-745.
5. Stilgenbauer S, Eichhorst B, Schetelig J, et al. Venetoclax in relapsed or refractory chronic lymphocytic leukaemia with 17p deletion: a multicentre, open-label, phase 2 study. Lancet Oncol. 2016;17(6):768-778.
6. Zenz T, Eichhorst B, Busch R, et al. TP53 mutation and survival in chronic lymphocytic leukemia. J Clin Oncol. 2010;28(29):4473-4479.
7. Brown JR, Hillmen P, O'Brien S, et al. Extended follow-up and impact of high-risk prognostic factors from the phase 3 RESONATE study in patients with previously treated CLL/SLL. Leukemia. 2018;32(1):83-91.
8. Byrd JC, Brown JR, O'Brien S, et al. Ibrutinib versus ofatumumab in previously treated chronic lymphoid leukemia. N Engl J Med. 2014;371(3):213-223.
9. Koffman B. Ibrutinib’s approval history and its use as frontline therapy for CLL. https://cllsociety.org/2018/08/ibrutinibsapproval-history-and-its-use-as-frontline-therapy-for-cll/. Accessed 2 February 2022.
10. Burger JA, Tedeschi A, Barr PM, et al. Ibrutinib as initial therapy for patients with chronic lymphocytic leukemia. N Engl J Med. 2015;373(25):2425-2437.
11. Mato AR, Roeker LE, Allan JN, et al. Outcomes of front-line ibrutinib treated CLL patients excluded from landmark clinical trial. Am J Hematol. 2018;93(11):1394-1401.
This study was designed, funded, and conducted by Bei Gene, Ltd.
On request, and subject to certain criteria, conditions, and exceptions, BeiGene, Ltd., will provide access to individual de-identified participant data from BeiGene-sponsored glo bal interventional clinical studies conducted for medicines (i) for indications that have been approved or (ii) in programs that have been terminated. BeiGene will also consider re quests for the protocol, data dictionary, and statistical analysis plan. Data requests may be submitted to DataDis closure@beigene.com. In addition, the data that support the findings of this study have been originated by Flatiron Health, Inc. These de-identified data may be made available upon request, and are subject to a license agreement with Flatiron Health; interested researchers should contact Da taAccess@flatiron.com to determine licensing terms.
12. Rhodes JM, Barrientos JC. Chemotherapy-free frontline therapy for CLL: is it worth it? Hematology Am Soc Hematol Educ Program. 2020;2020(1):24-32.
13. O'Brien S, Jones JA, Coutre SE, et al. Ibrutinib for patients with relapsed or refractory chronic lymphocytic leukaemia with 17p deletion (RESONATE-17): a phase 2, open-label, multicentre study. Lancet Oncol. 2016;17(10):1409-1418.
14. Jones J, Mato A, Coutre S, et al. Evaluation of 230 patients with relapsed/refractory deletion 17p chronic lymphocytic leukaemia treated with ibrutinib from 3 clinical trials. Br J Haematol. 2018;182(4):504-512.
15. Woyach JA, Ruppert AS, Heerema NA, et al. Ibrutinib regimens versus chemoimmunotherapy in older patients with untreated CLL. N Engl J Med. 2018;379(26):2517-2528.
16. Ahn IE, Tian X, Wiestner A. Ibrutinib for chronic lymphocytic leukemia with TP53 alterations. N Engl J Med. 2020;383(5):498500.
17. NCCN clinical practice guidelines: chronic lymphocytic leukemia/small lymphocytic lymphoma. Version 1.2020. https://www.nccn.org/professionals/physician_gls/pdf/cll.pdf.
Accessed 2 February 2022.
18. Mato A, Nabhan C, Kay NE, et al. Real-world clinical experience in the Connect® chronic lymphocytic leukaemia registry: a prospective cohort study of 1494 patients across 199 US centres. Br J Haematol. 2016;175(5):892-903.
19. Mato AR, Barrientos JC, Ghosh N, et al. Prognostic testing and treatment patterns in chronic lymphocytic leukemia in the era of novel targeted therapies: results from the informCLL registry. Clin Lymphoma Myeloma Leuk. 2020;20(3):174-183.e3.
20. Mato AR, Nabhan C, Thompson MC, et al. Toxicities and outcomes of 616 ibrutinib-treated patients in the United States: a real-world analysis. Haematologica. 2018;103(5):874-879.
21. Mato AR, Allan JN, Pagel JM, et al. Front-line ibrutinib therapy for chronic lymphocytic leukemia (CLL) in the real world: responses, toxicity, outcomes and subsequent therapies. Blood. 2017;130(Suppl 1):3011.
22. Byrd JC, Hillmen P, Ghia P, et al. First results of a head-to-head
trial of acalabrutinib versus ibrutinib in previously treated chronic lymphocytic leukemia [abstract]. J Clin Oncol. 2021;39(Suppl 15):7500.
23. Hillmen P, Eichhorst B, Brown JR, et al. First interim analysis of alpine study: results of a phase 3 randomized study of zanubrutinib vs ibrutinib in patients with relapsed/refractory chronic lymphocytic leukemia/small lymphocytic lymphoma [abstract]. Presented at the Congress of the European Hematology Association (EHA), June 9-17, 2021, virtual session.
24. Tam CS, Robak T, Ghia P, et al. Zanubrutinib monotherapy for patients with treatment naïve chronic lymphocytic leukemia and 17p deletion. Haematologica. 2021;106(9):2354-2363.
25. Davids MS, Lampson BL, Tyekucheva S, et al. Acalabrutinib, venetoclax, and obinutuzumab as frontline treatment for chronic lymphocytic leukaemia: a single-arm, open-label, phase 2 study. Lancet Oncol. 2021;22(10):1391-1402.
26. Soumerai JD, Mato AR, Dogan A, et al. Zanubrutinib, obinutuzumab, and venetoclax with minimal residual diseasedriven discontinuation in previously untreated patients with chronic lymphocytic leukaemia or small lymphocytic lymphoma: a multicentre, single-arm, phase 2 trial. Lancet Haematol. 2021;8(12):e879-e890.
27. Huber H, Edenhofer S, von Tresckow J, et al. Phase 2 study of obinutuzumab (GA-101), ibrutinib and venetoclax (CLL2-GIVe) in patients with untreated high-risk chronic lymphocytic leukemia. Blood. 2022;139(9):1318-1329.
28. Lipsky A, Lamanna N. Managing toxicities of Bruton tyrosine kinase inhibitors. Hematology Am Soc Hematol Educ Program. 2020;2020(1):336-345.
29. Sharman JP, Egyed M, Jurczak W, et al. Acalabrutinib with or without obinutuzumab versus chlorambucil and obinutuzmab for treatment-naive chronic lymphocytic leukaemia (ELEVATE TN): a randomised, controlled, phase 3 trial. Lancet.
2020;395(10232):1278-1291.
30. Thompson MC, Roeker LE, Mato AR. All in the family: back-toback kinase inhibitors for the treatment of chronic lymphocytic leukemia. Haematologica. 2021;106(9):2300-2301.
31. Burger JA, Sivina M, Jain N, et al. Randomized trial of ibrutinib vs ibrutinib plus rituximab in patients with chronic lymphocytic leukemia. Blood. 2019;133(10):1011-1019.
32. Sharman JP, Farber CM, Mahadevan D, et al. Ublituximab (TG1101), a novel glycoengineered anti-CD20 antibody, in combination with ibrutinib is safe and highly active in patients with relapsed and/or refractory chronic lymphocytic leukaemia: results of a phase 2 trial. Br J Haematol. 2017;176(3):412-420.
33. Sharman JP, Brander DM, Mato AR, et al. Ublituximab plus ibrutinib versus ibrutinib alone for patients with relapsed or refractory high-risk chronic lymphocytic leukaemia (GENUINE): a phase 3, multicentre, open-label, randomised trial. Lancet Haematol. 2021;8(4):e254-e266.
34. Song JW, Chung KC. Observational studies: cohort and casecontrol studies. Plast Reconstr Surg. 2010;126(6):2234-2242.
35. Zenz T, Gribben JG, Hallek M, Döhner H, Keating MJ, Stilgenbauer S. Risk categories and refractory CLL in the era of chemoimmunotherapy. Blood. 2012;119(18):4101-4107.
36. Dohner H, Stilgenbauer S, Benner A, et al. Genomic aberrations and survival in chronic lymphocytic leukemia. N Engl J Med. 2000;343(26):1910-1916.
37. Dicker F, Herholz H, Schnittger S, et al. The detection of TP53 mutations in chronic lymphocytic leukemia independently predicts rapid disease progression and is highly correlated with a complex aberrant karyotype. Leukemia. 2009;23(1):117-1124.
38. Zhao X, Zhao Q, Sun J, Kim JS. Generalized log-rank tests for partly interval-censored failure time data. Biom J. 2008;50(3):375-385.
Kathryn E. Flynn,1 Ehab Atallah,1 Li Lin,2 Neil P. Shah,3 Richard T. Silver,4 Richard A. Larson,5 Javier Pinilla-Ibarz,6 James E. Thompson,7 Vivian G. Oehler,8 Jerald P. Radich,8 Vamsi Kota,9 Michael J. Mauro,10 Charles A. Schiffer,11 Jorge Cortes,9 and Kevin P. Weinfurt2
1Medical College of Wisconsin, Milwaukee, WI; 2Duke University School of Medicine, Durham, NC; 3University of California at San Francisco, San Francisco, CA; 4Weill Cornell Medicine, New York, NY; 5University of Chicago, Chicago, IL; 6H. Lee Moffitt Cancer Center and Research Institute, Tampa, FL; 7Roswell Park Comprehensive Cancer Center, Buffalo, NY; 8Fred Hutchinson Cancer Center, Seattle, WA; 9Georgia Cancer Center at Augusta University, Augusta, GA; 10Memorial Sloan Kettering Cancer Center, New York, NY and 11Karmanos Cancer Institute, Wayne State University School of Medicine, Detroit, MI, USA
Correspondence: K. E. Flynn
17, 2021.
22, 2022.
For patients with optimally treated chronic myeloid leukemia (CML), discontinuation of tyrosine kinase inhibitor (TKI) ther apy can lead to treatment-free remission. In previous trials, TKI discontinuation has been associated with increased mus culoskeletal pain in some patients (“withdrawal syndrome”), based on physician-reported adverse events (AE). Patient-reported pain has not been described. The Life After Stopping TKI study was a 14-site prospective, non-randomized clinical trial of TKI discontinuation. We defined increased pain after discontinuation as: (i) a physician-reported pain AE, (ii) a 2-level increase in self-reported musculoskeletal pain (4-level single item), or (iii) initiation of a medication for pain. We plotted the trajectory of patient-reported pain over time using a piecewise mixed-effects ordinal logistic model. Within 3 months of discontinuation, 35 of 172 patients (20.3%) had a physician-reported pain AE, 22 of 172 (12.8%) had an increase in self-reported pain, and 18 of 154 (11.7%) initiated a pain medication. Agreement among these measures was limited; overall, 60 of 172 patients (34.9%) had increased pain. Three patients (1.7%) restarted a TKI because of pain. The modelpredicted trajectory showed an increase in pain in the first 3 months followed by a decrease, returning to baseline levels by 6 months and further decreasing after that. This trajectory was similar among patients who did and did not restart TKI, suggesting that resuming a TKI for withdrawal syndrome may be necessary for some, but other approaches to manage pain should be tried so that patients can remain in treatment-free remission when possible.
Compared to other treatments for chronic myeloid leuke mia (CML), tyrosine kinase inhibitors (TKI) are highly ef fective1 and less toxic.2,3 However, they are still associated with side effects, particularly fatigue and gastrointestinal symptoms.4 Moreover, TKI may be cost-prohibitive for pa tients, leading to non-adherence.5 For select patients who achieve a sustained deep molecular response, TKI discon tinuation may lead to treatment-free remission (TFR), ef fectively a “cure” for CML.6 In TKI discontinuation trials, 32-67% of patients sustained TFR.7-16 For patients without sustained TFR, restarting TKI therapy was effective in re storing stable remission, including return to deep mol ecular response. TKI discontinuation is hypothesized to improve patient-reported symptoms and functioning, and
this was recently demonstrated in the US Life After Stop ping TKI (LAST) study.16,17 However, previous trials found that TKI discontinuation was unexpectedly associated with increased musculoskeletal pain for some patients, which has been called “TKI withdrawal syndrome”. In these previous trials, physician-reported adverse events (AE) related to musculoskeletal pain were reported for anywhere from 10-50% of patients.18
Uncertainty about the extent of increased musculoskel etal pain associated with TKI discontinuation is com pounded by the reliance on physician-reported AE. Studies with patients with solid tumor cancers have documented generally poor-to-moderate agreement be tween physician and patient reports of pain.19 A previous study in CML assessed physician-patient agreement on nine symptoms and found 44% agreement for musculos
keletal pain, with physicians underestimating patient musculoskeletal pain for 42% of patients and overesti mating it for 14% of patients.20 To our knowledge, no pre vious studies have described patient-reported musculoskeletal pain after TKI discontinuation. Herein we describe physician-reported pain-related AE and patientreported musculoskeletal pain, as well as their overlap, in the context of the LAST study.
LAST was a 14-site, single-arm, prospective longitudinal TFR study. Eligible patients had chronic-phase CML, were aged ≥18 years, and receiving imatinib, dasatinib, nilotinib, or bosutinib for ≥3 years with continuous documented BCR-ABL <0.01% International Standardized by real-time quantitative polymerase chain reaction (RQ-PCR) for ≥2 years. The study was approved by the Institutional Review Board of each participating institution, and all patients provided written informed consent. Additional method ological details are included in the Online Supplementary Appendix and have previously been published.21
Physician-reported adverse events
AE were evaluated using the Common Terminology Criteria for Adverse Events (CTCAE) version 4.0. We defined painrelated AE as any grade AE that was reported after TKI discontinuation using toxicity group “musculoskeletal and connective tissue disorders”.
In order to measure musculoskeletal pain, we used a single item with four response options from the European Organization for Research and Treatment of Cancer (EORTC) QLQ-CML24 that asks about aches or pains in muscles or joints. We assessed how much pain affected daily life using the PROMIS® Pain Interference computer ized adaptive test.22
On the 3-month PRO assessment for those in TFR (off TKI), we asked patients about changes in medications since TKI discontinuation, including whether they had started any new prescription or over-the-counter medi cations. For any “yes” responses, patients were asked to name the medication. These responses were coded by a physician (EA) to determine whether they were related to pain. We included analgesics, anti-inflammatory medi cations, and muscle relaxants.
We summarized the different measures of pain using fre
quencies and percentages. Patients were classifi ed as having an indicator of increased pain after stopping TKI if they had any of the following within 3 months of stopping: (i) physician-reported pain AE, (ii) a ≥ 2 level increase from their previous assessment in self-reported musculoskel etal pain, or (3) initiation of a medication for pain (while a 1 category change may reflect meaningful change, be cause of uncertainty around what to consider a meaning ful change on this single item, for subsequent analyses we selected the ≥ 2 category increase to be conservative.) Characteristics of patients who did and did not have in creased pain within 3 months were compared using Wil coxon rank sum tests for continuous or ordinal categorical variables and c2 tests for categorical variables. Among pa tients with increased pain within 3 months, we plotted the distribution of responses over time for self-reported musculoskeletal pain and for PROMIS Pain Interference scores. In order to better account for missing data, we also plotted the predicted trajectory of pain using piece wise mixed-effects ordinal logistic (EORTC QLQ-CML24 item on musculoskeletal pain) and a piecewise mixed-ef fects ordinal logistic regression model (EORTC QLQCML24 item on musculoskeletal pain) and a piecewise mixed-effects linear regression model (PROMIS Pain In terference) that allowed the slope to differ before and after the 3-month visit. Random intercepts and slopes were included in models to allow the trajectories to differ among individual patients. For time points after 6 months, we computed the percentage of patients with no or mild pain. We used a 2-tailed significance level of α=0.05 for all assessments. Statistical analyses were conducted using SAS 9.4 (SAS Institute Inc., Cary, NC, USA).
From 12/2014 to 12/2016, 173 patients from 14 US centers were enrolled, of whom 172 had evaluable data. Median duration of TKI therapy prior to study enrollment was about 7 years (Table 1), similar to other studies.8,9,23
Indicators of increased pain within 3 months after TKI discontinuation
Physician-reported pain-related adverse events Cumulatively, 35 patients (20.4%) had physician-reported pain-related AE in the
rst 3 months (Table 2), with most happening within the
rst month. One month after TKI discontinuation, physicians reported pain-related AE for 26 patients (15.1%). At 2 months, physicians reported painrelated AE for 11 patients (6.4%), and at 3 months it was five patients (2.9%). For most patients, the maximum pain grade was mild (Table 3). While our study focused on in creased pain within 3 months, ten additional patients (5.8%) had pain-related AE reported at time points later
Table 1. Baseline patient characteristics
and
increased pain status (N=172).
Age in years
With increased pain N=60 Without increased pain N=112
Median (range) 61 (22-88) 61 (22-84) 61 (26-88)
Sex, N (%)
Female Male 89 (51.7) 83 (48.3) 37 (61.7) 23 (38.3) 52 (46.4) 60 (53.6)
Race, N (%)
Asian/Pacific Islander
Black/African American White Other
5 (2.9) 18 (10.5) 145 (84.3) 3 (1.7)
1 (1.7) 8 (13.3) 51 (85.0) 1 (1.7)
4 (3.6) 10 (8.9) 94 (83.9) 2 (1.8)
Hispanic/Latino ethnicity, N (%) 7 (4.1) 1 (1.7) 6 (5.4)
Education, N (%)
Associate degree or less Bachelor’s degree or more 83 (48.3) 89 (51.7) 26 (43.3) 34 (56.7) 57 (50.9) 55 (49.1)
Health insurance, N (%)
Private Public Other or uninsured
TKI prior to discontinuation, N (%)
Imatinib
Nilotinib
Dasatinib Bosutinib
Duration of TKI treatment, months
104 (60.5) 56 (32.5) 12 (7.0)
102 (59.3) 39 (22.7) 27 (15.7) 4 (2.3)
35 (58.3) 21 (35.0) 4 (6.7)
36 (60.0) 13 (21.7) 10 (16.7) 1 (1.7)
69 (61.6) 35 (31.3) 8 (7.1)
66 (58.9) 26 (23.2) 17 (15.2) 3 (2.7)
Median (range) 83.0 (36.1-199.1) 83.1 (36.1-199.1) 83.0 (36.8-182.9)
PROMIS Pain interference, mean (SD) 50.7 (10.0) 51.9 (10.4) 50.0 (9.8)
PROMIS Fatigue, mean (SD) 52.9 (9.9) 54.1 (10.0) 52.3 (9.9)
PROMIS Physical function, mean (SD) 47.3 (8.3) 47.1 (7.9) 47.4 (8.6)
PROMIS Depression, mean (SD) 48.8 (8.0) 48.9 (8.1) 48.8 (8.0)
PROMIS Anxiety, mean (SD) 50.4 (10.0) 50.6 (8.3) 50.3 (8.7)
PROMIS Sleep disturbance, mean (SD) 49.7 (8.2) 49.8 (8.0) 49.7 (8.4)
PROMIS Social roles, mean (SD) 51.1 (9.6) 50.5 (9.2) 51.4 (9.8)
TKI: tyrosine kinase inhibitor; SD: standard deviation.
than 3 months, for a total of 45 patients (26%) who had a pain-related AE after TKI discontinuation.
We previously reported that for patients in the LAST study, baseline pain interference scores were the same as the average in the US general population (score of 50).13 Re garding musculoskeletal pain specifically, the majority of patients (77.8%) reported some musculoskeletal pain be fore TKI discontinuation. At baseline, 38 patients (22.2%) reported no musculoskeletal pain, 60 patients (35.1%) re ported a little bit, 43 patients (25.2%) reported quite a bit, and 30 patients (17.5%) reported very much (1 missing re
sponse at baseline). Within the first 3 months after TKI discontinuation, the worst musculoskeletal pain rating re ported by patients was “a little bit” for 43 patients (25%), “quite a bit” for 64 patients (37.2%), and “very much” for 57 patients (33.1%). Eight patients (4.7%) consistently re ported no musculoskeletal pain between baseline and 3 months, while 62% of patients reported a ≥ 1 category in crease in musculoskeletal pain, and 13% reported a ≥ 2 category increase in pain (Table 2).
At 3 months, of the 154 patients who reported on changes in medications, 18 patients (11.7%) reported adding a
medication for pain, including eight (5.2%) who started an over-the-counter medication and 11 (7.1%) who started a prescription medication; one patient reported starting both over-the-counter and prescription medications for pain.
Agreement among indicators of increased pain Agreement between physician-reported pain-related AE and patient-reported pain varied depending on the threshold considered for increase in patient-reported pain (Table 2; Online Supplementary Table S1). There was slightly better agreement between patients and physicians regarding the presence of increased pain using a ≥ 1 level increase (14%) compared to considering a ≥ 2 level in crease (4%); however, there was also worse agreement re garding the absence of increased pain (31% agreement for a ≥ 1 level increase vs. 71% for a ≥ 2 level increase), result ing in a better overall agreement for a ≥ 2 level increase (75%) compared to a ≥ 1 level increase (45%). The crosstabulation of AE grade and patient-reported increase in musculoskeletal pain is shown in Table 3. Although phys
icians and patients reported the symptoms using different methodologies and scales, Table 3 suggests that phys icians’ ratings reflect under-reporting (values in the upper right cells) more than over-reporting (values in the lower left cells).
Using the ≥ 2 level increase in patient-reported pain, 45 patients (26%) had a single indicator of increased pain (AE, increase on PRO measure, or reported new medication), and 15 patients (9%) had more than one indicator of in creased pain, for a total of 60 patients (35%) who had strong evidence of increased pain within 3 months after TKI discontinuation.
Characteristics of patients experiencing increased pain after stopping tyrosine kinase inhibitors
There were no statistically significant differences in base line characteristics of patients who did and did not have increased pain within 3 months (Table 1), including age or the particular TKI the patient had been taking prior to dis continuation. Of the 60 patients with evidence of in creased pain within 3 months, at 4 years of follow-up, 40
Table 2. Pain within 3 months of tyrosine kinase inhibitor discontinuation.
Patient-reported increased muscle/joint pain (1+) (N=172)
Patient-reported increased muscle/joint pain (2+) (N=172)
Added medication for pain (N=154)
Patient-reported increased muscle/joint pain (2+) or added medication for pain (N=172)
Physician-reported pain-related AE No Yes No Yes No Yes No Yes
No, N (%) 54 (31.4) 83 (48.3) 122 (70.9) 15 (8.7) 108 (70.1) 14 (9.1) 112 (65.1) 25 (14.5)
Yes, N (%) 11 (6.4) 24 (14.0) 28 (16.3) 7 (4.1) 28 (18.2) 4 (2.6) 24 (14.0) 11 (6.4)
Total, N (%) 65 (37.8) 107 (62.2) 150 (87.2) 22 (12.8) 136 (88.3) 18 (11.7) 136 (79.1) 36 (20.9)
Note: 18 patients were missing data on medication, 14 of whom because they had restarted a tyrosine kinase inhibitor (TKI). AE: adverse events.
between patient-
months after tyrosine kinase inhibitor
(N=172).
Maximum grade of physicianreported pain-related AE
Increase in patient-reported muscle/joint pain after TKI discontinuation
increasea
Total
None, N (%) 54 (31.6) 68 (39.8) 14 (8.8) 1 (0.6) 137 (79.7)
Mild, N (%)
N
N (%)
N (%)
N (%)
increase includes patients with no change
(4.1) 14 (8.2) 4 (2.3)
(1.2)
(37.8)
(11.7)
tyrosine kinase
(1.2)
(14.5)
(4.7)
(0.6)
(0.6)
(100.0)
adverse events.
(66.7%) had molecular relapse-free survival and 37 (61.7%) had sustained TFR, similar to the rates for patients who did not have increased pain within 3 months (64.0% mol ecular relapse-free survival and 60.4% TFR, Online Sup plementary Figure S1).
Trajectories of pain after stopping tyrosine kinase inhibitors
Self-reported musculoskeletal pain
Figure 1 displays the distribution of self-reported muscu loskeletal pain over time by TFR, among patients who had an indicator of increased pain after TKI discontinuation.

The black line represents the best estimated pain trajec tory for patients who experienced an increase in pain after TKI discontinuation. Both the observed (blue) line and the model-adjusted (black) line (which accounts for missing data) show an average increase in pain in the first 3 months that then decreases over time, returning to the baseline level by 6 months and further decreasing after that. Importantly, by 12 months, half of patients on TKI as well as more than half of patients off TKI reported littleto-no musculoskeletal pain (Figure 2). By 24 months this had increased to about three-quarters of patients who re ported little-to-no pain.

Figure 1. Trajectory of patient-reported musculoskeletal pain among patients with increased pain after tyrosine kinase inhibitor discontinuation (N=60). Note: blue diamonds and line indicate observed average; black line is the predicted trajectory for patients who do not restart a tyrosine kinase inhibitor (TKI) based on a piecewise mixed-effects ordinal logistic regression model.
Figure 2. Proportions of patients with well-controlled pain off and on a tyrosine kinase inhibitor over time (N=60). TKI: tyrosine kinase inhibitor.
Figure 3 displays the distribution of pain interference scores over time by TFR, among patients who had an in dicator of increased pain after TKI discontinuation. As with the single musculoskeletal pain item, there was an in crease in pain interference after TKI discontinuation that peaked at 3 months and then decreased again. By 12 months, more than half of patients on TKI as well as three-quarters of patients off TKI reported little-to-no pain interference (Figure 2).

Three patients (1.7%) restarted a TKI due to withdrawal syndrome of pain. All three patients had physician-re ported pain-related AE by 3 months and none reported starting a new medication for pain. The observed trajec tories of patient-reported pain for these patients are shown in Figure 4. All demonstrate an increase in pain or sustained high level of pain after TKI discontinuation, fol lowed by a decrease in patient-reported pain after re starting a TKI. They also show variation in patient-reported pain scores during both periods (on and off TKI). These patients restarted a TKI at 3 months, 7 months, and 12 months.
In this large, multi-center trial, 26% of patients had a physician-reported pain-related AE, in line with the 1050% with physician-reported pain-related AE in previous studies.18 When including patient-reported indicators of increased pain, 35-72% of patients had increased pain in
the first 3 months after TKI discontinuation. We did not observe differences in pain after TKI discontinuation by type of TKI.
An important question for patients who experience in creased pain after TKI discontinuation is whether resump tion of a TKI will reduce pain more effectively than remaining off the TKI. Our data provide some insight into this question, because the 60 patients who experienced increased pain within 3 months of discontinuation in cluded patients who did and did not restart a TKI. Almost all who restarted a TKI did so because of disease recur rence. We found that trajectories of musculoskeletal pain and pain interference showed similar patterns of improve ment among patients who did and did not restart a TKI. Furthermore, the percentage of patients with well-con trolled pain was similar for both groups of patients, sug gesting that for patients who have increased pain after TKI discontinuation, pain should decrease again over time. The three patients who resumed a TKI because of in creased pain evidenced similar trajectories of pain as the other patients who remained off TKI or restarted because of recurrence. Together, these data suggest that many pa tients in TFR who experience an increase in pain after stopping TKIs are likely to experience reductions in pain over time without having to restart a TKI. Whereas resum ing a TKI may be necessary for some, other approaches to manage pain should be tried so that patients can remain in TFR when possible.
In previous studies, correlations between clinician-re ported symptomatic AE and PRO measures have been shown to be moderate at best.19 In the LAST study, we also found moderate agreement. Over 60% of LAST patients reported any increase in musculoskeletal pain in the first
Figure
patient-reported pain interference among patients with increased pain after tyrosine kinase inhibitor
blue diamonds and line indicate observed average; black line is the predicted trajectory for patients who do not restart tyrosine kinase inhibitor
regression model.
3 months after TKI discontinuation, while 13% of patients reported a 2- or 3-level increase in musculoskeletal pain, and 12% added a medication for pain relief. Using the threshold of a ≥ 2 level increase, there was an overall agreement of 75% between patients and physicians, with the data suggesting physicians reported fewer pain in creases and less severe pain increases than patients did. There are a few possible explanations for discrepancies in patient and physician reports. First, patients have direct access to their own pain, whereas physicians have indirect access through observation and conversation with the pa tient. Second, patient reports and physician AE reports were made on different measurement scales. Third, phys icians reported on pain that emerged after TKI discontinu ation whereas changes in self-reported pain were based on repeated assessments of pain, reported using a recall period of 7 days.
It is important to consider these findings in the context of previously published findings from the LAST study. The majority of patients reported improvements in fatigue and diarhea16 and in social functioning,24 but there were no corresponding improvements in physical function,24 which may seem surprising.25 One hypothesis for this is that while reduced fatigue and diarrhea may be sufficient to improve someone’s ability to participate in social roles and activities, it may not be enough to increase their physical function without a concerted effort to increase physical activity. Interventions to increase physical activity have been successful in many other oncologic settings.26,27 TKI discontinuation may represent an opportunity to en courage patients to increase their physical activity, taking advantage of the expected improvement in symptoms. This may also serve to mitigate the potential increase in musculoskeletal pain.
Figure 4. Observed pain ratings for patients who restarted a tyrosine kinase inhibitor for withdrawal syndrome of pain (N=3). Note: dotted lines represent trajectories during treat ment-free remission (off tyrosine kinase inhibitor [TKI]) and solid lines represent trajectories after restarting a TKI.

LAST patients were representative of the current TKI pre scribing patterns in the US, with 59% of patients receiving imatinib.23 The rate of molecular recurrence in LAST was similar to other studies.24 That said, our sample was drawn from academic medical centers and may not be represen tative of all patients treated for CML. Self-reported mus culoskeletal pain was measured using a single item that might have had limited precision, though the pain trajec tory over time was very similar to the multi-item PROMIS Pain Interference assessment. Patients self-reported the changes in prescription and over-the-counter medications at 3 months after TKI discontinuation; we did not verify prescriptions. Finally, this was a group of patients who had been on therapy for nearly 7 years, so they were most likely to have been tolerating their medications well. Assessing the benefits of TKI discontinuation with regard to musculoskeletal pain is complicated. In the initial few months, the benefit of TKI discontinuation may be masked by the onset of TKI withdrawal syndrome. Our study has demonstrated that musculoskeletal pain improves with time after TKI discontinuation. For patients who experi ence increased pain, behavioral or cognitive approaches to managing musculoskeletal pain should be considered. In addition, given that TFR is associated with decreased fatigue, increased physical activity to improve musculos keletal symptoms may be an effective modality to de crease pain. Finally, the use of analgesics and/or anti-inflammatory pain medication may help control pain. Additional studies to elucidate the mechanism of in creased joint pain are warranted.
KEF reports receiving personal fees from Inhibikase and Pfizer and grants to her institution from Novartis outside
the submitted work. EA reports receiving personal fees from Novartis, Bristol Myers Squibb, and Takeda and grants to his institution from Novartis and Takeda outside the submitted work. NPS reports receiving funding to his insti tution from Bristol-Myers Squibb outside the submitted work. JPR reports receiving personal fees from Novartis, Bristol Myers Squibb, Takeda, Amgen, Cepheid, Bio-Rad, Adaptive, and SeaGen outside the submitted work. JP-I re ports receiving personal fees from Janssen, AbbVie, Astra Zeneca, Novartis, Pfizer, and Takeda outside the submitted work. VK reports receiving personal fees from Novartis and Pfizer outside the submitted work. RAL reports receiving grants and personal fees from Novartis and Celgene; per sonal fees from Bristol Myers Squibb, Takeda, Amgen, CVS/Caremark, Epizyme, AstraZeneca, and Agios; and grants from Forty Seven, Rafael Pharmaceuticals, Astellas, Daiichi Sankyo, and Cellectis, outside the submitted work; in addition, RAL had a patent to UptoDate Inc with royalties paid. JET reports receiving grants from Novartis and Bristol Myers Squibb outside the submitted work. VGO reports re ceiving personal fees from Bristol Myers Squibb, Takeda, Novartis and Pfizer outside the submitted work. MJM re ports personal fees and research funding from Novartis Oncology and Bristol Myers Squibb; personal fees from
1. Bower H, Bjorkholm M, Dickman PW, Hoglund M, Lambert PC, Andersson TM. Life expectancy of patients with chronic myeloid leukemia approaches the life expectancy of the general population. J Clin Oncol. 2016;34(24):2851-2857.
2. Hahn EA, Glendenning GA, Sorensen MV, et al. Quality of life in patients with newly diagnosed chronic phase chronic myeloid leukemia on imatinib versus interferon alfa plus low-dose cytarabine: results from the IRIS Study. J Clin Oncol. 2003;21(11):2138-2146.
3. Druker BJ, Guilhot F, O'Brien SG, et al. Five-year follow-up of patients receiving imatinib for chronic myeloid leukemia. N Engl J Med. 2006;355(23):2408-2417.
4. Efficace F, Cardoni A, Cottone F, Vignetti M, Mandelli F. Tyrosinekinase inhibitors and patient-reported outcomes in chronic myeloid leukemia: a systematic review. Leuk Res. 2013;37(2):206-213.
5. Winn AN, Keating NL, Dusetzina SB. Factors associated with tyrosine kinase inhibitor initiation and adherence among medicare meneficiaries with chronic myeloid leukemia. J Clin Oncol. 2016;34(36):4323-4328.
6. Flynn KE, Mauro MJ, George G, et al. Patients' perspectives on the definition of cure in chronic myeloid leukemia. Leuk Res. 2019;80:40-42.
7. Mahon FX, Rea D, Guilhot J, et al. Discontinuation of imatinib in patients with chronic myeloid leukaemia who have maintained complete molecular remission for at least 2 years: the prospective, multicentre Stop Imatinib (STIM) trial. Lancet Oncol. 2010;11(11):1029-1035.
8. Etienne G, Guilhot J, Rea D, et al. Long-term follow-up of the french stop imatinib (STIM1) study in patients with chronic
Takeda and Pfizer; and research funding from Sun Pharma/SPARC outside the submitted work. JC reports grants to his institution and personal fees from Novartis, Pfizer, Sun Pharma and Takeda; and grants from BMS out side the submit work. No other disclosures were reported.
KEF, EA and KPW developed the concept and design of the study; all authors acquired and interpreted data; KEF, LL and KPW performed statistical analysis; KEF, EA, LL and KPW drafted the manuscript; all authors critically revised the manuscript; KEF and EA obtained funding.
This study was supported by grant R01 CA184798 from the National Cancer Institute. The content is solely the respon sibility of the authors and does not represent the official views of the National Cancer Institute.
The data underlying this article cannot be shared publicly due to the privacy of individuals that participated in the study. The data will be shared on reasonable request to the corresponding author.
myeloid leukemia. J Clin Oncol. 2017;35(3):298-305.
9. Ross DM, Branford S, Seymour JF, et al. Safety and efficacy of imatinib cessation for CML patients with stable undetectable minimal residual disease: results from the TWISTER study. Blood. 2013;122(4):515-522.
10. Rousselot P, Charbonnier A, Cony-Makhoul P, et al. Loss of major molecular response as a trigger for restarting tyrosine kinase inhibitor therapy in patients with chronic-phase chronic myelogenous leukemia who have stopped imatinib after durable undetectable disease. J Clin Oncol. 2014;32(5):424-430.
11. Mahon F-X, Rea D, Guilhot J, et al. Long term follow-up after imatinib cessation for patients indeep molecular response: the update results of the STIM1 study. Blood. 2013;122(21):255.
12. Rea D, Rousselot P, Guilhot Fo, et al. Discontinuation of second generation (2G) tyrosine kinase inhibitors (TKI) in chronic phase (CP)-chronic myeloid leukemia (CML) patients with stable undetectable BCR-ABL transcripts. Blood. 2012;120(21):916.
13. Oh YJ, Choi SY, Lee S-E, et al. Results from the Korean Imatinib discontinuation study (KIDS): updated data with 14-month median follow up. Blood. 2013;122(21):4003.
14. Zang DY, Lee WS, Mun Y-C, et al. Long-term follow-up after treatment discontinuation in patients with chronic myeloid leukemia: the Korean Imatinib Discontinuation (KID) study. Blood. 2018;132(Suppl 1):S4252.
15. Mahon F-X, Nicolini FE, Noël M-P, et al. Preliminary report of the STIM2 study: a multicenter stop imatinib trial for chronic phase chronic myeloid leukemia de novo patients on imatinib. Blood. 2013;122(21):654.
16. Atallah E, Schiffer CA, Radich JP, et al. Assessment of outcomes after stopping tyrosine kinase inhibitors among patients with
chronic myeloid leukemia: a nonrandomized clinical trial. JAMA Oncol. 2021;7(1):42-50.
17. Schoenbeck KL, Atallah E, Lin L, et al. Patient-reported functional outcomes in patients with chronic myeloid leukemia after stopping tyrosine kinase inhibitors. J Natl Cancer Inst. 2022;114(1):160-164.
18. Kota V, Atallah E. Musculoskeletal pain in patients with chronic myeloid leukemia after tyrosine kinase inhibitor therapy cessation. Clin Lymphoma Myeloma Leuk. 2019;19(8):480-487.
19. Atkinson TM, Ryan SJ, Bennett AV, et al. The association between clinician-based common terminology criteria for adverse events (CTCAE) and patient-reported outcomes (PRO): a systematic review. Support Care Cancer. 2016;24(8):3669-3676.
20. Efficace F, Rosti G, Aaronson N, et al. Patient- versus physicianreporting of symptoms and health status in chronic myeloid leukemia. Haematologica. 2014;99(4):788-793.
21. Atallah E, Schiffer CA, Weinfurt KP, et al. Design and rationale for the life after stopping tyrosine kinase inhibitors (LAST) study, a prospective, single-group longitudinal study in patients with chronic myeloid leukemia. BMC Cancer. 2018;18(1):359.
22. Cella D, Riley W, Stone A, et al. The Patient Reported Outcomes Measurement Information System (PROMIS) developed and
tested its first wave of adult self-reported health outcome item banks: 2005-2008. J Clinl Epidemiol. 2010;63(11):1179-1194.
23. Saussele S, Richter J, Guilhot J, et al. Discontinuation of tyrosine kinase inhibitor therapy in chronic myeloid leukaemia (EURO-SKI): a prespecified interim analysis of a prospective, multicentre, non-randomised, trial. Lancet Oncol. 2018;19(6):747-757.
24. Schoenbeck KL, Atallah E, Lin L, et al. Patient-reported functional outcomes in patients with chronic myeloid leukemia after stopping tyrosine kinase inhibitors. J Natl Cancer Inst. 2022;114(1):160-164.
25. Efficace F, Baccarani M. Quality of life improvements in patients with chronic myeloid leukemia after stopping long-term therapy: who can benefit the most? J Natl Cancer Inst. 2022;114(1):9-11.
26. Kiss N, Baguley BJ, Ball K, et al. Technology-supported selfguided nutrition and physical activity interventions for adults with cancer: systematic review. JMIR Mhealth Uhealth. 2019;7(2):e12281.
27. Stout NL, Baima J, Swisher AK, Winters-Stone KM, Welsh J. A systematic review of exercise systematic reviews in the cancer literature (2005-2017). PM&R. 2017;9(9):S347-S384.
Paolo Rossato,1* Enrica Federti,2* Alessandro Matte’,2 Helmut Glantschnig,1 Fabio Canneva,1 Maria Schuster,1 Sogue Coulibaly,1 Gerald Schrenk,1 Dirk Voelkel,1 Michael Dockal,1 Barbara Plaimauer,1 Immacolata Andolfo,3 Achille Iolascon,3 Hanspeter Rottensteiner,1 Herbert Gritsch,1 Friedrich Scheiflinger,1 Werner Hoellriegl1# and Lucia De Franceschi2#
1Baxalta Innovations GmbH, a Takeda company, Vienna, Austria; 2Department of Medicine, University of Verona and Azienda Ospedaliera Universitaria Integrata di Verona, Policlinico GB Rossi, Verona, Italy and 3Dipartimento di Medicina Molecolare e Biotecnologie Mediche, Università degli Studi di Napoli Federico II, and CEINGE Biotecnologie Avanzate, Naples, Italy
*PR and EF contributed equally as co-first authors.
#WH and LDF contributed equally as co-senior authors.
Correspondence: G. Schrenk gerald.schrenk@takeda.com
Received: October 26, 2021.
Accepted: April 8, 2022.
Prepublished: April 21, 2022.
https://doi.org/10.3324/haematol.2021.280233
©2022 Ferrata Storti Foundation
Published under a CC BY-NC license
Sickle cell disease (SCD) is an inherited red blood cell disorder that occurs worldwide. Acute vaso-occlusive crisis is the main cause of hospitalization in patients with SCD. There is growing evidence that inflammatory vasculopathy plays a key role in both acute and chronic SCD-related clinical manifestations. In a humanized mouse model of SCD, we found an in crease of von Willebrand factor activity and a reduction in the ratio of a disintegrin and metalloproteinase with throm bospondin type 1 motif, number 13 (ADAMTS13) to von Willebrand factor activity similar to that observed in the human counterpart. Recombinant ADAMTS13 was administered to humanized SCD mice before they were subjected to hypoxia/re oxygenation (H/R) stress as a model of vaso-occlusive crisis. In SCD mice, recombinant ADAMTS13 reduced H/R-induced hemolysis and systemic and local inflammation in lungs and kidneys. It also diminished H/R-induced worsening of in flammatory vasculopathy, reducing local nitric oxidase synthase expression. Collectively, our data provide for the firsttime evidence that pharmacological treatment with recombinant ADAMTS13 (TAK-755) diminished H/R-induced sickle cell-related organ damage. Thus, recombinant ADAMTS13 might be considered as a potential effective disease-modifying treatment option for sickle cell-related acute events.
Sickle cell disease (SCD) is a hereditary red blood cell dis order caused by a single amino acid substitution in the β chain of hemoglobin and results in the production of pathological sickle hemoglobin (HbS). SCD is character ized by chronic hemolysis and inflammatory vasculopathy, which concur with acute vaso-occlusive crises. These main causes of hospitalization of SCD patients contribute to the disease’s high mortality and morbidity.1-3 In the last decade, progress in the knowledge of the pa thophysiology of SCD has highlighted the role of pro-ad hesive cell-cell interactions involving dense red blood cells, reticulocytes, neutrophils, inflammatory activated endothelial cells, and plasma factors.4-9 Collectively these factors contribute to the pro-thrombotic profile of SCD as supported by thrombin generation, depleted anticoagu lant proteins, an activated fibrinolytic system, and in
creased tissue factor expression, even in steady state.5,9-14 von Willebrand factor (VWF) and its regulatory protease ADAMTS13 (a disintegrin and metalloproteinase with thrombospondin type 1 motif, number 13) represent a critical axis in both hemostasis and inflammatory re sponses.15,16 VWF activity has been suggested as a driving mechanism in various diseases such as atherosclerosis, diabetes, coronary artery disease, stroke, myocardial in farction, thrombotic microangiopathy, and sepsis. All these are characterized by inflammatory vasculopathy, amplified inflammatory response and vascular dysfunc tion.4,5,8,11.17 Ultra-large multimers of VWF have been re ported in these disorders, most likely associated with relative reduction of ADAMTS13 activity due to either in hibition of cleavage activity of ADAMTS13 or degradation of ADAMTS13 related to severe inflammation.18 Recombinant human ADAMTS13 (rADAMTS13; TAK-755) has been developed for the treatment of congenital and im
mune-mediated thrombotic thrombocytopenic purpura (TTP). ADAMTS13 deficiency in TTP causes unusually large VWF multimers, thrombosis in the microcirculation and ischemic damage to multiple organs.19 Administration of TAK-755 to patients with congenital TTP reduced the con centration of ultra-large VWF multimers and improved the clinical course of congenital TTP.20 Accumulation of ultra-large VWF has been reported in patients with SCD, possibly related to the detrimental effect of plasma free hemoglobin that, binding to VWF, prevents its cleavage by ADAMTS13.21-25 This is further supported by the obser vation of increased VWF antigen and decreased ADAMTS13/VWF:antigen ratio in SCD patients at both steady state and in acute pain crises.23,24,26-28
To address the question of whether the normalization of ADAMTS13 might mitigate sickle cell-related acute events, we administered recombinant human ADAMTS13 (TAK-755) to humanized sickle cell mice which were then exposed to hypoxia/reoxygenation (H/R) stress, a consoli dated model mimicking sickle cell-related acute vaso-oc clusive events.4,17,29 Here, we showed that treatment with rADAMTS13 limits H/R-induced infl ammatory vasculo pathy in target organs for SCD such as lung and kidney, reducing vascular vulnerability with beneficial effects on disease progression. Taken together, our data provide a rationale to explore the use of rADAMTS13 in the treat ment of sickle cell-related acute events.
Mice humanized for human sickle hemoglobin (Hbatm1(HBA)Tow Hbbtm2(HBG1,HBB*)Tow, HbS, SS mice) or human normal hemoglobin (Hbatm1(HBA)Tow Hbbtm3(HBG1,HBB*)Tow, HbA, AA mice), were either directly supplied by The Jackson Lab oratory (Jackson Laboratories, USA/ Charles River Lab oratories, Sulzfeld, Germany) or bred at Verona University (CIRSAL), Italy. All animal studies complied with national laws governing animal experimentation. The experimental protocol was approved by the animal care and use com mittees of the respective institutions. Male and female AA and SS mice, aged 3 to 4 months old, were studied under ambient conditions (normoxia) or exposed to H/R (7 or 8% oxygen for 5 or 10 h, followed by 1 or 3 h at am bient atmosphere) to mimic sickle cell-related acute vaso-occlusive crisis.4,29 rADAMTS13 (TAK-755, SHP655, Baxalta Innovations GmbH, Orth an der Donau, Austria) was provided in sterile water for injection. In preliminary experiments, we verified the ability of human rADAMTS13 to cleave mouse VWF with an efficiency similar to that observed for human VWF.30 Sequence analysis of human and mouse ADAMTS13 re vealed a high interspecies identity and similarities in pro
tein areas involved in either protease activity or VWF binding (Online Supplementary Figure S1A, B). rADAMTS13 was administered intravenously (via the tail vein) at a dose volume of 10 mL/kg 1 h before hypoxia. In prelim inary pharmacokinetic experiments, we identified 2,940 U/kg as the optimal dose to reduce VWF activity/antigen ratio in SS mice.31 Vehicle buffer was a solution in sterile water for injection of calcium chloride (2 mM), L-histidine (20 mM), mannitol (3% w/w), sucrose (1% w/w), and poly sorbate 80 (0.05% w/w) at pH 6.9-7.1. Hematologic parameters and red cell indices were deter mined as previously reported.32-35 H/R-induced clinical signs were evaluated as previously described.4,36,37 Details are reported in the Online Supplementary Methods.
Plasma assays and bioactivity of human recombinant ADAMTS13
Human ADAMTS13 antigen level was determined by an enzyme-linked immunosorbent assay (ELISA) using affin ity puri fi ed polyclonal anti-human ADAMTS13 antibody from guinea pig and detection with horseradish peroxi dase-conjugated polyclonal rabbit anti-human ADAMTS13 antibody. Human ADAMTS13 activity was determined by a fl uorescence resonance energy transfer (FRET) assay 38 using FRETS-VWF73 quenching substrate (Peptanova). Mouse VWF antigen level was determined by ELISA (As serachrom, VWF:Ag), mouse VWF activity by a VWF col lagen binding ELISA method (Zymutest, VWF:CBA), and mouse VWF multimer analysis by low resolution agarose gel electrophoresis in combination with immunostaining with an anti-human VWF antibody (Hydragel).
Histological analysis of lungs and kidneys
Paraffin-embedded tissue blocks were cut into 2-3 µm sections and mounted on adhesion microscope glass slides for hematoxylin and eosin (H&E) and Perls’ staining for iron content. The analysis was performed on four dif ferent fields at a 200X magni fication. Tissue pathology, inflammatory cell infiltrate, the presence of thrombi and iron deposition were assessed by blinded pathologists as previously described.4,29,32
Real-time polymerase chain reaction analysis was carried out as previously described.29 Details are reported in the Online Supplementary Methods.
Frozen lung, kidney and aorta samples were homogenized and lysed as previously reported.4,29,32 Proteins were quantified and analyzed by sodium dodecylsulfate poly acrylamide gel electrophoresis. Gels were transferred to nitrocellulose membranes for immunoblot analysis with specific antibodies. Details are described in the Online
The degree of calcein-labeled platelet adhesion (ex pressed as percent coverage over the total surface) was studied in a perfusion chamber (BioFlux 1000z System, Fluxion BioSciences, San Francisco, CA, USA), using SS mouse blood in a 48-well plate coated with equine ten don fibrillar collagen type I (Horm collagen reagent, Takeda, Linz, Austria) at a wall shear rate of 1500 s-1 (60 dyne/cm2) with and without addition of rADAMTS13 (200 U/mL).
Statistical analysis was performed with GraphPad Prism 8.0, and P values were calculated using an unpaired onetailed t-test with the Welch correction. Data were ana lyzed using either a t-test or one-way analysis of variance for repeated measures between the mice of various ge notypes. A difference with a P<0.05 was considered stat istically significant.
Sickle cell disease mice showed raised von Willebrand factor activity and relative deficiency of ADAMTS13 activity
In humanized SCD mice, we found a 2-fold increase in VWF activity/antigen ratio compared to that in healthy AA mice. In agreement, a higher order and higher number of VWF multimers were detected in plasma from SS mice compared to AA animals, similarly to the situation in pa tients with SCD (Figure 1A, Online Supplementary Figure S2A).24 We then evaluated VWF and ADAMTS13 protein ac tivities and antigens under ambient air conditions or hy poxia (Online Supplementary Figure S2B). ADAMTS13 activity was similar in both mouse strains under either normoxia or hypoxia (Figure 1B). Increases in VWF activity, as determined by collagen binding, and in total VWF antigen levels were observed in SS mice under normoxia compared to those in AA animals (Figure 1B, Online Sup plementary Figure S2C). Hypoxia further increased VWF activity in plasma from SS mice (Figure 1B). The ADAMTS13/VWF activity ratio was lower in SS mice, under either normoxia or hypoxia, than in healthy animals (Figure 1B). Our results agree with observations in patients with SCD,25,26 characterized by increased VWF activity and relative deficiency of ADAMTS13 activity. This supported the translational relevance of the tested pharmacology. Thus, we evaluated the impact of rADAMTS13 on the hu manized mouse model of SCD exposed to H/R stress to mimic acute vaso-occlusive crisis4,36 (Online Supplemen tary Figure S2D).
In sickle cell mice, recombinant ADAMTS13 improved hypoxia/reoxygenation-induced hematologic changes and reduced systemic inflammation
Recombinant ADAMTS13 diminished the H/R-induced re duction in hematocrit and hemoglobin (Figure 1C, Online Supplementary Figure S2E). This was associated with a sig nificant reduction in hemoglobin distribution width, used as a marker of a dense cell subpopulation, compared with that in vehicle-treated SS animals (Figure 1D, left panel). Hemoglobin distribution width corresponds to the standard deviation of the red cell hemoglobin histogram shown in the right panel of Figure 1D (see also Online Supplementary Fig ure S2F for the histogram for healthy, AA, mice). We also ob served a reduction in plasma lactate dehydrogenase in rADAMTS13-treated SS mice exposed to H/R compared to the value in SS vehicle-treated animals (Online Supplemen tary Figure S2G). Previously, Nwankwo et al. reported lower platelet counts in SS mice under normoxia than in healthy (AA) controls.40 Here, we found that, compared to treatment with vehicle, rADAMTS13 treatment ameliorated the H/R-in duced thrombocytopenia in SS mice (Figure 1E). Since a functional connection between platelets and ADAMTS13 ac tivity has been reported in other models of inflammatory vasculopathy associated with H/R stress, we conducted preliminary experiments of platelet adhesion to immobi lized collagen in a perfusion chamber with or without rADAMTS13. We found increased adhesion of platelets from SS mice when compared to platelets from heathy controls. This was significantly reduced by rADAMTS13 (Online Sup plementary Figure S3A, B). A significant decrease in neutro phil count was also found in rADAMTS13-treated SS mice exposed to H/R, compared to the count in vehicle-treated SS mice (Figure 1F). This was associated with a reduction in C-reactive protein, a marker of systemic inflammation (On line Supplementary Figure S3C). Taken together, our data in dicate that rADAMTS13 reduces hemolysis and platelet adhesion and ameliorates systemic inflammation in SS mice exposed to H/R.
In sickle cell mice, recombinant ADAMTS13 diminished hypoxia/reoxygenation-induced lung injury and local inflammatory related vascular dysfunction
Lung is a target organ of SCD.4,37 Thus, we evaluated the ef fects of rADAMTS13 on lungs of SS mice exposed to H/R stress. rADAMTS13 reduced inflammatory cell infiltrates and thrombi formation compared with those in vehicle-treated animals (Figure 2A, Table 1). This was associated with sig nificant reductions in protein and leukocyte counts in bron choalveolar lavage fluid, indicating a reduction of H/R-associated vascular leakage in rADAMTS13-treated SS mice compared with that in vehicle-treated animals (Figure 2B).
Previous studies have shown the crucial role of nuclear fac tor kappa B (NF-κB)-dependent pathways in the severity
Figure 1. Recombinant ADAMTS13 reduced hypoxia/reoxygenation-induced hemolysis and modulated the systemic inflammatory response. (A) von Willebrand factor (VWF) activity/antigen concentration ratio in plasma of humanized healthy (AA) and sickle cell (SS) mice. VWF multimer gel analysis of SS and AA mouse plasma (see Online Supplementary Figure S2A for additional gels). (B) Plasma ADAMTS13 activity, VWF activity, ADAMTS13/VWF activity ratio in AA and SS mice (n=5-6 age-matched male mice; *P<0.05 vs. SS 21%). (C) Hemoglobin (Hb) in AA and SS mice under normoxia and exposed to hypoxia/reoxygenation (H/R) treated with either vehicle or recombinant ADAMTS13 (rADAMTS13); *P<0.05 compared to AA; ^P<0.05 compared to vehicle. (D) Left panel. Hemoglobin distribution width (HDW) in AA and SS mice under normoxia and exposed to H/R treated with either vehicle or rADAMTS13; *P<0.05 compared to AA; ^P<0.05 compared to vehicle. Right panel. Distribution histograms generated for red blood cell volume (RBC Volume) and cell hemoglobin concentration (RBC-HC) of red blood cells from humanized SS mice under nor moxia and treated with either vehicle or rADAMTS13 and exposed to H/R. One experiment representative of six others with similar results is shown. The blue circle indicates the presence of a subpopulation of dense red cells. (E) Platelet (PLT) counts in hu manized AA and SS mice under normoxia and treated with either vehicle or rADAMTS13 and exposed to H/R (n=6; age-matched female and male mice; ^P<0.05). (F) Peripheral neutrophils in AA and SS mice under normoxia or exposed to H/R (8% oxygen for 10 h followed by 3 h of reoxygenation) treated with either vehicle or rADAMTS13. Data are presented as box-and-whisker plots. *P<0.001 compared to vehicle-treated animals under normoxia. ^P<0.001 compared to vehicle-treated animals under hypoxia. P values were calculated using an unpaired one-tailed t-test with the Welch correction.

of SCD-related lung injury.4,37 Here, we found that rADAMTS13 reduced H/R-induced activation of NF-κB p65 (pNF- κ B/NF- κ B ratio) compared with that in vehicletreated SS mice (Figure 2C, Online Supplementary Figure S4A). Indeed, a downregulation of Il1 gene expression was observed in lungs from rADAMTS13-treated SS mice com pared with that in samples from vehicle-treated animals (Online Supplementary Figure S4B).
Markers of both vascular endothelial dysfunction and local inflammatory responses, such as vascular endothelial cell adhesion molecule-1 (VCAM-1), intracellular adhesion molecule-1 (ICAM-1), endothelin-1 (ET-1) and E-selectin, were significantly lower in lungs of rADAMTS13-treated SS
mice than in vehicle-treated SS animals (Figure 2D, Online Supplementary Figures S4C and S5). It is noteworthy that the expression of thromboxane synthase (TXAS), con trolled by NF-κB, was significantly reduced in rADAMTS13treated SS mice compared with that in vehicle-treated animals. This finding is in line with the downregulation of heme-oxygenase-1 (HO-1) expression, a known anti-oxi dant and lung cytoprotective system4,41 (Figure 2D, Online
Supplementary Figure S4C). Indeed, we found a reduction in oxidation of lung proteins from rADAMTS13-treated SS mice exposed to H/R stress compared with that in ve hicle-treated animals (Online Supplementary Figure S6A). Previous studies showed that a local reduction in nitric

Figure 2. In sickle cell disease mice, recombinant ADAMTS13 reduced hypoxia/reoxygenation-induced lung damage and inflam matory vasculopathy. (A) Representative hematoxylin and eosin-stained sections of lung tissue from healthy (AA) and sickle cell (SS) mice exposed to hypoxia (8% oxygen; 10 h), followed by reoxygenation (21% oxygen; 3 h) treated with vehicle or recombinant ADAMTS13 (rADAMTS13) (2940 U/kg), see also Table 1; black arrows indicate inflammatory cell infiltrate. (B) Leukocyte content (lower panel) and protein content (upper panel) in bronchoalveolar lavage (BAL) from AA and SS mice under normoxia or exposed to hypoxia (8% oxygen; 10 h), followed by reoxygenation (21% oxygen; 3 h) treated with either vehicle or rADAMTS13. Data are presented as mean ± standard error of mean (n=6, age-matched male and female animals). *P<0.001 compared to vehicletreated animals under normoxia. ^P<0.001 compared to vehicle-treated animals under hypoxia. P values were calculated using an unpaired one-tailed t-test with the Welch correction. (C) Immunoblot analysis, using specific antibodies against phosphory lated (P-)NF-κB p65 and NF-κB p65 of lung from AA and SS mice under normoxia or exposed to hypoxia (8% oxygen; 10 h), fol lowed by reoxygenation (21% oxygen; 3 h) treated with either vehicle or rADAMTS13. GAPDH was used as a protein loading control. One representative gel from three with similar results is shown. Densitometric analysis of immunoblots is shown in Online Sup plementary Figure 4SA. (D) Immunoblot analysis, using specific antibodies against VCAM-1, ICAM-1, ET-1, TXAS and HO-1 of lung from AA and SS mice treated as in (C). GAPDH was used as a protein loading control. One representative gel from three with similar results is shown (n=3 age-matched male and female mice in each group). Densitometric analysis of immunoblots is shown in Online Supplementary Figure S4C. H/R: hypoxia/reoxygenation; VCAM-1: vascular endothelial cell adhesion molecule-1; ICAM-1: intracellular adhesion molecule-1; ET-1: endothelin-1; TXAS: thromboxane synthase; HO-1: heme oxygenase-1; GAPDH: glyceraldehyde-3-phosphate dehydrogenase.
Table 1. Effects of recombinant ADAMTS13 on lung and kidney pathology of healthy and sickle cell mice exposed to hypoxia/reoxygenation stress.
Tissue Marker Measure
Lung
Kidney
vehicle - H/R (N=5)
rADAMTS13 - H/R (N=5) vehicle - H/R (N=5) rADAMTS13 - H/R (N=4)
Inflammatory cell infiltrate grade (+) (+) (+) - (++) (+) incidence 3/5 1/5 2/5 - 3/5 1/4
Thrombi
grade (0) (0) (+) (+) incidence 0/5 0/5 5/5 1/4
mean per field 0 0 3 3
Inflammatory cell infiltrate grade (+) (+) (+) - (++) (0) incidence 1/5 1/5 2/5 - 1/5 0/4
Thrombi
grade (0) (0) (+) (+) incidence 0/5 0/5 5/5 4/4 mean per field 0 0 5 2.5
AA. healthy; SS: sickle cell; rADAMTS13: recombinant ADAMTS13 (a disintegrin and metalloproteinase with thrombospondin type 1 motif, number 13); H/R: hypoxia/reoxygenation.
oxide is critical to the pathogenesis of acute sickle cellrelated organ damage. Two main nitric oxide synthases (NOS) have been described to be important in SS. eNOS is constitutively expressed in the endothelium, whereas iNOS is inducible by cytokines and the inflammatory re sponse. 37,42-44 It is worth noting that prolonged or severe oxidation might transform eNOS from a coupled to un coupled state, resulting in superoxide production.45 In our model, we found increased expression of eNOS in SS mice under normoxia when compared with that in healthy mice ( Online Supplementary Figure S6B ). H/R stress further upregulates eNOS expression in SS mice. rADAMTS13 reduced the H/R-induced upregulation of eNOS in SS mice. No major change was observed in rADAMTS13-treated AA mice compared with vehicletreated animals ( Online Supplementary Figure S6B) . No difference in iNOS expression was observed in both mouse strains exposed to H/R treated with either ve hicle or rADAMTS13 ( Online Supplementary Figure S6B ). Collectively, our data indicate that rADAMTS13 reduces local inflammatory and vascular dysfunction in the lung by modulation of vascular adhesion markers and eNOS expression.
In sickle cell mice, recombinant ADAMTS13 reduced hypoxia/reoxygenation-induced kidney injury and modulated local inflammatory response Sickle cell-related nephropathy is one of the most com mon complications in both children and adults with SCD. 36,46,47 In SCD, renal vasculopathy has been linked to both ischemic/reperfusion damage, resulting in vascular
dysfunction and pro-fibrotic stimuli.1,33 Here, we found that treatment with rADAMTS13 reduced atrophic tubules, glomerular inflammatory cell infiltration and decreased thrombi formation in SS mice compared with vehicle-treated SS animals (Figure 3A, Table 1). This was associated with significant reductions in both creatinine and blood urea nitrogen in rADAMTS13-treated SS mice exposed to H/R compared with their levels in vehicletreated animals (Figure 3B). This agrees with the lower activation of NF- κ B p65 observed in kidneys from rADAMTS13-treated SS mice than in vehicle-treated ani mals (Figure 3C, Online Supplementary Figure S7A), sug gesting an amelioration of the local inflammatory response to H/R stress. Indeed, we found downregula tion of VCAM-1, ET-1, TXAS and E-selectin expression in kidney from rADAMTS13 SS mice compared with the ex pression in vehicle-treated SS animals (Figure 3D, On line Supplementary Figure S7B ). Taken together our data indicate that rADAMTS13 reduced H/R-induced kidney damage and renal inflammatory vasculopathy in hu manized SCD mice. Indeed, we found reduction in oxi dation of proteins in kidney from rADAMTS13-treated SS mice exposed to H/R stress compared with that in ve hicle-treated animals (Figure 4A). This was associated with upregulation of both eNOS and iNOS in kidney from SCD mice exposed to H/R compared with the levels in either SS mice under normoxia or AA mice exposed to H/R stress. rADAMTS13 reduced the H/R-induced in creased expression of both eNOS end iNOS in kidney from SS mice compared with that in vehicle-treated SS animals (Figure 4B).
Figure 3. In sickle cell disease mice, recombinant ADAMTS13 diminished hypoxia/reoxygenation-induced kidney damage and vascular inflammatory activation. (A) Representative hematoxylin and eosin-stained sections of kidney tissue from healthy (AA) and sickle cell (SS) mice exposed to hypoxia (8% oxygen; 10 h), followed by reoxygenation (21% oxygen; 3 h) treated with either vehicle or recombinant ADAMTS13 (rADAMTS13) (2940 U/kg); see also Table 1; black arrows indicate inflammatory cell infiltrate. (B) Plasma creatinine (upper panel) and blood urea nitrogen (BUN) (lower panel) in AA and SS mice treated as in (A). Data are mean ± standard error of mean (n=6 age-matched male and female animals). *P<0.05 compared to AA, ^P<0.05 compared to ve hicle-treated animals. (C) Immunoblot analysis, using specific antibodies against phosphorylated (P-)NF-κB p65 and NF-κB p65 of kidney from AA and SS mice under normoxia or exposed to hypoxia (8% oxygen; 10 h), followed by reoxygenation (21% oxygen; 3 h) treated with vehicle or rADAMTS13. GAPDH served as the protein loading control. One representative gel from three with similar results is shown (n=3 age-matched male and female in each group). Densitometric analysis of immunoblots is shown in Online Supplementary Figure 7SA. (D) Immunoblot analysis, using specific antibodies against VCAM-1, ET-1, TXAS and E-Selectin of kidney from AA and SS mice treated as in (A). GAPDH served as a protein loading control. One representative gel from three with similar results is shown (n=3 age-matched male and female in each group). Densitometric analysis of immunoblots is shown in Online Supplementary Figure 7SB. H/R: hypoxia/reoxygenation; VCAM-1: vascular endothelial cell adhesion molecule-1; ET-1: endothelin-1; TXAS: thromboxane synthase; GAPDH: glyceraldehyde-3-phosphate dehydrogenase.
Collectively, our data show that rADAMTS13 reduces H/R -induced kidney injury, and improves the local inflam matory response and vascular dysfunction.
In sickle cell mice, recombinant ADAMTS13 diminished hypoxia/reoxygenation-induced inflammatory vasculopathy Since inflammatory vasculopathy plays a key role in the pa thogenesis of both acute and chronic sickle cell-related organ damage,4,7,9,29 we studied isolated aorta from both mouse strains exposed to H/R stress. As shown in Figure 4C, we confirmed the H/R-induced upregulation of both ET1 and E-selectin in aorta from vehicle-treated SS mice com pared with that of SS animals under normoxia.4,29,36 This effect was reduced by rADAMTS13 treatment. No major change in ET-1 was observed in AA mice exposed to H/R stress compared with that in normoxic AA animals (Figure

4C). The expression of E-Selectin was increased in aorta from both mouse strains exposed to H/R compared with the expression in normoxic animals. This effect was reduced by rADAMTS13 treatment in both mouse strains (Figure 4C).
Here, we show for the first time that exogenous ADAMTS13 reduces acute SCD-related vascular activation and H/Rinduced organ damage in humanized sickle cell mice. Pre vious observations in human subjects with SCD suggested a relative ADAMTS13 deficiency that contributes to the ac cumulation of VWF and participates in the inflammatory vasculopathy that characterizes the disease.24 Administration of rADAMTS13 to SCD mice was shown to reduce H/R-induced hemolysis and H/R-induced throm
Figure 4. Recombinant ADAMTS13 reduces hypoxia/reoxygenation-induced kidney over-activation of endothelial nitric oxide synthase and protects against hypoxia/reoxygenation-induced worsening of inflammatory vasculopathy. (A) Left panel. Kidney soluble fraction from healthy (AA) and sickle cell (SS) mice treated under normoxia or exposed to hypoxia (8% oxygen; 10 h), fol lowed by reoxygenation (21% oxygen; 3 h) treated with either vehicle or recombinant ADAMTS13 (rADAMTS13) (2940 U/kg). Samples were analyzed by 11% sodium dodecylsulfate polyacrylamide gel electrophoresis and subjected to OxyBlot. The carbonylated proteins (1 mg) were detected by treating with 2,4-dinitrophenylhydrazine (DNP) and blotted with anti-DNP antibody. Right panel Band area was quantified by densitometry and expressed as percentage of that in AA mice in normoxia. The data are presented as means ± standard error of mean (SEM) (n=3 age-matched male and female mice in each group); ^P<0.05 compared to nor moxia, *P<0.05 compared to AA mice; #P<0.05 compared to vehicle-treated animals by a one-tailed t-test with Welch correction. (B) Left panel. Immunoblot analysis, using specific antibodies against eNOS and iNOS in kidney from AA and SS mice under nor moxia or exposed to hypoxia (8% oxygen; 10 h), followed by reoxygenation (21% oxygen; 3 h) treated with either vehicle or rADAMTS13 (2940 U/kg). GAPDH served as a protein loading control. One representative gel from three with similar results is shown. Right panel. Densitometric analysis of the immunoblot. Data are presented as means ± SEM (n=3 age-matched male and female mice in each group); ^P<0.05 compared to normoxia, *P<0.05 compared to AA mice; #P<0.05 compared to vehicle-treated animals by a one-tailed t-test with Welch correction. (C) Left panel. Immunoblot analysis, using specific antibodies against ET1 and E-Selectin of isolated aorta from AA and SS mice under normoxia or exposed to hypoxia (8% oxygen; 10 h), followed by re oxygenation (21% oxygen; 3 h) treated with either vehicle or rADAMTS13 (2940 U/kg). Actin was used as a protein loading control. One representative gel from three with similar results is shown. Right panels. Densitometric analysis of immunoblots. Data are presented as means ± SEM (n=3 age-matched male and female in each group); ^P<0.05 compared to normoxia, *P<0.05 compared to AA; #P<0.05 compared to vehicle-treated animals, one-tailed t-test with Welch correction. H/R: hypoxia/reoxygenation; ET-1: endothelin-1; eNOS: endothelial nitric oxide synthase; iNOS: inducible nitric oxide synthase; DU: densitometric units.
bocytopenia, suggesting that rADAMTS13 can beneficially affect microangiopathy related to acute vaso-occlusive crises. Indeed, rADAMTS13 decreased the adhesion of pla telets from SS mice, further corroborating the working hy pothesis of rADAMTS13 as a new therapeutic option for management of sickle cell-related acute events.

The beneficial effects of rADAMTS13 on clinical manifes tation related to H/R stress is also supported by: (i) the decrease of systemic inflammation and of local inflam matory cell infiltrates in target organs for SCD, such as the lungs and kidneys; (ii) the downregulation of VCAM-1 and ICAM-1 in both lungs and kidneys; and (iii) the reduc
tion in thrombi formation observed in both organs from SS mice exposed to H/R stress and treated with rADAMTS13. This was paralleled by modulation of both markers of vascular activation and pro-adhesion mol ecules in isolated aorta from rADAMTS13-treated SS mice, further supporting the role of the relative deficiency of ADAMTS13 activity in sickle cell-related inflammatory vas culopathy.11,48
The amplified and sustained inflammatory response participates in ADAMTS13 dysfunction in SCD (Figure 5), as supported by modulation of eNOS/iNOS ex pression in both lung and kidney by rADAMTS13 treatment.11,49
Although hydroxyurea is the standard therapy for both children and adults with SCD, the biocomplexity of SCD requires a multimodal therapeutic approach to prevent more severe acute and chronic organ complications. Novel therapeutic strategies such as anti-P-selectin antibody (crizanlizumab), which interferes with pro-adhesive events, and voxelotor, a small anti-sickling agent, have re cently been approved by the Food and Drug Administra tion.5,8,50 Both agents act in the long-term, as chronic treatments. In contrast, rADAMTS13 might be used in the early phase of severe vaso-occlusive events to reduce vascular dysfunction and to limit sickle cell-related acute organ damage. rADAMTS13 (TAK-755) has been tested in a series of safety and toxicity studies in rats and cynomol gus monkeys (in rats at doses up to 1,980 U/kg, Cmax up to 108.5 U/mL and treatment duration up to 26 weeks). Ad verse events (including bleeding episodes) directly related to rADAMTS13 were not observed, even at the highest doses tested, in any of the studies.51
In conclusion, our data indicate that treatment with rADAMTS13, via regulation of ultra-large VWF multimer cleavage, might provide a pharmacological benefit and disease-modifying activity. Collectively our findings pro vide the rationale to enter rADAMTS13 into a clinical trial of SCD (ClinicalTrials.gov Identifier: NCT03997760) testing the applicability of this agent in the clinical management of acute events in patients with SCD.
Figure 5. Schematic diagram of mechanisms involved in sickle cell-related microangiopathy and the role of recombinant ADAMTS13 as a novel therapeutic option for acute vaso-occlusive crises. Vaso-occlusive crises in sickle cell dis ease are characterized by hypoxia/reoxygenation stress, pro moting an amplified inflammatory response and severe hemolysis. Both factors contribute to a relative deficiency of ADAMTS13 associated with decreased susceptibility of von Willebrand factor (VWF) to ADAMTS13. This potentiates vas cular endothelial activation and damage, characterized by in creased expression of vascular pro-adhesion markers and abnormal local bioavailability of nitric oxide as part of severe sickle cell-related inflammatory vasculopathy and vascular dysfunction involved in acute organ damage. H/R: hypoxia/re oxygenation; Hb: hemoglobin; ADAMTS13: a disintegrin and metalloproteinase with thrombospondin type 1 motif, number 13; VWF: von Willebrand factor; rADAMTS13: recombinant ADAMTS13; NO: nitric oxide; VCAM-1: vascular cell adhesion molecule-1.

SC, GS, and HGr are employees of Baxalta Innovations GmbH, a member of the Takeda group of companies and are Takeda stock owners. PR, HGl, FC, MS, DV, MD, BP, HR, FS and WH were employees of Baxalta Innovations GmbH, a member of the Takeda group of companies at the time of the study. LDF has received grant/research support from: Baxalta Innovations GmbH, a Takeda company; and Roche; Agios. EF and AM have no conflicts of interest to declare.
LDF, PR, MD, FS and WH designed the experiments. EF, AM, IA, AI, FC, MS, SC, GS, DV, HGr. and BP performed and in terpreted the experiments. EF, AM, HR, WH and LDF re viewed the experimental data and the manuscript. PR, HG, WH and LDF contributed to writing the manuscript.
The authors thank Jutta Schreiner, Sylvia Peyrer-Heim staett, Sabrina Pable, Sonja Reisinger, Sandra Jelen, Astrid Prader, Michaela Schmidt and Nina Pruckner (all from Ba xalta Innovations GmbH) for excellent technical assistance.
The data that support the findings of this study are avail able from the corresponding author, [Gerald Schrenk], upon reasonable request.
1. Rodday AM, Esham KS, Savidge N, Parsons SK. Patterns of healthcare utilization among patients with sickle cell disease hospitalized with pain crises. EJHaem. 2020;1(2):438-447.
2. Shah N, Bhor M, Xie L, Paulose J, Yuce H. Sickle cell disease complications: Prevalence and resource utilization. PLoS One. 2019;14(7):e0214355.
3. Desai RJ, Mahesri M, Globe D, et al. Clinical outcomes and healthcare utilization in patients with sickle cell disease: a nationwide cohort study of Medicaid beneficiaries. Ann Hematol. 2020;99(11):2497-2505.
4. Matte A, Recchiuti A, Federti E, et al. Resolution of sickle cell disease-associated inflammation and tissue damage with 17Rresolvin D1. Blood. 2019;133(3):252-265.
5. Matte A, Cappellini MD, Iolascon A, Enrica F, De Franceschi L. Emerging drugs in randomized controlled trials for sickle cell disease: are we on the brink of a new era in research and treatment? Expert Opin Investig Drugs. 2020;29(1):23-31.
6. Manwani D, Frenette PS. Vaso-occlusion in sickle cell disease: pathophysiology and novel targeted therapies. Blood. 2013;122(24):3892-3898.
7. Vinchi F, De Franceschi L, Ghigo A, et al. Hemopexin therapy improves cardiovascular function by preventing heme-induced endothelial toxicity in mouse models of hemolytic diseases. Circulation. 2013;127(12):1317-1329.
8. Matte A, Zorzi F, Mazzi F, et al. New therapeutic options for the treatment of sickle cell disease. Mediterr J Hematol Infect Dis. 2019;11(1):e2019002.
9. De Franceschi L, Cappellini MD, Olivieri O. Thrombosis and sickle cell disease. Semin Thromb Hemost. 2011;37(3):226-236.
10. De Franceschi L, Corrocher R. Established and experimental treatments for sickle cell disease. Haematologica. 2004;89(3):348-356.
11. Lombardi E, Matte A, Risitano AM, et al. Factor H interferes with the adhesion of sickle red cells to vascular endothelium: a novel disease-modulating molecule. Haematologica. 2019;104(5):919-928.
12. Faes C, Ilich A, Sotiaux A, et al. Red blood cells modulate structure and dynamics of venous clot formation in sickle cell disease. Blood. 2019;133(23):2529-2541.
13. Noubouossie D, Key NS, Ataga KI. Coagulation abnormalities of sickle cell disease: relationship with clinical outcomes and the effect of disease modifying therapies. Blood Rev. 2016;30(4):245-256.
14. Faes C, Sparkenbaugh EM, Pawlinski R. Hypercoagulable state in sickle cell disease. Clin Hemorheol Microcirc. 2018;68(2-3):301-318.
15. Kawecki C, Lenting PJ, Denis CV. von Willebrand factor and inflammation. J Thromb Haemost. 2017;15(7):1285-1294.
16. Gragnano F, Sperlongano S, Golia E, et al. The role of von Willebrand factor in vascular inflammation: from pathogenesis to targeted therapy. Mediators Inflamm. 2017;2017:5620314.
17. Dalle Carbonare L, Matte A, Valenti MT, et al. Hypoxiareperfusion affects osteogenic lineage and promotes sickle cell bone disease. Blood. 2015;126(20):2320-2328.
18. Schwameis M, Schorgenhofer C, Assinger A, Steiner MM, Jilma B. VWF excess and ADAMTS13 deficiency: a unifying pathomechanism linking inflammation to thrombosis in DIC, malaria, and TTP. Thromb Haemost. 2015;113(4):708-718.
19. Joly BS, Coppo P, Veyradier A. Thrombotic thrombocytopenic purpura. Blood. 2017;129(21):2836-2846.
20. Scully M, Knobl P, Kentouche K, et al. Recombinant ADAMTS-13:
fi
rst-in-human pharmacokinetics and safety in congenital thrombotic thrombocytopenic purpura. Blood. 2017;130(19):2055-2063.
21. Zhou Z, Behymer M, Guchhait P. Role of extracellular hemoglobin in thrombosis and vascular occlusion in patients with sickle cell anemia. Anemia. 2011;2011:918916.
22. Zhou Z, Han H, Cruz MA, et al. Haemoglobin blocks von Willebrand factor proteolysis by ADAMTS-13: a mechanism associated with sickle cell disease. Thromb Haemost. 2009;101(6):1070-1077.
23. Zhou Z, Yee DL, Guchhait P. Molecular link between intravascular hemolysis and vascular occlusion in sickle cell disease. Curr Vasc Pharmacol. 2012;10(6):756-761.
24. Schnog JJ, Kremer Hovinga JA, Krieg S, et al. ADAMTS13 activity in sickle cell disease. Am J Hematol. 2006;81(7):492-498.
25. Novelli EM, Kato GJ, Hildesheim ME, et al. Thrombospondin-1 inhibits ADAMTS13 activity in sickle cell disease. Haematologica. 2013;98(11):e132-134.
26. Chen J, Hobbs WE, Le J, et al. The rate of hemolysis in sickle cell disease correlates with the quantity of active von Willebrand factor in the plasma. Blood. 2011;117(13):3680-3683.
27. Colombatti R, De Bon E, Bertomoro A, et al. Coagulation activation in children with sickle cell disease is associated with cerebral small vessel vasculopathy. PLoS One. 2013;8(10):e78801.
28. Sins JWR, Schimmel M, Luken BM, et al. Dynamics of von Willebrand factor reactivity in sickle cell disease during vasoocclusive crisis and steady state. J Thromb Haemost. 2017;15(7):1392-1402.
29. Kalish BT, Matte A, Andolfo I, et al. Dietary omega-3 fatty acids protect against vasculopathy in a transgenic mouse model of sickle cell disease. Haematologica. 2015;100(7):870-880.
30. Chauhan AK, Motto DG, Lamb CB, et al. Systemic antithrombotic effects of ADAMTS13. J Exp Med. 2006;203(3):767-776.
31. Rossato P, Canneva F, Schrenk G, et al. Dose-dependent effects of recombinant ADAMTS13 (TAK-755/SHP655) on recovery in a humanized mouse model of sickle cell disease. Res Pract Thromb Haemost. 2019;3(Suppl 1):PB1593.
32. de Franceschi L, Turrini F, Honczarenko M, et al. In vivo reduction of erythrocyte oxidant stress in a murine model of beta-thalassemia. Haematologica. 2004;89(11):1287-1298.
33. De Franceschi L, Olivieri O, Miraglia del Giudice E, et al. Membrane cation and anion transport activities in erythrocytes of hereditary spherocytosis: effects of different membrane protein defects. Am J Hematol. 1997;55(3):121-128.
34. Brugnara C, de Franceschi L. Effect of cell age and phenylhydrazine on the cation transport properties of rabbit erythrocytes. J Cell Physiol. 1993;154(2):271-280.
35. Park SY, Matte A, Jung Y, et al. Pathologic angiogenesis in the bone marrow of humanized sickle cell mice is reversed by blood transfusion. Blood. 2020;135(23):2071-2084.
36. Sabaa N, de Franceschi L, Bonnin P, et al. Endothelin receptor antagonism prevents hypoxia-induced mortality and morbidity in a mouse model of sickle-cell disease. J Clin Invest. 2008;118(5):1924-1933.
37. de Franceschi L, Baron A, Scarpa A, et al. Inhaled nitric oxide protects transgenic SAD mice from sickle cell disease-specific lung injury induced by hypoxia/reoxygenation. Blood. 2003;102(3):1087-1096.
38. Kokame K, Matsumoto M, Fujimura Y, Miyata T. VWF73, a region from D1596 to R1668 of von Willebrand factor, provides a
minimal substrate for ADAMTS-13. Blood. 2004;103(2):607-612.
39. Demagny J, Driss A, Stepanian A, et al. ADAMTS13 and von Willebrand factor assessment in steady state and acute vasoocclusive crisis of sickle cell disease. Res Pract Thromb Haemost. 2021;5(1):197-203.
40. Nwankwo JO, Gremmel T, Gerrits AJ, et al. Calpain-1 regulates platelet function in a humanized mouse model of sickle cell disease. Thromb Res. 2017;160:58-65.
41. Federti E, Matte A, Ghigo A, et al. Peroxiredoxin-2 plays a pivotal role as multimodal cytoprotector in the early phase of pulmonary hypertension. Free Radic Biol Med. 2017;112:376-386.
42. De Franceschi L, Platt OS, Malpeli G, et al. Protective effects of phosphodiesterase-4 (PDE-4) inhibition in the early phase of pulmonary arterial hypertension in transgenic sickle cell mice. FASEB J. 2008;22(6):1849-1860.
43. Heusch G. Critical Issues for the Translation of Cardioprotection. Circ Res. 2017;120(9):1477-1486.
44. Tang L, Wang H, Ziolo MT. Targeting NOS as a therapeutic approach for heart failure. Pharmacol Ther. 2014;142(3):306-315.
45. Golbidi S, Badran M, Ayas N, Laher I. Cardiovascular
consequences of sleep apnea. Lung. 2012;190(2):113-132.
46. Naik RP, Derebail VK. The spectrum of sickle hemoglobinrelated nephropathy: from sickle cell disease to sickle trait. Expert Rev Hematol. 2017;10(12):1087-1094.
47. Nath KA, Hebbel RP. Sickle cell disease: renal manifestations and mechanisms. Nat Rev Nephrol. 2015;11(3):161-171.
48. Martinelli N, Montagnana M, Pizzolo F, et al. A relative ADAMTS13 deficiency supports the presence of a secondary microangiopathy in COVID 19. Thromb Res. 2020;193:170-172.
49. Zhou XJ, Laszik Z, Ni Z, et al. Down-regulation of renal endothelial nitric oxide synthase expression in experimental glomerular thrombotic microangiopathy. Lab Invest. 2000;80(7):1079-1087.
50. Torres L, Conran N. Emerging pharmacotherapeutic approaches for the management of sickle cell disease. Expert Opin Pharmacother. 2019;20(2):173-186.
51. Kopic A, Benamara K, Piskernik C, et al. Preclinical assessment of a new recombinant ADAMTS-13 drug product (BAX930) for the treatment of thrombotic thrombocytopenic purpura. J Thromb Haemost. 2016;14(7):1410-1419.
Gaetano Giuffrida,1* Uros Markovic,1,2,3* Annalisa Condorelli,1,4 Marianna Calagna,1,4 Stephanie Grasso,1 Andrea Duminuco,1,4 Carla Riccobene,1 Angelo Curto Pelle,1,4 Guido Zanghi5 and Francesco Di Raimondo1,4
1Division of Hematology, AOU "Policlinico G. Rodolico-San Marco", Catania; 2Unità Operativa di Oncoematologia e BMT Unit, Istituto Oncologico del Mediterraneo, Viagrande; 3Department of Biomedical, Dental, Morphological and Functional Imaging Sciences, University of Messina, Messina; 4Postgraduate School of Hematology, University of Catania, Catania and 5Department of Surgery (CHIR), School of Medicine, University of Catania, Catania, Italy.
*GG and UM contributed equally as co-
Correspondence: U. Markovic
Received: February 24, 2022.
: April 22, 2022.
May 5, 2022.
rst authors.
Immune-mediated thrombotic thrombocytopenic purpura (iTTP) is a rare and life-threatening disease. Vaccination has been reported to be a trigger of onset and relapse of autoimmune diseases. We evaluated after mRNA COVID-19 vaccination 32 adult patients previously diagnosed with iTTP by means of weekly monitoring of complete blood count and ADAMTS13 testing. Thirty of 32 patients received at least one dose of Pfizer-BioNTech, the remaining two received Moderna. A total of five patients, all vaccinated with Pfizer-BioNTech, had a biochemical relapse at a median post-vaccination time of 15 days following the second or third vaccine dose, presenting without measurable ADAMTS13 activity and a median antiADAMTS13 autoantibody value of 34 U/mL. Four of five cases had concomitant clinical relapse and were treated with cor ticosteroids alone or daily sessions of plasma exchange and caplacizumab, while one patient was closely monitored with ADAMTS13 with no onset of anemia and thrombocytopenia. Although the benefits of vaccination exceed its potential risks, clinicians should be aware that iTTP relapse might follow COVID-19 vaccination. Therefore, laboratory and clinical moni toring of iTTP patients should be done in the first post-vaccination month, in order to promptly diagnose and treat any relapse.
Immune-mediated thrombotic thrombocytopenic purpura (iTTP), a rare and life-threatening disease with an annual incidence of roughly 1.5 new cases/million, is characterized by microangiopathic hemolytic anemia, thrombocytopenia and ischemic end organ injury due to microvascular pla telet-rich thrombi.1 The formation of microvascular thrombi is caused by the deficiency of the von Willebrand factorcleaving protease ADAMTS13, due to the presence of antiADAMTS13 autoantibodies.2 A major challenge in iTTP is the risk of relapse after remission.3 Although the predictors of relapse remain unsettled, a multi-center study by Sun and colleagues showed that a history of prior relapse, age younger than 25 years and non-O blood group were associ ated with an increased risk.4 ADAMTS13 activity monitoring during follow-up has shown that patients without measur
able levels of ADAMTS13 and/or high levels of antiADAMTS13 during clinical remission have a three-fold greater likelihood of relapse.5 A pre-emptive therapy with the anti-CD20 monoclonal antibody rituximab has been shown to prevent clinical relapses in most patients by maintaining in them measurable ADAMTS13 activity.6,7 How ever, not all patients with persistently low levels of ADAMTS13 have clinical relapse, suggesting the need for such additional hits as infection and/or inflammation.8 Disease onset or relapse of iTPP was described following different vaccines, including pneumococcal, influenza and rabies.9–13 Given the current massive vaccination due to the SARS-CoV-2 pandemic, new onset iTTP has been docu mented following a vector based Ad26.COV2-S vaccine14 and we recently described two new onset cases following the first dose of the Pfizer-BioNTech COVID-19 vaccine.15,16 Here we describe our real-life single center experience of iTTP
monitoring following mRNA COVID-19 vaccination in order to early detect any disease relapse.
In our center 42 adult patients had a prior diagnosis of iTTP. Diagnosis had been made on the presence of Coombsnegative microangiopathic hemolytic anemia, acute throm bocytopenia in the absence of any identifiable cause accompanied by the severe acquired deficiency of ADAMTS13 activity (<10%) and the presence of antiADAMTS13 antibodies.
Clinical relapse of iTTP was defined as the reappearance after a clinical remission (defined as a sustained clinical re sponse for at least 30 days after the last PEX/caplacizumab) of a platelet count <150x109/L with other causes of throm bocytopenia ruled out, with or without clinical evidence of new ischemic organ injury.17 A clinical relapse must be con firmed by documentation of severe ADAMTS13 deficiency. Biochemical relapse of iTTP was defined as ADAMTS13 plasma levels <20% after ADAMTS13 remission was achieved, i.e., at least a partial remission with ADAMTS13 level >20% but in the absence of clinical symptoms, micro angiopathic hemolytic anemia and thrombocytopenia. Bio chemical remission was defined as ADAMTS13 level >40%, while patients with ADAMTS13 level between 20% and 40% were defined to have partial biochemical responses.17 A total of 32 of 42 iTTP patients received a COVID-19 mRNA

vaccination (Pfizer-BioNTech or Moderna) between February 2021 and January 2022 (Figure 1). They were characterized according to age, sex, presence of biochemical relapse prior to vaccination, type of COVID-19 vaccine, number of vaccine doses, prevaccination ADAMTS13 activity and antiADAMTS13 autoantibodies and development of clinical or biochemical signs of disease relapse (Table 1). The study was conducted in accordance with International Confer ence on Harmonization Guidelines on Good Clinical Practice and the principles of the Declaration of Helsinki. All patients provided written informed consent.
Complete blood count (CBC), ADAMTS13 activity and antiADAMTS13 antibodies were employed for weekly monitoring during the month following each vaccine dose. Measure ment of both ADAMTS13 activity was performed in plasma, prior to incubation by using TECHNOZYM® ADAMTS13 ELISA (AlifaxTM Spa), a chromogenic enzyme-linked immunosor bant assay (ELISA) for the measurement of ADAMTS13 ac tivity in human plasma. Severe ADAMTS13 deficiency was defined as activity less than 10%, moderate ADAMTS13 defi ciency between 10% and 40%, normal ADAMTS13 between 40-130%. Anti-ADAMTS13 antibodies were measured by using the same chromogenic ELISA kit (TECHNOZYM® ADAMTS13 INH-AlifaxTM Spa) quantified by the spectropho tometer and the threshold for the positivity was ≥12 U/mL. ADAMTS13 measurement was done prior to vaccine admin istration and subsequently either as prescheduled followup controls or in case of suspected disease relapse.
Figure 1. Flow chart of immune-mediated thrombotic throm bocytopenic purpura patients and subsequent relapses, both clinical and biochemical, following mRNA COVID-19 vaccination. iTTP: immune-mediated thrombotic thrombocytopenic purpura.
A total of 32 iTTP cases (median age 47 years) were vacci nated with at least one dose of either Pfizer-BioNTech (30 cases) or Moderna (2 cases) COVID-19 mRNA vaccines (Fig ure 1). After a median follow-up of 71 months (range, 6-389 months) from the original iTTP disease diagnosis, these pa tients were re-evaluated prior to vaccination with CBC, that was within the normal range in all cases. Moreover, median ADAMTS13 activity was 48.5% and the titer of antiADAMTS13 was 5 U/mL, but seven patients were in bio chemical relapse prior to COVID-19 vaccination (Table 1), while three additional patients had a partial biochemical re sponse. Within a median follow-up period of 8 months fol lowing the first vaccine dose (range, 1-11 months), five patients (13%) had a clinical or biochemical relapse, all fol lowing the second or third Pfizer-BioNTech vaccine dose, at a median time interval of 15 days (range, 7-25 days) from vaccination, presenting without measurable ADAMTS13 ac tivity and a median anti-ADAMTS13 value of 34 U/mL (range,
Table 1. Clinical and laboratory characteristics of 32 immunemediated thrombotic thrombocytopenic purpura patients who received mRNA COVID-19 vaccination.
Age prior to vaccination
Median in years (range) 47 (19-73)
≤50 years, N (%) 18 (56)
>50 years, N (%) 14 (44)
Biochemical relapse prior to vaccination
Yes, N (%) 7 (22)
No, N (%) 25 (78)
ADAMTS13 prior to vaccination
ADAMTS13 activity, % (range) 48.5 (0-100)
ADAMTS13 autoantibodies, U/mL (range) 5 (1-92)
COVID-19 vaccine type
Pfizer-BioNTech, N (%) 30 (94)
Moderna, N (%) 2 (6)
N of vaccination doses
One, N (%) 3 (9)
Two,N (%) 20 (63)
Three, N (%) 9 (28)
iTTP relapse post-vaccination
Clinical relapse, N (%) 4 (13)
Biochemical relapse, N (%) 1 (3)
Relapse outcome (4 patients)
Clinical remission, N (%) 3 (75) Early relapse, N (%) 1 (25)
Recurrent TTP Patients (at least 2 previous relapse)
Yes, N (%) 6 (18) No, N (%) 26 (82)
iTTP: immune-mediated thrombotic thrombocytopenic purpura.
17-70 U/mL). Four of five cases concomitantly suffered from clinical relapse, while one patient had no signs of anemia and thrombocytopenia. None of the two patients with Mod erna vaccination relapsed. In case of severe thrombo cytopenia (less than 20.000/mmc) and the presence of hemolytic anemia patients were treated with steroids + plasma exchange (PEX) + caplacizumab, while others were started on steroids alone and in case of lack of response switched to steroids + PEX + caplacizumab.
A summary description of the five iTTP cases who had a post-vaccination relapse is shown in Table 2, and more details are listed below.
A 44-year-old A-positive woman with a diagnosis of iTTP made in 2017 and in complete remission since then, re ceived two doses of the Pfizer-BioNTech COVID-19 vaccine between May and September 2021. Before vaccination, ADAMTS13 activity was 20% and ADAMTS13 antibodies 3.2 U/mL. Three weeks after the second vaccine dose, com plete blood count (CBC) showed the appearance of ane mia (Hb 8.1 g/dL), thrombocytopenia (42.000/mmc) along with positive hemolysis markers. ADAMTS13 activity was not measurable (<10%), with a markedly increased antiADAMTS13 (34 U/mL, normal values [n.v.] 12-15 U/mL). The patient was admitted to hospital and treated with intra venous methylprednisolone at a daily dosage of 1 mg/kg, achieving clinical response after 7 days of treatment with normalization of both hemoglobin and platelet count, subsequent steroid tapering and stopping. However, there was no biochemical remission with persistently not measurable ADAMTS activity and a high titer of antiADAMTS13 (36 U/mL) at the last check-up 3 months fol lowing clinical relapse.
A 53-year-old O-positive woman with a iTTP diagnosis made in 2017 and a single clinical relapse in 2020, was in complete clinical and biochemical remission prior to COVID-19 vaccination, with 30% ADAMTS13 activity and antibody level of 5.5 U/mL. Two doses of the Pfizer-BioN Tech vaccine were administered in the period between May and June 2021. Three weeks after the second dose she developed a clinical relapse, with the presence of a low platelet count (68.000/mmc), positive hemolysis markers and schistocytes in the blood smear. ADAMTS13 testing confirmed biochemically the clinical relapse, showing not measurable activity (<10%) and high titer anti-ADAMTS13 (44 U/mL). Treated in the outpatient set ting with oral prednisone at the dosage of 1 mg/kg, clinical and biochemical responses were both obtained 8 days after treatment initiation, with 70% ADAMTS13 activity at her last check-up seven months from last disease re lapse.
Table 2. Summary of the immune-mediated thrombotic thrombocytopenic purpura relapses following mRNA COVID-19 vaccination (all after the Pfizer-BioNTech vaccine).
44 y/F 20% Two Clinical 20 days <10% 34 U/mL
Steroids only
53 y/F 30% Two Clinical 25 days <10% 44 U/mL Steroids only
32 y/F 58% Two Clinical 15 days <10% 70 U/mL
44 y/M <10% Three Clinical 15 days <10% 17 U/mL
PEX+steroids+ caplacizumab
PEX+steroids+ caplacizumab
55 y/M 42% Two Biochemical 7 days <10% 16 U/mL None
ITTP: immune-mediated thrombotic thrombocytopenic purpura; N: number; y: years; F: female; M: male; PEX: plasma exchange.
A 32-year-old O-positive woman had had a diagnosis of iTTP in 2007 and subsequently experienced two clinical relapses in 2015 and 2018, both during gestation with complete remission after parturition. Complete clinical and biochemical remission was confi rmed prior to COVID-19 vaccination, with 58% ADAMTS13 activity and low antibody level (4.6 U/mL). She received a two-dose Pfizer-BioNTech vaccine between September and October 2021 within an interval of 4 weeks. Two weeks after the second dose she experienced intense headache with fa tigue and was admitted to the hospital emergency room.
CBC revealed anemia (Hb 9,5 gr/d) with schistocytes, se vere thrombocytopenia (14.000/mmc) and positive hemolysis markers. ADAMTS13 activity was not measur able (<10%) with a high anti-ADAMTS13 (70 U/mL). She was treated with seven daily sessions of PEX, intravenous steroids (1 mg/kg) and a standard caplacizumab dosage (10 mg intravenously before the first PEX and 10 mg sub cutaneously daily until day 30 from the last PEX). After an initial clinical response to the treatment with normaliza tion of both hemoglobin and platelet count but with per sistently not measurable ADAMTS13 activity, she had a clinical relapse 50 days after treatment initiation (20 days after the end of caplacizumab) at the time of steroid ta pering. The platelet count was low again (46.000/mmc), with anemia (Hb 10.4 g/dL) and a high titer of antiADAMTS13 (93 U/mL), so she was restarted on the same initial therapy with steroids, PEX and caplacizumab, ob taining again a clinical response after 5 days. This patient completed weekly immunotherapy with rituximab at the standard dosage of 375 mg/m2 for a total of four weekly doses, with still not measurable ADAMTS13 activity fol lowing the last rituximab dose at the end of January 2022.
A 44-year-old O-positive man had a diagnosis of iTTP in 2018 and experienced three clinical relapses since then.
ADAMTS13 testing prior to vaccination revealed a biochemi cal relapse (activity of 10%, with 16 U/mL anti-ADAMT13) in the absence of anemia and thrombocytopenia. He received two doses of Pfizer-BioNTech in March and April 2021, with no signs of thrombocytopenia in the frame of weekly CBC controls. However, 2 weeks after the third booster dose at the end of December, a CBC control revealed severe throm bocytopenia (23.000/mmc) but no anemia (Hb 15,9 g/dL), therefore he was treated in the outpatient setting with oral prednisone at the dosage of 1 mg/kg. Two days later mod erate anemia (Hb 11.1 g/dL) with the presence of schisto cytes in the blood smear as well as severe thrombocytopenia (5.000/mmc) were found, along with blood chemistry markers of hemolysis. ADAMTS13 testing showed no measurable activity (<10%) and high antiADAMTS13 antibodies (17.3 U/mL). The patient was hospi talized and treated with daily sessions of PEX, intravenous steroids and caplacizumab (10 mg intravenously before the first PEX and 10 mg subcutaneously until 30 days from the last PEX), with an initial platelet response after 6 days of PEX and a biochemical response 14 days after treatment initiation, with 20% of ADAMTS13 and low anti-ADAMTS13 values (1.4 U/mL).
A 55-year-old B-negative man was diagnosed with iTTP in 2013 and subsequently experienced five biochemical re lapses, three of them being also clinical relapses. Seven days after receiving the second Pfizer-BioNTech vaccine dose in June 2021 ADAMTS13 activity decreased from 42% to <10% with an increase in the antibody level (from 8 to 16 U/mL) but no CBC change. The patient was regularly monitored with CBC in the following few months without any treatment and in December 2021 received a third booster vaccine dose with a subsequent increase in antiADAMTS13 values (29 U/mL) without measurable ADAMTS13 activity and without signs of hemolytic anemia and thrombocytopenia.
Onset of autoimmune diseases following vaccination is a known phenomenon, caused by the vaccine through mol ecular mimicry, epitope spreading and polyclonal activa tion.18 Vaccine adjuvants are an alternative possible cause of autoimmunity, and the autoimmune/inflammatory syn drome induced by adjuvants (ASIA) has been described as a hyperactive immune response to adjuvants.19 Given the autoimmune-origin of acquired TTP, it is not surprising that vaccination may be a trigger for disease relapse.9–13 Given the global COVID-19 pandemic with a high number of hospitalized patients, our opinion was that the benefits of vaccination outweighed the possible relapse risk even in iTTP patients with a risk of relapse. Thus, in order to early detect relapses, we chose to monitor our patients with iTTP in clinical remission with weekly CBC, ADAMTS13 and antiADAMTS13 testing following each mRNA vaccination for COVID-19. Serial biological monitoring was not considered because that there was no indication for treatment in pa tients suffering from biochemical relapse alone, and pa tients were therefore monitored at prescheduled controls every 3 months. This strategy allowed us to detect five cases of relapse (clinical or biochemical) following at least two doses of Pfizer-BioNTech. Interestingly, three of the eleven patients with ADAMTS13 <40% suffered from clinical relapse following the second or third vaccine dose, whereas only 9% of the patients with ADAMTS13 >40% had clinical and/or biochemical relapses (Figure 1). Two patients were treated early and successfully with steroids alone at a time when thrombocytopenia was not severe (platelet count > 20.000/mmc) and in the absence of hemolytic anemia. Of the two patients who received PEX and caplacizumab to gether with steroids, one had an early relapse and was re treated with the same regimen, followed by weekly rituximab for a total of four doses. Furthermore, there was a case who had only a biochemical relapse with normal he moglobin and platelet count following the second vaccina tion dose. Of note, three of four patients who had a clinical relapse are recurrent TTP patients (with at least one prior relapse in their clinical history) and one of them had low prevaccination ADAMTS13 activity (<10%). Thus, we ac knowledge that these patients were at high risk of relapse irrespective of vaccination, although the temporal relation ship between the two events suggests that vaccination was the trigger of the event, but not necessarily the cause.20 Since the beginning of the global COVID-19 vaccination vari ous cases of autoimmune activations, both as new-onset and disease flares, were reported.16 Watad and colleagues described 27 subjects with different autoimmune reactions that occurred on average 4 days following SARS-CoV-2 vac cination, including 17 flares and 10 new onsets. Twentythree of 27 cases had received Pfizer-BioNTech, while
Moderna and ChAdOx1 vaccines were received in two cases each.19 Furthermore, the development of venous thrombosis at unusual sites was described in association with the vac cine-induced immune thrombotic thrombocytopenia (VITT) syndrome caused by adenovirus-based COVID-19 vaccines such as ChAdOx1 and INN-Ad26.COV2-S.21 Cases of new onset of both immune thrombocytopenic purpura (ITP) and iTTP following COVID-19 vaccination have been also de scribed, including our experience of three cases of the former and two of the latter.15,22
In the case of VITT syndrome and newly diagnosed ITP and iTTP seen at our center, disease onset was detected follow ing the first vaccine dose in the majority of instances, at variance with our experience in the relapse setting. Unlike the two cases described in the literature following the first vaccine dose, in the present study all relapsed patients had received at least two doses of Pfizer-BioNTech and the as sociation between vaccination and clinical relapse is sup ported by the short latency period between COVID-19 vaccine dose and changes of both hemoglobin and pla telets.
Although the benefits of vaccination outweigh potential risks, clinicians should be aware that iTTP relapse might fol low COVID-19 vaccination. Considering the important mor bidity and mortality of iTTP, the importance of an early diagnosis of clinical relapse and prompt treatment initiation with weekly CBC controls following vaccination can be of aid both for patient outcome and the burden on the health system in the period of COVID-19 pandemic.
No conflicts of interest to disclose.
GG was responsible for project administration; UM, AC and MC interpreted the data and drafted the article; AC, MC, SG, AD and ACP selected patients, acquired and analyzed the data; GG and FDR revised the article for important intellec tual content and approved the final version for submission. All authors contributed to the article and approved the sub mitted version.
The authors are thankful to all patients and families and nurses who accepted to participate.
This work was supported by “Associazione Italiana contro le Leucemie, Linfomi e Mielomi” (A.I.L.) Catania.
The data that support the findings of this study are available upon documented request.
1. Miesbach W, Menne J, Bommer M, et al. Incidence of acquired thrombotic thrombocytopenic purpura in Germany: a hospital level study. Orphanet J Rare Dis. 2019;14:260.
2. Sukumar S, Lämmle B, Cataland SR. Thrombotic thrombocytopenic purpura: pathophysiology, diagnosis, and management. J Clin Med. 2021;10(3):536.
3. Kremer Hovinga JA, Vesely SK, Terrell DR, Lämmle B, George JN. Survival and relapse in patients with thrombotic thrombocytopenic purpura. Blood. 2010;115(8):1500-1511.
4. Sun L, Mack J, Li A, et al. Predictors of relapse and efficacy of rituximab in immune thrombotic thrombocytopenic purpura. Blood Adv. 2019;3(9):1512-1518.
5. Peyvandi F, Lavoretano S, Palla R, et al. ADAMTS13 and antiADAMTS13 antibodies as markers for recurrence of acquired thrombotic thrombocytopenic purpura during remission. Haematologica. 2008;93(2):232-239.
6. Bresin E, Gastoldi S, Daina E, et al. Rituximab as pre-emptive treatment in patients with thrombotic thrombocytopenic purpura and evidence of anti-ADAMTS13 autoantibodies. Thromb Haemost. 2009;101(2):233-238.
7. Jestin M, Benhamou Y, Schelpe AS, et al. Preemptive rituximab prevents long-term relapses in immune-mediated thrombotic thrombocytopenic purpura. Blood. 2018;132(20):2143-2153.
8. Miyata T, Fan X. A second hit for TMA. Blood. 2012;120(6):1152-1154.
9. Dias PJ, Gopal S. Refractory thrombotic thrombocytopenic purpura following influenza vaccination. Anaesthesia. 2009;64(4):444-446.
10. Hermann R, Pfeil A, Busch M, et al. Schwerste thrombotischthrombozytopenische Purpura (TTP) nach H1N1-Vakzinierung. Med Klin. 2010;105(9):663-668.
11. Kojima Y, Ohashi H, Nakamura T, et al. Acute thrombotic thrombocytopenic purpura after pneumococcal vaccination. Blood Coagul Fibrinolysis. 2014;25(5):512-514.
12. Brodin-Sartorius A, Guebre-Egziabher F, Fouque D, et al. Recurrent idiopathic thrombotic thrombocytopenic purpura: a
role for vaccination in disease relapse? Am J Kidney Dis. 2006;48(3):e31-e34.
13. Kadikoylu G, Yavasoglu I, Bolaman Z. Rabies vaccine-associated thrombotic thrombocytopenic purpura. Transfus Med. 2014;24(6):428-429.
14. Yocum A, Simon EL. Thrombotic thrombocytopenic purpura after Ad26.COV2-S vaccination. Am J Emerg Med. 2021;49441.e3-441.e4.
15. Giuffrida G, Condorelli A, Di Giorgio MA, et al. Immune-mediated thrombotic thrombocytopenic purpura following PfizerBioNTech COVID-19 vaccine. Haematologica. 2022;107(4):1008-1010.
16. Mannucci PM. Thrombotic thrombocytopenic purpura and other immune mediated blood disorders following SARS-CoV-2 Vaccination. Haematologica. 2022;107(4):785-786.
17. Cuker A, Cataland SR, Coppo P, et al. Redefining outcomes in immune TTP: an international working group consensus report. Blood. 2021;137(14):1855-1861.
18. Kivity S, Agmon-Levin N, Blank M, Shoenfeld Y. Infections and autoimmunity – friends or foes? Trends Immunol. 2009;30(8):409-414.
19. Watad A, De Marco G, Mahajna H, et al. Immune-mediated disease flares or new-onset disease in 27 subjects following mrna/dna sars-cov-2 vaccination. Vaccines. 2021;9(5):435.
20. Causality assessment of an adverse event following immunization (AEFI): user manual for the revised WHO classification (Second edition). Geneva: World Heal Organ; 2018.
21. Gresele P, Momi S, Marcucci R, Ramundo F, De Stefano V, Tripodi A. Interactions of adenoviruses with platelets and coagulation and the vaccine-associated autoimmune thrombocytopenia thrombosis syndrome. Haematologica. 2021;106(12):3034-3045.
22. Condorelli A, Markovic U, Sciortino R, Di Giorgio MA, Nicolosi D, Giuffrida G. Immune thrombocytopenic purpura cases following COVID-19 vaccination. Mediterr J Hematol Infect Dis. 2021;13(1):e2021047.
Julien Haroche,1* Yoram Gueniche,2* Damien Galanaud,3 Fleur Cohen-Aubart,1 Didier Dormont,3 Theophile Rousseau,4 Zahir Amoura,1 Valerie Touitou,4 and Natalia Shor2,5
1Sorbonne Universite, Assistance Publique-Hopitaux de Paris, Service de Medicine Interne 2, Centre National de Reference des Histiocytoses, Hopital Pitie-Salpetriere; 2Assistance Publique-Hopitaux de Paris, Service de Neuroradiologie; 3Sorbonne université, Assistance Publique-Hopitaux de Paris, Service de Neuroradiologie; 4Sorbonne Universite, Assistance Publique-Hopitaux de Paris, Service d’Ophtalmologie and 5Service de Neuroimagerie, Centre Hospitalier National d’Ophtalmologie des Quinze-Vingts, Paris, France
*JH and YG contributed equally as co-first authors.
Correspondence: N. Shor
natalia.shor@aphp.fr
J. Haroche
julien.haroche@aphp.fr
Received: December 14, 2021.
Accepted: April 12, 2022.
Prepublished: April 28, 2022.
https://doi.org/10.3324/haematol.2021.280510
©2022 Ferrata Storti Foundation
Published under a CC-BY-NC license
Erdheim-Chester disease (ECD) is a rare L-group histiocytosis. Orbital involvement is found in a third of cases, but few data are available concerning the radiological features of ECD-related orbital disease (ECD-ROD). Our aim was to characterize the initial radiological phenotype and outcome of patients with ECD-ROD. Initial and follow-up orbital magnetic resonance imaging (MRI) from the patients with histologically proven ECD at a national reference center were reviewed. Pathological orbital findings were recorded for 45 (33%) of the 137 patients included, with bilateral involvement in 38/45 (84%) cases. The mean age (± standard deviation) of these patients was 60 (±11.3) years and 78% were men. Intraconal fat infiltration around the optic nerve sheath adjacent to the eye globe (52%), with intense gadolinium uptake and a fibrous component was the most frequent phenotype described. Optic nerve signal abnormalities were observed in 47% of cases. Two patients had bilateral homogeneous extraocular muscle enlargement suggestive of a myositis-like involvement of ECD-ROD. None had isolated dacryoadenitis but in 17 eyes dacryodenitis was described in association with other types of orbital lesions. Only seven patients (15%) had normal brain MRI findings. ECD-associated paranasal sinus involvement and post-pituitary involvement were detected in 56% and 53% of patients, respectively. A decrease/disappearance of the lesions was observed in 17/24 (71%) of the patients undergoing late (>12 months) followups. Interestingly, ECD-ROD only rarely (7/45; 16%) revealed the disease, with exophthalmos being the most frequently identified feature in this subgroup (3/45; 6%). Even though ECD-ROD can be clinically silent, it comprises a broad array of lesions often resulting in optic nerve signal abnormalities, the functional outcome of which remains to be established. ECD-ROD should thus be assessed initially and subsequently monitored by orbital MRI and ophthalmological follow-up.
Erdheim-Chester disease (ECD) is a rare, L-group histio cytosis1 encompassing various pathophysiological pro cesses and diverse clinical manifestations originating from the xanthomatous or xanthogranulomatous infiltration of tissues by foamy histiocytes, “lipid-laden” macrophages, or histiocytes, with the infiltrate surrounded by fibrosis.2
It commonly affects the long bones (96-99%), 2-4 and is frequently characterized by bilateral symmetric long-bone osteosclerosis.2,5–7 About half the patients present with extraskeletal manifestations, including orbital infiltration in about 30% of cases.8 Intraorbital infiltration, sometimes described as “intraorbital masses”, has been reported in
association with clinical exophthalmos in ECD patients.914 ECD-related orbital disease (ECD-ROD) may have im aging features in common with other causes of orbital inflammation, such as immunoglobulin G4-related orbital disease (IgG4-ROD), lymphoproliferative disease, or gra nulomatosis with polyangiitis, particularly if there is as sociated lacrimal gland involvement (dacryoadenitis). There is no published systematic description of a sub stantial series of patients with ECD-ROD, and no followup data are currently available. Our aim here was to characterize the orbital involvement in ECD by retrospec tively reviewing orbital magnetic resonance imaging (MRI) findings. We also evaluated the available clinical and radiological follow-up data.
This retrospective study analyzing patients’ medical rec ords and imaging data was approved (n. 20210810160633) by the ethics committee of our institution (Pitié-Salpê trière Hospital, Paris). It was conducted in accordance with the Declaration of Helsinki.
Patients with a histologically proven diagnosis of ECD re ferred to our French tertiary center between 1996 and 2020 were enrolled in the study. The inclusion criteria were: (i) patient over 18 years of age; (ii) definitive diag nosis of ECD established on the basis of the consensus criteria;15 and (iii) available brain and orbital MRI. Patients with mixed histiocytosis (ECD and Langerhans cell histio cytosis/Rosai-Dorfman disease) were excluded.
Magnetic resonance imaging protocol Orbital MRI included 3 or 1.5 Tesla images with at least T2-weighted (T2W) coronal and T1-weighted (T1W) spinecho fat-saturated, gadolinium-enhanced sequences covering the entire orbit and the visual pathways, includ ing the optic chiasm. Brain MRI included at least T2Wand diffusion-weighted imaging axial, three-dimensional or axial T2 fluid-attenuated inversion recovery (FLAIR) sequences.
The imaging data were collected and retrospectively re viewed by two neuroradiologists (YG and NS) with 5 and 7 years of experience in neuroradiology. Differences in as sessment were settled by consensus with the third reader (DG) with 20 years of experience. Only the patients with positive identification of orbital lesions were included in the final imaging analysis. The readers assessed the fol lowing characteristics of each orbital lesion: (i) its lateral location, defined as left, right or bilateral; (ii) its location within orbital regions, as follows: adjacent to the globe, intraconal or extraconal orbital fat involvement, extraocu lar muscle, lacrimal gland; (iii) its main signal on T2W im aging, defined as hypointense, isointense or hyperintense, relative to the signal for healthy oculomotor muscles, the temporal muscles; (iv) its enhancement after contrast in jection, relative to that of healthy extraocular muscles, classified as absent, moderate if weaker than that of healthy extraocular muscles, or major if at least as strong as that of healthy oculomotor muscles; (v) its extension to the cavernous sinus, foramen ovale or foramen rotun dum; (vi) exophthalmos: defined as the posterior third of the orbital globe lying in front of the external bicanthal line;16,17 (vii) enophthalmos: defined as half the orbital globe lying behind the external bicanthal line; and (viii)
optic nerve T2 signal abnormality and optic nerve sheath enlargement.
The following information was collected from the brain MRI sequences: (i) the presence of thickening of the pitu itary stem and/or a loss of spontaneous T1W hyperinten sity of the posterior pituitary gland and infundibular stalk abnormalities; (ii) pachymeningeal and leptomeningeal in volvement; (iii) intra-axial mass; (iv) high T2 FLAIR signal intensity within the dentate nuclei; (v) ischemic sequelae; and (vi) cortico-subcortical atrophy.
The presence of paranasal sinus involvement suggestive of ECD was also assessed. All of the available follow-up MRI scans were analyzed.
Clinical data, including age at the time of orbital MRI, sex, and BRAF status, were collected. Available visual acuity test results and the existence of associated cardiac dam age or kidney damage were also assessed.
Age is expressed as the mean and standard deviation (SD). Categorical variables are expressed as counts and percen tages. Comparisons between categorical variables were performed with the Fisher exact test and the c2 test, for univariate analysis. We considered P values <0.05 to be statistically significant. SPSS software was used for the analyses.
In total, 304 patients with suspected ECD were referred to the internal medicine department of our hospital be tween January 1996 and July 2020. We excluded 62 (20%) of these patients due to mixed histiocytosis or because the diagnosis of ECD was not proven according to prede fined and accepted criteria.2,15 The 137 brain MRI scans for the remaining patients included specific, orbital se quences, and 45 (33%) of these MRI revealed orbital ab normalities. The selection of participants is illustrated in Figure 1. The patients with orbital MRI abnormalities were mainly men (78%), with a mean age (± SD) of 60 (±11.3) years. BRAF status was obtained for 122 of the 137 pa tients with proven ECD disease. A BRAF mutation was de tected in 32 of the 80 (40%) without orbital abnormalities, and in 11 of the 42 (26%) patients with ECD-ROD (P=0.188, c2 test).
The initial MRI scans of 45 patients (83 affected eyes) were analyzed. Bilateral lesions were detected in 38 (84%) pa tients, and 25 (55%) patients had symmetric orbital involve ment. Orbital fat infiltration was observed in 88% of cases, whereas the intraconal fat surrounding the optic nerve
Figure 1. Flow-chart of the patients’ inclusion and analysis. ECD: Erdheim-Chester disease; MRI: magnetic resonance imaging.
sheath was involved in 84% of cases. This involvement was anterior, adjacent to the eyeball, resulting in radiological images resembling “hairy globes” in 52% of cases. It re sulted in optic nerve signal abnormalities in 47% of cases (Figure 2). For orbital infiltration, it was possible to assess the intensity of the T2W signal on MRI for only 67 affected eyes, due to significant movement artifacts. In most cases, the infiltration presented a hypointense T2W signal reflect ing a fibrous component. We were able to analyze the ga dolinium uptake of the infiltration in 69 affected eyes. The vast majority (90%) of lesions presented intense gadolinium
enhancement, with only 10% having weaker enhancement than for the temporal muscle. Interestingly, 7% of affected eyes displayed isolated bilateral optic nerve sheath en largement and/or isolated optic nerve signal abnormalities. Two patients had homogeneous bilateral extraocular muscle enlargement (Figure 3). Both these patients tested negative for Graves’ disease and neither was on interferon treatment. None of the patients had isolated dacryoadeni tis. Only 31% of affected eyes presented exophthalmos, and 10% presented enophthalmos. Orbital involvement is summarized in Table 1.

Figure 2. Orbital fat in
ltration in two patients.
T1-weighted with
D) and without
the signal abnormalities of the optic nerve
patient
enhanced
layers of
the internal layer being hypointense on the T2weighted image
sequence
arrowhead) than the peripheral one.
Out of 45 patients with orbital lesions only seven (15%) had normal brain MRI results. Paranasal sinus involvement (56%) and the loss of the T1W bright spot in the posterior pituitary lobe (53%) were the most frequent extraorbital findings. Cortico-subcortical atrophy was observed in 20 of 45 (45%) patients. The extraorbital lesions are summarized in Table 2. The brain MRI findings of the patients included before 2010 were reported by Drier et al.8 There was no significant statistical link between the pres ence of orbital, encephalic, and paranasal sinus lesions. For the 45 patients with orbital abnormalities, we found no sig nificant associations with the involvement of other organs. No significant statistical link was detected between “hairyglobe” infiltration and the “hairy-kidney” sign (P=0.5). One of the three patients with isolated optic nerve hyperinten sity had a history of glaucoma, whereas the other two had undergone no ophthalmological monitoring.


Twenty-nine patients underwent at least one follow-up
MRI scan. Eleven patients underwent MRI at a check-up visit within 1 year (early follow-up), and 24/45 had longi tudinal follow-up data for more than a year (late followup). Follow-up lasted a mean of 55 months and a median of 33.5 months (range, 7-238 months). Infiltration re mained stable on the early follow-up MRI scans for all but one of the 11 patients with such scans available. Late follow-up MRI scans were performed for 24 patients (among whom 12 were treated with interferon- α , 5 with a BRAF inhibitor, 1 with dual therapy (BRAF + MEK in hibitor), 2 with remicade, 1 with tocilizumab, and 1 with anakinra). In 17 (71%) of the 24 patients the lesions de creased in size or disappeared. It should be noted that lesions decreased in two patients who were off therapy (Figure 4). For all these patients, we observed a decrease in the intensity of gadolinium uptake followed by a de crease in lesion volume. Two of the seven patients dis playing no significant modification had an isolated enlargement of the optic nerve sheath. Four of the five remaining patients with infiltrative lesions had an initial hypointense signal lesion on the T2W sequence relative
to the intensity of the signal from temporal muscles, suggesting a mostly fibrous component. We were able to collect visual acuity data for 26/45 pa tients. Sixteen (61%) had a visual acuity of 10/10. Three of the 45 patients (11%) had a visual acuity ≤5/10, and all three had anterior “hairy-globe” lesions. Interestingly, or bital involvement was rarely (7/45; 16%) identified as the sign revealing the disease, and clinical exophthalmos was the most frequent form of optical involvement detected (3/45; 6%).
This is, to the best of our knowledge, the largest study to date of patients with ECD-ROD. It is also the only study providing follow-up analysis of the orbital imaging. As such, it provided sufficient data for a rich topographical and semiological description. In this series of 137 patients,
Table 1. Results of orbital magnetic resonance imaging analysis.
Orbital lesions (N=45 patients)
N (%)
Bilateral orbital involvement 38/45 (84)
Symmetric orbital involvement 25/45 (55)
Infiltrative lesions (n=83 AE) 73/83 (88)
Infiltration morphology/location analysis
Pre-orbital fat 3/73 (4)
Adjacent to the eyeball 38/73 (52)
Involvement of the optic nerve sheath 63/73 (86)
Intraconal fat 61/73 (84)
Extraconal fat 38/73 (52)
OMM 32/73 (44)
Lacrimal gland 18/73 (25) Orbital apex 42/73 (58)
Infiltration signal analysis
T2 signal ≤ TM 51/67 (76)
T2 signal ≤ healthy OMM 41/67 (61)
Major enhancement 62/69 (90)
Moderate enhancement 7/69 (10)
Optic nerve signal abnormality 34/73 (47)
Extraorbital involvement (cavernous sinus/ foramen ovale/ foramen rotundum) 7/73 (10)
Other orbital abnormalities (n=83 AE) 10/83 (12)
Isolated optic nerve sheath enlargement and/or isolated optic nerve signal abnormalities 6/83 (7)
Extraorbital muscle enlargement 4/83 (5)
Isolated lacrimal gland enlargement 0/83 (0)
Exophthalmos 26/83 (31)
Enophthalmos 8/83 (10)
AE: affected eyes; OMM: oculomotor muscles; TM: temporal muscles.
orbital MRI results were abnormal for 45 (33%) patients. The previously reported intraconal, anterior “hairy globelike” lesions18-22 were the most frequent type in patients with ECD-ROD, but unilateral orbital abnormalities were not exceptional (16%) (Figure 5). Four affected eyes pres ented homogeneous extraocular muscle enlargement with no significant intraorbital fat infiltration. This myositis-like pattern of ECD-ROD has not previously been reported in ECD-ROD. This new feature is of particular importance for the differential diagnosis of Graves’ disease-associated or bitopathy or idiopathic orbital myositis-related inflamma tion.23 Only 31% of the patients had exophthalmos evident on radiological examination, and ophthalmological symp toms revealed the disease in only 16% of cases. However, a large proportion of patients (47% of affected eyes with intraorbital fat infiltration) presented optic nerve signal abnormalities. Given the scarcity of residual visual acuity data and the lack of systematic monitoring of the visual field or retinal thickness, both of which are expected to be modified by chronic extrinsic compression, no con clusions can yet been drawn about the clinical implica tions of this finding.24-26 Head MRI results were frequently abnormal in the patients with orbital lesions (85%). Consistent with the findings of previous studies, associated lesions most frequently de tected were paranasal sinus and pituitary lobe abnormal ities.8
Late follow-up MRI revealed a remarkable decrease in the size of orbital infiltrative lesions or the total disappea rance of these lesions. Gadolinium enhancement, reflect ing the intensity of inflammation, was the first sign to disappear during follow-up. Case reports and very small series of patients have re sulted in descriptions of ophthalmological symptoms such
Table 2. Associated brain and sinus involvement.
Cortico-subcortical atrophy, N (%) 20/45 (44)
Ischemic sequelae, N (%) 4/45 (8)
Intra-axial mass, N (%) 2/45 (4)
High T2 FLAIR signal intensity in the dentate nucleus area, N (%) 12/45 (27)
Diffuse pachymeningeal thickening, N (%) 9/45 (20)
Diffuse leptomeningeal thickening, N (%) 1/45 (2)
Infundibular stalk abnormalities, N (%) 6/45 (13)
Absence of T1 bright spot in the posterior pituitary lobe, N (%) 23/43 (53)
Sinus involvement, N (%) 25/45 (56)
FLAIR: fluid-attenuated inversion recovery.
as reduced visual acuity or exophthalmos associated with ECD-ROD, which is often the first clinical manifestation of the disease.10,11,22,27,28 In our study, ophthalmological symp toms (exophthalmos) helped to reveal the disease in only a small proportion of cases. When available, the visual acuity seemed to be generally well preserved (89% had a visual acuity ≥6/10), but no data were available concerning retinal nerve fiber layer thickness/visual field. No isolated lacrimal gland lesions were observed in our series. Fur thermore, the extension of lesions towards the cavernous sinus/foramen rotundum was very rare (10% of the infil trative lesions). This feature may be of use for distinguish ing between ECD-ROD and its principal differential diagnoses, such as IgG4-ROD and sarcoidosis. Of note, al most every orbital structure may be involved in IgG4-ROD, lacrimal gland involvement being the most frequent (up to 53-87.7%).29-31 Orbital involvement may be isolated.30,32 Perineural spread along the V1, V2 (into the foramen ro
tundum) and especially V3 branches (into the foramen ovale) is a specific feature of IgG4-ROD.32 The most com mon orbital features in neurosarcoidosis include uveitis,33 lacrimal gland involvement (42% and 63%)34,35 and retro bulbar optic neuritis (63%).
The most recent consensus recommendations15 indicate the performance of brain MRI with gadolinium injection during initial diagnostic investigations. However, these rec ommendations do not stress the importance of including speci
c orbital sequences. The results of our study dem onstrate the difficulty of diagnosing ECD-ROD and the need for systematic orbital MRI sequences to be included in the initial assessment and follow-up of ECD-associated organ involvement.


The retrospective design of this study was one of its limi tations. Furthermore, the rarity of the disease necessi tated the collection of data for patients seen over a period of 24 years, to ensure the inclusion of suf
cient numbers
of patients. These data were, inevitably, incomplete, and the quality of the orbital MRI scans available was highly variable, in terms of both the sequences performed and their resolution. Visual acuity data were available for only 56% of patients, and no data on the visual field or the thickness of the retinal nerve fiber layer were available for a substantial number of patients. In conclusion, ECD-ROD corresponds to an array of lesions, mostly silent, but often resulting in optic nerve signal ab normalities. The initial assessment and subsequent moni toring of ECD-ROD by orbital MRI and ophthalmological follow-up is therefore essential to prevent possible func tional handicaps, such as visual field limitation.
No conflicts of interest to disclose.
1. Emile J-F, Abla O, Fraitag S, et al. Revised classification of histiocytoses and neoplasms of the macrophage-dendritic cell lineages. Blood. 2016;127(22):2672-2681.
2. Haroche J, Arnaud L, Cohen-Aubart F, et al. Erdheim-Chester disease. Curr Rheumatol Rep. 2014;16(4):412.
3. Mazor RD, Manevich-Mazor M, Shoenfeld Y. Erdheim-Chester disease: a comprehensive review of the literature. Orphanet J Rare Dis. 2013;8:137.
4. Arnaud L, Hervier B, Néel A, et al. CNS involvement and treatment with interferon-α are independent prognostic factors in Erdheim-Chester disease: a multicenter survival analysis of 53 patients. Blood. 2011;117(10):2778-2782.
5. Dion E, Graef C, Miquel A, et al. Bone involvement in ErdheimChester disease: imaging findings including periostitis and partial epiphyseal involvement. Radiology. 2006;238(2):632-639.
6. Estrada-Veras JI, O’Brien KJ, Boyd LC, et al. The clinical spectrum of Erdheim-Chester disease: an observational cohort study. Blood Adv. 2017;1(6):357-366.
7. Veyssier-Belot C, Cacoub P, Caparros-Lefebvre D, et al. Erdheim-Chester disease. Clinical and radiologic characteristics of 59 cases. Medicine (Baltimore). 1996;75(3):157-169.
8. Drier A, Haroche J, Savatovsky J, et al. Cerebral, facial, and orbital involvement in Erdheim-Chester disease: CT and MR imaging findings. Radiology. 2010;255(2):586-594.
9. Alper MG, Zimmerman LE, Piana FG. Orbital manifestations of Erdheim-Chester disease. Trans Am Ophthalmol Soc. 1983;81:64-85.
10. Broccoli A, Stefoni V, Faccioli L, et al. Bilateral orbital ErdheimChester disease treated with 12 weekly administrations of VNCOP-B chemotherapy: a case report and a review of literature. Rheumatol Int. 2012;32(7):2209-2213.
11. Gilles M, Alberti N, Seguy C, et al. [An ophthalmologic diagnostic error leading to a rare systemic diagnosis: Erdheim-Chester disease]. J Fr Ophtalmol. 2014;37(5):377-380.
12. Mamlouk MD, Aboian MS, Glastonbury CM. Case 245: ErdheimChester disease. Radiology. 2017;284(3):910-917.
13. de Abreu MR, Chung CB, Biswal S, et al. Erdheim-Chester disease: MR imaging, anatomic, and histopathologic correlation of orbital involvement. AJNR Am J Neuroradiol. 2004;25(4):627-630.
YG analyzed data, wrote the manuscript and conducted re search; JH and NS: designed the study, analyzed data, wrote the manuscript and conducted research; DG, FCA, DD, ZA, TR and VT reviewed the work and contributed to the data analysis. All the authors critically reviewed and approved the final manuscript.
Mr. Elie Lagache performed the statistical analysis of the data.
The datasets used and/or analyzed during the current study are available from the corresponding authors (NS & JH) on reasonable request
14. Sheidow TG, Nicolle DA, Heathcote JG. Erdheim-Chester disease: two cases of orbital involvement. Eye (Lond). 2000;14(Pt 4):606-612.
15. Goyal G, Heaney ML, Collin M, et al. Erdheim-Chester disease: consensus recommendations for evaluation, diagnosis, and treatment in the molecular era. Blood. 2020;135(22):1929-1945.
16. Héran F, Lafitte F. Chapitre 4 - Pathologie orbitopalpébrale: Exophtalmie. In: Héran F, Lafitte F, eds. Imagerie en Ophtalmologie pour les Radiologues. Elsevier Masson; 2018:81-153.e30.
17. Fang ZJ, Zhang JY, He WM. CT features of exophthalmos in Chinese subjects with thyroid-associated ophthalmopathy. Int J Ophthalmol. 2013;6(2):146-149.
18. Grumbine FL, Aderman C, Vagefi MR, et al. Orbital MRI pre- and post-vemurafenib therapy for Erdheim-Chester disease. Ophthalmic Plast Reconstr Surg. 2015;31(6):e169.
19. Pineles SL, Liu GT, Acebes X, et al. Presence of Erdheim-Chester disease and Langerhans cell histiocytosis in the same patient: a report of 2 cases. J Neuroophthalmol. 2011;31(3):217-223.
20. Lau WW, Chan E, Chan CW. Orbital involvement in ErdheimChester disease. Hong Kong Med J. 2007;13(3):238-240.
21. Perić P, Antić B, Knezević-Usaj S, et al. Successful treatment with cladribine of Erdheim-Chester disease with orbital and central nervous system involvement developing after treatment of Langerhans cell histiocytosis. Vojnosanit Pregl. 2016;73(1):83-87.
22. Abdellateef EE, Abdelhai AR, Gawish HH, et al. The first reported case of Erdheim-Chester disease in Egypt with bilateral exophthalmos, loss of vision, and multi-organ involvement in a young woman. Am J Case Rep. 2016;17:360-370.
23. Mombaerts I, Bilyk JR, Rose GE, et al. Consensus on diagnostic criteria of idiopathic orbital inflammation using a modified Delphi approach. JAMA Ophthalmol. 2017;135(7):769-776.
24. Rosiene J, Liu X, Imielinska C, et al. Structure-function relationships in the human visual system using DTI, fMRI and visual field testing: pre- and post-operative assessments in patients with anterior visual pathway compression. Stud Health Technol Inform. 2006;119:464-466.
25. Ryu WHA, Starreveld Y, Burton JM, et al. The utility of magnetic resonance imaging in assessing patients with pituitary tumors
compressing the anterior visual pathway. J Neuroophthalmol. 2017;37(3):230-238.
26. Danesh-Meyer HV, Yoon JJ, Lawlor M, et al. Visual loss and recovery in chiasmal compression. Prog Retin Eye Res. 2019;73:100765.
27. Pichi F. Choroidal mass as the first presentation of ErdheimChester disease. Am J Ophthalmol Case Rep. 2019;16:100539.
28. Valmaggia C, Neuweiler J, Fretz C, et al. A case of ErdheimChester disease with orbital involvement. Arch Ophthalmol. 1997;115(11):1467-1468.
29. Shor N, Sené T, Zuber J, et al. Discriminating between IgG4related orbital disease and other causes of orbital inflammation with intra voxel incoherent motion (IVIM) MR imaging at 3T. Diagn Interv Imaging. 2021;102(12):727-734.
30. Tiegs-Heiden CA, Eckel LJ, Hunt CH, et al. Immunoglobulin G4related disease of the orbit: imaging features in 27 patients. AJNR Am J Neuroradiol. 2014;35(7):1393-1397.
31. Sogabe Y, Ohshima K, Azumi A, et al. Location and frequency of lesions in patients with IgG4-related ophthalmic diseases.
Graefes Arch Clin Exp Ophthalmol. 2014;252(3):531-538.
32. Ben Soussan J, Deschamps R, Sadik JC, et al. Infraorbital nerve involvement on magnetic resonance imaging in European patients with IgG4-related ophthalmic disease: a specific sign. Eur Radiol. 2017;27(4):1335-1343.
33. Lutt JR, Lim LL, Phal PM, et al. Orbital inflammatory disease.
Semin Arthritis Rheum. 2008;37(4):207-222.
34. Prabhakaran VC, Saeed P, Esmaeli B, et al. Orbital and adnexal sarcoidosis. Arch Ophthalmol. 2007;125(12):1657-1662.
35. Demirci H, Christianson MD. Orbital and adnexal involvement in sarcoidosis: analysis of clinical features and systemic disease in 30 cases. Am J Ophthalmol. 2011;151(6):1074-1080.e1.
36. Leclercq M, Sené T, Chapelon-Abric C, et al. Prognosis factors and outcomes of neuro-ophthalmologic sarcoidosis. Ocul Immunol Inflamm. 2020;9:1-8.
Alejandro Martín García-Sancho,1 Monica Bellei,2 Miriam López-Parra,1 Giuseppe Gritti,3 María Cortés,4 Silvana Novelli,5 Carlos Panizo,6 Luigi Petrucci,7 Antonio Gutiérrez,8 Ivan Dlouhy9, Mariana Bastos-Oreiro,10 Juan M. Sancho,11 María J. Ramírez,12 José M. Moraleda,13 Estrella Carrillo,14 Ana I. Jiménez-Ubieto,15 Isidro Jarque,16 Lorella Orsucci,17 Estefanía García-Torres,18 Carlos Montalbán,19 Anna Dodero,20 Reyes Arranz,21 Natalia de las Heras,22 María J. Pascual,23 Javier López-Jiménez,24 Michelle Spina,25 Alessandro Re,26 Sonia González de Villambrosia,27 Sabela Bobillo,28 Massimo Federico29 and Dolores Caballero1 on behalf of the Grupo Español de Linfomas y Trasplante Autólogo de Médula Ósea (GELTAMO) and Fondazione Italiana Linfomi (FIL)
1Department of Hematology, Hospital Universitario de Salamanca, IBSAL, CIBERONC, Salamanca, Spain; 2Fondazione Italiana Linfomi (FIL) Onlus, Modena, Italy; 3Hematology and Bone Marrow Transplant Unit, ASST Papa Giovanni XXIII, Bergamo, Italy; 4Department of Statistics, Hospital Universitario de Salamanca / IBSAL, Salamanca, Spain; 5Hematology Department, Hospital de la Santa Creu i Sant Pau, José Carreras Leukemia Research Institute and IIB Sant Pau, Barcelona, Spain; 6Department of Hematology, Clínica Universidad de Navarra, IdiSNA, Pamplona, Spain; 7Department of Translational and Precision Medicine, Sapienza University, Rome, Italy; 8Department of Hematology, Son Espases University Hospital, IdISBa, Palma de Mallorca, Spain; 9Department of Hematology, Hospital Clínic de Barcelona, Barcelona, Spain; 10Hematology Department, Hospital Gregorio Marañón / IISGM, Madrid, Spain; 11Hematology Department, ICO-IJC-Hospital Germans Trias i Pujol, Badalona, Spain; 12Hematology Department, Hospital de Especialidades de Jerez de la Frontera, Cádiz, Spain; 13Hematology Department, Hospital Clínico Universitario Virgen de la Arrixaca, Murcia, Spain; 14Hematology Department, Hospital Universitario Virgen del Rocío, Seville, Spain; 15Hematology Department, Hospital Universitario 12 de Octubre, Madrid, Spain; 16Hematology Department, CIBERONC, Instituto Carlos III, Hospital Universitario y Politécnico La Fe, Valencia, Spain; 17Hematology, Azienda Ospedaliero-Universitaria Città della Salute e della Scienza, Multidisciplinary Outpatient Oncology Clinic, Candiolo Cancer Institute, FPO-IRCCS, Candiolo (Torino), Italy; 18Hematology Department, Hospital Universitario Reina Sofía, Cordoba, Spain; 19Department of Translational Research, MD Anderson Cancer Center, Madrid, Spain; 20Division of Hematology and Bone Marrow Transplantation, Fondazione IRCCS Istituto Nazionale dei Tumori, Milano, Italy; 21Hematology Department, Hospital La Princesa, Madrid, Spain; 22Department of Hematology, Complejo Hospitalario de León, León, Spain; 23Hematology Department, Regional Hospital, Málaga, Spain; 24Hematology Department, Hospital Universitario Ramón y Cajal, Madrid, Spain; 25Division of Medical Oncology and Immune-related Tumors, Centro di Riferimento Oncologico di Aviano (CRO) IRCCS, Aviano, Italy; 26Division of Hematology, ASST Spedali Civili di Brescia, Brescia, Italy; 27Hematology Department, Hospital Universitario Marqués de Valdecilla, Santander, Spain; 28Department of Hematology, University Hospital Vall d'Hebron and Universitat Autònoma de Barcelona, Barcelona, Spain and 29Medical Oncology, CHIMOMO Department, University of Modena and Reggio Emilia, Modena, Italy.
Correspondence: A. M. García-Sancho amartingar@usal.es
Received: July 21, 2021.
: January 28, 2022.
: March 24, 2022.
Peripheral T-cell lymphomas (PTCL) are a heterogeneous group of rare lymphoid malignancies that mostly have poor prognoses with currently available treatments. Upfront consolidation with autologous stem cell transplantation (ASCT) is frequently carried out, but its efficacy has never been investigated in randomized trials. We designed a multicenter, international, retrospective study with the main objective of comparing progression-free survival and overall survival of patients with PTCL who underwent ASCT in complete remission (CR) after first-line chemotherapy with a control group who did not undergo ASCT. From the initial population of 286 registered patients, 174 patients with PTCL other than anaplastic large cell lymphoma, ALK-positive, deemed fit for ASCT at the time of diagnosis, and who were in CR or
uncertain CR after induction therapy (CR1) were included in our analysis. one hundred and three patients underwent ASCT, whereas 71 did not, in most cases (n=53) because the physician decided against it. With a median follow-up of 65.5 months, progression-free survival was significantly better in the transplanted patients than in the non-transplanted group: 63% versus 48% at 5 years (P=0.042). Overall survival was significantly longer for ASCT patients in the subgroup with advanced stage at diagnosis (5-year overall survival: 70% vs. 50%, P=0.028). In the multivariate analysis, first-line ASCT was associated with significantly prolonged progression-free survival (HR=0.57, 95% CI: 0.35-0.93) and overall survival (HR=0.57, 95% CI: 0.33-0.99). In conclusion, our study supports the use of ASCT as a consolidation strategy for patients with PTCL in CR1. These results should be confirmed in a prospective randomized study.
Peripheral T-cell lymphomas (PTCL) are a heterogeneous group of rare lymphoid malignancies. With the exception of some primarily cutaneous and leukemic forms, PTCL are aggressive in nature, with rapid disease progression and poor response to treatment.1 Cyclophosphamide, dox orubicin, vincristine and prednisone (CHOP), or variants of it, has been the most commonly used regimen for treating nodal PTCL.2 However, except for anaplastic lymphoma ki nase (ALK)-positive anaplastic large cell lymphoma (ALCL), prognosis when using this approach remains poor, with 5-year overall survival (OS) rates of around 30% for the remaining PTCL subtypes.3 These poor outcomes have prompted many centers to in clude autologous stem-cell transplantation (ASCT) as part of the first-line treatment of patients with PTCL. This strategy has been evaluated in prospective studies sug gesting more favorable outcomes,4–8 but randomized trials are lacking. In addition, several large retrospective studies have yielded conflicting results,1,9 so the precise role of ASCT for PTCL remains largely unknown in front-line set tings.
Given this background, we designed a large multicenter and international retrospective study with the main ob jective of analyzing the outcomes of patients with PTCL other than ALK-positive ALCL, who underwent ASCT in complete remission (CR) after first-line chemotherapy, compared with a control group who did not undergo ASCT as part of their first-line treatment (Table 1).
This is an international, multicenter, retrospective study designed by the Spanish and Italian lymphoma groups, Grupo Español de Linfomas y Trasplante Autólogo de Médula Ósea (GELTAMO) and Fondazione Italiana Linfomi (FIL), performed in accordance with the Declaration of Helsinki and approved in Spain by the national authorities and the institutional ethics committee of Hospital Univer sitario de Salamanca, and in Italy by the relevant ethics
committees and regulatory authorities. Eligibility criteria were: (i) aged 18 to 65 years at diagnosis; (ii) histological diagnosis of PTCL between 2001 and 2011 from the fol lowing subtypes:10 PTCL, not otherwise specified (NOS); angioimmunoblastic T-cell lymphoma; ALCL, ALK-positive; ALCL, ALK-negative; extranodal NK/T-cell lymphoma, nasal type (non-localized cases); enteropathy-associated T-cell lymphoma; hepatosplenic T-cell lymphoma; primary cutaneous Ɣ δ T-cell lymphoma; and primary cutaneous CD8-positive aggressive epidermotropic cytotoxic T-cell lymphoma; (iii) patients deemed fit for ASCT at the time of diagnosis; and (iv) documented partial response (PR), or unconfirmed CR (CRu), or CR after anthracycline-based first-line treatment. Patients who experienced progressive disease within 3 months of the initiation of the last cycle of first-line chemotherapy were not considered to be re sponders.
Participating centers were required to identify eligible pa tients from local databases. In each center, all records of patients diagnosed in the designated period were re viewed, and all eligible patients were registered. Data were retrospectively collected from the medical records of all centers. The response to first-line treatment re corded in the study was the response indicated in the medical records according to the clinical judgment of the treating physician, provided that it was supported, at least, by the findings of an imaging study.
The primary objective was to assess survival in patients with PTCL different from ALCL, ALK-positive who under went ASCT in CR/CRu after first-line therapy, and compare them with a control non-transplanted group. Secondary objectives were to assess the influence on survival of other prognostic factors, and to assess survival in patients undergoing ASCT in PR after first-line therapy. With re spect to the cohort of patients with ALK-positive ALCL (n=41), only six patients underwent ASCT after first-line treatment, two in PR and four in CR. Given the very low number of transplanted patients in this cohort, no worth while statistical analysis could be carried out. A landmark analysis was performed in which time zero was defined as the date of the response assessment after
first-line treatment. The c2, Fisher exact or Mann-Whitney test was used for statistical comparison of the ASCT and non-ASCT groups. Survival curves were constructed using the Kaplan-Meier method and compared using the logrank test. Progression-free survival (PFS) was calculated from the date of response assessment after first-line treatment until the date of relapse, progression, or death from any cause. OS was calculated from the date of re sponse assessment after first-line treatment to the date of death or of last follow-up. Multivariate Cox analyses were undertaken to investigate factors that could be prognostic for survival. We tested all factors included in Table 2 in the multivariate regression model, eliminating non-significant terms by backward selection. Age was tested as a dichotomous variable (≤60 vs. >60 years, based on the International Prognostic Index [IPI] and Prog nostic Index for T-cell lymphoma [PIT] indices). Analyses were performed using R version 4.0.3 (R Foundation for Statistical Computing, Vienna, Austria; https://www.R-pro ject.org/), and IBM SPSS Statistics version 25 (IBM Cor poration, Armonk, NY, USA).
Figure 1 shows the study flowchart. From the initial popu lation of 286 registered patients, the 174 patients who were in CR/CRu after induction therapy were included in the primary analysis. The other 112 patients were excluded due to absence of CR/CRu after induction (60 patients; PR, n=53; response to first-line not documented, n=7), presence of ALK-positive ALCL histology (41 patients), re lapse within 3 months of the initiation of the last cycle of first-line treatment (7 patients), or for not meeting other inclusion criteria (4 patients). One hundred and three pa tients underwent ASCT, whereas 71 patients did not undergo transplantation, in most cases because the phys ician decided against it up-front (n=53). Other reasons why patients did not receive a transplant were patients’

condition (n=9), patients’ refusal (n=7), pregnancy (n=1) and early relapse (n=1). In these 18 cases, the decision not to proceed to transplant was not taken at the beginning of first-line treatment but well into the treatment or at the end of it. The use of up-front ASCT did not change over time. From the overall series, 58 and 116 patients were diagnosed between 2001-2006 and 2007-2011, re spectively, and 34 (58.6%) and 69 (59.5%) patients from the two groups, respectively, underwent ASCT (P=0.913). The patients’ characteristics are summarized in Table 1. The median age of patients in the non-transplanted group was older than that in the transplanted group (54 vs. 50 years; P=0.037), and a higher proportion of the non-trans planted patients were older than 60 years compared with the transplanted patients. On the other hand, a signifi cantly higher proportion of patients in the transplant group had adverse prognostic factors, such as advanced stage or increased lactate dehydrogenase (LDH) level. Ap proximately 90% of patients in both groups had a nodal PTCL. The proportion of patients with angioimmunoblastic T-cell lymphoma was higher in the transplant group, whereas ALCL was a more frequent diagnosis in the nonASCT group, although these differences were not statis tically significant.
The majority of patients in both groups received CHOP, CHOEP or similar as an induction regimen, although a higher proportion of patients in the transplant group re ceived a CHOP-like scheme that was alternated with other regimens, as shown in Table 1. There were no significant differences in the time between the last cycle of first-line regimen and the evaluation of response between the transplanted and the non-transplanted groups (median of 31.5 days [interquartile range, 22.0-53.0] vs. 33.5 days [in terquartile range, 26.2-49.5, P=0.782]). Radiotherapy was much more frequently administered in the non-transplant group; this was planned at diagnosis in most cases (16 out of 19) because the patients had limited-stage disease.
With a median follow-up of 65.5 months (range, 4.1-176.7
Figure 1. Study flowchart *Relapse within 3 months of the initiation of the last cycle of first-line treatment. **Relapse beyond 3 months of the initiation of the last cycle of first-line treatment. ALCL: anaplastic large cell lymphoma; ASCT: autologous stem-cell transplantation; CR: complete remission; CRu: unconfirmed complete remission.
Table 1.
Characteristic
Missing, N ASCT, N (%)
Non-ASCT, N (%) P
Total number of evaluable patients 103 71
Male sex 0 62 (60.2) 42 (59.2) 0.507
Age, years, median (range)
Older than 60
Peripheral T-cell lymphoma, NOS
Angioimmunoblastic T-cell lymphoma
Anaplastic large cell lymphoma, ALK-negative
Enteropathy-associated T-cell lymphoma
Hepatosplenic T-cell lymphoma
Extranodal NK/T-cell lymphoma, nasal type
Primary cutaneous ɣδ T-cell lymphoma
ECOG performance status 2-4
Ann-Arbor stage III-IV
50 (18-65) 12 (11.7) 54 (19-65) 19 (26.8) 0.037 0.010
41 (39.8) 31 (30.1) 19 (18.4) 5 (4.9) 4 (3.9) 2 (1.9) 1 (1.0)
26 (36.6) 17 (23.9) 19 (26.8) 4 (5.6) 1 (1.4) 4 (5.6) 0
0.336
20 (19.6) 7 (10.1) 0.071
86 (84.3) 36 (50.7) <0.001
Lactate dehydrogenase increased 12 54 (55.1) 22 (34.4) 0.007
Bone marrow infiltration
International Prognostic Index 0-1 2-3 4-5
Prognostic Index for T-cell Lymphoma 0-1 2 3-4
First-line treatment CHOP or CHOP-like CHOEP or CHOEP-like MACOP-B or VACOP-B CHOP-like alternating with others Others
Radiotherapy as part of first-line treatment
33 (32.4) 15 (21.4) 0.080
40 (40.8) 48 (49.0) 10 (10.2)
66 (64.7) 25 (24.5) 11 (10.8)
68 (66.0) 11 (10.7) 4 (3.9) 14a (13.6) 6c (5.8)
39 (58.2) 22 (32.8) 6 (9.0)
53 (79.1) 7 (10.4) 7 (10.4)
58 (81.7) 5 (7.0) 3 (4.2) 4b (5.6) 1d (1.4)
0.081
0.067
0.155
3 (2.9) 19 (26.8) <0.001
aESHAP (n=6), Hyper-CHiDAM (n=2), IFE (n=4), methotrexate-cytarabine (n=3); bESHAP (n=2), Hyper-CHiDAM (n=2); cESHAP (n=1), methotre xate-L-asparaginase (n=1), ICE (n=1), IVE-MTX-dexamethasone (n=1), MACOP-HDMTX (n=1), MACOP-IVE-DHAP (n=1); dCOPP-EBV-CAD (n=1). ASCT: autologous stem-cell transplantation; NOS: not otherwise specified; ALK: anaplastic lymphoma kinase; NK: natural killer; ECOG: Easter Cooperative Oncology Group; CHOP: cyclophosphamide, doxorubicin, vincristine, and prednisolone; CHOEP: cyclophosphamide, doxorubicin, etoposide; vincristine, and prednisolone; MACOP-B: methotrexate, doxorubicin, cyclophosphamide, vincristine, prednisone, and bleomycin; VACOP-B: etoposide, doxorubicin, cyclophosphamide, vincristine, prednisone, and bleomycin; COPP-EBV-CAD: cyclophosphamide, lomustine, vindesine, melphalan, prednisone, epidoxorubicin, vincristine, procarbazine, vinblastine, and bleomycin; DHAP: dexamethasone, cytarabine, cisplatin; ESHAP: etoposide, solumedrol, cytarabine, and cisplatin; HDMTX: high-dose methotrexate; Hyper-CHiDAM: hyperfractionated cyclo phosphamide, high-dose arabinosylcytosine, and high-dose methotrexate; ICE: ifosfamide, carboplatin, etoposide; IFE: ifosfamide, etoposide; IVE-MTX: ifosfamide, epirubicin, etoposide, and methotrexate.
months), PFS was significantly higher in the transplant group (Figure 2), 63% (95% confidence interval [95% CI]: 53.2-72.8) vs. 49% (95% CI: 37.2-60.8) at 5 years, with a median not reached (95% CI: not estimable) in the ASCT group vs. 50.5 months (95% CI: 0-110.9) in the non-ASCT group (P=0.042). The OS was also better in the transplant group, 74% (95% CI: 65.2-82.8) vs. 62% (95% CI: 50.0-73.9) at 5 years, with a median not reached (95% CI: not esti mable) in the ASCT group vs. 100.6 months (95% CI: 66.1135.1) in the non-ASCT group, although the difference was not statistically significant (P=0.124).
In the univariate analysis (Table 2), first-line transplanta tion was the only factor significantly associated with PFS, whereas stage and number of extranodal sites were the only factors associated with OS. Other variables that were not associated (P>0.05) with PFS or OS were sex, age, his tology, performance status according to Easter Cooper ative Oncology Group (ECOG), LDH, bone marrow infiltration, B symptoms, IPI, PIT score, chemotherapy regimen, and radiotherapy (Table 2). We performed additional univariate analyses to assess the impact of ASCT on OS by subgroups, as shown in Online
Supplementary Table S1. We only detected statistically sig nificant differences in the subgroup of patients with ad vanced-stage disease. Although transplantation does not seem to improve survival significantly in patients with lo
calized stage at diagnosis, this was not the case among patients with advanced-stage disease, as shown in Figure
3. In this group of patients, OS was significantly longer for ASCT patients (median not reached [95% CI: not esti
Table 2. Univariate analysis of progression-free survival and overall survival.
Sex
Male Female 104 70 56 59 0.427 69 69 0.510
PTCL, NOS
AITL
ALCL, ALK-negative Others
67 48 38 21
58 49 68 53
0.220 67 65 81 63
0.199
Age ≤60 years >60 years 143 31 59 50 0.303 68 73 0.778
ECOG-PS
0-1 2-4 144 27 58 55 0.435 69 70 0.447
Lactate dehydrogenase
Normal Increased 86 76 59 55 0.478 72 66 0.227
Ann-Arbor stage
I-II III-IV 51 122 62 55 0.191 80 64 0.034
Extranodal sites
0-1 ≥2 142 32 59 49 0.219 72 57 0.028
Bone marrow infiltration
Yes No 48 124 53 59 0.270 62 72 0.190
B symptoms
Yes No 79 91 55 60 0.439 64 73 0.141
International Prognostic Index
0-1 2-3 4-5
Prognostic Index for T-cell Lymphoma
0-1 2 3-4
First-line treatment
79 70 16
119 32 18
59 59 36
60 51 55
0.058 72 70 53
0.334 71 67 65
0.089
0.450
CHOP-like Others 126 48 54 65 0.606 70 67 0.505
Radiotherapy
Yes No 22 152 45 59 0.229 63 70 0.522
First-line ASCT
Yes No 103 71 63 49 0.042 74 62 0.124
PFS: progression-free survival; OS: overall survival; PTCL, NOS: peripheral T-cell lymphoma, not otherwise specified; AITL: angioimmunoblastic T-cell lymphoma; ALCL: anaplastic large cell lymphoma; ALK: anaplastic lymphoma kinase; ECOG-PS: Eastern Cooperative Oncology Group Performance Status; CHOP: cyclophosphamide, doxorubicin, vincristine, and prednisolone; ASCT: autologous stem-cell transplantation.
mable], 5-year OS 70% [95% CI: 59.8–80.2]) than for nonASCT patients (median 71.0 months [95% CI: 40.3-101.7], 5-year OS 50% [95% CI: 32.0–68.0], P=0.028).
To account for disease imbalances between groups, a multivariate analysis using Cox regression was performed. In 156 cases for which complete data were available, firstline ASCT was associated with significantly prolonged PFS (HR=0.57, 95% CI: 0.35-0.93) and OS (HR=0.57, 95% CI: 0.33-0.99) independently of the individual variables of the IPI and PIT scores, B-symptoms, sex, histological subtype, and first-line regimen, as shown in Table 3. Localized stage at diagnosis was also associated with better PFS (HR=0.54, 95% CI: 0.31-0.96) and OS (HR=0.38, 95% CI: 0.19-0.78). We also tested IPI and PIT scores (excluding all individual variables other than disease stage) in the multi variate analysis. First-line ASCT and localized stage at di
agnosis maintained an independent influence on both PFS (HR=0.55 [95% CI: 0.34-0.90] and 0.52 [95% CI: 0.29-0.93] for ASCT and stage, respectively) and OS (HR=0.53 [95% CI: 0.31-0.91] and 0.40 [95% CI=0.20-0.80] for ASCT and stage, respectively).
In addition, we carried out a multivariate sensitivity analy sis including only patients with nodal PTCL (angioimmu noblastic T-cell lymphoma, ALCL, ALK-negative and PTCL, NOS). First-line ASCT and localized stage at diagnosis maintained their independent influence on both PFS (HR=0.57 [95% CI: 0.34-0.96] and 0.45 [95% CI: 0.23-0.87] for ASCT and stage, respectively) and OS (HR=0.52 [95% CI: 0.29-0.93] and 0.31 [95% CI: 0.13-0.70] for ASCT and stage, respectively).
Separate analysis of patients in partial response after first-line
As a secondary objective, we assessed survival in patients
A B
Figure 2. Kaplan–Meier estimation of survival in the transplanted and non-transplanted cohorts. (A) Progression-free survival; (B) overall survival. ASCT: autologous stem-cell transplantation
Figure 3. Kaplan-Meier estimation of overall survival by stage at diagnosis in the transplanted and non-transplanted cohorts ASCT: autologous stem-cell transplantation.


undergoing ASCT in PR after first-line chemotherapy. Of 53 patients with a documented PR after first-line treat ment, 15 were excluded because they had disease pro gression within 3 months of the initiation of the last cycle of first-line treatment. Fifteen patients underwent ASCT in PR after first-line treatment, whereas 23 patients did not undergo transplantation. Of these 23 patients, 17 re ceived salvage chemotherapy while in PR and five received it after further progression. Eleven patients underwent transplantation (8 autologous and 3 allogeneic trans plants) as part of the salvage therapy.
There were no significant differences between ASCT and non-ASCT groups with respect to patients’ characteristics and first-line treatment, as shown in Online Supplemen tary Table S2. With a median follow-up of 84.1 months (range, 26.3-138.7 months), there was a trend towards better PFS in the transplant group compared with the non-ASCT group (Online Supplementary Figure S1): 46% (95% CI: 18.5-74.1) vs . 27% (95% CI: 7.7-45.3) at 5 years (P=0.081), respectively, with no significant differences in
OS (53% [95% CI: 24.4-82.4] vs. 52% [95% CI: 31.8-72.6] at 5 years [P=0.962] in the ASCT and non-ASCT groups, re spectively).
In the present study, we collected clinical data from pa tients with newly diagnosed PTCL from 44 institutions in Spain and Italy. The cohorts included in this analysis either underwent upfront ASCT or were observed after achieving first CR/CRu (CR1). Although the clinical characteristics of the transplanted and non-transplanted patients differed, multivariate analysis identified ASCT as one of the main variables influencing PFS (HR=0.57, 95% CI: 0.35-0.93) and OS (HR=0.57, 95% CI: 0.33-0.99), suggesting a benefit of upfront ASCT in patients with PTCL in CR1.
The current recommendation to consider ASCT in first re mission for most PTCL subtypes is largely based on the results from several phase II, single-arm studies.4-8 The
Table 3. Multivariate Cox regression model (backward selection) for survival.
Characteristic (N=156)
Included in the model
First-line ASCT
PFS OS HR (95% CI) P HR (95% CI) P
Yes vs. no 0.59 (0.36-0.96) 0.035 0.57 (0.33-0.99) 0.048
Stage
I-II vs. III-IV 0.53 (0.29-0.96) 0.035 0.40 (0.19-0.81) 0.012 Removed from the model Sex
Male vs. female 0.407 0.706
Histology
PTCL, NOS vs. AITL vs. ALCL, ALK-negative vs. others
B symptoms
0.366 0.402
Yes vs. no 0.986 0.528
Bone marrow infiltration
No vs. yes 0.608 0.729
Age ≤60 vs. >60 years 0.997 0.281
ECOG-PS
0-1 vs. 2-4 0.617 0.779
Lactate dehydrogenase
Normal vs. high 0.928 0.882
Extranodal sites
0-1 vs ≥2 0.514 0.199
First-line chemotherapy
CHOP-like vs. others 0.668 0.595
Radiotherapy
Yes vs. no 0.188 0.135
PFS: progression-free survival; OS: overall survival; HR: hazard ratio; 95% CI: 95% confidence interval; ASCT: autologous stem-cell transplan tation; PTCL, NOS: peripheral T-cell lymphoma, not otherwise specified; AITL: angioimmunoblastic T-cell lymphoma; ALCL: anaplastic large cell lymphoma; ALK: anaplastic lymphoma kinase; ECOG-PS, Eastern Cooperative Oncology Group Performance Status; CHOP, cyclophos phamide, doxorubicin, vincristine, and prednisolone.
largest prospective trial evaluating ASCT in first-line was carried out by the Nordic Lymphoma Group (NLG T-01 study) in which patients with de novo PTCL were treated with CHOEP-14 x 6 followed by BEAM/BEAC and ASCT, leading to long-term PFS in 44% of patients.8 In the Italian experience, patients who attained CR before ASCT had significantly better outcomes than patients who did not achieve CR, in terms of OS (48% vs. 22% at 10 years, P<0.0001) and event-free survival (47% vs. 11%, P<0.0001). However, these studies are very difficult to interpret be cause they did not include a control group of patients who did not undergo transplantation. In the absence of ran domized clinical trials, no definitive consensus has there fore been reached about the role of ASCT as upfront consolidation for PTCL patients.
Retrospective comparisons of ASCT versus observation in first remission have produced conflicting results.1,9,11-15 Fos sard et al 9 analyzed a cohort of 269 patients with nodal PTCL other than ALK-positive ALCL in CR (n=217) or PR (n=52) after induction. The patients were divided into two groups, ASCT and non-ASCT, based on the physicians’ decision before starting induction treatment (intentionto-treat), according to the information collected in the medical records. Neither the Cox multivariate model nor the propensity score analysis revealed a survival advan tage for ASCT as a consolidation procedure for patients in response after induction. However, in a study from the Swedish Lymphoma Registry,1 upfront ASCT was associ ated with a superior OS (HR=0.58, P=0.004) and PFS (HR=0.56, P=0.002) compared with the outcomes of pa tients treated without ASCT in an intention-to-treat analysis of 252 patients with nodal PTCL or enteropathyassociated T-cell lymphoma (excluding ALK-positive ALCL), although no adjustment for response status after induction was made.
The design of our study differs from that of the two pre viously mentioned, since we selected the patients in CR1, who are likely to benefit the most from ASCT, rather than using a design that enabled an analysis based on the in tention to treat. Since transplantation is usually per formed several weeks after remission is achieved, rather than immediately after, patients who experienced pro gressive disease within 3 months of the initiation of the last cycle of first-line chemotherapy were not considered to be responders, and were excluded from the analysis to limit a potential bias. Other retrospective studies have also analyzed the role of ASCT in patients who achieve CR after induction treatment. Abramson et al. 13 showed a benefit favoring ASCT in first remission, but this dis appeared in multivariate analysis when adjusting for CR to initial chemotherapy as well as stage, LDH, and hypo albuminemia, although these results were limited by the small number of patients who proceeded to transplanta tion (n=33). In a single-center study11, upfront ASCT did
not improve PFS when compared with active observation in PTCL patients who achieved CR1 after receiving CHOPlike induction chemotherapy, but these results were also limited by the small sample size (n=20 transplanted pa tients). In contrast, in another observational study (COM PLETE)14 that directly compared the outcomes of ASCT and non-ASCT in patients with nodal PTCL in CR1, ASCT emerged as one of the variables most strongly associated with favorable OS (HR=0.37; 95% CI: 0.15-0.89), whereas an advanced stage was associated with poor OS (HR=2.65; 95% CI: 1.08-6.55), in line with our results. However, this study was limited not only by the small number of pa tients who proceeded to transplantation (n=36), but also by the relatively short duration of follow-up (median of ~34 months).
Similar to the COMPLETE study, the present study directly compared the results of ASCT and non-ASCT in patients in CR1, but in a much larger series (103 ASCT and 71 nonASCT cases) and with longer follow-up (>60 months). In our series, clinical characteristics differed between the two groups, as a significantly higher proportion of patients in the transplant group had adverse prognostic factors, such as advanced stage or increased LDH level. This indi cates that baseline risk factors, especially stage, could play a significant role in determining whether to proceed with ASCT in CR1. Nevertheless, it is remarkable that the ASCT group was associated with superior PFS in the over all series, even though a significantly higher proportion of patients in the ASCT group had more adverse prognostic factors than the non-ASCT group. Consistent with what Park et al. found in the COMPLETE study,14 in our study we observed a significant influence of upfront ASCT on OS, especially in patients with advanced-stage disease, whereas the benefit was less evident in patients with li mited-stage disease. These results should be interpreted with caution because of the small sample sizes available for these subanalyses.
As a secondary objective, we assessed the survival of pa tients undergoing ASCT in PR after first-line therapy. Our results indicate that a significant proportion of patients in PR could benefit from transplantation, although, once again, these results must be interpreted with caution due to the very small sample size investigated in this sub analysis. Recent studies16,17 have shown that patients with relapsed or refractory diffuse large B-cell lymphoma in PR after salvage therapy could still benefit from ASCT, but, to our knowledge, this subject has not been specifically in vestigated in patients with PTCL; it warrants being ad dressed in future studies.
In all the studies that we have discussed, including our own, the response to induction therapy is assessed mainly by computed tomography.18 The impact of upfront ASCT in patients with PTCL in complete metabolic response has not been rigorously investigated. In a retrospective study,
the prognostic significance of 18F-fluorodeoxyglucose positron emission tomography–computed tomography (PET/CT) responses to induction chemotherapy was studied in 96 patients with PTCL from two centers. In the 59 patients with final response Deauville scores of 1–2, there was no statistically significant difference in the PFS and OS between the transplanted and non-transplanted patients. In addition, of the 37 patients with a final PET/CT response score of 3–4, the PFS rate was equally poor in transplanted and non-transplanted patients. The study was limited by the small number of patients who pro ceeded to transplantation in the overall series (n=37) and by the interpretation of the Deauville scale, since only pa tients with a score of 1–2 were considered to have shown a complete metabolic response, whereas the international consensus regards patients with scores of 1–3 as showing a complete response.19,20 Therefore, further studies are needed to define the role of PET/CT in patients with PTCL treated with upfront ASCT.
The observational nature of this study means that it is prone to unintentional bias and the effects of confounding variables. There are three major limitations to the study.
First, no central histological diagnostic review was under taken. Second, in the non-ASCT group, the decision not to proceed to transplantation was taken well into the treatment of some patients, based mainly on the patients’ general condition, which could have been associated with subsequent worse survival. Finally, the response to firstline treatment was determined by the treating physician supported by an imaging investigation; however, response criteria could have changed over time and imaging inves tigations were not specifically reviewed for this study. Overall, and bearing in mind the study’s limitations, the data presented here support the use of ASCT as a con solidation strategy for patients with PTCL other than ALKpositive ALCL in CR1. Our analyses suggest that some subgroups of patients, especially those with advancedstage disease, might benefit more than others. Given the limitations of any retrospective study and the lack of con sensus about the procedure, a large collaborative ran domized trial should be conducted to enable definitive conclusions to be drawn.
AMG-S reports consulting fees, honoraria and/or non-fi nancial support from Roche, Celgene/BMS , Morphosys, Kyowa Kirin, Clinigen, Eusa Pharma, Novartis, Gilead, Ser vier, Incyte, Janssen and Takeda. SN reports honoraria from Takeda. CP reports consulting fees, honoraria and/or nonfinancial support from Roche, Janssen, Celgene/BMS, In cyte and Kyowa Kirin. J-MS reports consulting fees and/or honoraria from Roche, Janssen, Gilead-Kite, BMS-Celgene, Novartis, Lilly, Incyte, Beigene and Takeda. RA reports con sulting fees, honoraria and/or non-financial support from
Takeda, Eusa Pharma and Novartis. SB reports honoraria and/or non-financial support from Gilead, Janssen, Novar tis and Roche. The remaining authors have no relevant conflicts of interest to disclose.
AMGS, DC, MB and MF were responsible for the design and conduct of the study; AMGS, MLP, MC, and MB analyzed and interpreted the data; AMGS drafted the report, which all co-authors critically revised for significant scientific content; MLP, GG, SN, CP, LP, AG, ID, MBO, JMS, MJR, JMM, EC, AIJU, IJ, LO, EGT, CM, AD, RA, NH, MJP, JLJ, MS, AR, SGV, and SB contributed research data to the study; all coauthors contributed to data analysis and interpretation, and approved the submitted and final versions.
AWe are grateful to Ángel Cedillo and Ana Méndez, from the Grupo Español de Linfomas y Trasplante Autólogo de Médula Ósea (GELTAMO), and Fondazione Italiana Linfomi (FIL), for their research support. Our thanks to Phil Mason for correcting the grammar and spelling errors of this ar ticle.
Any requests for study data and protocol will be reviewed by the study management group and GELTAMO/FIL. Only requests that have a methodologically sound basis and whose proposed use of the data has been approved by the applicable ethics committees and regulatory authorities will be considered.
In addition to the authors, the following investigators col laborated in the present study: M. Manni (CHIMOMO De partment, University of Modena and Reggio Emilia, Modena, Italy), F. Merli (Hematology Unit, Azienda Unità Sanitaria Locale-IRCCS, Reggio Emilia, Italy), I. Ceberio (Hematology Department, Hospital Universitario Donostia, San Sebas tián, Spain), M. Pedreño (Department of Clinical Hematol ogy, Hospital Dr. Peset, Valencia, Spain), M.J. Rodríguez-Salazar (Hematology Department, Hospital Uni versitario de Canarias, Santa Cruz de Tenerife, Spain), M. Casanova (Hematology Department, Hospital Costa del Sol, Marbella, Spain), E. de Cabo (Department of Hematol ogy, Hospital de El Bierzo, León, Spain), A.J.M. Ferreri (Lym phoma Unit, Department of Onco-Haematology, IRCCS San Raffaele Scientific Institute, Milano, Italy), E. GonzálezBarca (Clinical Hematology Department, ICO-Hospital Duran i Reynals, IDIBELL, Barcelona, Spain), A.M. D’Arco (Onco-hematology Unit, Hospital A. Tortora, Pagani, Sa lerno, Italy), A. Muntañola (Hematology Department, Hos pital Mútua de Terrassa, Terrassa, Spain), P. Sánchez-Godoy (Hematology Department, University Hospital Severo
Ochoa, Madrid, Spain.), J. Pérez de Oteyza (Hospital Uni versitario Madrid Sanchinarro, Madrid, Spain), M. Rodrí guez-Calvillo (Department of Hematology, Hospital Complex Navarre, Pamplona, Navarra, Spain), M. Roig (De partment of Hematology, Hospital General Universitario de Valencia, Valencia, Spain), C. Stelitano (Department of Hematology, Grande Ospedale Metropolitano Bianchi Mel acrino Morelli, Reggio Calabria, Italy), D. Mannina (Hema tology Unit, Papardo Hospital, Messina, Italy), M.E. Infante (Hematology Department, Hospital Infanta Leonor, Madrid, Spain), I. Heras (Hematology Department, Hospital Morales Meseguer, Murcia, Spain), J.L. Bello (Hematology Depart ment, Hospital de Nuestra Señora de la Esperanza, San
1. Ellin F, Landstrom J, Jerkeman M, Relander T. Real-world data on prognostic factors and treatment in peripheral T-cell lymphomas: a study from the Swedish Lymphoma Registry. Blood. 2014;124(10):1570-1577.
2. d’Amore F, Gaulard P, Trumper L, et al. Peripheral T-cell lymphomas: ESMO Clinical Practice Guidelines for diagnosis, treatment and follow-up. Ann Oncol. 2015;26 (Suppl 5):v108-115.
3. Abouyabis AN, Shenoy PJ, Sinha R, Flowers CR, Lechowicz MJ. A systematic review and meta-analysis of front-line anthracycline-based chemotherapy regimens for peripheral Tcell lymphoma. ISRN Hematol. 2011;2011:623924.
4. Corradini P, Tarella C, Zallio F, et al. Long-term follow-up of patients with peripheral T-cell lymphomas treated up-front with high-dose chemotherapy followed by autologous stem cell transplantation. Leukemia. 2006;20(9):1533-1538.
5. Rodriguez J, Conde E, Gutierrez A, et al. Frontline autologous stem cell transplantation in high-risk peripheral T-cell lymphoma: a prospective study from the Gel-Tamo Study Group. Eur J Haematol. 2007;79(1):32-38.
6. Mercadal S, Briones J, Xicoy B, et al. Intensive chemotherapy (high-dose CHOP/ESHAP regimen) followed by autologous stem-cell transplantation in previously untreated patients with peripheral T-cell lymphoma. Ann Oncol. 2008;19(5):958-963.
7. Reimer P, Rudiger T, Geissinger E, et al. Autologous stem-cell transplantation as first-line therapy in peripheral T-cell lymphomas: results of a prospective multicenter study. J Clin Oncol. 2009;27(1):106-113.
8. d’Amore F, Relander T, Lauritzsen GF, et al. Up-front autologous stem-cell transplantation in peripheral T-cell lymphoma: NLG-T01. J Clin Oncol. 2012;30(25):3093-3099.
9. Fossard G, Broussais F, Coelho I, et al. Role of up-front autologous stem-cell transplantation in peripheral T-cell lymphoma for patients in response after induction: an analysis of patients from LYSA centers. Ann Oncol. 2018;29(3):715-723.
10. Swerdlow SH Harris NL, Jaffe ES, et al. WHO Classification of Tumours of Haematopoietic and Lymphoid Tissues. Lyon: IARC. 2008.
11. Yam C, Landsburg DJ, Nead KT, et al. Autologous stem cell
tiago de Compostela, Spain), A. Suárez-Cabrera (Hematol ogy Department, Hospital Universitario de Gran Canaria Doctor Negrín, Las Palmas de Gran Canaria, Spain), M.A. Canales (Hematology Department, Hospital Universitario La Paz, Madrid, Spain), C. Cuéllar (Hematology Department, Hospital de la Santa Creu i Sant Pau, Barcelona, Spain), M.J. Vidal (Department of Hematology, Complejo Hospita lario de León, León, Spain), C. Grande (Hematology Depart ment, Hospital Universitario 12 de Octubre, Madrid, Spain), J. Sánchez (Hematology Department, Hospital Universitario Reina Sofía, Cordoba, Spain), E. Conde (Hematology De partment, Hospital Universitario Marqués de Valdecilla, Santander, Spain).
transplantation in first complete remission may not extend progression-free survival in patients with peripheral T cell lymphomas. Am J Hematol. 2016;91(7):672-676.
12. Cederleuf H, Hjort Jakobsen L, Ellin F, et al. Outcome of peripheral T-cell lymphoma in first complete remission: a Danish-Swedish population-based study. Leuk Lymphoma. 2017;58(12):2815-2823.
13. Abramson JS, Feldman T, Kroll-Desrosiers AR, et al. Peripheral T-cell lymphomas in a large US multicenter cohort: prognostication in the modern era including impact of frontline therapy. Ann Oncol. 2014;25(11):2211-2217.
14. Park SI, Horwitz SM, Foss FM, et al. The role of autologous stem cell transplantation in patients with nodal peripheral T-cell lymphomas in first complete remission: Report from COMPLETE, a prospective, multicenter cohort study. Cancer. 2019;125(9):1507-1517.
15. Ahn S-Y, Jung S-Y, Jung S-H, et al. Prognostic significance of FDG-PET/CT in determining upfront autologous stem cell transplantation for the treatment of peripheral T cell lymphomas. Ann Hematol. 2020;99(1):83-91.
16. Shah NN, Ahn KW, Litovich C, et al. Is autologous transplant in relapsed DLBCL patients achieving only a PET+ PR appropriate in the CAR T-cell era? Blood. 2021;137(10):1416-1423.
17. Shadman M, Pasquini MC, Ahn KW, et al. Autologous transplant vs chimeric antigen receptor T-cell therapy for relapsed DLBCL in partial remission. Blood. 2022;139(9):1330-1339.
18. Cheson BD, Horning SJ, Coiffier B, et al. Report of an international workshop to standardize response criteria for nonHodgkin’s lymphomas. J Clin Oncol. 1999;17(4):1244.
19. Barrington SF, Mikhaeel NG, Kostakoglu L, et al. Role of imaging in the staging and response assessment of lymphoma: consensus of the International Conference on Malignant Lymphomas Imaging Working Group. J Clin Oncol. 2014;32(27):3048-3058.
20. Cheson BD, Fisher RI, Barrington SF, et al. Recommendations for initial evaluation, staging, and response assessment of Hodgkin and non-Hodgkin lymphoma: the Lugano classification. J Clin Oncol. 2014;32(27):3059-3068.
Alberto J. Arribas,1,2* Sara Napoli,1* Luciano Cascione,1,2 Giulio Sartori,1 Laura Barnabei,1 Eugenio Gaudio,1 Chiara Tarantelli,1 Afua Adjeiwaa Mensah,1 Filippo Spriano,1 Antonella Zucchetto,3 Francesca M. Rossi,3 Andrea Rinaldi,1 Manuel Castro de Moura,4 Sandra Jovic,5 Roberta Bordone-Pittau,6 Alessandra Di Veroli,7 Anastasios Stathis,6,8 Gabriele Cruciani,7 Georg Stussi,6 Valter Gattei,3 Jennifer R. Brown,9 Manel Esteller,4,10-12 Emanuele Zucca,1,6 Davide Rossi1,6 and Francesco Bertoni1,6
1Institute of Oncology Research, Faculty of Biomedical Sciences, Università della Svizzera Italiana, Bellinzona, Switzerland; 2SIB Swiss Institute of Bioinformatics, Lausanne, Switzerland; 3Centro di Riferimento Oncologico di Aviano – CRO, Aviano, Italy; 4Josep Carreras Leukemia Research Institute (IJC), Badalona, Spain; 5Institute for Research in Biomedicine, Università della Svizzera italiana, Bellinzona, Switzerland; 6Oncology Institute of Southern Switzerland, Bellinzona, Switzerland; 7Department of Chemistry, Biology and Biotechnology, University of Perugia, Perugia, Italy; 8Faculty of Biomedical Sciences, Università della Svizzera Italiana, Bellinzona, Switzerland; 9Chronic Lymphocytic Leukemia Center, Division of Medical Oncology, Dana-Farber Cancer Institute and Harvard Medical School, Boston, MA, USA; 10Centro de Investigacion Biomedica en Red Cancer (CIBERONC), Madrid, Spain; 11Institucio Catalana de Recerca i Estudis Avançats (ICREA), Barcelona, Spain and 12Physiological Sciences Department, School of Medicine and Health Sciences, University of Barcelona (UB), Barcelona, Spain.
*AJA and SN contributed equally as co-first authors.
Correspondence: A. Arribas
alberto.arribas@ior.usi.ch
F. Bertoni
francesco.bertoni@ior.usi.ch
September 4, 2021.
: April 12, 2022.
April 28, 2022.
PI3Kδ inhibitors are active in patients with lymphoid neoplasms and a first series of them have been approved for the treatment of multiple types of B-cell lymphoid tumors, including marginal zone lymphoma (MZL). The identification of the mechanisms underlying either primary or secondary resistance is fundamental to optimize the use of novel drugs. Here we present a model of secondary resistance to PI3Kδ inhibitors obtained by prolonged exposure of a splenic MZL cell line to idelalisib. The VL51 cell line was kept under continuous exposure to idelalisib. The study included detailed character ization of the model, pharmacological screens, silencing experiments, and validation experiments on multiple cell lines and on clinical specimens. VL51 developed resistance to idelalisib, copanlisib, duvelisib, and umbralisib. An integrative analysis of transcriptome and methylation data highlighted an enrichment of upregulated transcripts and low-methylated promoters in resistant cells, including IL-6/STAT3- and PDGFRA-related genes and surface CD19 expression, alongside the repression of the let-7 family of miRNA, and miR-125, miR-130, miR-193 and miR-20. The IL-6R blocking antibody to cilizumab, the STAT3 inhibitor stattic, the LIN28 inhibitor LIN1632, the PDGFR inhibitor masitinib and the anti-CD19 antibody drug conjugate loncastuximab tesirine were active compounds in the resistant cells as single agents and/or in combination with PI3Kδ inhibition. Findings were validated on additional in vitro lymphoma models and on clinical specimens. A novel model of resistance obtained from splenic MZL allowed the identification of therapeutic approaches able to improve the antitumor activity of PI3Kδ inhibitors in B-cell lymphoid tumors.
The delta isoform of phosphoinositide kinase (PI3K δ ) shows prominent expression across hematopoietic tis sues and has a central role in B-cell receptor (BCR) sig
naling.1,2 Indeed, its inhibition is being extensively explored as a therapeutic approach for patients with lymphoid neo plasms.1-3 Idelalisib was the first-in-class specific PI3Kδ inhibitor to show clinical activity as a single agent in pa tients with follicular lymphoma, marginal zone lymphoma
(MZL), chronic lymphocytic leukemia and mantle cell lymphoma, and in combination with rituximab in pa tients with chronic lymphocytic leukemia,1,2 and it re ceived the approval from the U.S. Food and Drug Administration (FDA) for the treatment of patients with relapsed follicular lymphoma or small lymphocytic lym phoma after at least two prior systemic therapies, and, in combination with rituximab, for patients with re lapsed chronic lymphocytic leukemia. 3 Idelalisib has been successfully followed by a series of second-gen eration PI3K δ inhibitors, such as parsaclisib and zandeli sib, and by compounds that inhibit additional kinases, such as copanlisib (PI3K α /PI3K δ ), duvelisib (PI3K δ /PI3K g ) and umbralisib (PI3K δ and casein kinase-1 ε ), achieving clinical responses in lymphomas, including follicular lymphoma, mantle cell lymphoma, MZL and chronic lymphocytic leukemia.1-3 In particular, data have so far led to the FDA approval of copanlisib for patients with relapsed/refractory follicular lymphoma, duvelisib for patients with relapsed/refractory chronic lymphocytic leukemia, small lymphocytic lymphoma or follicular lym phoma, and umbralisib for the treatment of patients with relapsed/refractory MZL or follicular lymphoma. 3 The identification of the mechanisms underlying either primary or secondary resistance to PI3K δ inhibitors is fundamental to optimize the use of these drugs, and a number of studies have described mechanisms of resis tance to this class of agents in lymphoid neoplasms, driven by activation of alternative signaling cascades.4-11 Here we present a model of secondary resistance to PI3K δ inhibitors, including duvelisib, copanlisib and um bralisib, obtained by prolonged exposure of a splenic MZL cell line to idelalisib.
VL51 cells were cultured according to the recommended conditions, as previously described.12 To develop resis tance cell lines were exposed to a 90% inhibitory con centration (IC 90) of idelalisib (Selleckchem, Houston, TX, USA) for several months until they acquired specific drug resistance (resistant cells). In parallel, cells were cultured under similar conditions in the absence of drug (parental cells). Proliferation of stable resistance was tested by the 3-(4,5-dimethylthiazol-2-yl)-2,5-diphenyl tetrazolium bromide (MTT) assay after 2 weeks of drugfree culture. The multidrug resistance phenotype was assessed by real-time polymerase chain reaction for MDR1 and MDR2/3 genes using published primers.13 We developed biological replicates by splitting the resistant clones 1 month after the development of resistance, keeping them separate for 6 months before performing
further experiments. Cell line identity was periodically authenticated by short tandem repeat DNA profiling, as previously described.14 Cells were periodically tested to confirm Mycoplasma negativity using the MycoAlert My coplasma Detection Kit (Lonza, Visp, Switzerland).
Response to single drugs or drug combinations was as sessed after 72 h of exposure to increasing doses of the drug followed by an MTT assay. Copanlisib, duvelisib, umbralisib, everolimus, bimiralisib, vincristine, 5-azaciti dine, masitinib, stattic and tocilizumab were purchased from Selleckchem, Lin28-1632 (LIN1632) from R&D Sys tems (Minneapolis, MN, USA), and human recombinant interleukin 6 (IL-6; CYT-213) from Prospec (Rehovot, Is rael). Loncastuximab tesirine was kindly provided by ADC Therapeutics (Epalinges, Switzerland). Details are provided in the Online Supplementary Methods
Details of the genomics studies and data mining are pro vided in the Online Supplementary Methods.
For enzyme-linked immunosorbent assays (ELISA) the conditioned medium was cultured for 72 h and col lected. The medium was then filtered twice (22 µm) and centrifuged at 4000 rpm for 30 minutes in Amicon Ultra4 tubes (Ultracel 3k, Merk Millipore) to remove cells and particles, and analyzed via cytokine array or ELISA. Cyto kine arrays (Human Cytokine Array Panel A, R&D Sys tems) were performed according to the manufacturer’s protocols. ELISA on frozen human serum samples were performed using a Luminex Assay (R&D Systems) ac cording to the manufacturer’s protocols. The serum samples were collected from patients treated with ide lalisib and enrolled on tissue banking protocols at Dana Farber Cancer Institute; all patients signed written in formed consent prior to a sample being drawn, and the protocols were approved by the Dana-Farber Harvard Cancer Center Institutional Review Board.
Flow cytometry was performed to determine the surface expression of platelet-derived growth factor receptor A (PDGFRA), IL-6 receptor (IL-6R), IL-6 cytokine family sig nal transducer (IL-6ST), CXCR4 and CD19 ( Online Sup plementary Table S1 ), levels of p-AKT, p-BTK, p-PLCG2, p-mTOR and p-ERK ( Online Supplementary Table S2 ); and cell cycle phases. Immunoblotting was performed to determine the expression of AKT/p-AKT, ERK/p-ERK JAK/p-JAK, STAT/p-STAT and GAPDH (Online Supplemen tary Table S3 ). Details are provided in the Online Sup plementary Methods
Pharmacological screening was performed by exposing idelalisib-resistant cells in parallel with parental clones to 348 compounds, as single agents (1 µM) or in combina tion with idelalisib (1 µM), from a custom library containing agents belonging to the following classes: “Kinase In hibitory”, “Epigenetic Compound”, “PI3K/Akt Inhibitor”, “Apoptosis”, “Anti-cancer Compound”, and “MAPK In hibitor” (Selleckchem). Cell viability was measured by MTT assay after 72 h of exposure to the agents.
Details of the gene silencing experiments are provided in
A splenic marginal zone lymphoma model of secondary resistance to PI3Kδ inhibitors
To create a novel model of resistance to the PI3K δ in hibitors, we selected the splenic MZL-derived VL51 cell line, with transcriptome, somatic mutational status, DNA profile and methylome comparable to that of primary splenic MZL samples.15,16 VL51 harbors a series of lesions that are typical of splenic MZL, including truncating mu
A B C D E FFigure 1. Profiles of drug sensitivity differ between parental and resistant cell lines. (A-G) Acquired resistance was tested by an MTT assay (72 h) in parental (black) and resistant (red) cells of the VL51 cell line. Drug sensitivity was evaluated in resistant and parental cells for the PI3K inhibitors idelalisib (A), copanlisib (B), duvelisib (C), umbralisib (D), the dual PI3K-mTOR inhibitor bimi ralisib (E), the mTOR inhibitor everolimus (F) and the chemotherapy agent and the multidrug resistance substrate vincristine (G). Error bars correspond to standard deviation of the mean. Data are derived from at least three independent experiments. P values from a Z-test, statistically significant for values <0.05.

tations of NOTCH2 and BIRC3, which activate downstream NOTCH and non-canonical NF-κB, respectively, and a nu clear localization signal mutation of KLF2. 15,17,18
After 6 months of continuous exposure to the FDA-ap proved PI3Kδ inhibitor idelalisib, VL51 developed stable re sistance with an IC50 25-fold higher than that of its parental counterpart (Figure 1A). The resistance was con firmed to be stable by repeating the IC50 measurements after 2 weeks in medium containing no drug, and multi drug resistance was ruled out by demonstrating no changes in the expression levels of MDR1/2 genes by semi quantitative real-time polymerase chain reaction (Online Supplementary Figure S1).
The idelalisib-resistant cell line also showed resistance to other FDA-approved PI3K inhibitors, including the PI3Kα/PI3Kδ inhibitor copanlisib, the PI3Kδ/PI3Kg inhibitor duvelisib, and the PI3Kδ/CK1ε inhibitor umbralisib (Figure 1B-D). Conversely, they maintained sensitivity to the mTOR inhibitor everolimus, to the dual PI3K/mTOR inhibitor bimi ralisib (Figure 1E, F) and to the chemotherapy agent and MDR substrate vincristine (Figure 1G).
Resistant cells clearly differed from their parental counterparts based on RNA-sequencing (total RNA,

miRNA) and methylation, as shown by unsupervised ana lyses and at the pharmacological profiling (Figure 1, Online Supplementary Figures S2 and S11), but no exonic nonsyn onymous variants appeared to be acquired in the resistant cells. Online Supplementary Table S4 shows the single and copy number variants identified by whole-exome se quencing in resistant cells compared to parental cells.
To investigate the mechanism of resistance, we integrated the gene expression (gene expression profiling, RNA-se quencing), miRNA (RNA-sequencing) and methylation (800k Illumina array) profiles obtained in resistant and parental cells (Online Supplementary Table S4). When compared to its parental counterpart, the resistant cell line was enriched in BCR/TLR/NF-κB (TLR4, CD19, SYK), IL6/STAT3 (IL-6, CD44), chemokines (CXCL10, CXCR4, CXCR3), PDGFR (PDGFRA, PRKCE), IGF1R and RAS-RAF signaling pathways, epigenetic signatures (PRC2-complex targets and methylated genes in cancer) and genes upregulated in MZL. On the other hand, it showed decreased ex pression of transcripts involved in amino acid deprivation, antigen processing, drug metabolism, translation, proteo
es activation of the IL-6-PDGFRA axis. Heatmap of RNA (gene expression profiling), methylation and miRNA profiles of resistant cells compared to parental cells. Heatmap values rep resent the differences between resistant and parental cells: fold change (log2 for RNA and miRNA) or D β-value (methylation), red for enrichment in resistant cells and blue for parental cells. Columns correspond to gene expression (gene expression profiling, RNA-sequencing) and methylation (MethylationEPIC BeadChip, Illumina) profiles of the top ten upregulated and top ten down regulated genes; rows represent the differently expressed miRNA (RNA-sequencing) with values in the columns corresponding to the targeted gene. *Statistically significant differences (moderated t-test). GEP: gene expression profile; FC: fold change.
Figure 2. Multi-omics signature of the VL51, resistant cell line identi
some and hypoxia (Online Supplementary Figures S2B and S3, Online Supplementary Table S5). The integrative analy sis of transcriptome and methylation data highlighted an enrichment of upregulated transcripts among the lowmethylated promoters in resistant cells, including IL-6 and RAS-related genes (Figure 2, Online Supplementary Figure S3). Analysis of the miRNA profiles identified re pression of members of the let-7 family (let-7e, let-7g, let7d, let-7f, let-7a), along with other miRNA including miR-125, miR-130, miR-193 and miR-20. Conversely, only one member of the let-7 family (let-7c) was among the upregulated miRNA in resistant cells, together with miR3196, miR-4492, miR-4516 and others (Online Supplemen tary Table S5). Among the repressed miRNA in resistant cells, miRNA potentially targeting the IL-6-PDGFRA axis
were enriched. Integration of methylation and miRNA data identified fully methylated and repressed miRNA known to target upregulated genes: members of the let-7 family of miRNA (let-7d, let-7e, let-7g) that directly target IL-6, 19 miR-125a that regulates IL-6, IL-6R and STAT3, 20 and the negative regulators of PDGFR signaling, miR-130a,21 miR193b, miR-20b and miR-1722,23 (Figure 2, Online Supplemen tary Table S5). These data indicated that an epigenetic reprogramming could sustain the observed resistance. Having observed an upregulation of the secreted factor IL-6 at the RNA level in resistant cells, we evaluated whether the transfer of conditioned media to parental cells was able to transfer the resistance to PI3K inhibitors. The media from resistant cells (taken at 48 h), but not media taken from other cells, including parental cells,

C
Figure 3. Proteome profiles of resistant cells differ from those of parental cells. (A) Cell viability, determined by the MTT assay, of parental cells (black line) exposed to idelalisib in the presence or not of conditioned medium from VL51 idelalisib-resistant cells (red line), cultured for 48 h, and parental + RES-cond RPMI (dotted black line). Data were derived from the average of three independent experiments. (B) Expression of surface PDGFRA (top), CXCR4 (center) and CD19 (bottom) by fluorescence activated cell sorting in parental (gray) and resistant (red) cell lines. The dotted black line represents the negative control (neg-cnt). Data were derived from two independent experiments. (C) Levels of protein phosphorylation by immunoblot in resistant cells. Values correspond to average fold-change of resistant compared to parental cells in two independent experiments. Data were normal ized to GAPDH levels. Error bars represent standard error of the mean. *Statistically significant differences (t-test). MFI: mean fluorescence intensity; FACS: fluorescence activated cell sorting.
conferred resistance (Figure 3A). The secretion of IL-6 was
rmed by ELISA (Online Supplementary Figure S4), and the overexpression of surface PDGFRA, CXCR4 and CD19 was shown by flow cytometry (Figure 3B, Online Supple mentary Figure S5). Increased levels of p-ERK (immunob lot and phosphoFlow) and p-STAT (immunoblot) were observed in resistant cells (Figure 3C, Online Supplemen tary Figures S6 and S7)
While silencing of individual genes had only partial effects, the concomitant silencing of both IL-6 and PDGFRA by siRNA reverted the resistance (Figure 4A, Online Supple mentary Figure S8). Consistent with the effect of IL-6 si lencing, exposure of parental cells to recombinant IL-6 induced resistance (Figure 4B).

Targeting IL-6/STAT3, LIN28, or PDGFRA reverts the resistance to idelalisib
We then explored pharmacological approaches to over come the acquired resistance. Based on IL-6 involvement we tested tocilizumab, an IL-6R blocking antibody ap proved by the FDA for the treatment of various auto immune disorders and cytokine release syndrome.24 The addition of tocilizumab to idelalisib overcame the resis tance increasing the potency (i.e., the minimal active con centration) of the small molecule in the resistant cells (Figure 4B). No advantage was given by adding the anti body in parental cells. Tocilizumab as a single agent showed limited cytotoxicity in both parental and resistant cells (Online Supplementary Figure S9). To investigate the signaling activation in resistant cells downstream of IL-6, we combined idelalisib with the STAT3 inhibitor stattic. Consistent with the involvement of IL-6/STAT3 activation in resistant cells, and similarly to tocilizumab, addition of
stattic decreased cell viability and enhanced sensitivity to idelalisib in resistant cells, with minimal effects in par ental cells (Online Supplementary Figure S10).
Since members of the let-7 family were downregulated in the resistant cells, we evaluated LIN1632, an inhibitor of LIN28, an RNA binding protein involved in the downregu lation of such miRNA. While the compound had no activity as a single agent, addition of LIN1632 to idelalisib im proved the activity of the PI3Kδ inhibitor (1 µM) (Figure 5A), and increased the expression of let-7 in resistant cells but not in parental ones (Online Supplementary Figure S11).
While a low dose of LIN1632 (1 µM) was effective only in resistant cells, higher doses of LIN1632 (50 µM) increased expression of let-7 in parental cells as well, confirming the activity of the LIN28/let-7 axis in VL51 cells (Online Supplementary Figure S11B).
Screening with 348 anticancer agents and compounds targeting important biological pathways identified ac quired sensitivity of the resistant cells to the PDGFR in hibitor masitinib (Online Supplementary Figure S12). The efficacy of idelalisib was enhanced by the presence of masitinib (500 nM) only in resistant cells and not in par ental ones (Figure 5B, Online Supplementary Figure S13).
CD19 upregulation in resistant cells determines increased sensitivity to CD19-targeting agents
Due to the increased CD19 (RNA and surface) expression in the idelalisib-resistant VL51 cell line compared to its parental counterpart (Figures 6A and 3B bottom, Online Supplementary Figure S5E), we evaluated a CD19-targeting treatment, namely the CD19-directed antibody-drug con jugate loncastuximab tesirine (ADCT-402), recently ap proved by the FDA for the treatment of patients with
Figure 4. Interfering with IL-6 or PDFGRA overcomes resistance in the VL51 model. (A) Small interfering RNA were used for gene expression silencing of IL6 alone (brown dotted line), PDGFRA alone (orange dotted line) or concomitant silencing of IL6 and PDGFRA (yellow dotted line). Black and red lines for parental and resistant controls. *Statistically significant differences when compared to resistant control (red line, Z-test P<0.05). (B) Stimulation with recombinant IL-6 (30 ng/mL) conferred resistance to idelalisib in the parental cells (dotted black line) and blocking of IL-6 signaling with the monoclonal antibody tocilizumab (25 µg/mL) overcame resistance to idelalisib (red dotted line). Black and red continuous lines represent parental and resistant con trols. *Statistically significant differences when compared to parental control (black continuous line, Z-test P<0.05). Sensitivity to all treatments was tested by an MTT assay at 72 h. Data were derived from three independent experiments, error bars represent standard deviation of the mean.
Figure 5. Combination with LIN28 or PDFGRA inhibitors restores sensitivity to idelalisib. (A) Addition of 1 µM of the LIN28 inhibitor LIN1632 restored sensitivity to idelalisib in the resistant cell line with no effect in the parental cells and very limited sensitivity as a single agent for both parental and resistant cell lines (Online Supplementary Figure S11B). (B) The combination of idelalisib with 500 nM of the PDGFR inhibitor masitinib increased sensitivity to idelalisib in the resistant cells with limited benefit in the parental cells. Treatment with masitinib as a single agent was beneficial only in resistant cells but not in parental ones (Online Supplementary Figure S13B). Sensitivity to all treatments was tested by an MTT assay at 72 h. Data were derived from three in dependent experiments, error bars represent standard deviation of the mean. *Statistically significant differences when compared to treatment with idelalisib as a single agent (black continuous line, Z-test P<0.05).
relapsed/refractory large B-cell lymphoma.25 The idelal isib-resistant cells were much more sensitive than their parental counterpart (Figure 6B).
The detected mechanisms of resistance are not limited to idelalisib or the VL51 model

We then investigated whether the mechanism of resis tance identified might affect sensitivity to other PI3K in hibitors, such as duvelisib, umbralisib and copanlisib. Addition of the IL-6R blocking antibody tocilizumab, the STAT3 inhibitor stattic, the PDGFR inhibitor masitinib or the LIN28 inhibitor LIN1632 improved the anti-lymphoma activity not only of idelalisib but also of the other clini cally relevant PI3K inhibitors in resistant cells but not in the parental VL51 cell line (Online Supplementary Figure S14A, B). Conversely, as observed for idelalisib in parental cells, stimulation with recombinant IL-6 decreased sen sitivity to duvelisib, umbralisib and copanlisib, which was restored by the addition of tocilizumab (Online Supple mentary Figure S14C, D).
To further extend the significance of our findings beyond
the VL51 model, we first took advantage of a large series of lymphoma cell lines we had previously characterized at transcriptome level and for their sensitivity to idelal isib.26 IL6, PDGFRA and LIN28 expression levels were in versely correlated with idelalisib sensitivity, while the latter was positively correlated with let-7 and miR-125 levels also in these additional B-cell lymphoma models (P<0.05) (Figure 7). Second, we selected two B-cell lym phoma models, another splenic MZL SSK41 and the dif fuse large B-cell lymphoma-derived RCK8, based on their low sensitivity to idelalisib and their expression of IL6R, PDGFRA and LIN28. We tested the response to idelalisib, duvelisib, umbralisib and copanlisib in combination with the corresponding inhibitors tocilizumab (anti-IL-6R), masitinib (PDGFR inhibitor) and LIN1632 (LIN28 inhibitor). In line with what was observed in the VL51 model, both SSK41 and RCK8 benefited from the addition of tocilizu mab, masitinib and LIN1632 (Online Supplementary Figure S15A, B). Third, the effect of IL-6 stimulation on the sen sitivity to idelalisib and to the additional PI3K inhibitors duvelisib, umbralisib and copanlisib was evaluated in pri
Figure 6. Idelalisib-resistant cells exhibited increased sensitivity to an anti-CD19 treatment. (A) CD19 expression was increased in resistant (red) compared to parental (grey) cells, both at the mRNA level (shown by RNA-sequencing) and with regards to sur face expression (shown by fluorescence activated cell sorting, Figure 3B bottom panel). (B) The response to loncastuximab tesirine (ADCT-402) was tested by an MTT assay at 72 h of exposure. Data were derived from three independent experiments, error bars represent standard deviation of the mean. *Statistically significant differences between parental (black) and resistant (red) cell lines (Z-test, P<0.05). RNA-seq: RNA sequencing

mary idelalisib-sensitive B-cell lymphoma cell lines with expression of IL6R, including the mantle cell lymphoma models Granta519 and JVM2. Similarly to VL51 parental cells, stimulation with recombinant IL-6 decreased sen sitivity to all PI3K inhibitors, and addition of tocilizumab restored response to the drugs ( Online Supplementary Figure S15C, D).
Based on the different epigenetic profi les observed in parental and resistant cells, we evaluated whether resis tance may be reverted using epigenetic drugs. Due to the enrichment in resistant cells for targets of the PRC2complex and methylated genes in cancer (Online Supple mentary Figure S2B ), we tested the combination of idelalisib with the EZH2 inhibitor tazemetostat and the demethylating agent 5-azacitidine. Resistant and parental cells were exposed to 5-azacitidine or to tazemetostat given concomitantly with idelalisib or 5 days before the PI3K inhibitor. The concomitant combination exhibited very limited effects in either parental or resistant cells ( Online Supplementary Figure S16A). Nevertheless, and consistent with a mechanistic role of methylation in the resistance to idelalisib, pre-treatment with either 5-aza citidine (200 nM) or tazemetostat (1 µM) was beneficial in resistant cells and not in parental ones (Online Supple mentary Figure S16B).
The factors associated with resistance in cell lines are also relevant in clinical specimens
To extrapolate our fi ndings to the clinical context, we studied both available expression datasets and a series of serum samples. PDGFRA, IL-6 and IL-6 receptor ap
peared expressed in two series of retrospective collec tions of MZL clinical specimens and in a large series of diffuse large B-cell lymphomas27-29 (Online Supplementary Figure S17A-D ). Taking advantage of the previously re ported gene expression profi le of splenic MZL clinical specimens,28 we determined the top 200 genes positively correlated (Pearson correlation) with the expression of either IL6 or PDGFRA, defining IL6 and PDFGRA signatures. When applied to our resistant model, the two signatures were enriched among the transcripts more expressed in the resistant cells than in the parental VL51 cells (Online Supplementary Figure S17E), highlighting the similarities between our model and the clinical setting. Finally, secreted levels of IL-6 were evaluated in the serum of patients treated with idelalisib, comparing chronic lymphocytic leukemia patients with primary or acquired resistance to the PI3Kδ inhibitor to patients re sponding to the drug and paired for similar clinical fea tures (Online Supplementary Table S6). In agreement with the in vitro data, all samples but one secreting IL-6 were non-responders to idelalisib (Figure 8A). Longitudinal analyses, comparing responders and non-responders to idelalisib were carried out for those patients with IL-6 se cretion and available data along time. Non-responders showed increasing IL-6 levels upon treatment, while the paired responders remained with no IL-6 expression (Fig ure 8B).
These data suggest that the secreted factors identified in vitro can be present in the tumor microenvironment and that lymphoma cells might express the correspond ing receptors to take advantage of available chemokines. Thus, although different mechanisms may drive resis tance to PI3K inhibitors in clinical cases, the mechanism identified here might apply to some of these patients.
Figure 7. Expression levels of crucial factors are correlated with resistance to idelalisib. IL6, PDGFRA, and LIN28 expression levels are inversely correlated with idelalisib sensitivity. Conversely, expression of miR-125a and members of the let-7 family of microRNA is associated with sensitivity to idelalisib. Expression and sensitivity data were analyzed from a previous publication by our group in a panel of 34 B-cell lymphoma cell lines.26 Cell lines were split into two groups based on higher (positive, black bars) or lower (negative, grey bars) values than the median expression of the corresponding gene or miRNA. Means of the idelalisib IC50 were calculated for these two groups and compared by a t-test. *P<0.05. IC50: half maximum inhibitory concentration.

We developed and characterized a model of secondary re sistance to PI3K inhibitors in splenic MZL. Our results in dicate that: (i) epigenetic reprogramming can drive
resistance to PI3K inhibitors by promoting the secretion of cytokines; and (ii) the resistance can be overcome using various drugs, which could be tested in novel clinical trials.
Idelalisib was the first-in-class PI3Kδ inhibitor and several
additional PI3K inhibitors with different selectivity, includ ing duvelisib, copanlisib and umbralisib, have entered the clinical setting as single agents and in combinations.1-3 The model of secondary resistance we developed via pro longed in vitro exposure to idelalisib presented decreased sensitivity to other PI3K inhibitors, such as copanlisib, du velisib and umbralisib. The role of the identified factors in the resistance to PI3K inhibitors has been further vali dated in additional B-cell lymphoma in vitro models and across a large series of cell lines derived from different types of lymphoma, and their expression demonstrated in various clinical specimens, including the serum of idelal isib-resistant patients.
Targeting epigenetic vulnerabilities has been recently pro posed as a valuable strategy to overcome resistance to ther apy in cancer, including resistance to PI3K inhibitors.30-33 Epigenetic cell plasticity, which might be pharmacologi cally reverted, allows the development of drug-tolerant subpopulations even in the absence of genetic lesions or can provide a first permissible environment for the emergence, later on, of cells carrying DNA changes.34 A relevant role for methylation has been suggested in splenic MZL, in which a hypermethylation phenotype,
elevated expression of EZH2, and enrichment of PRC2complex targets are associated with a more aggressive clinical outcome.16
The resistant cell line secreted interleukins and chemo kines, such as IL-6, and showed upregulation of prosur vival networks, including PDGFRA, JAK-STAT and NF- κ B pathways. Our findings are in line with the notion that se creted factors can give resistance to PI3K inhibitors,35,36 and with the background of the cell line we have used, representative of the recently described NNK splenic MZL subgroup, driven by mutations in genes involved in NFκ B/NOTCH/KLF2. 37 IL-6 can protect cancer cells from apoptosis and DNA damage induced by drugs and can de crease sensitivity to tyrosine kinase inhibitors by activat ing different signaling pathways, such as the JAK-STAT, AKT-mTOR and NF-κB signaling pathways.38 Release of IL6 mediates resistance to the BTK inhibitor ibrutinib in Waldenström macroglobulinemia.39 to duvelisib and co panlisib in diffuse large B-cell lymphoma and T-cell lym phoma cells,35 and, in head and neck squamous cell carcinoma cell lines, blockade of IL-6 signaling overcomes resistance to the pan-PI3K inhibitor buparlisib.36 In our re sistant cell line, upregulation of IL-6 was associated with

A
B
Figure 8. Levels of serum IL-6 are higher in idelalisib-resistant chronic lymphocytic leukemia patients than in idelalisib-sensitive ones. (A) IL-6 secretion was evaluated in serum samples from patients with chronic lymphocytic leukemia at the end of the treatment by enzyme-linked immunosorbent assay (Luminex, R&D Systems). Patients who responded to idelalisib (responders, blue) or did not (non-responders, red) were compared by a t-test. P represents adjusted P-value. (B) Longitudinal analyses were performed on clinically-paired patients with secretion of IL-6. Secretion of IL-6 was compared between patients not responding to idelalisib (red) and their corresponding matched controls (responding, blue). MFI: mean fluorescence intensity. ELISA: enzymelinked immunosorbent assay.
downregulation of let-7 and miR-125 microRNA, which di rectly target the interleukin,19 and with the loss of methyl ation in the IL6 gene promoter. The latter was methylated in the parental cell line but not in resistant lines, and methylation-based repression of the IL-6-targeting miRNA, miR-125 and members of let-7 family, might con tribute to the increased IL-6 expression. LIN28 is an RNA binding protein that functions as an oncogene inhibiting the expression of let-7 family microRNA, dysregulating the normal balance between differentiation and cell growth.40 Since IL-6 induces transcription of NF-κB targets, a posi tive feedback loop leads to B-cell activation under the control of LIN28 and let-7.19 The miRNA mir-125 is located at 19q13 and frequently downregulated or deleted in cancer, and it can also regulate cell proliferation by tar geting p53.41 Loss of miR-125 leads to high expression of STAT3, IL-6 itself and of a subunit of IL-6 receptor com plex (IL-6R).20 Hence, in the context of NF-κ B and JAKSTAT activation, miR-125 might work concomitantly with let-7. Alongside IL-6, PDGFRA too was upregulated in the resistant cell line. Active PDGFRA signaling, as a con sequence of genomic aberrations affecting PDGFRA, is as sociated with tumor development and progression in solid cancer,42 it mediates the activation of PI3K-AKT, JAK-STAT and RAS-ERK signaling,43 and it confers resistance to the tyrosine kinase inhibitor imatinib.44 PDGFR signaling is known to increase IL-6/IL-6R axis expression,45 and, fur thermore, PDGFR is also linked with CXCR4,46 upregulated in the resistant cells. CXCR4 is upregulated after exposure to BCR inhibitors, including PI3K and BTK inhibitors26 and, in diffuse large B-cell lymphoma models, it has been sug gested as a potential mechanism of resistance to the ty rosine kinase inhibitors themselves.5,6
Since a multitude of experiments, including genetic si lencing and use of IL-6 recombinant protein, indicated that the mechanism of resistance to PI3K inhibitors in the VL51 model was driven by activation of the IL-6/STAT3 and PDFGRA signaling cascades and was dependent on the action of LIN28, we explored possible therapeutic inter ventions. Tocilizumab is an IL-6R blocking antibody in clinical use to treat different autoimmune disorders and more recently for the cytokine release syndrome that can be seen with chimeric antigen receptor T-cell therapy or in patients with coronavirus disease 2019.24 Masitinib, a small molecule that inhibits PDGFR signaling and targets the innate immune system, is under clinical development for various indications, including systemic mastocytosis, solid tumors, and amyotrophic lateral sclerosis.47 The combination with these two already clinically available drugs, and with the LIN28 inhibitor LIN1632 or with the STAT3 inhibitor stattic, two compounds in the preclinical phase of investigation, restored sensitivity to PI3K in hibition. Moreover, the resistant cells had higher CD19 ex pression on their cell surface, which gave much higher
activity to the CD19 targeting antibody drug conjugate lon castuximab tesirine, recently approved by the FDA for the treatment of patients with relapsed or refractory large Bcell lymphoma.25 In the clinical routine, CD19 could be easily investigated (by immunohistochemistry or flow cytometry) and its expression provides a rationale for testing CD19-targeting antibody drug conjugates, naked antibodies, and cellular therapies in patients exposed to PI3K inhibitors.
In conclusion, a model of secondary resistance to PI3K in hibitors, derived from splenic MZL, has revealed mechan isms of resistance to these drugs and allowed the identification of a first series of active therapeutic ap proaches that could be explored further.
AJA has received a travel grant from Astra Zeneca. LC has received a travel grant from HTG. LB is currently a parttime employee of Bright Peak Therapeutics. AS has re ceived institutional research funds from Bayer, ImmunoGen, Merck, Pfizer, Novartis, Roche, MEI Pharma, ADC-Therapeutics and travel grants from AbbVie and Phar maMar. Valter Gattei has received research funding from Menarini SpA, laboratory activity fees from Janssen, and scientific advisory board fees from AbbVie. JB is a consul tant for Abbvie, Acerta, Astra Zeneca, Beigene, Catapult, Dynamo Therapeutics, Eli Lilly, Genentech/Roche, Gilead, Juno/Celgene/Bristol Myers Squibb, Kite, Loxo, MEI Pharma, Nextcea, Nov artis, Octapharma, Pfizer, Phar macyclics, Rigel, Sunesis, TG Therapeutics and Verastem; has received research funding from Gilead, Loxo, Sun, TG Therapeutics and Verastem; and has served on data safety monitoring committees for Invectys. EZ has received insti tutional research funds from Celgene, Roche and Janssen, advisory board fees from Celgene, Roche, Mei Pharma, Astra Zeneca and Celltrion Healthcare and travel grants from Abbvie and Gilead; and has provided expert state ments to Gilead, Bristol-Myers Squibb and MSD. DR has re ceived grant support from Gilead, AbbVie, and Janssen, honoraria from Gilead, AbbVie Janssen, and Roche; and scientific advisory board fees from Gilead, AbbVie, Janssen, AstraZeneca, and MSD. GS has received travel grants from Novartis, Celgene and Roche, consultancy fees from No vartis, scientific advisory board fees from Bayer, Celgene, Janssen and Novartis, and speaker fees from Gilead. FB has received institutional research funds from Acerta, ADC Therapeutics, Bayer AG, Cellestia, CTI Life Sciences, EMD Serono, Helsinn, ImmunoGen, Menarini Ricerche, NEOMED Therapeutics 1, Nordic Nanovector ASA, Oncology Thera peutic Development, and PIQUR Therapeutics AG, has re ceived consultancy fees from Helsinn and Menarini, has provided expert statements to HTG, and has received travel grants from Amgen, Astra Zeneca, Jazz Pharmaceuticals and PIQUR Therapeutics AG. The other authors have no
thing to disclose.
AJA and SN contributed equally. AJA performed experi ments, analyzed and interpreted data, performed data mining, prepared the figures and co-wrote the manuscript; SN performed silencing experiments and interpreted data; LC performed data mining; GS, EG, CT, AM, FS and LB per formed experiments; AZ, FR, RBP, GS and VG performed flow-cytometry analyses; AR performed genomics experi ments; MCM and ME performed methylation profiling ex periments and data mining, SJ performed ELISA Luminex experiments; AS provided advice; JRB collected and char acterized tumor samples; EZ and DR jointly designed the
1. Phillips TJ, Michot JM, Ribrag V. Can next-generation PI3K inhibitors unlock the full potential of the class in patients with B-cell lymphoma? Clin Lymphoma Myeloma Leuk. 2021;21(1):8-20.e3.
2. Kienle DL, Stilgenbauer S. Approved and emerging PI3K inhibitors for the treatment of chronic lymphocytic leukemia and non-Hodgkin lymphoma. Expert Opin Pharmacother. 2020;21(8):917-929.
3. Tarantelli C, Argnani L, Zinzani PL, et al. PI3Kδ inhibitors as immunomodulatory agents for the treatment of lymphoma patients. Cancers (Basel). 2021;13(21):5535.
4. Scheffold A, Jebaraj BMC, Tausch E, et al. IGF1R as druggable target mediating PI3K-δ inhibitor resistance in a murine model of chronic lymphocytic leukemia. Blood. 2019;134(6):534-547.
5. Chen L, Ouyang J, Wienand K, et al. CXCR4 upregulation is an indicator of sensitivity to B-cell receptor/PI3K blockade and a potential resistance mechanism in B-cell receptor-dependent diffuse large B-cell lymphomas. Haematologica. 2020;105(5):1361-1368.
6. Kim JH, Kim WS, Ryu KJ, et al. CXCR4 can induce PI3Kδ inhibitor resistance in ABC DLBCL. Blood Cancer J. 2018;8(2):23.
7. Faia K, White K, Murphy E, et al. The phosphoinositide-3 kinase (PI3K)-δ,γ inhibitor, duvelisib shows preclinical synergy with multiple targeted therapies in hematologic malignancies. PLoS One. 2018;13(8):e0200725.
8. Yahiaoui A, Meadows SA, Sorensen RA, et al. PI3Kδ inhibitor idelalisib in combination with BTK inhibitor ONO/GS-4059 in diffuse large B cell lymphoma with acquired resistance to PI3Kδ and BTK inhibitors. PLoS One. 2017;12(2):e0171221.
9. Iyengar S, Clear A, Bodor C, et al. P110alpha-mediated constitutive PI3K signaling limits the efficacy of p110deltaselective inhibition in mantle cell lymphoma, particularly with multiple relapse. Blood. 2013;121(12):2274-2284.
10. Murali I, Kasar S, Naeem A, et al. Activation of the MAPK pathway mediates resistance to PI3K inhibitors in chronic lymphocytic leukemia. Blood. 2021;138(1):44-56.
11. Matera E-L, Fouret J, Baulu E, et al. Enhanced sensitivity of idelalisib and ibrutinib-resistant cell lines to anti-CD38 antibodies. J Cancer Sci Clin Ther. 2020;4:71-77.
12. Spriano F, Chung EYL, Gaudio E, et al. The ETS inhibitors YK-4279 and TK-216 are novel antilymphoma agents. Clin Cancer Res. 2019;25(16):5167-5176.
research and edited the manuscript, FB designed research, interpreted data, and co-wrote the manuscript. All authors approved the final manuscript.
This study was supported in part by the Swiss National Science Foundation (SNSF 31003A_163232/1) with funds to EZ, DR and FB. JRB was supported by National Institutes of Health grant RO1 CA 213442 (PI: Jennifer Brown).
Genomics data will be available in the GEO database (under submission).
13. Hoellein A, Decker T, Bogner C, et al. Expression of multidrug resistance-associated ABC transporters in B-CLL is independent of ZAP70 status. J Cancer Res Clin Oncol. 2010;136(3):403-410.
14. Gaudio E, Tarantelli C, Spriano F, et al. Targeting CD205 with the antibody drug conjugate MEN1309/OBT076 is an active new therapeutic strategy in lymphoma models. Haematologica. 2020;105(11):2584-2591.
15. Piva R, Deaglio S, Fama R, et al. The Kruppel-like factor 2 transcription factor gene is recurrently mutated in splenic marginal zone lymphoma. Leukemia. 2015;29(2):503-507.
16. Arribas AJ, Rinaldi A, Mensah AA, et al. DNA methylation profiling identifies two splenic marginal zone lymphoma subgroups with different clinical and genetic features. Blood. 2015;125(12):1922-1931.
17. Rossi D, Deaglio S, Dominguez-Sola D, et al. Alteration of BIRC3 and multiple other NF-kappaB pathway genes in splenic marginal zone lymphoma. Blood. 2011;118(18):4930-4934.
18. Rossi D, Trifonov V, Fangazio M, et al. The coding genome of splenic marginal zone lymphoma: activation of NOTCH2 and other pathways regulating marginal zone development. J Exp Med. 2012;209(9):1537-1551.
19. Iliopoulos D, Hirsch HA, Struhl K. An epigenetic switch involving NF-kappaB, Lin28, Let-7 microRNA, and IL6 links inflammation to cell transformation. Cell. 2009;139(4):693-706.
20. Li D, Kong C, Tsun A, et al. MiR-125a-5p decreases the sensitivity of Treg cells toward IL-6-mediated conversion by inhibiting IL-6R and STAT3 expression. Sci Rep. 2015;5:14615.
21. Singh BN, Kawakami Y, Akiyama R, et al. The Etv2-miR-130a network regulates mesodermal specification. Cell Rep. 2015;13(5):915-923.
22. Mazzu YZ, Hu Y, Shen Y, et al. miR-193b regulates tumorigenesis in liposarcoma cells via PDGFR, TGFbeta, and Wnt signaling. Sci Rep. 2019;9(1):3197.
23. Slattery ML, Mullany LE, Sakoda LC, et al. The MAPK-signaling pathway in colorectal cancer: dysregulated genes and their association with microRNAs. Cancer Inform. 2018;17:1176935118766522.
24. Actemra (tocilizumab): highlights of prescribing information. Revised: 03/2021. Genentech, Inc. http://www.accessdata.fda.gov/scripts/cder/drugsatfda/index.cf m. 2021.
25. Zynlonta (loncastuximab tesirine): highlights of prescribing information. Revised: 04/2021. ADC Therapeutics, Inc. http://www.accessdata.fda.gov/scripts/cder/drugsatfda/index.cf m. 2021.
26. Tarantelli C, Gaudio E, Arribas AJ, et al. PQR309 is a novel dual PI3K/mTOR inhibitor with preclinical antitumor activity in lymphomas as a single agent and in combination therapy. Clin Cancer Res. 2018;24(1):120-129.
27. Arribas AJ, Campos-Martín Y, Gómez-Abad C, et al. Nodal marginal zone lymphoma: gene expression and miRNA profiling identify diagnostic markers and potential therapeutic targets. Blood. 2012;119(3):e9-e21.
28. Arribas AJ, Gomez-Abad C, Sanchez-Beato M, et al. Splenic marginal zone lymphoma: comprehensive analysis of gene expression and miRNA profiling. Mod Pathol. 2013;26(7):889-901.
29. Lenz G, Wright G, Dave SS, et al. Stromal gene signatures in large-B-cell lymphomas. N Engl J Med. 2008;359(22):2313-2323.
30. Wu D, Yan Y, Wei T, et al. A targetable epigenetic vulnerability in PI3K/AKT inhibitor resistant cancers. bioRxiv 2020.08.27.269613; doi: https://doi.org/10.1101/2020.08.27.269613. [preprint, not peer-reviewed]
31. Quagliano A, Gopalakrishnapillai A, Barwe SP. Understanding the mechanisms by which epigenetic modifiers avert therapy resistance in cancer. Front Oncol. 2020;10:992.
32. Romero-Garcia S, Prado-Garcia H, Carlos-Reyes A. Role of DNA methylation in the resistance to therapy in solid tumors. Front Oncol. 2020;10:1152.
33. Garcia-Martinez L, Zhang Y, Nakata Y, et al. Epigenetic mechanisms in breast cancer therapy and resistance. Nat Commun. 2021;12(1):1786.
34. Wright SCE, Vasilevski N, Serra V, et al. Mechanisms of resistance to PI3K inhibitors in cancer: adaptive responses, drug tolerance and cellular plasticity. Cancers (Basel). 2021;13(7):1538.
35. Kim JH, Kim WS, Park C. Interleukin-6 mediates resistance to PI3K-pathway-targeted therapy in lymphoma. BMC Cancer. 2019;19(1):936.
36. Yun MR, Choi HM, Kang HN, et al. ERK-dependent IL-6 autocrine signaling mediates adaptive resistance to pan-PI3K inhibitor
BKM120 in head and neck squamous cell carcinoma. Oncogene. 2018;37(3):377-388.
37. Bonfiglio F, Bruscaggin A, Guidetti F, et al. Genetic and phenotypic attributes of splenic marginal zone lymphoma. Blood 2022;139(5):732-747.
38. Kumari N, Dwarakanath BS, Das A, et al. Role of interleukin-6 in cancer progression and therapeutic resistance. Tumour Biol. 2016;37(9):11553-11572.
39. Chen JG, Liu X, Munshi M, et al. BTK Cys481Ser drives ibrutinib resistance via ERK1/2 and protects BTK wild-type MYD88mutated cells by a paracrine mechanism. Blood. 2018;131(18):2047-2059.
40. Piskounova E, Polytarchou C, Thornton JE, et al. Lin28A and Lin28B inhibit let-7 microRNA biogenesis by distinct mechanisms. Cell. 2011;147(5):1066-1079.
41. Chen J, Ouyang H, An X, et al. miR-125a is upregulated in cancer stem-like cells derived from TW01 and is responsible for maintaining stemness by inhibiting p53. Oncol Lett. 2019;17(1):87-94.
42. Verhaak RG, Hoadley KA, Purdom E, et al. Integrated genomic analysis identifies clinically relevant subtypes of glioblastoma characterized by abnormalities in PDGFRA, IDH1, EGFR, and NF1. Cancer Cell. 2010;17(1):98-110.
43. Ip CKM, Ng PKS, Jeong KJ, et al. Neomorphic PDGFRA extracellular domain driver mutations are resistant to PDGFRA targeted therapies. Nat Commun. 2018;9(1):4583.
44. Li GZ, Raut CP. Targeted therapy and personalized medicine in gastrointestinal stromal tumors: drug resistance, mechanisms, and treatment strategies. Onco Targets Ther. 2019;12:5123-5133.
45. Lim SE, Esain V, Kwan W, et al. HIF1α induced PDGFRβ signaling promotes developmental HSC production via IL-6 activation. Exp Hematol. 2017;46:83-95.e6.
46. Bernat-Peguera A, Simón-Extremera P, da Silva-Diz V, et al. PDGFR-induced autocrine SDF-1 signaling in cancer cells promotes metastasis in advanced skin carcinoma. Oncogene. 2019;38(25):5021-5037.
47. Laforgia M, Marech I, Nardulli P, et al. An evaluation of masitinib for treating systemic mastocytosis. Expert Opin Pharmacother. 2019;20(13):1539-1550.
Knut Smeland,1,2 Harald Holte,2,3 Unn-Merete Fagerli,4,5 Hanne Bersvendsen,6 Marianne J. Hjermstad,7 Jon H. Loge,8 Klaus Murbræch,9 Marianne D. Linnsund,10 Øystein Fluge,11 Jo S. Stenehjem,12 May B. Lund,13 Stein Kvaløy 1,2 and Cecilie E. Kiserud1
1National Advisory Unit on Late Effects after Cancer Treatment, Department of Oncology, Oslo University Hospital, Oslo; 2Department of Oncology, Oslo University Hospital, Oslo; 3KG Jebsen Center for B Cell Malignancies, Institute of Clinical Medicine, Faculty of Medicine, University of Oslo, Oslo; 4Department of Oncology, St. Olavs Hospital, Trondheim; 5Department of Cancer Research and Molecular Medicine, Norwegian University of Science and Technology, Trondheim; 6Department of Oncology, University Hospital of North Norway, Tromsø; 7Regional Advisory Unit for Palliative Care and European Palliative Care Research Center (PRC), Department of Oncology, Oslo University Hospital and Institute of Clinical Medicine, University of Oslo, Oslo; 8Department of Behavioral Medicine, Faculty of Medicine, University of Oslo, Oslo; 9Department of Cardiology, Oslo University Hospital, Rikshospitalet, Oslo; 10Department of Pediatric and Adolescent Medicine, Akershus University Hospital, Lørenskog; 11Department of Oncology and Medical Physics, Haukeland University Hospital, Bergen; 12Department of Research, Cancer Registry of Norway, Oslo and 13Department of Respiratory Medicine, Oslo University Hospital and Institute of Clinical Medicine, University of Oslo, Oslo, Norway
Correspondence: K. Smeland
November 25, 2021.
April 15, 2022.
28, 2022.
Lymphoma survivors after high-dose therapy with autologous stem-cell transplant (HDT-ASCT) are at risk of several late effects, which might impair their health-related quality of life (HRQoL). We assessed the total late effect burden in this population, and how it affects HRQoL. All lymphoma survivors treated with HDT-ASCT as adults in Norway between 1987 and 2008 were identified, and 271 (68%) attended both a comprehensive clinical assessment and completed a question naire. Severity of 45 conditions in 12 organ-system categories were graded as mild, moderate, severe or life-threatening, according to a modified version of CTCAEv4.03. At a median of 8 years after HDT-ASCT, 98% of survivors had at least one moderate or more severe late effect and 56% had severe or life-threatening late effects. Fourteen percent had low, 39% medium and 47% high late effect burden, defined as having moderate or more severe late effects in 0-1, 2-3 and >3 organsystems, respectively. Female sex, increasing age, B-symptoms at diagnosis and >1 treatment line prior to HDT-ASCT were independently associated with having high late effect burden. The survivors had significantly poorer physical and mental HRQoL assessed by the Short Form-36 compared to age- and sex-matched controls. The prevalence of poor physical and mental HRQoL increased with higher late effect burden (both P<0.001), and the low burden group had better physical HRQoL than controls (P<0.001). In conclusion, lymphoma survivors after HDT-ASCT have impaired HRQoL, seemingly driven by a high late effect burden. This highlights the importance of prevention, regular assessments for early detection and treatment of late effects and modifiable risk factors.
High-dose therapy with autologous stem-cell transplan tation (HDT-ASCT) has been a potentially curative treat ment option for selected lymphoma patients for decades and its use is still increasing.1,2 More than 60% of patients with Hodgkin lymphoma3 and 50% of those with nonHodgkin lymphoma4 are alive 10 years after HDT-ASCT, and
for patients who survive the initial 2-5 years after HDTASCT, reported long-term survival is up to 90%, approach ing the average life expectancy.3-5 Consequently, there is a growing population of long-term survivors at increased risk of late effects of the cumulative treatment received with radiotherapy, conventional chemotherapy and the HDT-ASCT itself. We and others have shown that lym phoma survivors in general, and those after HDT-ASCT, are
at increased risk of a wide range of late effects such as secondary cancers, cardiovascular disease, respiratory im pairments, peripheral neuropathies, hormonal disturb ances, sexual dysfunction, chronic fatigue and mental distress.3,4,6-17 However, most of these studies have fo cused on a single late effect, were based on self-reports only or did not encompass the severity of the late effects. While several studies have described total burden of late effects in childhood cancer survivors,18-22 a comprehensive assessment of the total late effect burden with system atic severity grading in adult lymphoma survivors or after HDT-ASCT specifically have, to the best of our knowledge, not previously been done.
Health-related quality of life (HRQoL) has been defined as: “the extent to which one’s usual or expected physical, emotional or social well-being is affected by a medical condition or its treatment”.23 A recent meta-analysis, in cluding 64 studies, found that HRQoL continues to be sig nificantly impaired in long-term cancer survivors 2-26 years after diagnosis.24 Among lymphoma survivors car diopulmonary late effects, neuropathy, chronic fatigue and psychological late effects have been associated with im paired HRQoL.25-27 To what degree the total burden, i.e. the number and severity, of late effects affects HRQoL in adult lymphoma survivors after HDT-ASCT is not known.
Our primary aim was to assess the total burden of late ef fects, including severity grading, in a national cohort of real-world adult lymphoma survivors treated with HDTASCT. Second, we examined factors associated with hav ing a high late effect burden, and explored to what extent the total burden of late effects is related to HRQoL.
The study was part of a national, multicenter, cross-sec tional study performed in four centers from 2012 to 2014.15
All survivors treated with HDT-ASCT for lymphoma in Nor way from 1987 to 2008, aged ≥18 years at the time of transplantation, resident in Norway at the time of the sur vey and not currently undergoing systemic therapy for ac tive malignancy were eligible (n=399). The survivors were identified through treatment records and registries at each participating center. Eligible survivors were invited by mail to complete a 125-item multi-instrument ques tionnaire, including the Short Form-36 (SF-36) for HRQoL, and attend an outpatient clinical examination. Details are provided in the Online Supplementary Methods. For comparison of HRQoL, we randomly drew 871 controls matched 1:3 on sex and 5-year age group from a repre sentative sample of 2,107 people from the general Norwe gian population with SF-36 data collected in 2015.28 Based on the information available from the clinical exam ination, the patient’s charts and questionnaire, the sever
ity of all late effects were graded according to a modified version of the National Cancer Institute Common Ter minology Criteria for Adverse Events (CTCAE) v4.03 devel oped for late-onset and long-term chronic health outcomes in pediatric cancer survivors in the St. Jude Lifetime Cohort Study,20 or according to the original CTCAE v4.03, as applicable. In total 45 conditions were graded as mild (grade 1), moderate (grade 2), severe (grade 3) or life-threatening (grade 4) and then grouped into 12 organ-system categories: endocrine, cardiovascular, neuro-/musculoskeletal, pulmonary, genital/sexual, renal, hematologic, hearing, second cancer, hepatic, chronic fa tigue and psychological, as described in Online Supple mentary Table S1. As the study only included survivors alive at the time of the survey, grade 5 (death) was not in cluded. If the information was insufficient to distinguish between two grades, the lower grade was assigned.
To evaluate the total late effect burden, the number of organ-system categories with grade 2 (moderate) or more severe late effect(s) were counted, and survivors with late effects in 0-1, 2-3 and >3 organ-systems were classified as having low, medium and high burden, respectively. Grade 1 conditions were excluded in the analyses of late effect burden as these by definition are mild or asympto matic and therefore found less relevant.
Descriptive statistics and comparison of groups by t tests, Mann-Whitney U tests, Kruskall-Wallis tests, c2 tests and Fisher exact tests were performed as appropriate. Logistic regression analyses were performed to identify variables associated with having high late effect burden (late effects in >3 organ-system categories as the de pendent variable). Independent variables with a P-value <0.15 in univariate analyses were included in the multi variable model. High-dose regimen and cisplatin were ex cluded in the multivariable model because of their strong correlations with time since HDT-ASCT and number of treatment lines, respectively. Variables included in multi variable analyses were tested for multicollinearity, and the assumptions for logistic regression analysis were met. The significance level was set at 0.05, and all tests were twosided. Analyses were performed using IBM SPSS statistics version 26.
The study was approved by the South East Regional Com mittee for Medical and Health Research Ethics (n. 2011/1353). All participants gave written informed consent to the study.
Of 399 eligible survivors, 271 (68%) completed both the questionnaire and attended the clinical examination (On line Supplementary Figure S1). Age at the time of the sur
vey, gender, time from HDT-ASCT, lymphoma type and HDT regimen did not differ between participants and non-par
ticipants (data not shown). Among participants, 167 (62%) were men (Table 1). The median age at the time of the sur
Table 1. Patient, disease and treatment characteristics of the study population and according to late effect burden groups.
Total (N=271)
Low-medium burden (N=142)
High burden (N=129) P
Age at diagnosis in years, median (range) 42 (10-65) 40 (13-65) 45 (10-64) 0.04
Age at HDT-ASCT in years, median (range) 46 (19-67) 43 (19-66) 48 (19-67) 0.02
Age at survey in years, median (range) 56 (24-77) 53 (24-73) 59 (24-77) 0.001
Time diagnosis to survey in years, median (range) 12 (3-34) 11 (3-31) 13 (4-34) 0.03
Time HDT-ASCT - survey in years, median (range) 8.5 (3-25) 8 (3-25) 9.5 (3-25) 0.04
Female sex, N (%) 104 (38) 46 (32) 58 (45) 0.03
In a relationshipa, N (%) 199 (74) 104 (74) 95 (74) 0.98
Education <13 years, N (%) 140 (52) 75 (53) 65 (51) 0.69
Unemployed, N (%) 68 (25) 23 (16) 45 (35) <0.001
Household income lowb, N (%) 145 (54) 66 (47) 79 (62) 0.01
Lymphoma and treatment
Lymphoma type
Hodgkin lymphoma, N (%)
Aggressive non-Hodgkin lymphomac, N (%) Indolent non-Hodgkin lymphomad, N (%)
61 (23) 182 (67) 28 (10)
29 (20) 101 (71) 12 (9)
32 (25) 81 (63) 16 (12)
0.32
Stage III-IV at diagnosis, N (%) 186 (69) 96 (68) 90 (70) 0.77 B-symptoms at diagnosis, N (%) 95 (36) 38 (27) 57 (45) <0.01
High-dose regime
0.04
Total body irradiation, N (%)
BEAM, N (%) 38 (14) 233 (86) 14 (10) 128 (90) 24 (19) 105 (81)
>1 treatment lines prior to HDT-ASCT, N (%) 191 (71) 91 (64) 100 (78) 0.02
Radiotherapy, N (%) 174 (64) 82 (58) 92 (71) 0.02
Radiotherapy to mediastinum, N (%) >30 Gy to mediastinum, N (%) Gy to mediastinum, median (range)
99 (37) 37 (14) 29.75 (13-67)
45 (32) 20 (14) 30 (13-65)
54 (42) 17 (13) 26 (13-67)
0.08 0.83 0.12
Radiotherapy below diaphragm, N (%) 97 (36) 44 (31) 53 (41) 0.08
Doxorubicin, mg/m2, median (range) 300 (0-775) 300 (80-580) 300 (0-775) 0.67
Cyclophosphamide, gr/m2, median (range) 4.5 (0-12.3) 4.5 (0-11.3) 4.5 (0-12.3) 0.55
Cisplatin, N (%) 11 (4) 3 (2) 8 (6) 0.08
Bleomycin, N (%) 34 (13) 16 (11) 18 (14) 0.51
Rituximab, N (%) 114 (42) 63 (44) 51 (40) 0.42
Relapse after HDT-ASCT, N (%) 59 (22) 28 (20) 31 (24) 0.39
Allogeneic transplantation, N (%)
Sedentarye, N (%)
Smokingf, N (%)
Unhealthy alcohol consumptiong, N (%)
Diet less than 5-a-dayh, N (%)
(6)
(7) 7 (5) 0.58
(54) 66 (47) 79 (62) 0.01
(19) 27 (19) 23 (18) 0.80
(6)
(3) 11 (9) 0.03
(87) 125 (88) 111 (86) 0.63
The late effect burden groups compared were low-medium burden (grade 2 or more severe late effect(s) in ≤3 organ-systems) vs. high burden (grade 2 or more severe late effect(s) in >3 organ-systems). P-values obtained by the c2-test for categorical variables and independent t-test or Mann-Whitney (skewed data) for continuous variables. Statistically significant P-values are indicated in bold. Missing values: in at relation ship, n=1; education, n=2; income, n=4; stage, n=1; B-symptoms, n=4; sedentary, n=1; smoking, n=2, unhealthy alcohol consumption, n=4 aMarried or cohabitant. bLow household income: <600,000 NOK/year (≈ €60,000). cIncludes diffuse large B-cell lymphoma, n=60; mantle cell lymphoma, n=34; T-cell lymphomas, n=29; transformed lymphomas, n=28; lymphoblastic lymphoma, n=19; Burkitt lymphoma, other/notspecified non-Hodgkin lymphoma, n=2. dIncludes follicular and other indolent lymphomas. e<150 min/week of moderate physical activity or <75 min/week of strenuous physical activity (WHO recommendation). fSmoking current or occasionally. gAlcohol consumption >6 or >12 alcohol units per week for women and men, respectively. hThree vegetables and two fruits per day. HDT-ASCT: high-dose therapy with autologous stem-cell transplantation; BEAM: carmustine, etoposide, cytarabine and melphalan
vey was 56 years, and the median observation time from lymphoma diagnosis and HDT-ASCT to survey was 12 and 8 years, respectively. HDT-ASCT was given after relapse in 70% of the survivors, while the remaining received HDTASCT in first remission. All but one patient had received doxorubicin, with a mean cumulative dose of 310 mg/m2 (standard deviation [SD] 117), and 64% had also received radiotherapy.
The frequencies and grades of the separate late effects within each organ-system category are given in Online Supplementary Table S1. All of the 271 survivors had late effect(s) in at least one of the 12 organ-system categories when including all grades. Ninety-eight percent (n=265) had at least one grade 2 or more severe late effect and 56% had severe or life-threatening (grade 3-4) late effect(s) (Figure 1). The endocrine system was most com monly affected, with dysfunction observed in 94% of sur vivors. Most of these late effects were grade 1-2 hypogonadism (n=129), hypothyroidism (n=129) and abnor mal glucose metabolism (n=57), but grade 3-4 late effects were also present in 28% (mostly body mass index ≥30 and premature ovarian failure). The second most com monly affected category was the cardiovascular system with 86% of survivors having any grade late effects and 23% have grade 3-4 late effects. The types of late effects and severity were largely similar for patients with Hodgkin lymphoma or non-Hodgkin lymphoma (Online Supplemen tary Figure S2), with the endocrine and cardiovascular systems being the two most commonly affected for both.
The mean number of organ-system categories with grade

2 or more severe late effects per survivor was 3.5 (SD 1.7) (Figure 2). Thirty-seven (14%), 105 (39%) and 129 (47%) had low, medium and high burden, respectively. The propor tions with high late effect burden among females and males were 55.8% and 42.5%, respectively (P=0.03). Sur vivors with a high late effect burden were also older (median 48 vs. 43 years [P=0.02] and 59 vs. 53 years [P=0.001] at the time of the HDT-ASCT and survey, re spectively), and had a longer time from diagnosis to HDTASCT and from HDT-ASCT to survey (Table 1). The proportions of survivors with low income and unemployed were higher in the high late effect burden group. Of lymphoma- and treatment-related factors, the high late effect burden group had higher proportions of surviv ors with B-symptoms at diagnosis, survivors treated with total body irradiation as the high-dose regimen or with radiotherapy given at any time, and survivors having re ceived >1 treatment line prior to HDT-ASCT. In the high burden group, 62% and 9% had a sedentary life style and unhealthy alcohol consumption, respectively, compared with 47% and 3% of those with mild to medium burden. Table 2 shows the factors associated with having high late effect burden with P<0.15 in univariate logistic regression analyses. In the multivariable analysis, female sex (odds ratio [OR]=1.76; 95% confidence interval [95% C]: 1.01-3.07; P=0.04), increasing age (OR=1.05; 95% CI: 1.02-1.07; P<0.001), B-symptoms at diagnosis (OR=2.56; 95% CI: 1.39-4.69; P<0.01) and >1 treatment line prior to HDT-ASCT (OR=2.09; 95% CI: 1.11-3.94; P=0.02) were associated with having high late effect burden.
Health-related quality of life and association with late effect burden
Mean physical (PCS) and mental (MCS) composite scale
scores for all survivors were 44.9 (SD 10.9) and 51.8 (SD 10.0), respectively, compared with 48.5 (SD 10.5) (P<0.001) and 53.4 (SD 7.8) (P=0.02) in controls (Figure 3). The preva lence of poor physical HRQoL (PCS <40) and mental HRQoL (MCS <40) among survivors were 33% and 14%, re spectively, compared with 20% and 7% in controls (P<0.001 for both). Survivors scored significantly lower on seven out of the eight SF-36 scales compared to controls (Figure 3E). Both PCS (P<0.001) and MCS (P<0.01) scores decreased and the prevalence of poor physical (P<0.001) and mental (P<0.001) HRQoL increased with higher late ef fect burden (Figure 3).
When assessing the late effect organ-system categories separately, survivors with chronic fatigue and those with psychological late effect(s) had both lower PCS and MCS, while survivors with cardiovascular, pulmonary and neuro/musculoskeletal late effect(s) had lower PCS scores, but similar MCS scores. For the remaining late effects cat egories there were no statistically significant differences in mean PCS or MCS scores (Table 3).
To our knowledge, this is the first study assessing late ef fect burden in adult lymphoma survivors, including sever ity grading based on a comprehensive clinical assessment combined with patient-reported outcomes. The preva lence of late effects in this unselected cohort of longterm lymphoma survivors after HDT-ASCT was high, with almost all (98%) having at least one moderate or more se vere late effect and more than half having severe or life-
threatening late effect(s). The vast majority had multiple organ-systems affected, with about half of survivors hav ing a high late effect burden, defined as late effects in three or more of the 12 organ-system categories assessed. Both physical and mental HRQoL was reduced among sur vivors compared with that in the general population, and decreased with increasing late effect burden.
A high prevalence of late effects and high late effect burden among survivors after childhood cancer have pre viously been shown in several studies.18-20 Among 112 longterm survivors after pediatric stem cell transplantation (including 32 HDT-ASCT) from the St. Jude Lifetime Co hort Study cohort, Eissa et al. reported a prevalence of 100% of any grade 1-4 conditions, and 67% of grade 3-4 for those treated with HDT-ASCT.19 While their cohorts differ from ours in many aspects, in particular with regard to age at transplantation, attained age and follow-up time, the results are similar to ours (corresponding prevalence of 100% and 56%). Studies based on self-reports only have found lower prevalences of any grade and grade 3-4 late effects in survivors after hematopoietic stem cell trans plantation both in adults (61% and 16%, respectively after HDT-ASCT)29 and children.30
In line with previous findings, female sex, higher age and more treatment lines were associated with high late ef fect burden.21,22,29-32 In addition, presence of B-symptoms at diagnosis was also statistically significant in multivari able analysis, an association consistently observed with chronic fatigue.33 The reason for this is not clear, but could possibly be related to the intensity of primary treatment and/or to detrimental effects of inflammation. Supporting this, we found, in a previous study on this same cohort of
Number of organ-system categories with grade 2 or higher late effects per survivor. Green (0-1 organ system): low late effect burden (n=37); orange (2-3 organ systems): medium late effect burden (n=105); red (>3 organ systems): high late effect burden (n=129).
Figure

Table 2. Univariate and multivariable logistic regression analyses of potential factors associated with high late effect burden (n=129, 48%).
Female sex (ref. male)
Age at survey (years)
Time HDT-ASCT - survey (years)
Household income <600,000 NOK
B-symptoms at diagnosis
1.71 1.04-2.79 0.03 1.76 1.01-3.07 0.04
1.04 1.02-1.06 <0.001 1.05 1.02-1.07 <0.001
1.05 1.00-1.10 0.03 1.02 0.96-1.07 0.58
1.85 1.13-3.10 0.01 1.59 0.92-2.75 0.10
2.19 1.31-3.64 <0.01 2.56 1.39-4.69 <0.01
TBI high-dose regime (ref. BEAM) 2.10 1.03-4.24 0.04
Radiotherapy
Infradiaphragmatic radiotherapy
1.82 1.10-3.02 0.02 1.85 0.94-3.63 0.07
1.55 0.94-2.56 0.08
Mediastinal radiotherapy 1.55 0.94-2.55 0.08
>1 treatment line prior to HDT-ASCT 1.93 1.13-3.31 0.02 2.09 1.11-3.94 0.02
Cisplatin 3.06 0.80-11.8 0.10
Sedentary life stylea
1.83 1.12-2.98 0.02 1.49 0.86-2.59 0.15
Unhealthy alcohol consumptionb 3.33 1.03-10.7 0.04 1.51 0.41-5.60 0.54
High late effect burden is defined as grade 2 or more severe late effects in >3 organ-system categories. Variables with P≤0.15 in univariate analysis are shown. aLess than 150 min/week of moderate intensity or 75 min/week of vigorous intensity (WHO recommendation). bAlcohol consumption >6 or >12 alcohol units per week for women and men, respectively. OR: odds ratio; CI: confidence interval; HDT-ASCT: highdose therapy with autologous stem-cell transplantation; NOK: Norwegian krones; TBI: total body irradiation; BEAM: carmustine, etoposide, cytarabine and melphalan
long-term lymphoma survivors, increased serum levels of the pro-inflammatory cytokines interleukin-6 and inter leukin-1 receptor antagonist compared to the levels in controls from the general population, with an indepen dent association with chronic fatigue.8
Our study supports previous reports of reduced physical HRQoL in long-term lymphoma survivors relative to con trols from reference populations.24,34-36 We also found sig nificantly reduced mental HRQoL among the survivors, in line with the findings of some studies on other cancer survivor populations,24 but in contrast to most reports on lymphoma survivors.34-36 The negative effect on HRQoL seems to be driven by the late effect burden experienced by these survivors and, interestingly, even though all par ticipating survivors had at least one late effect, those with the lowest burden reported better physical HRQoL than controls from the reference population. In contrast, in the high late effect burden group, the prevalences of poor physical and mental HRQoL were both two to three times higher than those in controls. Similarly, it has previously been shown that multi-morbidity is associated with poorer physical and mental HRQoL,37,38 and that cancer survivors have better HRQoL than cancer-free patients with other chronic diseases.39
Different demographic and diagnosis- or treatment-re lated factors that have been associated with poor HRQoL in cancer survivors are largely non-modifiable. The indi vidual survivor’s late effect burden can, however, poten
tially be targeted by early detection and treatment of prevalent late effects of somatic, mental and psychosocial character and known risk factors. For example, exercise interventions are effective at reducing late effects such as chronic fatigue and cardiovascular disease40,41 and can improve quality of life.42 It has also been shown that im proved survivorship care, including the use of survivorship care plans based on risk factors and treatment exposures, can improve HRQoL in stem cell transplant survivors.43
The high late effect burden we observed in this cohort and its consequences in terms of reduced HRQoL calls for de velopment of structured follow-up programs for such heavily treated lymphoma survivors, including monitoring and management of late effects and modifiable risk fac tors. An important focus should be on patients’ education, lifestyle measures and tertiary prevention, and such pro grams should preferably be done in prospective interven tion studies to evaluate their effects. Besides physical activity, there is scarcity of studies documenting a positive impact of other lifestyle factors such as diet quality, weight loss and smoking cessation on late effects and HRQoL in lymphoma survivors.41 Future research should also focus on identifying underlying mechanisms for dif ferent common late effects, to increase our understanding and help guide future treatment decisions.
The completeness of the study population is a major strength of this study, with all lymphoma survivors treated with HDT-ASCT in Norway until 2008 being accounted for
Figure 3. Health-related quality of life and its association with late effect burden. (A) Mean physical composite scale (PCS) scores. (B) Percentage with poor physical health-related quality of life (HRQoL) (PCS score <40). (C) Mean mental composite scale (MCS) scores. (D) Percentage with poor mental HRQoL (MCS score <40), (E) Mean Short Form-36 domain scores for controls (gray) compared with all survivors (blue) and survivors with low late effect burden (green): grade 2 or more severe late effects in 0-1 organ-system categories, medium late effect burden (orange): grade 2 or more severe late effects in 2-3 organ-systems and high late effect burden (red): grade 2 or more severe late effects in >3 organ systems. PF: physical functioning; RP: role physical; BP: bodily pain; GH: general health; SF: social functioning; VT: vitality; RE: role emotional; MH: mental health, PCS: physical composite score, MCS: mental composite score. Statistically significant differences compared to controls denoted as *P<0.05, **P<0.01 and ***P<0.001.

Table 3. Physical composite scale and mental composite scale scores according to the presence or not of grade 2 or more severe late effect(s) in each organ-system category.
Endocrine
Cardiovascular
Neuro-/musculoskeletal
Pulmonary
Genital/sexual
Renal
Hematologic
Hearing
Second cancer
Chronic fatigue
Psychological
46.6 ± 10.3 44.4 ± 11.2 0.15 52.1 ± 10.7 51.7 ± 9.9 0.75
46.8 ± 9.8 43.8 ± 11.5 0.03 51.0 ± 10.3 52.2 ± 9.9 0.34
47.8 ± 9.9 41.8 ± 11.2 <0.001 51.6 ± 9.7 52.0 ± 10.4 0.31
46.8 ± 9.6 39.6 ± 12.8 <0.001 52.2 ± 9.5 50.6 ± 11.4 0.41
45.7 ± 10.7 43.7 ± 11.3 0.17 51.7 ± 10.3 51.9 ± 9.7 0.93
45.3 ± 11.0 41.8 ± 10.5 0.12 51.5 ± 10.2 54.9 ± 8.6 0.26
45.1 ± 11.0 39.0 ± 9.6 0.18 52.9 ± 10.0 47.3 ± 11.1 0.27
45.2 ± 10.9 43.6 ± 11.4 0.42 51.6 ± 10.2 52.9 ± 9.1 0.42
45.3 ± 10.9 42.3 ± 11.4 0.15 51.7 ± 10.0 52.1 ± 10.4 0.85
48.9 ± 8.6 36.7 ± 10.9 <0.001 54.2 ± 8.3 46.5 ± 11.4 <0.001
46.4 ± 10.5 30.4 ± 11.0 <0.001 55.3 ± 6.9 40.4 ± 11.0 <0.001
PCS: physical composite scale; MCS: mental composite scale score.
and invited to participate. Of the eligible survivors, 68% completed both the clinical examination and the ques tionnaire, and these individuals did not differ from nonparticipants in attrition analysis, strengthening the external validity and generalizability of our results. Fur thermore, detailed and high quality real-world data from hospital records combined with objectively measured findings of clinical examinations and patient-reported outcome measures ensure a thorough assessment of most common late effects. Having matched controls from the background population for comparison of SF-36 data collected at a similar time is another strength. Not having normative controls for the late effect burden, however, is a limitation. Prevalent late effects observed in this study are common conditions also in the general population. However, as only patients who are medically fit and without serious co-morbidities are considered eligible for HDT-ASCT, the participants would probably be healthier than the general population before their lymphoma diagnosis and treatment. This could also explain the better physical HRQoL seen in sur vivors than in controls. We have previously published more in-depth analyses on separate late effects in this same cohort of lymphoma survivors showing higher prevalences of chronic fatigue,8 cardiac disorders,13-15 pul monary and cardiorespiratory fitness impairments9,10,12 and sexual dysfunction6,7 than seen in the general population. On the other hand, the prevalence of osteoporosis was similar11 and the state of being overweight/obese was less prevalent than in matched normative controls.44 With 57% of survivors having a body mass index >25, being over weight/obese was still the most common separate grade 2 or more severe condition observed. Another limitation
of the study was the cross-sectional design, with lack of pre-diagnostic and pretreatment data, which precludes causal conclusions.
The time period over which the survivors received treat ment and HDT-ASCT is extensive and lymphoma therapy has evolved considerably, including less use of radiother apy, especially for Hodgkin lymphoma, and significant im provements in treatment strategies and supportive care, as well as changing indications and selection for HDTASCT. Total body irradiation was used as the high-dose regimen in the first period (1987-1995) only, when the role of HDT-ASCT was less defined and performed in clinical trials, with more stringent eligibility criteria. It is not poss ible to separate the contribution of total body irradiation itself from longer observation time, and both variables could not be included in the same multivariable analysis, but neither was significantly associated with high late ef fect burden when entered separately in the multivariable model. However, we have previously shown a significant association between total body irradiation/early treatment period with separate late effects, including second cancer4 and cardiac repercussions.13,15
In conclusion, we present a comprehensive overview of the total late effect burden in a real-world complete na tional cohort of lymphoma survivors treated with HDTASCT. Most survivors have a significant late effect burden and experience several different moderate or more severe late effects, affecting their HRQoL. This highlights the im portance of efforts to prevent and treat any late effect or chronic condition of somatic or psychosocial character experienced by heavily treated cancer survivors. This could include risk-stratified survivorship surveillance and survivorship care incorporating a focus on lifestyle and
health-related behaviors and enabling early detection and management of conditions amenable to interventions.
No conflicts of interest to disclose.
KS, CEK, JHL, HH and SK: conception and design of the study; KS, UMF, HB, MJH, KM, MDL, OF, JSS, MBL, SK and
1. Passweg JR, Baldomero H, Chabannon C, et al. Hematopoietic cell transplantation and cellular therapy survey of the EBMT: monitoring of activities and trends over 30 years. Bone Marrow Transplant. 2021;56(7):1651-1664.
2. Smeland KB, Kiserud CE, Lauritzsen GF, et al. High-dose therapy with autologous stem cell support for lymphoma in Norway 1987-2008. Tidsskr Nor Laegeforen. 2013;133(16):1704-1709.
3. Smeland KB, Kiserud CE, Lauritzsen GF, et al. Conditional survival and excess mortality after high-dose therapy with autologous stem cell transplantation for adult refractory or relapsed Hodgkin lymphoma in Norway. Haematologica. 2015;100(6):e240-243.
4. Smeland KB, Kiserud CE, Lauritzsen GF, et al. A national study on conditional survival, excess mortality and second cancer after high dose therapy with autologous stem cell transplantation for non-Hodgkin lymphoma. Br J Haematol. 2016;173(3):432-443.
5. Myers RM, Hill BT, Shaw BE, et al. Long-term outcomes among 2-year survivors of autologous hematopoietic cell transplantation for Hodgkin and diffuse large B-cell lymphoma. Cancer. 2018;124(4):816-825.
6. Bersvendsen HS, Haugnes HS, Dahl AA, et al. Sexual dysfunction is prevalent in female lymphoma survivors after autologous stem-cell transplantation and is associated with younger age, chronic fatigue, and mental distress. Bone Marrow Transplant. 2021;56(4):968-970.
7. Bersvendsen HS, Haugnes HS, Dahl AA, et al. Sexual function in long-term male lymphoma survivors after high-dose therapy with autologous stem-cell transplantation. Bone Marrow Transplant. 2020;55(5):891-905.
8. Smeland KB, Loge JH, Aass HCD, et al. Chronic fatigue is highly prevalent in survivors of autologous stem cell transplantation and associated with IL-6, neuroticism, cardiorespiratory fitness, and obesity. Bone Marrow Transplant. 2019;54(4):607-610.
9. Stenehjem JS, Smeland KB, Murbraech K, et al. Obstructive and restrictive pulmonary dysfunction in long-term lymphoma survivors after high-dose therapy with autologous stem cell transplantation. Acta Oncol. 2018;57(6):773-781.
10. Stenehjem JS, Smeland KB, Murbraech K, et al. Diffusing capacity impairment is prevalent in long-term lymphoma survivors after high-dose therapy with autologous stem cell transplantation. Bone Marrow Transplant. 2017;52(4):646-649.
11. Seland M, Smeland KB, Bjoro T, et al. Bone mineral density is close to normal for age in long-term lymphoma survivors treated with high-dose therapy with autologous stem cell transplantation. Acta Oncol. 2017;56(4):590-598.
12. Stenehjem JS, Smeland KB, Murbraech K, et al.
CEK: data collection and assembly; KS, JHL, CEK, MBL and HH: data analysis and interpretation. All authors took part in writing the manuscript and reviewed and approved the final version.
The data that support the findings of this study are available from the corresponding author upon reasonable request.
Cardiorespiratory fitness in long-term lymphoma survivors after high-dose chemotherapy with autologous stem cell transplantation. Br J Cancer. 2016;115(2):178-187.
13. Murbraech K, Wethal T, Smeland KB, et al. Valvular dysfunction in lymphoma survivors treated with autologous stem cell transplantation: a national cross-sectional study. JACC Cardiovasc Imaging. 2016;9(3):230-239.
14. Murbraech K, Holte E, Broch K, et al. Impaired right ventricular function in long-term lymphoma survivors. J Am Soc Echocardiogr. 2016;29(6):528-536.
15. Murbraech K, Smeland KB, Holte H, et al. Heart failure and asymptomatic left ventricular systolic dysfunction in lymphoma survivors treated with autologous stem-cell transplantation: a national cross-sectional study. J Clin Oncol. 2015;33(24):2683-2691.
16. Majhail NS, Ness KK, Burns LJ, et al. Late effects in survivors of Hodgkin and non-Hodgkin lymphoma treated with autologous hematopoietic cell transplantation: a report from the bone marrow transplant survivor study. Biol Blood Marrow Transplant. 2007;13(10):1153-1159.
17. Georges GE, Bar M, Onstad L, et al. Survivorship after autologous hematopoietic cell transplantation for lymphoma and multiple myeloma: late effects and quality of life. Biol Blood Marrow Transplant. 2020;26(2):407-412.
18. Suh E, Stratton KL, Leisenring WM, et al. Late mortality and chronic health conditions in long-term survivors of earlyadolescent and young adult cancers: a retrospective cohort analysis from the Childhood Cancer Survivor Study. Lancet Oncol. 2020;21(3):421-435.
19. Eissa HM, Lu L, Baassiri M, et al. Chronic disease burden and frailty in survivors of childhood HSCT: a report from the St. Jude Lifetime cohort study. Blood Adv. 2017;1(24):2243-2246.
20. Hudson MM, Ehrhardt MJ, Bhakta N, et al. Approach for classification and severity grading of long-term and late-onset health events among childhood cancer survivors in the St. Jude Lifetime cohort. Cancer Epidemiol Biomarkers Prev. 2017;26(5):666-674.
21. Geenen MM, Cardous-Ubbink MC, Kremer LC, et al. Medical assessment of adverse health outcomes in long-term survivors of childhood cancer. JAMA. 2007;297(24):2705-2715.
22. Oeffinger KC, Mertens AC, Sklar CA, et al. Chronic health conditions in adult survivors of childhood cancer. N Engl J Med. 2006;355(15):1572-1582.
23. Cella DF, Bonomi AE. Measuring quality of life: 1995 update. Oncology (Williston Park). 1995;9(11 Suppl):47-60.
24. Firkins J, Hansen L, Driessnack M, Dieckmann N. Quality of life in "chronic" cancer survivors: a meta-analysis. J Cancer Surviv. 2020;14(4):504-517.
25. Khimani N, Chen YH, Mauch PM, et al. Influence of new late effects on quality of life over time in Hodgkin lymphoma survivors: a longitudinal survey study. Ann Oncol. 2013;24(1):226-230.
26. Eikeland SA, Smeland KB, Mols F, et al. Chemotherapy-induced peripheral neuropathy after modern treatment of Hodgkin's lymphoma; symptom burden and quality of life. Acta Oncol. 2021;60(7):911-920.
27. Seland M, Holte H, Bjoro T, et al. Chronic fatigue is prevalent and associated with hormonal dysfunction in long-term nonHodgkin lymphoma survivors treated with radiotherapy to the head and neck region. Leuk Lymphoma. 2015;56(12):3306-3314.
28. Jacobsen EL, Bye A, Aass N, et al. Norwegian reference values for the Short-Form Health Survey 36: development over time. Qual Life Res. 2018;27(5):1201-1212.
29. Sun CL, Francisco L, Kawashima T, et al. Prevalence and predictors of chronic health conditions after hematopoietic cell transplantation: a report from the Bone Marrow Transplant Survivor Study. Blood. 2010;116(17):3129-3139.
30. Armenian SH, Sun CL, Kawashima T, et al. Long-term healthrelated outcomes in survivors of childhood cancer treated with HSCT versus conventional therapy: a report from the Bone Marrow Transplant Survivor Study (BMTSS) and Childhood Cancer Survivor Study (CCSS). Blood. 2011;118(5):1413-1420.
31. Oeffinger KC, Stratton KL, Hudson MM, et al. Impact of riskadapted therapy for pediatric Hodgkin lymphoma on risk of long-term morbidity: a report from the Childhood Cancer Survivor Study. J Clin Oncol. 2021;39(20):2266-2275.
32. Khera N, Storer B, Flowers ME, et al. Nonmalignant late effects and compromised functional status in survivors of hematopoietic cell transplantation. J Clin Oncol. 2012;30(1):71-77.
33. Hjermstad MJ, Fossa SD, Oldervoll L, Holte H, Jacobsen AB, Loge JH. Fatigue in long-term Hodgkin's disease survivors: a follow-up study. J Clin Oncol. 2005;23(27):6587-6595.
34. Yen HJ, Eissa HM, Bhatt NS, et al. Patient-reported outcomes in survivors of childhood hematologic malignancies with hematopoietic stem cell transplant. Blood. 2020;135(21):1847-1858.
35. Linendoll N, Saunders T, Burns R, et al. Health-related quality of life in Hodgkin lymphoma: a systematic review. Health Qual Life
Outcomes. 2016;14(1):114.
36. Oerlemans S, Mols F, Nijziel MR, Lybeert M, van de Poll-Franse
LV. The impact of treatment, socio-demographic and clinical characteristics on health-related quality of life among Hodgkin's and non-Hodgkin's lymphoma survivors: a systematic review. Ann Hematol. 2011;90(9):993-1004.
37. Huang IC, Hudson MM, Robison LL, Krull KR. Differential impact of symptom prevalence and chronic conditions on quality of life in cancer survivors and non-cancer individuals: a population study. Cancer Epidemiol Biomarkers Prev. 2017;26(7):1124-1132.
38. Weaver KE, Forsythe LP, Reeve BB, et al. Mental and physical health-related quality of life among U.S. cancer survivors: population estimates from the 2010 National Health Interview Survey. Cancer Epidemiol Biomarkers Prev. 2012;21(11):2108-2117.
39. Heins MJ, Korevaar JC, Hopman PE, Donker GA, Schellevis FG, Rijken MP. Health-related quality of life and health care use in cancer survivors compared with patients with chronic diseases. Cancer. 2016;122(6):962-970.
40. Mustian KM, Alfano CM, Heckler C, et al. Comparison of pharmaceutical, psychological, and exercise treatments for cancer-related fatigue: a meta-analysis. JAMA Oncol. 2017;3(7):961-968.
41. Minoia C, Gerardi C, Allocati E, et al. The impact of healthy lifestyles on late sequelae in classical Hodgkin lymphoma and diffuse large B-cell lymphoma survivors. A systematic review by the Fondazione Italiana Linfomi. Cancers (Basel). 2021;13(13):3135
42. Prins MC, van Hinte G, Koenders N, Rondel AL, Blijlevens NMA, van den Berg MGA. The effect of exercise and nutrition interventions on physical functioning in patients undergoing haematopoietic stem cell transplantation: a systematic review and meta-analysis. Support Care Cancer. 2021;29(11):7111-7126.
43. Majhail NS, Murphy E, Laud P, et al. Randomized controlled trial of individualized treatment summary and survivorship care plans for hematopoietic cell transplantation survivors. Haematologica. 2019;104(5):1084-1092.
44. Bersvendsen HS, Haugnes HS, Fagerli UM, et al. Lifestyle behavior among lymphoma survivors after high-dose therapy with autologous hematopoietic stem cell transplantation, assessed by patient-reported outcomes. Acta Oncol. 2019;58(5):690-699.
1Department of Radiology and Nuclear Medicine, Amsterdam University Medical Centers, Amsterdam, the Netherlands; 2C.J. Gorter Center for High Field MRI, Department of Radiology, Leiden University Medical Center, Leiden, the Netherlands; 3Division of Cardiology, Children’s Hospital Los Angeles, Keck School of Medicine, University of Southern California, Los Angeles, CA, USA and 4Department of Hematology, Amsterdam University Medical Centers, Amsterdam, the Netherlands
#HJMMM and AS contributed equally as co-senior authors.
Correspondence: A. Schrantee a.g.schrantee@amsterdamumc.nl
Received: October 19, 2021.
Accepted: May 5, 2022.
Prepublished: May 12, 2022.
https://doi.org/10.3324/haematol.2021.280183
©2022 Ferrata Storti Foundation
Published under a CC BY-NC license
Silent cerebral infarcts (SCI) are common in patients with sickle cell disease (SCD) and are thought to be caused by a mismatch between oxygen delivery and consumption. Functional cerebrovascular shunting is defined as reduced oxygen offloading due to the rapid transit of blood through the capillaries caused by increased flow and has been suggested as a potential mechanism underlying reduced oxygenation and SCI. We investigated the venous arterial spin labeling signal (VS) in the sagittal sinus as a proxy biomarker of cerebral functional shunting, and its association with hemodynamic im aging and hematological laboratory parameters. We included 28 children and 38 adults with SCD, and ten healthy racematched adult controls. VS, cerebral blood flow (CBF), velocity in the brain feeding arteries, oxygen extraction fraction (OEF) and cerebral metabolic rate of oxygen (CMRO2) were measured before and after acetazolamide administration. VS was higher in patients with SCD compared to controls (P<0.01) and was increased after acetazolamide administration in all groups (P<0.01). VS was primarily predicted by CBF (P<0.01), but CBF-corrected VS was also associated with decreased CMRO2 (P<0.01). Additionally, higher disease severity defined by low hemoglobin and increased hemolysis was associated with higher CBF-corrected VS. Finally, CMRO2 was negatively correlated with fetal hemoglobin, and positively correlated with lactate dehydrogenase, which could be explained by changes in oxygen affinity. These findings provide evidence for cerebral functional shunting and encourage future studies investigating the potential link to aberrant capillary exchange in SCD.
Sickle cell disease (SCD) is characterized by chronic hemolytic anemia resulting in organ damage including si lent cerebral infarcts (SCI).1,2 SCI are associated with cog nitive impairment at an early stage in life, which can result in under- and unemployment as well as lower quality of life.2,3 SCI are primarily localized in deep white matter and are hypothesized to be a result of impaired oxygen de livery.4–6 In order to maintain brain oxygenation, cerebral blood flow (CBF) is increased in patients with SCD.7–9 However, despite the preservation of normal global oxygen delivery at rest,10 the incidence of SCI continues to rise throughout the lifetime of these patients and is prevalent in more than 50% of adult SCD patients by the age of 32 years.11 One potential pathophysiological mechanism that has been proposed suggests that SCI result from localized
impairments in oxygen delivery caused by cerebral func tional shunting.10,12,13 Cerebral functional shunting is defined as the rapid transit of blood through the brain capillaries as a result of increased flow, limiting offloading of oxygen to the tissue.13 However, functional shunting is difficult to assess and more insight into this process is required to understand the underlying cerebral hemodynamics in SCD.
Arterial spin labeling (ASL) magnetic resonance imaging (MRI) is widely used in research settings as a non-invasive technique for cerebral perfusion measurements in pa tients with SCD.9,14,15 ASL applies radiofrequency pulses in the brain feeding arteries that change the magnetization of blood, also known as labeling. Following labeling, the blood travels to the brain and a labeled image is acquired. The same procedure is repeated without labeling to ac quire a control image. By subtracting the labeled image
from the control image, a quantitative perfusion map is obtained. A requirement of ASL is that images are acquired after a predefined delay (post-label delay), allowing the la beled blood to travel to the capillary bed, and for the la beled spins to enter the tissue. The difference between labeled spins detected in arterial and venous circulations represents spins that have exchanged with the brain par enchyma.16 According to the Renkin-Crone model, which re lates blood flow to extraction fraction, the amount of unexchanged labeled spins in the venous outflow, i.e., the venous signal (VS), will increase approximately propor tionally with CBF.17,18 However, in the presence of cerebral functional shunting, a larger volume of the labeled blood will pass unexchanged through the capillaries and may ar rive on the venous side at the time of imaging. Indeed, a previous study demonstrated that, with longer post-label delays, the VS in the sagittal sinus can be used to inform on the exchange of spins at the capillary level.16 As such, VS may provide additional hemodynamic information about oxygen utilization at the capillary level, which may be af fected in patients with SCD.
Support for this hypothesis comes from prior work in SCD patients.13,19,20 Juttukonda et al.13,20 observed the presence of ASL signal in the venous sinuses at a regular post-label delay (1,900 ms), which was associated with increased CBF and elevated velocities in the carotid arteries. When administered to adult patients with SCD, acetazolamide (ACZ; a compound that induces vasodilation and in creased CBF) led to observed reductions in oxygen extraction fraction (OEF) as well as the cerebral metabolic rate of oxygen (CMRO2),10 indicating that oxygen consump tion can actually deteriorate despite increasing oxygen delivery. Moreover, in SCD patients with SCI, an inverse relation between VS scores and OEF was found, providing support for a mechanism involving functional shunting.20 However, whether VS relates to cerebral functional shunt ing and could therefore be a marker of capillary oxygen exchange efficiency in SCD patients, remains to be inves tigated.
Therefore, in the present study, we investigated cerebral functional shunting in patients with SCD, by examining the relationship between VS and cerebrovascular imaging par ameters of perfusion, cerebral oxygen extraction and me tabolism as well as laboratory measures. In order to directly probe the VS-CBF relationship, we studied the im aging parameters both before and after ACZ administra tion in adult participants.
The data were obtained from two studies6,21 (one adult and one pediatric study) that were approved by the medical ethics committee of Academic Medical Center in Amster
dam and performed in accordance with the Declaration of Helsinki. Written informed consent was obtained from all adults and from parents/legal guardians of participants in the pediatric study cohort. Sixty-six patients with SCD (59 HbSS and 7 HbSβ0thalassemia) were recruited from hematology outpatient clinics.6,21 Additionally, ten healthy adult race-matched controls (8 HbAA and 2 HbAS) were recruited. Exclusion criteria were MRI contraindications, history of cerebral pathology, sickle cell crisis at inclusion, hospitalization 1 month prior to the study day, pregnancy, and ACZ contraindications for adult participants.
Images were acquired on two 3.0 T MRI systems (Philips Intera and Ingenia, Philips Healthcare, Best, the Nether lands) with an 8-channel head coil for pediatric patients and a 32-channel head coil for adults. Prior to MRI, blood was drawn to quantify hematological laboratory par ameters (for details, see the Online Supplementary Appen dix). Anatomical sequences included a 2D T2-weighted and a 2D fluid-attenuated inversion recovery (FLAIR) scan for children and 3D FLAIR for adult participants were used for lesion and gray matter segmentation, and registration pur poses.
For VS and CBF measurements, pseudo-continuous arter ial spin labeling (pCASL) was used (Table 1). Adult partici pants received intravenous ACZ (16 mg/kg with a maximum of 1,400 mg) 10 minutes prior to the second ASL scan.
In order to obtain venous saturation for OEF measure ments in adult participants’ pre- and post-ACZ, T2-pre pared tissue Relaxation with an Inversion Recovery MRI (T2-TRIR) sequence22 was used. Finally, to obtain velocity measurements in the brain feeding arteries, a 2D phasecontrast single-shot gradient-echo T1 FFE sequence was acquired both pre- and post-ACZ (Table 1) (for more de tails on the acquisition parameters, see the Online Sup plementary Appendix).
VS was assessed both qualitatively and quantitatively. Qualitatively, ASL images were visually inspected by an observer (LA) for the presence or absence of the venous ASL signal. Quantitatively, we scaled the perfusionweighted signal (control-label) from the ASL images, by the group-based T1 of blood (patients = 1,818 ms23 and controls = 1,650 ms24), subject-specific estimates of labe ling efficiency based on velocity,25 and M0 in ExploreASL.26 The superior sagittal sinus and straight sinus were man ually segmented in three group-average (children and adults with SCD and healthy control group) images of all participants in standard MNI space27 (Figure 1). The seg mented average image of each group was resampled to the native ASL space of each individual and used as an

ASL mask from which the average VS is measured. In case the segmented venous sinuses were not correctly aligned after resampling, manual correction was applied to only include the VS. In addition, subject-specific gray matter masks were used in the native space to measure the mean signal in the GM. For the comparison between children and adults, the proportion of signal in the venous regions of interest (ROI) relative to GM was calculated in the VS images (VS/GM). This ratio is referred to as VGR henceforth. Taking the ratio rather than VS cancels out global physiological perfusion confounders and imaging
acquisition differences and allows a comparison between the pediatric and adult group. However, the VS was used to study the associations between VS and other hemody namic parameters within each group.
CBF, OEF and CMRO2 were calculated as described in the previous studies10,21 and are illustrated in Figure 2 and de scribed in the Online Supplementary Appendix, together with the analysis of the velocity in the brain feeding ar teries. White matter lesions were delineated on FLAIR im ages using manual segmentation and quantified as previously described.6,21
Figure 2. Visual representation of the image analysis steps. Left: the arterial spin labeling (ASL) signal was obtained by subtracting the control images from the labeled images. Cerebral blood flow (CBF) was then quantified using the dual compartment model and the obtained CBF image was multiplied by the gray matter (GM) mask (created from anatomical images not shown here) to obtain the GM CBF image. CBF images were also used for venous signal assessment. Right: T2-prepared tissue relaxation with an inversion recovery magnetic resonance imaging (T2-TRIR) images were used to obtain the T1 and T2 values of venous blood. An automatic localizer tool was used to detect the region of interest in the posterior part of the brain (in red). This tool searched for high-intensity signals in the last 7 phases of the magnitude reconstructed T2-TRIR data to detect the sagittal sinus. Sub sequently, a fit was initiated in the sagittal sinus voxels (shown in green on the mask image). The fitted T1 values were used for CBF quantification in adults and the fitted T2 values were converted to venous oxygen saturation using the hemoglobin A (HbA) and HbS calibration models. Subsequently, the venous oxygen saturation and arterial oxygen saturation (assumed to be 0.98) were used to calculate the oxygen extraction fraction (OEF). CMRO2 was obtained by multiplying the OEF by the CBF and oxygencarrying capacity (CaO2). For details, see the Online Supplementary Appendix. ATT: arterial transit time.

Statistical analyses were performed in SPSS v26 (IBM, NY, USA). P<0.05 was considered statistically significant. In dependent t -tests and paired-sample t -tests (or nonparametric alternatives in case of non-normality) were performed to test differences between the groups and to test the statistical differences of VGR before and after ACZ administration. We performed the correlation analy sis to assess the relationship between VS and CBF. In order to test if VS contained additional hemodynamic in formation independently from CBF, the residuals of the regression between VS and CBF (VSCBF) were used as the dependent variable in stepwise multiple linear regression analyses against age, sex, participant groups, hydroxy
Table
urea, hemoglobin (Hb; as a measure of anemia) and lac tate dehydrogenase (LDH) (as a measure of hemolysis) for the baseline data. In order to test the role of oxygen me tabolism and ACZ on VS in adult participants, linear mixed-effects modeling was performed, in which OEF, CMRO2 and ACZ condition were added as additional pre dictors.
In order to further explore the relationship between par ameters of oxygen metabolism and hemodynamic and laboratory parameters in adult SCD patients, we per formed linear mixed-effects modeling with CMRO2, cor rected for VSCBF as the dependent variable. The predictors tested in the model were CBF, VS, Hb, LDH, HbF, and ACZ condition.
clinical and imaging summary of participants.
Pediatric SCD Adult SCD Controls P-value N=28 N=38 N=10 PSCD vs. ASCD ASCD vs. CTL Demographics
Age in years, mean ± SD 12.7 ± 2.3 32.1 ± 11.2 36.4 ± 15.9 < 0.01 0.74
Female, N (%) 9 (32%) 14 (37%) 4 (40%) 0.69 0.85
Hemoglobin, gr/dL, mean ± SD 8.4 ± 1.1 8.8 ± 1.4 13.9 ± 1.2 0.14 < 0.01
Hematocrit, %, mean ± SD 23 ± 3 26 ± 4 42 ± 3 < 0.01 < 0.01
Reticulocytesx 10e9/L, mean ± SD 277.7 ± 106.7 260.2 ± 108.2 63.1 ± 24.4 0.60 < 0.01
LDH, U/L 37°C, mean ± SD 514 ± 110 460 ± 160 181 ± 41 0.12 < 0.01
Total Bilirubin, mg/dL, mean ± SD 3.5 ± 2.2 3.5 ± 2.8 0.7 ± 0.48 0.85 < 0.01
HbF, %, mean ± SD 9.8 ± 5.1 9.1 ± 7.6 0.20
HbS, %, ± DS 85.8 ± 4.6 80.4 ± 15.1 37.0 ± 0.4 0.52 0.02
Hydroxyurea, N of patients (%) 9 (32%) 15 (39%) 0.44 Ex transfusions N of patients (%) 3 (8%)
CBFGM, mL/100 gr/min, mean ± SD pre-ACZ post-ACZ 96.8 ± 14.7 85.8 ± 15.4 113.3 ± 22.0 52.7 ± 3.15 88.9 ± 9.9 < 0.01 < 0.01 < 0.01
VGR, mean ± SD pre-ACZ post-ACZ 2.4 ± 0.8 2.0 ± 0.9 2.8 ± 0.7 0.6 ± 0.5 2.0 ± 0.6 0.08 < 0.01 < 0.01
Weighted velocity, cm/s, mean ± SD pre-ACZ post-ACZ 27.5 ± 5.3 24.5 ± 4.7 30.7 ± 5.0 17.5 ± 2.6 24.2 ± 4.9 0.03 < 0.01 < 0.01
OEF, %, mean ± SD pre-ACZ post-ACZ 27.2 ± 4.4 19.0 ± 5.8 35.4 ± 3.4 20.1 ± 7.6 < 0.01 0.64
CMRO2 ,μmol O2/100 g/min, mean ± SD pre-ACZ post-ACZ
< 0.01 0.01 Lesion volume, mL, mean ± SD
20.3
<0.01 0.03 Lesion presence, N (%)
(61%)
(82%)
(80%) 0.06 0.91
P-values were calculated using independent-sample t-tests or Mann-Whitney test in case of non-normality, or Pearson’s Chi-square test for categorical variables. PSCD: pediatric sickle cell disease (SCD); ASCD: adult SCD; CTL: control; F: female; LDH: lactate dehydrogenase; Hb: hemoglobin; CBF: cerebral blood flow; GM: gray matter; ACZ: acetazolamide; VS: venous signal; VGR: VS to gray matter signal ratio; OEF: oxygen extraction fraction; CMRO2: cerebral metabolic rate of oxygen.
Demographic, clinical and imaging parameters of 28 pedi atric patients with SCD, 38 adult patients and ten healthy controls are presented in Table 2. The Online Supplemen tary Table S1 shows the available sample size for each in cluded parameter. Of this sample, nine (32%) pediatric and 15 (39%) adult patients were using hydroxyurea. In the adult SCD group, three (8%) patients received regular blood exchange transfusions and were studied 3-28 days since their last transfusion.
Venous ASL signal was observed in 27 (96%) pediatric pa tients, 36 (95%) adult patients and one (10%) healthy con trol. After ACZ administration, VS was observed in all adult participants (Figure 3A). VGR was significantly higher in patients compared to controls (Z=-4.24, P<0.01), but not between pediatric and adult SCD patients (t=-1.78, P=0.08) (Figure 3B). After ACZ administration, VGR increased in adult patients (t=-6.10, P<0.01) and controls (Z=2.80, P<0.01) compared to baseline VGR (Figure 3B). No signifi cant VGR differences were found between patients receiv ing hydroxyurea and those not receiving this intervention.

We observed a positive relationship between baseline CBF and baseline VS (R2=0.59; F(1,73)=104.4, P<0.001; Figure 4A). After ACZ administration, these associations remained significant (R2=0.57; F(1,45)=59.4, P<0.001; Figure 4B). No significant association was found between VS and lesion volume in patients with SCD ( β =-0.002 P=0.89). Sub
sequently, we tested associations with baseline VSCBF in all participants. Stepwise multiple regression analysis demonstrated significant associations with Hb (β=-0.26, P<0.001) and participant group ( β =0.55, P=0.004; total model R2=0.23). Subsequent analyses demonstrated a negative correlation between Hb and VSCBF in the com bined patient groups ( β =-0.45, P<0.001), but not in the control group (β=0.02, P=0.85) (Figure 5A). After splitting the patient groups, the association between Hb and VSCBF remained significant in both adults (β=-0.43, P<0.001) and children (β=-0.45, P=0.02) with SCD.
For adult participants, we added OEF, CMRO2 and ACZ condition as additional parameters and used a linear mixed model to accommodate the repeated measures de pendencies. The strongest predictor of VSCBF was CMRO2 (β=-0.79, F(1,81)=-24.5, P<0.001), demonstrating that sub jects with lower CMRO2 showed higher VS, independent of CBF (Figure 5B). Subsequently, participant group (adult SCD vs. controls) in combination with either Hb (model 1) or LDH (model 2) were significant additional predictors (model 1: CMRO2 β=-0.75, F(1,82)=19.8, P<0.001 / group β=69.6, F(1,72)=11.5, P=0.001 / Hb β=-11.6, F(1,78)=11.7, P=0.001; model 2: CMRO2 β=-0.92, F(1,78)=27.8, P<0.001 / group β=40.1, F(1,78)=5.4, P=0.023 / LDH β =0.11, F(1,79)=10.0, P=0.002). When splitting the group into SCD adults and controls, we observed that in addition to CMRO2, Hb and LDH were significant independent predictors of VSCBF in patients (but not in controls) with Hb being a negative predictor (β=-14.2, P<0.001) and LDH being a positive pre dictor (β=0.13, P=0.002). We repeated our statistical ana lyses excluding the three patients receiving exchange transfusion and found comparable results.
FigureIn order to assess further contributing factors to CMRO2 in SCD patients, we explored the relationships between CMRO2 and the various hemodynamic and hematological markers. Linear mixed modeling demonstrated that HbF and LDH were significant predictors of CMRO2 when cor rected for VSCBF. Higher HbF was associated with lower CMRO2 (β=-1.4, F(1,56)=23.4, P<0.001) and higher LDH was associated with higher CMRO2 ( β =0.05, F(1,61)=8.5, P=0.005). As HbF is increased by hydroxyurea, we further split the data into hydroxyurea and no hydroxyurea groups to investigate its effects. The associations between HbF and CMRO2, and LDH and CMRO2 were similar across both groups.
The purpose of this study was to investigate cerebral functional shunting in patients with SCD, by means of ex ploring the relationship between the VS intensity in ASL images and cerebral circulation and oxygen metabolism. Our results confirmed prior observations of higher VS in patients with SCD compared to healthy controls, although no differences between pediatric and adult patients were observed. Our VS data showed a strong association with CBF, confirming that venous outflow is indeed strongly dependent on the inflow to the brain. A key finding of this study was that the CBF-corrected VS was negatively as sociated with CMRO2, demonstrating that VS contains im portant information about microvascular oxygen offloading, providing evidence for functional shunting. Ad ditionally, higher disease severity, as reflected by more se vere anemia and hemolysis was, independently of CBF, associated with higher VS. Finally, in addition to potential cerebral shunting mechanisms in SCD patients, we found that CMRO2 was further negatively correlated with HbF
and positively correlated with LDH. The oxygen-carrying capacity of blood in patients with SCD is reduced and as a result, compensatory increases of CBF are observed.7–9 Previous studies using both con tinuous and categorical estimates of VS13,28,29 observed that higher perfusion in SCD patients results in the pres ence of venous ASL signal at standard post-label delays, and the results of the current study corroborate these findings. In addition to CBF, microvascular permeability affects the fraction of labels arriving in the venous si nuses. In case of endothelial dysfunction, the permeabil ity-surface area product (PS), defined as the flow of molecules through the capillary membranes in a certain volume of tissue, may be altered. At physiologically plaus ible CBF levels and in subjects with intact microvascula ture, labeled spins enter the tissue and barely any VS is observed (Figure 6A). In case of increased CBF (e.g., after ACZ administration) and intact PS, VS can be observed in the brain (Figure 6B). However, at elevated CBF with low PS, we expect more labeled spins to pass unexchanged into the cerebral venous circulation (Figure 6C), a process we refer to as microvascular shunting. Importantly, our current findings provide empirical evidence for shunting, by showing that higher VS (independently of CBF) is as sociated with lower CMRO2. Our results are concordant with decreased OEF values observed in SCD patients with categorically increased venous signal scores.20 Taken to gether, these data suggest that the venous signal, beyond that expected for a given CBF, is a biomarker of cerebral functional shunting, which might be a result of PS reduc tion.
The inverse relation between CBF and the parameters OEF and CMRO2 in chronic anemia might seem paradoxical, but can be explained by physiological mechanisms at the cap illary level. Low Hb levels trigger reciprocal increases in CBF to preserve resting oxygen delivery. However, elevated
Figure 4. Association between ve nous signal and cerebral blood flow.
Scatterplots of massociations be tween venous signal (VS) and gray matter cerebral blood flow (CBF) be fore (left) and after (right) acetazola mide (ACZ). SCD: sickle cell disease administration.

CBF results in decreased capillary transit times, poten tially promoting trans-capillary pressure, and increasing heterogeneity in transit times across capillaries in the vascular bed.30,31 As oxygen extraction is dependent on the time the blood resides in the capillary network, elevated CBF can result in lower OEF and CMRO2. However, it is im portant to consider our findings with respect to the exist ing body of literature. Studies using T2-relaxationunder-spin-tagging (TRUST) have shown increased, unaf fected or decreased OEF values in patients with SCD compared to controls,13,19,20,32,33 depending on the calibra tion model used for the SCD patients. Inconsistent OEF values were also found using other techniques, with a previous PET study showing no differences in OEF and CMRO2 between patients and controls,7 whereas studies applying susceptibility MRI techniques reported both in creased or decreased OEF values in SCD patients.34–36 Our findings cannot be fully attributed to microvascular shunting per se, as we did not assess shunting locally at the capillary level, but rather used VS as a proxy. Never theless, although anatomical shunts in this population have been reported,37,38 microvascular shunting seems the most likely explanation, given the relation between VS and CMRO2 in the current study, and a previous report showing a reduction of VS after blood transfusion.39 Interestingly, a very recent study using multi-TI ASL showed that de spite lower bolus arrival times in the tissue, much longer arrival times were found in the sagittal sinus of patients with SCD compared to controls, suggesting that hyper perfusion in the arterial tree may be accompanied by al
tered capillary and/or venular micro-circulatory flow pat terns, potentially due to microvascular resistance.29 Fu ture studies are needed to further elucidate these processes in SCD at the capillary level.
Increased VS beyond that expected for a given CBF (VSCBF) might represent a reduction in PS that may be pathologi cal. We demonstrated an inverse relationship of VSCBF with Hb in both pediatric and adult patients. In adults, VSCBF was also highly correlated with LDH. This may indicate that SCD patients with higher disease severity, i.e., more anemia and hemolysis, have lower functional cerebral microvascular surface area. Further studies are needed to confirm this hypothesis and to investigate if such changes represent permanent damage or a reversible physiologic phenotype.

We demonstrated that besides VS, CMRO2 was also in fluenced by HbF and LDH. Whereas HbF reduces HbS polymerization, which diminishes the complications of SCD, we found a negative association of HbF with CMRO2
This negative association is likely a result of the higher oxygen-binding affinity of HbF compared to HbA,40 poten tially resulting in lower oxygen extraction and CMRO2 for the same CBF. Notably, the HbF effect was not driven spe cifically by patients on hydroxyurea. The positive associ ation between LDH and CMRO2 most likely reflects the impact of dense red blood cells (DRBC) on the Hb-disso ciation curve. DRBC are an important biomarker of SCD severity because of their predisposition for polymerization and hemolysis. Dense cells have markedly low oxygen af finity41 which would facilitate oxygen extraction. Indeed,
Figure 5. Predictors of VSCBF. Left: scatterplot of hemoglobin (Hb) and VSCBF (the residual of the regression between venous signal [VS] and cerebral blood flow [CBF]) for all pre-acetazolamide (pre-ACZ) data of all subject groups. The association between Hb and VSCBF was only significant in the patients, but not in controls. Right: scatterplot of cerebral metabolic rate of oxygen (CMRO2) and VSCBF for the pre-ACZ and post-ACZ data in all adult subjects, showing a significant correlation across all subjects. Please note that the values for VSCBF differ for both regressions as the pre-ACZ data were analyzed using multiple linear regression, whereas the pre-ACZ vs. post-ACZ data were analyzed using linear mixed models to accommodate the repeated measures vari ation.
another study demonstrated that, on multivariate analy sis, LDH was the strongest predictor of DRBC, with biliru bin and HbF levels also retained in the model.42
VSCBF was comparable between pediatric and adult SCD patients, despite differences in absolute CBF. On the one hand, one might postulate higher VSCBF in children be cause of their increased cerebral metabolic rates and greater risk for ischemic injury.43 Alternatively, one might expect progressive microvascular damage and loss of cer ebrovascular cross-sectional area with increasing age, similar to microvascular disease in other organs in SCD patients. A preliminary report assessing blood-brain bar rier permeability demonstrated that children with SCD have higher PS than controls, despite lower extraction, suggesting increased functional capillary exchange area.44 However, this remains to be confirmed in future studies that are encouraged to incorporate OEF and CMRO2 measurements from pediatric patients as well as agematched healthy controls. This is important because SCI are also present in pediatric patients with SCD and it is, therefore, important to understand potential age-depend ent underlying mechanisms.4,45

We were unable to demonstrate any link between VSCBF and white matter damage, however, the lesion load was relatively low, and no patients with overt stroke were in cluded. Previous studies incorporating these samples also showed no association between lesion volume and
hemodynamic parameters.10,15 Although evidence from neurodegenerative disorders and vascular disease suggest that there is a link between hypoxia and white matter lesions,46,47 it remains to be determined how lower OEF and CMRO2, and potentially functional shunting mechan isms are related to such lesions in patients with chronic anemia. A previous study20 demonstrated a relationship between VS and OEF only in patients with a significant lesion load, but not in patients with overt stroke. However, they also did not correlate VS to lesion volumes. In this study, T2-TRIR instead of TRUST was used to obtain venous oxygenation estimates for OEF calculation. T2-TRIR enables T1 measurements in addition to T2 measurements. Given this advantage and a previous study showing OEF values in the same range as the values obtained from TRUST,22 we opted for T2-TRIR here. However, a recent study from our group48 demonstrated that the OEF values obtained from T2-TRIR were significantly lower compared to OEF values obtained from the TRUST sequence (despite comparable reproducibility), which may explain our lower OEF and CMRO2 values compared to previous studies using the TRUST sequence.20,33 Additionally, we here used the HbS calibration model introduced by Bush et al.19 to obtain the venous oxygenation in patients with SCD (al though see the Online Supplementary Appendix, showing comparable findings using the HbA model for complete ness). Recently, a novel sickle cell specific calibration
Figure 6. Schematic hypothetical outline of venous signal in the absence and presence of shunting. Arterially labeled spins enter brain parenchyma at a rate determined by the product of vascular surface area and intrinsic water permeability (per meability-surface area product). The re-entry of the label was previously shown to be negligible (Lin et al. 2018) and is there fore not displayed. (A) In the brain of a healthy control with normal cerebral blood flow (CBF) levels, (almost) no venous signal (VS) is observed. (B) In the brain of a healthy control after acetazolamide administration with increased CBF and intact permeability-surface area product (PS), VS signal can be ob served as flow predominates the microvascular uptake. (C) In a patient with sickle cell disease (SCD) with the presence of shunting, blood preferentially passes through short, low resis tance capillary pathways leading to functional loss of capillary surface area, further increasing VS and impairing oxygen un loading. HC: healthy control, ACZ: acetazolamide.
model, the Bush-Li model,49 was introduced, based on a larger range of hematocrit. However, they did not show statistical superiority compared to the currently used Bush model, and therefore, we do not expect that our conclusions would be different using the Bush-Li model. An important strength of this study is the fact that we used a continuous estimate of VS, which allowed us to conduct regression analyses to investigate the relation between VS, hemodynamic measures and hematological parameters. However, our sample size is relatively small for multiple regression analyses, which is why we have carefully chosen our included predictors. Future studies should confirm our regression analyses using larger sample sizes, to further explore the presence of functional shunting and the associations between shunting and the parameters of oxygen metabolism. Furthermore, our pedi atric sample did not include age-matched healthy con trols. However, previous studies have already shown that CBF is higher in children with SCD compared to healthy children.9,15 In addition, Wu et al.28 showed that the signal in the sagittal sinus was lower in healthy children com pared to children with SCD. Furthermore, the MRI scanner, the head coil and multiple scan parameters differed be tween the pediatric and adult patients, which precluded direct comparison of CBF and lesion volume estimates. Individual M0 scans were not acquired in our pediatric co hort, because the scanning was done prior to the M0 con sensus recommendations in 2014.24 Instead, we used a single fixed M0 value to quantify CBF. In a post hoc analy sis in adults, we found comparable coefficients of vari ation for GM CBF obtained from a group average M0 and from a subject-specific M0. Moreover, using a group aver age M0 did not change the associations between VS and the parameter GM CBF and the markers Hb and LDH. Nevertheless, using a single M0 value does not account for slight spatial differences in magnetization, which is why a subject-specific M0 was used in our adult partici pants and why this is also recommended for future studies. Additionally, the T2-TRIR scan was not available for the pediatric study, and therefore OEF and CMRO2 es timates could not be obtained in pediatric patients. In the adults, only a small proportion of patients were on chronic exchange transfusion, and therefore its effect could not be estimated in this study. Although hydroxy urea did not appear to affect the relationships found in this study, future studies in larger samples could shed
1. Rees DC, Williams TN, Gladwin MT. Sickle-cell disease. Lancet. 2010;376(9757):2018-2031.
2. Debaun MR, Kirkham FJ. Central nervous system complications and management in sickle cell disease. Blood. 2016;127(7):829-838.
light on the effects of hydroxyurea treatment on func tional shunting. Our control group included two sickle cell trait participants whose hematological parameters and T2 values were in the same range as those of the HbAA con trols, in line with previous studies.19,50 This suggests that they were appropriately included as control subjects. In summary, our findings suggest that higher CBF-cor rected venous signal may reflect the loss of capillary ex change area as shown by its relationship to CMRO2, providing evidence for cerebral functional shunting. More over, we found that higher disease severity is related to higher VS and that CMRO2 is additionally influenced by HbF and LDH. These findings indicate that the venous sig nal on ASL images can be considered as a complementary biomarker of cerebral perfusion and oxygen metabolism.
BB has financial relationship with GBT, Novartis, Sanquin, Novo nordisk, Celgene, CSL Behring, CHIESI and Bluebird Bio. LV has a financial relationship with Philips Healthcare
LAH was involved in the study conception and design, analysis and interpretation of the data and manuscript drafting; LV and BJB were involved in data acquisition, analysis and interpretation of the data and manuscript revision; JCW was involved in analysis and interpretation of the data and manuscript revision; AJN and HJMMM were involved in study conception and design, analysis and in terpretation of the data and manuscript revision; AS was involved in analysis and interpretation of the data and manuscript drafting..
The authors would like to thank all the participants for their time and effort to take part in this study and they are grateful to Dr. Jan Petr for his advice regarding ExploreASL.
The authors disclose receipt of the following financial sup port for the research, authorship, and/or publication of this article: National Heart Lung and Blood Institute (1RO1HL136484-A1).
Data available on request from the authors.
3. Strouse JJ, Jordan LC, Lanzkron S, et al. The excess burden of stroke in hospitalized adults with sickle cell disease. Am J Hematol. 2009;84(9):548-552.
4. Ford AL, Ragan DK, Fellah S, et al. Silent infarcts in sickle cell disease occur in the border zone region and are associated
with low cerebral blood flow. Blood. 2018;132(16):1714-1723.
5. Bernaudin F, Verlhac S, Arnaud C, et al. Chronic acute anemia and extracranial internal carotid stenosis are risk factors for silent cerebral infarcts in sickle cell anemia. Blood. 2015;125(10):1653-1661.
6. van der Land V, Mutsaerts HJMM, Engelen M, et al. Risk factor analysis of cerebral white matter hyperintensities in children with sickle cell disease. Br J Haematol. 2016;172(2):274-284.
7. Herold S, Brozovic M, Gibbs J, et al. Measurement of regional cerebral blood flow, blood volume and oxygen metabolism in patients with sickle cell disease using positron emission tomography. Stroke. 1986;17(4):692-698.
8. Numaguchi Y, Haller JS, Humbert JR, et al. Cerebral blood flow mapping using stable Xenon-enhanced CT in sickle cell cerebrovascular disease. Neuroradiology. 1990;32(4):289-295.
9. Oguz KK, Golay X, Pizzini FB, et al. Sickle cell disease: continuous arterial spin-labeling perfusion MR imaging in children. Radiology. 2003;227(2):567-574.
10. Václavů L, Petr J, Petersen ET, et al. Cerebral oxygen metabolism in adults with sickle cell disease. Am J Hematol. 2020;95(4):401-412.
11. Kassim AA, Pruthi S, Day M, et al. Silent cerebral infarcts and cerebral aneurysms are prevalent in adults with sickle cell anemia. Blood. 2016;127(16):2038-2040.
12. Bush A, Chai Y, Choi SY, et al. Pseudo continuous arterial spin labeling quantification in anemic subjects with hyperemic cerebral blood flow. Magn Reson Imaging. 2018;47:137-146.
13. Juttukonda MR, Donahue MJ, Davis LT, et al. Preliminary evidence for cerebral capillary shunting in adults with sickle cell anemia. J Cereb Blood Flow Metab. 2019;39(6):1099-1110.
14. Van Den Tweel XW, Nederveen AJ, Majoie CBLM, et al. Cerebral blood flow measurement in children with sickle cell disease using continuous arterial spin labeling at 3.0-tesla MRI. Stroke. 2009;40(3):795-800.
15. Gevers S, Nederveen AJ, Fijnvandraat K, et al. Arterial spin labeling measurement of cerebral perfusion in children with sickle cell disease. J Magn Reson Imaging. 2012;35(4):779-787.
16. Lin Z, Li Y, Su P, et al. Non-contrast MR imaging of blood-brain barrier permeability to water. Magn Reson Med. 2018;80(4):1507-1520.
17. Renkin EM. Transport of potassium-42 from blood to tissue in isolated mammalian skeletal muscles. Am J Physiol. 1959;197:1205-1210.
18. Crone C. The permeability of capillaries in various organs as determined by use of the ‘indicator diffusion’ method. Acta Physiol Scand. 1963;58:292-305.
19. Bush AM, Coates TD, Wood JC. Diminished cerebral oxygen extraction and metabolic rate in sickle cell disease using T2 relaxation under spin tagging MRI. Magn Reson Med. 2018;80(1):294-303.
20. Juttukonda MR, Donahue MJ, Waddle SL, et al. Reduced oxygen extraction efficiency in sickle cell anemia patients with evidence of cerebral capillary shunting. J Cereb Blood Flow Metab. 2020;41(3):546-560.
21. Václavů L, Meynart BN, Mutsaerts HJMM, et al. Hemodynamic provocation with acetazolamide shows impaired cerebrovascular reserve in adults with sickle cell disease. Haematologica. 2019;104(4):690-699.
22. De Vis JB, Petersen ET, Alderliesten T, et al. Non-invasive MRI measurements of venous oxygenation, oxygen extraction fraction and oxygen consumption in neonates. Neuroimage. 2014;95:185-192.
23. Vaclavu L, Van Der Land V, Heijtel DFR, et al. In vivo T1 of blood measurements in children with sickle cell disease improve
cerebral blood flow quantification from arterial spin-labeling MRI. Am J Neuroradiol. 2016;37(9):1727-1732.
24. Alsop DC, Detre JA, Golay X, et al. Recommended implementation of arterial spin-labeled perfusion MRI for clinical applications: a consensus of the ISMRM Perfusion Study group and the European consortium for ASL in dementia. Magn Reson Med. 2015;73(1):102-116.
25. Zhao MY, Václavů L, Petersen ET, et al. Quantification of cerebral perfusion and cerebrovascular reserve using Turbo QUASAR arterial spin labeling MRI. Magn Reson Med. 2020;83(2):731-748.
26. Mutsaerts H, Petr J, Groot P, et al. ExploreASL: an image processing pipeline for multi-center ASL perfusion MRI studies. Neuroimage. 2020;219:117031.
27. Evans AC, Janke AL, Collins DL, et al. Brain templates and atlases. Neuroimage. 2012;62(2):911-922.
28. Wu WC, St Lawrence KS, Licht DJ, et al. Quantification issues in arterial spin labeling perfusion magnetic resonance imaging. Top Magn Reson Imaging. 2010;21(2):65-73.
29. Stotesbury H, Hales PW, Koelbel M, et al. Venous cerebral blood flow quantification and cognition in patients with sickle cell anemia. J Cereb Blood Flow Metab 2022;42(6):1061-1077.
30. Jespersen SN, Østergaard L. The roles of cerebral blood flow, capillary transit time heterogeneity, and oxygen tension in brain oxygenation and metabolism. J Cereb Blood Flow Metab. 2012;32(2):264-277.
31. Sakadžić S, Mandeville ET, Gagnon L, et al. Large arteriolar component of oxygen delivery implies a safe margin of oxygen supply to cerebral tissue. Nat Commun. 2014;5:5734.
32. Jordan LC, Gindville MC, Scott AO, et al. Non-invasive imaging of oxygen extraction fraction in adults with sickle cell anaemia. Brain. 2016;139(Pt 3):738-750.
33. Vu C, Bush A, Choi S, et al. Reduced global cerebral oxygen metabolic rate in sickle cell disease and chronic anemias. Am J Hematol. 2021;96(8):901-913.
34. Guilliams KP, Fields ME, Ragan DK, et al. Red cell exchange transfusions lower cerebral blood flow and oxygen extraction fraction in pediatric sickle cell anemia. Blood. 2018;131(9):1012-1021.
35. Croal PL, Leung J, Phillips CL, et al. Quantification of pathophysiological alterations in venous oxygen saturation: A comparison of global MR susceptometry techniques. Magn Reson Imaging. 2019;58:18-23.
36. Wang Y, Fellah S, Fields ME, et al. Cerebral oxygen metabolic stress, microstructural injury, and infarction in adults with sickle cell disease. Neurology. 2021;97(9):e902-e912.
37. Hambley BC, Rahman RA, Reback M, et al. Intracardiac or intrapulmonary shunts were present in at least 35% of adults with homozygous sickle cell disease followed in an outpatient clinic. Haematologica. 2019;104(1):e1-e3.
38. Dowling MM, Quinn CT, Ramaciotti C, et al. Increased prevalence of potential right-to-left shunting in children with sickle cell anaemia and stroke. Br J Haematol. 2017;176(2):300-308.
39. DeBeer T, Jordan LC, Lee CA, et al. Evidence of transfusioninduced reductions in cerebral capillary shunting in sickle cell disease. Am J Hematol. 2020;95(9):E228-E230.
40. Young RC, Rachal RE, Del Pilar Aguinaga M, et al. Automated oxyhemoglobin dissociation curve construction to assess sickle cell anemia therapy. J Natl Med Assoc. 2000;92(9):430-435.
41. Di Liberto G, Kiger L, Marden MC, et al. Dense red blood cell and oxygen desaturation in sickle-cell disease. Am J Hematol. 2016;91(10):1008-1013.
42. Bartolucci P, Brugnara C, Teixeira-Pinto A, et al. Erythrocyte density in sickle cell syndromes is associated with specific
clinical manifestations and hemolysis. Blood. 2012;120(15):3136-3141.
43. DeBaun MR, Sarnaik SA, Rodeghier MJ, et al. Associated risk factors for silent cerebral infarcts in sickle cell anemia: Low baseline hemoglobin, sex, and relative high systolic blood pressure. Blood. 2012;119(16):3684-3690.
44. Lin Z, Lance E, Li Y, et al. Impaired blood-brain barrier function in pediatric sickle cell disease. In: ISMRM 27th Annual Meeting & Exhibition, Montreal, Canada, 11-16 May 2019, Abstract #0738
45. DeBaun MR, Armstrong FD, McKinstry RC, et al. Silent cerebral infarcts: a review on a prevalent and progressive cause of neurologic injury in sickle cell anemia. Blood. 2 012;119(20):4587-4596.
46. Yatawara C, Lee D, Ng KP, et al. Mechanisms linking white
matter lesions, tract integrity, and depression in alzheimer disease. Am J Geriatr Psychiatry. 2019;27(9):948-959.
47. Van Dijk EJ, Prins ND, Vrooman HA, et al. Progression of cerebral small vessel disease in relation to risk factors and cognitive consequences: Rotterdam scan study. Stroke. 2008;39(10):2712-2719.
48. Baas K, Coolen B, Petersen E, et al. Comparative analysis of blood T2 values measured by T2 TRIR and TRUST. J Magn Reson Imaging. 2022;56(2):516-526.
49. Bush A, Vu C, Choi S, et al. Calibration of T2 oximetry MRI for subjects with sickle cell disease. Magn Reson Med. 2021;86(2):1019-1028.
50. Eaton W, Hofrichter J. Hemoglobin S gelation and sickle cell disease. Blood. 1987;70(5):1245-1266.
Waldenström’s macroglobulinemia (WM) is a rare mature B-cell lymphoproliferative disorder, characterized by bone marrow (BM) infiltration of lymphoplasmacytic cells and the presence of a monoclonal IgM. MYD88L265P mutation has been identified as the main driver event, with more than 90% of patients harboring this mutation.1 MYD88 is an adaptor protein of the Toll-like receptors (TLR) and IL1 receptors signaling cascades, and is consequently key in the activation of the NF-kB and JAK/STAT pathways.1 The second most commonly mutated gene is CXCR4 (3040%),2 including around 50% of mutations located in the S338 codon (referred to as CXCR4WHIM). The most frequent cytogenetic abnormality is 6q deletion (del6q), found in 30% to 55% of cases.3 Other chromosomal abnormalities are, in decreasing order of frequency: trisomy 18 (tri18), del13q, del17p, tri4 and del11q.4 Thirty percent of patients are asymptomatic at diagnosis. Of those, 68% will require treatment at 10 years.5 Main reasons for therapy initiation are anemia (67%), increasing IgM levels, peripheral neu ropathy (20%), hyperviscosity (15%), and organomegaly (10%).6
A significant association between WM and dysimmune conditions has been reported,7 supporting the hypothesis that chronic immune stimulation could contribute to lym phomagenesis. Clinical practitioners caring for WM pa tients also notice that a fraction presents with chronic inflammatory syndrome, for which there is no obvious cause besides WM itself. Chronic inflammation may be the cause of and/or contribute to the development of anemia, the leading cause of WM treatment initiation. However, very few data exist on the association between WM and inflammatory syndrome. One prospective clinical trial published in 2001 including 231 WM patients showed that 51% of the cohort had a C-reactive protein (CRP) value of at least 1 mg/L at enrollment, which was associated with a higher risk of treatment initiation and lower progressionfree (PFS) and overall survival (OS) rates.8 Authors have postulated that the association between WM and inflam mation could be mediated by interleukin 6 (IL-6), an in ductor of CRP synthesis,9 with higher levels in WM patients compared to healthy controls, and significant re duction after treatment.10 IL-6 production is mediated through NF-kB activation, itself the consequence of MYD88L265P mutation. However, not all patients present with inflammation, suggesting that other mechanisms are at work. Main objectives of our study were to estimate
the prevalence of inflammatory WM and to compare clini cal and biological characteristics between inflammatory and non-inflammatory patients.
We conducted a retrospective analysis including all WM patients who consulted in the Clinical Hematology Unit of Pitié-Salpêtrière hospital (Paris, France) between 1988 and 20204 with available information regarding CRP, at diag nosis and/or before treatment initiation. We defined “in flammatory” status as a CRP value equal or superior to 5 mg/L (according to local normal values) and confirmed once at a minimum interval of 1 month, with no obvious cause besides WM itself. Written consent for clinical, bio logical and bone marrow (BM) analyses were obtained in accordance with the Declaration of Helsinki and with eth ical approval from national (CNIL 2212382) and local (CPP Ile-De-France 05/21/2014) ethics committees. Main characteristics of the whole WM cohort are detailed in the Online Supplementary Table S1. No significant dif ference was observed between WM patients with avail able CRP or not. The study population comprised 222 patients, of which 66% were male. Median age at WM di agnosis was 64.5 years old (range, 28.4-88.2). During fol low-up, 167 of 222 (75%) WM patients required first-line (1L) therapy. Those therapies consisted of chemoimmuno therapy, chemotherapy, anti-CD20 monoclonal antibody alone or in combination with proteasome inhibitor in 117 (70%), 33 (20%), 13 (8%) and four (2%) of cases, respect ively. Median follow-up for the whole WM cohort was 7.2 years. Median treatment-free survival (TFS) was 3.5 years. Five-year PFS for patients receiving 1L therapy was 57%, and 5-year OS for the whole cohort was 92% (data not shown). Median CRP level was 16.7 mg/L (range, 0-263), including 103 (46%) patients with CRP values strictly below 5 mg/L, and 119 (54%) patients with CRP values ≥5 mg/L (thereafter referred to as “inflammatory”). Among the 119 patients with inflammatory WM, patients harboring CRP levels between 5-19, 20-49 and ≥50 mg/L were 66 (55%), 31 (26%) and 22 (18%) respectively (Figure 1A). The mean albumin value was significantly lower in the inflam matory group, as expected. Inflammatory WM patients more frequently presented with lymphadenopathies and anemia (Table 1; Online Supplementary Table S2). All other routine clinical and biological parameters were similar be tween inflammatory and non-inflammatory WM groups (Table 1; Online Supplementary Table S2, whether CRP was studied as a negative/positive value or a continuous value
Figure 1. Description of inflammatory patients. (A) Creactive protein (CRP) distribution (density plot), (B) proportion of 6q deletion (del6q) patients according to CRP levels, (C) correlation between CRP and hema tological response.

respectively). The frequencies of main cytogenetic abnor malities and gene alterations in the whole cohort are rep resented in the Online Supplementary Table S1. The most frequent mutations were identified in MYD88 (90%), CXCR4 (24%), MLL2/KMT2D (11%), ARID1A (10%), TP53 (7%), and CD79A/B (7%). Main cytogenetic abnormalities ident ified by karyotype and/or fluorescence in situ hybridiza tion (FISH) were, in decreasing order of frequency, del6q (28%), tri4 (11%), tri12 (7%) and del17p (7%). Complex ka ryotype (CK) was observed in 17% of cases. TP53 abnor malities (either del17p and/or TP53 mutation) were present in 11% of 190 evaluable patients. In univariate analysis, del6q was the only cytogenetic or molecular ab normalities to be significantly associated with inflamma tory status (Table 1), with del6q occurring in 39% of inflammatory versus 11% of non-inflammatory WM (P<10-3, Table 1). The proportion of del6q patients increased along with CRP values (Figure 1B). The level of CRP as a continu ous variable was significantly associated with the pres ence of del6q (hazard ratio [HR] 1.014, 95% confidence interval [CI]: 1.004-1.027; P=0.015) meaning the probability of del6q increased by 14% for a one-point increase in CRP (IC95%; 95% CI: 0.4-2.7; Online Supplementary Table S2).
Eighty-three percent of del6q patients had CRP values ≥5 mg/L compared to 49% non-del6q WM patients. In multi variate analysis, only del6q (P=0.02) and albumin (P<10-2) were found to be significantly associated with inflamma tory status, whereas lymphadenopathies and anemia were not (Table 1).
Inflammatory WM patients more often required treatment (85% vs. 64%, P<10-3) (Table 1) but this did not translate in TFS difference (Figure 2A). Types of therapies were com parable between the two subgroups except for a slightly higher proportion of WM patients receiving rituximab monotherapy in the non-inflammatory subgroup (12% vs 5%). Mean CRP values were signifi cantly lower after 1L treatment in inflammatory WM (Table 1) and correlated with IgM response (Figure 1C). We did neither observe any difference in terms of response to 1L therapy nor PFS (Table 1; Figure 2B; 5-year PFS of 52% and 65% for inflam matory and non-inflammatory group respectively). Median OS was 10 years in the inflammatory group versus not reached in the non-inflammatory group, however it did not reach statistical significance (P=0.06, Figure 2C). Sur vival analyses according to CRP groups (5-19, 20-49 and ≥50 mg/L) or as a continuous variable did not yield sig
Table 1. Patients characteristics associated with inflammatory status.
Age at diagnosis, years, mean (range) 64.3 (28.4-86.6) 64.6 (35.1-88.2) 1.00
Male, N (%) 61/103 (59) 86/119 (72) 0.77
Lymphadenopathies, N (%) 14/101 (14) 38/118 (32) 0.04 2.2 (0.7-8.0) 0.21
Splenomegaly, N (%) 8/100 (8) 17/118 (14) 1.00
Hyperviscosity syndrome, N (%) 6/101 (6) 10/118 (9) 1.00
Past history of dysimmune conditions, N (%) 11/92 (12) 6/110 (5) 1.00
M spike, g/dL, mean (range)
16.0 (0.1-71.0)
17.8 (1.0-58.0) 1.00
Hb <11 g/dL, N (%) 31/66 (47) 75/101 (74) <10-2 1.6 (0.6-4.4) 0.32
Platelets < 100 x 109/L, N (%)
Medullary infiltration %, mean (range)
CRP, mg/L, mean (range)
Albumin, g/L, mean (range)
β2 microglobulin, mg/L, mean (range)
9/66 (14) 15/100 (15) 1.00
43 (10-97) 33 (0-95) 0.16
0.4 (0-4.4) 30.9 (5.0-263.0) NR
40.4 (31.0-50.5) 36.3 (15.0-45.6) <10-5 0.8 (0.7-0.9) <10-2
2.5 (1.2-12.0)
3.9 (1.5-33) 0.07
IPSSWM: low; intermediate; high, N (%) 18/56 (32); 16/56 (29); 22/56 (39) 14/85 (16); 23/85 (27); 48/85 (56) 1.00
6q deletion, N (%) 8/74 (11) 41/104 (39) <10-3 4.4 (1.4-16.0) 0.02
TP53 abnormalities, N (%) 6/79 (8) 14/111 (13) 1.00
Complex karyotype, N (%) 9/68 (13) 18/91 (20) 1.00
MYD88 mutation, N (%) 65/71 (92) 83/93 (89) 1.00
CXCR4 mutation, N (%) 18/66 (27) 19/91 (21) 1.00
Need for treatment initiation, N (%) 66/103 (64) 101/119 (85) <10-2 NA
ORR*, N (%); VGPR+CR, N (%) 38/64 (59); 12/64 (19) 61/96 (64); 20/96 (21) 1.00
CRP after 1L treatment, mg/L, mean (range) 1.0 (0-16) 5.5 (0-69) 0.08
*ORR=CR+VGPR+PR. WM: Waldenström’s
dence interval; ORR: overall response rate; VGPR: very good partial response; CR: complete response; 1L:
PR: partial reponse; DLBCL: diffuse large B-cell lymphoma; CRP: c-re active protein; IPSSWM: International Prognostic Scoring System of (WM). Subgroup comparisons were performed using Chi-square of Fisher’s exact test for categorical variables, and Student’s t test for continuous variables. Multiple hypothesis correction was performed with Holm’s method for univariate analysis. A multivariate logistic regression was performed for multivariate analysis.
nificant differences (data not shown and Online Supple mentary Table S3). Univariate and multivariate analyses of clinical and biological variables associated with TFS, PFS
and OS in the entire cohort are summarized in the Online Supplementary Table S3. Prognostic factors associated with shorter OS included ISSWM (P<10-2), anemia (P=0.02),
Figure 2. Outcomes according to inflammatory and non-inflammatory subgroups. (A) Treatment-free survival, (B) progressionfree survival and (C) overall survival according to inflammatory (pink) and non-inflammatory (blue) subgroups. Survival compari sons were performed using log-rank test and shown with Kaplan-Meier curves. All P values were 2-sided, with P<0.05 indicating statistical significance. Statistical analyses were performed with R 3.6.3 (Foundation for Statistical Computing, Vienna, Austria).
tri4 (P=0.03), del6q (P<10-2) and TP53abn (P<10-2), while only TP53abn (P=0.04) retained significant pejorative im pact in multivariate analysis.
In this large retrospective WM cohort, considering a posi tivity threshold of 5 mg/L, we observed WM-associated inflammation in more than half of the cases. Inflammatory status was significantly associated with anemia and con sequently more frequent need for treatment initiation. In flammatory status was not associated with higher IgM spike or BM infiltration, which is consistent with the hy pothesis of cytokine-mediated anemia in this context. One of the main findings of our work was the strong as sociation between inflammation and del6q, corroborating two previous retrospective studies focusing on del6q status.11,12 It is of particular interest given that the mini mally deleted region of 6q chromosome in WM contains IBTK, HIVEP2 and TNFAIP3 genes, negative regulators of NF-κB13 which mediates IL-6 production. Furthermore, it has been shown that TNFAIP3 specifically exerts an in hibitory effect on the L265P mutated MYD88 receptor,14 allowing us to postulate that one of the mechanisms through which del6q is associated with inflammation is the loss of TNFAIP3. However, more than half of the in flammatory patients from our cohort did not harbor del6q, indicating that other mechanisms are at play. While inflammatory WM patients more frequently required therapy, we did not observe significant association with TFS, response to therapy nor PFS. A trend for poorer OS was observed although not significant (P=0.06). Inflam mation has many deleterious effects, such as fostering malnutrition, cardiovascular disease and cancer. Rare cases of WM associated with AA amyloidosis have been described.15 The sharp decrease in CRP values at the end of 1L treatment in our cohort shows that hematological and inflammatory responses were well correlated. Al though our study did not explore this hypothesis, it could

be speculated that persistence of elevated CRP after 1L therapy could contribute to morbi-mortality in these pa tients. This raises the question of early therapy initiation and/or complementary therapies directed against either the WM clone or IL-6 in order to prevent long-term con sequences of chronic inflammation. Indeed, IL-6 plays an autocrine role in lymphoplasmacytic differentiation9 and an anti-tumoral effect of anti-IL6 therapy has been dem onstrated in a WM murine model in which anti-IL6 recep tor antibodies were associated with a decrease in tumoral syndrome and M spike.16
In conclusion, our work highlights clinical and biological specificities of WM patients with chronic inflammation, notably a higher prevalence of del6q, more frequent need for therapy initiation and a trend for poorer OS, which will have to be confirmed by further studies. These findings may have implications for the understanding of inflamma tion in WM as well as for further therapeutic devel opments.
Nathalie Forgeard,1 Marine Baron,1 Jonathan Caron,4 Clémentine Boccon-Gibod,1 Daphné Krzisch,1 Nayara Guedes,1 Véronique Morel,1 Nathalie Jacque,1 Maya Ouzegdouh,1 Sylvain Choquet,1 Clotilde Bravetti,2 Florence Nguyen-Khac,3,4 Elise Chapiro,3,4 Véronique Leblond1 and Damien Roos-Weil,1,4 on behalf the FILO (French Innovative Leukemia Organization) group
1Sorbonne Université, Service d’Hématologie Clinique, Hôpital PitiéSalpêtrière, AP-HP; 2Sorbonne Université, Service de Biologie Moléculaire, Hôpital Pitié-Salpêtrière, AP-HP; 3Sorbonne Université, Service de Cytogénétique, Hôpital Pitié-Salpêtrière, AP-HP and 4Centre de Recherche des Cordeliers, INSERM, Cell Death and Drug
Resistance in Lymphoproliferative Disorders Team, Sorbonne Université, Université Sorbonne Paris Cité, Université Paris Descartes, Université Paris Diderot, Paris, France.
Correspondence:
D. ROOS WEIL - damien.roosweil@aphp.fr https://doi.org/10.3324/haematol.2022.281053
Received: March 25, 2022.
Accepted: July 5, 2022. Prepublished: July 14, 2022.
©2022 Ferrata Storti Foundation
Published under a CC BY-NC license
No conflicts of interest to disclose.
NF, VL and DRW designed the research. NF and DRW analyzed data and wrote the manuscript. NF, JC, CBG, DK, NG, CB, FNK, EC and
1. Braggio E, Philipsborn C, Novak A, Hodge L, Ansell S, Fonseca R. Molecular pathogenesis of Waldenström’s macroglobulinemia. Haematologica. 2012;97(9):1281-1290.
2. Hunter ZR, Xu L, Yang G, et al. The genomic landscape of Waldenström macroglobulinemia is characterized by highly recurring MYD88 and WHIM-like CXCR4 mutations, and small somatic deletions associated with B-cell lymphomagenesis. Blood. 2014;123(11):1637-1646.
3. Nguyen-Khac F, Lambert J, Chapiro E, et al. Chromosomal aberrations and their prognostic value in a series of 174 untreated patients with Waldenström’s macroglobulinemia. Haematologica. 2013;98(4):649-654.
4. Krzisch D, Guedes N, Boccon-Gibod C, et al. Cytogenetic and molecular abnormalities in Waldenström’s macroglobulinemia patients: correlations and prognostic impact. Am J Hematol. 2021;96(12):1569-1579.
5. Pophali PA, Bartley A, Kapoor P, et al. Prevalence and survival of smouldering Waldenström macroglobulinaemia in the United States. Br J Haematol. 2019;184(6):1014-1017.
6. Bustoros M, Sklavenitis-Pistofidis R, Kapoor P, et al. Progression risk stratification of asymptomatic Waldenström macroglobulinemia. J Clin Oncol. 2019;37(16):1403-1411.
7. Kristinsson SY, Koshiol J, Björkholm M, et al. Immune-related and inflammatory conditions and risk of lymphoplasmacytic lymphoma or Waldenstrom macroglobulinemia. J Natl Cancer Inst. 2010;102(8):557-567.
8. Dhodapkar MV, Jacobson JL, Gertz MA, et al. Prognostic factors and response to fludarabine therapy in patients with Waldenström macroglobulinemia: results of United States intergroup trial (Southwest Oncology Group S9003). Blood.
DRW performed experiments. NF, MB, CBG, DK, NG, VM, NJ, MO, SC, FNK, VL and DRW recruited patients. All authors reviewed and approved the manuscript.
We thank Dr Nicolas Gilliers for his assistance with the statistical analysis, and Luce Smagghe for her technical help (financially supported by FILO).
This study was supported by grants from INCA-DGOSINSERM_12560 (SiRIC CURAMUS is financially supported by the French National Cancer Institute, the French Ministry of Solidarity and Health and INSERM with financial support from ITMO Cancer AVIESAN), by prix Force Hémato 2020 and by the Fondation ARC pour la recherche sur le cancer (to DRW). LS and JC were financially supported by SiRIC CURAMUS.
Due to the nature of this research, participants of this study did not agree to their data being shared publicly, so supporting data is not available.
2001;98(1):41-48.
9. Levy Y, Fermand JP, Navarro S, et al. Interleukin 6 dependence of spontaneous in vitro differentiation of B cells from patients with IgM gammapathy. Proc Natl Acad Sci U S A. 1990;87(9):3309-3313.
10. Hatzimichael EC, Christou L, Bai M, Kolios G, Kefala L, Bourantas KL. Serum levels of IL-6 and its soluble receptor (sIL-6R) in Waldenström’s macroglobulinemia. Eur J Haematol. 2001;66(1):1-6.
11. Ocio EM, Schop RFJ, Gonzalez B, et al. 6q deletion in Waldenström macroglobulinemia is associated with features of adverse prognosis. Br J Haematol. 2007;136(1):80-86.
12. García-Sanz R, Dogliotti I, Zaccaria GM, et al. 6q deletion in Waldenström macroglobulinaemia negatively affects time to transformation and survival. Br J Haematol. 2021;192(5):843-852.
13. Guerrera ML, Tsakmaklis N, Xu L, et al. MYD88 mutated and wild-type Waldenström’s Macroglobulinemia: characterization of chromosome 6q gene losses and their mutual exclusivity with mutations in CXCR4. Haematologica. 2018;103(9):e408-411.
14. Wenzl K, Manske MK, Sarangi V, et al. Loss of TNFAIP3 enhances MYD88L265P-driven signaling in non-Hodgkin lymphoma. Blood Cancer J. 2018;8(10):97.
15. Terrier B, Jaccard A, Harousseau JL, et al. The clinical spectrum of IgM-related amyloidosis: a French nationwide retrospective study of 72 patients. Medicine (Baltimore). 2008;87(2):99-109.
16. Han W, Matissek SJ, Jackson DA, Sklavanitis B, Elsawa SF. Targeting IL-6 receptor reduces IgM levels and tumor growth in Waldenström macroglobulinemia. Oncotarget. 2019;10(36):3400-3407.
Chronic thrombocytosis may be reactive in nature, be driven by inherited genetic characteristics (e.g., THPO, MPL, JAK2 mutations) or be caused by an acquired mye loid malignancy (mainly myeloproliferative neoplasm [MPN]). The diagnostic workup of isolated thrombocyto sis therefore requires testing for inflammation/iron defi ciency, consideration of a family history, a bone marrow examination and the search for "classical" MPN driver mutations ( BCR-ABL1 , JAK2 V617F, CALR exon 9, MPL W515L/K). According to the World Health Organiza tion (WHO) classification, the diagnosis of essential thrombocytosis (ET) requires typical histological fea tures.1 In the absence of a driver mutation, histological characterization is the only element allowing classifica tion of thrombocytosis as ET. However, a number of pa tients with a clinical presentation of "triple-negative" acquired thrombocytosis do not display the character istic histological features of ET or of MPN, raising the question of appropriate therapeutic management. In deed, in the presence of "high-risk" features (age >60 years, a history of thrombosis), cytoreductive therapy has been demonstrated to reduce the thrombotic risk in MPN patients; however, when the diagnosis of MPN is uncertain because of the lack of typical histological fea tures, it is not known whether patients would benefit from cytoreductive treatment. Previous studies have shown that next-generation sequencing (NGS) could de tect variants in 12 to 73% of cases of triple-negative thrombocytosis2-5 Variants can be acquired in genes fre quently mutated in myeloid malignancies or may be identify as germline variants in genes involved in mega karyocytic proliferation, even in the absence of a familial history of thrombocytosis (mainly JAK2 , MPL ).6,7 Efforts at finding a common genetic alteration in triple-negative ET have, in fact, reinforced the idea that this group of patients is heterogeneous, with clonal or non-clonal hematopoiesis and identification of additional acquired as well as constitutive JAK2, MPL or SH2B3 variants, but no common recurrent anomaly.6,7
In a cohort of 130 patients with chronic, non-reactive triple-negative thrombocytosis, we first had bone mar row biopsies reviewed by experts of the French group of hematopathologists (GEBOM), then asked whether tar geted NGS could help reach a diagnosis. We also asked whether the outcome of patients was predicted better when the diagnostic classification was based on genetic and/or histological features.
Patients followed at Angers or Brest university hospitals,
for ET or chronic thrombocytosis, were included if their platelet count at diagnosis was >400x10 9/L, there was no reactive cause (iron deficiency, splenectomy, inflam mation) for the raised platelet count and they did not have JAK2 V617F, CALR exon 9 or MPL W515L/K mutations (as determined by allele-specific quantitative polyme rase chain reaction [PCR] analysis, PCR fragment length polymorphism and quantitative PCR followed by allelic discrimination using probe competition, as previously described).8 Bone marrow biopsies had been performed in all patients, 118 of which were available for central re view. All patients were >18 years old and provided written informed consent, in accordance with law n. 2004-800 of 2004 and law n. 2012-300 of 2012. The median age at diagnosis was 53 years old (range, 18-84) and 72% were females.
Among the 130 patients with triple-negative thrombo cytosis, bone marrow biopsy led to a diagnosis of ET/MPN in 79, while in 45 patients, the biopsy was not in favor of MPN and in six the diagnosis was unclear (in sufficient quality). After central review of the bone mar row biopsies by GEBOM experts, the repartition was broadly similar (Figure 1A), but the tissue provided was considered insufficient for a clear diagnosis in eight pa tients. Overall, 24 (18%) patients finally changed cat egories after review of the bone marrow biopsies (13 initially in favor of a MPN were reclassified as non-MPN; whereas 6 initially considered not in favor of a diagnosis of MPN were finally considered MPN).
Since a histological diagnosis between MPN and nonMPN may be subject to variability and some patients still had unclear diagnosis, we wondered whether a muta tional analysis with targeted NGS of 24 genes commonly mutated in MPN ( Online Supplementary Table S1) could help with the diagnostic discrimination of patients. Among 130 tested patients, a total of 57 variants were found in 38 patients, who displayed one (n=28), two (n=6) or more (n=4) variants, while 92 (71%) patients had none ( Online Supplementary Table S2 ). The most fre quently affected genes were MPL, ASXL1, SH2B3, JAK2, TET2 and DNMT3A (Figure 1B). Overall, pathogenic/likely pathogenic variants were found slightly more frequently in patients considered as having MPN after bone marrow biopsy review (33 variants in 17/69 (25%) vs. 10 variants in 8/50 (16%) in non-MPN patients, P =not significant). Acquired MPL mutations were found in ten patients in itially considered “triple-negative” because only W515K/L mutations had been screened for. Three of
Figure 1. Diagnoses modified, mutations detected by next-generation sequencing in the triple-negative cohort, and incidence of thrombotic events in untreated and treated patients in the triple-negative groups compared to JAK2- and CALR-mutated controls. (A). Initial and modified diagnoses after bone marrow review and next-generation sequencing (NGS) analysis. Top. Repartition of diagnoses according to successive classifications: (left) at initial diagnosis (before bone marrow biopsy review by GEBOM and NGS); (middle) after bone marrow biopsy review; (right) after targeted NGS. Bottom. Sankey diagram showing the proportion of patients whose diagnosis was modified by bone marrow biopsy review and/or NGS analysis. (B). Molecular landscape of the whole cohort. (Left) number of mutations per gene classified per category (pathogenic, likely pathogenic, germline and of uncer tain significance); (left) repartition of genes mutated according to diagnosis before targeted NGS analysis (MPN, no-MPN, uncertain diagnosis); (right) repartition of mutated genes according to diagnosis after targeted NGS analysis (MPN, no-MPN, constitutional thrombocytopenia). (C). Thrombosis-free survival in untreated and treated patients with triple-negative thrombocytosis compared to JAK2- and CALR-mutated controls. Survival curves are represented by Kaplan-Meier plots with log-rank associated tests and Cox models for multivariate analysis. Statistics were performed with R software (v4.0.3, Vienna, Austria). MPN: myeloproliferative neoplasm (i.e., essential thrombocythemia); no-MPN : histology/NGS not in favor of myeloproliferative neoplasm; VUS: variant of unknown significance.

these mutations affected W515 (W515A in 2 patients, W515S in 1 patient), one affected S505 and the others were scattered in the whole gene, in regions coding extracellular as well as intracellular domains.
Germline variants were found mostly in the JAK2 and MPL genes (in 9 and 3 patients, respectively) (Figure 1B), most of which were confirmed to be germline by Sanger sequencing on nail DNA. Interestingly, germline MPL variants were found in the non-MPN group whereas germline JAK2 variants were mainly found in the MPN group, suggesting that these variants favor the devel opment of a “true” MPN phenotype. Some of these JAK2 variants have been described in contexts different from that of familial thrombocytosis, such as JAK2 R1063H which was shown to enhance signaling and lead to a distinct phenotype in JAK2 V617F-positive MPN. 9 How ever, it is interesting to note that patient B358, who presented with isolated thrombocytosis and a bone marrow biopsy suggestive of MPN, has an 11-year-old daughter with thrombocytosis, an isolated R1063H vari ant at NGS screening and a bone marrow biopsy also showing characteristics of MPN. Also, a young patient (A005) with thrombocytosis and a bone marrow biopsy suggestive of ET, displayed a previously described JAK2 T875N variant,10-12 which was confirmed as germline on examination of nail DNA. He had thrombosis resulting in cerebral and thoracic spinal cord ischemia and, 2 years after diagnosis, he developed polycythemia. In ad dition, rare variants (mean allele frequency <0.1) of JAK2 and MPL in our cohort were significantly more frequent than in a local control cohort (from the French Exome Project Database), further suggesting their significance in chronic thrombocytosis.
In order to assess whether NGS data could better dis criminate thrombocytosis patients with a higher risk of complications, we reclassified patients with an acquired pathogenic or likely pathogenic variant in the “MPN” group, irrespective of their histology. Similarly, patients with germline variants in JAK2 or MPL were reclassified as having constitutional thrombocythemia. Overall, ap plying these criteria in the “non-MPN” group, NGS was not informative for 39 patients, allowed confirmation of non-MPN in four (constitutional thrombocythemia) and prompted reclassification into the “MPN” group in nine patients. In the MPN group, NGS was not informative for 44 patients, allowed confirmation (acquired pathogenic/likely pathogenic variant) in 17 and prompted reclassification into constitutional thrombocythemia in eight patients. For the 11 patients for whom bone mar row biopsy was not able to provide a classification, NGS did not give additional information in nine, but detected an acquired mutation in two patients: DNMT3A D835M (variant allele frequency, 2%) and CBL L380P (variant al lele frequency, 3%), allowing a reclassification to MPN.
It is worth noting that mutations with such a low allele burden could be considered as clonal hematopoiesis of indeterminate potential and the clinical interpretation of these cases remains challenging.
In order to determine whether the NGS-based or histol ogy-based classifications allow for a better prognostic discrimination, clinical characteristics and evolution were assessed in the groups defined by histological findings or NGS findings. The demographic, biological, and main clinical data of the patients, divided into groups according to the initial diagnosis, histology re view or the NGS-based diagnosis, are detailed in Table 1A and Online Supplementary Table S2. Age at diagnosis and sex ratio were similar between MPN and non-MPN patients whereas MPN patients had higher platelet counts and lower leukocyte counts. These findings held true regardless of the diagnostic classification applied. In contrast, while the ratio of treated versus untreated patients was similar in the two groups (MPN and nonMPN) after initial assessment (67% in MPN vs. 51% in non-MPN, P=0.128), it became significantly higher in MPN patients after central review (69% vs. 46%, P =0.025), suggesting that therapeutic decisions in current clinical practice were not based only on the WHO classification and/or decisional algorithms. In survival analyses, we used information on event status and follow-up time to estimate a survival function (median follow-up of 5 years).
Overall survival was not significantly different between MPN and non-MPN patients whatever the classification applied ( P values of 0.34, 0.081 and 0.27 for initial, bone marrow biopsy-reviewed and NGS classifications, re spectively). It is interesting to note, however, that trans formation to myelofibrosis or acute leukemia only occurred in MPN patients (n=5), according to all classifi cations. Similarly, no significant difference was observed for event-free survival between the MPN and non-MPN groups defined with the three classifications ( P values of 0.82, 0.66 and 0.68, respectively). However, the pa tients reassigned to the MPN group after expert pathol ogist review or NGS had more thrombotic events compared to other patients with an initial diagnosis of MPN or not, suggesting that bone marrow biopsies should be examined by highly trained pathologists, and that identification of clonal hematopoiesis by NGS is of relevance ( P =0.0078) ( Online Supplementary Figure S1A ). Since patients in the MPN and non-MPN groups had similar evolutions, we wondered whether the presence of an acquired “additional” mutation could have an im pact on event-free survival (thrombosis or transforma tion) or overall survival in the whole triple-negative population. The presence of pathological variants did not have a statistically significant effect on overall survival, but did seem to be associated with a higher risk of
Table 1. (A) Demographic, biological and clinical characteristics in each group of patients with triple-negative thrombocytosis (with myeloproliferative neoplasm, not with myeloproliferative neoplasm, unclear and constitutional) according to the initial diagnosis and the diagnosis made with next-generation sequencing. (B) Comparison of demographic, clinical and biological characteristics at diagnosis and evolution of triple-negative patients, JAK2-mutated patients and CALR-mutated patients.
A. Diagnoses of the triple-negative group of patients (N=130)
Initial Dx
Age at Dx, years, median (range)
Sex Hemoglobin, g/L, median (range)
Platelets ×109/L, median (range)
Leukocytes ×109/L, median (range)
Neutrophils ×109/L, median (range)
MPN (N=79) 53 (18-84) 57F/22M 135 (107-170) 685 (442-1800)** 8.1 (4.1-16)* 4.8 (2.3-11.7)*
CD34+ cells/x10-6L, median (range)
Splenomegaly, n/N (%)
History of thrombosis, n/N (%)
Cytoreductive treatment, n/N (%)
2.7 (0.8-14) 10/79 (13) 14/79 (18) 53/79 (67)
No-MPN (N=45) 53 (18-79) 30F/15M 135 (89-169) 580 (454-1990) 9.6 (4.9-16) 6.0 (2.7-14.3) 3 (1-6.8) 1/45 (2) 7/45 (16) 23/45 (51)
Unclear (N=6) 55 (36-82) 6F/0M 139 (125-155) 543 (444-1544) 8.5 (4.7-23.8) 5.1 (2.7-22.4) 1.8 (0.5-3) 0/6 0/6 3/6 (50)
MPN (N=70) 58 (18-84) 51F/19M 135 (107-163) 710 (444-1800)** 8.1 (4.1-16.0)* 5.1 (2.3-11.7) 2.4 (0.5-14) 6/70 (9) 14/70 (20) 49/70 (70)*
No-MPN (N=39) 51 (18-78) 24F/15M 136 (89-169) 579 (442-1990) 9.5 (4.9-16) 5.8 (2.7-14.3) 2.6 (1-10.7) 3/39 (8) 5/39 (13) 18/39 (46) Constitutional (N=12) 40 (24-71) 9F/3M 141 (131-170) 524 (468-788) 9.1 (6.0-13.9) 6.2 (3.5-10.5) 2.8 (1.5-7.4) 2/12 (17) 2/12 (17) 7/12 (58)
Unclear (N=9) 62 (36-82) 9F/0M 137 (20-155) 550 (472-1544) 8.8 (4.7-23.8) 5.7 (2.7-22.4) 4 (3-6.8) 0/9 0/9 5/9 (56)
B. Comparison of triple-negative patients versus patients with mutated essential thrombocythemia
Groups
Age at Dx, years, median (range)
Sex Hemoglobin, g/L, median (range)
Platelets ×109/L, median (range)
Leukocytes ×109/L, median (range)
Neutrophils ×109/L, median (range)
CD34+ cells x10-6/L, median (range)
Splenomegaly, n/N (%)
History of thrombosis, n/N (%)
Cytoreductive treatment, n/N (%)
Triple-negative (N=130) 53 (18-84)^ 93F/37M 136 (89-170)§ 635 (442-1990) 8.5 (4.1-23.8)§ 5.4 (2.3-22.4)§ 2.7 (0.5-14.0) 11/130 (8) 21/130 (16)§ 79/130 (61)^
JAK2V617F (N=246) 65 (17-97) 158F/88M 142 (76-175) 684 (145-2381) 9.3 (3.5-23.8) 6.6 (0.15-19.9) 2.5 (0.5-14) 20/246 (8) 81/246 (33) 226/246 (92)
CALR exon 9 (N=98) 60 (18-88)^^ 49F/49M# 140 (105-165) 800 (511-2300)$ 7.9 (4.3-19.5)§ 5.1 (2.5-13.0)§ 2.85 (1.0-17.1) 6/98 (6) 12/98 (12)§ 86/98 (88)
Comparisons of quantitative and categorical parameters were performed with Mann-Whitney and Fisher tests, respectively.*P<0.05 vs. NoMPN group; **P≤0.001 vs. No-MPN group. ^P<0.01 vs. JAK2 and CALR-mutated;
P<0.05 vs. JAK2-mutated; #P<0.05 vs. CALR-mutated; §P<0.01 vs. JAK2-mutated; $P<0.001 vs. triple-negative and JAK2-mutated. Constitutional: constitutional thrombocythemia; MPN: myeloproliferative neoplasm; no MPN: histology not in favor of MPN; Dx: diagnosis; M: male; F: female.
events, mainly after a long follow-up (beyond 4 years) ( Online Supplementary Figure S1B). We then compared our cohort of triple-negative patients with a control group of 246 patients with JAK2 V617Fmutated ET and 98 with CALR -mutated ET. Age at diag nosis, hemoglobin levels and neutrophil counts were significantly higher in these JAK2 V617F-mutated ET pa tients than in our triple-negative patients, and platelet
counts were higher in the CALR -mutated patients than in the triple-negative patients (Table 1B). More impor tantly, overall, triple-negative patients had a significantly higher incidence of thrombosis than that in patients with JAK2 V617F-mutated ET, especially during the first years following the diagnosis (hazard ratio=2.76 [95% confidence interval: 1.2-6-3]; P =0.0167) ( Online Supple mentary Figure S1C ). The proportion of patients treated
Table 2. Main characteristics of patients with triple-negative thrombocytosis who suffered a thrombotic event.
Patients Age at Dx Sex
History of thrombosis pre-Dx
Dx with BMB review
A_004 32 M N No MPN
Mutations (VAF%)
ASXL1 D1180E (47) / SH2B3 R265Q (48)
A_005 24 M N MPN JAK2 T875N (49)
Dx with NGS Hb* g/L Platelets* ×109/L
Leukocytes* ×109/L
Neutrophils* ×109/L
Age at thrombosis, years
Cytoreductive therapy*
Thrombosis location
No MPN NR NR NR NR 33 N Stroke
Constitu tional 158 478 5.4 3.4 25 N Cerebral + thoracic spinal cord ischemia
A_013 59 F N ET / ET 115 894 10.2 5.6 60 N Stroke
A_037 69 F N Unclear DMNT3A T835M (2) MPN 113 828 7.8 6.4 72 Y Pulmonary embolism
A_055 71 M N No MPN / No MPN 148 395 6.5 4.1 74 Y TIA
B_008 25 F N ET ASXL1 S846N (51) ET 148 428 4.66 2.19 27 Y Abdominal thrombosis
B_024 47 M Y No MPN / No MPN NR NR NR NR 47/50/52 Y Stroke and 2 TIA
B_044 59 F N ET / ET 133 324 7 4.7 70 Y Stroke
B_053 64 M Y ET / ET 134 269 9.3 7.7 82 Y Myocardial infarction
B_054 65 F N No MPN DNMT3A N797D (37) MPN 110 439 8 6 69 Y Lower limb thrombosis
B_063 74 M N ET / ET 116 461 11.1 8.8 74/81/82 Y TIA and 2 lower limb thromboses
B_344 52 M N No MPN / No MPN 153 441 13.6 9.1 54 N MI and stroke
B_358 43 F N ET JAK2 R1063H (51)
Constitu tional 146 400 12.6 8.3 43 N Stroke
*Hematologic values and treatment at the time of thrombosis. Dx: diagnosis; BMB: bone marrow biopsy; VAF: variant allele frequency; NGS: next-generation sequencing; Hb: hemoglobin; M: male; F. female; Y: yes; N. no; ET: essential thrombocythemia; preMF: pre-myelofibrosis; MPN: myeloproliferative neoplasm; no MPN: histology not in favor of a myeloproliferative neoplasm; Constitutional: constitutional thrombo cythemia; TIA: transient ischemic attack; MI: myocardial infarction.
with cytoreductive therapy was significantly higher in CALR -mutated patients (86/98; 88%) and JAK2 V617Fmutated patients (226/246; 92%) than in the triplenegative patients (79/130; 61%) (Table 1B). To evaluate the potential benefit of cytoreductive therapy on throm bosis risk, we compared the incidence of thrombosis in untreated versus treated patients (the main character istics of patients with triple-negative thrombocytosis who suffered a thrombotic event are presented in Table 2). For this purpose, we performed a landmark analysis considering first untreated patients and then treated pa tients with a starting time of follow-up at treatment initiation. This analysis showed an excess risk of throm bosis in triple-negative patients among untreated, but not among treated patients (Figure 1C). In order to make
sure that the increased thrombotic risk applied to “true” cases of MPN, the analysis was also carried out includ ing only patients showing bone marrow histology of MPN and/or an acquired clonal mutation, with similar results ( Online Supplementary Figure S1D ). Of note, all five un treated triple-negative patients who had thrombotic events were in the low-risk group. These elements indi cate that cytoreductive strategies might be improved in this group of patients. In conclusion, this study shows that characterization of triple-negative thrombocytosis relies on thorough clini cal, biological, histological and genetic characterization. A relatively small panel of commonly mutated genes allows confirmation or challenges the initial assessment in as many as 20% patients each. Besides the demon
stration of clonal hematopoiesis, it is of particular inter est to study the whole coding sequence of MPL and JAK2 to identify a sub set of patients with constitutive thrombocytosis and variants in these genes. Finally, our results showed a higher risk of thrombosis in patients with triple-negative thrombocytosis than in ET patients with driver mutations, with the risk being especially high among patients who do not receive cytoreductive drugs.
Sandrine Lemoine,1-4 Clelia Mornet,4,5 Isabelle Quintin-Roue,6 MarieChristine Rousselet,7 Laurane Cottin,1-4 Aurélie Georgeais,5 Ludovic Dubouis,8 Françoise Boyer,3,4,9 Corentin Orvain,2-4,9 Clara Caillon,3,9 Maxime Renard,1,3 Valoris Le Brun,3,5 Lenaig Le Clech,10 JeanChristophe Ianotto,3,4,11,12 Emmanuelle Génin,13 Barbara Burroni,4,14,15 Valérie Ugo,1-4 Damien Luque Paz1-4# and Eric Lippert3-5,13#
1Laboratoire d’Hématologie, CHU Angers, Angers; 2Université d'Angers, Nantes Université, CHU Angers, Inserm, CNRS, CRCI2NA, Angers; 3Fédération Hospitalo-Universitaire “Grand Ouest Against Leukemia” (FHU GOAL), Angeres; 4France Intergroupe des Syndromes Myéloprolifératifs (FIM), Paris; 5Laboratoire d’Hématologie, CHRU Brest, Brest; 6Département de Pathologie Cellulaire et Tissulaire, CHRU Brest, Brest; 7Département de Pathologie Cellulaire et Tissulaire, CHU Angers, Angers; 8Laboratoire de Biopathologie, CHRU Nancy, Nancy; 9Service des Maladies du Sang, CHU Angers, Angers; 10Service d’Hématologie Clinique, CHIC de Quimper, Quimper; 11Service d’Hématologie Clinique, CHRU Brest, Brest; 12Université Brest, Inserm, GETBO, Brest; 13Université Brest, Inserm, EFS, UMR 1078, GGB, Brest; 14Service de Pathologie, AP-HP, Hôpital Cochin, Paris and 15Centre de Recherche des Cordeliers, Sorbonne Université, Inserm, Université de Paris, Paris, France.
#DLP and EL contributed equally as co-senior authors.
1. Arber DA, Orazi A, Hasserjian R, et al. The 2016 revision to the World Health Organization (WHO) classification of myeloid neoplasms and acute leukemia. Blood. 2016;127(20):2391-2405.
2. Grinfeld J, Nangalia J, Baxter EJ, et al. Classification and personalized prognosis in myeloproliferative neoplasms. N Engl J Med. 2018;379(15):1416-1430.
3. Angona A, Fernández-Rodríguez C, Alvarez-Larrán A, et al. Molecular characterisation of triple negative essential thrombocythaemia patients by platelets analysis and targeted sequencing. Blood Cancer J. 2016;6(8):e463.
4. Michail O, McCallion P, McGimpsey J, et al. Mutational profiling in suspected triple-negative essential thrombocythaemia using targeted next-generation sequencing in a real-world cohort. J Clin Pathol. 2021;74(12):808-811.
5. Acha P, Xandri M, Fuster-Tormo F, et al. Diagnostic and
Correspondence:
E. LIPPERT - eric.lippert@chu-brest.fr https://doi.org/10.3324/haematol.2022.280917
Received: February 24, 2022.
Accepted: July 6, 2022. Prepublished: July 14, 2022.
©2022 Ferrata Storti Foundation
Published under a CC BY-NC license
No conflicts of interest to disclose.
FB, JCI, CO, LLC, JCI and EL included patients. IQR, MCR, LD and BB analyzed the bone marrow biopsies. SL, CM, LC, AG, CC, MR, VLB, EG, VU, DLP and EL performed molecular studies and analyzed the data. SL, CM, DLP and EL drafted the manuscript. All co-authors proof-read and approved the manuscript.
The authors thank the CRB Santé du CHU de Brest, the CRB of Angers (Dr Odile Blanchet) and the French Clinical and Biological Network of Myeloproliferative Neoplasms (FIMBANK) for providing high quality biological resources. EL is grateful to the Ligue Contre le Cancer (especially the Finistère committee) for continuous support throughout many years.
All data generated and analyzed during this study are included in this published article and its online supplementary file. Further details can be requested from the senior authors (damien.luquepaz@chu-angers.fr or eric.lippert@chu-brest.fr).
prognostic contribution of targeted NGS in patients with triplenegative myeloproliferative neoplasms. Am J Hematol. 2019;94(10):E264-E267.
6. Milosevic Feenstra JD, Nivarthi H, Gisslinger H, et al. Wholeexome sequencing identifies novel MPL and JAK2 mutations in triple-negative myeloproliferative neoplasms. Blood. 2016;127(3):325-332.
7. Cabagnols X, Favale F, Pasquier F, et al. Presence of atypical thrombopoietin receptor (MPL) mutations in triple-negative essential thrombocythemia patients. Blood. 2016;127(3):333-342.
8. Mansier O, Luque Paz D, Ianotto JC, et al. Clinical and biological characterization of MPN patients harboring two driver mutations, a French Intergroup of Myeloproliferative neoplasms (FIM) study. Am J Hematol. 2018;93(4):E84-E86.
9. Mambet C , Babosova O, Defour JP, et al. Cooccurring JAK2
V617F and R1063H mutations increase JAK2 signaling and neutrophilia in myeloproliferative neoplasms. Blood. 2018;132(25):2695-2699.
10. Mercher T, Wernig G, Moore SA, et al. JAK2T875N is a novel activating mutation that results in myeloproliferative disease with features of megakaryoblastic leukemia in a murine bone marrow transplantation model. Blood. 2006;108(8):2770-2779.
11. Chen C, Li F, Ma MM, et al. Roles of T875N somatic mutation in the activity, structural stability of JAK2 and the transformation of OCI-AML3 cells. Int J Biol Macromol. 2019;137:1030-1040.
12. Yoshimitsu M, Hachiman M, Uchida Y, et al. Essential thrombocytosis attributed to JAK2-T875N germline mutation. Int J Hematol. 2019;110(5):584-590.
Several recent trials have changed the standard-of-care for patients with limited stage (LS) diffuse large B-cell lymphoma (DLBCL) by minimizing the number of chemo immunotherapy cycles and/or eliminating the need for radiotherapy without compromising long-term out comes.1,2 However, there may be patient subsets where an abbreviated-treatment approach is insufficient. With this in mind, Bobillo et al., retrospectively reviewed LS DLBCL patients treated at a single institution with rituximab, cyclophosphamide, doxorubicin, vincristine, and predni sone (RCHOP) for four to six cycles with or without radio therapy.3 This group reported that an extranodal presentation had shorter progression-free (PFS) and over all survival (OS) compared with nodal presentation. In these patients, consolidative radiotherapy prolonged sur vival in patients with extranodal disease, especially those with a positive positron emission tomography (PET) scan at the end of chemoimmunotherapy. In response, we ana lyzed similar patients treated on three consecutive SWOG studies (S0014, S0313, S1001; clinicaltrails gov. Identifier: NCT00005089, NCT00070018, NCT01359592).2,4,5
From April 2000 to June 2016, 234 eligible patients with non-bulky (exception of 2 patients) LS DLBCL were ac crued to S0014 (n=60), S0313 (n=43), or S1001 (n=131).2,4,5 Bulky disease was defined as any tumor mass >10 cm (greatest diameter) and/or a mediastinal mass ≥ one third of the maximum chest diameter. Tumor bulk was measured prior to initial biopsy from available commuted tomography scans. Reasons for exclusion are detailed in the Online Supplementary Figure S1. Enrolled patients re ceived therapy with RCHOP (rituximab, cyclophos-pha mide, doxorubicin, vincristine, prednisone) for three cycles (RCHOP3) + involved field radiotherapy (IFRT; 26%); RCHOP3 + IFRT + ibritumomab tiuxetan (24%); or RCHOP alone for three to four cycles (51%; Online Supplementary Figure S1). For patients enrolled in S1001, an interim PET (iPET) scan was performed after RCHOP3 and considered negative if the Deauville Score was ≤3.2 Nodal disease was defined as lymphoma limited to lymph nodes, spleen, or tonsils. Extranodal disease included lymphoma in all other locations. Fisher’s exact test for categorical variables and Wilcoxon sum rank test for continuous variables were used to compare the distribution of the characteristics and treatments received at 2-sided α of 0.05. PFS was calculated from date of registration until progression, re lapse, or death. OS was calculated from date of registra
tion until death. PFS and OS estimates were calculated using the Kaplan-Meier method. Median follow-up is 7 years (range, 1.1–15.8). Median age was 62 years (range, 18–85). Of the 234 patients, 104 (44%) had extranodal disease. The most common sites of extra nodal disease were head and neck (n=46; nasopharynx n=14 [6 were localized to the nose or nasal cavity and the remaining covered larger areas of the nasopharynx, ex cluding the tonsils]; oral cavity n=17; orbit n=2; parotid n=4; sinus n=7; submandibular gland n=1; and vocal cord n=1]), bone (n=13), skin/soft tissue/muscle (n=12), gastro intestinal tract (n=11), thyroid (n=9), and breast (n=6). Baseline clinical characteristics (age, stage, lactate de hydrogenase [LDH], sm-IPI) and treatments received be tween extranodal and nodal disease presentations were not statistically different (Table 1). For all patients, esti mated 10-year PFS and OS were 71% (95% confidence in terval [CI]: 64-77%) and 77% (95% CI: 69-83%), respectively. For patients with extranodal versus nodal disease, there was no difference in the estimated 10-year PFS (68% vs. 74%; 2-sided log-rank P=0.51, Figure 1A) or 10-year OS (77% vs. 77%; 2-sided log-rank P=0.65; Figure 1B). Of the 135 patients with stage I disease, there was no difference in the estimated 10-year PFS (70% vs. 73%; 2sided log-rank P=0.79) or 10-year OS (73% vs. 81%; 2-sided log-rank P=0.88) when comparing patients with extra nodal versus nodal disease (Online Supplementary Figure S2). For the 46 patients with extranodal disease of the head and neck, estimated 10-year PFS and OS were 57% (95% CI: 38-71%) and 75% (95% CI: 58-86%). Among the different subgroups of patients with disease classified as extranodal disease of the head and neck (nasopharynx, oral cavity, sinus, or other) there were no significant dif ferences in estimated 10-year PFS or OS (2-sided log-rank P values of 0.84 and 0.71, respectively). For 10-year PFS and OS for the other sites of extranodal presentation, see the Online Supplementary Table S1. Among patients with extranodal disease who received IFRT (n=54) versus those who did not (n=50), there was no difference in the esti mated 5-year PFS (83% vs. 87%; 2-sided log-rank P=0.52) or 5-year OS (85% vs. 92%; 2-sided log-rank P=0.28; Fig ure 2). Specifically for the patients presenting with head and neck extranodal disease, there is no difference in 5year PFS or OS for patients who received IFRT compared those who did not receive IFRT after completion of chemotherapy (2-sided log-rank P values of 0.35 and 0.43,
Total, N (%) Nodal, N (%) Extranodal, N (%) 2-sided P value*
Number of patients 234 130 (56) 104 (44)
S0014
S0313
S1001
60 (26) 43 (18) 131 (56)
33 (26) 21 (16) 76 (58)
27 (26) 22 (21) 55 (53)
Age in years, median (range) 62 (18-85) 62 (23-85) 64 (18-85) 0.69†
Male 124 (53) 67 (52) 57 (54) 0.69
Zubrod Performance Status
0-1 2 227 (97) 7 (3) 128 (98) 2 (2) 99 (95) 5 (5)
I II No evidence of disease
135 (58) 95 (41) 4 (2)
76 (58) 51 (39) 3 (2)
59 (57) 44 (42) 1 (1)
0.25
0.75
Bulky** 2 (0.8) 0 (0) 2 (2) 0.20
B symptoms 46 (20) 25 (19) 21(20) 0.87
Elevated LDH 47 (20) 22 (17) 25 (24) 0.19
SM-IPI score
0 1 2 3 4
Treatment R-CHOP R-CHOP + RT R-CHOP + RT + 90Y-IT
0.26
36 (15) 123 (53) 60 (26) 14 (6) 1 (0.4)
119 (51) 60 (26) 55 (24)
24 (18) 70 (54) 28 (22) 8 (6)
(0)
69 (53) 33 (25) 28 (22)
12 (11) 53 (51) 32 (31) 6 (6) 1 (1)
50 (48) 27 (26) 27 (26)
0.68
IFRT dose, cGy¥ median (range) 4140 (400-5,400) 4140 (3,780-5,400) 4140 (400-5,000) .38†
Complete surgical excision before treatment 12 (5) 10 (8) 2 (2) .07
Cgy: centi-gray; IFRT: involved-field radiotherapy; LDH: lactate dehydrogenase; NED: no evidence of disease; R-CHOP: rituximab, cyclophos phamide, doxorubicin, vincristine, prednisone; SM-IPI: stage-modified international prognostic index; 90Y-IT: ibritumomab tiuxetan.** Bulky disease: any mass ≥10 cm in diameter or a mediastinal mass >1/3 chest diameter. * Fisher’s exact P values calculated exclude missing or un classifiable/unevaluable values. † Wilcoxon sum rank test. ¥ 107 patients reported total RT dose (51 had extranodal disease).
respectively). Of 55 patients with extranodal disease treated on S1001, five (9%) patients had a positive iPET, 47 (85.5%) patients had a negative iPET, and three (5.5%) pa tients did not have an iPET. In the five patients with extra nodal disease and a positive iPET, all received IFRT and one progressed. Among 123 patients on S1001 who had available measurement of the largest lymph node or mass diameter, the median of the largest diameter was 3.5 cm (range, 1.0–9.7 cm). There was no difference in 5-year PFS or OS for patients with the largest diameter above the median compared those with the largest diameter below the median (2-sided log-rank P values of 0.36 and 0.61), respectively. There were 50 patient deaths. Of these, the cause of death was lymphoma in 16 (32%), second cancer
in six (12%), other in 15 (30%), and unknown in 13 (26%). Patients with LS DLBCL treated on three SWOG studies (S0014, S0313, and S1001) had excellent and prolonged PFS and OS regardless of extranodal versus nodal pres entation or receipt of consolidative radiotherapy. As seen in previous studies, there was a continuous rate of relapse without plateau of the PFS curves.6 The most common known cause of death was lymphoma, which supports the need for long term follow-up. Our results contrast with those from Bobillo et al.3 and do not support extranodal disease as an adverse prog nostic factor for patients with LS DLBCL. There are sev eral differences between the two patient populations. The SWOG population included 41% stage II disease, while the
Bobillo dataset was exclusively stage I disease. An analysis of the 135 patients with stage I disease in our dataset showed no difference in the estimated 10-year PFS or OS when comparing extranodal versus nodal presentations. The most common sites of extranodal disease presenta tion were different between the two analyses. In the SWOG dataset, the most common extranodal sites were head and neck (44%), bone (13%), skin/muscle/soft tissue (12%), and gastro-intestinal tract. Although the estimated rates of 10-year OS within the subgroups of extranodal disease were similar, ranging from 63-100%, patient numbers in each subgroup were too small to make de finitive conclusions about risk based on disease site. As the most common site of extranodal disease in the SWOG dataset was head and neck and this group was amongst the lowest estimated 10-year PFS and OS (Online Supple mentary Table S1), we compared outcomes between extranodal and nodal disease in this subset and found no significant difference in survival. Another group found that
extranodal presentation of limited stage DLBCL in the head and neck bene
tted from radiation, however when we compared outcomes between patients in this sub group who received and did not receive IFRT, we found no difference in survival.7 In the Bobillo dataset, the most common extranodal sites were GI tract (27%), bone (21%), head and neck (15%), and testis (9%). An additional differ ence between the two studies was that patients with tes ticular involvement did not enroll on the SWOG studies. As testicular lymphoma carries a particularly high risk of relapse, Bobillo et al. performed a survival subanalysis ex cluding patients with testicular involvement.8,9 They found no difference from their original results. Analysis of a larger population of LS DLBCL could have the statistical power necessary to determine whether a specific extra nodal site of disease contributes to risk for relapse. Patients in the SWOG dataset generally received fewer cycles of RCHOP (maximum 4 cycles vs. 36% receiving 6 cycles) and had a higher median radiation dose (4,140 cGy
Figure 1. Estimated 10-year survival is not statistically different between patients presenting with nodal versus extranodal presentation of limited stage diffuse large B-cell lymphoma. (A) Estimated 10-year progression-free survival. (B) Estimated 10-year overall survival. Conf.Int.: confidence interval.

Figure 2. Estimated 5-year survival was not statistically different in the 104 patients with limited stage diffuse large B-cell lymphoma who were treated with or without radiation. (A) Estimated 5-year progression-free survival. (B) Estimated 5-year overall survival. RCHOP: rituximab, cyclophos-phamide, doxorubicin, vincristine, prednisone.

vs. 3,060 cGy) when compared to patients in the Bobillo dataset. It is unclear whether differences in therapy could be the reason for the contrasting results. Finally, there were too few patients with extranodal dis ease treated on the S1001 study that had a positive iPET to make a recommendation for PET-adapted IFRT. Unlike the Bobillo study, the SWOG experience was pros pective and enrolled patients across the National Clinical Trials Network. Although patients enrolled on clinical trials may be biased toward more favorable characteristics, this may be less of an issue with limited stage presentations of DLBCL.2 A strength of our study is that patients were enrolled throughout the National Clinical Trials Network including community sites, which reflects a “real-world” setting.10 Based upon our analysis, patients with extra nodal presentations of LS DLBCL should be approached like those with nodal presentations, with a risk-adapted approach rather than uniform IFRT. Our results support the NCCN guidelines in this setting. Future trials are needed to determine if subsets of patients may benefit from response adaptation.
Deborah M. Stephens,1 Hongli Li,2 Louis S. Constine,3 Thomas J. Fitzgerald,4 John P. Leonard,5 Brad S. Kahl,6 Joo Y. Song,7 Michael L. LeBlanc,2 Sonali M. Smith,8 Daniel O. Persky9 and Jonathan W. Friedberg10
1Division of Hematology, University of Utah, Salt Lake City, UT; 2SWOG Statistics and Data Management Center, Fred Hutchinson Cancer Research Center, Seattle, WA; 3Departments of Radiation Oncology and Pediatrics, University of Rochester, Rochester, NY; 4Imaging and Radiation Oncology Core (IROC), Lincoln, RI; 5Division of Hematology and Medical Oncology, Weill Cornell Medical Center, New York, NY; 6Department of Medicine, Washington University School of Medicine, St. Louis, MO; 7Department of Pathology, City of Hope, Duarte, CA; 8Section of Hematology/Oncology, University of Chicago, Chicago, IL; 9Division of Hematology/Oncology, University of Arizona, Tucson, AZ and 10Division of Hematology/Oncology, University of Rochester, Rochester, NY, USA
D. M. STEPHENS - Deborah.stephens@hci.utah.edu
1. Poeschel V, Held G, Ziepert M, et al. Four versus six cycles of CHOP chemotherapy in combination with six applications of rituximab in patients with aggressive B-cell lymphoma with favourable prognosis (FLYER): a randomised, phase 3, non-
https://doi.org/10.3324/haematol.2022.281004
Received: March 8, 2022.
Accepted: July 7, 2022. Prepublished: July 14, 2022.
©2022 Ferrata Storti Foundation Published under a CC BY-NC license
DMS has received research funding from Acerta Pharma, Gilead Sciences, Karyopharm Therapeutics, Mingsight, Arqule, Novartis, Verastem, Juno Therapeutics; she has received consulting fees from Pharmacyclics/Janssen, Karyopharm Therapeutics, Beigene, Innate, AstraZeneca, Abbvie, CSL Behring, Celegene, TG Therapeutics, and Innate Pharma. JPL has received research funding from Genentech; he has received consulting fees from AbbVie, AstraZeneca, Bayer, Bristol-Myers Squibb/Celgene,Epizyme, Genentech/Roche, GenMab, Gilead/Kite, Incyte, Janssen, Karyopharm, MEI, Miltenyi, Regeneron, and Sutro. BSK has received research funding from Abbvie, BeiGene, AstraZeneca, and Acerta; he has received consulting fees from Abbvie, ADCT, AstraZeneca, Beigene, Celgene, Teva, Janssen, MTEM, Bayer, InCyte, Adaptive, Genentech, Roche, MEI, KITE, TG Therapeutics, Epizyme, and Takeda. SMS has received research funding from Portola; she has received consulting fees from ADC Therapeutics, Gilead, Kite, BMS, Morphosys, Adaptive,Janssen, Karyopharm, Genentech, TGTX, Bayer, and Celgene. JWF participates in DSMC for Bayer, Acerta, and Novartis. Since completion of this work, DOP is now an employee of Gilead.
DMS, HL, SMS, JWF, and DOP designed the research, collected and analyzed data, drafted the original manuscript, revised the manuscript, and approved the final draft. LSC, TJF, JPL, BSK, JYS, and MLL collected and analyzed data, revised the manuscript, and approved the final draft.
NIH/NCI/NCTN grants U10CA180888, U10CA180819, U10CA180820, U10CA180821, U10CA180882; and by Spectrum Pharmaceuticals, Inc. and Biogen IDEC Pharmaceuticals Corp. (Biogen Inc.).
Original data and protocols can be obtained by emailing the corresponding author.
inferiority trial. Lancet. 2019;394(10216):2271-2281.
2. Persky DO, Li H, Stephens DM, et al. Positron emission tomography-directed therapy for patients with limited-stage diffuse large B-cell lymphoma: results of Intergroup National
Clinical Trials Network Study S1001. J Clin Oncol. 2020;38(26):3003-3011.
3. Bobillo S, Joffe E, Lavery JA, et al. Clinical characteristics and outcomes of extranodal stage I diffuse large B-cell lymphoma in the rituximab era. Blood. 2021;137(1):39-48.
4. Persky DO, Unger JM, Spier CM, et al. Phase II study of rituximab plus three cycles of CHOP and involved-field radiotherapy for patients with limited-stage aggressive B-cell lymphoma: Southwest Oncology Group study 0014. J Clin Oncol. 2008;26(14):2258-2263.
5. Persky DO, Miller TP, Unger JM, et al. Ibritumomab consolidation after 3 cycles of CHOP plus radiotherapy in high-risk limitedstage aggressive B-cell lymphoma: SWOG S0313. Blood. 2015;125(2):236-241.
6. Stephens DM, Li H, LeBlanc ML, et al. Continued risk of relapse independent of treatment modality in limited-stage diffuse large B-cell lymphoma: final and long-term analysis of
Southwest Oncology Group Study S8736. J Clin Oncol. 2016;34(25):2997-3004.
7. Ermann DA, Vardell VA, Shah H, et al. Treatment outcomes of consolidative radiation in extranodal early-stage diffuse large Bcell lymphoma. Blood. 2021;138(Suppl 1):S49.
8. Zucca E, Conconi A, Mughal TI, et al. Patterns of outcome and prognostic factors in primary large-cell lymphoma of the testis in a survey by the International Extranodal Lymphoma Study Group. J Clin Oncol. 2003;21(1):20-27.
9. Takahashi H, Tomita N, Yokoyama M, et al. Prognostic impact of extranodal involvement in diffuse large B-cell lymphoma in the rituximab era. Cancer. 2012;118(17):4166-4172.
10. Maurer MJ, Ghesquières H, Link BK, et al. Diagnosis-totreatment interval is an important clinical factor in newly diagnosed diffuse large B-cell lymphoma and has implication for bias in clinical trials. J Clin Oncol. 2018;36(16):1603-1610.
Direct oral anticoagulants (DOAC) have a predictable anticoagulant effect, a rapid onset and offset of action, and fewer drug-drug interactions than vitamin K antag onists (VKA). These compounds have demonstrated similar efficacy and a better safety profile compared to VKA for the treatment of venous thromboembolism (VTE) 1 and for stroke prevention in patients with nonvalvular atrial fibrillation (FANV) 2 in large randomized controlled trials and meta-analyses. Patients with antiphospholipid antibody syndrome (APS) require long-term anticoagulation for the secondary prevention of thrombotic events. 3,4 In this setting, VKA were shown to be more effective than DOAC 5-7 and are therefore recommended by international guidelines. 4 However, the risk of recurrent thrombosis remains high even with VKA treatment, varying from 3% to 24%,8,9 and even increasing the intensity of VKA therapy does not reduce the probability of recurrence. 8,10 It is clear that adequate anticoagulation therapy still represents a clinical challenge in patients with APS and further investigation is needed before declaring DOAC ineffective. It has been reported that patients with pre vious arterial or venous manifestation recur with the same type of thromboses and that the risk of recurrence on DOAC is higher in patients with a history of arterial events.11 Two randomized clinical trials (RCT) comparing DOAC and warfarin in APS have been prematurely inter rupted due to the evidence of increased incidence of thrombotic events in the DOAC group,6,7 especially strokes. However, it remains unclear whether VKA are more effective than DOAC also in patients with VTE his tory and no arterial events. The aim of our study was to provide the best evidence from RCT on the risk of major vascular events and bleeding in patients with APS treated with DOAC versus warfarin and to evaluate if pa tients with no history of arterial thrombosis may be can didate to treatment with DOAC. We performed a systematic review and meta-analysis of the literature including RCT that investigated the role of DOAC in patients with APS. For this purpose, PubMed, Medline, Embase and Cochrane databases were searched (from inception to 25/05/2022), according to the PRISMA guidelines. A combination of the following titles was used: "antiphospholipid syndrome" and "direct oral anticoagulants" or "apixaban", "dabigatran", "edox aban", "rivaroxaban". Two physicians (IG and FD) inde pendently reviewed titles and abstracts of manuscripts detected through database searches to identify poten
tially suitable studies for further evaluation. The number of arterial and venous thrombotic events and of major bleedings, according to the International Society on Thrombosis and Hemostasis definition, by treatment group was collected. A composite outcome of arterial and venous events plus major hemorrhagic events was compared between patients in treatment with DOAC or warfarin. Efficacy and safety were individually calculated and a sub-group analysis of separate arterial and venous events was also performed. Finally, a comparison of ef ficacy was done in patients without previous history of arterial events. We calculated relative risk and cor responding 95% confidence interval (CI) for each out come. Outcomes across the studies were combined using the restricted maximum-likelihood method and compared with the DerSimonian and Laird random-ef fects model. We assessed and quantified statistical het erogeneity across the studies using the Cochran Q statistic and I 2 test. All analyses were performed by STATA version 17.0 software for Mac (StataCorp. 2019. Stata Statistical Software: Release 17. StataCorp Ltd, College Station, TX, USA).
Four RCT comparing DOAC and warfarin in patients with APS were selected, three with rivaroxaban and one with apixaban. A total of 468 patients were included in this meta-analysis, 231 randomized to DOAC and 237 to war farin. The weighted mean age was 48.1 years with a higher prevalence of women (68.8%). Treatment assign ment was open label in each study.
In total, 51 major events (10.9%, 95% CI: 8.08-13.72) were recorded in the entire study population: 26 arterial thromboses (51.0%), five venous thromboses (9.8%) and 20 major bleedings (39.2%). The number of events was greater in the DOAC group (15.1%) than in the warfarin group (6.7%) with a risk ratio (RR) of 2.61 (95% CI: 0.957.19), that was close to statistical significance ( P =0.06) (Figure 1).
Treatment with DOAC was associated with a more than 3-fold increased risk of thrombotic events (RR 3.50, 95% CI: 1.04-11.84) as compared to warfarin (Figure 2A). There was no difference in the number of major bleedings be tween patients treated with DOAC and warfarin (Figure 2B).
The number of arterial events was significantly higher in the DOAC group (9.9%) compared with the warfarin group (1.3%) with a RR of 4.55 (95% CI: 1.63-12.72) (Figure 2C). The majority of arterial events were strokes (86.3%) with an increased risk of cerebral ischemic events of 13.6 times
(95% CI: 2.63-70.68) with DOAC. There was no difference in the risk of VTE between the groups (Figure 2D). The number of patients with no prior history of arterial thrombotic events was 355 (75.8%) with 177 patients as signed to DOAC and 178 to warfarin. The number of events recorded was greater in DOAC-treated patients (5.6%) than in warfarin-treated patients (1.1%) with a RR


of thrombosis recurrence of 3.05 (95% CI: 0.91-10.21), which was close to statistical significance ( P =0.07) (Fig ure 3). All recorded events were arterial events in the DOAC group while events in the warfarin group were two deep vein thromboses.
Heterogeneity among the studies was moderate (I 2 =40.7%), but not significant for the principal analysis
Figure 1. Incidence of events in patients treated with direct oral anticoagulants compared with warfarin. DOAC: direct oral anti coagulants; N: number; CI: confidence interval.
D
Figure 2. Comparison between patients treated with direct oral anticoagulants or warfarin. (A) Incidence of thrombotic events, (B) major bleedings, (C) arterial events and (D) venous events. DOAC: direct oral anticoagulants; N: number; CI: confidence interval; VTE: venous thromboembolism.
Figure 3. Incidence of thrombotic events in patients without history of arterial events treated with direct oral anticoagulants compared with warfarin. DOAC: direct oral anticoagulants; N: number; CI: confidence interval.
(Figure 1) and low or absent for all the other analyses. In this meta-analysis we confirmed that DOAC are less effective than warfarin in preventing recurrence of thrombotic events in APS patients. The excess of throm bosis in patients treated with DOAC was due to arterial events, while we found no difference in the occurrence

of VTE between the two treatment groups. It has been suggested that the use of DOAC may be con sidered in some selected cases of APS, such as individ uals with a history of a single venous thrombosis or with a low-risk APL antibody profile, but, until now, no studies are available to support this hypothesis.

We found that DOAC therapy is associated with an in creased risk of arterial events, particularly stroke, also in “high-risk” APS patients treated for prior venous thrombotic events or miscarriages. Arterial events were also reported in patients with “low-risk” APL antibody profile, but only few patients with these characteristics were included in the studies selected for our metaanalysis, and, thus, no conclusions can be drawn. Given the high risk of arterial events in APS patients, al ternative approaches may be considered in future studies. One of these includes the association of DOAC and low dose aspirin (LDA), for which there are currently insufficient data to provide any recommendation. LDA, in combination with prophylactic dose low molecular weight heparin (LMWH), is the standard of treatment during pregnancy for obstetric APS12 and the use of LDA has been associated with the same risk of first event compared with LDA plus warfarin in primary prevention of patients positive for antiphospholipid antibodies.13
Few data exist on the association of LDA and warfarin for the secondary prevention of thrombotic events in APS. In a small cohort of patients, this drug combination was associated with increased risk of bleeding and no effect on thrombosis recurrence.14 Yet, this strategy is recommended by the European Alliance Of Association For Rheumatology guidelines as an option following a first arterial thrombosis or recurrent arterial or venous thrombosis in APS patients.15
In conclusion, the use of DOAC as a single therapeutic approach appears to be insufficiently effective in high risk patients with APS, even without a history of arterial thrombosis. Since in patients treated with VKA the risk of thrombosis remains non-negligible,8-10 further studies are needed to assess alternative approaches in this set ting.
1. van Es N, Coppens M, Schulman S, Middeldorp S, Buller HR.
Direct oral anticoagulants compared with vitamin K antagonists for acute venous thromboembolism: evidence from phase 3 trials. Blood. 2014;124(12):1968-1975.
2. Ruff CT, Giugliano RP, Braunwald E, et al. Comparison of the efficacy and safety of new oral anticoagulants with warfarin in patients with atrial fibrillation: a meta-analysis of randomised trials. Lancet. 2014;383(9921):955-962.
3. Ruiz-Irastorza G, Cuadrado MJ, Ruiz-Arruza I, et al. Evidencebased recommendations for the prevention and long-term management of thrombosis in antiphospholipid antibodypositive patients: report of a task force at the 13th International Congress on antiphospholipid antibodies. Lupus. 2011;20(2):206-218.
4. Keeling D, Mackie I, Moore GW, Greer IA, Greaves M, British Committee for Standards in H. Guidelines on the investigation and management of antiphospholipid syndrome. Br J Haematol.
Igor Giarretta,1 Walter Ageno2 and Francesco Dentali1,2
1Department of Emergency of High-Specialty and Medical Center, ASST-Settelaghi and 2Department of Medicine and Surgery, University of Insubria, Varese, Italy
F. DENTALI - francesco.dentali@asst-settelaghi.it
https://doi.org/10.3324/haematol.2022.281586
Received: June 14, 2022.
Accepted: July 12, 2022. Prepublished: July 21, 2022.
©2022 Ferrata Storti Foundation
Published under a CC BY-NC license
No conflicts of interest to disclose.
Contributions IG, WA and FD conceptualized the study. IG designed and performed the statistical analyses. IG and FD wrote the first draft of the manuscript. FD and WA revised the final version of the paper. All authors participated in data collection, revised and approved the final manuscript. The corresponding author attests that all listed authors meet authorship criteria.
The data presented in this study are available upon request addressed to the corresponding author.
2012;157(1):47-58.
5. Ordi-Ros J, Saez-Comet L, Perez-Conesa M, et al. Rivaroxaban versus vitamin K antagonist in antiphospholipid syndrome: a randomized noninferiority trial. Ann Intern Med. 2019;171(10):685-694.
6. Pengo V, Denas G, Zoppellaro G, et al. Rivaroxaban vs warfarin in high-risk patients with antiphospholipid syndrome. Blood. 2018;132(13):1365-1371.
7. Woller SC, Stevens SM, Kaplan D, et al. Apixaban compared with warfarin to prevent thrombosis in thrombotic antiphospholipid syndrome: a randomized trial. Blood Adv. 2022;6(6):1661-1670.
8. Crowther MA, Ginsberg JS, Julian J, et al. A comparison of two intensities of warfarin for the prevention of recurrent thrombosis in patients with the antiphospholipid antibody syndrome. N Engl J Med. 2003;349(12):1133-1138.
9. Prandoni P, Simioni P, Girolami A. Antiphospholipid antibodies,
recurrent thromboembolism, and intensity of warfarin anticoagulation. Thromb Haemost. 1996;75(5):859.
10. Finazzi G, Marchioli R, Brancaccio V, et al. A randomized clinical trial of high-intensity warfarin vs. conventional antithrombotic therapy for the prevention of recurrent thrombosis in patients with the antiphospholipid syndrome (WAPS). J Thromb Haemost. 2005;3(5):848-853.
11. Dufrost V, Risse J, Zuily S, Wahl D. Direct oral anticoagulants use in antiphospholipid syndrome: are these drugs an effective and safe alternative to warfarin? A systematic review of the literature. Curr Rheumatol Rep. 2016;18(12):74.
12. Cohen H, Hunt BJ, Efthymiou M, et al. Rivaroxaban versus warfarin to treat patients with thrombotic antiphospholipid syndrome, with or without systemic lupus erythematosus (RAPS): a randomised, controlled, open-label, phase 2/3, non-
inferiority trial. Lancet Haematol. 2016;3(9):e426-436.
13. Cuadrado MJ, Bertolaccini ML, Seed PT, et al. Low-dose aspirin vs low-dose aspirin plus low-intensity warfarin in thromboprophylaxis: a prospective, multicentre, randomized, open, controlled trial in patients positive for antiphospholipid antibodies (ALIWAPAS). Rheumatology (Oxford). 2014;53(2):275-284.
14. Bala MM, Celinska-Lowenhoff M, Szot W, et al. Antiplatelet and anticoagulant agents for secondary prevention of stroke and other thromboembolic events in people with antiphospholipid syndrome. Cochrane Database Syst Rev. 2020;10(10):CD012169.
15. Cohen H, Cuadrado MJ, Erkan D, et al. 16th International Congress on Antiphospholipid Antibodies task force report on antiphospholipid syndrome treatment Trends. Lupus. 2020;29(12):1571-1593.
Treatment for lower-risk myelodysplastic syndromes (MDS),1 defined by the International Prognostic Scoring System as ‘low-’ and ‘intermediate-1’-risk,2 is aimed at managing symptomatic cytopenias.3 Erythropoiesisstimulating agents remain the first-line treatment for most patients, although lenalidomide is an established treatment option for patients with lower-risk MDS with deletion 5q and luspatercept has shown efficacy in trans fusion-dependent MDS associated with ring sideroblasts and/or the SF3B1 mutation.4 Despite these advances, there remains a paucity of therapies for patients with lower-risk MDS that target the ‘natural history’ of the disease course. Myeloid-derived suppressor cells (MDSC) are a hetero geneous group of immature myeloid cells associated with immunosuppression, inflammation, and cancer. Aberrant accumulation of MDSC has been observed in the bone marrow of patients with MDS and is thought to play a pa thogenic role in the suppression of hematopoiesis.5-7 The myeloid differentiation antigen CD33, an established drug target in acute myeloid leukemia,8-10 is highly expressed on MDSC isolated from patients with MDS, thus warrant ing assessment of CD33-targeted therapies as a means to ‘suppress the suppressor’ and thereby facilitate erythro poiesis.5
BI 836858 is a fully humanized IgG1 unconjugated antiCD33 monoclonal antibody.11 Preclinically, BI 836858 re duced MDSC by antibody-dependent cellular cytotoxicity and prevented immune-suppressive cytokine secretion.12 Here, we report the findings of an open-label, phase I/II dose-escalation study of BI 836858 in patients with trans fusion-dependent low- or intermediate-1-risk MDS (NCT02240706).
Details of the study methodology are available on request. Briefly, BI 836858 was administered as a rate-controlled intravenous infusion on days 1 and 15 of a 28-day treat ment cycle without premedication. In phase I, the starting dose was 20 mg and, in the absence of dose-limiting toxicities, dose escalation up to 320 mg was planned. Pa tients were eligible to receive up to eight repeated ad ministrations of BI 836858 and could continue treatment beyond four cycles if they showed clinical benefit and if tolerability was acceptable, until progressive disease or other withdrawal criteria occurred. In phase II, patients were to be randomized to BI 836858 plus best supportive care or best supportive care alone. However, phase II of this trial was not conducted due to a decision by the
sponsor to terminate the study based on a lack of singleagent efficacy (hematologic response) in the dose-esca lation phase.
The primary endpoints for the study were the maximum tolerated dose and number of patients with dose-limiting toxicities during the period of evaluation of maximum tol erated dose. Secondary endpoints included: red blood cell transfusion independency; neutrophil, platelet and ery throid hematologic improvement; time to the erythroid hematologic response; mean hemoglobin increase ≥1.5 g/dL; overall objective response; and duration of response. Thirty-six patients were enrolled and 27 patients were treated with BI 836858 (Table 1, Online Supplementary Fig ure S1). The median duration of treatment was 114 days (range, 1–811 days) and a median of five cycles were initi ated (range, 1–29). Dose-limiting toxicities were observed in three of the 24 patients assessed during the period of evaluating the maximum tolerated dose (3 patients were excluded from evaluation of the maximum tolerated dose as they had <2 administrations in cycle 1 [1 patient in the 20 mg cohort and 2 patients in the 320 mg cohort]). One patient in the 80 mg group had a grade 3 decrease in neu trophil count and grade 4 sepsis during cycle 1, leading to a greater than 8-week delay in starting cycle 2. The pa tient recovered and received a reduced dose in cycle 2 (40 mg) but experienced recurrent grade 3 neutropenia and was unable to start cycle 3 and BI 836858 was dis continued in this patient. Two dose-limiting toxicities oc curred during the phase I expansion cohort stage (320 mg): a grade 2 serious infusion-related reaction (IRR) leading to a dose reduction of BI 836858 and a grade 2 non-serious IRR leading to discontinuation of BI 836858.
As only one dose-limiting toxicity was observed during dose escalation, the maximum tolerated dose was not de termined.
No pharmacokinetic parameters were calculated. Individ ual plasma concentrations of BI 836858 were listed by dose group, cycle and day of treatment, as available. Bio analytical results of further cycles were listed when avail able and all dose groups were represented in the lists. Table 2 shows a comparison of maximum plasma concen trations at day 1 and day 14 in cycle 1 and day 1 and day 14 in cycle 2. For the 20 mg dose group, the number of avail able bioanalytical results was not sufficient to calculate descriptive statistics at all time points. Maximum plasma concentrations increased in a more than dose-propor
Table 1. Baseline demographics and characteristics of patients with low- or intermediate-1-risk myelodysplastic syndrome treated with BI 836858.
Characteristic 20 mg N=3 40 mg N=3 80 mg N=6 160 mg N=4 320 mg N=11
All patients N=27
Male, N (%) 3 (100) 3 (100) 5 (83.3) 2 (50.0) 7 (63.6) 20 (74.1)
White race, N (%) 3 (100) 3 (100) 6 (100) 4 (100) 11 (100) 27 (100)
Age in years, median
Aged <65 years, N (%) Aged ≥65 years, N (%)
ECOG PS, N (%)
70.0 0 3 (100)
77.0 0 3 (100)
79.5 1 (16.7) 5 (83.3)
67.0 2 (50.0) 2 (50.0)
76.0 0 11 (100)
76.0 3 (11.1) 24 (88.9)
0/1 2 2 (66.7)/1 (33.3) 0 1 (33.3)/2 (66.7) 0 1 (16.7)/5 (83.3) 0 2 (50.0)/2 (50.0) 0 0/10 (90.9) 1 (9.1) 6 (22.2)/20 (74.1) 1 (3.7)
IPSS category, N (%) Low/Int-1 3 (100)/0 1 (33.3)/2 (66.7) 3 (50.0)/3 (50.0) 2 (50.0)/2 (50.0) 4 (36.4)/7 (63.6) 13 (48.1)/14 (51.9)
Revised IPSS category, N (%)
Very low Low Intermediate High Missing
0 3 (100.0) 0 0 0
1 (33.3) 1 (33.3) 0 0 1 (33.3)
1 (16.7) 1 (16.7) 1 (16.7)
3 (50.0)
1 (25.0) 0 1 (25.0) 1 (25.0) 1 (25.0)
2 (18.2) 2 (18.2) 2 (18.2) 0 5 (45.5)
5 (18.5) 7 (25.9) 4 (14.8) 1 (3.7) 10 (37.0)
Previous MDS therapy: yes, N (%) 2 (66.7) 2 (66.7) 6 (100) 3 (75.0) 11 (100) 24 (88.9)
of previous MDS ther apies, median (range) 2.0 (1-3) 2.5 (2-3) 2.0 (1-7) 4.0 (4-6) 3.0 (1-5) 3.0 (1-7)
PS: Eastern Cooperative Oncology Group performance status; Int-1: intermediate-1; IPSS: International Prognostic Scoring System; MDS: myelodysplastic syndromes.
tional behavior. Steady-state plasma concentration be tween cycles 1 and 2 was not proven with statistical sig nificance for the 320 mg dose group, suggesting accumulation which may be expected with repeat IgG dosing, although pharmacokinetic assessments were not performed after cycle 2 to confirm achievement of steady state at later time points nor to confirm the half-life with this dosing regimen once every 14 days. All treated patients experienced at least one adverse event; the most common adverse events were IRR (77.8%),
decreased neutrophil count (29.6%), pyrexia (29.6%) and hyperglycemia (25.9%) (Table 3). Grade 3 and 4 adverse events were reported in 15 (55.6%) and six (22.2%) pa tients, respectively. There was no relationship between dose and incidence of adverse events. Twenty-four (88.9%) patients had adverse events considered related to BI 836858 (3 in the 20 mg cohort, 2 in the 40 mg cohort, 6 in the 80 mg cohort, 4 in the 160 mg cohort and 9 in the 320 mg cohort). The most common drug-related adverse events were IRR (77.8%), decreased neutrophil count
(22.2%), nausea (11.1%) and decreased white blood cell count (11.1%) (Online Supplementary Table S1). One patient (320 mg cohort) had an adverse event leading to dose re duction (grade 2 IRR, also reported as a dose-limiting toxicity). Five (18.5%) patients discontinued treatment due to adverse events: IRR and decreased white blood cell count in one patient, and IRR, decreased neutrophil count, non-cardiac chest pain and muscular weakness (each n=1). Serious adverse events were reported in 13 (48.1%) patients. Four serious adverse events were considered re lated to treatment (IRR [n=3] and sepsis [n=1]). There were no adverse events leading to death during the on-treat ment period. IRR were generally mild, with only one pa tient (3.7%) reporting a grade 3 IRR (Table 3). IRR of grade 2 of higher occurred in 41% of patients. No objective responses were reported. Furthermore, based on investigator assessment, hematologic improve ment or red blood cell transfusion independence was not
observed in any patients. One patient (160 mg cohort) had a mean hemoglobin increase of ≥1.5 g/dL; review of lab oratory and transfusion data indicated that this patient likely qualified as having an erythroid hematologic re sponse. This patient had received treatment for the lon gest period: 811 days.
The trial included a pharmacodynamic analysis of the im pact of BI 836858 on CD33 expression on MDSC in bone marrow and peripheral blood by comparing levels of CD33+HLA-DR Lin MDSC to CD33 HLA-DR Lin leukocytes before and after treatment by fluorescence-activating cell sorting. While the absolute number of CD33+ MDSC de creased with treatment in some patients (Online Supple mentary Figure S2), CD33 leukocytes increased at the same time (data not shown ), indicating that BI 836858 either masked or internalized CD33 molecules on MDSC but did not reduce the number of MDSC. Furthermore, natural killer (NK) cells are effector cells relevant for the
Table 3. All-cause adverse events, described by MedDRA preferred terms, and highest CTCAE grade in patients with low- or intermediate-1-risk myelodysplastic syndrome treated with BI 836858 (n=27). On-treatment period.
Adverse events
All grades, N (%) Grade 1/2, N (%) Grade 3, N (%) Grade 4, N (%)
Total with adverse events 27 (100) 6 (22.2) 15 (55.6) 6 (22.2)
Infusion-related reaction 21 (77.8) 20 (74.0) 1 (3.7) 0
Neutrophil count decreased 8 (29.6) 0 5 (18.5) 3 (11.1)
Pyrexia 8 (29.6) 7 (25.9) 1 (3.7) 0
Hyperglycemia 7 (25.9) 4 (14.8) 3 (11.1) 0
Anemia 6 (22.2) 1 (3.7) 5 (18.5) 0
Dizziness 6 (22.2) 5 (18.5) 1 (3.7) 0
WBC count decreased 6 (22.2) 3 (11.1) 2 (7.4) 1 (3.7)
Diarrhea 5 (18.5) 5 (18.5) 0 0
Fatigue 5 (18.5) 5 (18.5) 0 0
Nausea 5 (18.5) 5 (18.5) 0 0
Peripheral edema
ALT increased
Cough
(18.5) 5 (18.5) 0 0
(14.8) 4 (14.8) 0 0
(14.8)
(14.8) 0 0
Fall 4 (14.8) 2 (7.4) 2 (7.4) 0
Headache
overload
Muscular weakness
Platelet count decreased
Bone pain
Contusion
Decreased appetite
Dehydration
Dyspepsia
Upper respiratory tract infection
Vomiting
(14.8)
(14.8)
(14.8)
(14.8)
(11.1)
(11.1)
(11.1)
(11.1)
(11.1)
(11.1)
(11.1)
(14.8)
(11.1)
(7.4)
(7.4)
(11.1)
(11.1)
(11.1)
(11.1)
(11.1)
(11.1)
(11.1)
0
(3.7) 0
(7.4)
(7.4) 0
The adverse events shown are those occurring in >10% of patients for all grades. AE: adverse event; ALT: alanine aminotransferase; CTCAE: Common Terminology Criteria for Adverse Events; MedDRA: Medical Dictionary for Drug Regulatory Activities; MDS: myelodysplastic syndromes; WBC: white blood cell.
proposed BI 836858 mechanism of action. Accordingly, changes in NK cell numbers (CD3 CD16+ NK cells) and their activation status (CD3 CD16+CD69+ NK cells) were also as sessed. NK cell numbers were relatively low in all patients treated with BI 836858 and no increase in activated NK cells was observed (Online Supplementary Figure S2).
In summary, the maximum tolerated dose of BI 836858 was not reached at doses up to 320 mg in patients with low- or intermediate-1-risk MDS. The most common ad verse event was IRR; the overall adverse event profile was consistent with that expected for patients with MDS. While the overall rate of IRR was high, the rate of grade 3 or higher IRR was consistent with that seen with the antiCD33 agents gemtuzumab ozogamicin,13 and lintuzumab.13 No conclusions on the efficacy of BI 835858 in patients with MDS could be drawn due to premature termination of the trial; however, we observed an erythroid response in a single patient. A limitation of this study was the lack of enrollment of a diverse population of patients, with 100% Caucasian enrollment and imbalanced male/female representation (74% males/26% females). Nevertheless, in contrast to preclinical findings, pharmacodynamic ana lyses indicated that BI 835858 did not activate NK cells or reduce overall MDSC numbers in patients, despite a de crease in CD33 expression. These data do not support the proposed mode of action and are in line with the absence of clinical activity found in the study. The lack of activity in this lower-risk MDS population may reflect that other cell populations, in addition to MDSC, are implicated in the suppression of NK cells in MDS.6 Moreover, MDSC are less predominant in lower-risk MDS than in higher-risk MDS, suggesting that they may play less of a role in the early stages of the natural history of the disease.7
BI 836858 was also assessed in a phase I dose escalation study in patients with relapsed or refractory acute mye loid leukemia (NCT01690624).14 That study was also ter minated prematurely. Consistent with our study, dose-limiting toxicity was not reached (although only doses up to 40 mg were assessed prior to trial termina tion) and BI 836858 had a predictable and manageable tolerability profile, with febrile neutropenia, nausea and IRR being among the most commonly reported all-cause adverse events. As with the current study, pharmacody namic analysis suggested that there may be target en gagement but BI 836858 did not increase activation of effector NK cells. This lack of effector cell function most likely underpins the lack of clinical activity. However, pa tients’ outcomes may improve by targeting MDSC with targets other than CD33, or at an earlier stage of disease development rather than after failure of hypomethylating agents, as in this cohort, when poor outcomes are likely, even in patients with lower-risk MDS. Optimization of dos ing in future studies may also contribute to improving hematopoesis in the setting of MDSC depletion.
In conclusion, evidence of CD33+ MDSC target engagement in this study did not translate into a hematologic response and corresponding clinical efficacy. While development of BI 836858 has been discontinued, this trial demonstrates the feasibility and tolerability of MDSC-targeted ap proaches, using CD33, as applied in transfusion-depend ent lower-risk MDS. It is unknown whether the lack of efficacy reflects a feature of the antibody itself, or whether targeting MDSC is insufficient to elicit an antitumor response. Alternative forms, differing from a ‘naked’ anti-CD33 antibody (e.g., antibody-drug conjugates or bis pecific T-cell engaging antibodies) might be required to induce clinical efficacy. For example, recent preclinical data indicate that a bispecifi c CD33/CD3 antibody may confer anti-MDS activity.15 Furthermore, given the com plexity of the pathogenesis of lower-risk MDS, novel com bination regimens incorporating anti-CD33 antibodies (e.g., with checkpoint inhibitors)15 may be required to ac tivate an immune response.
Rami S. Komrokji,1 Hetty E. Carraway,2 Ulrich Germing,3 Martin Wermke,4 Amer M. Zeidan,5 Eric Fu,6 Björn Rüter,7 Ute Burkard,7 Annika Osswald7 and James M. Foran8
1Malignant Hematology Department, H Lee Moffitt Cancer Center and Research Institute, Tampa, FL, USA; 2Leukemia Program, Taussig Cancer Institute, Cleveland Clinic, Cleveland, OH, USA; 3Department of Hematology, Oncology, and Clinical Immunology, Heinrich-Heine University Dusseldorf, Universitätsklinikum, Dusseldorf, Germany; 4NCT/UCC-ECTU, Medical Faculty Carl Gustav Carus, Technical University, Dresden, Germany; 5Department of Internal Medicine, Section of Hematology, Yale University School of Medicine, New Haven, CT, USA; 6Boehringer Ingelheim Pharmaceuticals, Inc., Ridgefield, CT, USA; 7Boehringer Ingelheim Pharma GmbH & Co. KG, Biberach/Riss, Germany and 8Department of Hematology and Medical Oncology, Mayo Clinic, Jacksonville, FL, USA
Received:
17, 2021.
13, 2022.
23, 2022.
RSK reports a consulting or advisory role for Bristol Myers Squibb, Novartis, Daiichi Sankyo, Pfizer, Janssen, Agios, and Incyte; speakers’ bureau fees from Novartis, Alexion Pharmaceuticals, and Jazz Pharmaceuticals; travel, accommodation, or expenses from Bristol Myers Squibb, Incyte, Alexion Pharmaceuticals, Novartis, Jazz Pharmaceuticals, and Daiichi Sankyo; and stock and other ownership interests in AbbVie. AZ reports honoraria from, and a consulting or advisory role for AbbVie, Otsuka, Pfizer, Bristol Myers Squibb, Jazz Pharmaceuticals, Incyte, Agios, Boehringer Ingelheim, Novartis, Acceleron Pharma, Astellas Pharma, Daiichi Sankyo, Cardinal Health, Taiho Pharmaceutical, Seattle Genetics, BeyondSpring Pharmaceuticals, Trovagene, Takeda, Ionis Pharmaceuticals, and Epizyme; research funding from Bristol Myers Squibb, AbbVie, Astex Pharmaceuticals, Pfizer, AstraZeneca/MedImmune, Boehringer Ingelheim, Trovagene, Incyte, Takeda, Novartis, Aprea Therapeutics, and ADC Therapeutics; and travel, accommodation, or expenses from Pfizer, Novartis, Bristol Myers Squibb, and Trovagene. HEC reports research funding for an investigator-initiated clinical trial from Celgene; sitting on advisory boards for Celgene, Agios, Bristol Myers Squibb, Daiichi, Jazz, Stemline, and Novartis; talks for Agios, Celgene, Agios, Jazz, Novartis, and Stemline; and sitting on an independent review committee for Abbvie, ASTEX, and Takeda. UG reports honoraria from Celgene, Novartis, and Jazz Pharmaceuticals; a consulting or advisory role for Celgene; and research funding from Celgene (institutional), and Novartis (institutional). MW reports honoraria from Bristol Myers Squibb; Merck, Roche, Novartis, Kite, Boehringer Ingelheim, and AstraZeneca; a consulting or advisory role for Bristol Myers Squibb, Novartis, Kite, Heidelberg Pharma, Roche, and Boehringer Ingelheim; and travel, accommodation, or expenses from Glenmark, Bristol Myers Squibb, and AstraZeneca. EF and BR report employment with Boehringer Ingelheim Pharmaceuticals, Inc. UB and AO report employment with Boehringer Ingelheim Pharma GmbH & Co. KG. JMF reports honoraria as a consultant for Revolution Medicines, Inc. and honoraria related to formal advisory activities from Bristol-Myers Squibb Company, Novartis AG, Pfizer Inc., and SERVIER. JMF’s institution has received grant support related to research activities from AbbVie Inc., Actinium Pharmaceuticals, Inc., Aprea Therapeutics, Aptose Biosciences, Boehringer Ingelheim GmbH, H3 Biomedicine Inc., Kura Oncology, Inc., Takeda Oncology, Trillium Therapeutics Inc., and Xencor. The authors did not receive payment related to the development of the manuscript.
RSK, EF, BR, UB, AO, and JMF designed the study. RSK, HEC, VG, MW,
1. Arber DA, Orazi A, Hasserjian R, et al. The 2016 revision to the World Health Organization classification of myeloid neoplasms and acute leukemia. Blood. 2016;127(20):2391-2405.
2. Greenberg P, Cox C, LeBeau MM, et al. International scoring system for evaluating prognosis in myelodysplastic syndromes. Blood. 1997;89(6):2079-2088.
AZ, and JMF conducted the study. EF, BR, UB, and AO analyzed the data. The authors met criteria for authorship as recommended by the International Committee of Medical Journal Editors. All authors participated in manuscript development, approved the final version of the manuscript and agree to be accountable for all aspects of the work, which includes ensuring that questions related to the accuracy or integrity of any part of the work are appropriately investigated and resolved.
Medical writing assistance during the preparation of this manuscript was provided by Lynn Pritchard, of Ashfield MedComms, an Ashfield Health company, which was funded by Boehringer Ingelheim.
This work was supported and funded by Boehringer Ingelheim. Boehringer Ingelheim were given the opportunity to review the manuscript for medical and scientific accuracy as well as intellectual property considerations.
To ensure independent interpretation of clinical study results, Boehringer Ingelheim grants all external authors access to relevant material, including participant-level clinical study data, as needed by them to fulfill their role and obligations as authors under the International Committee of Medical Journal Editors criteria. Clinical study documents and participants’ clinical study data are available to be shared on request after publication of the primary manuscript in a peer-reviewed journal, and if regulatory activities are complete and other criteria met as per the BI Policy on Transparency and Publication of Clinical Study Data (see https://www.mystudywindow.com/msw/datasharing). Bona fide, qualified scientific and medical researchers are eligible to request access to the clinical study data with corresponding documentation describing the structure and content of the datasets. Upon approval, and governed by a legal agreement, data can be shared in a secured data-access system for a limited period of 1 year, which may be extended upon request. Prior to providing access, clinical study documents and data will be examined, and, if necessary, redacted and de-identified, to protect the personal data of study participants and personnel, and to respect the boundaries of the informed consent of the study participants. Researchers should use the https://vivli.org/ link to request access to study data and visit https://www.mystudywindow.com/msw/datasharing for further information.
3. Hellstrom-Lindberg E, Tobiasson M, Greenberg P. Myelodysplastic syndromes: moving towards personalized management. Haematologica. 2020;105(7):1765-1779.
4. Fenaux P, Haase D, Santini V, et al. Myelodysplastic syndromes: ESMO Clinical Practice Guidelines for diagnosis, treatment and follow-up. Ann Oncol. 2021;32(2):142-156.
5. Chen X, Eksioglu EA, Zhou J, et al. Induction of myelodysplasia by myeloid-derived suppressor cells. J Clin Invest. 2013;123(11):4595-4611.
6. Carlsten M, Järås M. Natural killer cells in myeloid malignancies: immune surveillance, NK cell dysfunction, and pharmacological opportunities to bolster the endogenous NK cells. Front Immunol. 2019;10:2357.
7. Kittang AO, Kordasti S, Sand KE, et al. Expansion of myeloid derived suppressor cells correlates with number of T regulatory cells and disease progression in myelodysplastic syndrome. Oncoimmunology. 2016;5(2):e1062208.
8. Castaigne S, Pautas C, Terre C, et al. Effect of gemtuzumab ozogamicin on survival of adult patients with de-novo acute myeloid leukaemia (ALFA-0701): a randomised, open-label, phase 3 study. Lancet. 2012;379(9825):1508-1516.
9. Hills RK, Castaigne S, Appelbaum FR, et al. Addition of gemtuzumab ozogamicin to induction chemotherapy in adult patients with acute myeloid leukaemia: a meta-analysis of individual patient data from randomised controlled trials. Lancet Oncol. 2014;15(9):986-996.
10. Maakaron JE, Rogosheske J, Long M, Bachanova V, Mims AS.
CD33-targeted therapies: beating the disease or beaten to death? J Clin Pharmacol. 2021;61(1):7-17.
11. Vasu S, He S, Cheney C, et al. Decitabine enhances anti-CD33 monoclonal antibody BI 836858-mediated natural killer ADCC against AML blasts. Blood. 2016;127(23):2879-2889.
12. Eksioglu EA, Chen X, Heider KH, et al. Novel therapeutic approach to improve hematopoiesis in low risk MDS by targeting MDSCs with the Fc-engineered CD33 antibody BI 836858. Leukemia. 2017;31(10):2172-2180.
13. Giles FJ, Cortes JE, Halliburton TA, et al. Intravenous corticosteroids to reduce gemtuzumab ozogamicin infusion reactions. Ann Pharmacother. 2003;37(9):1182-1185.
14. Vasu S, Altman JK, Uy GL, et al. A phase I study of the fully human, fragment crystallizable-engineered, anti-CD-33 monoclonal antibody BI 836858 in patients with previouslytreated acute myeloid leukemia. Haematologica. 2021;107(3):770-773.
15. D'Souza S, Murata H, Jose MV, et al. Engineering of cell membranes with a bisphosphonate-containing polymer using ATRP synthesis for bone targeting. Biomaterials. 2014;35(35):9447-9458.
Prevention and treatment of graft-versus-host disease (GvHD) still represent a major unmet need of allogeneic stem cell transplantation (HSCT). Roughly half of the pa tients receiving HSCT will develop acute GvHD (aGvHD) and half will obtain complete resolution of GvHD through cor ticosteroids in combination with immunosuppressive ther apy; steroid refractory aGvHD will lead to death of around 20% of patients and the remaining will experience an aber rant immune activation possibly leading to chronic GvHD (cGvHD).1-2
Early identification of patients at higher risk of developing steroid-refractory aGvHD and GvHD-related mortality is a paramount.
Refined immunologic profiles and machine learning algo rithms have been recently investigated,3 aiming at the es timation of clinical outcomes after post-transplant cyclophosphamide (PTCy)–based GvHD prophylaxis. Unfor tunately, clinical scoring systems, easier to apply in clinical practice, have intrinsic limitations: if the maximum grade of aGvHD is strongly correlated with mortality, this can be determined only retrospectively, while the grade at onset is dramatically inconsistent due to subsequent evolutions. The Minnesota group has provided a risk score model for aGvHD classifying patients into high risk (HR) or standard risk (SR) at aGvHD onset. This score was firstly validated in a CIBMTR cohort of 1,723 patients and recently confirmed in a multicenter cohort of 355 patients.1,4-6 The original study of the Nineties involved over 800 patients. The Min nesota aGvHD risk score can be used in real time at the bedside and proved to offer a reliable stratification of pa tients with reference to both probability of aGvHD overall response and transplant related mortality (TRM).
The aim of our study was to assess the efficacy of the Min nesota risk score as a tool to identify patients at higher risk of mortality at onset of aGvHD in the setting of PTCy, in creasingly adopted by the worldwide community in all types of donor type and matching. Of note, GvHD prophy laxis was based on PTCy with sirolimus alone for matched related donor (MRD) HSCT, or in combination with myco phenolate mofetil in case of a mismatched related (MMRD) or matched unrelated donor (MUD), in accordance with local guidelines.7
Categorical variables were described as frequencies and continuous variables as median value and interquartile range. Acute GvHD and cGvHD were graded according to MAGIC criteria8 and NIH 2014 criteria.9 TRM was defined as
death from any cause while in continuous remission of the primary disease. Overall survival (OS) was defined as the interval from allogeneic HSCT to death whatever the cause, and patients were censored at the date of last contact if alive. Progression-free survival (PFS) was defined as the in terval from HSCT to either relapse or progression or death in remission (whichever came first). The probabilities of OS and PFS were estimated using the Kaplan-Meyer estima tor.10 Cumulative incidences were estimated for engraft ment, GvHD, relapse and TRM to accommodate competing risks. Relapse or progression was a competing risk for TRM. Relapse/progression and death from any causes were com peting risks for GvHD.11 Log-rank test was used for univari ate comparisons of survival curves,12 while the Gray’s test was conducted to compare cumulative incidences of com peting-risks endpoints.13 Factors predicting aGvHD were studied using multivariable Cox regression analysis.14 The proportional hazard assumption was met for all variables. All tests were 2-sided, and a α-1 error of 0.05 was con sidered significant for the determination of factors associ ated with time to event. Statistical analyses were performed with R 4.0.4 (R Development Core Team, Vienna, Austria) software. The Minnesota risk score was calculated based on the number of involved organs and organ stage, thus determining the severity of GvHD at onset as pre viously detailed.4-5
Our analysis consisted in a prospective single-center study, involving all consecutive allogeneic transplants performed in 315 patients at our center for any disease, from any donor type and under PTCy-based GvHD prophylaxis,7 be tween January 2016 and June 2020. Patients’ median age was 52.7 years (range, 15.3-75.6). The median follow-up was 2.4 years (range, 1.4-3.5). Patients and transplant features are described in Table 1.
The 2-years probability of OS was 66.2% (95% confidence interval [CI]: 60.4-71.4), the 2-years probability of PFS was 62.5% (95% CI: 56.6-67.8). The 2-years cumulative inci dence of relapse was 20% (95% CI: 15.6-24.8) while the 2years cumulative incidence of TRM was 17.5% (95% CI: 1.4-22.1) (Online Supplementary Figure S1).
Acute GvHD was diagnosed in 139 patients and the median time from transplant to GvHD onset was 30 days (range, 1250). Day-100 cumulative incidence of aGvHD grade II-IV and III-IV was 24.8% (95% CI: 26.5–37.4) and 14.9% (95% CI: 11.2–19.1) respectively. First-line systemic treatment at di agnosis of aGvHD grade II-IV – irrespective of single-organ
manifestation or multi-organ manifestation - consisted of high dose steroids (methylprednisolone 2 mg/kg/day) ac cording to the EBMT recommendation15 and agents beyond the first line included extracorporeal photopheresis, ruxo litinib and infliximab. Multivariate analysis outlined donor type (MRD vs. MUD vs. MMRD ) and donor age indepen dently associate with aGvHD (Online Supplementary Table S1)
The 2-years cumulative incidence of cGvHD was 31.9% (95% CI: 26.5-37.4) overall, while moderate/severe cGvHD was 24.5% (95% CI: 19.6-29.6) (Online Supplementary Figure S2). First-line systemic treatment consisted of steroids (prednisone 1 mg/kg/day) and agents beyond the first line included extracorporeal photopheresis, ruxolitinib, ibrutinib and methotrexate.
Among patients diagnosed with aGvHD, initial GvHD organ involvement was skin only (54%), upper and/or lower gas tro-intestinal tract only (10%), liver only (1.4%) or multiorgan (31.7%).
Of the 139 patients, 46 (33.1%) were categorized as Minne sota HR aGvHD and 93 (66.9%) as Minnesota SR aGHHD. GvHD treatment was initiated at GvHD declaration in both SR and HR. At onset of steroid therapy, 36% of patients had grade I GvHD, 25.9% grade II GvHD, 24.5% had grade III GvHD and 12.2% had grade IV GvHD. Overall, three patients did not receive any steroid systemic or topical treatment; nine patients with topical therapy only were in complete response at day 28, one in partial response.
Day-28 overall response (complete remission [CR], partial remission [PR]) was higher in Minnesota SR (96% - 78 pa tients CR, 9 patients PR) versus Minnesota HR aGvHD (63% - 27 patients CR, 2 patients PR) P<0.0001. Overall, in the SR aGvHD cohort two patients were not evaluable due to dis ease progression and related treatment, while in the HR aGvHD cohort 17 patients were considered non-responders and all but one died due to aGvHD (n=12), disease progres sion (n=2), infections (n=2).
The 1-year cumulative incidence of cGvHD was not signifi cantly different between SR and HR aGvHD patients: 9% (95% CI: 1-36) for Minnesota SR and 26% (95% CI: 14-49) for Minnesota HR, P=0.065. In multiple regression analysis, adjusting for clinically sig nificant variables, the 2-year OS were lower in HR versus SR GvHD patients: 57% (95% CI, 37.8-72.4) for Minnesota SR and 30.7% (95% CI: 17.4-45) for Minnesota HR, P=0.00389; conversely the 2-year TRM were higher in HR versus SR GvHD patients: 20.6% (95% CI: 9.5-34.7) for Min nesota SR and 52.7% (95% CI, 36.3-66.7) for Minnesota HR, P=0.00156 (Figure 1A and B).
Of note, the 2-year OS according to day-28 response was 68% (95% CI: 57-76) for patients in CR, 55% (95% CI: 23-78) for patients in PR and 10% (95% CI: 2-27) for non-re sponders (P<0.0001). Similarly, the 2-year TRM according to day-28 response was 13% (95% CI: 7-21) for patients in CR,
Patient sex, N (%)
All patients N=315 Acute GvHD patients N=139
F 117 (37.1) 52 (37.4)
M 198 (62.9) 87 (62.6)
Diagnosis, N (%)
AML 176 (55.9) 70 (50.4)
ALL 37 (11.7) 17 (12.2)
NHL/HL 41 (13.0) 15 (10.8)
MDS or MPN 57 (18.1) 33 (23.7)
Other 4 (1.3) 4 (2.9)
Disease status, N (%)
AD 135 (42.9) 66 (47.5)
CR>1 56 (17.8) 23 (16.5)
CR1 122 (38.7) 50 (36)
DRI, N (%)
Low-int 174 (55.2) 77 (55.4)
High 94 (29.8) 40 (28.8)
Very high 22 (7.0) 8 (5.8)
Donor, N (%)
MMRD 126 (40.0) 67 (48.2)
MRD 62 (19.7) 18 (12.9)
MUD 127 (40.3) 54 (38.9)
Donor sex, N (%)
F 121 (38.4) 52 (37.4)
M 192 (61.0) 86 (61.9)
Female donor to male host, N (%)
No 247 (78.4) 109 (78.4)
Yes 66 (21.0) 29 (20.9)
CMV matching, N (%)
Neg/neg 22 (7.0) 12 (8.6)
Neg/pos 9 (2.9) 4 (2.9)
Pos/neg 81 (25.7) 33 (23.7)
Pos/pos 202 (64.1) 89 (64)
Conditioning, N (%)
MAC 212 (67.3) 98 (70.5)
RIC 103 (32.7) 40 (28.8)
Graft source, N (%)
BM 13 (4.1) 8 (5.8)
PBSC 302 (95.9) 131 (94.2)
Minnesota risk, N (%)
HR 46 (14.6) 46 (33.1)
SR 93 (29.5) 93 (66.9)
GvHD: graft-versus-host disase; F: female; M: male; AML: acute myeloid leukemia; ALL: acute lymphoblastic leukemia; NHL: non-Hodgkin lymphoma; HL: Hodgkin lymphoma; MDS: myelodysplastic syndromes; MPN myeloproliferative syndromes; CR: complete remission; AD: active disease; DRI: Disease Risk Index; MMRD: mismatched related donor; MRD: matched related donor; MUD: matched unrelated donor; CMV: cytomegalovirus matching; MAC: myeloablative conditioning, RIC: reduced intensity conditioning; PBSC: peripheral blood stem cells; BM: bone marrow; CBU: cord blood unit; HR: high risk; SR: standard risk.
Figure 1. Overall survival and transplant-related mortality analysis. (A) Cumulative incidence of transplant-related mortality and (B) probability of overall survival (OS) according to Minnesota acute graft-versus-host disease (aGvHD) risk score stratification (red line standard risk – black line high risk). HR: high risk; SR: standard risk.
18% (95% CI: 3-46) for patients in PR and 75% (95% CI: 4889) for non-responders (P<0.0001).
Identification of patients at higher risk of steroid refractory aGvHD and consequently of TRM is crucial to optimize treatment and counseling. Minnesota risk score proved to be a reliable and easy-to-use tool for stratification of pa tients at onset of aGvHD.
In the setting of PTCy GvHD prophylaxis, the Minnesota risk score clearly identifies patients with lower possibility of GvHD overall response by day-28, higher risk of TRM and lower probability of survival. Of note, in our cohort a higher percentage of patients was classified as high risk in comparison with the original Minnesota reports. A poss ible speculation may be related to the different proportion in stem cell donor source: while in the original reports a consistent proportion of patients received cord blood stem cells and bone marrow, in our experience the ma jority (94.2%) received peripheral blood stem cells. Not only, in our experience the conditioning was full myeloab lative in most patients (70.5% vs. 50% new Minnesota co hort and 47% old Minnesota cohort) and age was slightly higher (52.7 years vs. 49 years in the new Minnesota co hort and 40 years in the old Minnesota cohort).
Among the risk factors, graft cell composition, patients’ age and conditioning regimens are well-recognized key players for aGvHD development.
Major outcomes – OS and TRM – significantly differ ac cording to the day-28 response, pointing out for a dismal prognosis for patients that fail to obtain a complete or partial response. Notably, day-28 overall response ratewith current available treatment - is significantly better
in SR aGvHD patients than in HR patients, strengthening the indication to candidate HR patients to clinical trials where possible. Conversely, the Minnesota risk score does not predict the development of cGvHD.
It is interesting to observe that, in our cohort the response rate to first line steroid therapy was higher than in the original Minnesota report. We can only speculate on the possible effect exerted by PTCy in reshaping the immune system through a more tolerogenic cytokines and lympho cytes milieux able to promote a better response to treat ment. Of course, further evaluations are warranted to clarify this point.
Today considerable efforts are aimed at identifying bio markers capable of refining diagnosis, prognosis and pre dictivity of response to treatment in both aGvHD and cGvHD.16 Biomarkers certainly can increase both prediction and prognostication on aGvHD. Unfortunately, so far, the use of biomarkers is not available in clinical practice on a large scale and in all centers, thus constituting a limit in the applicability of more refined algorithms. Coupling the Minnesota risk score with the MAGIC algorithm probability (MAP) will provide additional insight in the comprehension of risk signature of GvHD patients, fostering the identifi cation not only of high-risk patients but also of low-risk patients, who will be ideally candidates to de-escalating approaches in the GvHD treatment.
Waiting for a systematic implementation of biomarkers applicability, the Minnesota risk score calculated at the onset of aGvHD is a reliable prognostic score irrespective of the donor source within the frame of PTCy GvHD pro phylaxis.

Federica Ardizzoia,1-2*° Francesca Lorentino,1-3* Alessandro Bruno,1 Sarah Marktel,1 Fabio Giglio,1 Daniela Clerici,1 Francesca Farina,1 Sara Mastaglio,1 Simona Piemontese,1 Andrea A. Assanelli,1 Matteo G. Carrabba,1 Massimo Bernardi,1 Consuelo Corti,1 Jacopo Peccatori,1 Fabio Ciceri,1-2 Raffaella Greco1 and Maria Teresa Lupo-Stanghellini1
1Hematology and Bone Marrow Transplantation Unit, IRCCS San Raffaele Scientific Institute; 2Vita-Salute, San Raffaele University and 3Department of Medicine and Surgery, PhD Program in Public Health, University of Milano-Bicocca, Milano, Italy
*FA and FL contributed equally as co-first authors.
°Current address: Alma Mater Studiorum – University of Bologna, Istituto di Ematologia e Oncologia Medica “L. e A. Seragnoli” IRCCS
Azienda Ospedaliero-Universitaria di Bologna Policlinico Sant’Orsola, Bologna, Italy
Correspondence:
M.T. LUPO STANGHELLINI - lupostanghellini.mariateresa@hsr.it
https://doi.org/10.3324/haematol.2022.281269
1. Holtan SG, MacMillan ML. A risk-adapted approach to acute GVHD treatment: are we there yet? Bone Marrow Transplant. 2016;51(2):172-175.
2. Ferrara JLM, Chaudhry MS. GVHD: biology matters. Blood Adv. 2018;2(22):3411-3417.
3. McCurdy SR, Radojcic V, Tsai HL, et al. Signatures of GVHD and relapse after posttransplant cyclophosphamide revealed by immune profiling and machine learning. Blood. 2022;139(4):608-623.
4. MacMillan ML, Robin M, Harris AC, et al. A refined risk score for acute graft-versus-host disease that predicts response to initial therapy, survival, and transplant-related mortality. Biol Blood Marrow Transplant. 2015;21(4):761-767.
5. MacMillan ML, DeFor TE, Holtan SG, Rashidi A, Blazar BR, Weisdorf DJ. Validation of Minnesota acute graft-versus-host disease Risk Score. Haematologica. 2020;105(2):519-524.
6. MacMillan ML, DeFor TE, Weisdorf DJ. What predicts high risk acute graft-versus-host disease (GVHD) at onset?: identification of those at highest risk by a novel acute GVHD risk score. Br J Haematol. 2012;157(6):732-741.
7. Greco R, Lorentino F, Albanese S, et al. Posttransplantation cyclophosphamide- and sirolimus-Based graft-versus-hostdisease prophylaxis in allogeneic stem cell transplant. Transplant Cell Ther. 2021;27(9):776.e1-776.e13.
8. Harris AC, Young R, Devine S, et al. International, multicenter standardization of acute graft-versus-host disease clinical data
Received: April 18, 2022.
Accepted: July 21, 2022.
Prepublished: July 28, 2022.
©2022 Ferrata Storti Foundation
Published under a CC BY-NC license
MTLS has no competing interests directly related to this manuscript. MTLS has received honoraria or travel support from Neovii Biotech, Novartis, Incyte and Mallinckrodt Pharmaceuticals. MTLS is part to Novartis and Mallinckrodt Pharmaceuticals advisory boards. All other authors declare no competing financial interests.
MTLS, FA, RG, FL designed the study and interpreted the data. MTLS, FA and AB collected and assembled the data. FL performed the statistical analysis. MTLS, FA and FL prepared the first draft of the manuscript; and all authors contributed to data interpretation, helped revise the manuscript, and gave final approval of the manuscript.
The datasets generated for this study are available on request to the corresponding author.
collection: a report from the Mount Sinai Acute GVHD International Consortium. Biol Blood Marrow Transplant. 2016;22(1):4-10.
9. Lee SE, Cho BS, Kim JH, et al. Risk and prognostic factors for acute GVHD based on NIH consensus criteria. Bone Marrow Transplant. 2013;48(4):587-592.
10. Kaplan EL, Meier P. Nonparametric estimation from incomplete observations. J Am Stat Assoc. 1958; 53(1282):457-481.
11. Gooley TA, Leisenring W, Crowley J, Storer BE. Estimation of failure probabilities in the presence of competing risks: new representations of old estimators. Stat Med. 1999;18(6):695-706.
12. Mantel N. Evaluation of survival data and two new rank order statistics arising in its consideration. Cancer Chemother Rep. 1966;50(3):163-170.
13. Gray R. A class of K-sample tests for comparing the cumulative incidence of a competing risk. Ann Stat. 1988;16(3):1141-1154.
14. Cox D. Regression models and life-tables. J R Stat Soc. 1972;34(2):187-220.
15. Penack O, Marchetti M, Ruutu T, et al. Prophylaxis and management of graft versus host disease after stem-cell transplantation for haematological malignancies: updated consensus recommendations of the European Society for Blood and Marrow Transplantation. Lancet Haematol. 2020;7(2):e157-e167.
16. Adom D, Rowan C, Adeniyan T, Yang J, Paczesny S. Biomarkers for allogeneic HCT outcomes. Front Immunol. 2020;11:673.
Intensive multiagent chemotherapy has been a corner stone of curative-intent treatment for adults with acute myeloid leukemia (AML) for several decades.1,2 More re cently, the market introduction of several new drugs has expanded the therapeutic options for such patients. 3-5 With increasingly diverse treatments available, there is growing interest in instruments that assess medical fit ness to aid the selection of the most suitable thera peutic strategy for individual patients. Now widely used for this purpose are criteria proposed by investigators from the Italian Society of Hematology (SIE), the Italian Society of Experimental Hematology (SIES), and the Ita lian Group for Bone Marrow Transplantation (GITMO).6 We recently reported in 703 adults with AML or other high-grade myeloid neoplasm that these “Ferrara” crite ria are indeed useful for patient risk-stratification and have a good to very good accuracy for the prediction of shorter-term mortality following intensive AML chemo therapy.7
Our data indicated the importance of pulmonary assess ments to categorize patients as fit or unfit for intensive AML chemotherapy as pulmonary abnormalities were the single most common reason for medical unfitness based on Ferrara criteria.7 However, this fitness evaluation requires lung function testing, which is not routinely per formed in many institutions and may be perceived as an unnecessary burden for asymptomatic patients. For example, in our cohort, only 159 of the 703 patients under went pulmonary function testing before chemotherapy initiation. Some of our analyses suggested that the ab sence of known pulmonary comorbidities combined with the lack of respiratory symptoms could serve as a sur rogate for normal pulmonary function, thereby avoiding the need for formal testing.7 In order to test this idea, we analyzed a cohort of adults ≥18 years of age with pre viously untreated AML (2016 World Health Organization criteria8) who were admitted to the Hematology Unit of the Policlinico Tor Vergata (Rome, Italy) between 01/2009 and 12/2020 and underwent pulmonary function testing as routine part of the pre-treatment assessment. This retrospective analysis was approved by the Fred Hutchin son Cancer Center and Policlinico Tor Vergata Institutional Review Board.
Information on pulmonary function testing, chest radio graphs, smoking status, and prior/concurrent pulmonary comorbidities was collected from medical records. Pa tients were classified as pulmonary unfit according to
Table 1. Characteristics of study population.
All patients (N=243)
Median age in years (range) 64.9 (22.4-88)
Female sex, N (%) 102 (42)
Smoking status, N (%)
Current 36 (15)
Past 59 (24)
Chest imaging available, N (%) 243 (100)
X-rays 19 (8)
CT scan 223 (92)
PET-CT 1 (<1)
Imaging findings, N (%)
Normal 120 (49)
Stable 29 (12)
New 44 (18)
Increased 28 (12)
Decreased 22 (9)
Documented lung comorbidity, N (%) 14 (6)
Active lung cancer 1 (<1)
Obstructive pulmonary disease 11 (5)
Fungal pneumonia 0
OSAS 0
Prior lobectomy 1 (<1)
Tuberculosis 1 (<1)
Asbestosis 0
Interstitial lung disease 0
Supplemental oxygen use, N (%)
During day 45 (19)
At night (CPAP) 0
None 198 (82)
Pulmonary Ferrara score, N (%)
Fit 184 (76)
Unfit 59 (24)
PFT 12 (20)
Dyspnea 11 (19)
Dyspnea and PFT 34 (58)
Active lung cancer 1 (2)
PFT and active lung cancer 1 (2)
CT: computed tomography; PET: positron emission tomography; OSAS: obstructive sleep apnea syndrome; CPAP: continuous positive airway pressure; PFT: pulmonary function test.
Table 2. Results from pulmonary function testing across different subsets of patients who had no pulmonary symptoms and lacked Ferrara criteria unfitness-defining pulmonary comorbidities (196 patients).
Normal* Mildly abnormal** Mild/Moderately abnormal*** Severely abnormal****
Non-smoker, no pulmonary comorbidities, normal chest imaging (N=78), N (%)
Smoker, no pulmonary comorbidities, normal chest imaging (N=36), N (%)
Non-smoker, pulmonary comorbidities, normal chest imaging (N=0)
Non-smoker, no pulmonary comorbidities, abnormal chest imaging (N=42), N (%)
Smoker, pulmonary comorbidities, normal chest imaging (N=0)
Smoker, no pulmonary comorbidities, abnormal chest imaging (N=31), N (%)
Non-smoker, pulmonary comorbidities, abnormal chest imaging (N=2)
Smoker, pulmonary comorbidities, abnormal chest imaging (N=7)
All patients (N=196), N (%)
19 (24) 28 (36) 29 (37) 2 (3)
7 (19) 14 (39) 12 (33) 3 (8)
0
8 (19) 11 (26) 21 (50) 2 (5)
0 0
4 (13) 11 (36) 16 (52) 0
2 (100) 0
1 (14) 1 (14) 5 (71)
38 (19) 65 (33) 81 (41) 12 (6)
*DLCO and FEV1 ≥91%; **DLCO and/or FEV1 81-90%; ***DLCO and/or FEV1 66-80%; ****DLCO and/or FEV1 ≤65%. DLCO: diffusing capacity for carbon monoxide; FEV1: forced expiratory volume in the first second.
Ferrara criteria (F-unfit) in case of abnormal lung function testing with diffusing capacity for carbon monoxide (DLCO) ≤65% predicted (relative to accepted reference values) or forced expiratory volume in the first second (FEV1) ≤65% predicted, dyspnea at rest, need for supple mental oxygen, or history of any pleural neoplasm or un controlled lung neoplasm.6 Chest imaging reports were reviewed by one of the authors (RP) and categorized as “normal” (no radiological abnormalities reported), “new” (previously unknown abnormalities reported), “stable” (previously known abnormalities reported to be un changed), “changed” (previously known abnormalities re ported to be changed), and “increased” or “decreased” (worsening or improvement of previously known abnor malities).
Two hundred forty-three patients met our study inclusion criteria. As summarized in Table 1, current and former smokers accounted for a minority of patients in these co horts. Pulmonary comorbidities were identified in 14 of 243 (6%) of the patients. Chest imaging studies were available in all cases and were normal in 120 of 243 (49%) of the patients. Forty-five of the 243 patients (19%) had dyspnea at rest requiring oxygen. Less than half (103/243 [42%]) had normal pulmonary function testing results (i.e., DLCO and FEV1 ≥81%). In contrast, in 47 (19%) of the pa tients, pulmonary function was severely abnormal (i.e., FEV1 and/or DLCO ≤65%), establishing pulmonary unfit ness according to the criteria proposed by Ferrara and colleagues.6
Of the 243 patients, 59 (24%) met criteria for pulmonary
Ferrara F-unfitness. Isolated pulmonary function test ab normalities were the reason for F-unfitness in only 12 of 59 (20%) of the patients, with isolated dyspnea (n=11 [19%]), active lung cancer (n=1 [2%]), and the combination of abnormal lung function tests together with dyspnea at rest (n=34 [58%]) or active lung cancer (n=1 [2%]) account ing for the remaining cases.
Because of our recent data suggesting the absence of Funfitness-defining pulmonary comorbidities and lack of respiratory symptoms (i.e., dyspnea at rest or requiring supplemental oxygen, or any pleural neoplasm or uncon trolled lung neoplasm) could potentially serve as a sur rogate for normal pulmonary function,7 we were particularly interested in the patients without pulmonary symptoms and no history of F-unfitness-defining pul monary disease. Among the 243 patients, 196 (81%) met these characteristics (Online Supplementary Table S1). Of these 196 individuals, pulmonary function testing was se verely abnormal (i.e., denoting F-unfitness) in 12 (6%) pa tients. In this small subset of patients with severely abnormal pulmonary function tests, seven (58%) had ab normal radiographic findings, the majority of which (6/7 [85%]) were increased or new. Furthermore, five of 12 (42%) of these patients had lung comorbidities that were documented but did not qualify for F-unfitness on their own, including obstructive pulmonary diseases (n=4) and prior lobectomy (n=1). Finally, current/prior smokers ac counted for over half of these patients (8/12 [67%]). As one might expect, the likelihood of severely abnormal lung function differed across individual patient subsets de
pending on past/current smoking status, presence of pul monary comorbidities, and chest imaging findings (Table 2). Among life-long non-smokers without known pulmon ary comorbidities and normal chest imaging studies – the largest subset of patients, overall accounting for 78 of 196 (40%) of the patients – lung function studies were se verely abnormal in only two (1%) of the patients. On the other hand, among the seven past/current smokers with known pulmonary comorbidities and abnormal chest im aging findings, lung function studies were severely abnor mal in five (71%) of the patients (Online Supplementary Figure S1).
Together, in the cohort of adults with previously untreated AML we studied, the vast majority of patients neither had respiratory symptoms nor pulmonary comorbidities that would qualify for unfitness based on Ferrara criteria.6 Thus, the question of whether the absence of pulmonary symptoms and lack of pulmonary comorbidities could serve as a surrogate for normal pulmonary function for the purpose of Ferrara fitness assessment is clinically rel evant as pulmonary function testing is not routinely per formed in many centers treating AML. Our data show that the lack of respiratory symptoms together with lack of pulmonary comorbidities is not indicative of having nor mal pulmonary function tests. Mildly or moderately ab normal test results were common. Moreover, across all patients, severely abnormal pulmonary function tests were found in almost 20% of cases. However, our findings indicate that among non-smokers with normal chest im aging studies and no history of pulmonary comorbidities, severely abnormal pulmonary function tests were uncom mon. In our cohort, only 1% of such patients had a severely abnormal lung function. In other words, for patients meet ing these characteristics, about 100 pulmonary function testing studies would need to be done to identify one pa tient with findings abnormal enough to qualify for Ferrara unfitness. Thus, in such patients, it would appear reason able to forgo pulmonary function testing if only done for the purpose of Ferrara fitness assessment using current criteria.
Raffaele Palmieri,1,2 Megan Othus,3 Guang-Shing Cheng,2,4
1. Döhner H, Weisdorf DJ, Bloomfield CD. Acute myeloid leukemia. N Engl J Med. 2015;373(12):1136-1152.
2. Döhner H, Estey E, Grimwade D, et al. Diagnosis and management of AML in adults: 2017 ELN recommendations from an international expert panel. Blood. 2017;129(4):424-447.
Francesco Buccisano,1 Giovangiacinto Paterno,1 Luca Maurillo,1 Maria Ilaria Del Principe,1 Giuseppe Sconocchia,5 Adriano Venditti,1 and Roland B. Walter2,6,7,8
1Department of Biomedicine and Prevention, Tor Vergata University, Rome, Italy; 2Clinical Research Division, Fred Hutchinson Cancer Center, Seattle, WA, USA; 3Public Health Science Division, Fred Hutchinson Cancer Center, Seattle, WA, USA; 4Department of Medicine, Division of Pulmonary and Critical Care Medicine, University of Washington, Seattle, WA, USA; 5Institute of Translational Pharmacology, Department of Biomedical Sciences, CNR, Rome, Italy; 6Department of Medicine, Division of Hematology, University of Washington, Seattle, WA, USA; 7Department of Laboratory Medicine and Pathology, University of Washington, Seattle, WA, USA and 8Department of Epidemiology, University of Washington, Seattle, WA, USA
Correspondence:
ROLAND B. WALTER - rwalter@fredhutch.org https://doi.org/10.3324/haematol.2022.281445
Received: May 21, 2022.
Accepted: July 25, 2022. Prepublished: August 4, 2022.
©2022 Ferrata Storti Foundation Published under a CC BY-NC license
No conflicts of interest to disclose.
RP contributed to the collection and assembly of data, data interpretation, and drafting of the manuscript. MO and GSC participated in data interpretation and drafting of the manuscript. FB, GP, LM, MIDP, GS and AV contributed to the provision of study material, patient recruitment, and acquisition of data. RBW conceptualized and designed this study and participated in data analysis and interpretation and drafting of the manuscript. All authors revised the manuscript critically and gave final approval to submit for publication.
For original, de-identified data, please contact the corresponding author.
3. Short NJ, Konopleva M, Kadia TM, et al. Advances in the treatment of acute myeloid leukemia: new drugs and new challenges. Cancer Discov. 2020;10(4):506-525.
4. Bazinet A, Assouline S. A review of FDA-approved acute myeloid leukemia therapies beyond '7 + 3'. Expert Rev Hematol.
2021;14(2):185-197.
5. Döhner H, Wei AH, Löwenberg B. Towards precision medicine for AML. Nat Rev Clin Oncol. 2021;18(9):577-590.
6. Ferrara F, Barosi G, Venditti A, et al. Consensus-based definition of unfitness to intensive and non-intensive chemotherapy in acute myeloid leukemia: a project of SIE, SIES and GITMO group on a new tool for therapy decision making. Leukemia. 2013;27(5):997-999.
7. Palmieri R, Othus M, Halpern AB, et al. Accuracy of SIE/SIES/GITMO consensus criteria for unfitness to predict early mortality after intensive chemotherapy in adults with AML or other high-grade myeloid neoplasm. J Clin Oncol. 2020;38(35):4163-4174.
8. Arber DA, Orazi A, Hasserjian R, et al. The 2016 revision to the World Health Organization classification of myeloid neoplasms and acute leukemia. Blood. 2016;127(20):2391-2405.
Adult T-cell leukemia-lymphoma (ATL) is a hematological malignancy caused by human T-lymphotropic virus type I (HTLV-1) with a dismal outcome.1 Allogeneic hematopoietic cell transplantation (HCT) is the standard of care in trans plant-eligible patients to improve the long-term clinical outcome in patients with aggressive ATL.1 Early allogeneic HCT is generally recommended as conventional chemo therapy does not achieve long-term disease control. Al logeneic HCT using an alternative donor such as cord blood or haploidentical related donor is emerging. Al though allogeneic HCT could reduce the risk of relapse or progression significantly, relapse or progression remains one of the major causes of failure in patients with ATL.2 Anecdotal reports showed that donor-derived ATL could occur, but donor-derived ATL was rarely reported, and in these cases, the stem cell donor was an HTLV-1 carrier.3-5
The transient proliferation of donor-derived ATL cell-like lymphocytes was also reported, but the donor was an HTLV-1 carrier.6 Theoretically, de novo donor-derived HTLV1-infected T cells could expand polyclonally or even prog ress to monoclonal ATL after allogeneic HCT. The actual risk for developing ATL in patients with polyclonal HTLV1-infected T cells is unclear. In some countries, strategies to minimize neoinfection of donor cells after allogeneic HCT using anti-viral drugs are undertaken, although there is no published evidence to support this approach.1 Here, we present a case of pseudo-progression of ATL after cord blood transplantation (CBT): polyclonal expan sion of de novo infected cord blood-derived HTLV-1-in fected T cells. The patient took part in a prospective comprehensive study to analyze molecular markers in cluding surface markers and other molecular markers in HTLV-1-infected individuals. The study has been approved by a formally constituted review board (Osaka Inter national Cancer Institute, Osaka, Japan, No. 1707259142). The study was conducted in accordance with the Declar ation of Helsinki.
A 58-year-old female was diagnosed with acute-type ATL at our institute. She received VCAP-AMP-VECP regimen as induction chemotherapy.7 VCAP-AMP-VECP regimen was effective, but myelosuppression persisted. Thus, chemo therapy was changed to CHOP regimen. She received four cycles of CHOP regimen, and achieved complete re mission. There was no HLA-matched related or unrelated volunteer donor available. Therefore, she received CBT fol lowing a reduced-intensity conditioning regimen contain ing fludarabine, melphalan and low-dose total body irradiation. Neutrophil engraftment was achieved at day 17
after CBT. Complete donor chimerism was confirmed. She had grade 2 acute graft-versus-host disease (GVHD, skin stage 2, gut stage 1), which was resolved by systemic cor ticosteroid.
Around 6 months after CBT, although there was no clinical signs or symptoms concerning recurrence of ATL, there was an emergence of abnormal lymphocytes in the pe ripheral blood (PB) (Figure 1A). The percentage and abso lute number of abnormal lymphocytes determined morphologically were 4.5% and 203 cells/μL, respectively. At the same time, there was an elevation of serum soluble interleukin-2 receptor (sIL-2R) level (2,250 IU/mL, normal range 157-474 IU/mL) and proviral load (PVL, 8.16 per 100 peripheral blood mononuclear cells [PBMC]). In multicolor flow cytometry (FCM) analysis, we were able to detect a significant population of CD3+CD4+ CADM1+CD7low-dim T cells (Figure 1B). We diagnosed relapse of ATL after CBT. There was no other lesion of relapse except for PB. Once progressed, the clinical outcome of relapsed ATL after al logeneic HCT is dismal.8 Therefore, we urgently adminis tered mogamulizumab as CCR4 was highly expressed. Following the administration of mogamulizumab, abnor mal lymphocytes in PB disappeared immediately. We re viewed the results of this case, and we thought that the result of the FCM analysis was not a typical pattern9,10 that CD7 expression varied in this T-cell population. However, we were unable to perform the additional test due to the complete disappearance of abnormal cells in PB after the administration of mogamulizumab.
Around 1.5 years after CBT, there was a re-emergence of the abnormal lymphocytes in PB. The result of FCM analy sis is shown in Figure 1C. The pattern was basically similar to the previous one at 6 months after CBT with elevated serum sIL2R level (2,649 IU/mL) and PVL (29.1 per 100 PBMC). In order to confirm the diagnosis of ATL progres sion, we performed the chimerism analysis by short tan dem repeat (STR) of whole and fractionated cells in PB: granulocytes, T cells, B cells, macrophage, and natural killer (NK) cells. The results showed that chimerism was completely donor-derived in all fractions (Figure 2A). In order to assess the chimerism and clonality of CD4+ T cells, we sorted T cells into different fractions named D (CADM1+CD7+), P (CADM1-CD7+), N (CADM1-CD7-) using FACS Aria II (Figure 2B). The sorted cells were assessed by XY fluorescence in situ hybridization (FISH) as CB was male and the recipient was female. We found that all sorted cells in each fraction were male by XY FISH. We additionally performed inverse polymerase chain reaction
C
Figure 1. Morphology of lymphocytes and flow cytometry analysis in peripheral blood. (A) Example image of lymphocytes in peripheral blood obtained by CellaVision DC-1. (B) Flow cyto metry analysis to assess the expression pattern of CADM1/CD7 in CD3+CD4+ T cells as previously reported. The sample was taken at around 6 months after cord blood transplant. (C) Flow cytometry analysis to assess the expression pattern of CADM1/CD7 in CD3+CD4+ T cells as previously reported. The sample was taken at around 1.5 years after cord blood trans plant.

A B
C
Figure 2. Chimerism and clonality analysis in peripheral blood. (A) Result of chimerism analysis using short tandem repeat in each fraction: whole blood, T cell, B cell, natural killer (NK) cell, macrophage and granulocyte. (B) Gating strategy of multicolor flow cytometry to sort P (CADM1-CD7+), D (CADM1+CD7+) and N (CADM1-CD7-) fraction. (C) Result of inverse polymerase chain reaction in the D and N fraction. CD8-positive cells were the control of polyclonal cells, and TLom1 was a positive control of monoclonal cells.

(PCR) in the D and N fraction, and found that HTLV-1 in fected cells were polyclonal in each fraction (Figure 2C). We did not have sufficient cell numbers for the analysis of the P fraction. Using inverse PCR, HTLV-1 was serially found to be polyclonal in PB. We concluded that the pa tient had pseudoprogression of ATL after CBT: polyclonal expansion of de novo infected cord blood-derived T cells. There is no consensus on how we manage HTLV-1 carriers after allogeneic HCT. Thus, patients were followed without additional treatment. At around 4 years after CBT, the pa tient had neither a relapse of ATL nor had developed chronic GVHD and was free of immunosuppressive drugs, but retained the status of HTLV-1 carrier. Here, we presented a case of pseudoprogression of ATL after CBT: polyclonal expansion of de novo HTLV-1-in fected CB-derived T cells. As far as we know, this is the first reported case of such a clinical situation after alloge neic HCT with a detailed analysis to confirm that the ex panded cells were the polyclonal expansion of de novo HTLV-1-infected cord blood-derived T cells. When we first encountered the emergence of abnormal lymphocytes in this case, we did not assess the possibility of polyclonal expansion of HTLV-1-infected cells and ad ministered mogamulizumab, as the pattern of multicolor FCM, serum sIL2R level and PVL level was consistent with the recurrence of recipient-derived ATL. However, in the multicolor FCM, the pattern of CD7 expression was not typical of aggressive ATL as previously reported.9,10 Thus, we added the detailed analysis to assess the chimerism and clonality when the patient had the re-emergence of abnormal lymphocytes in PB, and found that the ex panded cells were donor-derived and polyclonal. As CB is always confirmed to be HTLV-1 seronegative before CBT, it is certain that HTLV-1 infected CB after CBT. As donorderived ATL cells were reported, it would be essential to assess the chimerism and clonality when we detect ab normal lymphocytes in ATL patients after allogeneic HCT even when donor is HTLV-1 seronegative.3-6 Furthermore, it is unclear whether donor-derived HTLV-1-infected poly clonal T cells could progress to ATL. We need more data to clarify this issue in large cohorts of allogeneic HCT re cipients in HTLV-1-infected individuals. In conclusion, here we reported the first case of donorderived polyclonal expansion of HTLV-1-infected T cells.
1. Cook LB, Fuji S, Hermine O, et al. Revised Adult T-Cell Leukemia-Lymphoma International Consensus Meeting Report. J Clin Oncol. 2019;37(8):677-687.
2. Inoue Y, Nakano N, Fuji S, et al. Impact of conditioning intensity and regimen on transplant outcomes in patients with adult Tcell leukemia-lymphoma. Bone Marrow Transplant. 2021;56(12):2964-2974.
Shigeo Fuji,1 Jun-ichirou Yasunaga,2 Eri Watanabe,3 Masao Matsuoka,2 Kaoru Uchimaru4 and Jun Ishikawa1
1Department of Hematology, Osaka International Cancer Institute, Osaka; 2Graduate School of Medical Sciences, Faculty of Life Sciences Kumamoto University, Kumamoto; 3IMSUT Clinical Flow Cytometry Laboratory, The University of Tokyo, Tokyo and 4Laboratory of Tumor Cell Biology, Department of Computational Biology and Medical Sciences, Graduate School of Frontier Sciences, The University of Tokyo, Tokyo, Japan
S. FUJI - fujishige1231@gmail.com
https://doi.org/10.3324/haematol.2022.281175
Received: April 1, 2022.
Accepted: June 13, 2022.
Prepublished: June 23, 2022.
©2022 Ferrata Storti Foundation Published under a CC BY-NC license
No conflicts of interest to disclose.
SF designed and performed research, and wrote the paper. JY, EW, MM, KU and JI analyzed data. All authors have read the uploaded manuscript and consented to submission.
This research was partially supported by the Practical Research for Innovative Cancer Control from the Japan Agency for Medical Research and Development (grant number 21ck0106616h0002).
The data that support the findings of this study are available on request from the corresponding author. The data are not publicly available due to privacy or ethical restrictions.
3. Nakamizo A, Akagi Y, Amano T, et al. Donor-derived adult T-cell leukaemia. Lancet. 2011;377(9771):1124.
4. Tamaki H, Matsuoka M. Donor-derived T-cell leukemia after bone marrow transplantation. N Engl J Med. 2006;354(16):1758-1759.
5. Tamaki H, Taniguchi Y, Kikuchi A, Yamagami T, Soma T, Matsuoka M. Development of adult T-cell leukemia in donor-derived
human T-cell leukemia virus type I-infected T cells after allogeneic bone marrow transplantation. Leukemia. 2007;21(7):1594-1596.
6. Taguchi M, Imaizumi Y, Taguchi J, et al. Transient proliferation of donor-derived ATL cell-like lymphocytes early after allogeneic stem cell transplantation in an adult T-cell leukemia/lymphoma patient. Blood. 2013;121(21):4428-4430.
7. Tsukasaki K, Utsunomiya A, Fukuda H, et al. VCAP-AMP-VECP compared with biweekly CHOP for adult T-cell leukemialymphoma: Japan Clinical Oncology Group Study JCOG9801. J Clin Oncol. 2007;25(34):5458-5464.
8. Kato K, Uike N, Wake A, et al. The outcome and characteristics of patients with relapsed adult T cell leukemia/lymphoma after allogeneic hematopoietic stem cell transplantation. Hematol Oncol. 2019;37(1):54-61.
9. Kobayashi S, Nakano K, Watanabe E, et al. CADM1 expression and stepwise downregulation of CD7 are closely associated with clonal expansion of HTLV-I-infected cells in adult T-cell leukemia/lymphoma. Clin Cancer Res. 2014;20(11):2851-2861.
10. Kobayashi S, Tian Y, Ohno N, et al. The CD3 versus CD7 plot in multicolor flow cytometry reflects progression of disease stage in patients infected with HTLV-I. PLoS One. 2013;8(1):e53728.
Osteopetrosis (OP) is a rare progressive disorder caused by several different gene defects and associated with sig nificant morbidity and mortality.1 Allogeneic hematopoietic stem cell transplantation (allo HSCT) can be curative for infantile OP.2 Deficiency of osteoclast (OCL) development and/or function would lead to dense bone structure, and lack of space for medullary hematopoiesis. We investi gated the origin of OCL in two allo HSCT recipients with OP after the first recipient had a significant decline in pe ripheral blood (PB) donor myeloid chimerism by short tan dem repeat (STR) analysis, which concerned us about the maintenance of osteoclastogenesis and its potential ef fect on patient outcome.
Case 1. We previously reported an infant with severe combined immunodeficiency (SCID) due to interleukin-2 receptor g chain gene mutation, congenital chromoso mally-integrated herpesvirus-6 (HHV-6) infection, hemo phagocytic syndrome and OP. 3 The patient tested negative for known OP mutations by whole-exome and genome sequencing. Bone biopsy report emphasized the lack of osteoclastic activity. At 5 months of age, the pa tient underwent an allo HSCT from a matched unrelated donor (MUD) conditioned with fludarabine, busulfan and rabbit anti-thymocyte globulin, graft-versus-host disease (GvHD) prophylaxis with mycophenolate mofetil and ta crolimus and veno-occlusive disease (VOD) prophylaxis with defibrotide.
Early days of transplant were complicated by liver VOD and thrombotic microangiopathy. The patient achieved timely engraftment and continues to have normal periph eral blood counts without any GVHD, normal immuno globulin levels and T-cell function, has developed anti-HHV-6 antibodies, but continues to have low level HHV-6 viremia due to chromosomal integration of the virus without clinical consequences.4 Skeletal X-ray find ings are almost normalized. Thirty-four months after HSCT, the patient has mild azotemia with small-for-age kidneys not requiring intervention, also has autism spec trum disorder without any neurodegeneration in serial brain magnetic resonance imaging studies or abnormal ities in ophthalmologic and audiologic examinations. Peripheral blood cell counts recovered and STR analysis revealed “donor cells only” status on day +100. However, while donor chimerism was 93% in lymphocytes, donor myeloid chimerism declined to 43% at +13 months and 27% at +20 months. Further decline in PB donor myeloid
chimerism to 11% was observed at +22 months. (Table 1) Case 2. A 7-month-old Caucasian male with infantile ma lignant osteopetrosis due to double heterozygous TCIRG1 exon 12 mutations (1. C.1312C>T and 2. C.1320 1321delTC) underwent MUD allo HSCT at 7 months of age. He pres ented to our hospital at the age of 4 months with difficulty in feeding, congestion, harsh breathing, a recessed chin, obstructive sleep apnea, failure to thrive, right-sided optic atrophy and strabismus, hepatosplenomegaly, anemia, thrombocytopenia, leukoerythroblastic reaction in PB and findings consistent with OP in the skeletal survey.
A MUD HSCT was performed following fludarabine 40 mg/m2/dose on days -6 to -3, busulfan on days -5 to -2 targeting a cumulative area under the curve of 20,000 micromole x min/L and rabbit anti-thymocyte globulin 2.5 mg/kg/dose on days -8 to -6 conditioning with a mono nuclear cell dose of 14.3x10⁸/kg and CD34+ cell dose of 21.2x10⁶/kg and GVHD prophylaxis with mycophenolate mofetil and tacrolimus. Neutrophil engraftment was es tablished on day +13. Post-HSCT period was complicated with VOD despite defibrotide prophylaxis and skin GVHD for which he was treated on steroids. He has complete PB count recovery 3 months from HSCT and is doing well. One month post-HSCT, STR analysis showed donor chim erism of 64% in lymphocytes, and 100% in myeloid cells.
Osteoclast culture, characterization, and short tandem repeat analysis
Osteoclast culture methods proposed by Abdallah et al. were used with modifications to generate the OCL pre cursors (OCLp) and OCL from the PB mononuclear cells (PBMC).5 In preliminary experiments to optimize the os teoclast culture conditions, we incubated Ficoll-Hypaq density gradient-separated PBMC in RPMI medium 1640 Glutamax™, supplemented with 10% of fetal bovine serum (FBS) charcoal-stripped (v/v) and various concentrations of recombinant human macrophage colony-stimulating factor (M-CSF) and/or recombinant human RANK-L (Sigma Aldrich, St. Louis, MO) in multiple wells in 24-well culture plates replacing with fresh culture medium every 48 hours. Cells were harvested using Accutase (Sigma Al drich, St. Louis, MO) from different conditions and phe notyping was done to assess cell surface expression of markers CD14, HLA-DR (DR), CD45 (Beckman Coulter, Brea, CA) , CD51/61, CD68, osteopontin, CD115 (M-CSF re ceptor) (Biolegend, San Diego, CA), calcitonin receptor,
CD265 (hRANK) (R&D systems, Minneapolis, MN), TRAP(D3) (Santa Cruz Biotechnology Dallas, Texas), using 10-color Gallios flow cytometer (Beckman Coulter, Brea, CA) on days 6, 9, 13 and 17.
Since OCL are multinucleated large cells, they cannot pass through the flow cytometry chambers intact. Thus, OCL flow cytometric analysis cannot be performed. How ever, OCLp are much smaller in size and therefore, can be studied by flow cytometry. Decrease in CD14 and DR ex pression was observed as cultured cells progressed to wards OCLp or OCL formation in a subset of cells. Cytospin slides were prepared, stained with Write-Giemsa stain, and reviewed under microscope for the presence of OCL. Based on the cytospin cell morphology and CD14/DR expression in our preliminary experiments, day 14 was de cided as an optimal time to harvest and isolate OCLp. Osteoclastogenesis occurs by fusion of monocyte precur sors derived from hematopoietic stem cells in presence of RANK and M-CSF (CD115).
It has been demonstrated in the time-course parabiosis experiments in mice with osteopetrotic phenotype that fusion of donor and recipient monocytic cells circulating
in the blood results in expression of a donor-derived gene by recipient osteoclasts, and transfusion of monocytic cells can result in transfer of genes in osteoclasts for an extended period of time even in the absence of HSC chim erism.6 Since monocyte origin and maintenance of adult life osteoclastogenesis has been demonstrated, we used magnetic-activated cell sorting (MACS)-isolated CD14+ monocytes, which also reduced lymphocyte contamina tion in our optimized approach (Figure 1).5-7 Peripheral blood samples were collected at 20 and 22 months in the first patient and 1 month after allo HSCT in the second patient. The first case had shown decreasing donor mye loid chimerism but maintained stable lymphoid donor chimerism above 90%. Thus, there was a concern, if com plete loss of donor myeloid engraftment leading to dim inished production of healthy OCL and resurgence of OP findings was in process. In the second case, donor-de rived osteoclast generation in vitro was investigated at 1 month following HSCT.

Monocytes were suspended in RPMI medium 1640 Gluta max™, supplemented with 10% of FBS charcoal-stripped (v/v), 25 ng/mL of recombinant human M-CSF and 100
Figure 1. Experimental steps used in in vitro generation and characterization of osteoclasts and their precursors. Osteoclast pre cursors (OCLp) were generated by culture of magnetic-activated cell sorting (MACS)-isolated peripheral monocytes from peripheral blood mononuclear cells (PBMC). Peripheral blood monocytes were supplemented with fresh osteoclast culture medium containing recombinant human M-CSF at 25 ng/mL and recombinant human RANKL at 100 ng/mL every 48 hours for 14 days to stimulate dif ferentiation into OCLp. On day 14, harvested cells were separated into CD14-DR- OCLp and CD14+DR+ macrophages by MACS for further evaluation by flow cytometry, short tandem repeat (STR) analysis and preparation of cytospin slides.
ng/mL of recombinant human RANK-L and seeded into two wells of a 24-well plates at the density of 0.5×10⁶ cells/mL per well. The cells were incubated at 37°C, in hu midified atmosphere containing 5% CO2 over time. The medium was changed every 48 hours. On day 14, cells were harvested gently using Accutase and assessed for viability with trypan blue. The harvested cells were en riched by MACS separation using CD14 and DR microbeads (Miltenyi Biotec, Auburn, CA) into two separate popu lations, CD14-negative/DR-negative cells (OCLp) and CD14-bright/DR-bright cells (macrophages). Purity of en riched cells was checked by flow cytometry. Immunophe notyping was performed to assess the expression of CD14, CD115, HLA-DR, and osteopontin (Figure 2). Cytospin slides were prepared using suspension cells from both CD14-negative/DR-negative and CD14-bright/DR-bright populations, stained with Wright-Giemsa stain and re viewed under microscope. Cells from both populations were tested for donor chimerism by STR analysis. Mature OCL and OCLp express CD45, CD51/61, osteopontin, CD115, calcitonin receptor, CD265 (hRANK), and TRAP(D-3) similar to macrophages.8-12 We observed variable expression intensity patterns in these surface markers among different cases in OCLp and macrophages. While multinucleated giant OCL at different stages of maturation were seen on stained cytospin slides from OCLp, smaller cells with single nucleus were observed in the macrophage population under microscope (Table 1; Figure 2).
STR analysis of culture-grown OCLp showed the presence of 26% and 12% donor cells at 20 and 22 months following HSCT in the first case, respectively (Table 1). Donor OCLp percent values paralleled PB donor myeloid chimerism values indicating that both recipient and donor monocytes have the capacity to develop OCLp/OCL in vitro with the proper stimulation. We demonstrated that PB monocytes were induced to develop OCLp/OCL in vitro prior to HSCT in the second case; however, this was not performed in the first case. Despite declining donor myeloid chimerism, skeletal X-ray findings continue to resolve without any evidence of extramedullary hematopoiesis in the first case. Three of 14 patients with bone X-ray finding im provements following allo HSCT were reported to have mixed donor chimerism without specific numbers pro vided.13
We previously speculated that in utero HHV-6 viremia on a fetal severe combined immune deficiency background might have suppressed OCL development from hemato poietic cells leading to OP phenotype in the first patient.3 As emphasized above, HHV-6 viremia inevitably continues following successful allogeneic HSCT, though at a much lower level, and is controlled by immune surveillance. Thus, HHV-6 cannot affect neither donor nor recipient hematopoietic stem cells anymore. It could be further speculated that OCL of recipient origin are also functional and help maintain osteoclastogenesis in the first case. Al ternatively, as demonstrated in this study, 12% donor
precursor donor chimerism status and surface marker expression
clast precursors
blood, culture-grown macrophage
Post-HSCT in months
Chimerism, N (%) Flow Cytometry (MFI)
Figure 2. Immunophenotypic and morphologic characterization of culture-grown osteoclast precursors and macrophages. (A) Representative flow cytometric dot plots of culture-grown and isolated by magnetic-activated cell sorting osteoclast precursors (OCLp) characterized by CD14-negative/DR-negative staining and CD115 and osteopontin expression in the first case. (B) Repre sentative flow cytometric dot plots of culture-grown CD14-positive/DR-positive macrophage (MΦ) with expression of CD115 and osteopontin in the second case. (C) Wright-Giemsa-stained cytospin slide image of isolated CD14-negative/DR-negative cells showing predominantly OCLp characterized by their large size and multi-nucleation on day 14 of culturing (100x). (D) WrightGiemsa-stained cytospin slide image of isolated CD14-positive/DR-positive cells showing predominantly MΦ characterized by their comparatively smaller size and single-nucleation on day 13 of culturing (100x).

myeloid cells are capable of producing sufficient number of donor-derived OCL maintaining proper OCL function and bone health for this patient. We were able to demonstrate in vitro development of OCLp as well as young and mature OCL from peripheral blood monocytes supported by morphology and con firmed by CD14–/DR–/CD45+/CD51/61+/CD115+/calcitonin receptor+/CD265+/TRAP+ OCLp phenotype using flow cytometry in these two allo HSCT recipients with OP. Con tinued monitoring of donor myeloid chimerism might shed further light onto discovering the minimum required donor myeloid cell presence to maintain osteoclastogenesis in allo HSCT recipients with OP. Since we could not study multinucleated mature OCL due to their size by flow cyto metry and perform STR analysis, we cannot comment on the potential occurrence of gene transfer from donor monocytes into OCL as elegantly demonstrated in mice by Jacome-Galarza CE et al.6 The approach used in this report may be tested further in future studies.
1Children’s Hospital of Michigan, Division of Hematology/Oncology, Pediatric Blood and Marrow Transplant Program, Barbara Ann Karmanos Cancer Center, Detroit; 2Central Michigan University College of Medicine, Department of Pediatrics, Mount Pleasant; 3Children’s Hospital of Michigan, Division of Hematology/Oncology, Hematology/Oncology Flow Cytometry Laboratory, Detroit and 4Molecular Genetics Laboratory, Detroit Medical Center University Laboratories, Detroit, MI, USA
Correspondence: S. SAVAŞAN - savas1s@cmich.edu
Received: March 5, 2022.
Accepted: June 27, 2022. Prepublished: July 7, 2022.
Storti Foundation
CC BY-NC
No
Contributions
designed the project and experiments, obtained cytospin images,
Süreyyaprepared the
gures, drafted and
nalized the manuscript. MG designed and ran experiments, and prepared materials and methods, histograms and the
gures, and edited the manuscript. CF edited the manuscript. OM ran STR analysis and edited the manuscript
This work is partially supported by funds from Children’s Foundation.
1. Penna S, Capo V, Palagano E, et al. One disease, many genes: implications for the treatment of osteopetroses. Front Endocrinol (Lausanne). 2019;10:85.
2. Even-Or E, Stepensky P. How we approach malignant infantile osteopetrosis. Pediatr Blood Cancer. 2021;68(3):e28841.
3. Singh P, Secord E, Pappas K, et al. An infant with severe combined immunodeficiency, osteopetrosis, chromosomally integrated herpesvirus-6 infection, and hemophagocytic syndrome: what are the links? Pediatr Blood Cancer. 2021;68(1):e28564.
4. Inoue K, Miura H, Hoshino A, et al. Inherited chromosomally integrated human herpesvirus-6 in a patient with XIAP deficiency. Transpl Infect Dis. 2020;22(5):e13331.
5. Abdallah D, Jourdain ML, Braux J, et al. An optimized method to generate human active osteoclasts from peripheral blood monocytes. Front Immunol. 2018;9:632.
6. Jacome-Galarza CE, Percin GI, Muller JT, et al. Developmental origin, functional maintenance and genetic rescue of osteoclasts. Nature. 2019;568(7753):541-545.
7. Kylmäoja E, Nakamura M, Turunen S, et al. Peripheral blood monocytes show increased osteoclast differentiation potential compared to bone marrow monocytes. Heliyon. 2018;4(9):e00780.
The
that
this study are available from the
reasonable request
8. Maggiani F, Forsyth R, Hogendoorn PC, et al. The immunophenotype of osteoclasts and macrophage polykaryons.
J Clin Pathol. 2011;64(8):701-705.
9. Hou JM, Lin JL, Wen JP, et al. Immunohistochemical identification of osteoclasts and multinucleated macrophages. Cell Immunol. 2014;292(1-2):53-56.
10. Quinn JM, Elliott J, Gillespie MT, et al. A combination of osteoclast differentiation factor and macrophage-colony stimulating factor is suf
cient for both human and mouse osteoclast formation in vitro. Endocrinology. 1998;139(10):4424-4427.
11. Hattersley G, Chambers TJ. Calcitonin receptors as markers for osteoclastic differentiation: correlation between generation of bone-resorptive cells and cells that express calcitonin receptors in mouse bone marrow cultures. Endocrinology. 1989;125(3):1606-1612.
12. Luukkonen J, Hilli M, Nakamura M, et al. Osteoclasts secrete osteopontin into resorption lacunae during bone resorption. Histochem Cell Biol. 2019;151(6):475-487.
13. Hashemi Taheri AP, Radmard AR, Kooraki S, et al. Radiologic resolution of malignant infantile osteopetrosis skeletal changes following hematopoietic stem cell transplantation. Pediatr Blood Cancer. 2015;62(9):1645-1649.