Download presentation
Presentation is loading. Please wait.

1
This years talk Ray Hilborn University of Washington

2
The status of the California Current ecosystem

3
Worm et al approach

4
Alec MacCall (NOAA Fisheries Santa Cruz, CA) reviewed the California Current ecosystem data and concluded “ Total taxa – 258. Number listed as "collapsed" – 124. Number of collapsed eliminated by Gilbert filter (less than 1000 t landings) – 84. Remaining for closer consideration -- 39. Of the 39 that I examined closely, 7 needed to be combined with some other taxon, and in several cases the apparent decline was simply due to discontinuation of use as a taxonomic category. 13 were taxa from Mexican waters, an area that is now closed to US fishermen (these are not California species). 5 were from far northern waters, and are not California species. 2 declined due to management restrictions 2 were so lightly exploited as to be excluded, 4 were highly variable, with far higher amounts having been landed within a couple of years preceding 2001. This leaves 6 or 7 taxa, most of which declined due to market disinterest or possible adverse effects of the post-1976 warming. In the entire list there may be 1 to 3 serious declines, and even those need to be considered more carefully.”
 – 84. Remaining for closer consideration Of the 39 that I examined closely, 7 needed to be combined with some other taxon, and in several cases the apparent decline was simply due to discontinuation of use as a taxonomic category. 13 were taxa from Mexican waters, an area that is now closed to US fishermen (these are not California species). 5 were from far northern waters, and are not California species. 2 declined due to management restrictions 2 were so lightly exploited as to be excluded, 4 were highly variable, with far higher amounts having been landed within a couple of years preceding This leaves 6 or 7 taxa, most of which declined due to market disinterest or possible adverse effects of the post-1976 warming. In the entire list there may be 1 to 3 serious declines, and even those need to be considered more carefully. .")
5
Conclusion: data Worm et all used essentially useless Need to look at known abundance trends Will look only at groundfish – where all the overfished stocks are found

8
The overfished stocks

9
West coast groundfish

10
NC Coast models Assume that the total catch is regulated based on the stock size outside of protected areas

13
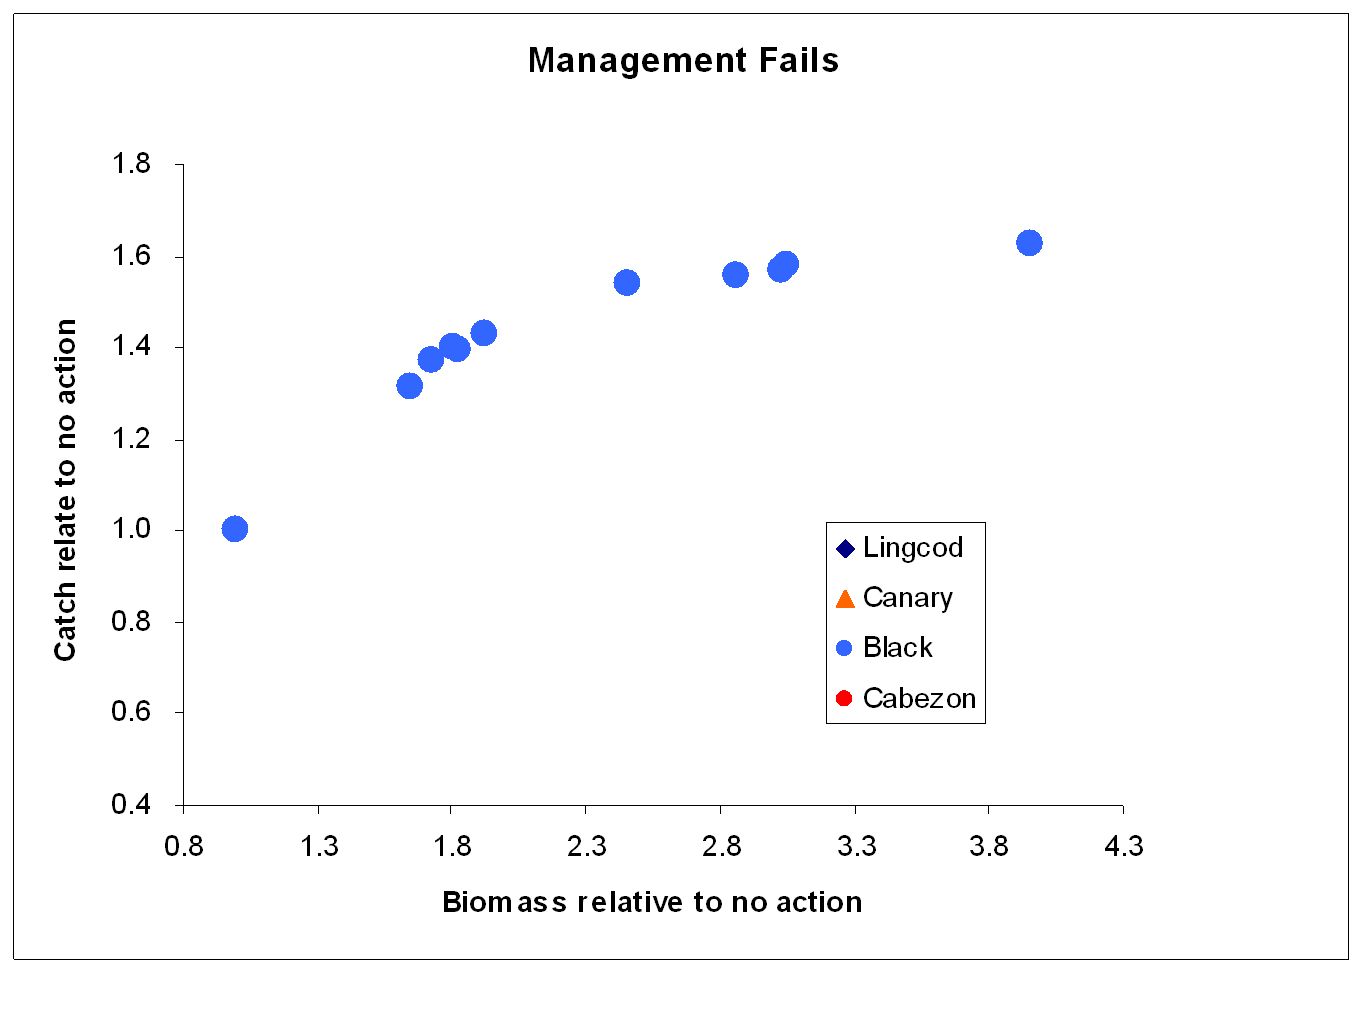
Management fails

14
What if catches are based on all the fish Then the fleet concentrates outside of the reserves and hammers the leakage

20
History of catch From Little et al

21
Revenue (constant $) from Little et al
 from Little et al")
22
Maximum biomass of key species in the ecosystem Pacific whiting 7,272,000 Dover sole 596,000 Pacific sardine 4,015,000 Shortbelly rockfish 295,000 Jack mackerel 1,905,000 Widow rockfish 265,000 Northern anchovy 1,598,000 Shortspine thornyhead 230,000 Pacific mackerel 1,394,000 Longspine thornyhead 228,000 Sablefish723,000Yellowtail rockfish 138,000

23
None of these stocks are overfished – no lost yield These stocks constitute 97% of the biomass! All of the overfished stocks are low abundance stocks, they constitute 1.3% of the unfished stock biomass

24
Maximum biomass of less abundant species Canary rockfish 93,000Dark blotched 28,000 Pacific Ocean Perch 83,000Petrale sole26,000 Lingcod76,000Vermilion rockfish 21,000 English sole 63,000Blackgill rockfish 21,000 Chilipepper rockfish 58,000Black rockfish 20,000 Bocaccio46,000Bank rockfish 14,000

25
State of the Pacific fisheries What is the problem? It depends on the question –what is the objective

26
What is the problem? If the objective is yield – the problem is not overfishing, but discarding and regulations imposed to try to keep all stocks above the overfishing threshold – loss of yield from overfishing is very little

27
What is the problem? If the objective is intact ecosystems – the problem is fishing and the desire to produce yield and jobs – less fishing, less yield, and fewer jobs would provide for more intact ecosystems

28
What is the problem? If the objective is jobs – the problem is discarding due to the trip limit system and regulations to protect overfished stocks, and the economic inefficiency of a large fleet – the same catch could be caught by a much smaller fleet

29
What is the problem? If the objective is profit – the problem is the trip-limit system, the regulations to prevent overfishing – the lack of a rational economic management system From a taxpayer perspective the problem is public subsidies

Similar presentations


>")


 - 2003 Wayne Wakeland 1, Olgay Cangur 1, Guillermo.>")

 Ian Taylor SMA 550: Climate Impacts on the Pacific Northwest.>")


