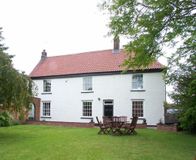
White House, 27, Low Road is a 5 bedroom detached house - it is ranked as the most expensive property* in DN20 0LY, with a valuation of £525,000.
Since it last sold in December 2020 for £440,000, its value has increased by £85,000.
The most paid for a property in Low Road, DN20 0LY was £440,000 in 2020.
| Date | Price | Change |
|---|---|---|
| Today's value* | £525,000 | 19.3% |
| 21 Dec 2020 | £440,000 | 15.2% |
| 18 Sep 2015 | £382,000 | 27.3% |
| 11 Mar 2005 | £300,000 | - |
The previous owner had the property for 5 years, having purchased it in September 2015 for £382,000.
During this time, the price rose by £58,000 (15.2%), which equates to it increasing in value by 2.7% each year.
The property didn't turn out to be a great investment for the previous owner.
White House, 27, Low Road, Worlaby has increased in price by £85,000 since it last sold in 2020 - this equates to a 5.3% rise each year.
If the property was previously purchased in a bad state of repair, making home improvements could increase its sale price to £604,000.
If no refurbishment work has been carried out since it was last purchased, we expect the property to sell for between £501k and £549k.
The property didn't turn out to be a great investment for the previous owner - returning on average 2.7% per annum.
| Property | Valuation | ||
|---|---|---|---|
 |
7 Low Road, Worlaby
2 bed | 829 sq. ft. |
£190,000 | |
|
33A Low Road, Worlaby
|
£292,000 | ||
 |
11 Low Road, Worlaby
3 bed |
£308,000 | |
 |
White House Barn, Low Road
5 bed | 1970 sq. ft. |
£360,000 | |
 |
3 Low Road, Worlaby
4 bed | 2009 sq. ft. |
£411,000 | |
|
Willow Hay, Low Road
|
£442,000 | ||
|
Woodrising, 13, Low Road
|
£516,000 | ||
 |
White House, 27, Low Road
5 bed |
£525,000 |
Most likely sale price: £525k

Our property valuation model calculates the latest property prices using data from trusted external sources in combination with available user-submitted information - this includes HM Land Registry which is the UK's official register for ownership of land and property in England and Wales.
The model takes into account what has sold, when and how prices have changed over time. It also brings in multiple datasources to cross reference accuracy with the latest sales data and cost per square foot benchmarks.
In addtion to this, we filter out bad data where we are able to identify it so we can improve accuracy.
If home improvements have been made or the property has been extended after it was last purchased, these improvements won't be taken into account if we don't know about them. For properties that have had home improvements made, you can get an updated valuation here.
A number of things can make a property more desirable and sell for more money per square foot than others in the area.
Some of the things that can cause a property to be worth more per square foot include:
We use multiple data sources to provide reliable property information to you.
Some of the data sources we use are:
* Excluding properties that we've been unable to calculate a valuation for.
** Excludes property transactions that occurred before 1995.
Whilst all reasonable effort is made to ensure the information in this website is current, The Move Market does not warrant the accuracy or completeness and accepts no liability for any loss or damage or costs.
Contains HM Land Registry data © Crown copyright and database right 2023. This data is licensed under the Open Government Licence v3.0.
The latest HM Land registry data covers property transactions up until 31/03/2024 - this was released on the 29/04/2024.