
Assessment of Antimicrobial Activity, Mode of Action and Volatile Compounds of Etlingera pavieana Essential Oil

 , ,
, , 
Abstract
:1. Introduction
2. Results and Discussion
2.1. Yield Percentage and Analysis of the Volatile Compounds from the Rhizome of E. pavieana Essential Oils (EOEP)
2.2. Determination of the MIC and MBC of EOEP
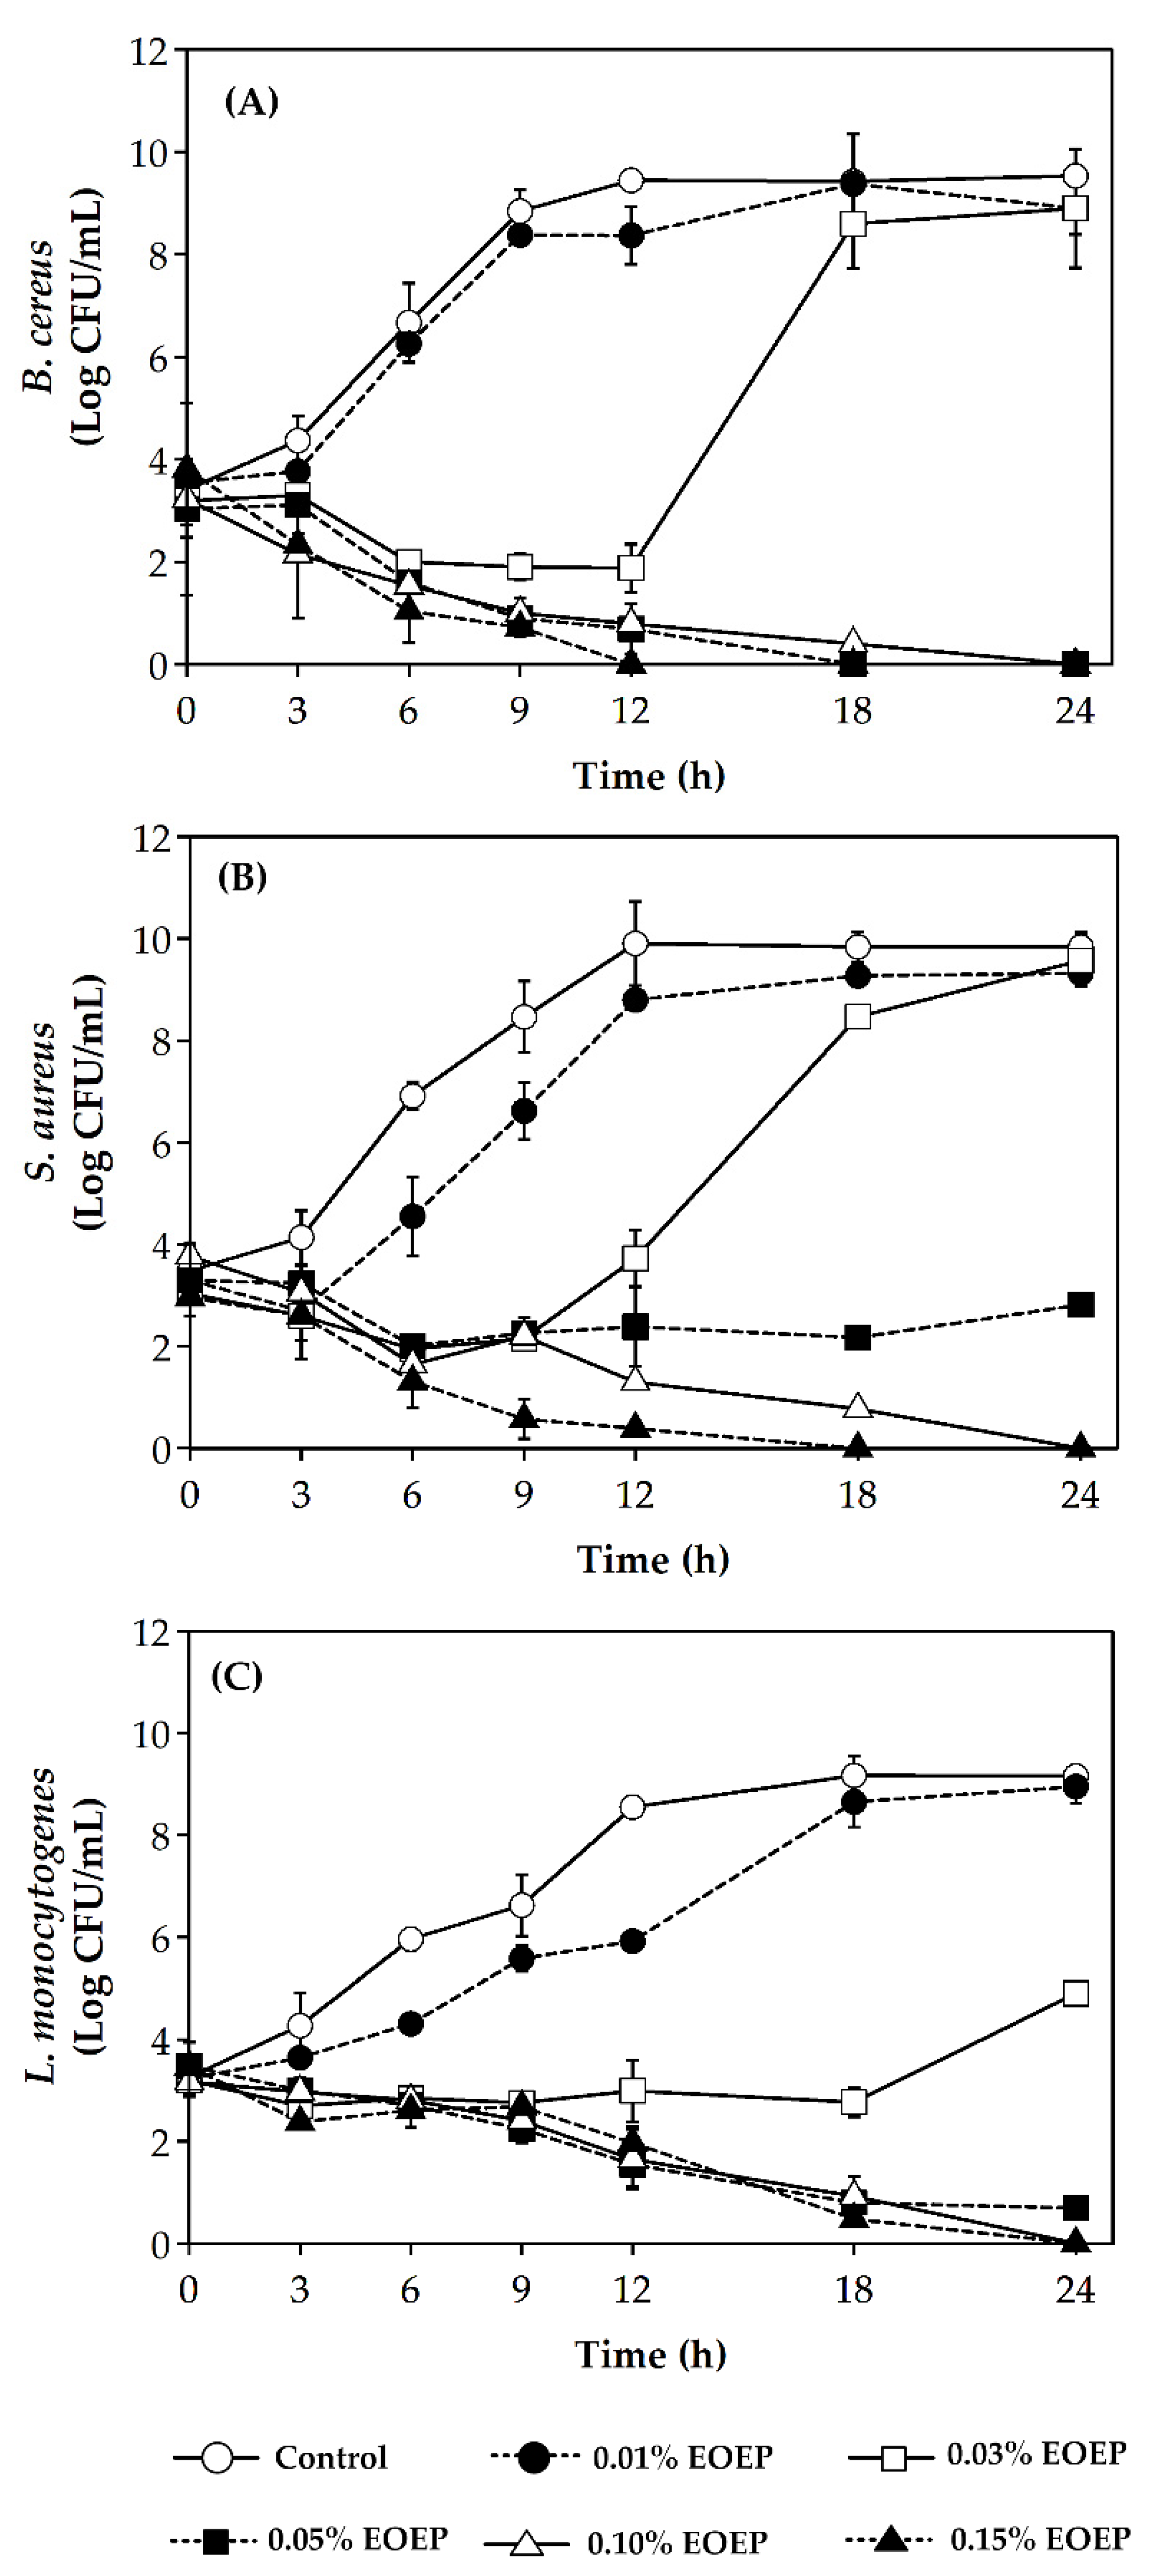
2.3. Enumeration Cell Death Over Time by Time-Kill Curve
2.4. Determination of the Modes of Action of EOEP on B. cereus Using Synchrotron FTIR Microspectroscopy
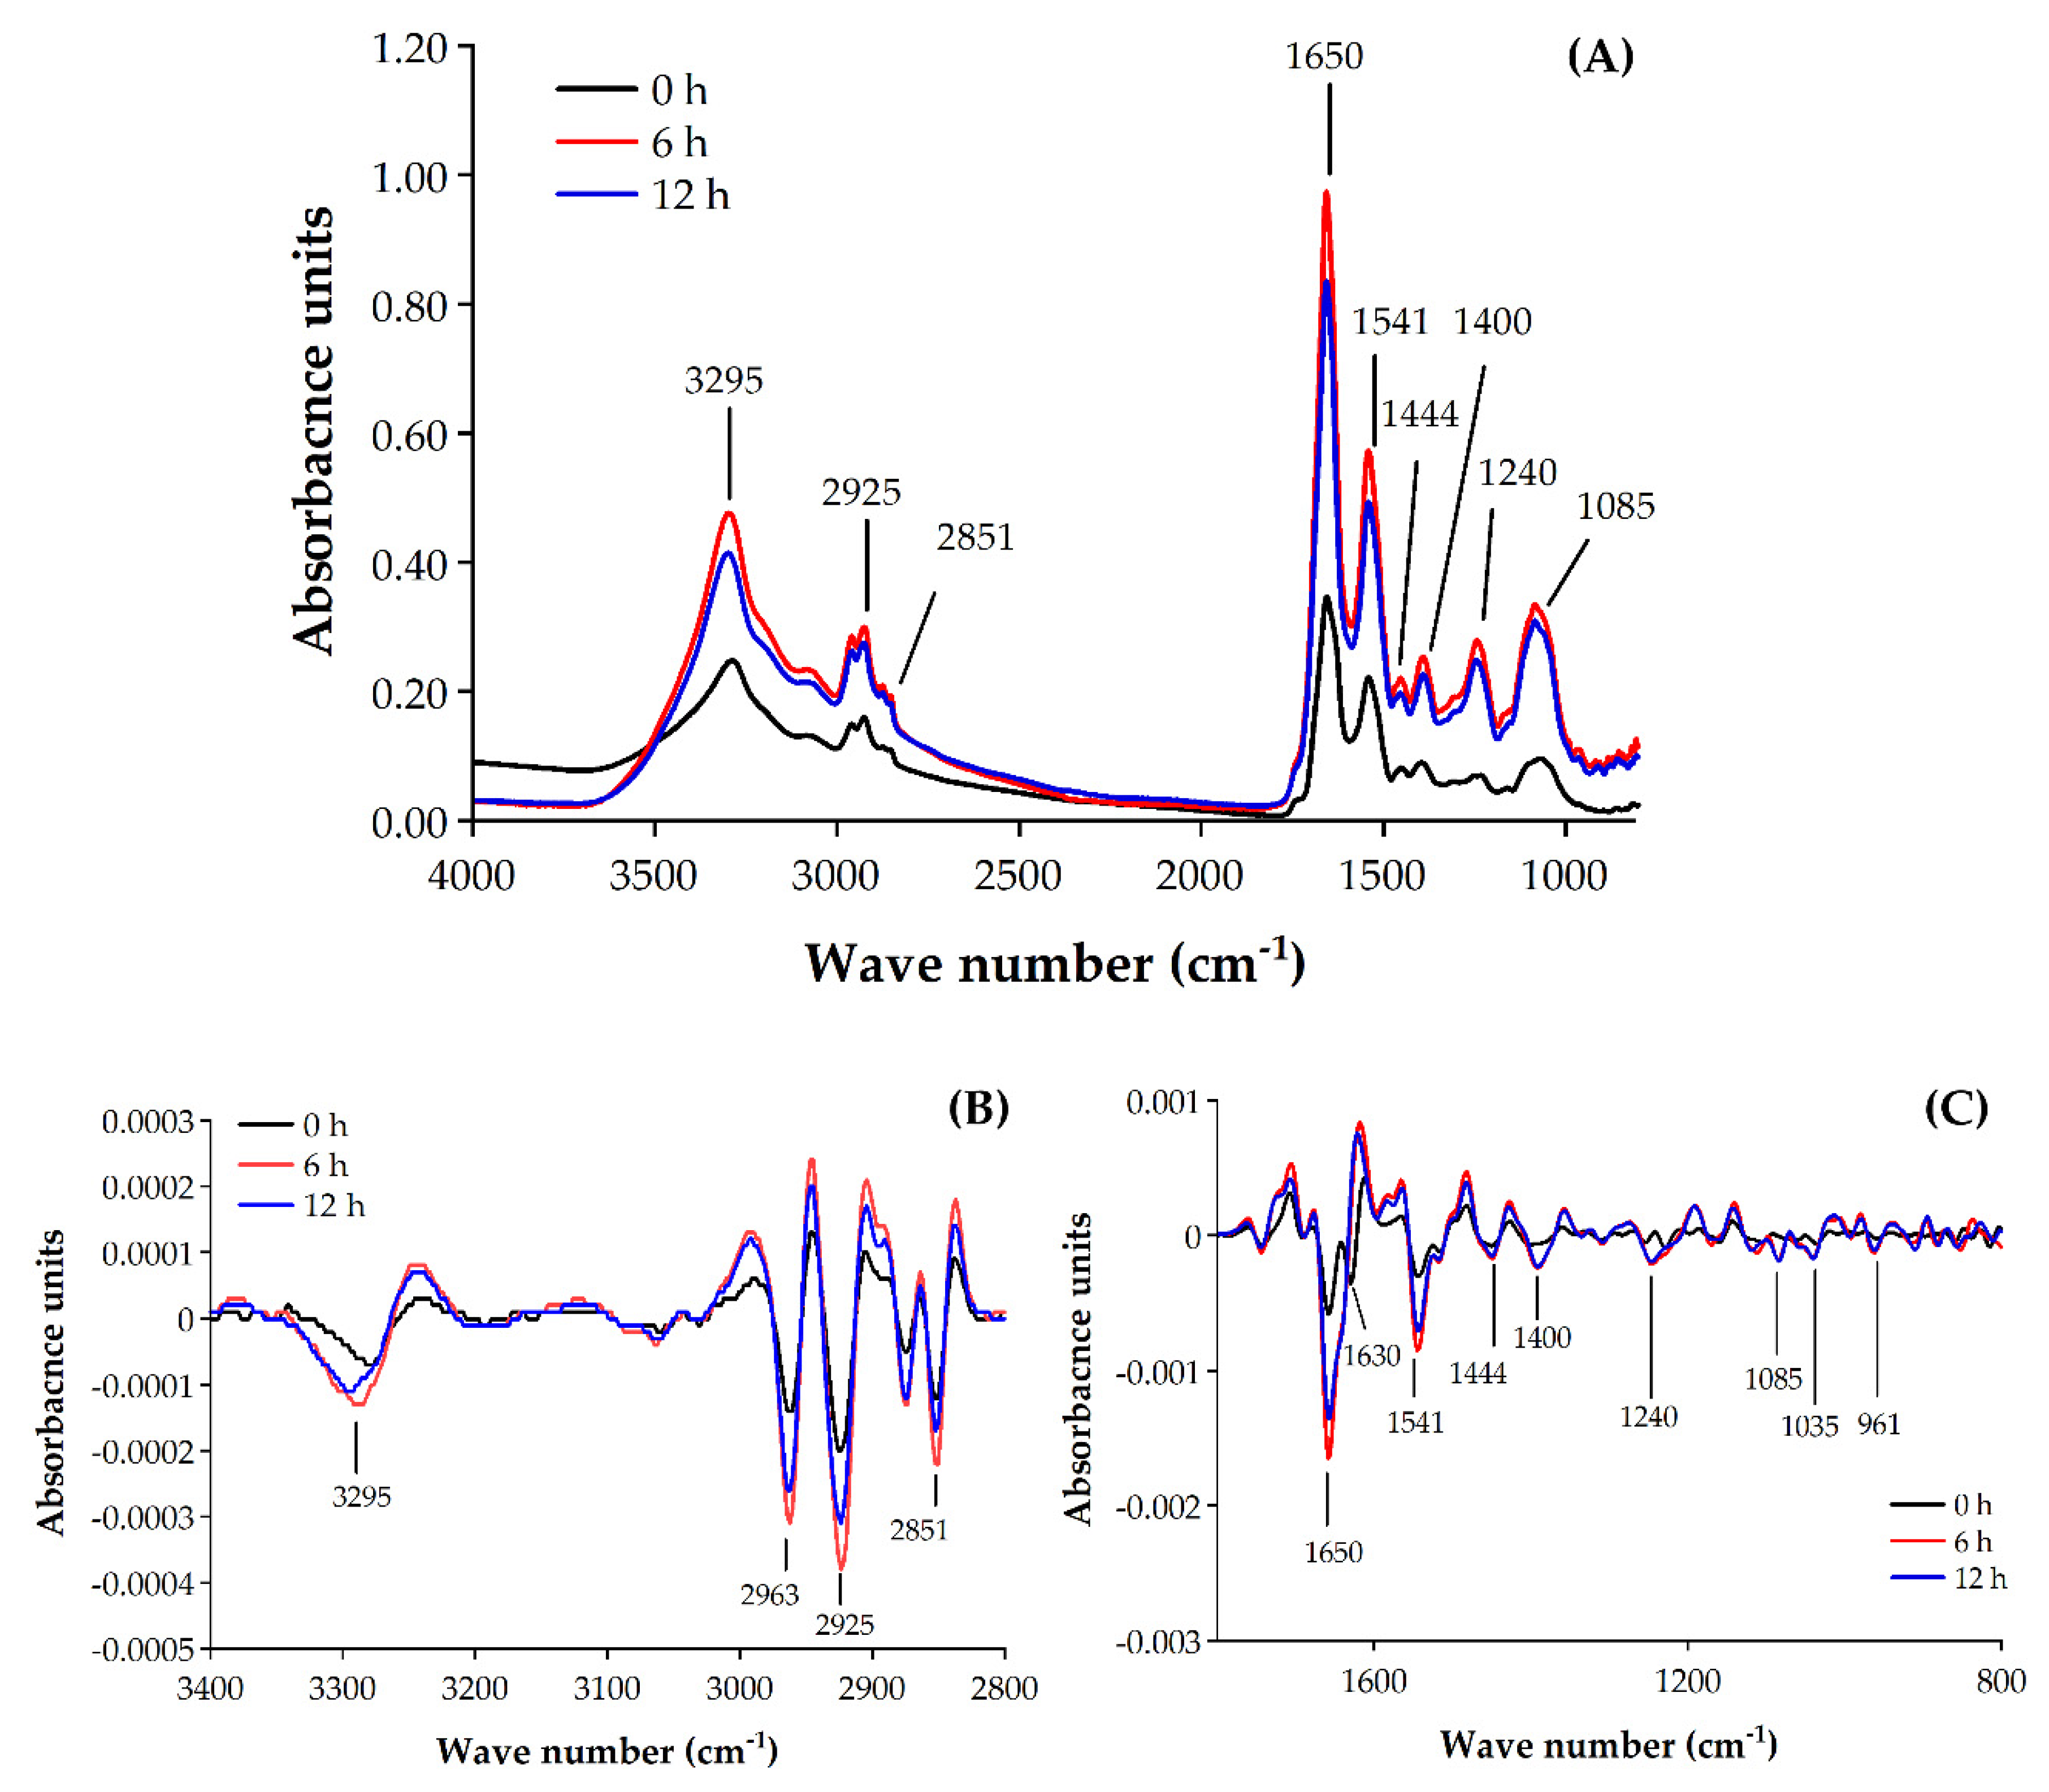
2.4.1. Assessment of Antimicrobial Action of EOEP Using Synchrotron FTIR Microspectroscopy
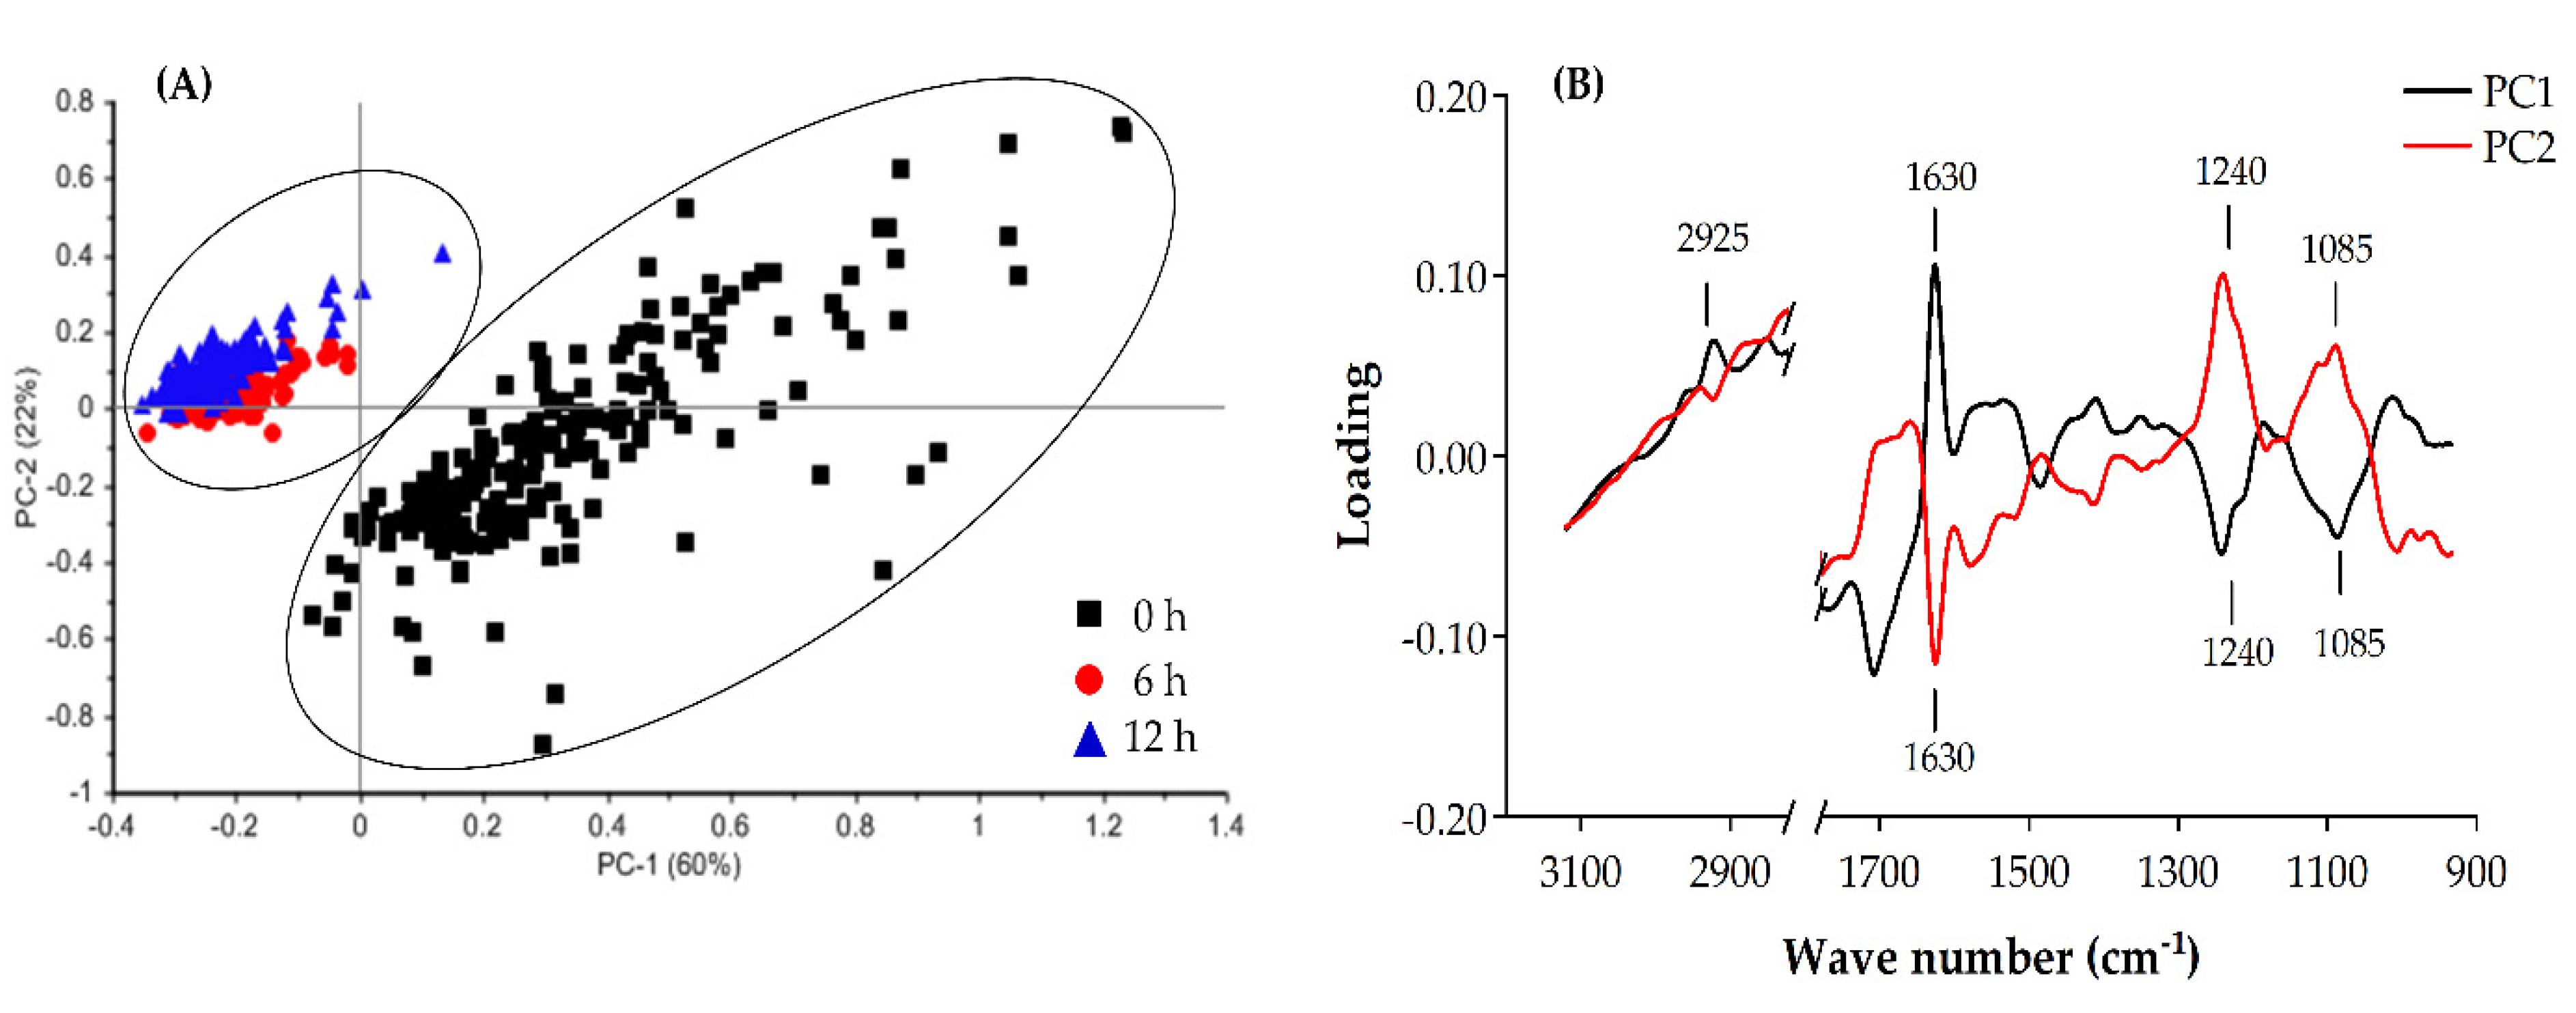
2.4.2. Principal Component Analysis (PCA) of the FTIR Spectra from B. cereus Treated with EOEP
3. Materials and Methods
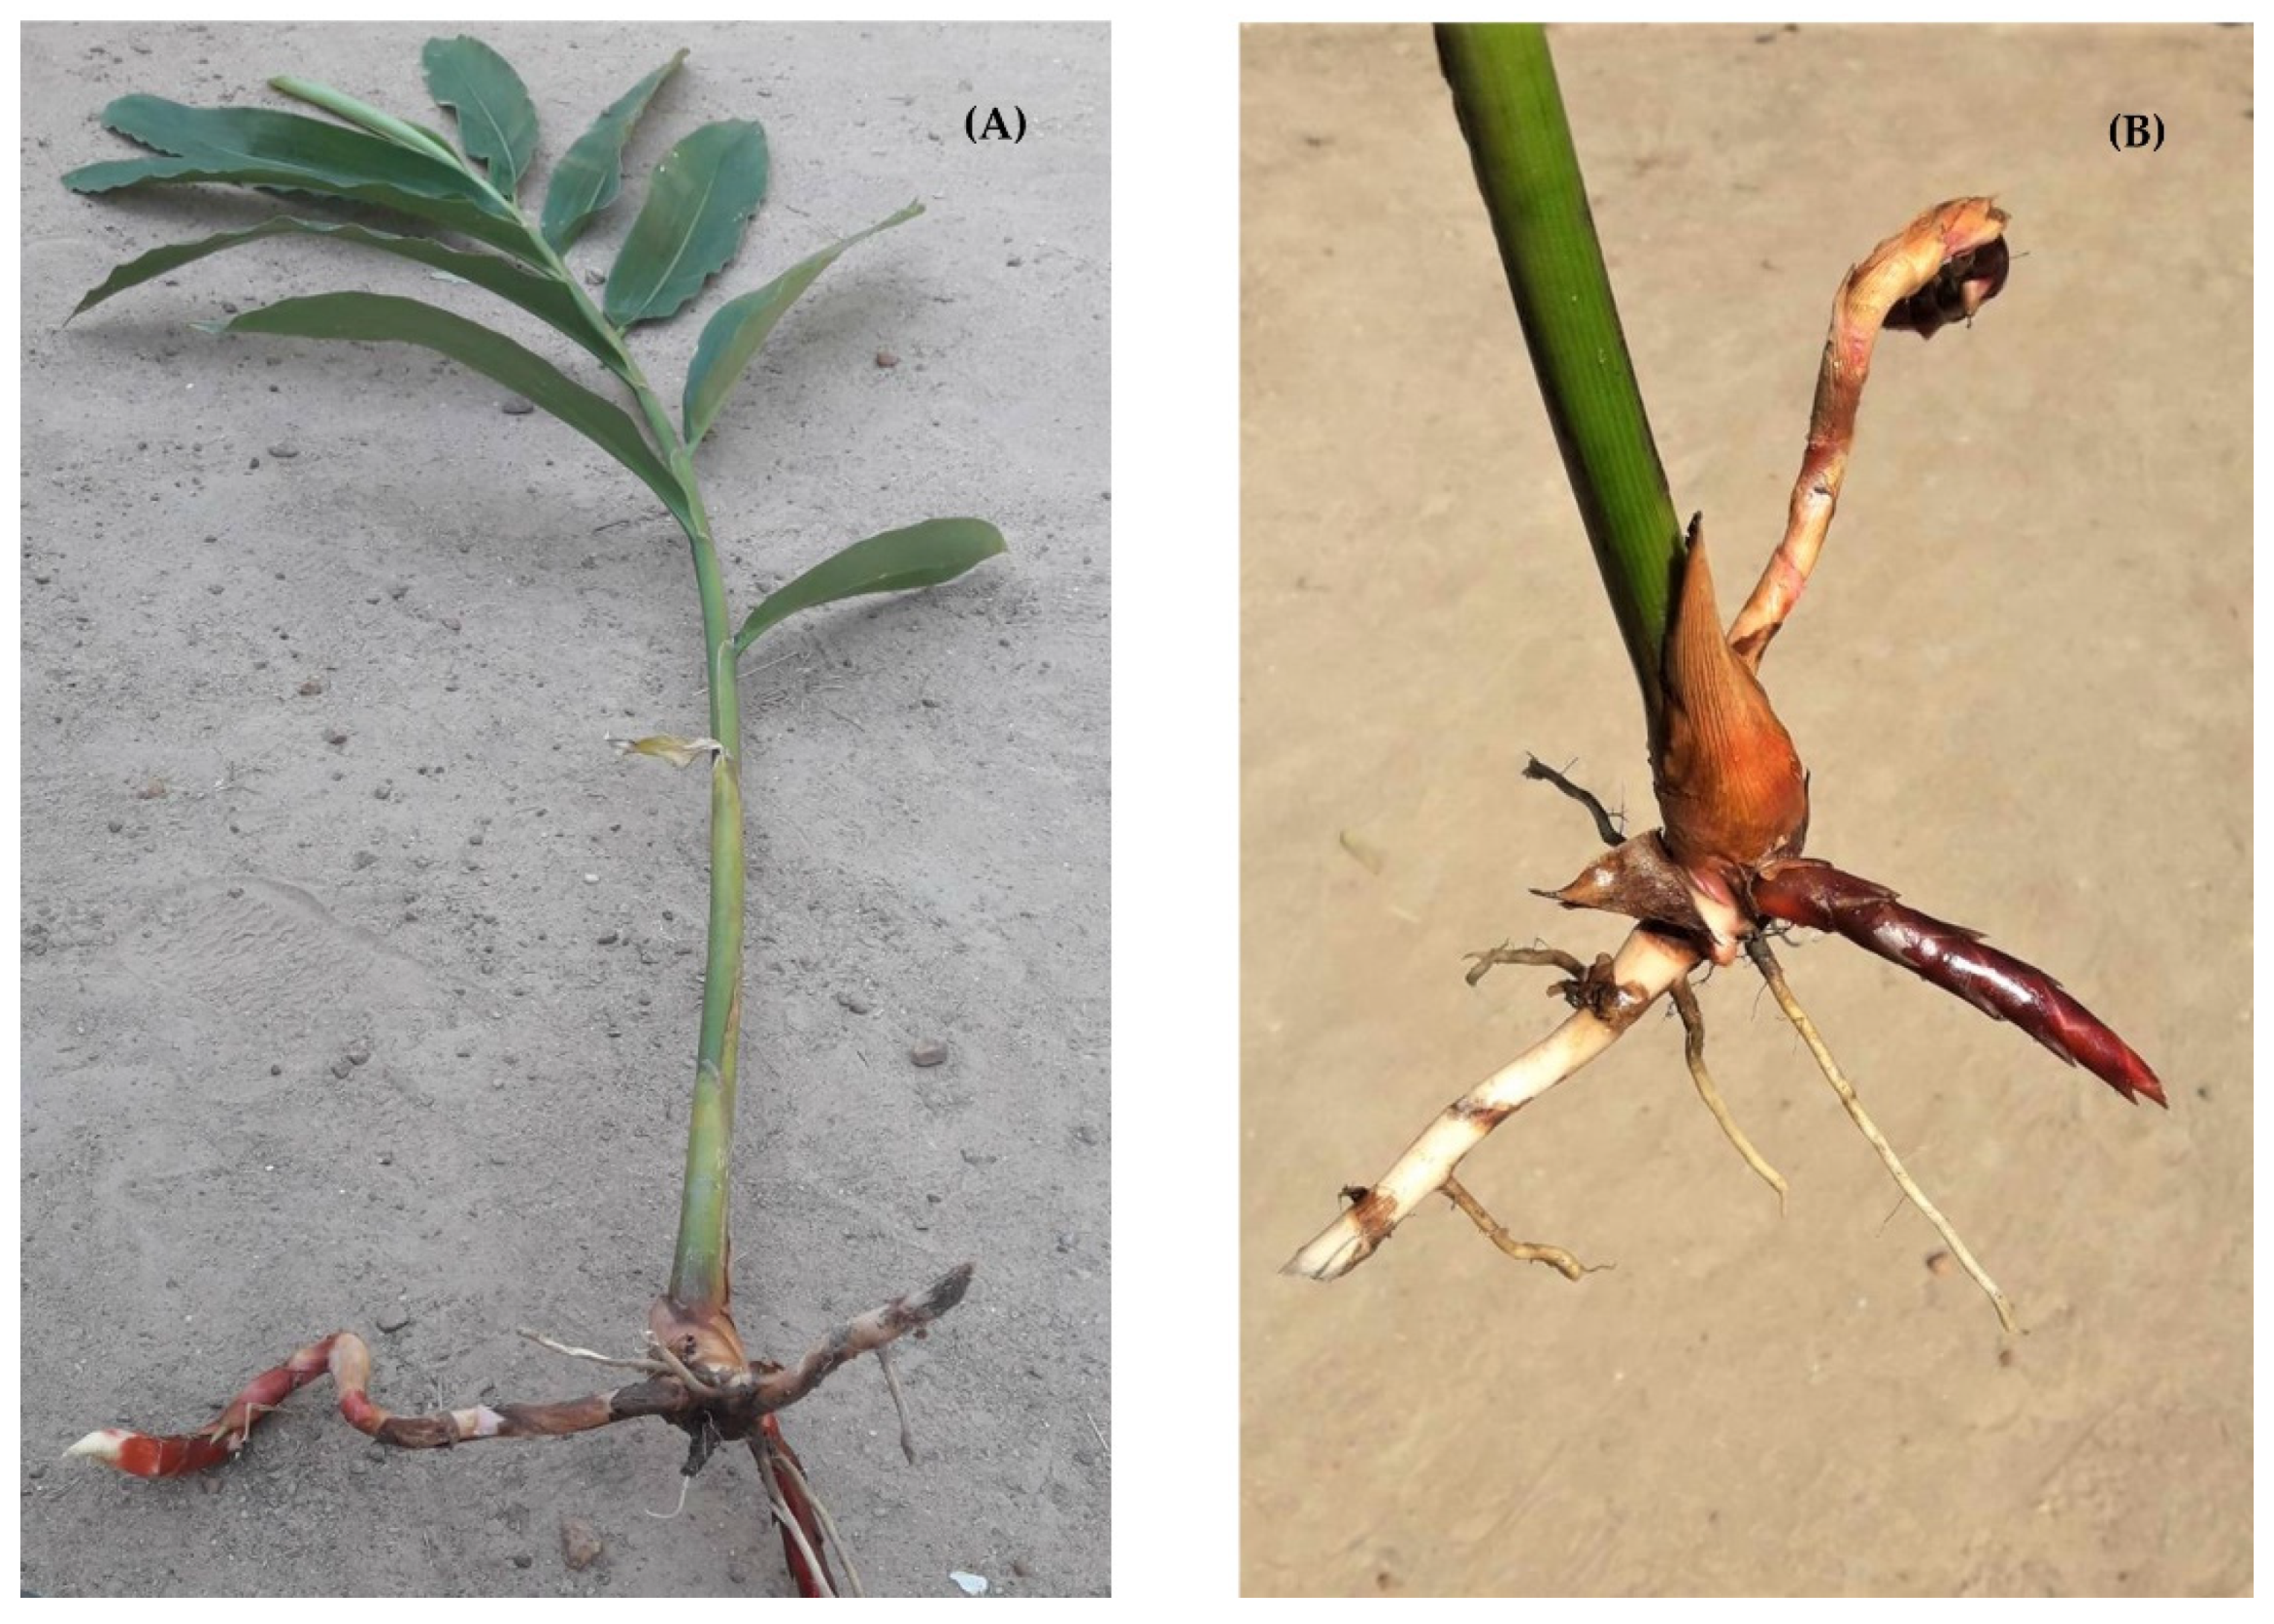
3.1. Plant Material
3.2. Characterization of Chemical Composition of EOEP
3.3. Microorganisms Preparation
3.4. Determination of Antimicrobial Activity
3.4.1. MIC and MBC Assay
3.4.2. Time-kill Assay
3.5. Determination of Mode of Actions of EOEP on B. cereus Using Synchrotron FTIR Microspectroscopy
3.5.1. Synchrotron FTIR Sample Preparation
3.5.2. FTIR Data Analysis
3.6. Statistical Analysis
4. Conclusions
Author Contributions
Funding
Acknowledgments
Conflicts of Interest
References
- Poulsen, A.; Phonsena, P. Morphological variation and distribution of the useful ginger, Etlingera pavieana (Zingiberaceae). Nord. J. Bot. 2017, 35, 467–475. [Google Scholar] [CrossRef]
- Tachai, S.; Wangkarn, S.; Nuntawong, N. Chemical constituents of the rhizome oils of Etlingera pavieana (Pierre ex Gagnep.) R.M.Sm. Biochem. Syst. Ecol. 2014, 57, 410–415. [Google Scholar] [CrossRef]
- Srisook, E.; Palachot, M.; Mankhong, S.; Srisook, K. Anti-inflammatory Effect of Etlingera pavieana (Pierre ex Gagnep.) R.M.Sm. Rhizomal Extract and Its Phenolic Compounds in Lipopolysaccharide-Stimulated Macrophages. Pharm. Mag. 2017, 13 (Suppl. 2), S230–S235. [Google Scholar] [CrossRef] [PubMed] [Green Version]
- Naksang, P.; Rachtanapun, C. Effect of sample preparation on antibacterial activity of Etlingera pavieana (Pierre ex Gagnep) R.M.Sm. extracts against foodborne bacteria. In Proceedings of the 53rd Kasetsart University Annual Conference: Innovation for Bio-Health Supplements, Kasetsart University, Bangkok, Thailand, 3–6 February 2015. [Google Scholar]
- Srisook, K.; Srisook, E. Pharmacological activities and phytochemicals of Etlingera pavieana (Pierre ex Gagnep) R.M.Sm. IntechOpen 2019, 1–13. [Google Scholar] [CrossRef] [Green Version]
- Morales-Soto, A.; Oruna-Concha, M.J.; Elmore, J.S.; Barrajón-Catalán, E.; Micol, V.; Roldán, C.; Segura-Carretero, A. Volatile profile of Spanish Cistus plants as sources of antimicrobials for industrial applications. Ind. Crop. Prod. 2015, 74, 425–433. [Google Scholar] [CrossRef]
- Saoudi, S.; Chammem, N.; Sifaoui, I.; Bouassida-Beji, M.; Jimenez, I.A.; Bazzocchi, I.L.; Silva, S.D.; Hamdi, M.; Bronze, M.R. Influence of Tunisian aromatic plants on the prevention of oxidation in soybean oil under heating and frying conditions. Food Chem. 2016, 212, 503–511. [Google Scholar] [CrossRef]
- Vairappan, C.S.; Nagappan, T.; Palaniveloo, K. Essential oil composition, cytotoxic and antibacterial activities of five Etlingera species from Borneo. Nat. Prod. Commun. 2012, 7, 1934578X1200700233. [Google Scholar] [CrossRef] [Green Version]
- Abdelmageed, A.H.A.; Faridah, Q.Z.; Nur Amalina, A.; Yaacob, M. The influence of organ and post-harvest drying period on yield and chemical composition of the essential oils of Ethlingera elatior (Zingiberaceae). J. Med. Plants Res. 2011, 5, 3432–3439. [Google Scholar]
- Ud-Daula, A.F.M.; Basher, M.A. Genus Etlingera—A review on chemical composition and antimicrobial activity of essential oils. J. Med. Plants Res. 2019, 13, 135–156. [Google Scholar]
- Tadthong, S.; Wannakhot, P.; Poolsawat, W.; Athikomkulchai, S.; Ruangrungsi, N. Antimicrobial activities of essential oil from Etlingera punicea rhizome. J. Health Res. 2009, 23, 77–79. [Google Scholar]
- Bhuiyan, M.N.I.; Chowdhury, J.U.; Begum, J.; Azim, M.A. Aromatic plants of Bangladesh: Constituents of leaf and rhizome oil of Etlingera linguiforme. Dhaka Univ. J. Sci. 2010, 58, 13–15. [Google Scholar]
- Abdelwahab, S.I.; Zaman, F.Q.; Mariod, A.A.; Yaacob, M.; Abdelmageed, A.H.; Khamis, S. Chemical composition, antioxidant and antibacterial properties of the essential oils of Etlingera elatior and Cinnamomum pubescens Kochummen. J Sci Food Agric 2010, 90, 2682–2688. [Google Scholar] [CrossRef] [PubMed]
- Mahdavi, B.; Yaacob, W.A.; Din, L.B. Chemical composition, antioxidant, and antibacterial activity of essential oils from Etlingera sayapensis A.D. Poulsen & Ibrahim. Asian Pac. J. Trop. Med. 2017, 10, 819–826. [Google Scholar] [PubMed]
- Wijekoon, M.M.J.O.; Bhat, R.; Karim, A.A.; Fazilah, A. Chemical composition and antimicrobial activity of essential oil and solvent extracts of torch ginger inflorescence (Etlingera elatior Jack.). Int. J. Food Prop. 2013, 16, 1200–1210. [Google Scholar] [CrossRef] [Green Version]
- Ud-Daula, A.F.M.S.; Demirci, F.; Abu Salim, K.; Demirci, B.; Lim, L.B.L.; Baser, K.H.C.; Ahmad, N. Chemical composition, antioxidant and antimicrobial activities of essential oils from leaves, aerial stems, basal stems, and rhizomes of Etlingera fimbriobracteata (K.Schum.) R.M.Sm. Ind. Crop. Prod. 2016, 84, 189–198. [Google Scholar] [CrossRef]
- Chan, E.W.C.; Lim, Y.Y.; Omar, M. Antioxidant and antibacterial activity of leaves of Etlingera species (Zingiberaceae) in Peninsular Malaysia. Food Chem. 2007, 104, 1586–1593. [Google Scholar] [CrossRef]
- Tachai, S.; Nuntawong, N. Uncommon secondary metabolites from Etlingera pavieana rhizomes. Nat. Prod. Res. 2016, 30, 2215–2219. [Google Scholar] [CrossRef]
- Chiang, E.C.W.; Yan, L.Y.; Ali, A.Z.M. Composition and antibacterial activity of essential oils from leaves of Etlingera species (Zingiberaceae). Int. J. Adv. Sci. Arts. 2010, 1, 1–12. [Google Scholar]
- Susanti, D.; Awang, N.A.; Qaralleh, H.; Sheikh Mohamed, H.I.; Attoumani, N. Antimicrobial activity and chemical composition of essential oil of Malaysian Etlingera elatior (Jack) R.M. Smith flowers. J. Essent. Oil Bear. Plants 2013, 16, 294–299. [Google Scholar] [CrossRef]
- Burt, S. Essential oils: Their antibacterial properties and potential applications in foods—a review. Int. J. Food Microbiol. 2004, 94, 223–253. [Google Scholar] [CrossRef]
- Ruberto, G.; Baratta, M.T.; Deans, S.G.; Dorman, H.J. Antioxidant and antimicrobial activity of Foeniculum vulgare and Crithmum maritimum essential oils. Planta Med. 2000, 66, 687–693. [Google Scholar] [CrossRef] [PubMed]
- Ambrosio, C.; Ikeda, N.; Miano Pastor, A.; Villa, E.; Moreno, A.; Stashenko, E.; Contreras-Castillo, C.; da Gloria, E. Unraveling the selective antibacterial activity and chemical composition of citrus essential oils. Sci. Rep. 2019, 9, 1–13. [Google Scholar] [CrossRef] [PubMed]
- Dunn, L.; Davidson, P.M.; Critzer, F. Antimicrobial efficacy of an array of essential oils against lactic acid bacteria. J. Food Sci. 2016, 81. [Google Scholar] [CrossRef] [PubMed]
- Ouwehand, A.; Tiihonen, K.; Kettunen, H.; Peuranen, S.; Schulze, H.; Rautonen, N. In vitro effects of essential oils on potential pathogens and beneficial members of the normal microbiota. Vet. Med. 2010, 55, 71–78. [Google Scholar] [CrossRef]
- Gutierrez, J.; Barry-Ryan, C.; Bourke, P. The antimicrobial efficacy of plant essential oil combinations and interactions with food ingredients. Int. J. Food Microbiol. 2008, 124, 91–97. [Google Scholar] [CrossRef] [Green Version]
- Davidson, P.M. Methods for testing the efficacy of food antimicrobials. Food Technol. 1989, 43, 148–155. [Google Scholar]
- Karapinar, M.; Esen Aktuǧ, Ş. Inhibition of foodborne pathogens by thymol, eugenol, menthol and anethole. Int. J. Food Microbiol. 1987, 4, 161–166. [Google Scholar] [CrossRef]
- Song, Y.R.; Choi, M.S.; Choi, G.W.; Park, I.K.; Oh, C.S. Antibacterial activity of cinnamaldehyde and estragole extracted from plant essential oils against Pseudomonas syringae pv. actinidiae causing bacterial canker disease in kiwifruit. Plant Pathol J 2016, 32, 363–370. [Google Scholar] [CrossRef]
- Osei-Safo, D.; Addae-Mensah, I.; Garneau, F.-X.; Koumaglo, H. A comparative study of the antimicrobial activity of the leaf essential oils of chemo-varieties of Clausena anisata (Willd.) Hook. f. ex Benth. Ind. Crop. Prod. Ind. Crop. Prod. 2010, 32, 634–638. [Google Scholar] [CrossRef]
- Shahat, A.A.; Ibrahim, A.Y.; Hendawy, S.F.; Omer, E.A.; Hammouda, F.M.; Abdel-Rahman, F.H.; Saleh, M.A. Chemical composition, antimicrobial and antioxidant activities of essential oils from organically cultivated fennel cultivars. Molecules 2011, 16, 1366–1377. [Google Scholar] [CrossRef]
- Naumann, D. Infrared spectroscopy in microbiology. In Encyclopedia of Analytical Chemistry; Meyers, R.A., Ed.; John Wiley & Sons: Chichester, UK, 2000; pp. 102–131. [Google Scholar]
- Lin, S.F.; Schraft, H.; Griffith, M.W. Identification of Bacillus cereus by Fourier transform infrared spectroscopy (FTIR). J. Food Prot. 1998, 61, 921–923. [Google Scholar] [CrossRef] [PubMed]
- Mietke, H.; Beer, W.; Schleif, J.; Schabert, G.; Reissbrodt, R. Differentiation between probiotic and wild-type Bacillus cereus isolates by antibiotic susceptibility test and Fourier transform infrared spectroscopy (FT-IR). Int. J. Food Microbiol. 2010, 140, 57–60. [Google Scholar] [CrossRef]
- Movasaghi, Z.; Rehman, S.; ur Rehman, D.I. Fourier transform infrared (FTIR) spectroscopy of biological tissues. Appl. Spectrosc. Rev. 2008, 43, 134–179. [Google Scholar] [CrossRef]
- Davis, R.; Mauer, L.J. Fourier transform infrared (FT-IR) spectroscopy: A rapid tool for detection and analysis of foodborne pathogenic bacteria. In Current Research, Technology and Education Topics in Applied Microbiology and Microbial Biotechnology; Mendez-Vilas, A., Ed.; Formatex Research Center: Badajoz, Spain, 2010; pp. 1582–1594. [Google Scholar]
- Yu, C.; Irudayaraj, J. Spectroscopic characterization of microorganisms by Fourier transform infrared microspectroscopy. Biopolymers 2005, 77, 368–377. [Google Scholar] [CrossRef] [PubMed]
- Paluszkiewicz, C.; Kwiatek, W.M. Analysis of human cancer prostate tissues using FTIR microscopy and SXIXE techniques. Mol. Struct. 2001, 565, 329–334. [Google Scholar] [CrossRef]
- Fung, M.F.K.; Senterman, M.K.; Mikhael, N.Z.; Lacelle, S.; Wong, P.T.T. Pressure-tuning Fourier transform infrared spectroscopic study of carcino-genesis in human endometrium. Biospectroscopy 1996, 2, 155–165. [Google Scholar] [CrossRef]
- Dovbeshko, G.I.; Gridina, N.Y.; Kruglova, E.B.; Pashchuk, O.P. FTIR spectroscopy studies of nucleic acid damage. Talanta 1997, 53, 233–246. [Google Scholar] [CrossRef]
- Wood, B.R.; Quinn, M.A.; Tait, B.; Ashdown, M.; Hislop, T.; Romeo, M.; McNaughton, D. FTIR microspectroscopic study of cell types and potential confounding variables in screening for cervical malignancies. Biospectroscopy 1998, 4, 75–91. [Google Scholar] [CrossRef]
- Wood, B.R.; Quinn, M.A.; Burden, F.R.; McNaughton, D. An investigation into FT-IR spectroscopy as a bio-diagnostic tool for cervical cancer. Biospectroscopy 1996, 2, 143–153. [Google Scholar] [CrossRef]
- Shetty, G.; Kedall, C.; Shepherd, N.; Stone, N.; Barr, H. Raman spectroscopy: Evaluation of biochemical changes in carcinogenesis of oesophagus. Br. J. Cancer 2006, 94, 1460–1464. [Google Scholar] [CrossRef]
- Agarwal, R.; Tandon, P.; Gupta, V.D. Phonon dispersion in poly (dimethylsilane). J. Organomet. Chem. 2006, 691, 2902–2908. [Google Scholar] [CrossRef]
- Fukuyama, Y.; Yoshida, S.; Yanagisawa, S.; Shimizu, M. A study on the differences between oral squamous cell carcinomas and normal oral mucosa measured by Fourier transform infrared spectroscopy. Biospectroscopy 1999, 5, 117–126. [Google Scholar] [CrossRef]
- Sukmark, T.; Rachtanapun, P.; Rachtanapun, C. Antimicrobial activity of oligomer and polymer chitosan from different sources against foodborne pathogenic bacteria. Kasetsart J. (Nat. Sci.) 2011, 45, 636–643. [Google Scholar]
- Delaquis, P.J.; Stanich, K.; Girard, B.; Mazza, G. Antimicrobial activity of individual and mixed fractions of dill, cilantro, coriander and eucalyptus essential oils. Int. J. Food Microbiol. 2002, 74, 101–109. [Google Scholar] [CrossRef]
- Thongson, C.; Davidson, P.M.; Mahakarnchanakul, W.; Vibulsresth, P. Antimicrobial effect of Thai spices against Listeria monocytogenes and Salmonella Typhimurium DT104. J. Food Prot. 2005, 68, 2054–2058. [Google Scholar] [CrossRef] [PubMed]
- Ekkarin, P.; Rachtanapun, C.; Wanchaitanawong, P.; Mahakarnchanakul, W. Antimicrobial activity of spice extracts against pathogenic and spoilage microorganisms. Kasetsart J. (Nat. Sci.) 2006, 40, 159–165. [Google Scholar]
Sample Availability: Samples of the compounds are available from the authors. |


| Compounds | LRI a | % Area b |
|---|---|---|
| Monoterpenes (Total) | 1.55 | |
| (−)-α-Pinene | 944 | 0.12 |
| Camphene | 948 | 0.17 |
| β-Myrcene | 989 | 0.84 |
| (+)-3-Carene | 1014 | 0.07 |
| α-Phellandrene | 1014 | 0.01 |
| o-Cymene | 1034 | 0.01 |
| p-Cymene | 1034 | 0.01 |
| d-Limonene | 1039 | 0.15 |
| β-Ocimene | 1041 | 0.15 |
| δ-Terpinene | 1067 | 0.01 |
| Bornyl acetate | 1300 | 0.01 |
| Oxygenate monoterpenes (Total) | 0.40 | |
| Eucalyptol | 1041 | 0.01 |
| l-Fenchone | 1101 | 0.01 |
| Camphor | 1163 | 0.12 |
| Pinocarvone | 1163 | 0.15 |
| endo-Borneol | 1184 | 0.04 |
| Terpinen-4-ol | 1193 | 0.03 |
| α-Terpineol | 1204 | 0.04 |
| Phenylpropanoids (Total) | 97.90 | |
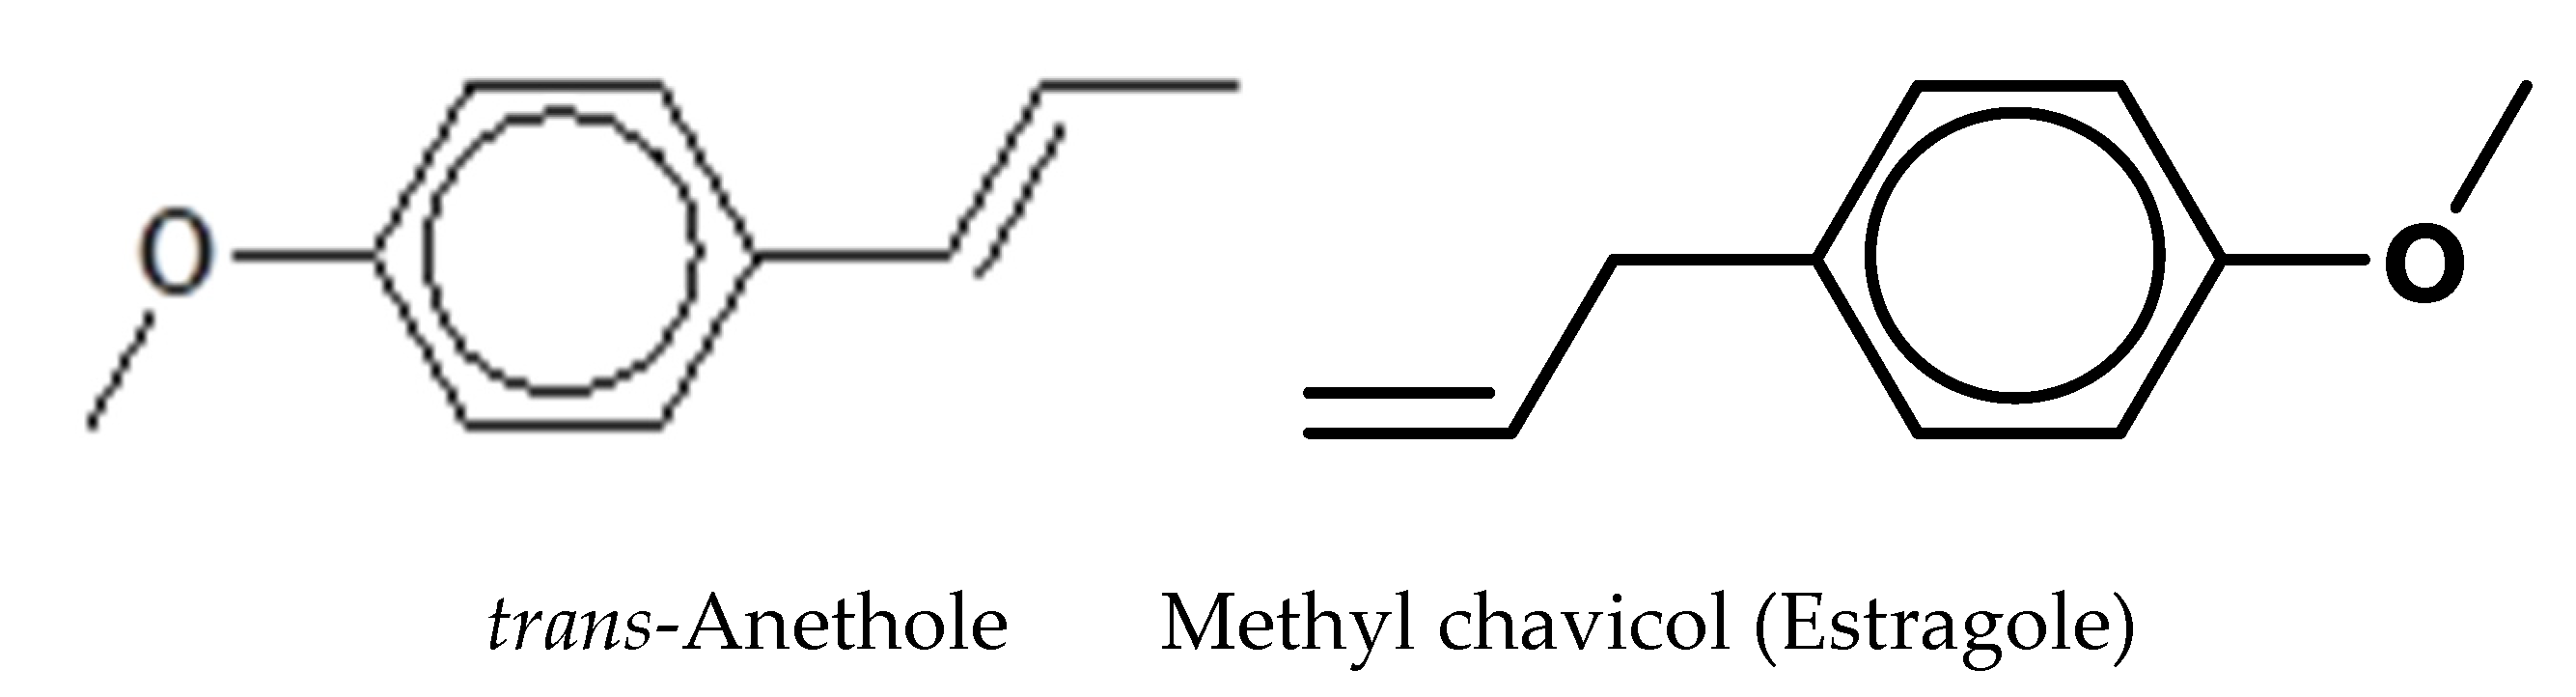
| Methyl chavicol (Estragole) | 1210 | 19.36 |
| trans-Anethole | 1300 | 78.54 |
| Sesquiterpenes (Total) | 0.09 | |
| α-Copaene | 1402 | 0.01 |
| Alloaromadendrene | 1496 | 0.08 |
| Total | 99.94 | |
| Tested Bacteria | MIC (% v/v) | MBC (% v/v) |
|---|---|---|
| Gram-Positive Bacteria | ||
| Bacillus cereus | 0.02 | 0.15 |
| Staphylococcus aureus | 0.03 | 0.15 |
| Listeria monocytogenes 101 | 0.02 | 0.15 |
| Listeria monocytogenes 108 | 0.02 | 0.10 |
| Listeria monocytogenes V7 | 0.02 | 0.30 |
| Listeria monocytogenes Scott A | 0.02 | 0.10 |
| Gram-negative bacteria | ||
| Escherichia coli | 5.00 | 5.00 |
| Pseudomonas aeruginosa | >5.00 | >5.00 |
| Salmonella Typhimurium | >5.00 | >5.00 |
| Lactic acid bacteria | ||
| Lactobacillus plantarum 541 | >5.00 | >5.00 |
| Lactobacillus plantarum 844 | >5.00 | >5.00 |
| Pediococcus cerevisiae | >5.00 | >5.00 |
| Leuconostoc mesenteroides | >5.00 | >5.00 |
| Wave Number (cm−1) | Possible Biomolecule Contributors | Contact Time | References | ||
|---|---|---|---|---|---|
| 0 h | 6 h | 12 h | |||
| 3295 | Amid A in Proteins | 246.37 ± 0.01b | 475.86 ± 0.06a | 414.12 ± 0.01a | [36,38] |
| 2925 | Fatty acids | 159.49 ± 0.01c | 299.66 ± 0.03a | 274.81 ± 0.01b | [36,37,39] |
| 2851 | Fatty acids | 107.39 ± 0.00b | 190.44 ± 0.02a | 177.77 ± 0.01a | [35,36,37] |
| 1650 | Proteinaceous content of cell | 340.63 ± 0.02c | 938.52 ± 0.10a | 808.40 ± 0.05b | [32,37,40] |
| 1630 | Proteinaceous content of cell | 272.01 ± 0.09c | 609.91 ± 0.07a | 514.76 ± 0.03b | [32,37,41] |
| 1541 | Proteinaceous content of cell | 221.51 ± 0.01b | 572.58 ± 0.06a | 493.14 ± 0.03a | [37,41,42] |
| 1444 | Cell membrane (lipids, proteins) | 79.61 ± 0.00b | 211.66 ± 0.02a | 189.53 ± 0.01a | [35,43] |
| 1400 | Cell membrane (amino acids, fatty acids) | 89.56 ± 0.01b | 244.34 ± 0.03a | 215.35 ± 0.01a | [36,37,44] |
| 1240 | Phosphodiesters in nucleic acid | 69.24 ± 0.01b | 277.30 ± 0.03a | 245.85 ± 0.01a | [37,45] |
| 1085 | DNA and RNA, phospholipids | 92.20 ± 0.00b | 334.54 ± 0.04a | 308.73 ± 0.01a | [32,37,45] |
© 2020 by the authors. Licensee MDPI, Basel, Switzerland. This article is an open access article distributed under the terms and conditions of the Creative Commons Attribution (CC BY) license (http://creativecommons.org/licenses/by/4.0/).
Share and Cite
Naksang, P.; Tongchitpakdee, S.; Thumanu, K.; Oruna-Concha, M.J.; Niranjan, K.; Rachtanapun, C. Assessment of Antimicrobial Activity, Mode of Action and Volatile Compounds of Etlingera pavieana Essential Oil. Molecules 2020, 25, 3245. https://doi.org/10.3390/molecules25143245
Naksang P, Tongchitpakdee S, Thumanu K, Oruna-Concha MJ, Niranjan K, Rachtanapun C. Assessment of Antimicrobial Activity, Mode of Action and Volatile Compounds of Etlingera pavieana Essential Oil. Molecules. 2020; 25(14):3245. https://doi.org/10.3390/molecules25143245
Chicago/Turabian StyleNaksang, Porawan, Sasitorn Tongchitpakdee, Kanjana Thumanu, Maria Jose Oruna-Concha, Keshavan Niranjan, and Chitsiri Rachtanapun. 2020. "Assessment of Antimicrobial Activity, Mode of Action and Volatile Compounds of Etlingera pavieana Essential Oil" Molecules 25, no. 14: 3245. https://doi.org/10.3390/molecules25143245