Article

Barbeya oleoides Leaves Extracts: In Vitro Carbohydrate Digestive Enzymes Inhibition and Phytochemical Characterization

by
Alaa A. Khojah
1,2,*,
Guillermo F. Padilla-González
3,
Ammar Bader
2,
Monique J. S. Simmonds
3,
Michael Munday
1 and
Michael Heinrich
1,*
1
UCL School of Pharmacy, University College London, London WC1N 1AX, UK
2
Department of Pharmacognosy, Faculty of Pharmacy, Umm Al-Qura University, Makkah 21955, Saudi Arabia
3
Royal Botanic Garden, Kew, Richmond, Surrey TW9 3AB, UK
*
Authors to whom correspondence should be addressed.
Molecules 2021, 26(20), 6229; https://doi.org/10.3390/molecules26206229
Submission received: 25 July 2021 / Revised: 6 October 2021 / Accepted: 12 October 2021 / Published: 15 October 2021

Abstract

:
This study investigated the in vitro inhibitory potential of different solvent extracts of leaves of Barbeya oleoides on key enzymes related to type 2 diabetes mellitus (α-glucosidase and α-amylase) in combination with an aggregation assay (using 0.01% Triton X-100 detergent) to assess the specificity of action. The methanol extract was the most active in inhibiting α-glucosidase and α-amylase, with IC50 values of 6.67 ± 0.30 and 25.62 ± 4.12 µg/mL, respectively. However, these activities were significantly attenuated in the presence of 0.01% Triton X-100. The chemical analysis of the methanol extract was conducted utilizing a dereplication approach combing LC-ESI-MS/MS and database searching. The chemical analysis detected 27 major peaks in the negative ion mode, and 24 phenolic compounds, predominantly tannins and flavonol glycosides derivatives, were tentatively identified. Our data indicate that the enzyme inhibitory activity was probably due to aggregation-based inhibition, perhaps linked to polyphenols.

1. Introduction

Type 2 diabetes mellitus (DM2) is a chronic disease characterized by insulin resistance and improper glucose metabolism, leading to hyperglycaemia. In 2017, it was estimated that over 6% of the global population were affected by DM2 [1]. Uncontrolled hyperglycaemia is associated with severe health complications, including cardiovascular disease, neuropathy, and retinopathy [2]. One of the current therapeutic approaches to treating DM2 is to control postprandial hyperglycaemia by inhibiting carbohydrate digestive enzymes. α-Amylase and α-glucosidase are major digestive enzymes responsible for the breakdown of oligosaccharides and disaccharides into monosaccharides [3]. Acarbose, miglitol, and voglibose are oral α-glucosidase inhibitors commonly prescribed for DM2 patients to delay intestinal absorption of sugar [4]. However, these are associated with undesirable gastrointestinal side effects such as diarrhoea and flatulence [5]. Several reviews described the digestive enzyme inhibitory effects of phytochemicals, including tannin, flavonoids, alkaloids, and terpenoids [6,7,8].
Screening of medicinal plants is one strategy to find lead compounds or extracts with potent digestive enzymes inhibiting properties that might counter the undesirable side effects of those in current use [9] and can be a basis for understanding the potential of herbal medicines. Several enzyme-based assays have been used as a starting point for identifying chemical leads. A core limitation is that non-specific effects of extracts or compounds have not been taken into account at an early stage of research [10,11]. For example, polyphenols are known to cause protein aggregation leading to false positives inhibition [12,13,14]. Aggregate-based inhibitors are sensitive to non-ionic detergents, which can disrupt the protein–aggregate interaction and reverse inhibition [15]. Therefore, a detergent-based assay is considered a practical and fast way to identify aggregation-based inhibition [13,14,16].
In this study, we investigated the α-glucosidase and α-amylase inhibitory activity of Barbeya oleoides Schweinf. (Barbeyaceae) (B. oleoides), a small tree commonly distributed in the mountainous region of Somalia, Ethiopia, Saudi Arabia, and Yemen [17]. B. oleoides was selected after a preliminary in vitro screening of α-glucosidase and α-amylase inhibitory potential of seven plants species native to Saudi Arabia (data not shown). B. oleoides leaves’ extracts exhibited the highest α-glucosidase and α-amylase inhibitory activities among all tested species. This medicinal plant was traditionally used to manage fever, oedema, infection, and some instances of inflammatory diseases [17].
The first phytochemical work on B. oleoides identified barbeyol, an indane-type phenolic compound [17]. In 2012, fifteen compounds were isolated and characterized from aerial parts of B. oleoides; these included uvaol, ursolic acid, arjunolic acid, corosolic acid, β-sitosterol-3-O-β-d-glucoside, isorhamnetin-4-O-glucoside, 3′-methoxyqurecetin-6″-O-α-l-rhamnopyranosyl(1–6)β-d-glucopyranoside, d-bornesitol, arjunglucoside I, catechins, and gallocatechins [18]. The later study also reported the antimicrobial activity and spasmolytic activity of B. oleoides extracts and a few of these isolated flavonoids and terpenoids.
The current study focused on the relationship between the chemical profile and enzymatic inhibitory potential (α-glucosidase and α-amylase activities) of B. oleoides extracts. Phytochemical profiling was undertaken on the most active extract by conducting a dereplication strategy that utilized ultrahigh-performance liquid chromatography coupled with an electron spray ionization and tandem spectrometry (UPLC-ESI-MS/MS) system. The promiscuous nature and aggregation tendencies were evaluated by conducting a detergent-sensitive enzyme inhibition assay.

2. Results and Discussion

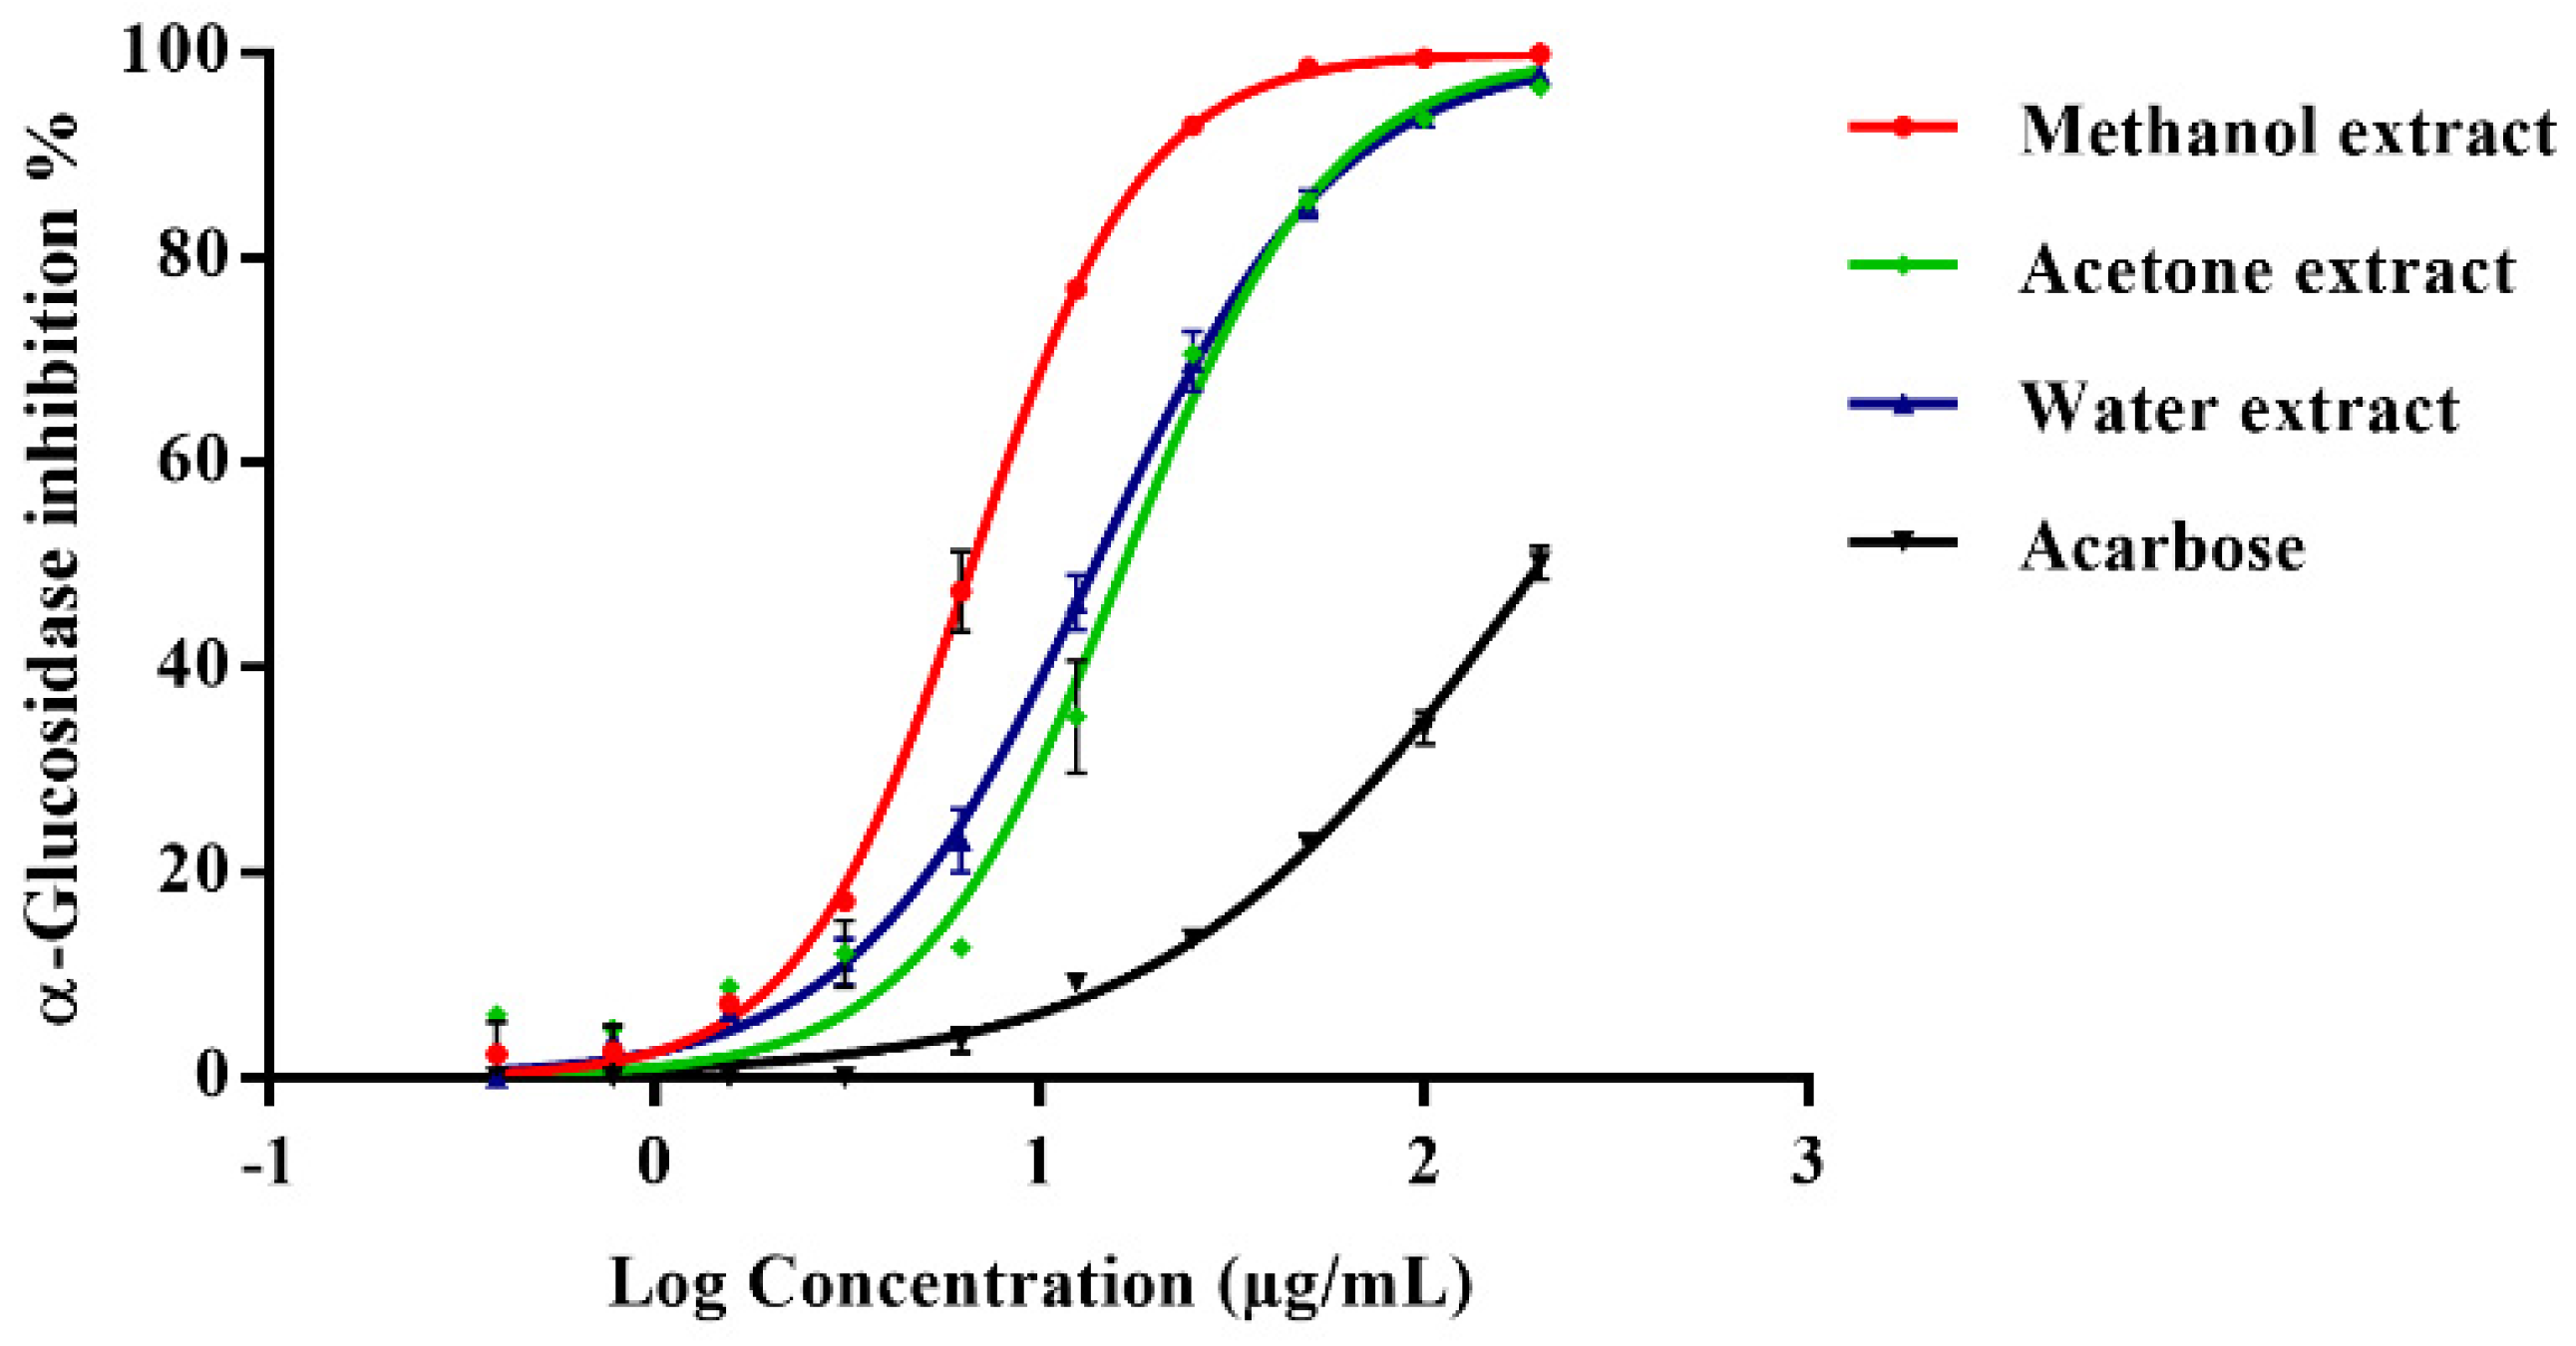
2.1. In Vitro Enzyme Inhibition

Six extracts of B. oleoides (200 μg/mL) of different polarity were assayed (positive control acarbose, 200 μg/mL) (Table 1). In a dose-dependent manner, the acetone, methanol, and water extracts exhibited the most potent α-glucosidase inhibition, with IC50 values lower than acarbose (Figure 1). The methanol extract demonstrated potent activity with the lowest IC50 value (6.67 ± 0.30 μg/mL) and was the only one to show inhibitory activity against α-amylase (Table 1).The α-amylase inhibition was in a dose-dependent manner and slightly less potent (IC50 25.62 ± 4.12 μg/mL) compared with acarbose (IC50 9.07 ± 0.96 μg/mL) (Figure S45).
The addition of 0.01% Triton X-100 detergent to α-glucosidase and α-amylase assay reduced the methanolic extract’s (200 μg/mL) inhibition to about half (47.11% ± 0.73) and one-sixth (14.33% ± 4.07), respectively (Figure 2). The addition of the detergent did not affect acarbose inhibitory activities against α-glucosidase and α-amylase (IC50 212.3 ± 7.84 μg/mL and IC50 6.87 ± 0.27 μg/mL, respectively).

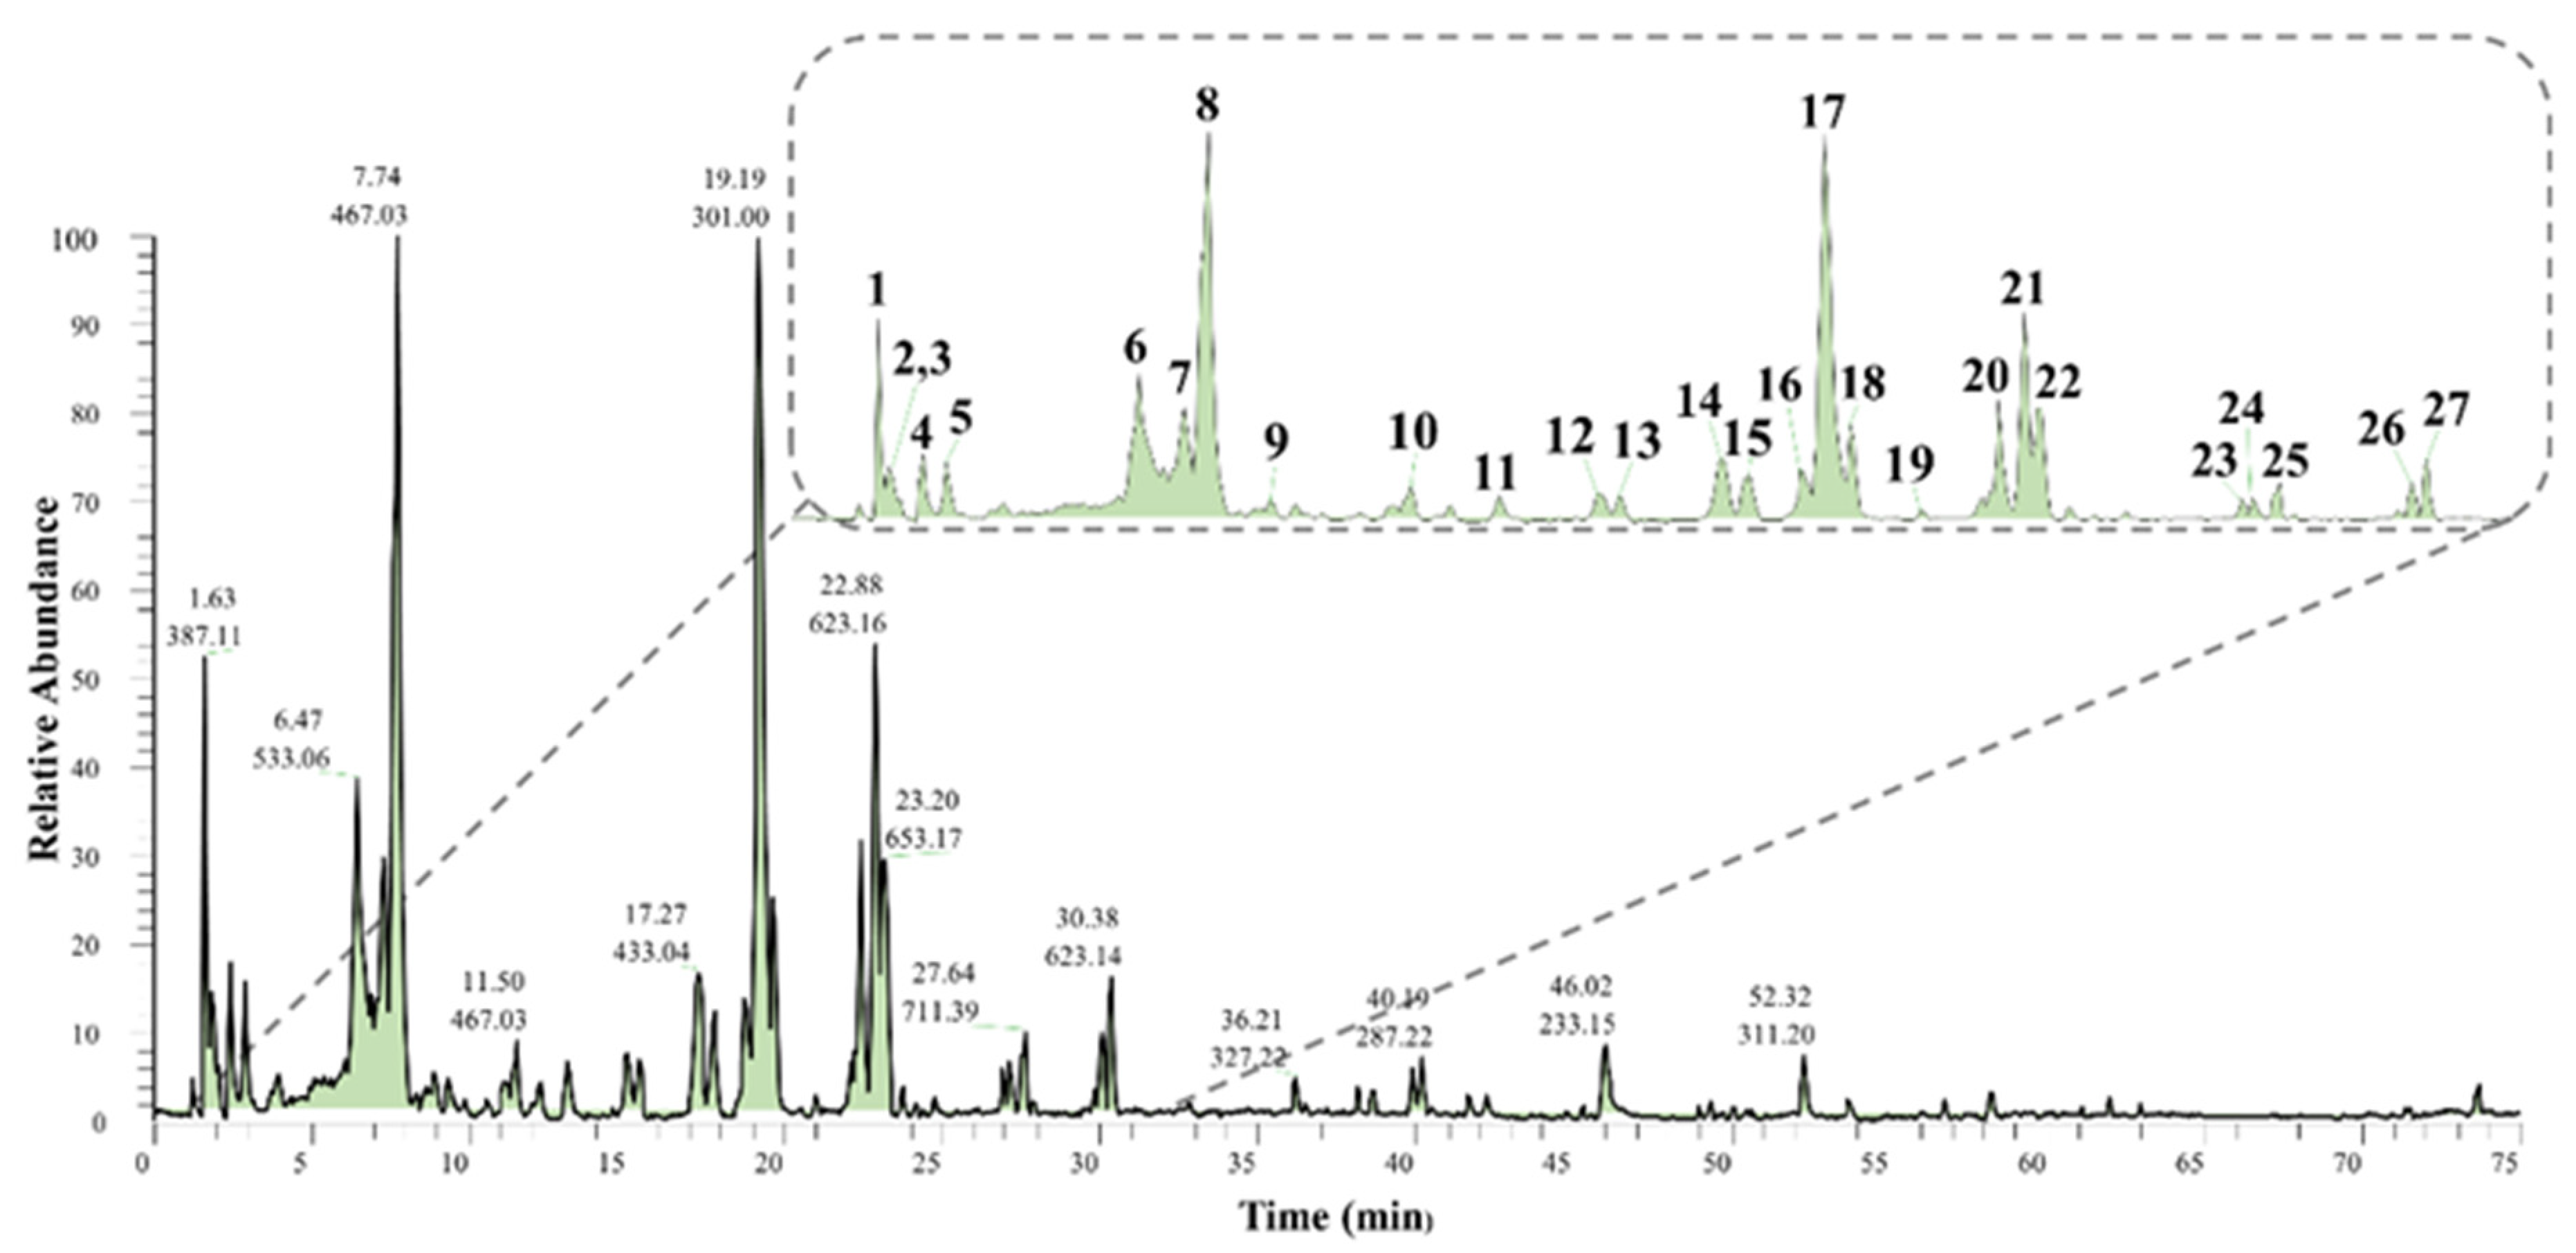
2.2. LC-ESI-MS/MS Profiling

Since the methanolic extract exhibited the highest inhibitory activity (Table 1), it was subjected to LC-ESI-MS/MS analysis in positive and negative ionization mode simultaneously by switching polarity in the same run. Data generated in the negative mode demonstrated a better ionization efficiency, and therefore, it was selected for the annotation of metabolites (Figure 3). Twenty-seven compounds were successfully separated and detected using LC-ESI-MS/MS. These compounds were tentatively identified through manual inspection of LC-MS data (retention time, accurate mass, elemental composition, and MSn fragments) and by comparison with published data and online databases (Table 2). Twenty-one compounds (15, 7, 8, 1019, 23, 24, 26, and 27) were identified putatively for the first time in B. oleoides, while three compounds (2022) had been previously isolated and identified [18]. Interestingly, most of the identified secondary metabolites belong to two main chemical classes: hydrolysable tannins and glycosylated flavonoids (Table 2). However, one disaccharide (1) and two unidentified compounds (9 and 25) were also detected.

2.2.1. Hydrolysable Tannins and Parent Molecules

Several hydrolysable tannins, which are characterized by gallic acid and ellagic acid units, were detected in methanol extracts of B. oleoides leaves. We identified five structurally related ellagitannins (2, 3, 7, 8, and 10, Figure 3, Table 2) showing a hexahydroxydiphenic acid (HHDP) molecule in their structures (Table 2). Compounds 2 and 3 were identified as two different isomers of HHDP-hexoside by interpretation of their fragmentation pattern and by MS2 comparisons with literature data. These compounds showed a deprotonated molecule [M − H] at 481.0618 and 481.0623 m/z, respectively. The MS2 spectra of both metabolites showed a base peak ion at 301 m/z, resulting from the neutral loss of a hexose unit (162 Da) and two water molecules to form ellagic acid, following the fragmentation mechanism suggested in Figure 4. The identity of the product ion at 301 m/z (ellagic acid) was further confirmed by spectral comparisons of its MS3 spectra with the data available in the Royal Botanic Garden’s library of MS2 data (Figure S4) and published literature [20,21,22]. Given the similarities in the parent ion, UV spectra, and fragmentation pattern to the other ellagitannins, compound 6 likely belongs to the same chemical class as compounds 2 and 3. This compound was detected as a deprotonated molecule [M − H] at 533.0562 m/z, showing an apparent in-source dimer at 1067.1179 m/z. However, detailed analysis of the isotopic pattern showed by the ions at 533 and 1067 m/z indicated that both ions represent double-charged molecules, suggesting that this compound represents a highly polymerized tannin with a molecular weight above 2000 Da. Therefore, as the molecular weight of this metabolite is outside the employed m/z range, it was not possible to suggest the identity of compound 6. Compound 7, on the other hand, was suggested as a galloyl-HHDP-hexoside based on the interpretation of its mass spectrometry data and literature search [25]. This compound showed a deprotonated molecule [M − H] at 633.0715 m/z. The MS2 spectra of this metabolite showed a base peak ion at 301 m/z and a minor fragment at 463 m/z, likely representing a deprotonated molecule of ellagic acid and ellagic acid linked to a hexose unit, respectively (Table 2). Further analysis of the MS3 spectra of the fragment ion at 301 m/z confirmed its identity as an ellagic acid derivative, given the presence of the diagnostic fragment ions at 257, 229, and 185 m/z [25].
Compounds 8 and 10 showed similar deprotonated molecules [M − H] at 935.0761 and 935.0757 m/z, respectively, suggesting their isomeric nature. These compounds were identified as two galloyl-bis-HHDP-hexoside isomers [22,25]. Both compounds exhibited a product ion at 633 m/z in their MS2 spectra, suggesting neutral loss of an ellagic acid molecule (Table 2). However, despite their isomeric nature, these compounds showed different MS3 spectra. While compound 10 showed a base peak ion at 301 m/z, likely representing a deprotonated molecule of ellagic acid, compound 8 was characterized by a base peak ion at 571 m/z. These differences in retention time and mass spectrometry data could be useful in identifying these isomers in future studies.
In addition to the ellagitannins described above, two isomers of gallic acid (4 and 5) showing distinct MS2 spectra were identified (Table 2), as well as three ellagic acid derivatives (14, 15, and 17, Table 2). Compounds 4 and 5 showed identical deprotonated molecules [M − H] at 169.0137 m/z. Both compounds yielded product ions at 151 and 125 m/z, formed by the neutral loss of a water molecule and a CO unit, respectively (Table 2). However, the stability of these ions differed among isomers. While compound 4 showed a base peak at 151 m/z, the base peak of compound 5 was the ion at 125 m/z. A literature search of such fragmentation pattern suggested that these compounds are likely isomers of gallic acid [23,24]. Among ellagic acids, compound 14 gave a deprotonated ion [M − H] at 433.0401 m/z that yielded a base peak ion at 301 m/z [M − H − 132], indicating the loss of a pentose unit. The MS3 spectrum of the 301 m/z ion was consistent with the characteristic fragment ions of ellagic acid (Table 2), thus suggesting that this compound is likely an ellagic acid pentoside [28]. Compound 15 showed similar MS2 and MS3 spectra to compound 14 (Table 2), but a different precursor ion at 447.0559 m/z, suggesting the presence of rhamnose instead of a pentose unit, i.e., an ellagic acid rhamnoside [28]. Compound 17 produced a deprotonated [M − H] at 300.9983 m/z with further fragments at 284, 257, 229, and 185 m/z, identical to those generated by ellagic acid [28,29].

2.2.2. Flavonoid Glycosides

In the methanolic extract of B. oleoides, glycosylated flavonols represent the chemical class with the highest diversity of identified metabolites. Thirteen flavonols were tentatively assigned based on mass spectrometry data and literature information. Seven myricetin derivatives were detected and represent the structurally most diverse group of flavonols (11–13, 18, 22, 24, and 26, Table 2), followed by quercetin derivatives (16, 20, 21, 23, and 27) and one kaempferol glycoside (19).
Among myricetin derivatives, we found three compounds (11, 12, and 13) containing a myricetin unit as a core molecule and four compounds with the core being a methoxylated myricetin derivative (18, 22, 24, and 26). Compounds 12 and 13 were identified as myricetin-O-rutinoside and myricetin-O-hexoside, respectively (Table 2). Compound 12 exhibited a deprotonated ion [M − H] at 625.1390 m/z, with two major fragment ions at 317 and 316 m/z, originating from the sequential loss of a rutinoside molecule and a hydrogen radical, respectively. Compound 13 displayed a deprotonated ion [M − H] at 479.0824 m/z that further fragmented to produce a base peak ion at 316 m/z, indicating a loss of a hexose [27]. Since both compounds showed similar MS3 spectra with product ions at 287, 271, 179, and 151 m/z, consistent with those of myricetin [34], these compounds were identified as myricetin glycosides. A similar fragmentation pattern was observed for compound 11, assigned as myricetin-galloyl-hexoside [27] with a deprotonated molecule [M − H] at 631.0913 m/z. The CID fragmentation of the parent molecule produced product ions at 479 m/z [M–152–H] and 317 m/z [M–152–162 –2H], indicating the losses of a galloyl (152 Da) and hexose units (162 Da). The product ion at 317 m/z further fragmented to produce ions at 287, 271, 179, and 151 m/z, consistent with the MS2 spectra of myricetin [34]. Therefore, compound 11 was suggested as myricetin-galloyl-hexoside [27].
Among the four methoxylated derivatives of myricetin, 18 and 24 were identified as two mono-methoxylated derivatives, while 22 and 26 were assigned as dimethoxylated molecules (Table 2). Compound 18 displayed a deprotonated molecule [M − H] at 639.1545 m/z, and a base peak ion at 331 m/z, along with less abundant peak at 316 m/z in its MS2. These fragments suggested the neutral losses of rutinose (308 Da) and CH3 group (15 Da), respectively. The MS3 spectra of the ion at 316 m/z showed a base peak at 287, which typifies myricetin along with other fragment ions at 271, 179, and 151 m/z [34]. Therefore, this compound 18 was suggested as methoxy myricetin-O-rutinoside. A similar fragmentation pattern was observed for compound 22 (Table 2); however, the presence of a parent ion [M − H] at 653.1700 m/z and two consecutive radical losses of 15 Da suggested a dimethoxylated version of compound 18. Therefore, compound 22 was putatively annotated as dimethoxy myricetin-O-rutinoside, previously described from B. oleoides [18]. A similar pattern was observed for compound 24 and compound 26 (Table 2). Compound 24 was tentatively assigned as methoxy myricetin-O-caffeoyl-rhamnoside. It showed a deprotonated molecule [M − H] at 639.1338 m/z and fragment ions at 493 and 331 m/z, formed after the neutral losses of a rhamnose and a caffeoyl units, respectively. The MS3 spectra of the ion at 331 m/z showed a base peak at 316 m/z, indicating the loss of CH3 group (15 Da). Compound 26 showed a similar fragmentation pattern as 24 (Table 2). However, two losses of methyl radical (15 Da) were observed in its MS2 spectra, suggesting di-methoxylated version of compound 24. Therefore, compound 26 was tentatively assigned as dimethoxy myricetin-O-caffeoyl-rhamnoside.
Among the quercetin derivatives, we found one quercetin glycoside (16), two mono-methoxylated quercetin glycosides (20 and 21), and two quercetin derivatives containing a caffeoyl ester in addition to the sugar moiety (23 and 27). Compound 16 yielded a deprotonated molecule [M − H] at 609.1437 m/z and a major fragment at 301 [M–308–H], indicating the neutral loss of a rutinoside unit. This product ion further fragmented to produce ions 271, 255, 179, and 151 m/z, consistent with the MS2 spectrum of quercetin [30]. Therefore, this compound was tentatively assigned as quercetin-O-rutinoside. A similar fragmentation pattern was found for compound 20 and compound 21. These compounds produced nearly identical deprotonated ions [M − H] at 623.1597 and 623.1592 m/z (error 0.8 ppm), respectively, as well as similar MS2 and MS3 spectra (Table 2). The presence of fragment ions at 315, 271, and 255 m/z (Table 2) allowed their structural assignment as isomers of methoxyquercetin-O-rutinoside, which was previously identified in B. oleoides [18]. Based on the interpretation of their fragmentation patterns, compound 23 and compound 27 were assigned as quercetin-O-caffeoyl-rhamnoside and methoxyquercetin-O-caffeoyl-rhamnoside, respectively (Table 2). Compound 23 showed a deprotonated molecule [M– H] at 609.1229 m/z, and fragment ions at 463 and 301 m/z (MS2) formed after the neutral loss of a rhamnoside and a caffeoyl unit, respectively. The MS3 spectra of the ion at 301 m/z was consistent with that of quercetin [30], thus allowing the tentative assignment of this peak as quercetin-O-caffeoyl-rhamnoside. Compound 27, on the other hand, showed a deprotonated molecule [M − H] at 623.1386 m/z. The MS2 spectra showed fragment ions at 315 and 300 m/z, indicating the loss of a methyl group (15 Da). The MS3 were found similar to those of compound 23; thus, compound 27 was assigned as a methoxylated version of compound 23.
Lastly, one kaempferol derivative (19) was detected. This compound showed a deprotonated molecule [M − H] at 593.1491 m/z and fragment ions at 327, 285, 255, and 227 m/z (Table 2). The presence of the base peak ion at 285 m/z, indicated the neutral loss of a rutinose unit. The MS3 spectra of this ion showed fragmentations similar to those of kaempferol [30]. Therefore, compound 19 was assigned as kaempferol-O-rutinoside [30,31,32].

2.2.3. Saccharides

Compound 1 was characterized as sucrose by MS2 comparisons with the spectra available in the Royal Botanic Gardens’ library of MS2 data (Figure S1). This compound was detected as a formate adduct [M + HCOO] at 387.1135 m/z. The MS2 spectra of the deprotonated molecule [M − H] at 341 m/z resulted in a base peak ion at 179 m/z, corresponding to the loss of a monosaccharide unit. The MS3 spectra of this ion showed a base peak ion at 143, 161, and 131 m/z (Table 2). The MS2 and MS3 spectra of this compound were found consistent with those of sucrose, previously reported by Schmidt, et al. [35].

2.2.4. Unidentified Compound

Compound 9 showed a peak at m/z 603.0678 [M − H] that generated product ions at 458 m/z in MS2 (Table 2). This was further fragmented in MS3 to yield product ions at m/z 573, 436, 427, 413, 382, 343, and 275 m/z. Compound 25 was presented as formate adduct [M + HCOO] at 711.3938. The MS2 spectra showed product ions at 655 and 503 m/z. No match was found between the given data and published literature. Therefore, compound 8 and compound 25 could not be identified.

2.3. General Discussion

The enzyme assays indicate that the methanol extracts, obtained from B. oleoides leaves, showed prominent inhibitory activity against α-glucosidase and α-amylase. However, based on the aggregation assay, these effects were found non-specific. This makes the development of novel drug leads implausible but points to the need to better understand the chemical profile of the extract, which could be used as herbal medical product.
The presented phenolic profile of B. oleoides methanolic extract, at least in part, explains the strong α-glucosidase and α-amylase inhibitory activity. The majority of the detected compounds were phenolics, specifically flavonols glycosides and hydrolysable tannins. Several studies reported potent α-glucosidase and α-amylase inhibitory activities of phenolic-rich extracts [3,36,37,38] and thus were regarded as a potential for modulating postprandial hyperglycaemia [39]. In previous work, tannins-rich extracts exhibited potent enzymatic inhibition on porcine pancreatic α-amylase [40,41]. Individual tannins, including corilagin (galloyl-HHDP-glucose) [35,42,43], along with ellagic acid [42,44,45] and gallic acid [46,47], were all found to be potent inhibitors of α-glucosidase. Furthermore, isolated flavonols including quercetin, myricetin [48,49], and kaempferol-3-O-rutinoside [50] revealed strong α-glucosidase inhibitory activities.
Polyphenols, including tannins and flavonoids, are known to aggregate with protein in aqueous buffers [12,16,42,51,52]. Despite such evidence that polyphenols form aggregates [15,53], many studies claim their therapeutic effects or drugability without considering their promiscuous potential [10]. Compounds exhibiting such inhibitory activity are known as promiscuous inhibitors [10] and their inhibitory behaviour is usually regarded as non-specific [11]. Therefore, identifying such undesirable hits at an early stage of drug discovery is of significant value before interpreting bioassay data.
Aggregate-based inhibition characterizes by its sensitivity to non-ionic detergent [51,54]. The percentage of enzyme inhibition by most aggregators reduces by at least 2-fold with the addition of 0.01% Triton X-100 [13,55,56]. Detergent-based assay was found to be a practical way of identifying aggregation-based inhibition [13,56] and was successfully implemented to determine the specificity of enzyme inhibition. Previous work has shown that the addition of 0.01% Triton X-100 resulted in a reduction in the inhibitory activity of quercetin against few unrelated enzymes such as lactate dehydrogenase (LDH) and chymotrypsin [51] as well as β-lactamase [56]. In 2020, Szabo, Hamori, and Gyemant [57] studied the effect of 0.01% of Triton X-100 on α-amylase inhibitory activity by gallotannin, extracted from the gull nut of Aleppo oak (from Quercus infectoria G.Olivier). The addition of the non-ion detergent resulted in the inhibitory activity reduction of gallotannin, with a 50-fold increase in the IC50 value.
To our knowledge, this is the first study to identify aggregation-based inhibition of α-glucosidase with the addition of 0.01% Triton-X100. We observed that aggregate formation in α-glucosidase assa could be controlled with the addition of 0.01% Triton X-100 without affecting assay performance. This additional step is recommended when using enzyme-based assays to identify specific bioactivity and eliminate any potential biases [51].
In the current work, the enzyme inhibitory activity of the methanol extract of leaves of B. oleoides was significantly attenuated with the addition of 0.01% non-ionic detergent. The LC-MS data profiling of this active extract revealed the presence of various polyphenols. Therefore, the inhibitory activity observed for B. oleoides methanol extract is likely to be aggregates-based and non-specific inhibition.

3. Materials and Methods

3.1. Chemical and Reagent

α-Glucosidase from Saccharomyces cerevisiae (EC 2.3.1.20), 4-nitrophenyl α-d-glucopyranoside (pNPG, ≥95%), acarbose ≥ 95%, porcine pancreatic α-amylase (EC 3.2.11), 3,5-dinitrosalicyclic acid (DNS), soluble starch from potato, potassium phosphate monobasic, potassium phosphate dibasic, and Triton X-100 were purchased from Sigma-Aldrich (St. Louis, MO, USA). All solvents were of analytical grade and were purchased from Thermo Fisher Scientific (Waltham, MA, USA).

3.2. Plant Material

Leaves of B. oleoides were collected from Baljarashi (AL-Baha, Saudi Arabia) in August 2017 and identified by A.B. Samples were air-dried, ground, and stored in the refrigerator at 2–4 °C at the University of Umm al-Qura (Makkah, Saudi Arabia). Samples were transported in airtight containers to University College London (London, UK), where a voucher specimen (No. UQU-UCL-22) was deposited in the school’s herbarium.

3.3. Preparation of Plant Extracts

Powdered plant material (1 g) was extracted by sonication, utilizing six solvents (10 mL) of increasing polarity (i.e., hexane, chloroform, ethyl acetate, acetone, methanol, and water) in consecutive steps. Plant extracts were shaken vigorously for 2 min and sonicated for 1 h using an ultrasonic water bath. Each extract was centrifuged at 4000 rpm for 40 min, and the supernatant was filtered through Whatman No.4 filter paper (Whatman, Cytiva, Marlborough, MA, USA). Filtered extracts were transferred into glass vials, and solvents were left to evaporate at room temperature. To prepare stocks of test samples, dried extracts were dissolved in DMSO at a 20 mg/mL concentration. Aqueous extracts were freeze-dried and dissolved in sodium phosphate buffer (20 mg/mL).

3.4. In Vitro Enzyme Inhibitory Assays

3.4.1. α-Glucosidase Assay

The α-glucosidase assay was performed using a slightly modified version of the method proposed by Yuan et al. [58]. A 50 μL aliquot of the test sample and 100 μL of yeast α-glucosidase (1 U/mL of α-glucosidase dissolved in 0.1 phosphate buffer, pH 6.9) were premixed and incubated in 96-well plates for 10 min at 25 °C. After pre-incubation, 50 uL of 0.1 phosphate buffer (pH 6.9) containing 5 mM p-nitrophenyl-α-d-glucopyranoside (pNPG) as the substrate was added to each well at a timed interval. The reaction mixture then was incubated at 25 °C for 5 min. Before and after the incubation, absorbance was measured at 405 nm using Tecan Infinite M200 Pro microplate reader (Tecan, Mannedorf, Switzerland) and Magellan software. The absorbance was compared with a control containing 50 μL of buffer solution instead of the extract. The reading of blank samples containing buffer in place of the enzyme was subtracted from each well. Acarbose (200 μg/mL) was used as the positive control. The percentage of α-glucosidase inhibition was calculated using the following formula:
%   Activity = ( Δ Abs   of   control Δ Abs   sample ) Δ Abs   of   control     ×   100

3.4.2. α-Amylase Assay

The α-amylase inhibitory activities of B. oleoides extracts were assayed based on a method described by Zaharudin et al. [59]. A 100 μL aliquot of the test sample was mixed with 100 μL of 0.02 M sodium phosphate buffer (pH 6.9 with 0.06 M NaCl) containing porcine pancreatic α-amylase (0.5 U/mL) at 20 °C. The mixture was incubated in a 2 mL Eppendorf tube for 10 min at 25 °C. After pre-incubation, 100 μL of 1% starch solution in 0.02 M sodium phosphate buffer was added to the mixture and incubated for 10 min at 25 °C. To terminate the reaction, 200 μL of 96 mM 3,5-dinitrosalicyclic acid colour reagent was added to the mixture. The mixture in the tube was then heated for 5 min in boiling water and cooled to room temperature. The reaction mixture was diluted with distilled water to a final volume of 2 mL. An amount of 200 μL of each mixture was transferred into 96-well microplates, and the absorbance was measured at 540 nm using a microplate reader and Magellan software. The absorbance was compared with a control containing 100 μL of buffer solution instead of the extract. The reading of blank samples that contained buffer in place of the enzyme was subtracted from each well. Acarbose (200 μg/mL) was used as a positive control. The results are expressed as percentage α-amylase inhibition activity and were calculated according to the Formula (1) above.

3.4.3. Half-Maximal Inhibitory Concentration (IC50) Determination

The IC50 values were calculated using the sample’s percentage of enzyme inhibitory activity tested over a range of concentrations (200 to 1.562 μg/mL).

3.4.4. Identification of Aggregate-Based Inhibition

B. oleoides methanol extracts (200 μg/mL) were tested for enzyme inhibition in the presence of non-ionic detergent. α-Glucosidase and α-amylase inhibitory assays were conducted as described, with the exception that a freshly prepared Triton X-100 was added to the buffer of sample stock solution (0.01% (v/v) total assay volume). Acarbose was used as negative control (non-aggregator).

3.4.5. Statistical Analysis

All experiments were performed in triplicate. Mean and standard deviation (SD) were calculated utilizing Microsoft Excel. The IC50 values were estimated by a nonlinear curve that was fitted using GraphPad Prism® program (Version 7.03).

3.5. LC-ESI-MS/MS Analysis of B. oleoides Methanol Extract

3.5.1. Sample Preparation

Methanol extracts of B. oleoides were dissolved in methanol (anhydrous solvent—synthesis grade) at concentrations of 50 mg/ mL and filtered through 0.22 μm pore size PTFE membrane. A volume of 1.5 mL of supernatant was transferred to 1.5 mL LC-MS amber vials (Thermo Fisher ScientificTM). A volume of 5 μL of the methanol extract was injected into the LC-ESI-MS/MS system. All solvents used were LC-MS grade (Fisher Scientific UK Ltd., Loughborough, UK).

3.5.2. Instrumentation and Analytical Condition

LC-MS was performed utilizing a Thermo Fisher Scientific system (Waltham, MA, USA) equipped with Xcalibur software). The LC consisted of a Vanquish UHPLC system equipped with a photodiode array detector (PDA) offering 100 Hz data rate. Analytes were separated on a Luna C18 column 150 mm × 3 mm, 3 μm (Phenomenex, Torrance, CA, USA) using 400 μL/min eluent gradient of 0:90:10 to 90:0:10 (methanol/water/acetonitrile + 1% formic acid) at 30 °C and over 1 h. UV detection was measured between 210 and 550 nm. The LC system was coupled with a high-resolution MS/MS Orbitrap Fusion Trihybrid mass spectrometer equipped with a heated electrospray (HESI) ionization source. Ionization was performed using a capillary temperature of 350 °C, a capillary voltage of 3.5 Kv (positive ionization mode), and −2.5 Kv (negative ionization modes). Total ion chromatograms (TIC) were acquired between 125 and 1800 m/z. MS/MS spectra were obtained using a collision energy of 35 eV CID and 60,000 FWHM resolution in the full scan mode. Nitrogen gas was used for drying, nebulization, and fragmentation. Four different scan levels were generated during the experiment, including full scan, MS2 of the most abundant peak in full scan, MS3 of the most intense peak in MS2, and MS3 of the second-most intense peak in MS2.

3.5.3. Data Analysis

Chromatograms were processed using Xcalibur™ 4.3 Software (Thermo Fisher Scientific), which allowed the observation of retention times, mass to charge ratios (m/z), and peaks of >1% intensity, as well as fragmentation patterns of parent peaks (MS2 and MS3 Spectrum). Peaks of ≥10% intensity were diagnosed in full scan mode (MS1), and fragment ions of ≥5% intensity were reported in MS2 and MS3. The obtained chromatograms of both negative and positive ionization modes were compared with those obtained by blank samples to exclude any peaks produced by external contaminants.

3.5.4. Metabolite Identification

The identification of metabolites was performed by comparisons of accurate mass values (<5 ppm accuracy) and MS2 spectral match with information available in the MS2 spectral library of Royal Botanic Gardens, Kew. This database, accessible through the NIST MS search 2.0 interface, contains more than 200,000 spectra of synthetic and natural products. Compounds not available in this database were identified by comparing their accurate mass and MS2 ions with those reported in published literature. Databases searching in the Dictionary of Natural Products (http://dnp.chemnetbase.com) and SciFinder Scholar (https://scifinder.cas.org) were also used to suggest some structural assignments.

Supplementary Materials

The following are available online.

Author Contributions

Conceptualization, A.A.K., M.H. and M.J.S.S.; methodology, A.A.K. and G.F.P.-G.; investigation, A.A.K. and G.F.P.-G.; resources, including plant material and authentication, A.B.; writing—original draft preparation, A.A.K.; writing—reviewing and editing, M.H., M.J.S.S., M.M. and G.F.P.-G.; supervision, M.H. and M.J.S.S. All authors have read and approved the manuscript.

Funding

The research conducted in this paper was part of a sponsored PhD project (Grant No. 541273), funded by the Saudi Arabia Ministry of Higher Education.

Institutional Review Board Statement

Not applicable.

Informed Consent Statement

Not applicable.

Data Availability Statement

The authors confirm that most of the data supporting the findings of this study are available within the article and its Supplementary Materials. Raw data are available from the corresponding author (A.A.K.) on request.

Acknowledgments

Sample preparation and biological experiments were conducted at UCL School of Pharmacy, while LC-MS/MS analysis was performed at the Jodrell Laboratory at the Royal Botanical Garden, Kew.

Conflicts of Interest

The authors declare no conflict of interest.

Sample Availability

Tested plant sample are available from the corresponding author (A.A.K.) on request.

References

  1. Khan, M.A.B.; Hashim, M.J.; King, J.K.; Govender, R.D.; Mustafa, H.; Al Kaabi, J. Epidemiology of type 2 diabetes—Global burden of disease and forecasted trends. J. Epidemiol. Glob. Health 2020, 10, 107–111. [Google Scholar] [CrossRef] [PubMed] [Green Version]
  2. Baron, A.D. Postprandial hyperglycaemia and α-glucosidase inhibitors. Diabetes Res. Clin. Pract. 1998, 40, 51–55. [Google Scholar] [CrossRef]
  3. Sachan, A.; Rao, C.; Sachan, N. In vitro studies on the inhibition of α-amylase and α-glucosidase by hydro-ethanolic extract of Pluchea lanceolata, Alhagi pseudalhagi, Caesalpinia bonduc. Pharmacogn. Res. 2019, 11, 310–314. [Google Scholar] [CrossRef]
  4. Lordan, S.; Smyth, T.J.; Soler-Vila, A.; Stanton, C.; Ross, R.P. The α-amylase and α-glucosidase inhibitory effects of Irish seaweed extracts. Food Chem. 2013, 141, 2170–2176. [Google Scholar] [CrossRef] [PubMed]
  5. Rosak, C.; Mertes, G. Critical evaluation of the role of acarbose in the treatment of diabetes: Patient considerations. Diabetes Metab. Syndr. Obes. 2012, 5, 357–367. [Google Scholar] [CrossRef] [Green Version]
  6. Kumar, A.S.; Kavimani, S.; Jayaveera, K.N. A review on medicinal plants with potential antidiabetic activity. Int. J. Phytopharm. 2011, 2, 53–60. [Google Scholar]
  7. Yin, Z.; Zhang, W.; Feng, F.; Zhang, Y.; Kang, W. α-Glucosidase inhibitors isolated from medicinal plants. Food Sci. Hum. Wellness 2014, 3, 136–174. [Google Scholar] [CrossRef] [Green Version]
  8. Sales, P.M.; Souza, P.M.; Simeoni, L.A.; Magalhaes, P.O.; Silveira, D. α-Amylase inhibitors: A review of raw material and isolated compounds from plant source. J. Pharm. Pharm. Sci. 2012, 15, 141–183. [Google Scholar] [CrossRef] [Green Version]
  9. Arulselvan, P.; Ghofar, H.A.A.; Karthivashan, G.; Halim, M.F.A.; Ghafar, M.S.A.; Fakurazi, S. Antidiabetic therapeutics from natural source: A systematic review. Biomed. Prev. Nutr. 2014, 4, 607–617. [Google Scholar] [CrossRef]
  10. Ryan, A.J.; Gray, N.M.; Lowe, P.N.; Chung, C.W. Effect of detergent on “promiscuous” inhibitors. J. Med. Chem. 2003, 46, 3448–3451. [Google Scholar] [CrossRef]
  11. McGovern, S.L.; Caselli, E.; Grigorieff, N.; Shoichet, B.K. A common mechanism underlying promiscuous inhibitors from virtual and high-throughput screening. J. Med. Chem. 2002, 45, 1712–1722. [Google Scholar] [CrossRef] [PubMed]
  12. Zhu, M.; David Phillipson, J.; Greengrass, P.M.; Bowery, N.E.; Cai, Y. Plant polyphenols: Biologically active compounds or non-selective binders to protein? Phytochem. Drug Discov. Today 1997, 44, 441–447. [Google Scholar] [CrossRef]
  13. Feng, B.Y.; Shoichet, B.K. A detergent-based assay for the detection of promiscuous inhibitors. Nat. Protoc. 2006, 1, 550–553. [Google Scholar] [CrossRef] [PubMed]
  14. Shoichet, B.K. Screening in a spirit haunted world. Drug Discov. Today 2006, 11, 607–615. [Google Scholar] [CrossRef] [Green Version]
  15. Feng, B.Y.; Simeonov, A.; Jadhav, A.; Babaoglu, K.; Inglese, J.; Shoichet, B.K.; Austin, C.P. A high-throughput screen for aggregation-based inhibition in a large compound library. J. Med. Chem. 2007, 50, 2385–2390. [Google Scholar] [CrossRef]
  16. McGovern, S.L.; Shoichet, B.K. Kinase inhibitors:  not just for kinases anymore. J. Med. Chem. 2003, 46, 1478–1483. [Google Scholar] [CrossRef]
  17. Ahmed, B.; Al-Rehaily, A.; Mossa, J. Barbeyol: A new phenolic indane type component from Barbeya oleoides. J. Biosci. 2002, 57, 17–20. [Google Scholar] [CrossRef]
  18. Al-Oqail, M.; Al-Rehaily, A.; Hassan, W.; Ibrahim, T.; Ahmad, S.; Ebada, S.; Proksch, P. New flavonol glycosides from Barbeya oleoides Schweinfurth. Food Chem. 2012, 132, 2081–2088. [Google Scholar] [CrossRef]
  19. Li, S.; Lin, Z.; Jiang, H.; Tong, L.; Wang, H.; Chen, S. Rapid identification and assignation of the active ingredients in fufang banbianlian injection using HPLC-DAD-ESI-IT-TOF-MS. J. Chromatogr. Sci. 2016, 54, 1225–1237. [Google Scholar] [CrossRef] [Green Version]
  20. Cudalbeanu, M.; Ghinea, I.O.; Furdui, B.; Dah-Nouvlessounon, D.; Raclea, R.; Costache, T.; Cucolea, I.E.; Urlan, F.; Dinica, R.M. Exploring new antioxidant and mineral compounds from wild-grown in danube delta biosphere. Molecules 2018, 23, 1247. [Google Scholar] [CrossRef] [Green Version]
  21. Yisimayili, Z.; Abdulla, R.; Tian, Q.; Wang, Y.; Chen, M.; Sun, Z.; Li, Z.; Liu, F.; Aisa, H.A.; Huang, C. A comprehensive study of pomegranate flowers polyphenols and metabolites in rat biological samples by high-performance liquid chromatography quadrupole time-of-flight mass spectrometry. J. Chromatogr. A 2019, 1604, 460472. [Google Scholar] [CrossRef] [PubMed]
  22. Da Silva, S.M.; Koehnlein, E.A.; Bracht, A.; Castoldi, R.; de Morais, G.R.; Baesso, M.L.; Peralta, R.A.; de Souza, C.G.M.; de Sa-Nakanishi, A.B.; Peralta, R.M. Inhibition of salivary and pancreatic α-amylases by a pinhao coat (Araucaria angustifolia) extract rich in condensed tannin. Food Res. Int. 2014, 56, 1–8. [Google Scholar] [CrossRef] [Green Version]
  23. Singh, A.; Bajpai, V.; Kumar, S.; Sharma, K.R.; Kumar, B. Profiling of gallic and ellagic acid derivatives in different plant parts of Terminalia arjuna by HPLC-ESI-QTOF-MS/MS. Nat. Prod. Commun. 2016, 11, 239–244. [Google Scholar] [CrossRef] [Green Version]
  24. Chernonosov, A.A.; Karpova, E.A.; Lyakh, E.M. Identification of phenolic compounds in Myricaria bracteata leaves by high-performance liquid chromatography with a diode array detector and liquid chromatography with tandem mass spectrometry. Rev. Bras. Farmacogn. 2017, 27, 576–579. [Google Scholar] [CrossRef]
  25. Zhu, M.; Dong, X.; Guo, M. Phenolic profiling of Duchesnea indica combining Macroporous Resin Chromatography (MRC) with HPLC-ESI-MS/MS and ESI-IT-MS. Molecules 2015, 20, 22463–22475. [Google Scholar] [CrossRef] [PubMed] [Green Version]
  26. Da Silva, N.A.; Rodrigues, E.; Mercadante, A.Z.; de Rosso, V.V. Phenolic compounds and carotenoids from four fruits native from the Brazilian Atlantic Forest. J. Agric. Food. Chem. 2014, 62, 5072–5084. [Google Scholar] [CrossRef] [PubMed]
  27. Saldanha, L.L.; Vilegas, W.; Dokkedal, A.L. Characterization of flavonoids and phenolic acids in Myrcia bella Cambess. using FIA-ESI-IT-MS(n) and HPLC-PAD-ESI-IT-MS combined with NMR. Molecules 2013, 18, 8402–8416. [Google Scholar] [CrossRef] [PubMed] [Green Version]
  28. Lee, J.H.; Johnson, J.V.; Talcott, S.T. Identification of ellagic acid conjugates and other polyphenolics in muscadine grapes by HPLC-ESI-MS. J. Agric. Food. Chem. 2005, 53, 6003–6010. [Google Scholar] [CrossRef] [PubMed]
  29. Paudel, L.; Wyzgoski, F.J.; Scheerens, J.C.; Chanon, A.M.; Reese, R.N.; Smiljanic, D.; Wesdemiotis, C.; Blakeslee, J.J.; Riedl, K.M.; Rinaldi, P.L. Nonanthocyanin secondary metabolites of black raspberry (Rubus occidentalis L.) fruits: Identification by HPLC-DAD, NMR, HPLC-ESI-MS, and ESI-MS/MS analyses. J. Agric. Food. Chem. 2013, 61, 12032–12043. [Google Scholar] [CrossRef] [PubMed]
  30. Li, Z.H.; Guo, H.; Xu, W.B.; Ge, J.; Li, X.; Alimu, M.; He, D.J. Rapid identification of flavonoid constituents directly from PTP1B inhibitive extract of raspberry (Rubus idaeus L.) leaves by HPLC–ESI–QTOF–MS-MS. J. Chromatogr. Sci. 2016, 54, 805–810. [Google Scholar] [CrossRef] [Green Version]
  31. Chen, Y.; Yu, H.; Wu, H.; Pan, Y.; Wang, K.; Jin, Y.; Zhang, C. Characterization and quantification by LC-MS/MS of the chemical components of the heating products of the flavonoids extract in pollen typhae for transformation rule exploration. Molecules 2015, 20, 18352–18366. [Google Scholar] [CrossRef] [Green Version]
  32. Zhang, Y.; Shi, P.; Qu, H.; Cheng, Y. Characterization of phenolic compounds in Erigeron breviscapus by liquid chromatography coupled to electrospray ionization mass spectrometry. Rapid Commun. Mass Spectrom. 2007, 21, 2971–2984. [Google Scholar] [CrossRef]
  33. Brito, A.; Ramirez, J.E.; Areche, C.; Sepúlveda, B.; Simirgiotis, M.J. HPLC-UV-MS profiles of phenolic compounds and antioxidant activity of fruits from three citrus species consumed in Northern Chile. Molecules 2014, 19, 17400–17421. [Google Scholar] [CrossRef]
  34. Hofmann, T.; Nebehaj, E.; Albert, L. Antioxidant properties and detailed polyphenol profiling of European hornbeam (Carpinus betulus L.) leaves by multiple antioxidant capacity assays and high-performance liquid chromatography/multistage electrospray mass spectrometry. Ind. Crops Prod. 2016, 87, 340–349. [Google Scholar] [CrossRef] [Green Version]
  35. Schmidt, J.S.; Nyberg, N.T.; Staerk, D. Assessment of constituents in Allium by multivariate data analysis, high-resolution α-glucosidase inhibition assay and HPLC-SPE-NMR. Food Chem. 2014, 161, 192–198. [Google Scholar] [CrossRef] [PubMed]
  36. Olaokun, O.O.; McGaw, L.J.; Eloff, J.N.; Naidoo, V. Evaluation of the inhibition of carbohydrate hydrolysing enzymes, antioxidant activity and polyphenolic content of extracts of ten African Ficus species (Moraceae) used traditionally to treat diabetes. BMC Complement. Altern. Med. 2013, 13, 94. [Google Scholar] [CrossRef] [PubMed] [Green Version]
  37. Figueiredo-Gonzalez, M.; Reboredo-Rodriguez, P.; Gonzalez-Barreiro, C.; Carrasco-Pancorbo, A.; Cancho-Grande, B.; Simal-Gandara, J. The involvement of phenolic-rich extracts from Galician autochthonous extra-virgin olive oils against the α-glucosidase and α-amylase inhibition. Food Res. Int. 2019, 116, 447–454. [Google Scholar] [CrossRef]
  38. Oboh, G.; Akinyemi, A.; Ademiluyi, A. Inhibition of α-amylase and α-glucosidase activities by ethanolic extract of Telfairia occidentalis (fluted pumpkin) leaf. Asian Pac. J. Trop. Biomed. 2012, 2, 733–738. [Google Scholar] [CrossRef] [Green Version]
  39. McDougall, G.J.; Kulkarni, N.N.; Stewart, D. Current developments on the inhibitory effects of berry polyphenols on digestive enzymes. BioFactors 2008, 34, 73–80. [Google Scholar] [CrossRef]
  40. McDougall, G.J.; Stewart, D. The inhibitory effects of berry polyphenols on digestive enzymes. BioFactors 2005, 23, 189–195. [Google Scholar] [CrossRef]
  41. Camila Gabriel, K.; de Almeida Gonçalves, G.; Rosely Aparecida, P.; Flavio Augusto Vicente, S.; de Sá-Nakanishi , A.B.; Livia, B.; Jurandir Fernando, C.; Adelar, B.; Rosane Marina, P. Inhibition of α-amylases by condensed and hydrolysable tannins: Focus on kinetics and hypoglycemic actions. Enzym. Res. 2017, 3, 5724902. [Google Scholar] [CrossRef] [Green Version]
  42. Li, D.Q.; Zhao, J.; Xie, J.; Li, S.P. A novel sample preparation and on-line HPLC–DAD–MS/MS–BCD analysis for rapid screening and characterization of specific enzyme inhibitors in herbal extracts: Case study of α-glucosidase. J. Pharm. Biomed. Anal. 2014, 88, 130–135. [Google Scholar] [CrossRef] [PubMed]
  43. Trinh, B.T.; Staerk, D.; Jäger, A.K. Screening for potential α-glucosidase and α-amylase inhibitory constituents from selected Vietnamese plants used to treat type 2 diabetes. J. Ethnopharmacol. 2016, 186, 189–195. [Google Scholar] [CrossRef] [PubMed]
  44. Najari Beidokhti, M.; Andersen, M.V.; Eid, H.M.; Sanchez Villavicencio, M.L.; Staerk, D.; Haddad, P.S.; Jager, A.K. Investigation of antidiabetic potential of Phyllanthus niruri L. using assays for α-glucosidase, muscle glucose transport, liver glucose production, and adipogenesis. Biochem. Biophys. Res. Commun. 2017, 493, 869–874. [Google Scholar] [CrossRef] [PubMed]
  45. You, Q.; Chen, F.; Wang, X.; Jiang, Y.; Lin, S. Anti-diabetic activities of phenolic compounds in muscadine against alpha-glucosidase and pancreatic lipase. Food Sci. Technol. 2012, 46, 164–168. [Google Scholar] [CrossRef]
  46. Zhao, J.; Zhou, X.W.; Chen, X.B.; Wang, Q.X. α-Glucosidase inhibitory constituents from Toona sinensis. Chem. Nat. Compd. 2009, 45, 244–246. [Google Scholar] [CrossRef]
  47. Wansi, J.D.; Lallemand, M.C.; Chiozem, D.D.; Toze, F.A.A.; Mbaze, L.M.A.; Naharkhan, S.; Iqbal, M.C.; Tillequin, F.; Wandji, J.; Fomum, Z.T. α-Glucosidase inhibitory constituents from stem bark of Terminalia superba (Combretaceae). Phytochemistry 2007, 68, 2096–2100. [Google Scholar] [CrossRef] [PubMed]
  48. Meng, Y.; Su, A.; Yuan, S.; Zhao, H.; Tan, S.; Hu, C.; Deng, H.; Guo, Y. Evaluation of total flavonoids, myricetin, and quercetin from Hovenia dulcis Thunb. as inhibitors of α-amylase and α-glucosidase. Plant. Foods Hum. Nutr. 2016, 71, 444–449. [Google Scholar] [CrossRef]
  49. Moradi-Afrapoli, F.; Asghari, B.; Saeidnia, S.; Ajani, Y.; Mirjani, M.; Malmir, M.; Bazaz, R.D.; Hadjiakhoondi, A.; Salehi, P.; Hamburger, M.; et al. In vitro α-glucosidase inhibitory activity of phenolic constituents from aerial parts of Polygonum hyrcanicum. Daru 2012, 20, 37. [Google Scholar] [CrossRef] [Green Version]
  50. Hong, H.C.; Li, S.L.; Zhang, X.Q.; Ye, W.C.; Zhang, Q.W. Flavonoids with α-glucosidase inhibitory activities and their contents in the leaves of Morus atropurpurea. Chin. Med. 2013, 8, 19. [Google Scholar] [CrossRef] [Green Version]
  51. Pohjala, L.; Tammela, P. Aggregating behavior of phenolic compounds-a source of false bioassay results? Molecules 2012, 17, 10774–10790. [Google Scholar] [CrossRef] [Green Version]
  52. Ali, H.; Houghton, P.; Soumyanath, A. α-Amylase inhibitory activity of some Malaysian plants used to treat diabetes; with particular reference to Phyllanthus amarus. J. Ethnopharmacol. 2006, 107, 449–455. [Google Scholar] [CrossRef] [PubMed]
  53. Shoichet, B.K. Interpreting steep dose-response curves in early inhibitor discovery. J. Med. Chem. 2006, 49, 7274–7277. [Google Scholar] [CrossRef] [PubMed]
  54. Irwin, J.J.; Duan, D.; Torosyan, H.; Doak, A.K.; Ziebart, K.T.; Sterling, T.; Tumanian, G.; Shoichet, B.K. An aggregation advisor for ligand discovery. J. Med. Chem. 2015, 58, 7076–7087. [Google Scholar] [CrossRef] [PubMed] [Green Version]
  55. Feng, B.Y.; Shelat, A.; Doman, T.N.; Guy, R.K.; Shoichet, B.K. High-throughput assays for promiscuous inhibitors. Nat. Chem. Biol. 2005, 1, 146–148. [Google Scholar] [CrossRef]
  56. McGovern, S.L.; Helfand, B.T.; Feng, B.; Shoichet, B.K. A specific mechanism of nonspecific inhibition. J. Med. Chem. 2003, 46, 4265–4272. [Google Scholar] [CrossRef]
  57. Szabo, K.; Hamori, C.; Gyemant, G. Gallotannins are non-specific inhibitors of α-amylase: Aggregates are the active species taking part in inhibition. Chem. Biol. Drug Des. 2021, 97, 349–357. [Google Scholar] [CrossRef] [PubMed]
  58. Yuan, T.; Wan, C.; Liu, K.; Seeram, N.P. New maplexins F-I and phenolic glycosides from red maple (Acer rubrum) bark. Tetrahedron 2012, 68, 959–964. [Google Scholar] [CrossRef]
  59. Zaharudin, N.; Salmean, A.A.; Dragsted, L.O. Inhibitory effects of edible seaweeds, polyphenolics and alginates on the activities of porcine pancreatic α-amylase. Food Chem. 2018, 245, 1196–1203. [Google Scholar] [CrossRef]
Figure 1. Dose-dependent α-glucosidase inhibition of B. oleoides leaves extracts and acarbose (200 μg/mL). Results are shown as mean and SD of three experiments (n = 3).
Molecules 26 06229 g001
Figure 2. Effect of 0.01% Triton X-100 detergent upon the inhibition of α-glucosidase (A) and α-amylase (B) by methanol extracts of B. oleoides and acarbose (200 µg/mL). The results represent mean and SD of three replicates.
Molecules 26 06229 g002
Figure 3. Base peak ion chromatogram in the negative mode of the methanol extract obtained from the leaves of B. oleoides.
Molecules 26 06229 g003
Figure 4. Proposed fragmentation mechanism of HHDP-hexoside to form ellagic acid.
Molecules 26 06229 g004
Table 1. The percentage of enzymes inhibition at 200 μg/mL and IC50 values of crude extracts of B. oleoides leaves. Acarbose was used as a positive control (200 µg/mL). Data are represented as mean ± SD of triplicate experiments.
Extracts
(200 µg/mL)
α-Glucosidase Assayα-Amylase Assay
% InhibitionIC50 (µg/mL)% InhibitionIC50 (µg/mL)
Hexane11.67 ± 7.81-NA-
Chloroform50.30 ± 1.64-NA-
Ethyl acetate50.89 ± 7.34-NA-
Acetone96.65 ± 0.2616.61 ± 2.33NA-
Methanol99.73 ± 0.306.67 ± 0.3083.84 ± 5.7925.62 ± 4.12
Water98.12 ± 0.4613.99 ± 1.34NA-
Acarbose50.17 ± 1.58214.3 ± 6.2393.22 ± 2.139.07 ± 0.96
NA, no activity.
Table 2. Detailed mass spectrometry information used for the annotation of metabolites in the methanolic leaves extract of B. oleoides.
Com.
No
RT
(min)
UV Max
(nm)
Tentative IdentificationMolecular FormulaObserved
(m/z)
Theoretical
(m/z)
Error
(ppm)
Fragment Ions-MSn (m/z)Source/Reference
11.63259SucroseC12H22O11[M + FA] 387.1135,
[M − H] 341.1078
[M − H]
341.1089
−3.22MS2(341): 179 bp, 161, 143, 131, 119, 113, 101
MS3(179): 161, 149, 143 bp, 131, 119, 113, 101, 89, 71
[19], Kew library
21.82260HHDP-hexoside (isomer 1)C20H18O14[M − H]
481.0618
[M − H]
481.0623
−1.04MS2(481): 321, 301 bp, 300, 275
MS3(301): 284, 257 bp, 229, 201, 185
[20,21,22]
32.39262HHDP-hexoside (isomer 2)C20H18O14[M − H]
481.0623
[M − H]
481.0623
0MS2(481): 301 bp, 275
MS3(301): 284, 257 bp, 229, 201, 185
[20,21,22]
42.46270Gallic acid (isomer 1)C7H6O5[M − H]
169.0137
[M − H]
169.0142
−2.96MS2(169): 151 bp, 125
MS3(151): 123, 95 bp
[23,24]
52.9270Gallic acid (isomer 2)C7H6O5[M − H]
169.0137
[M − H]
169.0142
−2.96MS2(169): 125 bp, 151
MS3(151): 97, 81 bp
[23,24]
66.47272Unknown tannin>2000[M–2H]2−
1067.1188
>2000-MS2(1067): 377, 885, 933, 977, 1005, 1023 bp
MS3(1023): 377, 533, 631, 703, 721, 859, 885, 903 bp, 933, 1005.
-
77.31272Galloyl-HHDP-hexosideC27H22O18[M − H]
633.0715
[M − H]
633.0733
−2.84MS2(633): 463, 301 bp
MS3(301): 284, 257 bp, 229, 201,185
[25]
87.74273Galloyl-bis-HHDP-hexoside (isomer 1)C41H28O26[M − H]
935.0761
[M − H]
935.0796
−3.74MS2(935): 917, 873, 783, 659, 633 bp, 615, 589, 571
MS3(633): 615, 589, 571 bp, 553, 481, 437, 419, 401, 383, 365, 329, 317, 299, 275
[25,26]
98.9271n.i-[M − H]
603.0678
--MS2(603): 458 bp
MS3(458): 573, 436 bp, 427, 413, 382, 343, 275.
-
1011.5275Galloyl-bis-HHDP-hexoside (isomer 2)C41H28O26[M − H]
935.0757
[M − H]
935.0796
−4.17MS2(935): 917, 783, 633 bp, 615, 301
MS3(633): 615, 481, 463, 301 bp
[25,26]
1113.14266Myricetin-galloyl-hexosideC28H24O17[M − H]
631.0913
[M − H]
631.0941
−4.43MS2(631): 479 bp, 317
MS3(317): 287, 271, 179, 151
[27]
1215.03354, 266Myricetin-O-rutinosideC27H30O17[M − H]
625.1390
[M − H]
625.1410
−3.20MS2(625): 317, 316 bp, 287, 271
MS3(316): 287, 271, 179, 151
Fragmentation pattern
1315.37353, 264Myricetin-O-hexosideC21H20O13[M − H]
479.0824
[M − H]
479.0831
−1.46MS2(479): 317, 316 bp
MS3(316): 287 bp, 271, 179, 151
[27]
1417.27361Ellagic acid-O-pentosideC19H14O12[M − H]
433.0401
[M − H]
433.0413
−2.77MS2(433): 301 bp, 300
MS3(301): 284, 257 bp, 244, 229, 201, 185
[28,29], Kew library
1517.78361Ellagic acid-O-rhamnosideC20H16O12[M − H]
447.0559
[M − H]
447.0569
−2.24MS2(447): 301 bp, 300
MS3(301): 284, 271,
257 bp, 244, 229, 201, 185
[28,29], Kew library
1618.74355Quercetin-O-rutinosideC27H30O16[M − H]
609.1437
[M − H]
609.1461
−3.94MS2(609): 301 bp, 300, 271, 255
MS3(301): 271, 255, 179 bp, 151
[30]
1719.19367Ellagic acidC14H6O8[M − H]
300.9984
[M − H]
300.9990
−1.99MS2(301): 284, 257 bp, 244, 229, 201, 185[28,29], Kew library
1819.66359Methoxymyricetin-O-rutinosideC28H32O17[M − H]
639.1545
[M − H]
639.1567
−3.44MS2(639): 607, 331 bp, 316, 315, 287, 271
MS3(316): 287 bp, 271, 259, 243, 178, 151
Fragmentation pattern
1920.96348Kaempferol-O-rutinosideC27H30O15[M − H]
593.1491
[M − H]
593.1512
−3.54MS2(593): 327, 285 bp, 255, 227
MS3(285): 267, 257, 255 bp, 241, 229, 227, 213, 197, 151
[30,31,32]
2022.48355Methoxyquercetin-O-rutinoside (isomer 1)C28H32O16[M − H]
623.1597
[M − H]
623.1618
−3.37MS2(623): 357, 315 bp, 300, 271
MS3(315): 300 bp, 299
MS3(300): 271 bp, 255
[18,30,33]
2122.88355Methoxyquercetin-O-rutinoside (isomer 2)C28H32O16[M − H]
623.1592
[M − H]
623.1618
−4.17MS2(623): 357, 315 bp, 300, 271
MS3(315): 300 bp, 299
MS3(300): 271 bp, 255
[18,30,33]
2223.20359Dimethoxymyricetin-O-rutinosideC29H34O17[M − H]
653.1700
[M − H]
653.1723
−3.52MS2(653): 345 bp, 330, 315, 287
MS3(345): 330 bp, 315
MS3(315): 287 bp, 271, 259, 243
[18]
2326.92311, 265Quercetin-O-caffeoyl-rhamnosideC30H26O14[M − H]
609.1229
[M − H]
609.1250
−3.45MS2(609): 463 bp, 301
MS3(301): 271 bp, 255, 179, 151
Fragmentation Pattern
2427.11311, 267Methoxymyricetin-O-caffeoyl-rhamnosideC31H28O15[M − H]
639.1338
[M − H]
639.1355
−2.66MS2(639): 493 bp, 331
MS3(331): 316 bp, 315, 179, 151
Fragmentation Pattern
2527.64281, 265n.i.-[M + FA]
711.3938,
[M − H]
665.3620
--MS2(711): 665, 503 bp
MS3(503): 505, 485, 453, 441 bp, 421, 409, 403
-
2630.08311, 266Dimethoxymyricetin-O-caffeoyl-rhamnosideC32H30O15[M − H]
653.1491
[M − H]
653.1512
−3.32MS2(653): 345 bp, 330, 315, 287
MS3(345): 330 bp, 315
MS3(315): 287 bp, 271, 259, 243
Fragmentation Pattern
2730.38315, 265Methoxyquercetin-O-caffeoyl-rhamnosideC31H28O14[M − H]
623.1386
[M − H]
623.1406
−3.21MS2(623): 315 bp, 300
MS3(300): 271 bp, 255, 227, 151
Fragmentation Pattern
RT, retention time; FA, formic acid; bp, base peak.
Publisher’s Note: MDPI stays neutral with regard to jurisdictional claims in published maps and institutional affiliations.

