Article

Complete Chloroplast Genomes and Comparative Analysis of Sequences Evolution among Seven Aristolochia (Aristolochiaceae) Medicinal Species

1
Shanghai Chenshan Plant Science Research Center, Chinese Academy of Sciences, Shanghai Chenshan Botanical Garden, Shanghai 201602, China
2
Shanghai Center for Plant Stress Biology, Chinese Academy of Sciences, Shanghai 201602, China
3
University of Chinese Academy of Sciences, Shanghai 201602, China
4
College of Life Sciences, Xinyang Normal University, Xinyang 464000, Henan, China
5
School of Life Sciences, East China Normal University, Shanghai 200241, China
*
Author to whom correspondence should be addressed.
Int. J. Mol. Sci. 2019, 20(5), 1045; https://doi.org/10.3390/ijms20051045
Submission received: 18 January 2019 / Revised: 14 February 2019 / Accepted: 21 February 2019 / Published: 28 February 2019
(This article belongs to the Special Issue Plant Genomics 2019)

Abstract

:
Aristolochiaceae, comprising about 600 species, is a unique plant family containing aristolochic acids (AAs). In this study, we sequenced seven species of Aristolochia, and retrieved eleven chloroplast (cp) genomes published for comparative genomics analysis and phylogenetic constructions. The results show that the cp genomes had a typical quadripartite structure with conserved genome arrangement and moderate divergence. The cp genomes range from 159,308 bp to 160,520 bp in length and have a similar GC content of 38.5%–38.9%. A total number of 113 genes were identified, including 79 protein-coding genes, 30 tRNAs and four rRNAs. Although genomic structure and size were highly conserved, the IR-SC boundary regions were variable between these seven cp genomes. The trnH-GUG genes, are one of major differences between the plastomes of the two subgenera Siphisia and Aristolochia. We analyzed the features of nucleotide substitutions, distribution of repeat sequences and simple sequences repeats (SSRs), positive selections in the cp genomes, and identified 16 hotspot regions for genomes divergence that could be utilized as potential markers for phylogeny reconstruction. Phylogenetic relationships of the family Aristolochiaceae inferred from the 18 cp genome sequences were consistent and robust, using maximum parsimony (MP), maximum likelihood (ML), and Bayesian analysis (BI) methods.

1. Introduction

Aristolochia sensu lato, comprising about 500 species, is the largest genus of Aristolochiaceae, with a broad distribution range from tropical to subtropical, extending to temperate regions [1,2]. Several species of Aristolochia, such as Aristolochia moupinensis, Aristolochia tagala, and Aristolochia mollissima, have been reported as traditional Chinese medicines [3,4]. Aristolochiaceae is a unique plant family containing aristolochic acids (AAs), and their derivatives are widely implicated in liver cancers [5,6]. However, current studies have demonstrated that AAs are of nephrotoxicity, carcinogenicity, and mutagenicity [7,8]. The sale and use of AA-containing herbal preparations have been restricted in many countries [9].
The monophyly of Aristolochiaceae was well supported in most analysis, and was divided into two subfamilies, Asaroideae and Aristolochioideae [10,11]. The studies recognized two genera Saruma and Asarum in Asaroideae [10,11,12,13]. The genus Aristolochia of subfamily Aristolochioideae was classified into two major lineages, as indicated by previous studies based on morphological characters and molecular phylogenetic methods [10,14,15,16]. In the past years, the nuclear ITS2, phyA gene, and several plastid genome regions (such as matk, rbcL, trnK, and trnL-trnF) or their combinations have been frequently used in molecular systematics of Aristolochiaceae [11,15,17,18]. The inter-simple sequence repeat (ISSR) markers were also used to identify diverse genetic stocks and understand the evolutionary relationships of Aristolochia [19,20]. The selected loci failed to provide sufficient phylogenetic information to elucidate the evolutionary relationships among Aristolochia species. A universal barcode either using whole chloroplast (cp) genomes or hyper-variable regions are urgently needed, which may significantly improve the low resolution in plant relationships and contribute to the conservation, domestication, and utilization of Aristolochia plants.
The chloroplast is the key organelle for photosynthesis and carbon fixation in green plants [21]. Their genomes could provide valuable information for taxonomic classification and phylogenetic reconstruction among species of land plants [22,23,24,25]. Typical cp genomes in angiosperms have a generally conserved quadripartite circular structure with two copies of inverted repeat (IR) regions that are separated by a large single copy (LSC) region and a small single copy (SSC) region, and encode 120–135 genes with sizes in the range of 120–170 kb [26,27]. In recent years, the cp genomes of Aristolochia debilis, Aristolochia contorta, Saruma henryi, and nine species of Asarum within the Aristolochiaceae family have been reported [28,29,30,31]. Those sequenced cp genomes of Aristolochiaceae, except for those of Asarum species, were conserved in length, gene and GC content, from which no rearrangement event had been detected.
With the rapid development of next-generation sequencing (NGS), it is now more convenient and cheaper to obtain cp genome sequences, feasible to compare analysis of sequences evolution among different individuals. In this study, we reported seven complete cp genomes of Aristolochia and conducted comparative genomic analyses, focused on gene size, content, patterns of nucleotide substitutions, and variable sites. Another 12 published cp genome sequences of Magnoliids downloaded from the National Center for Biotechnology Information (NCBI) organelle genome database (https://www.ncbi.nlm.nih.gov) [32] were also used to detect selective sites, repeat sequences, simple sequence repeats (SSRs), and phylogenetic constructions. We performed these comparative genomes analysis to obtain comprehensive understanding the structure of plastomes within Aristolochia and to provide genetic resources for future research in the genus.

2. Results

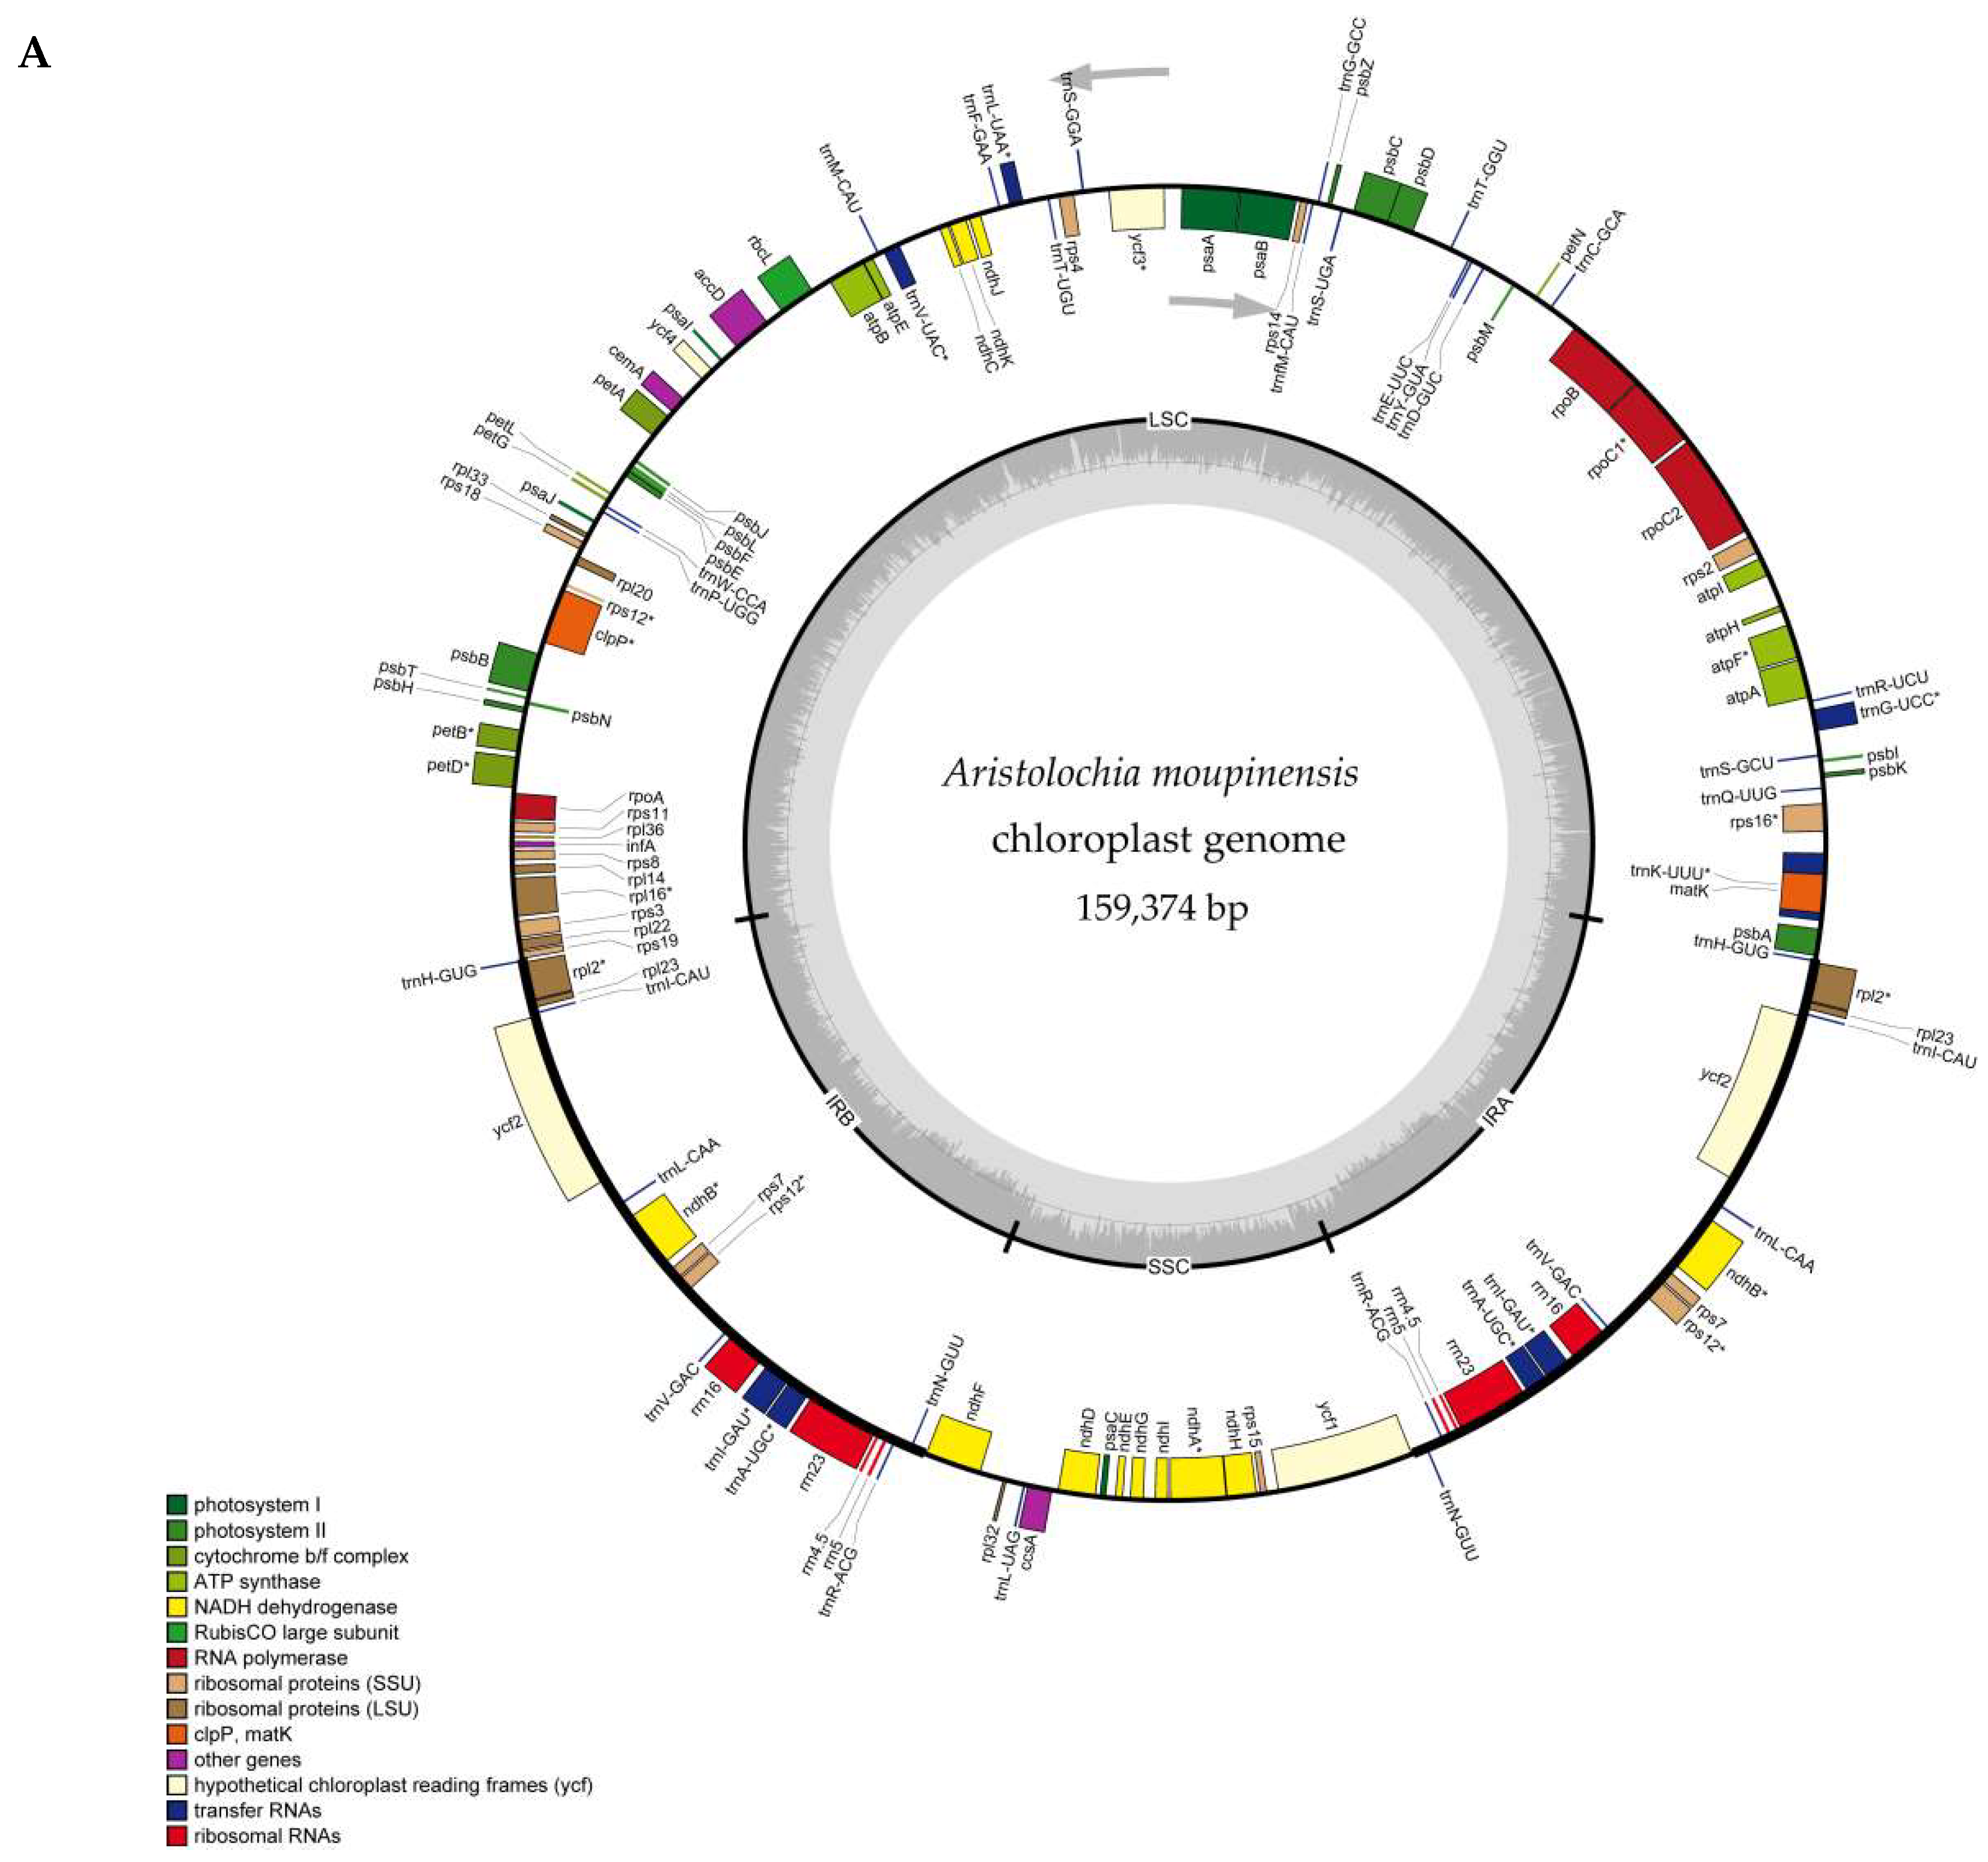
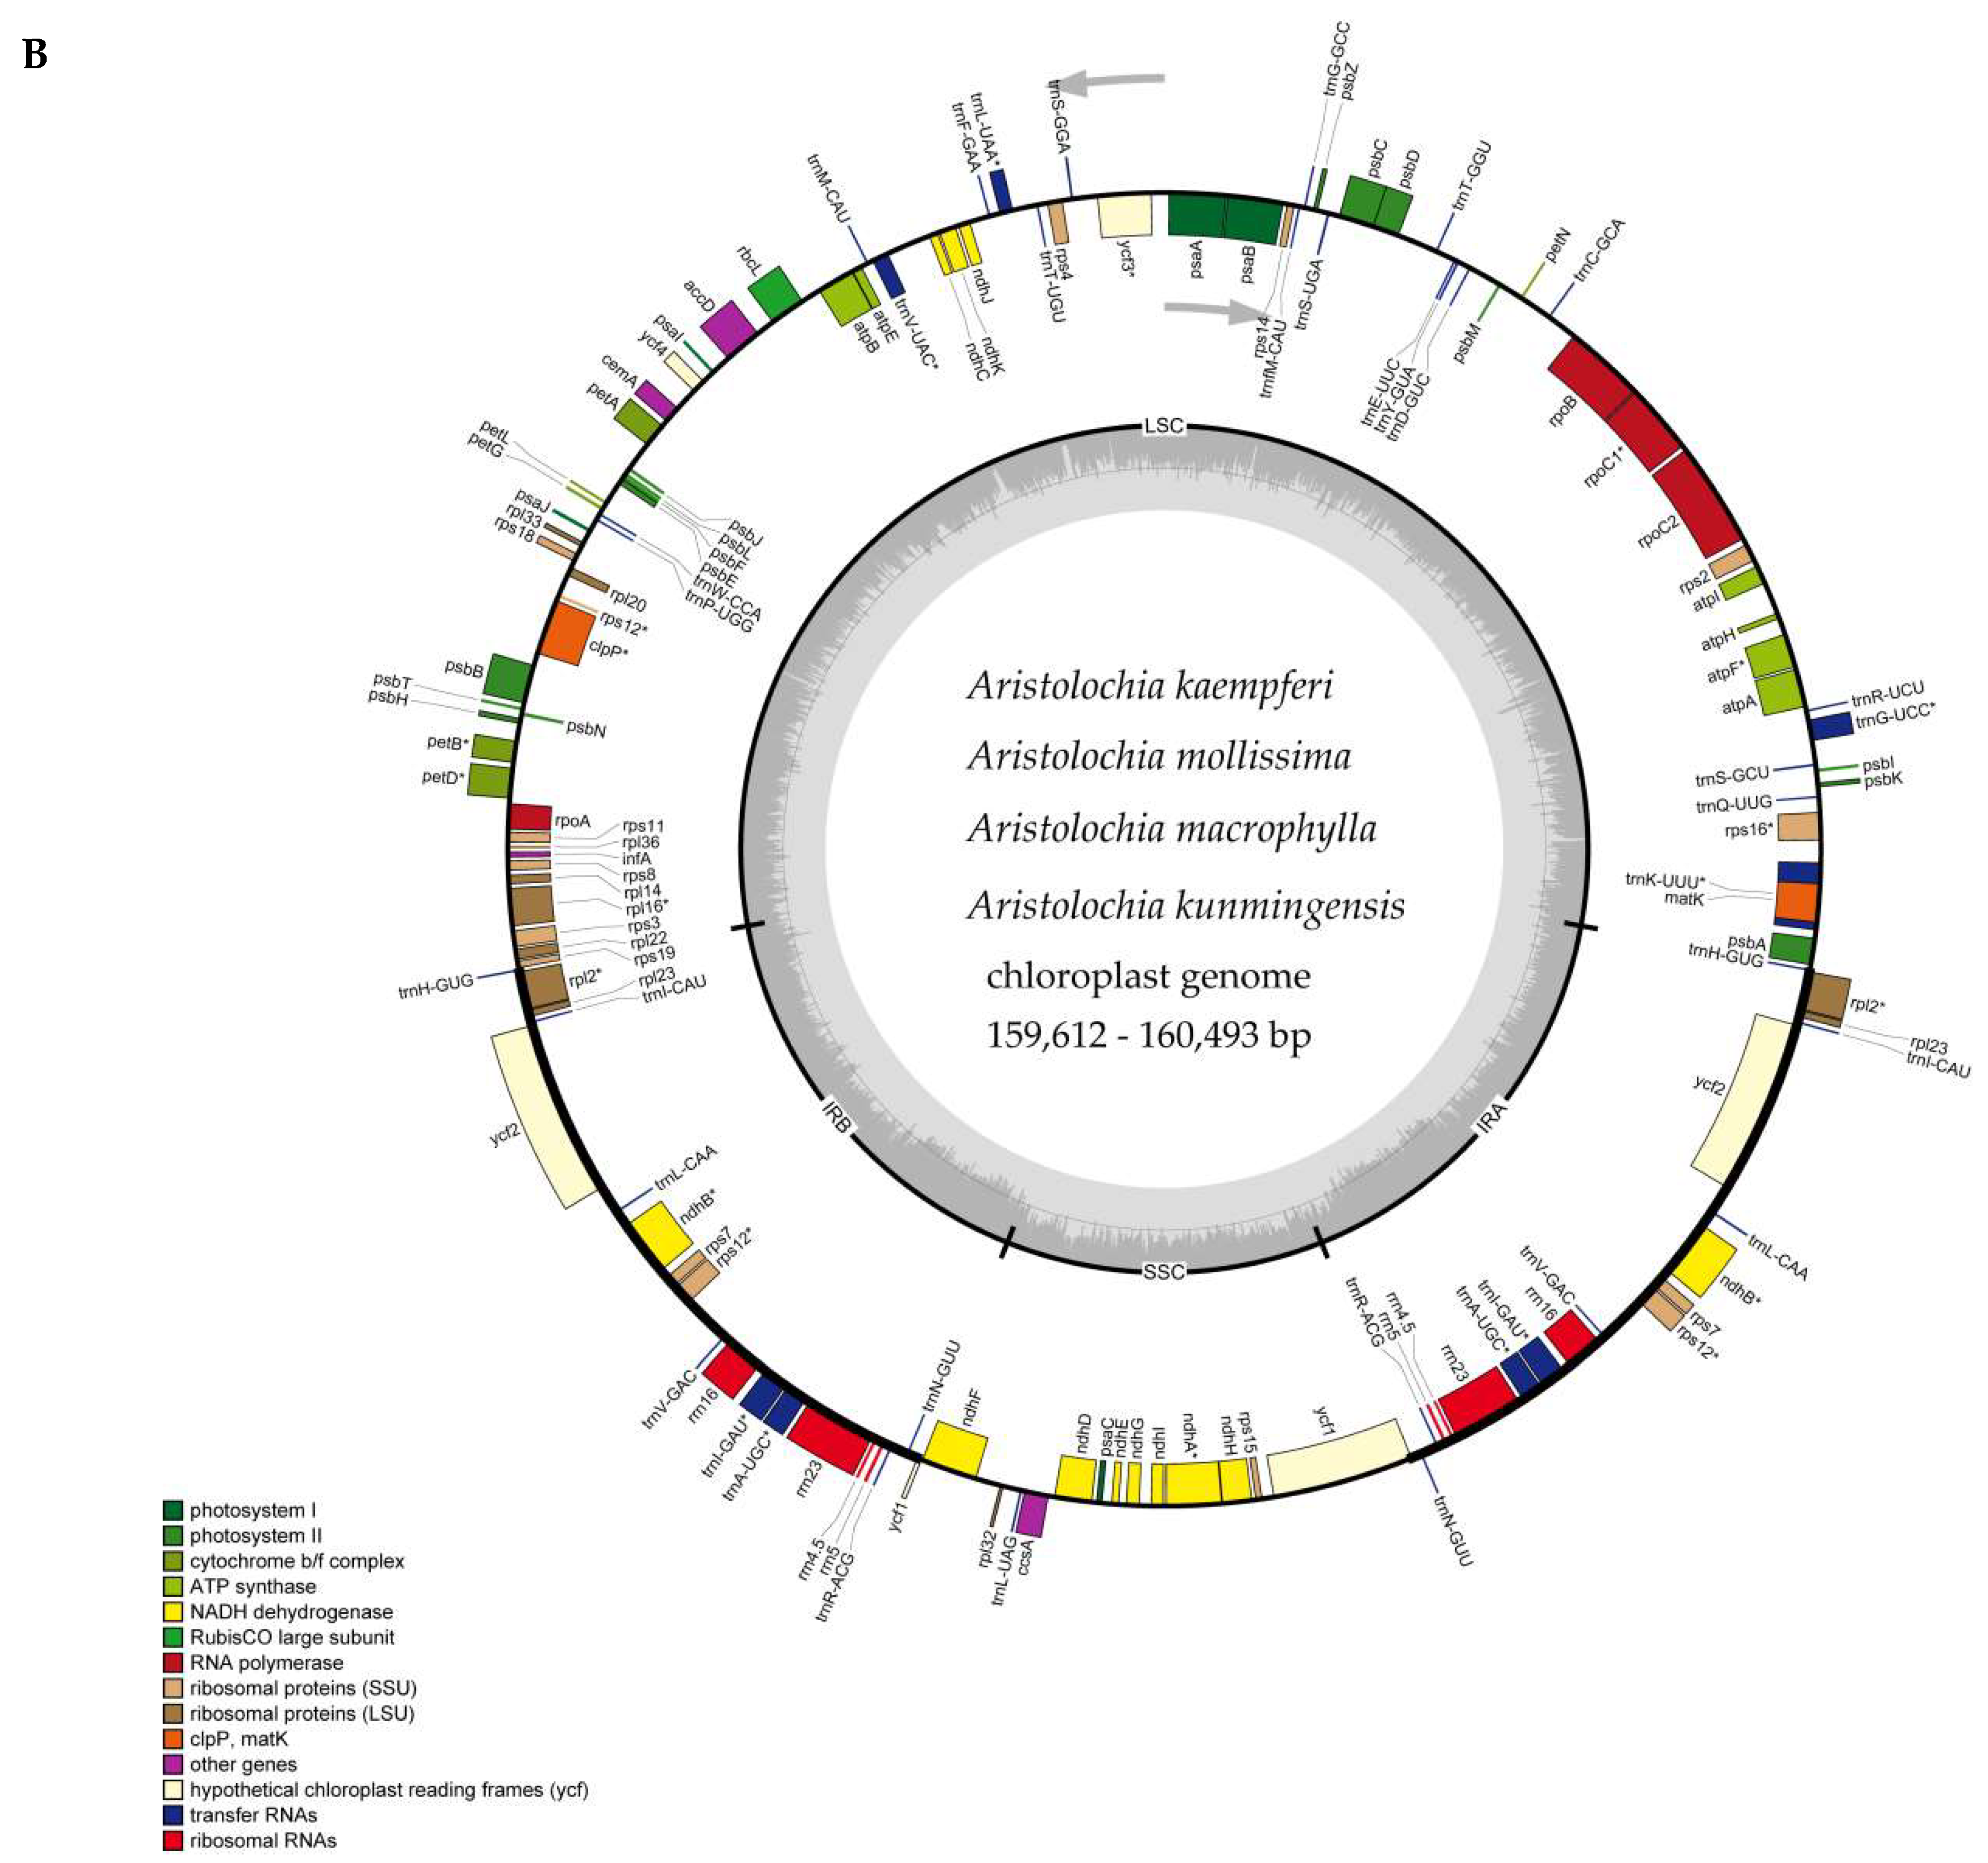
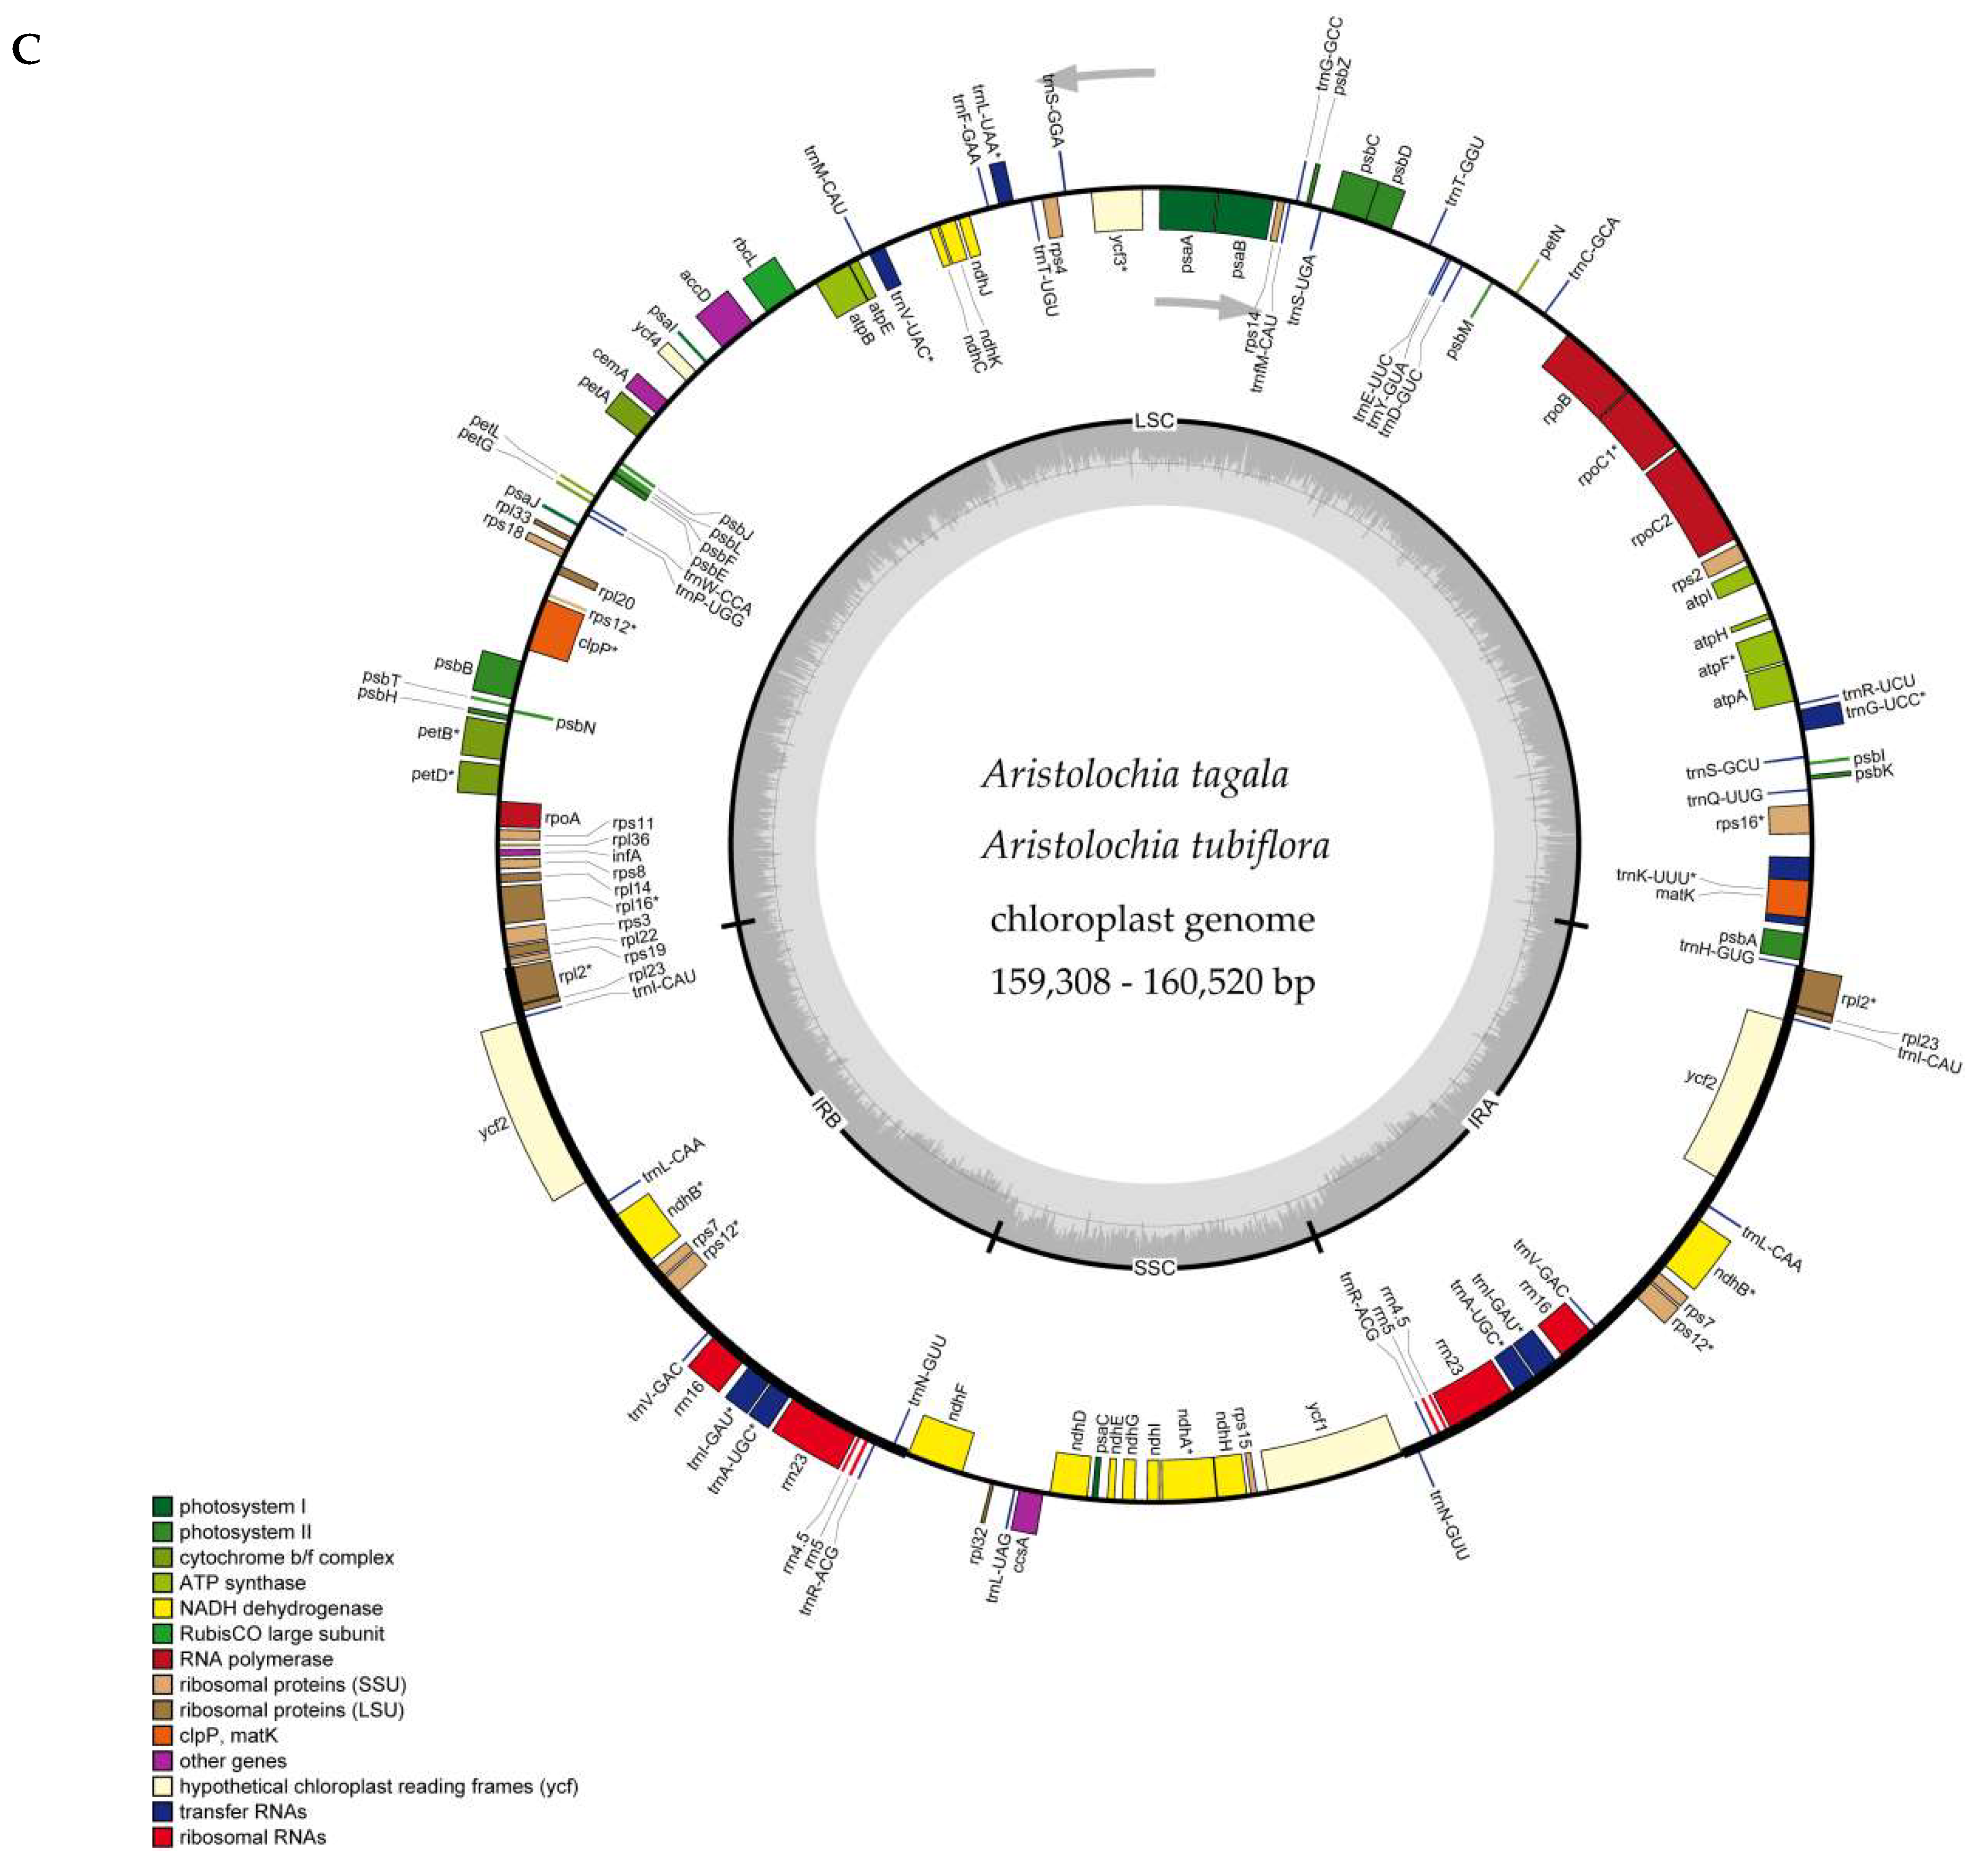
2.1. The Chloroplast Genome Structures of Species

All the species of Aristolochia we sequenced had a typical quadripartite structure, with a circular molecule of 159,308 bp to 160,520 bp in length. The complete cp genomes of involved species comprise an LSC region (88,652–89,859 bp) and an SSC region (19,322–19,799 bp), separated by a pair of IRs ranging from 25,242 bp to 25,700 bp in length (Figure 1, Table 1). GC content of the plastomes of the seven Aristolochia species varies slightly from 38.5% to 38.9% (Table 1). The GC content within coding sequence (CDS) of the two species (A. tagala and A. tubiflora) of subgenus Aristolochia and five species (A. kunmingensis, A. moupinensis, A. macrophylla, A. kaempferi, and A. mollissima) of subgenus Siphisia was 38.9% and 39.2%, respectively. GC% content of the first position was higher compared to those of the second and third positions (Figure 2, Table S1). A total of 113 unique genes were identified in the seven cp genomes, including 79 protein coding genes, 30 tRNAs and four rRNAs, 19 or 18 genes of which duplicated in the IR region (Table 1 and Table 2).
Introns play an important role in the regulation of some gene expressions [33]. Eighteen genes of seven plastomes contain one intron, including atpF, rpoC1, ycf3, rps12, rpl2, rpl16, clpP, petB, petD, rps16, ndhA, ndhB, and six tRNA genes, while three genes (clpP, ycf3, and rps12) contain two introns. The longest intron occurred in the trnK-UUU gene is 2552–2687 bp of seven plastomes, and had been used to the inter- and intra-species of Aristolochia [2,16]. In addition, the length of rpl2 intron in species of subgenus Siphisia and subgenus Aristolochia is 700 bp and 659 bp, respectively (Table 3).

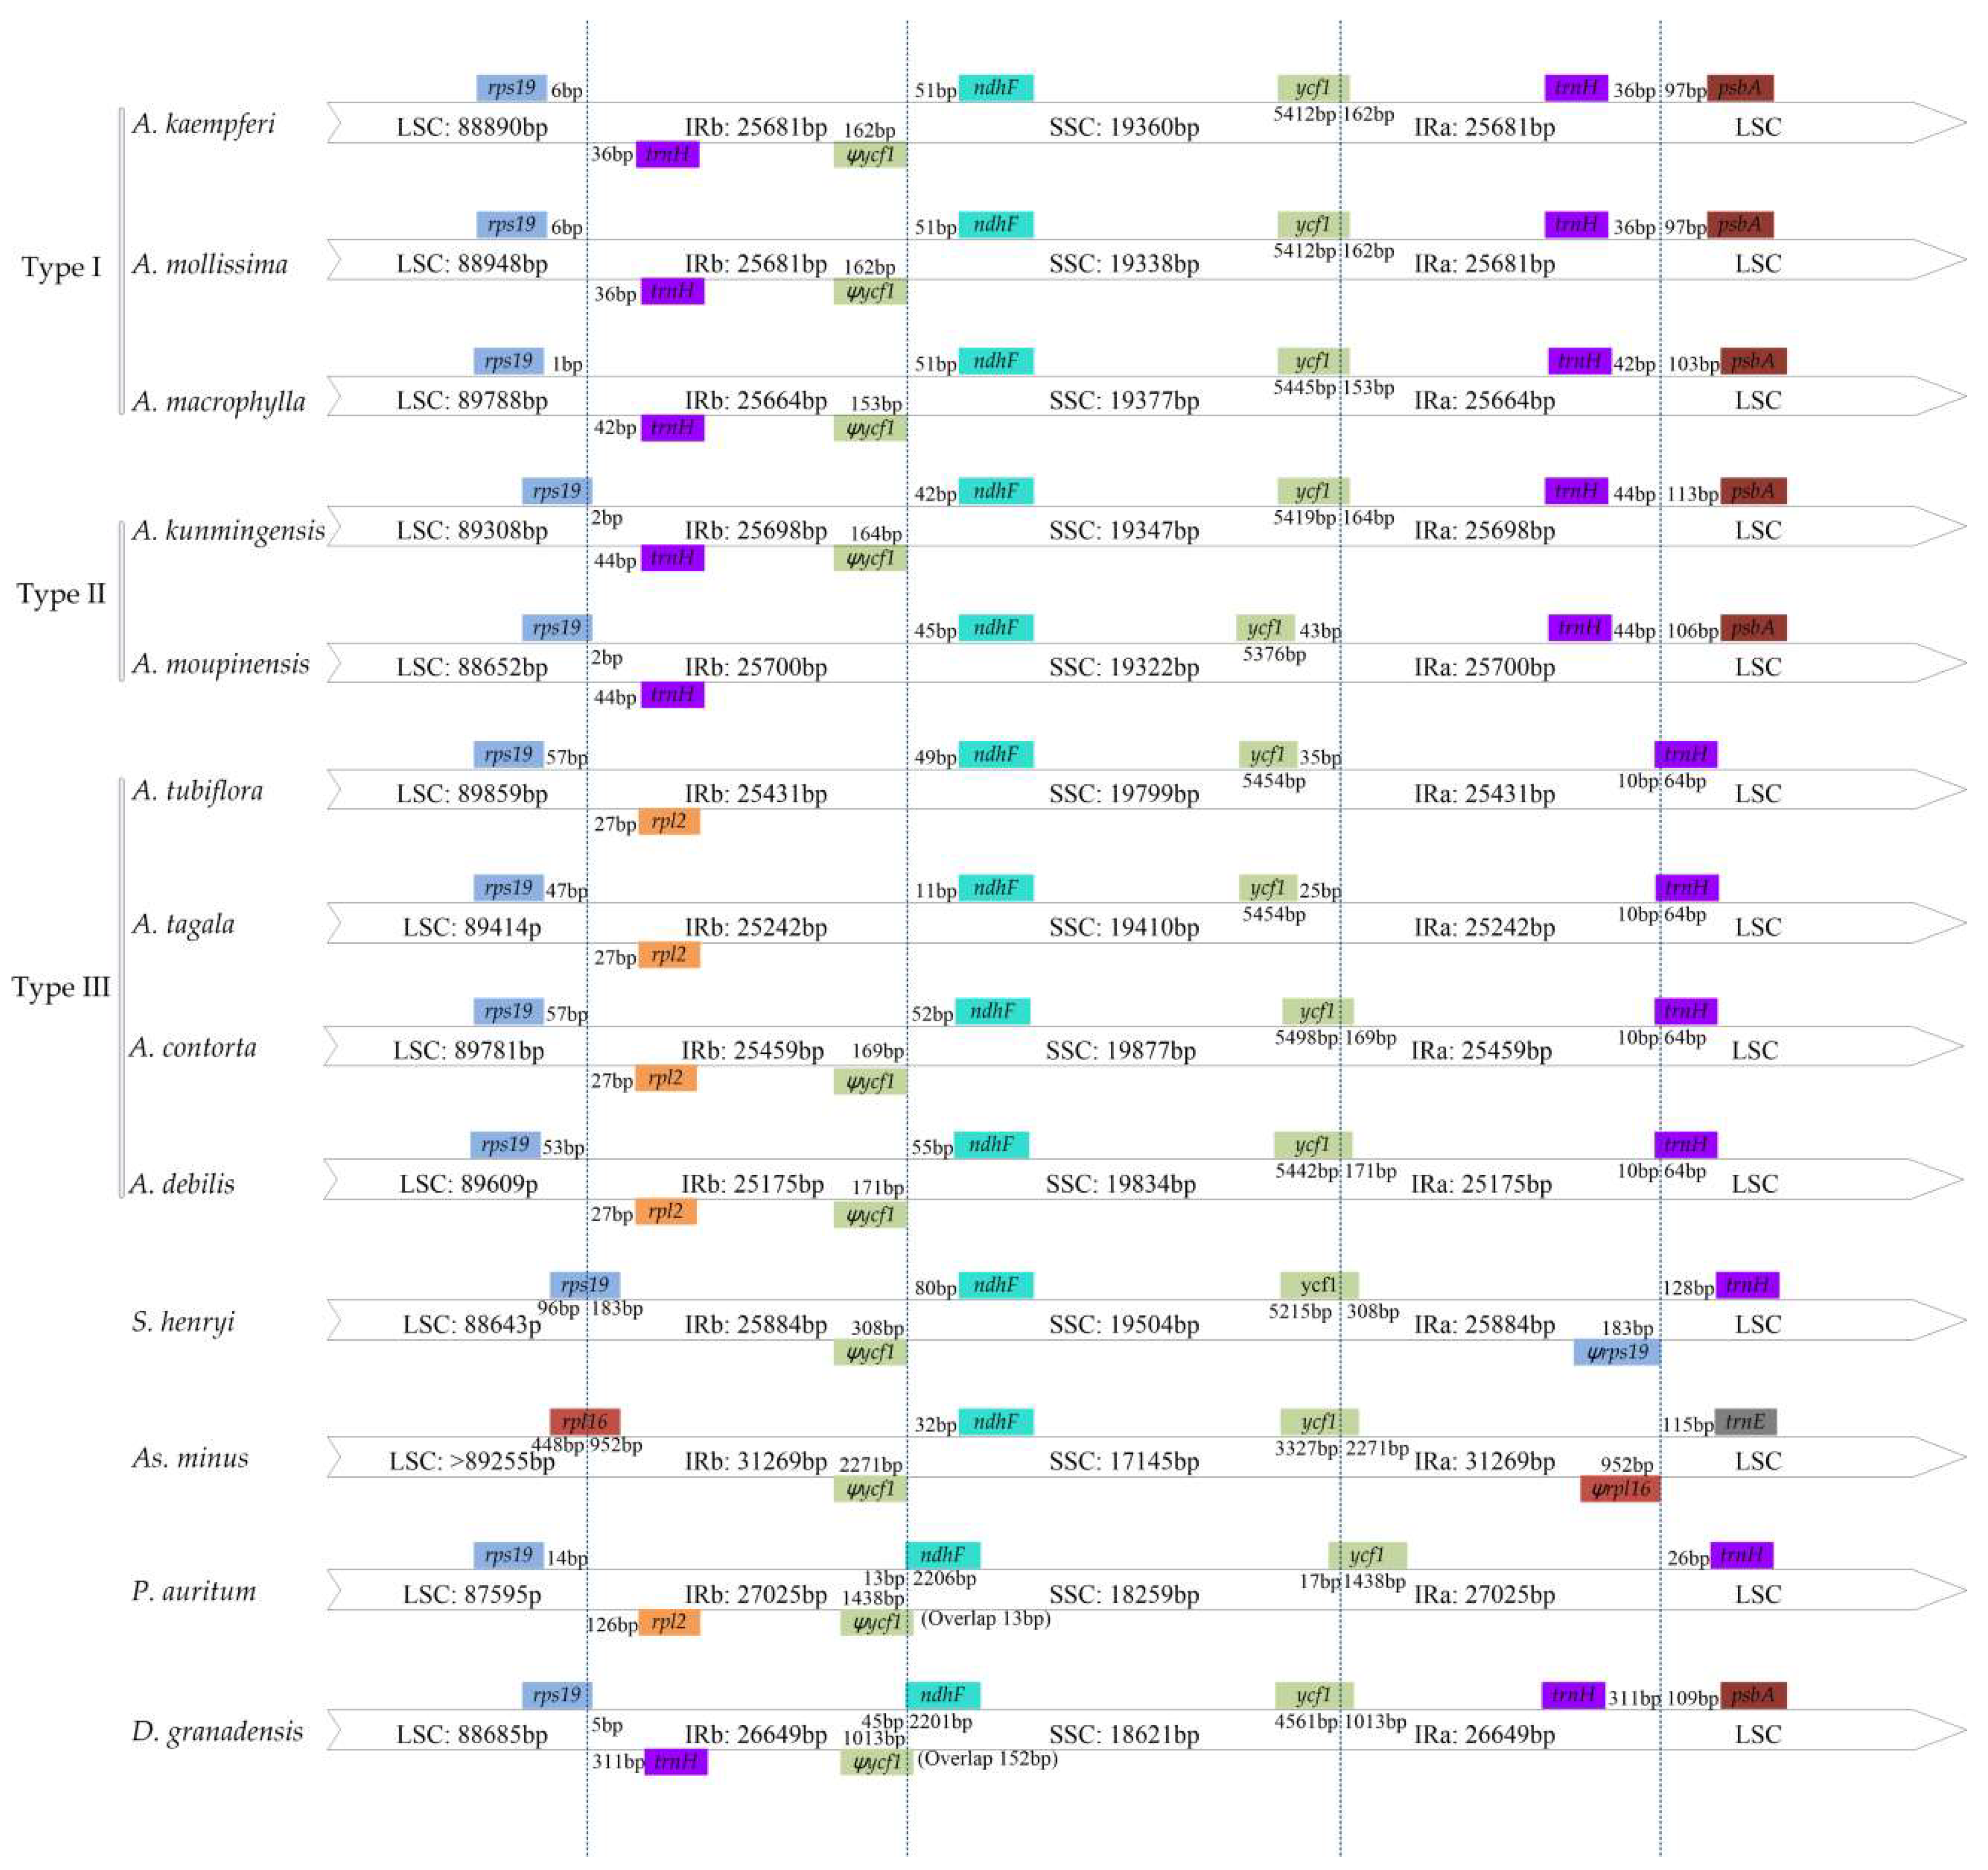
2.2. IR Contraction and Expansion
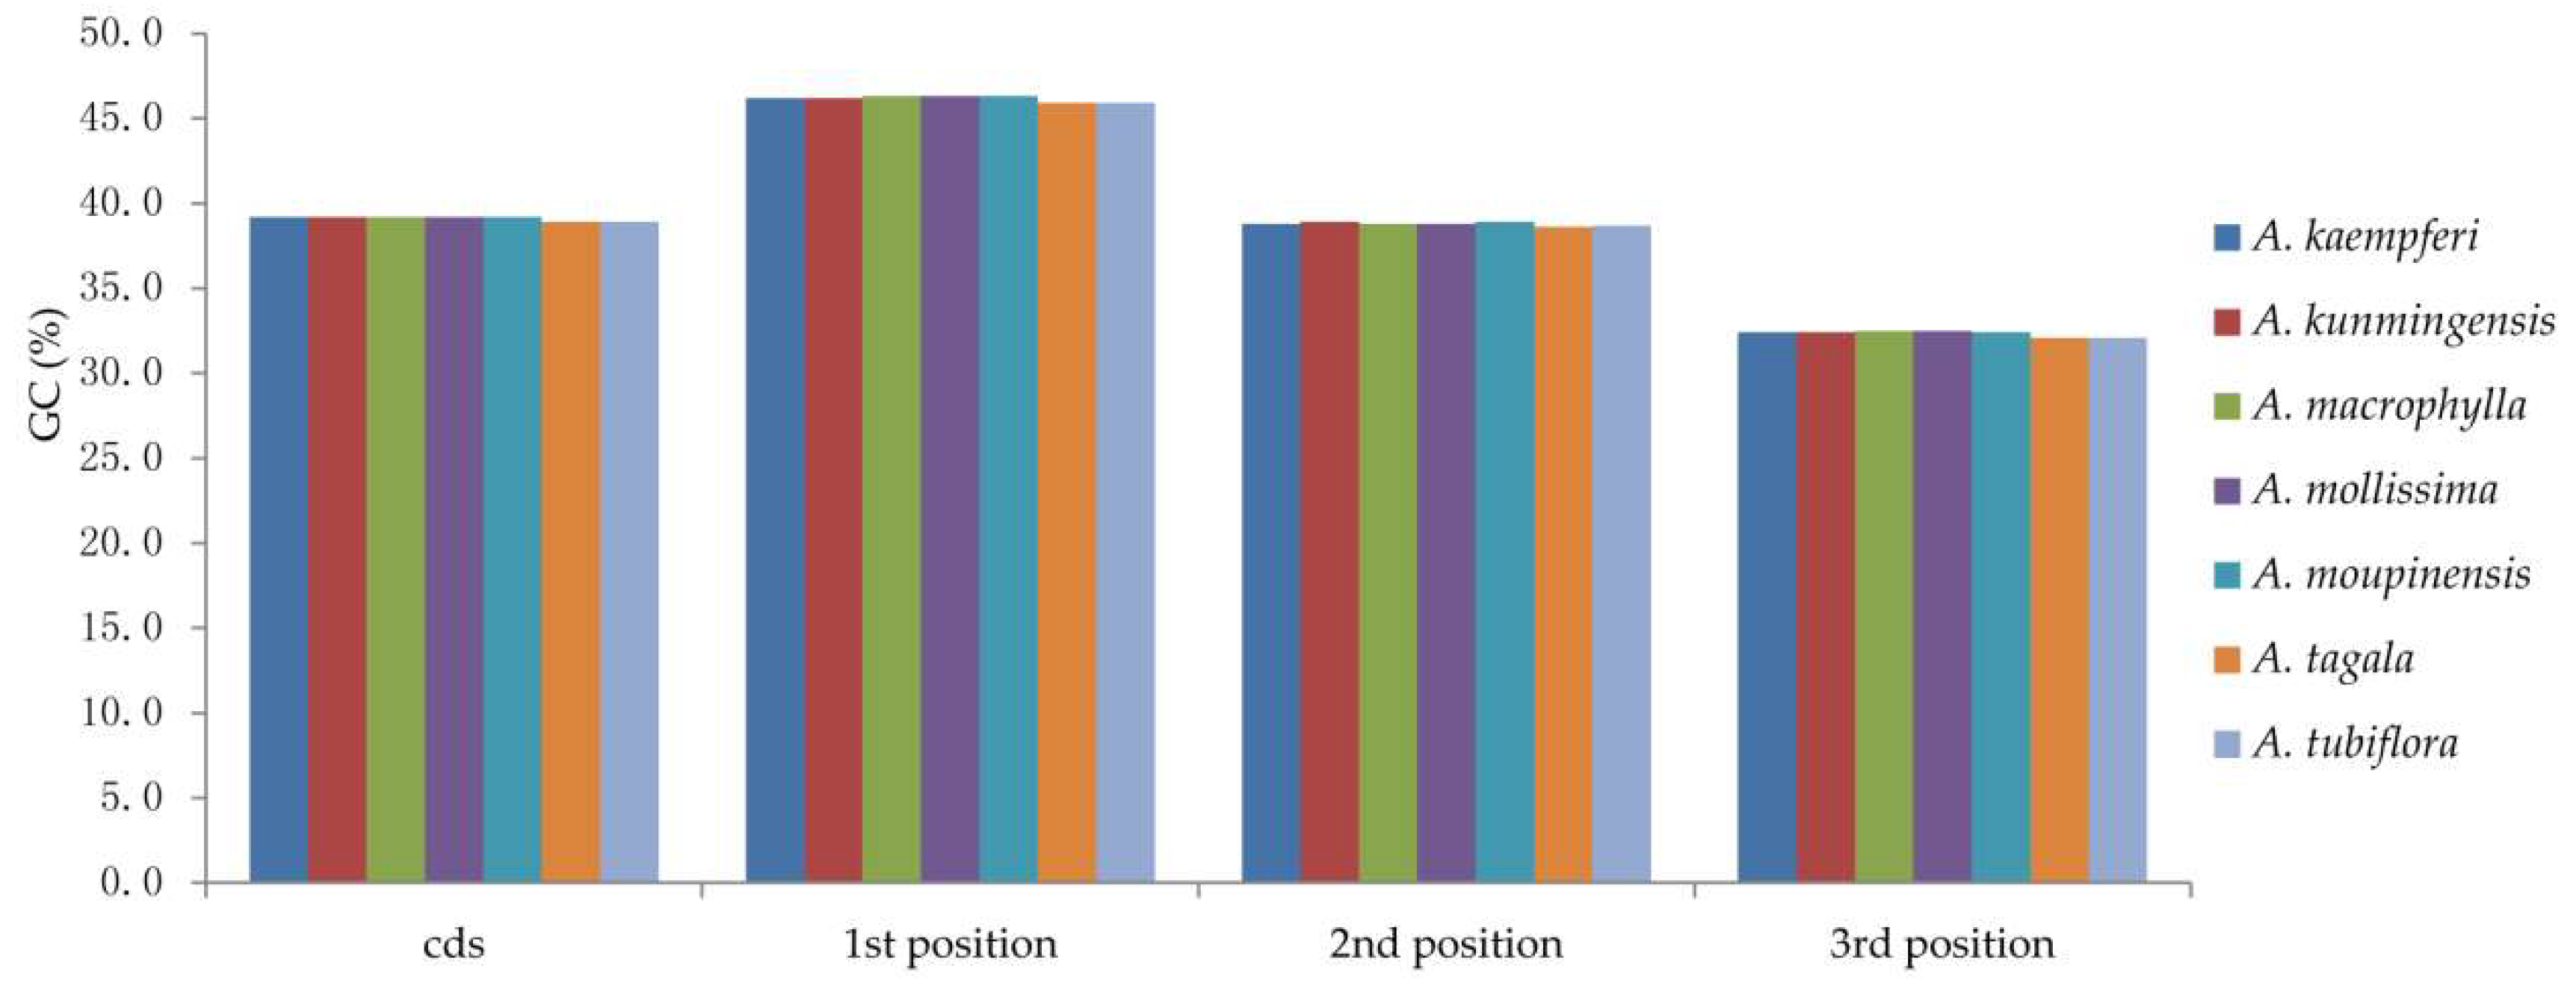
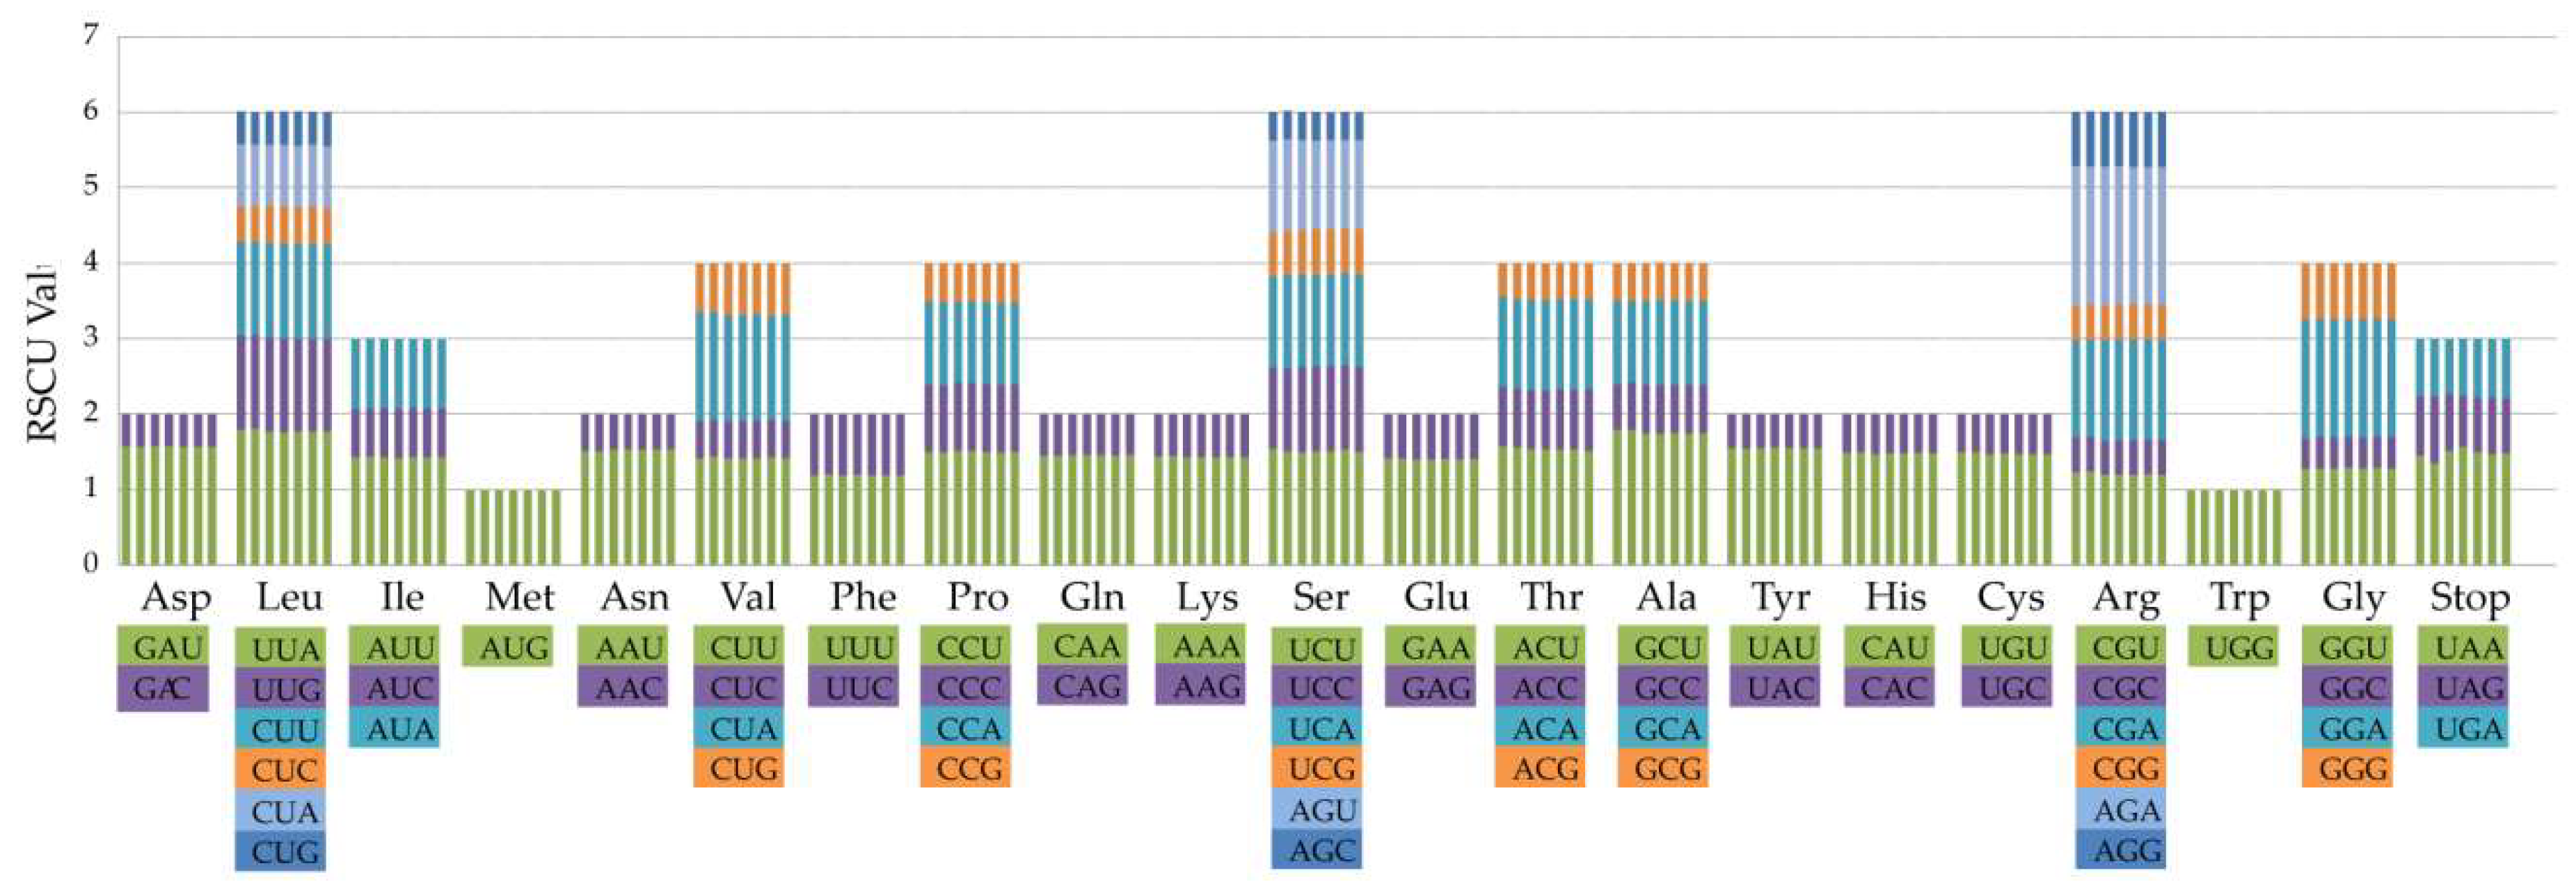
The IR regions are expanded in five species of subgenus Siphisia compare with other two species (A. tagala and A. tubiflora) of subgenus Aristolochia, indicated by different duplication genes in the IR regions, where eight or seven tRNA genes were duplicated, respectively (Figure 1, Table 2). The size of the IR region of subgenus Siphisia varies from 25,664 bp to 25,700 bp, and is 25,242 bp and 25,431 bp in the two plastomes of subgenus Aristolochia (Table 1).
Fluctuation of IR-SC borders, together with the adjacent genes, were examined among seven Aristolochia species and six plastomes retrieved from GenBank (including Aristolochia contorta: NC_036152.1, Aristolochia debilis: NC_036153.1, Asarum canadense: MG544845-MG544851, Saruma henryi: MG520100, Piper auritum: NC_034697.1, and Drimys granadensis: NC_008456.1) (Figure 3). The LSC-IRb border, was located within the genic spacer of rps19-trnH for A. kaempferi, A. macrophylla, and A. mollissima (Type I), within the rps19 gene for A. kunmingensis and A. moupinensis (Type II), while in the rps19-rpl2 spacer for A. tagala and A. tubiflora (Type III). There were two types of SSC-IRa border among 13 detected species. In the three plastomes (A. moupinensis, A. tubiflora, and A. tagala), which ycf1 gene was fully located in the SSC region, and 25-43 bp apart from the SSC-IRa border. The SSC-IRa border was situated in the coding region ycf1 gene in the other 10 sequenced species, which spanned into the IRa region. Among the 10 detected species, the pseudogene ycf1 in the IRb region with the same length as far as the IRa expanded into ycf1 gene, and the length ranged from 153 bp to 2271 bp. The ndhF gene was entirely located in the SSC region in 10 species of Aristolochiaceae, but varied in distance (11-80 bp) from the IRb-SSC border. The LSC-IRa border in the species of subgenus Aristolochia was situated in the trnH gene with 10 bp into the IRa region (Type III), while the border was located in the trnH-psbA spacer in subgenus Siphisia species (Type I and II) (Figure 3).

2.3. Codon Usage

All the protein-coding genes were composed of 26,194–26,398 codons in the cp genomes of the seven species of Aristolochia. The codon usages of protein-coding genes in the cp genomes are summarized in Figure 4 and Table S2. Among these codons, the most common amino acid in the protein-coding genes is leucine, which appears 2775 times in A. kaempferi and A. mollissima. The relative synonymous codon usage (RSCU) value analysis showed that almost all amino acids have more than one synonymous codon, except methionine and tryptophan. Nearly all of the protein-coding genes of Aristolochia species had the standard ATG start codon (RSCU = 1). About half of codons have RSCU > 1, and most of those (29/31, 93.5%) end with base A or T. About half of the codons have RSCU < 1, and most of those (28/31, 90.3%) end with base C or G.

2.4. Positive Selection Analysis

We compared the ratio of non-synonymous (dN) and synonymous (dS) substitution for 79 protein-coding genes among seven species, including A. kunmingensis, A. kaempferi, A. tagala, A. debilis, As. canadense, S. henryi, and P. auritum within Piperales. The statistical neutrality test showed that five genes in the seven cp genomes are under significant positive selection, and these genes are involved in the synthesis of ribosomal small and large subunit protein (rps12, rps18, and rpl20) or unknown function (ycf1 and ycf2) (Table 4). Likelihood ratio tests (M1a vs. M2a, M7 vs. M8) supported the presence of positively selected codon sites (p < 0.05) (Table S3). According to the M2a and M8 models, the rpl20 harbored three or four sites under positive selection. The gene ycf1 harbored one or three sites under positive selection based on two models, respectively. In addition, we identified rps12 gene with one positive selection site.

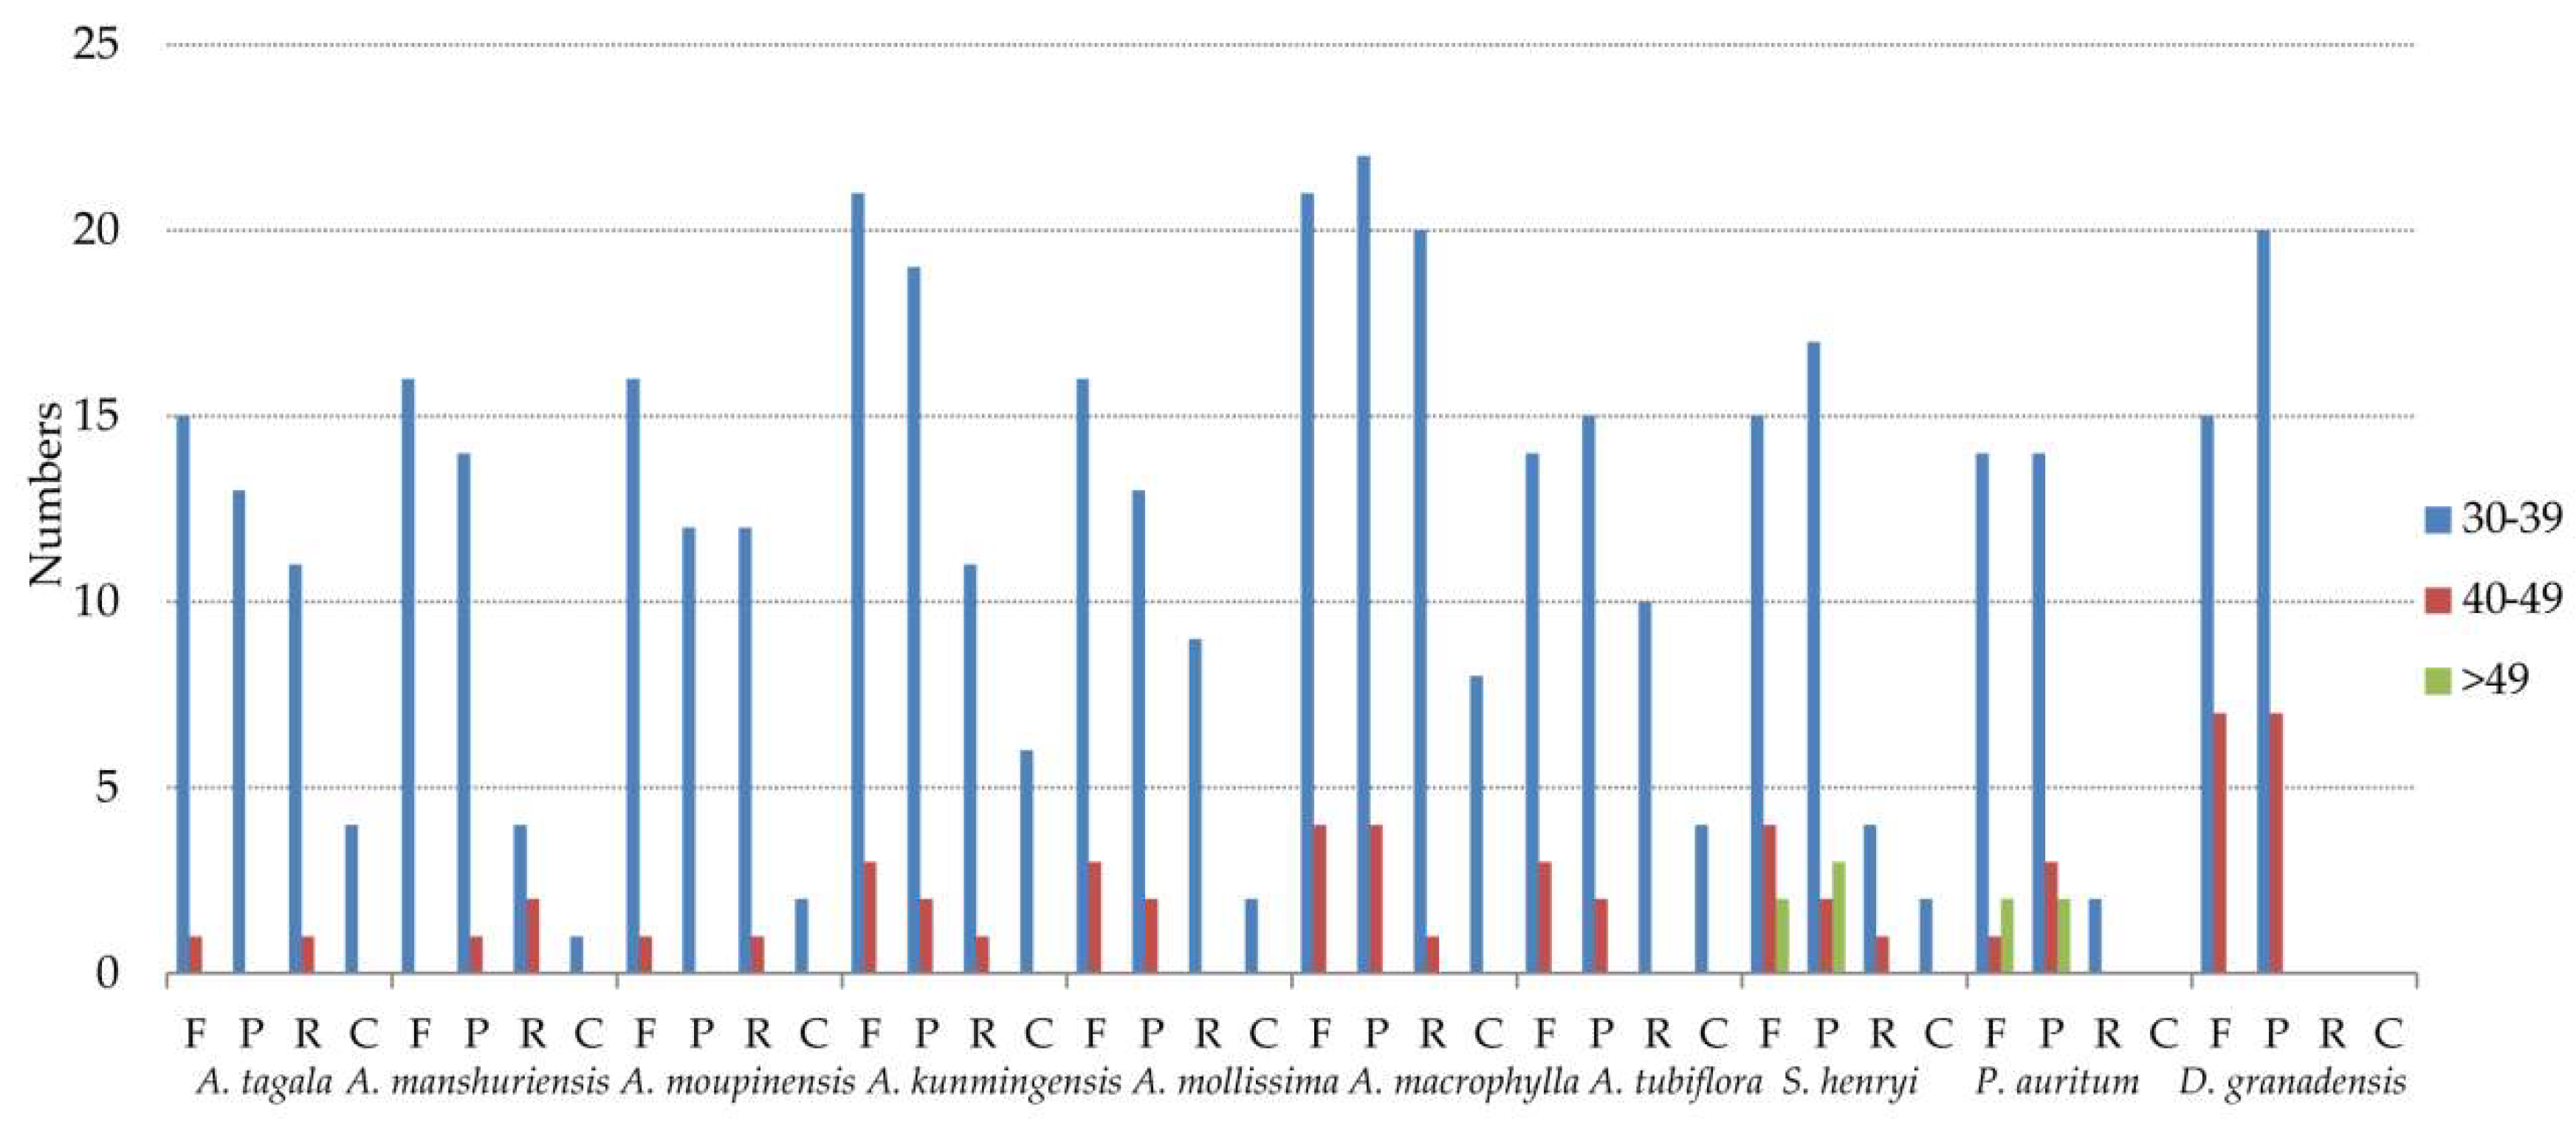
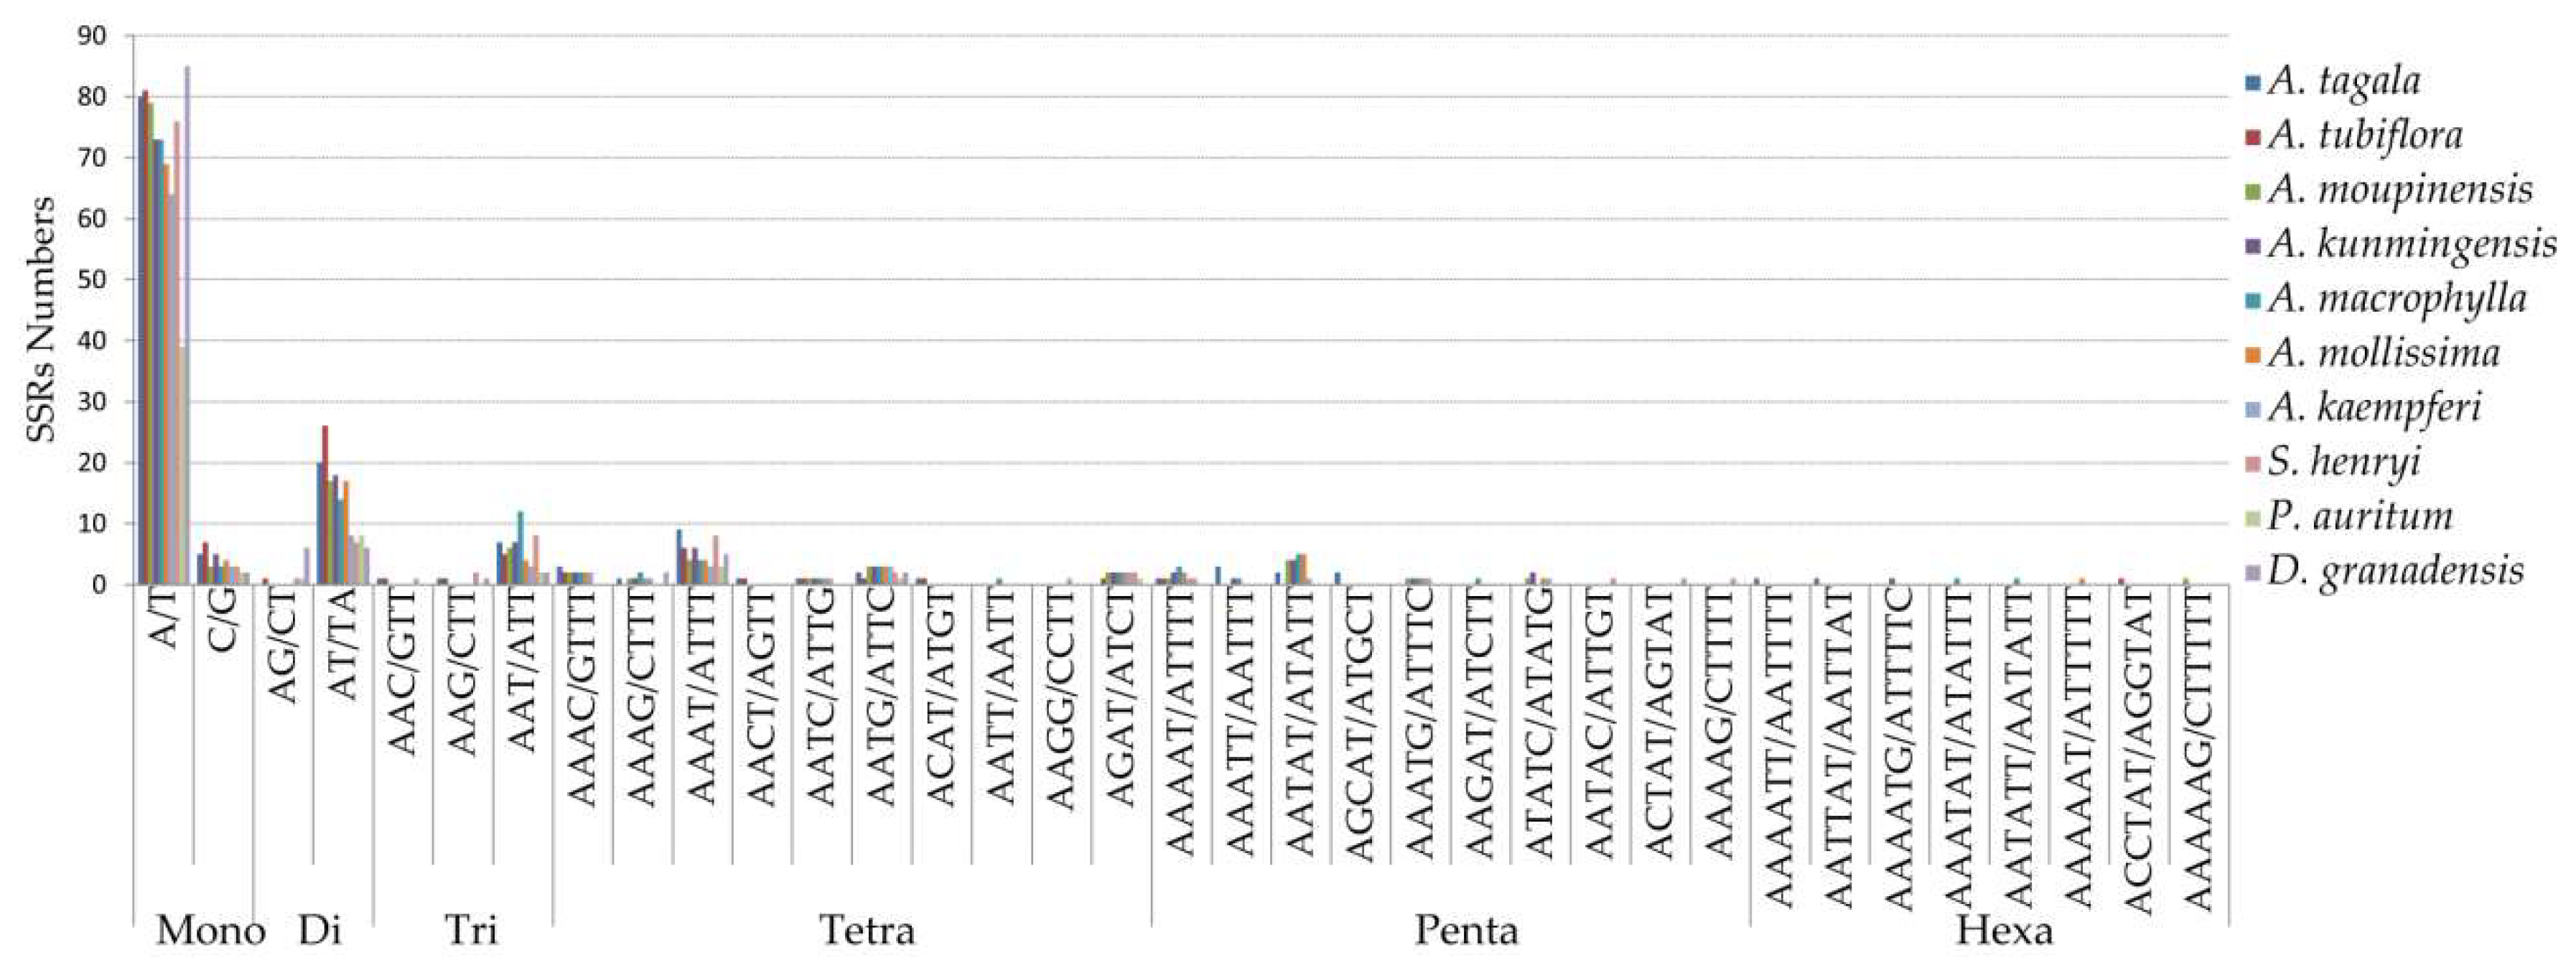
2.5. Repeat Structure and Simple Sequence Repeats Analyses

Repeats in ten cp genomes were analyzed using REPuter, including seven species of Aristolochia, S. henryi, P. auritum, and D. granadensis (Figure 5, Table S4). The results showed that A. macrophylla had the greatest number of repetitive elements in cp genome, comprised of 25 forward, 26 palindromic, 21 reverse, and eight complement repeats. The size of the most repeats were 30–39 bp, and the repeats with the length > 49 bp only occurred in cp genomes of S. henryi and P. auritum. The longest repeats, with a length of 1591 bp, was detected in S. henryi. The total numbers of SSRs were also identified in the cp genomes of the ten species (Figure 6 and Table S5). Mononucleotide repeats were the largest in a number of these SSRs, with 88% and 85% found in A. tubiflora and A. tagala, respectively. A/T repeats were the most common of mononucleotides, while AT/TA repeats are the majority of dinucleotide repeat sequences (96.3%–100%). The trinucleotide in the five species of subgenus Siphisia were only comprised of AAT/ATT repeats (100%), while A. tubiflora and A. tagala of subgenus Aristolochia also comprised AAC/GTT and AAG/CTT repeats.

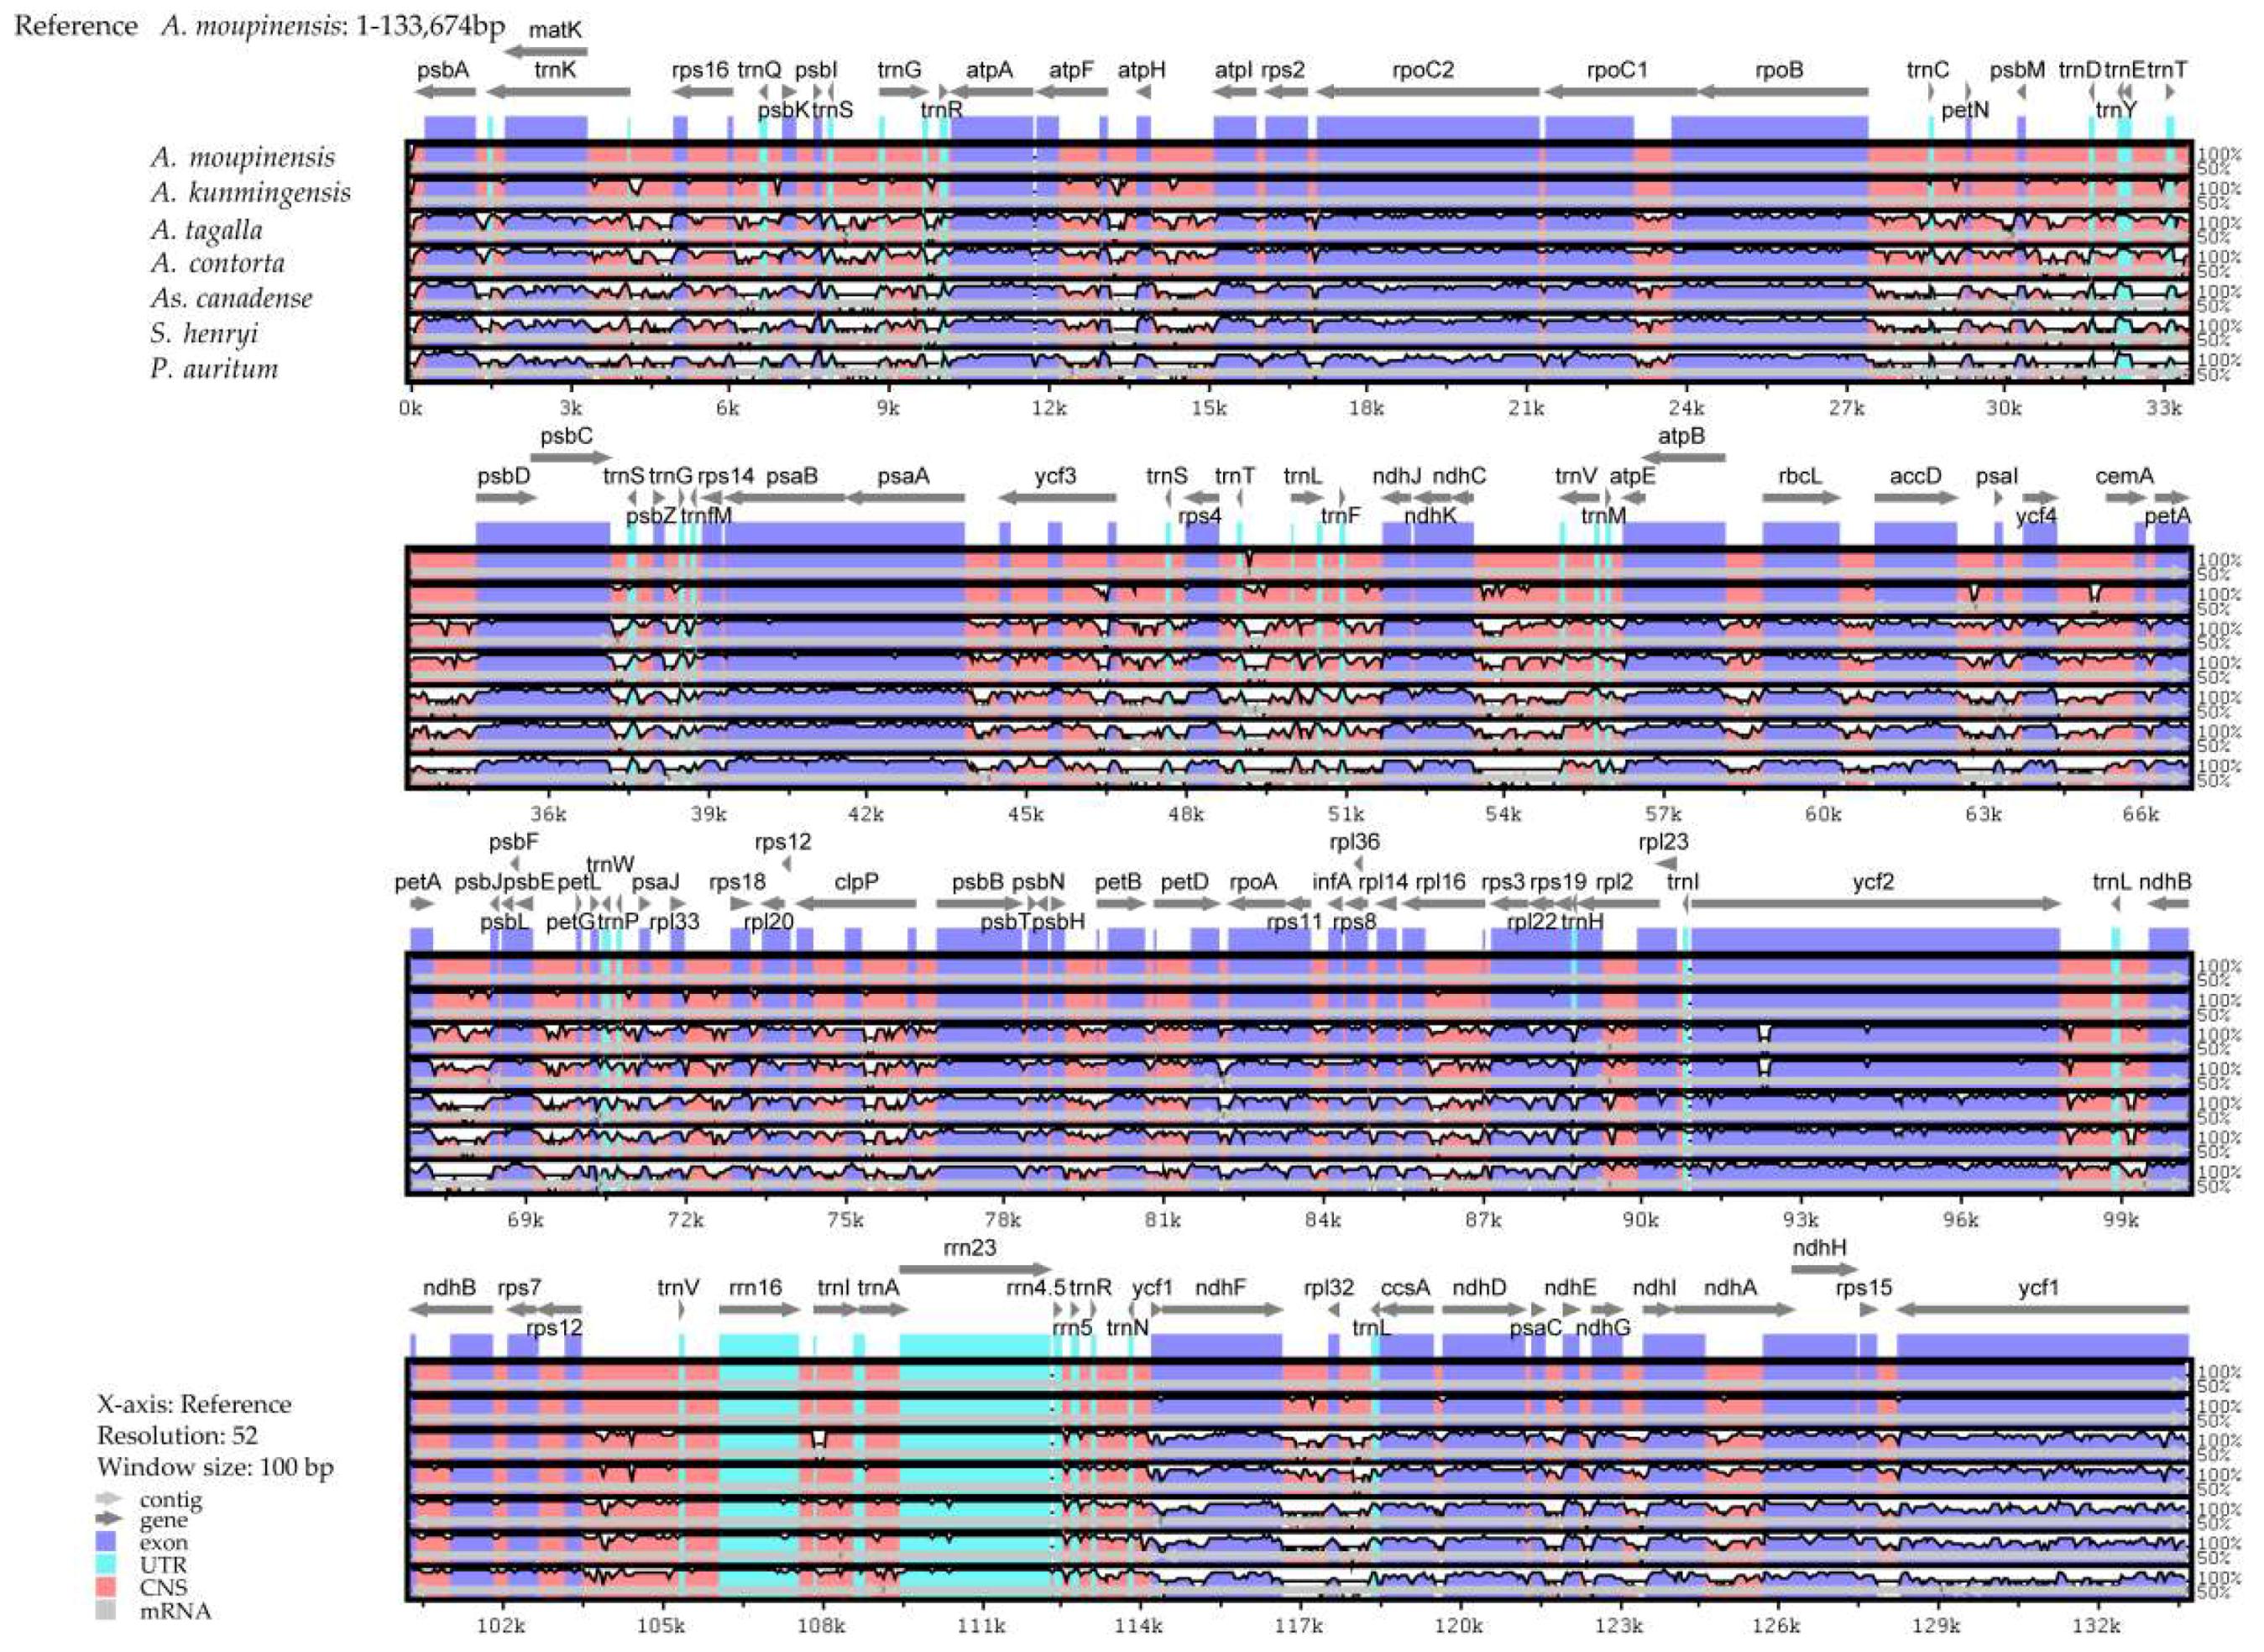
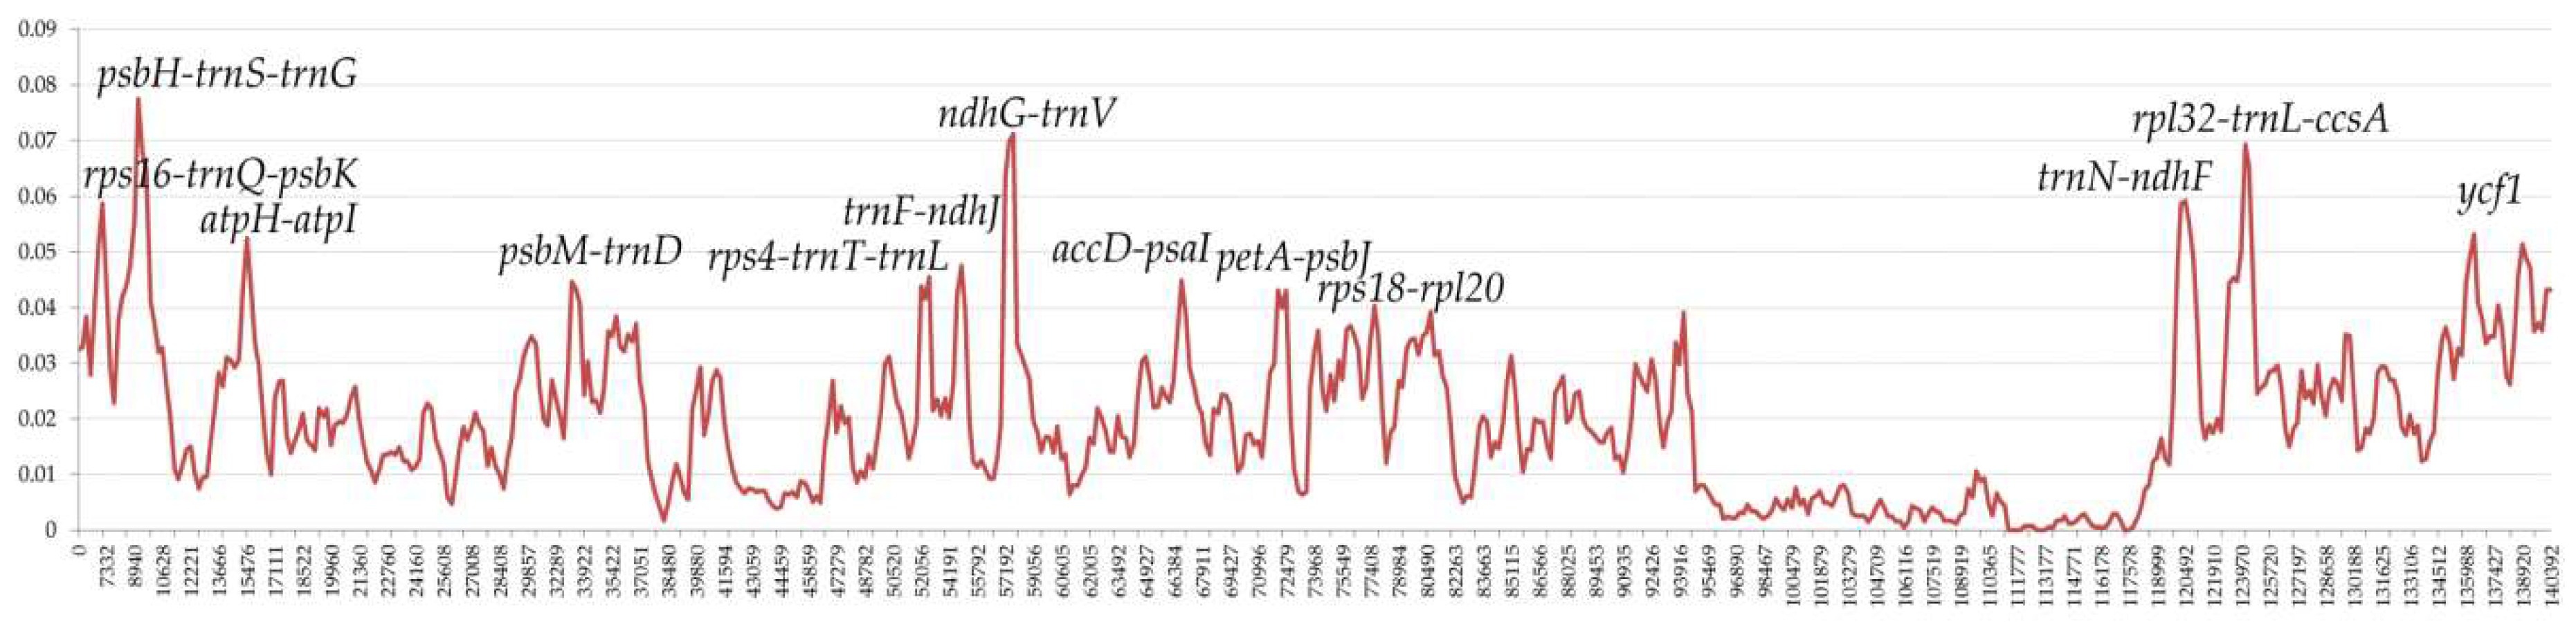
2.6. Comparative Genomic Divergence and Hotspots Regions

The SC and IR regions of cp genomes of the seven species (including A. moupinensis, A. kunmingensis, A. tagala, A. contorta, S. henryi, As. canadense, and P. auritum) were compared using the mVISTA program to detect hyper-variable regions (Figure 7). The alignment revealed high sequence conservatism across the cp genomes of A. moupinensis and A. kunmingensis of subgenus Siphisia. The comparison among seven cp genomes showed that the IR region was more conserved than the SC regions. The most divergent regions located in the intergenic spacers, and the most divergent coding regions were ndhF and ycf1.
Comparative analysis among our seven sequenced species within Aristolochia was conducted of the entire cp genomes, LSC, SSC, IR, and CDS regions, respectively (Table 5). The nucleotide diversity (Pi) value was also calculated to evaluate the sequence divergence among these cp genomes, and their values varied from 0 to 0.07746 (Figure 8). The analysis revealed that the SSC region, compared with other regions, exhibited the highest levels of divergence (Pi = 0.03114). These values of the LSC region, varied from 0.00175 to 0.07746, with the mean value of 0.02182. The IR region exhibited the lowest Pi values varying from 0 to 0.01056, with the mean of 0.00411, indicating that IR region was the most conserved one. Furthermore, we identified 16 hotspot regions (Pi > 0.04, the mean value = 0.05413) with the full length of 20,296 bp, including rps16-trnQ-psbK, psbI-trnS-trnG, atpH-atpI, psbM-trnD, rps4-trnT-trnL, trnF-ndhJ, ndhC-trnV, accD-psaI, petA-psbJ, rps18-rpl20, trnN-ndhF, rpl32-trnL-ccsA, and four regions of ycf1 coding gene (Table 6). Ten of these (rps16-trnQ-psbK, psbI-trnS-trnG, atpH-atpI, psbM-trnD, rps4-trnT-trnL, trnF-ndhJ, ndhC-trnV, accD-psaI, petA-psbJ, and rps18-rpl20) are located in the LSC, and six (trnN-ndhF, rpl32-trnL-ccsA and ycf1) in the SSC region, which could be utilized as potential markers for the phylogeny reconstruction and species identification of this subgenus in further studies.

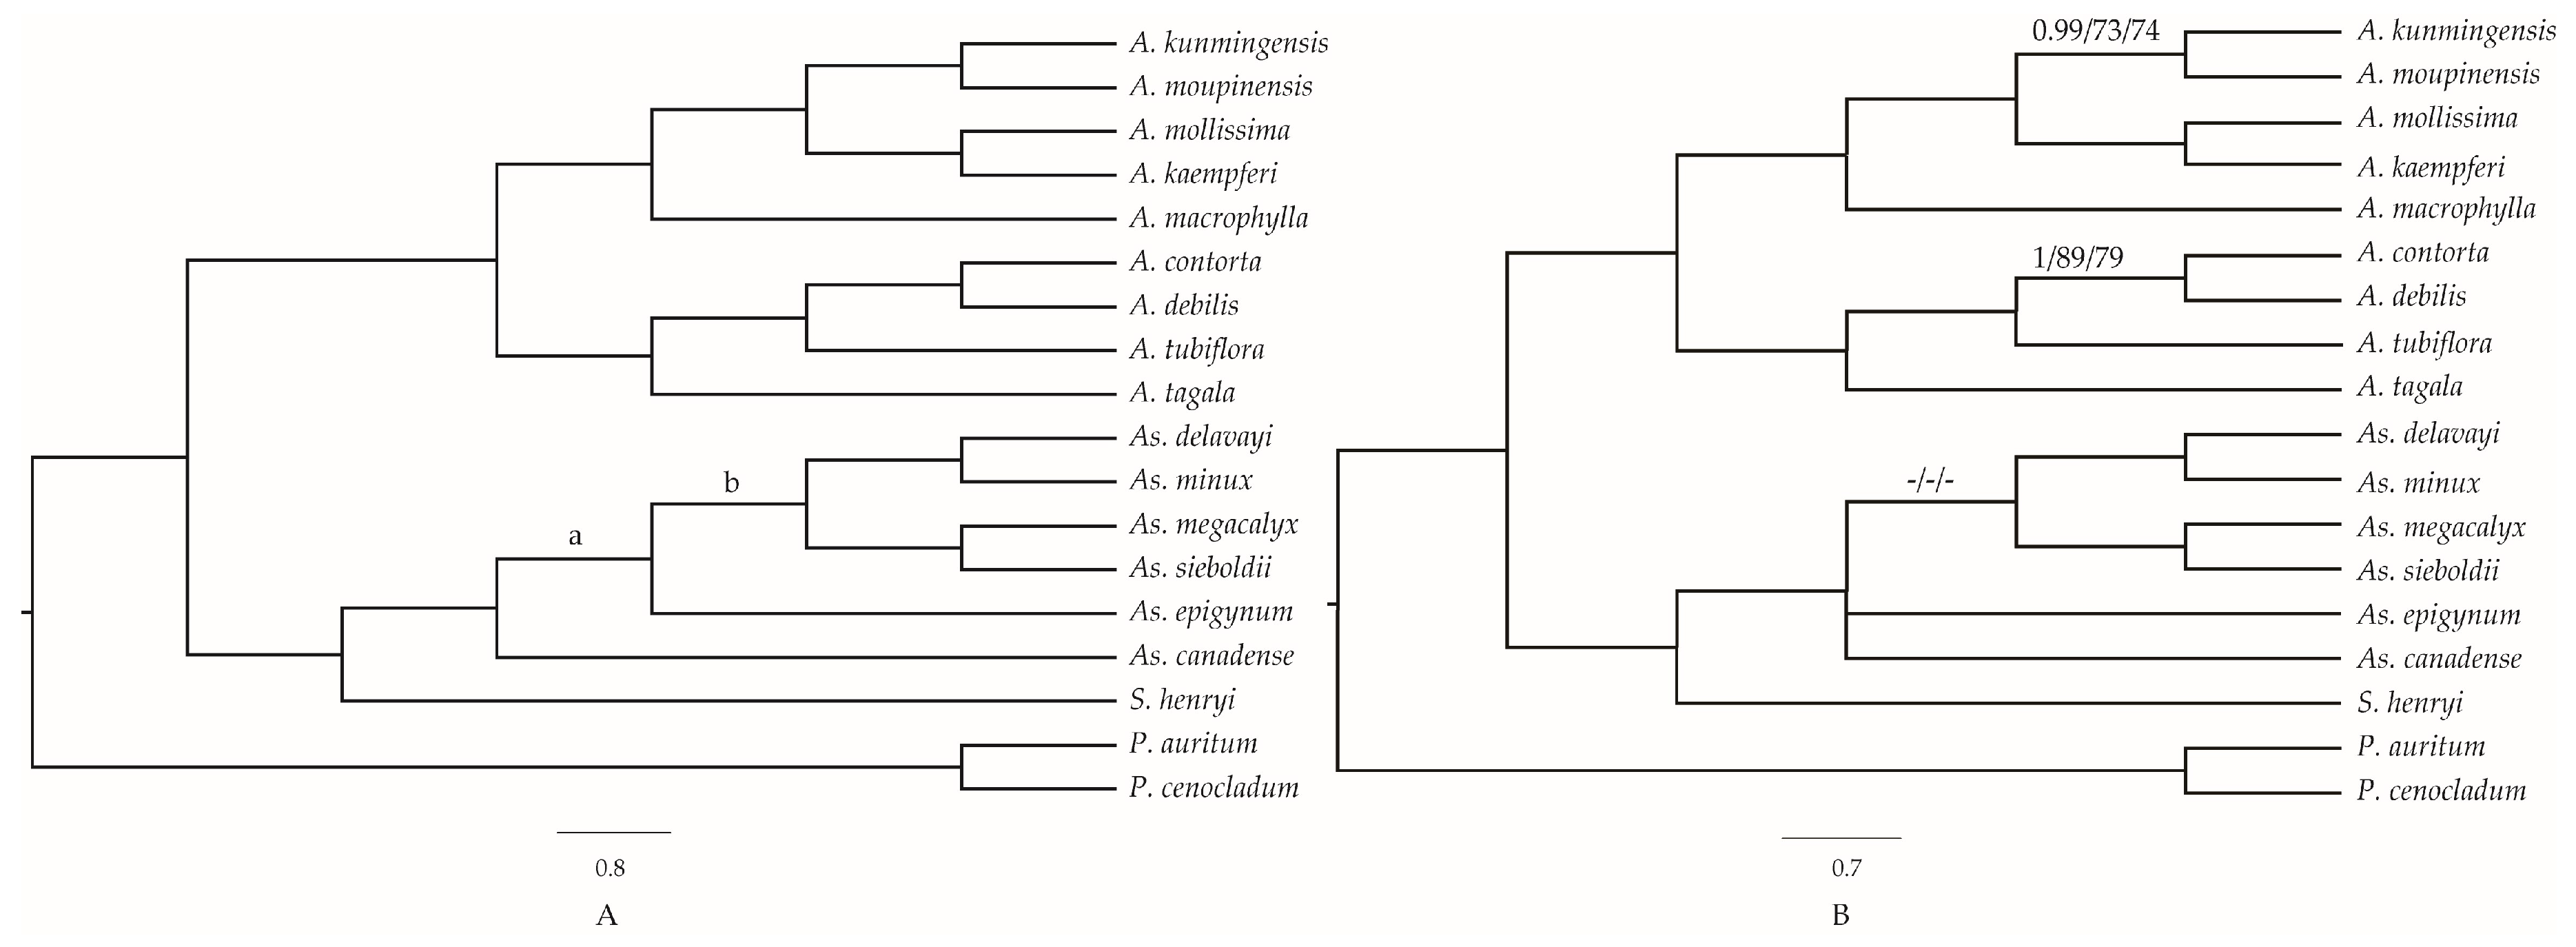
2.7. Phylogenetic Analyses

The phylogenetic relationships of Aristolochiaceae were constructed based on six datasets (entire cp genome sequences except a copy of IR, LSC, SSC, IR, and CDS regions and combining 16 hotspots) of 18 samples, using three methods of ML, MP, and BI, respectively (Figure 9). The robust topologies were consistent for most clades of cp genomes, LSC, SSC, CDS, and hotspots datasets, with the high bootstrap values for most of the branches (Figure 9A). From these six different datasets, the phylogenetic analysis showed that the genera Asarum and Saruma represented by seven species formed a clade with posterior probabilities (PP) = 1 based on BI, bootstrap values (%) (BS) =100 based on ML and BS =100 based on MP methods. However, the tree constructed using sequences of the IR region failed to resolve the phylogeny position of Asarum epigynum and As. canadense (Figure 9B), maybe due to inadequate information sites in the IR region. These nine species of Aristolochia species formed another strongly supported monophyletic group (PP = 1; [ML] BS = 100; [MP] BS = 100), and were divided into two subclades with strong support, corresponding to the taxonomic division of subgenus Siphisia (PP = 1; [ML] BS = 100; [MP] BS = 100) and subgenus Aristolochia (PP = 1; [ML] BS = 100; [MP] BS = 100). Within the subgenus Siphisia, the species A. macrophylla from North America was sister to the rest of four species from Asian region (PP = 1; [ML] BS = 100; [MP] BS = 100).

3. Discussion

3.1. IR Contraction and Expansion

Taken another two reported species (A. debilis and A. contorta) of subgenus Aristolochia into account, although genomic structure and size were highly conserved, the IR-SC boundary regions were variable between these nine cp genomes of Aristolochia (Figure 3). In general, contraction and expansion at the borders of IR regions are common evolutionary events and may cause IR size variation of plastomes [29,34,35,36]. The length of the IR regions of five Siphisia species, varying in the range of 25,664–25,700 bp, was longer than those of the four species of subgenus Aristolochia, which varied from 25,175 bp to 25,459 bp (Table 1) [28]. We identified three types of the IR-SC junctions from the nine Aristolochia species, according to the organization of genes (Figure 3). Within five detected species of subgenus Siphisia, its patterns were Type I and II, while the Type III only occurred in the four species of subgenus Aristolochia. Type I was found in A. mollissima, A. macrophylla, and A. kaempferi, and was characterized by trnH gene in IR region and LSC-IRb border located in rps19-trnH spacer. Type II was only found in A. moupinensis and A. kunmingensis and refers to LSC-IRb border within the rps19 gene. The trnH gene is intact and located upstream of rpl2 in IRb region for type I and II. Type III pattern was found in the four species of subgenus Aristolochia, characterized by LSC-IRb and SSC-IRa border in the rps19-rpl2 spacer and trnH gene, respectively. The trnH gene spanned the junction between IR-LSC regions in the four species of subgenus Aristolochia.
The shift of IR-LSC borders, caused by contraction and expansion of the gene trnH, is one of major differences between the plastomes of the subgenera Siphisia and Aristolochia. The whole gene duplication of trnH was detected in most monocots (e.g., Acorus, Phalaenopsi and Dioscorea), D. granadensis (Winteraceae) of magnoliids, and basal eudicots (Ranunculus japonica and Ranunculus macranthus) [34,37,38,39,40,41]. Wang et al. (2008) conducted RT-PCR assays and deduced that the duplicated trnH genes in most of non-monocots and monocots were regulated by different expression levels of promoters, and had distinct fates [37]. Within the family Aristolochiaceae, the trnH gene was located in the LSC region of S. henryi, 128 bp away from the border of LSC-IR, and was also a single copy in the six cp genomes of Asarum, but not sure the positions of the gene [29]. Furthermore, the study proposed that the low-complexity trnH region and ultimately inversion of a portion of the LSC were due to an AAT repeat. For inversion of a large portion of the LSC region, there were genes rearranged in SC-IR borders of sequenced species of Asarum, the IR boundaries of cp genomes of Asarum were highly variable and experienced positional shifts at borders. Such as there was an entirety of the SSC of As. canadense and As. sieboldii has been incorporated into the IR, and the boundary of the LSC-IR was found within rpl2 or rpl14 gene [29]. Within the species of S. henryi, rps19 pseudogene existed in the IRa region, with the length of 183 bp. The trnH-rps19 gene cluster had been used to distinguish monocots from other angiosperm for the organization of gene flanking the IR-SC junction [37,39]. The events of contraction or expansion of the IR regions also can be used to distinguish the species within Aristolochiaceae.

3.2. Inferring the Phylogeny and Species Identification of Aristolochia

Chloroplast genomes provide abundant resources significant for evolutionary, taxonomic, and phylogenetic studies [42,43,44]. The whole cp genomes and protein-coding genes have been successfully used to resolve phylogenetic relationships at multiple taxonomic levels during the past decade [45,46]. Repeats can lead to changes in genomic structure, and can be investigated to population genetics of allied taxa [47,48,49,50]. Repeats in ten cp genomes revealed that the repeats had a great number, comprised of 38–80 repeats (Figure 5 and Table S4), 66 and 138 repeats were respectively detected in A. debilis and A. contorta [28]. Given the variability of these repeats between lineages, they can be informative regions for developing genomic markers for phylogenetic analysis. SSRs, known as microsatellites, are tandemly repeated DNA sequences that consist of one–six nucleotide repeat units and are ubiquitous throughout the genomes [51]. A total number of 95–142 SSRs were identified in the seven cp genomes detected (Figure 6 and Table S5). According to the analysis of high variable regions, the hotspot regions within seven cp genomes also provide sufficient information sites to reveal phylogeny structure among species of family Aristolochiaceae, especially for the spacer ycf1 and rpl20, with high nucleotide diversity and under positive selection (Table 4). The ycf1 gene could be served as the barcode of land plants, and was also recognized as the most variable regions in plastid genome [50,52]. The gene rpl20 is an important part of protein synthesis, and is involved in translation [53]. This study will also provide a reference for phylogenomic studies of closely related lineages among Aristolochia and other genera.
Furthermore, we can design effective markers for clarifying the phylogenetic relationships of Aristolochia and elucidating the evolutionary history of species complex of Aristolochia at the population level, based on the analysis of SSR and SNP sites. Understanding genetic variation within and between populations plays an important role in improving genetic diversity and is essential for future adaptive changes, reproduction patterns, and its conservation [20,54,55]. The cpDNA and B-class gene PISTILLATA (PI) have been used to investigate taxonomy at the species complex, such as Aristolochia kaempferi group, and these studies revealed that its DNA barcoding and taxonomy are difficult to assess for multiple hybridization and introgression events in the group [56,57]. More genes under selection and neutral markers should be used to clarify those multiple diversification events. It will better to apply the full genome information or hyper-variation regions to elucidate the species diversity of Aristolochia.

4. Materials and Methods

4.1. Plant Material, DNA Extraction, and Sequencing

We selected seven species according to their potential medicinal uses, including A. kaempferi, A. kunmingensis, A. macrophylla, A. mollissima, and A. moupinensis from subgenus Siphisia and A. tagala and A. tubiflora of subgenus Aristolochia (Table 7). Genomic DNA was isolated from silica-gel dried leaf tissue or herbarium specimens using Plant Genomic DNA Kit (TIANGEN, Beijing, China). DNA integrity was examined by electrophoresis in 1% (w/v) agarose gel and their concentration was measured using a NanoDrop spectrophotometer 2000 (Thermo Scientific; Waltham, MA, USA). The DNA was used to construct PE libraries with insert sizes of 150 bp and sequenced according to the manufacturer’s manual for the Illumina Hiseq X.

4.2. Chloroplast Genome Assembly and Annotation

We used the software Trimmomatic version 0.36 (Max Planck Institute of Molecular Plant Physiology, Potsdam, Germany) [58] to trim the low-quality reads. We retrieved the plastome sequence of A. contorta (NC_036152.1), A. debilis (NC_036153.1), Asarum costatum (AP018513.1), Asarum minamitanianum (AP018514.1), and Asarum sakawanum (AP017908.1) from GenBank and used these sequences as the references [28,30,31]. The plastome was assembled using mapping to reference genome and de novo methods as implemented in Geneious R11 (Biomatters, Auckland, New Zealand) [59].
The cp genomes of the seven species was annotated using the online program Dual Organellar GenoMe Annotator (DOGMA) (University of Texas at Austin, Austin, TX, USA) [60], Annotation of Organellar Genomes (GeSeq) [61] and Chloroplast Genome Annotation, Visualization, Analysis, and GenBank Submission (CPGAVAS) (Institute of Medicinal Plant Development, Chinese Academy of Medical Sciences and Peking Union Medical College, Beijing, China) [62]. The tRNA genes were confirmed using tRNAscan-SE software (v2.0, University of California, Santa Cruz, CA, USA) [63]. Plastome annotations were manually corrected with the software Artemis [64]. The gene map was drawn using the Organelle Genome DRAW (OGDRAW) [65,66] with default settings and checked manually. The complete cp genome sequences of the seven species were deposited in GenBank, accession numbers are MK503927-MG503933 (Table S6).

4.3. Genome Structure Analyses

The distribution of codon usage was investigated using the software CodonW (University of Texas, Houston, TX, USA) with the RSCU value [67]. GC content was analyzed using Molecular Evolutionary Genetics Analysis (MEGA v6.0, Tokyo Metropolitan University, Tokyo, Japan) [68]. REPuter program (https://bibiserv.cebitec.uni-bielefeld.de/reputer) (University of Bielefeld, Bielefeld, Germany) [69] was used to identify the size and location of repeat sequences, including forward, palindromic, reverse, and complement repeats in the seven cp genomes. For all repeat types, the minimal size was set as 30 bp and the two repeat copies had at least 90% similarity. Perl script MISA (https://webblast.ipk-gatersleben.de/misa/) [70] was used to detect microsatellites (mono-, di-, tri-, tetra-, penta-, hexanucleotide repeats) with the following thresholds (unit size, min repeats): ten repeat units for mononucleotide SSRs, five repeat units for dinucleotide SSRs, four repeat units for trinucleotide SSRs, and three repeat units each for tetra-, penta-, and hexanucleotide SSRs.

4.4. Positive Selection Analysis

To identify the genes under selection, we scanned the cp genomes of seven species within Piperales using codeml of the package PAML4 [71,72]. The software was used for calculating the non-synonymous (dN) and synonymous (dS) substitution rates, along with their ratios (ω = dN/dS). The analyses of selective pressures were conducted along the ML tree in Newick format (S7), which based on the whole CDS region was used to determine the phylogenetic relationships of these seven species. Each single-copy CDS sequences was aligned according to their amino acid sequence. We used the site-specific model with five site models (M0, M1a & M2a, M7 & M8) were employed to identify the signatures of adaptation across cp genomes. This model allowed the ω ratio to vary among sites, with a fixed ω ratio in all the branches. Comparing the site-specific model, M1a (nearly neutral) vs. M2a (positive selection) and M7 (β) vs. M8 (β & ω) were calculated in order to detect positive selection [73]. Likelihood ratio test (LRT) of the comparison (M1a vs. M2a and M7 vs. M8) was used respectively to evaluate of the selection strength and the p value of Chi square (χ²) smaller than 0.05 is thought as significant. The Bayes Empirical Bayes (BEB) inference [74] was implemented in site models M2a and M8 to estimate the posterior probabilities and positive selection pressures of the selected genes.

4.5. Genome Comparison and Nucleotide Variation Analysis

The whole-genome (minus a copy of IR region) alignment for the cp genomes of the seven species including our A. moupinensis, A. kunmingensis, A. tubiflora and four reported species (A. contorta, As. canadense, S. henryi and P. cenocladum) of Piperales, was performed and plotted by the mVISTA program (http://genome.lbl.gov/vista/mvista/submit.shtml) in Shuffle-LAGAN model [75,76], and with A. moupinensis as the reference. The seven cp genomes of Aristolochia were first aligned using MAFFT v7 [77] and then manually adjusted using BioEdit v7.0.9 [78]. Variable sites and nucleotide variability across complete cp genomes, LSC, IR, SSC, and CDS regions of seven species were calculated using DnaSP v5 [79]. Furthermore, for the seven cp genomes minus a copy IR region, a sliding window analysis was conducted to evaluate the nucleotide variability using DnaSP software. The step size was set to 200 base pairs, and the window length was set to 600 base pairs.

4.6. Phylogenetic Analyses

To estimate phylogenetic relationships within the Aristolochiaceae, plastomes of 18 taxa were compared, including nine samples from Aristolochia, six and one cp genomes from Asarum and Saruma, respectively (Table S5). A total of 11 cp genomes were downloaded from the NCBI database. In the phylogenetic analyses, P. auritum and P. cenocladum of Piper were used as outgroup. Phylogenetic trees were constructed by MP, ML and BI methods using the cp genomes, LSC, SSC, IR, CDS and hotspots regions. The sequences of the involved regions were aligned using MAFFT v7. MP analysis was performed with PAUP*4.0b10 [80], using a heuristic search performed 1000 replications and tree bisection-reconnection (TBR) branch swapping. BI was conducted using the program MrBayes v3.2 [81] with the GTR+I+G model at the CIPRES Science Gateway website (http://www.phylo.org/) [82]. The Markov Chain Monte Carlo (MCMC) analysis was run for 2,000,000 generations, sampling every 1000 generations. The posterior probabilities (PP) of the phylogeny and its branches were determined from the combined set of trees, discarding the first 25% trees of each run as burn-in, as determined by Tracer v1.7 [83]. Maximum likelihood phylogenies were constructed by a fast and effective stochastic algorithm using IQ-TREE v1.6.2 [84] with the Best-fit model by ModelFinder [85] according to Bayesian information criterion (BIC) and the robustness of the topology was estimated using 2000 bootstrap replicates. Figtree v1.4 (http://tree.bio.ed.ac.uk/software/figtree/) [86] was used to visualize and annotate trees.

5. Conclusions

The complete cp genomes of A. kaempferi, A. kunmingensis, A. macrophylla, A. mollissima, and A. moupinensis of the subgenus Siphisia, and A. tagala and A. tubiflora of the subgenus Aristolochia were reported in this study. The cp genomes length and gene content of the genus Aristolochia were comparatively conserved. Although genomic structure and size were highly conserved, the IR-SC boundary regions were variable between these nine cp genomes of Aristolochia. The whole duplicated trnH gene within five species of Siphisia is one of major differences between the plastomes of the subgenera Siphisia and Aristolochia. We also identified SSR sites, five positive selection sites and 16 variable regions, which provide a reference for developing tools to further study Aristolochia species. Furthermore, the phylogenetic constructions with six datasets of 18 cp genomes illustrated robust and consistent relationships with high supports.

Supplementary Materials

Supplementary materials can be found at https://www.mdpi.com/1422-0067/20/5/1045/s1.

Author Contributions

X.L. performed the experiments, analyzed the data, and wrote the manuscript; Y.Z. assembled sequences and revised the manuscript; X.Z. and S.L. collected, identified plant materials and gave suggestions to the manuscript; J.M. revised the manuscript. All authors have read and approved the final manuscript.

Funding

This work was supported by the National Natural Science Foundation of China (No. 31370225).

Acknowledgments

The authors give special thanks to Shuwan Li, Yuan Wang, Zhanghua Wang, and Zhixiang Hua for collecting plant material. We acknowledged someone for their assistance with fieldwork, for data analysis, for giving comments on the manuscript paper. Our sincere thanks are also to the anonymous reviewers for their comments and suggestions.

Conflicts of Interest

The authors declare no conflict of interest.

Abbreviations

RSCURelative synonymous codon usage
NGSNext-generation sequencing
TLAThree letter acronym
SSRSimple sequence repeats
ATPAdenosine triphosphate
MPMaximum parsimony
MLMaximum likelihood
PiNucleotide diversity
BIBayesian Inference
AAsAristolochic acids
LSCLarge single copy
SSCSmall single copy
CDSCoding sequence
IRInverted repeat
SCSingle copy
CPChloroplast

References

  1. Neinhuis, C.; Wanke, S.; Hilu, K.W.; Müller, K.; Borsch, T. Phylogeny of Aristolochiaceae based on parsimony, likelihood, and Bayesian analyses of trnL-trnF sequences. Plant Syst. Evol. 2005, 250, 7–26. [Google Scholar] [CrossRef]
  2. Wagner, S.T.; Isnard, S.; Rowe, N.P.; Samain, M.S.; Neinhuis, C.; Wanke, S. Escaping the lianoid habit: Evolution of shrub-like growth forms in Aristolochia subgenus Isotrema (Aristolochiaceae). Am. J. Bot. 2012, 99, 1609–1629. [Google Scholar] [CrossRef] [PubMed]
  3. Feng, Y.X.; Lin, S.Q.; Zhang, X.Q. Botanical and pharmacognostical studies of Chinese Aristolochia: Resource utilization. Acta Pharm. Sin. 1983, 18, 291–298. [Google Scholar]
  4. Ma, J.S. Medicinal resources of Aristolochia in China. Chin. Wild Plant Resour. 1988, 3, 31–34. [Google Scholar]
  5. Chen, C.H.; Dickman, K.G.; Moriya, M.; Zavadil, J.; Sidorenko, V.S.; Edwards, K.L.; Gnatenkod, D.V.; Wu, L.; Turesky, R.J.; Wu, X.R.; et al. Aristolochic acid-associated urothelial cancer in Taiwan. Proc. Natl. Acad. Sci. USA 2012, 109, 8241–8246. [Google Scholar] [CrossRef] [PubMed] [Green Version]
  6. Wu, L.; Sun, W.; Wang, B.; Zhao, H.; Li, Y.; Cai, S.; Li, X.; Zhu, Y.J.; Yao, H.; Song, J.Y.; et al. An integrated system for identifying the hidden assassins in traditional medicines containing aristolochic acids. Sci. Rep. 2015, 5, 11318. [Google Scholar] [CrossRef] [PubMed] [Green Version]
  7. Tsai, D.M.; Kang, J.J.; Lee, S.S.; Wang, S.Y.; Tsai, I.; Chen, G.Y.; Liao, H.W.; Chu, L.W.; Kuo, C.H.; Tseng, Y.J. Metabolomic analysis of complex Chinese remedies: Examples of induced nephrotoxicity in the mouse from a series of remedies containing aristolochic acid. Evid.-Based Complement. Altern. Med. 2013, 2013, 263757. [Google Scholar] [CrossRef] [PubMed]
  8. Ng, A.W.T.; Poon, S.L.; Huang, M.N.; Lim, J.Q.; Boot, A.; Yu, W.; Suzuki, Y.; Thangaraju, S.; Ng, C.C.Y.; Tan, P.; et al. Aristolochic acids and their derivatives are widely implicated in liver cancers in Taiwan and throughout Asia. Sci. Transl. Med. 2017, 9, eaan6446. [Google Scholar] [CrossRef] [PubMed]
  9. Martena, M.J.; Van der Wielen, J.C.A.; Van de Laak, L.F.J.; Konings, E.J.M.; de Groot, H.N.; Rietjens, I.M.C.M. Enforcement of the ban on aristolochic acids in chinese traditional herbal preparations on the dutch market. Anal. Bioanal. Chem. 2007, 389, 263–275. [Google Scholar] [CrossRef] [PubMed]
  10. Lawrence, M.K.; González, F.A. Phylogenetic Relationships in Aristolochiaceae. Syst. Bot. 2003, 28, 236–249. [Google Scholar] [CrossRef]
  11. Wanke, S.; Jaramillo, M.A.; Borsch, T.; Samain, M.S.; Quandt, D.; Neinhuis, C. Evolution of Piperales-matK gene and trnK intron sequence data reveal lineage specific resolution contrast. Mol. Phylogenet. Evol. 2007, 42, 477–497. [Google Scholar] [CrossRef] [PubMed]
  12. Lawrence, M.K. A cladistic analysis of Asarum and implications for the evolution of Herkogamy. Am. J. Bot. 1997, 84, 1752–1765. [Google Scholar]
  13. Lawrence, M.K. Phylogenetic relationships in Asarum (Aristolochiaceae) based on morphology and ITS sequences. Am. J. Bot. 1998, 85, 1454–1467. [Google Scholar]
  14. González, F.A.; Stevenson, D.W. A phylogenetic analysis of the subfamily Aristolochioideae (Aristolochiaceae). Rev. Acad. Colomb. Cienc. 2002, 66, 59–65. [Google Scholar]
  15. Ohi-Toma, T.; Sugawara, T.; Neihuis, C.; Murata, H.; Wanke, S.; Murata, J. Molecular phylogeny of Aristolochia sensu lato(Aristolochiaceae) based on sequences of rbcL, matK, and phyA genes, with special reference to differentiation of chromosome numbers. Syst. Bot. 2006, 31, 481–492. [Google Scholar] [CrossRef]
  16. Wanke, S.; Samain, M.S.; Vanderschaeve, L.; Mathieu, G.; Goetghebeur, P.; Neinhuis, C. Phylogeny of the genus Peperomia (Piperaceae) inferred from the trnK/matK region (cpDNA). Plant Biol. 2006, 8, 93–102. [Google Scholar] [CrossRef] [PubMed]
  17. González, F.; Wagner, S.T.; Salomo, K.; Symmank, L.; Samain, M.-S.; Isnard, S.; Rowe, N.P.; Neinhuis, C.; Wanke, S.; Carine, M. Present trans-Pacific disjunct distribution of Aristolochia subgenus Isotrema (Aristolochiaceae) was shaped by dispersal, vicariance and extinction. J. Biogeogr. 2014, 41, 380–391. [Google Scholar] [CrossRef]
  18. Dechbumroong, P.; Aumnouypol, S.; Denduangboripant, J.; Sukrong, S. DNA barcoding of Aristolochia plants and development of species-specific multiplex PCR to aid HPTLC in ascertainment of Aristolochia herbal materials. PLoS ONE 2018, 13, e0202625. [Google Scholar] [CrossRef] [PubMed]
  19. Sarma, B.; Tanti, B. Analysis of genetic diversity of certain species of Aristolochia using ISSR-based molecular markers. Curr. Life Sci. 2017, 3, 47–53. [Google Scholar] [CrossRef]
  20. Yang, Z.Y.; Yi, T.S.; Zeng, L.Q.; Gong, X. The population genetic structure and diversification of Aristolochia delavayi (Aristolochiaceae), an endangered species of the dry hot valleys of the Jinsha River, southwestern China. Botany 2014, 92, 579–587. [Google Scholar] [CrossRef]
  21. Douglas, S.E. Plastid evolution: Origins, diversity, trends. Curr. Opin. Genet. Dev. 1998, 8, 655–661. [Google Scholar] [CrossRef]
  22. Moore, M.J.; Bell, C.D.; Soltis, P.S.; Soltis, D.E. Using plastid genome-scale data to resolve enigmatic relationships among basal angiosperms. Proc. Natl. Am. Sci. USA 2007, 104, 19363–19368. [Google Scholar] [CrossRef] [PubMed] [Green Version]
  23. Yang, J.B.; Yang, S.X.; Li, H.T.; Jing, Y.; Li, D.Z. Comparative chloroplast genomes of Camellia species. PLoS ONE 2013, 8, e73053. [Google Scholar] [CrossRef] [PubMed]
  24. Huang, H.; Shi, C.; Liu, Y.; Mao, S.; Gao, L. Thirteen Camellia chloroplast genome sequences determined by high-throughput sequencing: Genome structure and phylogenetic relationships. BMC Evol. Boil. 2014, 14, 151. [Google Scholar] [CrossRef] [PubMed]
  25. Lei, W.; Ni, D.; Wang, Y.; Shao, J.; Wang, X.; Yang, D.; Wang, J.S.; Chen, H.M.; Liu, C. Intraspecific and heteroplasmic variations, gene losses and inversions in the chloroplast genome of Astragalus Membranaceus. Sci. Rep. 2016, 6, 21669. [Google Scholar] [CrossRef] [PubMed]
  26. Jansen, R.K.; Raubeson, L.A.; Boore, J.L.; Depamphilis, C.W.; Chumley, T.W.; Haberle, R.C. Methods for obtaining and analyzing whole chloroplast genome sequences. Methods Enzymol. 2005, 395, 348–384. [Google Scholar] [PubMed]
  27. Wicke, S.; Schneeweiss, G.M.; Depamphilis, C.W.; Müller, K.F.; Quandt, D. The evolution of the plastid chromosome in land plants: Gene content, gene order, gene function. Plant Mol. Biol. 2011, 76, 273–297. [Google Scholar] [CrossRef] [PubMed]
  28. Zhou, J.G.; Chen, X.L.; Cui, Y.X.; Sun, W.; Li, Y.H.; Wang, Y.; Song, J.Y.; Yao, H. Molecular Structure and Phylogenetic Analyses of Complete Chloroplast Genomes of Two Aristolochia Medicinal Species. Int. J. Mol. Sci. 2017, 18, 1839. [Google Scholar] [CrossRef] [PubMed]
  29. Sinn, B.T.; Sedmak, D.D.; Kelly, L.M.; Freudenstein, J.V. Total duplication of the small single copy region in the angiosperm plastome: Rearrangement and inverted repeat instability in Asarum. Am. J. Bot. 2018, 105, 71–84. [Google Scholar] [CrossRef] [PubMed]
  30. Takahashi, D.; Sakaguchi, S.; Isagi, Y.; Setoguchi, H. Comparative chloroplast genomics of series Sakawanum in genus Asarum (Aristolochiaceae) to develop single nucleotide polymorphisms (SNPs) and simple sequence repeat (SSR) markers. J. For. Res. 2018, 23, 387–392. [Google Scholar] [CrossRef]
  31. Sakaguchi, S.; Ueno, S.; Tsumura, Y. Application of a simplified method of chloroplast enrichment to small amounts of tissue for chloroplast genome sequencing. Appl. Plant Sci. 2017, 5, 1700002. [Google Scholar] [CrossRef] [PubMed]
  32. NCBI. Genome. Available online: https://www.ncbi.nlm.nih.gov/ (accessed on 14 January 2019).
  33. Xu, J.W.; Feng, D.J.; Song, G.S.; Wei, X.L.; Chen, L.; Wu, X.L.; Li, X.G.; Zhu, Z. The first intron of rice epsp synthase enhances expression of foreign gene. Sci. China Life Sci. 2003, 46, 561–569. [Google Scholar] [CrossRef] [PubMed]
  34. Raubeson, L.A.; Peery, R.; Chumley, T.W.; Dziubek, C.; Fourcade, H.M.; Boore, J.L.; Jansen, R.K. Comparative chloroplast genomics: Analyses including new sequences from the angiosperms Nuphar advena and Ranunculus Macranthus. BMC Genom. 2007, 8, 174. [Google Scholar] [CrossRef] [PubMed]
  35. Yang, M.; Zhang, X.; Liu, G.; Yin, Y.; Chen, K.; Yun, Q.; Zhao, D.J.; Al-Mssallem, I.S.; Yu, J. The complete chloroplast genome sequence of date palm (Phoenix dactylifera L.). PLoS ONE 2010, 5, e12762. [Google Scholar] [CrossRef] [PubMed]
  36. Kim, K.J.; Lee, H.L. Complete chloroplast genome sequences from Korean Ginseng (Panax schinseng Nees) and comparative analysis of sequence evolution among 17 vascular plants. DNA Res. 2004, 11, 247–261. [Google Scholar] [CrossRef] [PubMed]
  37. Wang, R.J.; Cheng, C.L.; Chang, C.C.; Wu, C.L.; Su, T.M.; Chaw, S.M. Dynamics and evolution of the inverted repeat-large single copy junctions in the chloroplast genomes of monocots. BMC Evol. Boil. 2008, 8, 36. [Google Scholar] [CrossRef] [PubMed]
  38. Huotari, T.; Korpelainen, H. Complete chloroplast genome sequence of Elodea canadensis and comparative analyses with other monocot plastid genomes. Gene 2012, 508, 96–105. [Google Scholar] [CrossRef] [PubMed]
  39. Luo, Y.; Ma, P.F.; Li, H.T.; Yang, J.B.; Wang, H.; Li, D.Z. Plastid phylogenomic analyses resolve Tofieldiaceae as the root of the early diverging monocot order Alismatales. Genome Biol. Evol. 2016, 8, 932–945. [Google Scholar] [CrossRef] [PubMed]
  40. Cai, Z.Q.; Penaflor, C.; Kuehl, J.V.; Leebens-Mack, J.; Carlson, J.E.; Pamphilis, C.W.D.; Boore, J.L.; Jansen, R.K. Complete plastid genome sequences of Drimys, Liriodendron, and Piper: Implications for the phylogenetic relationships of magnoliids. BMC Evol. Boil. 2006, 6, 77. [Google Scholar] [CrossRef]
  41. Chang, C.C.; Lin, H.C.; Lin, I.; Chow, T.Y.; Chen, H.H.; Chen, W.H.; Cheng, C.H.; Lin, C.Y.; Liu, S.M.; Chang, C.C.; et al. The chloroplast genome of Phalaenopsis aphrodite (Orchidaceae): Comparative analysis of evolutionary rate with that of grasses and its phylogenetic implications. Mol. Biol. Evol. 2006, 23, 279–291. [Google Scholar] [CrossRef] [PubMed]
  42. Borsch, T.; Quandt, D. Mutational dynamics and phylogenetic utility of noncoding chloroplast DNA. Plant Syst. Evol. 2009, 282, 169–199. [Google Scholar] [CrossRef]
  43. Dong, W.P.; Liu, J.; Yu, J.; Wang, L.; Zhou, S.L. Highly variable chloroplast markers for evaluating plant phylogeny at low taxonomic levels and for DNA barcoding. PLoS ONE 2012, 7, e35071. [Google Scholar] [CrossRef] [PubMed]
  44. Tong, W.; Kim, T.S.; Park, Y.J. Rice chloroplast genome variation architecture and phylogenetic dissection in diverse Oryza species assessed by whole-genome resequencing. Rice 2016, 9, 57. [Google Scholar] [CrossRef] [PubMed]
  45. Dong, W.P.; Liu, H.; Xu, C.; Zuo, Y.J.; Chen, Z.J.; Zhou, S.L. A chloroplast genomic strategy for designing taxon specific DNA mini-barcodes: A case study on ginsengs. BMC Genet. 2014, 15, 138. [Google Scholar] [CrossRef] [PubMed]
  46. Du, Y.P.; Bi, Y.; Yang, F.P.; Zhang, M.F.; Chen, X.Q.; Xue, J.; Zhang, X.H. Complete chloroplast genome sequences of Lilium: Insights into evolutionary dynamics and phylogenetic analyses. Sci. Rep. 2017, 7, 5751. [Google Scholar] [CrossRef] [PubMed]
  47. Timme, R.E.; Kuehl, J.V.; Boore, J.L.; Jansen, R.K. A comparative analysis of the Lactuca and Helianthus (Asteraceae) plastid genomes: Identification of divergent regions and categorization of shared repeats. Am. J. Bot. 2007, 94, 302–312. [Google Scholar] [CrossRef] [PubMed]
  48. Nie, X.J.; Lv, S.Z.; Zhang, Y.X.; Du, X.H.; Wang, L.; Biradar, S.S.; Tan, X.F.; Wan, F.H.; Song, W.N. Complete chloroplast genome sequence of a major invasive species, crofton weed (Ageratina adenophora). PLoS ONE 2012, 7, e36869. [Google Scholar] [CrossRef] [PubMed]
  49. Huang, J.; Chen, R.H.; Li, X.G. Comparative analysis of the complete chloroplast genome of four known Ziziphus species. Genes 2017, 8, 340. [Google Scholar] [CrossRef] [PubMed]
  50. Gu, C.H.; Tembrock, L.R.; Zheng, S.Y.; Wu, Z.Q. The complete chloroplast genome of Catha edulis: A comparative analysis of genome features with related species. Int. J. Mol. Sci. 2018, 19, 525. [Google Scholar] [CrossRef] [PubMed]
  51. Powell, W.; Morgante, M.; Mcdevitt, R.; Vendramin, G.G.; Rafalski, J.A. Polymorphic simple sequence repeat regions in chloroplast genomes: Applications to the population genetics of pines. Proc. Natl. Acad. Sci. USA 1995, 92, 7759–7763. [Google Scholar] [CrossRef] [PubMed]
  52. Dong, W.P.; Xu, C.; Li, C.H.; Sun, J.H.; Zuo, Y.J.; Shi, S.; Cheng, T.; Guo, J.J.; Zhou, S.L. ycf1, the most promising plastid DNA barcode of land plants. Sci. Rep. 2015, 5, 8348. [Google Scholar] [CrossRef] [PubMed]
  53. Muto, A.; Ushida, C. Transcription and translation. Methods Cell Biol. 1995, 48, 483. [Google Scholar]
  54. Koren, O.G.; Nakonechnaya, O.V.; Zhuravlev, Y.N. Genetic structure of natural populations of the relict species Aristolochia manshuriensis (Aristolochiaceae) in disturbed and intact habitats. Russ. J. Genet. 2009, 45, 678–684. [Google Scholar] [CrossRef]
  55. Nakonechnaya, O.V.; Kholina, A.B.; Koren, O.G.; Zhuravlev, Y.N. Genetic diversity of a rare species Aristolochia contorta Bunge (Aristolochiaceae) in Primorsky krai. Russ. J. Genet. 2012, 48, 152–162. [Google Scholar] [CrossRef]
  56. Watanabe, K.; Kajita, T.; Murata, J. Chloroplast DNA and variation and geographical structure of the Aristolochia kaempferi group (Aristolochiaceae). Am. J. Bot. 2006, 93, 442–453. [Google Scholar] [CrossRef] [PubMed]
  57. Watanabe, K.; Ohi-Toma, T.; Murata, J. Multiple hybridization in the Aristolochia kaempferi group (Aristolochiaceae): Evidence from reproductive isolation and molecular phylogeny. Am. J. Bot. 2008, 95, 885–896. [Google Scholar] [CrossRef] [PubMed]
  58. Bolger, A.; Lohse, M.; Usadel, B. Trimmomatic: A flexible trimmer for Illumina sequence data. Bioinformatics 2014, 30, 2114–2120. [Google Scholar] [CrossRef] [PubMed]
  59. Drummond, A.J.; Ashton, B.; Buxton, S.; Cheung, M.; Cooper, A.; Duran, C.; Field, M. Geneious; Version 5.3+; Biomatters: Auckland, New Zealand, 2011. [Google Scholar]
  60. Wyman, S.K.; Jansen, R.K.; Boore, J.L. Automatic annotation of organelle genomes with DOGMA. Bioinformatics 2004, 20, 3252–3255. [Google Scholar] [CrossRef] [PubMed]
  61. Tillich, M.; Lehwark, P.; Pellizzer, T.; Ulbrichtjones, E.S.; Fischer, A.; Bock, R.; Greiner, S. Geseq—Versatile and accurate annotation of organelle genomes. Nucleic Acids Res. 2017, 45, W6–W11. [Google Scholar] [CrossRef] [PubMed]
  62. Liu, C.; Shi, L.C.; Zhu, Y.; Chen, H.M.; Zhang, J.H.; Lin, X.H.; Guan, X.J. CpGAVAS, an integrated web server for the annotation, visualization, analysis, and GenBank submission of completely sequenced chloroplast genome sequences. BMC Genom. 2012, 13, 715. [Google Scholar] [CrossRef] [PubMed]
  63. Schattner, P.; Brooks, A.N.; Lowe, T.M. The tRNAscan-SE, snoscan and snoGPS web servers for the detection of tRNAs and snoRNAs. Nucleic Acids Res. 2005, 33, W686–W689. [Google Scholar] [CrossRef] [PubMed]
  64. Carver, T.; Harris, S.R.; Berriman, M.; Parkhill, J.; Mcquillan, J.A. Artemis: An integrated platform for visualization and analysis of high-throughput sequence-based experimental data. Bioinformatics 2012, 28, 464–469. [Google Scholar] [CrossRef] [PubMed]
  65. Lohse, M.; Drechsel, O.; Bock, R. Organellargenomedraw (OGDRAW): A tool for the easy generation of high-quality custom graphical maps of plastid and mitochondrial genomes. Curr. Genet. 2007, 52, 267–274. [Google Scholar] [CrossRef] [PubMed]
  66. Lohse, M.; Drechsel, O.; Kahlau, S.; Bock, R. OrganellarGenomeDRAW—A suite of tools for generating physical maps of plastid and mitochondrial genomes and visualizing expression data sets. Nucleic Acids Res. 2013, 41, W575–W581. [Google Scholar] [CrossRef] [PubMed]
  67. Sharp, P.M.; Li, W.H. The codon adaptation index—A measure of directional synonymous codon usage bias, and its potential applications. Nucleic Acids Res. 1987, 15, 1281–1295. [Google Scholar] [CrossRef] [PubMed]
  68. Koichiro, T.; Glen, S.; Daniel, P.; Alan, F.; Sudhir, K. MEGA6: Molecular Evolutionary Genetics Analysis Version 6.0. Mol. Biol. Evol. 2013, 30, 2725–2729. [Google Scholar] [Green Version]
  69. Kurtz, S.; Choudhuri, J.V.; Ohlebusch, E.; Schleiermacher, C.; Stoye, J.; Giegerich, R. Reputer: The manifold applications of repeat analysis on a genomic scale. Nucleic Acids Res. 2001, 29, 4633–4642. [Google Scholar] [CrossRef] [PubMed]
  70. Thiel, T.; Michalek, W.; Varshney, R.K.; Graner, A. Exploiting EST databases for the development and characterization of gene-derived SSR-markers in barley (Hordeum vulgare L.). Theor. Appl. Genet. 2003, 106, 411–422. [Google Scholar] [CrossRef] [PubMed]
  71. Yang, Z. PAML: A program package for phylogenetic analysis by maximum likelihood. Bioinformatics 1997, 13, 555–556. [Google Scholar] [CrossRef]
  72. Yang, Z. PAML 4: Phylogenetic analysis by maximum likelihood. Mol. Biol. Evol. 2007, 24, 1586–1591. [Google Scholar] [CrossRef] [PubMed]
  73. Yang, Z.; Nielsen, R. Codon-substitution models for detecting molecular adaptation at individual sites along specific lineages. Mol. Biol. Evol. 2002, 19, 908–917. [Google Scholar] [CrossRef] [PubMed]
  74. Yang, Z.; Wong, W.S.W.; Nielsen, R. Bayes empirical bayes inference of amino acid sites under positive selection. Mol. Biol. Evol. 2005, 22, 1107–1118. [Google Scholar] [CrossRef] [PubMed]
  75. Brudno, M.; Malde, S.; Poliakov, A.; Do, C.B.; Couronne, O.; Dubchak, I.; Batzoglou, S. Glocal alignment: Finding rearrangements during alignment. Bioinformatics 2003, 19, i54–i62. [Google Scholar] [CrossRef] [PubMed]
  76. Frazer, K.A.; Pachter, L.; Poliakov, A.; Rubin, E.M.; Dubchak, I. Vista: Computational tools for comparative genomics. Nucleic Acids Res. 2004, 32, w273–w279. [Google Scholar] [CrossRef] [PubMed]
  77. Katoh, K.; Misawa, K.; Kuma, K.; Miyata, T. MAFFT: A novel method for rapid multiple sequence alignment based on fast fourier transform. Nucleic Acids Res. 2002, 30, 3059–3066. [Google Scholar] [CrossRef] [PubMed]
  78. Hall, T.A. Bioedit: A user-friendly biological sequence alignment editor and analysis program for windows 95/98/NT. Nucleic Acids Symp. Ser. 1999, 41, 95–98. [Google Scholar]
  79. Rozas, J.; Sánchez-DelBarrio, J.C.; Messeguer, X.; Rozas, R. Dnasp, dna polymorphism analyses by the coalescent and other methods. Bioinformatics 2003, 19, 2496–2497. [Google Scholar] [CrossRef] [PubMed]
  80. Swofford, D.L. PAUP*: Phylogenetic Analysis Using Parsimony, Distance, and Likelihood; Version 4; Sinauer: Sunderland, MA, USA, 2002. [Google Scholar]
  81. Ronquist, F.; Teslenko, M.; Van Der Mark, P.; Ayres, D.L.; Darling, A.; Höhna, S.; Larget, B.; Liu, L.; Suchard, M.A.; Huelsenbeck, J.P. MrBayes 3.2: Efficient Bayesian phylogenetic inference and model choice across a large model space. Syst. Biol. 2012, 61, 539–542. [Google Scholar] [CrossRef] [PubMed]
  82. Miller, M.A.; Pfeiffer, W.; Schwartz, T. Creating the CIPRES Science Gateway for inference of large phylogenetic trees. GCE 2010, 14, 1–8. [Google Scholar]
  83. Rambaut, A.; Drummond, A.J.; Xie, D.; Baele, G.; Suchard, M.A. Posterior summarization in bayesian phylogenetics using Tracer 1.7. Syst. Biol. 2018, 10, 901–904. [Google Scholar] [CrossRef] [PubMed]
  84. Nguyen, L.T.; Schmidt, H.A.; Von Haeseler, A.; Minh, B.Q. IQ-tree: A fast and effective stochastic algorithm for estimating maximum-likelihood phylogenies. Mol. Biol. Evol. 2015, 32, 268–274. [Google Scholar] [CrossRef] [PubMed]
  85. Kalyaanamoorthy, S.; Bui, M.Q.; Wong, T.K.F.; Von Haeseler, A.; Jermiin, L.S. ModelFinder: Fast model selection for accurate phylogenetic estimates. Nat. Methods 2017, 14, 587–589. [Google Scholar] [CrossRef] [PubMed]
  86. Figtree v1.4. Available online: http://tree.bio.ed.ac.uk/software/figtree/ (accessed on 14 January 2019).
Figure 1. Gene maps of the complete cp genome of seven species of Aristolochia. Gene map of cp genome of (A) Aristolochia manshuriensis; (B) Aristolochia kaempferi, Aristolochia macrophylla, Aristolochia mollissima and Aristolochia kunmingensis; (C) Aristolochia tagala and Aristolochia tubiflora. Genes on the inside of the circle are transcribed clockwise, while those outside are transcribed counter clockwise. The darker gray in the inner circle corresponds to GC content, whereas the lighter gray corresponds to AT content.
Ijms 20 01045 g001aIjms 20 01045 g001bIjms 20 01045 g001c
Figure 2. The GC (%) composition in different positions of coding sequence (CDS) region of species within Aristolochia.
Ijms 20 01045 g002
Figure 3. Comparison of the borders of large single copy (LSC), small single copy (SSC) and inverted repeat (IR) regions among 13 cp genomes. Number above the gene features means the distance between the ends of genes and the borders sites. These features are not to scale.
Ijms 20 01045 g003
Figure 4. Codon content of 20 amino acid and stop codons in all protein-coding genes of the seven cp genomes. The histogram from the left-hand side of each amino acid shows codon usage within Aristolochia (From left to right: A. tagala, A. tubiflora, A. moupinensis, A. kunmingensis, A. kaempferi, A. macrophylla, and A. mollissima).
Ijms 20 01045 g004
Figure 5. Repeat sequences in ten cp genomes. REPuter was used to identify repeat sequences with length ≥ 30 bp and sequence identity ≥ 90% in the cp genomes. F, P, R, and C indicate the repeat types F (forward), P (palindrome), R (reverse), and C (complement), respectively. Repeats with different lengths are indicated in different colors.
Ijms 20 01045 g005
Figure 6. Frequency of simple sequence repeats (SSRs) in the ten cp genomes.
Ijms 20 01045 g006
Figure 7. Sequence identity plot compared seven cp genomes with A. moupinensis as a reference by using mVISTA. Grey arrows and thick black lines above the alignment indicate genes with their orientation and the position of the IRs, respectively. A cut-off of 70% identity was used for the plots, and the Y-scale represents the percent identity from 50% to 100%.
Ijms 20 01045 g007
Figure 8. Sliding window analysis of the entire cp genome of seven Aristolochia species (window length: 600 bp; step size: 200 bp). X-axis: position of the midpoint of a window; Y-axis: nucleotide diversity of each window.
Ijms 20 01045 g008
Figure 9. Phylogenetic relationships of the 18 species inferred from maximum parsimony (MP), maximum likelihood (ML), and Bayesian (BI) analyses. (A) The topology was constructed by cp genomes, LSC, SSC, CDS, and hotspots regions; (B) tree constructed by IR region. Bayesian posterior probability values < 0.95 or Bootstrap values < 90 were marked on the branches. The support values in node (a): 1/86/93 (using LSC region), 0.97/78/84 (SSC), 0.82/-/- (CDS), and 1/81/80 (hotspots); (b): 1/90/79 (SSC) and 1/73/71 (hotspots). Numbers above nodes are support values with Bayesian posterior probabilities values on the left, ML bootstrap values in the middle, and MP bootstrap values on the right. “ - “ indicates the value < 70.
Ijms 20 01045 g009
Table 1. Summary of complete chloroplast (cp) genomes of Aristolochia species.
SpeciesTotalLSCIRSSCCDSTotalProtein Coding GenestRNArRNAGC%
A. kaempferi159,61288,89025,68119,36079191.01137930438.8
A. kunmingensis160,05189,30825,69819,34779143.01137930438.7
A. macrophylla160,49389,78825,66419,37779116.01137930438.6
A. mollissima159,65388,94825,68119,33879194.01137930438.8
A. moupinensis159,37488,65225,70019,32278753.01137930438.7
A. tagala159,30889,41425,24219,41078582.01137930438.5
A. tubiflora160,52089,85925,43119,79978624.01137930438.8
Table 2. Gene contents in the cp genomes of Aristolochia species.
No.Group of GenesGenes NamesAmount
1Photosystems IpsaA, psaB, psaC, psaI, psaJ5
2Photosystems IIpsbA, psbB, psbC, psbE, psbF, psbH, psbI, psbJ, psbK, psbL, psbM, psbN, psbT, psbZ15
3Cytochrome b/f complexpetA, petB *, petD *, petG, petL, petN6
4ATP synthaseatpA, atpB, atpE, atpF *, atpH, atpI6
5NADH dehydrogenasendhA *, ndhB *(x2), ndhC, ndhD, ndhE, ndhF, ndhG, ndhH, ndhI, ndhJ, ndhK12 (1)
6Rubisco large subunitrbcL1
7RNA polymeraserpoA, rpoB, rpoC1 *, rpoC24
8Ribosomal proteins(SSU)rps2, rps3, rps7(x2), rps8, rps11, rps12 **(x2), rps14, rps15, rps16 *, rps18, rps1914 (2)
9Ribosomal proteins(LSU)rpl2 *(x2), rpl14, rpl16 *, rpl20, rpl22, rpl23(x2), rpl32, rpl33, rpl3611 (2)
10Assembly/stability of photosystem Iycf3 **, ycf42
11Transfer RNAs37/38 tRNAs (6 contain an intron, 7/8 in the IRs)37 (7)/38(8)
12Ribosomal RNAsrrn4.5(x2), rrn5(x2), rrn16(x2), rrn23(x2)8 (8)
13RNA processingmatK1
14Carbon metabolismcemA1
15Cytochrome c synthesisccsA1
16Proteins of unknown functionycf1, ycf2(x2)3 (1)
17Other genesaccD, clpP **, infA3
* Gene contains one intron; ** gene contains two introns; (x2) indicates the number of the repeat unit is 2.
Table 3. Genes with introns in the seven cp genomes of Aristolochia as well as the lengths of the exons and introns.
TaxonGeneLocationExon IIntron IExon IIIntron IIExon III
A. kunmingensisatpFLSC144792411
clpPLSC71912288674250
ndhASSC5511095541
ndhBIR777703756
petBLSC6215642
petDLSC6702477
rpl16LSC91092402
rpl2IR391700431
rpoC1LSC4327621617
rps12LSC114 23253623
rps16LSC46842221
trnA-UGCIR3880435
trnG-UCCLSC2476348
trnI-GAUIR3793635
trnK-UUULSC37257435
trnL-UAALSC3545450
trnV-UACLSC3758736
ycf3LSC126871226745155
A. mollissimaatpFLSC144772411
clpPLSC71897295672243
ndhASSC5511097541
ndhBIR777702756
petBLSC6215642
petDLSC6702477
rpl16LSC91098399
rpl2IR391700431
rpoC1LSC4327621617
rps12LSC114 23253623
rps16LSC46848221
trnA-UGCIR3880435
trnG-UCCLSC2476447
trnI-GAUIR3793635
trnK-UUULSC37256235
trnL-UAALSC3545550
trnV-UACLSC3758736
ycf3LSC126820226753155
A. kaempferiatpFLSC144780411
clpPLSC71900295671243
ndhASSC5511097541
ndhBIR777702756
petBLSC6215642
petDLSC6702477
rpl16LSC91101399
rpl2IR391700431
rpoC1LSC4327651617
rps12LSC114 23253623
rps16LSC46842221
trnA-UGCIR3880435
trnG-UCCLSC2476448
trnI-GAUIR3793635
trnK-UUULSC37255235
trnL-UAALSC5045535
trnV-UACLSC3758736
ycf3LSC126812226752155
A. moupinensisatpFLSC144789411
clpPLSC71909288669250
ndhASSC5511101541
ndhBIR777703756
petBLSC6211646
petDLSC6708477
rpl16LSC39911009
rpl2IR391700431
rpoC1LSC4327641617
rps12LSC114 23253623
rps16LSC46839221
trnA-UGCIR3880435
trnG-UCCLSC2475848
trnI-GAUIR3793635
trnK-UUULSC37256735
trnL-UAALSC3546250
trnV-UACLSC3758736
ycf3LSC126920226746155
A. macrophyllaatpFLSC144778411
clpPLSC71928288664250
ndhASSC5511084541
ndhBIR777702756
petBLSC6215642
petDLSC6706477
rpl16LSC91095402
rpl2IR391700431
rpoC1LSC4327881617
rps12LSC114 23253623
rps16LSC46836221
trnA-UGCIR3880435
trnG-UCCLSC2475547
trnI-GAUIR3793635
trnK-UUULSC37255835
trnL-UAALSC3547550
trnV-UACLSC3758936
ycf3LSC126892226757155
A.tubifloraatpFLSC144751411
clpPLSC71819288671250
ndhASSC5511079541
ndhBIR777705756
petBLSC6214642
petDLSC6693477
rpl16LSC91077399
rpl2IR391657431
rpoC1LSC4327801617
rps12LSC114 23253623
rps16LSC46889221
trnA-UGCIR3880935
trnG-UCCLSC2476847
trnI-GAUIR3793735
trnK-UUULSC37263535
trnL-UAALSC3551450
trnV-UACLSC3759436
ycf3LSC126764226752149
A. tagalaatpFLSC144778408
clpPLSC71802288671250
ndhASSC5511101541
ndhBIR777704756
petBLSC6219642
petDLSC6488477
rpl16LSC91071399
rpl2IR391657431
rpoC1LSC4327851617
rps12LSC114 23253623
rps16LSC46848221
trnA-UGCIR3880435
trnG-UCCLSC2476848
trnI-GAUIR3774335
trnK-UUULSC37268735
trnL-UAALSC3549050
trnV-UACLSC3759536
ycf3LSC126830226763149
Table 4. Positive selected sites detected in the cp genome of the Piperales.
Gene nameM2aM8
selected sitesPr (w > 1)selected sitesPr (w > 1)
rpl2071A0.91871A0.967 *
72L0.999 **72L1.000 **
105R0.963 *105R0.984 *
116H0.963 *116H0.988 *
rps1279M0.966 *79M0.987 *
rps184S0.9374S0.975 *
99T0.92199T0.967 *
ycf1206S0.914206S0.967 *
211V0.975 *211V0.989 *
1412N0.9221412N0.971 *
ycf22036W0.9322036W0.950 *
* p < 0.05; ** p < 0.01.
Table 5. Variable sites analyses in the seven Aristolochia cp genomes.
RegionsNumber of SitesVariable SitesParsimony Informative SitesNucleotide Diversity
LSC94,564443023150.02182
SSC20,45114338040.03114
IR25,8842531540.00411
Complete166,113642234610.01717
CDS79,365252813760.01337
Table 6. Sixteen regions of highly variable sequences (Pi > 0.04) of Aristolochia.
High Variable MarkerLengthVariable SitesParsimony Informative SitesNucleotide Diversity
rps16-trnQ-psbK1301104580.04278
psbI-trnS-trnG23572571590.05364
atpH-atpI1160104690.04439
psbM-trnD1119152750.05888
rps4-trnT-trnL1572105500.04178
trnF-ndhJ92085510.04216
ndhC-trnV1402152970.06311
accD-psaI63761350.04220
petA-psbJ1130106650.04444
rps18-rpl2068258360.04155
trnN-ndhF1492161860.04758
rpl32-trnL-ccsA26792021130.04608
ycf1a1225126740.04285
ycf1b65256320.04053
ycf1c1228134840.04611
ycf1d74070390.04278
Combine20296221613490.05413
Table 7. Sampled species and their voucher specimens used in this study.
SpeciesSamplesVoucherlocality
A. kaempferiE2265Yuan WangJapan, Tokyo
A. kunmingensisE754Zhanghua WangChina, Yunnan
A. macrophyllaE2111Jinshuang Ma North America, North Carolia
A. mollissimaE1016Xinxin Zhu & Zhixiang HuaChina, Guangdong
A. moupinensisE1086Xinxin Zhu & Zhixiang HuaChina, Sichuan
A. tagalaE1071Yuan WangChina, Hongkong
A. tubifloraE2239Shuwan LiChina, Guangxi

