Article

Comparative Analyses of Five Complete Chloroplast Genomes from the Genus Pterocarpus (Fabacaeae)

1
State Key Laboratory of Tree Genetics and Breeding, Research Institute of Tropical Forestry, Chinese Academy of Forestry, Guangzhou 510520, China
2
Guangdong Laboratory for Lingnan Modern Agriculture, Genome Analysis Laboratory of the Ministry of Agriculture, Agricultural Genomics Institute at Shenzhen, Chinese Academy of Agricultural Sciences, Shenzhen 518120, China
3
Department of Agricultural Biology, Colorado State University, Fort Collins, CO 80523, USA
*
Author to whom correspondence should be addressed.
These authors contributed equally to this work.
Int. J. Mol. Sci. 2020, 21(11), 3758; https://doi.org/10.3390/ijms21113758
Submission received: 28 March 2020 / Revised: 20 May 2020 / Accepted: 24 May 2020 / Published: 26 May 2020
(This article belongs to the Special Issue Chloroplast Development and Function)

Abstract

:
Pterocarpus is a genus of trees mainly distributed in tropical Asia, Africa, and South America. Some species of Pterocarpus are rosewood tree species, having important economic value for timber, and for some species, medicinal value as well. Up to now, information about this genus with regard to the genomic characteristics of the chloroplasts has been limited. Based on a combination of next-generation sequencing (Illumina Hiseq) and long-read sequencing (PacBio), the whole chloroplast genomes (cp genomes) of five species (rosewoods) in Pterocarpus (Pterocarpus macrocarpus, P. santalinus, P. indicus, P. pedatus, P. marsupium) have been assembled. The cp genomes of five species in Pterocarpus have similar structural characteristics, gene content, and sequence to other flowering plants. The cp genomes have a typical four-part structure, containing 110 unique genes (77 protein coding genes, 4 rRNAs, 29 tRNAs). Through comparative genomic analysis, abundant simple sequence repeat (SSR)loci (333–349) were detected in Pterocarpus, among which A /T single nucleotide repeats accounted for the highest proportion (72.8–76.4%). In the five cp genomes of Pterocarpus, eight hypervariable regions, including trnH-GUG_psbA, trnS-UGA_psbC, accD-psaI, ndhI-exon2_ndhI-exon1, ndhG_ndhi-exon2, rpoC2-exon2, ccsA, and trnfM-CAU, are proposed for use as DNA barcode regions. In the comparison of gene selection pressures (P. santalinus as the reference genome), purifying selection was inferred as the primary mode of selection in maintaining important biological functions. Phylogenetic analysis shows that Pterocarpus is a monophyletic group. The species P. tinctorius is resolved as early diverging in the genus. Pterocarpus was resolved as sister to the genus Tipuana.

1. Introduction

Pterocarpus is a genus in the subfamily Papilionoideae of Fabaceae. There are more than 20 tree species in the genus, many of which are highly valued for the quality wood they produce. Species of Pterocarpus are mainly distributed in tropical Asia, Africa, and South America [1,2,3]. Some species of this genus are referred to as rosewood (this term also is used to refer to species from the sister genus Dalbergia) because of the dark red, high-quality heartwood used for making fine furniture, traditional medicine, and handicrafts such as musical instruments [4]. Because some Pterocarpus species are so highly valued for timber and the growth rate is relatively slow, they have been overexploited and, in some cases, may be driven to extinction [5,6]. The loss of genetic diversity caused by human activities increases the risk of species extinction [7]. In 2017, P. santalinus (endangered plants) and P. erinaceus were listed in the The Convention on International Trade in Endangered Species of Wild Fauna and Flora (CITES) appendices which controls the export of wood from these species because the populations are declining. Pterocarpus indicus and P. angolensis have been listed as a vulnerable species and a near threatened species by the International Union for Conservation of Nature [8], respectively. Considering the economic value and the loss of genetic diversity of rosewoods species, many countries have begun to restrict export of Pterocarpus wood to protect remaining resources [6]. Meanwhile, driven by market demand among other interests [9], it is also common to label wood with similar anatomical features (red color) as a precious wood species such as those from Pterocarpus when in fact it might originate from a different genus or even family [9,10]. Owing to the rarity and value of rosewood tree species, research on Pterocarpus has mainly focused on the value of developing species for timber production [11,12,13], the proper identification of precious wood [9,10], and the introduction and cultivation for use in timber plantations [14,15,16]. Given the issues of overexploitation and illegal logging associated with high value timber such as rosewood, having molecular markers for species and population identification can be very useful in identifying imposter woods, and tracking illegal logging and exportation [17]. As such, it is vital to have a set of DNA markers to identify the origin and type (species) of high value timber being sold and traded in international markets. In plants, chloroplast genomes have provided numerous such markers for species and population identification.
The chloroplast (cp) is the photosynthetic organelle of plants and algae [18,19]. The cp genome sequence has unique characteristics, such as uniparental inheritance, conserved sequence composition in coding regions, numerous variable sites, and a typical four-part genome structure [20,21,22]. Because of these shared attributes, chloroplast phylogenomics has become a common method to resolve plant phylogenies and evaluate biodiversity [23,24,25]. Research on chloroplast phylogeny and the genomic structural characteristics of Pterocarpus is of significance for the protection of biodiversity and for the determination of the appropriate priority protection level of plants [26,27]. Pterocarpus is a genus that, due to numerous revisions since the initial naming in 1763, has uncertain affinities in regard to the placement within the Fabaceae [28]. Though some researchers have used molecular methods to explore phylogenetic relationships within the genus and the phylogenetic position of Pterocarpus in Papilionoideae [4,29,30], the selected DNA fragments were few and the support values were generally low, resulting in unresolved taxonomic placements. The whole cp genome of three species in Pterocarpus had been used to develop DNA barcodes for identifying some rosewood species but did not analyze the structural characteristics of the genome in greater detail [31]. Structural differences among closed species are also valuable in proper species identification. As such, we conducted a detailed comparison of cp genome structural differences to provide additional genomic resources in the study of Pterocarpus species.
In this study, we sequenced and analyzed the cp genome of five species (P. macrocarpus, P. santalinus, P. indicus, P. pedatus, P. marsupium) of Pterocarpus (abbreviated throughout the manuscript as M-S-I-P-M2 respectively). In this study, we focused on (1) analyzing the cp genome structural characteristics of Pterocarpus, (2) identifying SSR loci to provide resources for later studies in population genetic structure and phylogeography of Pterocarpus and its related genera, (3) inferring the phylogenetic relationship of five species in Pterocarpus and the phylogenetic position in Fabaceae using the complete cp genome alignments, and (4) identifying hypervariable regions for use as DNA barcodes.

2. Results

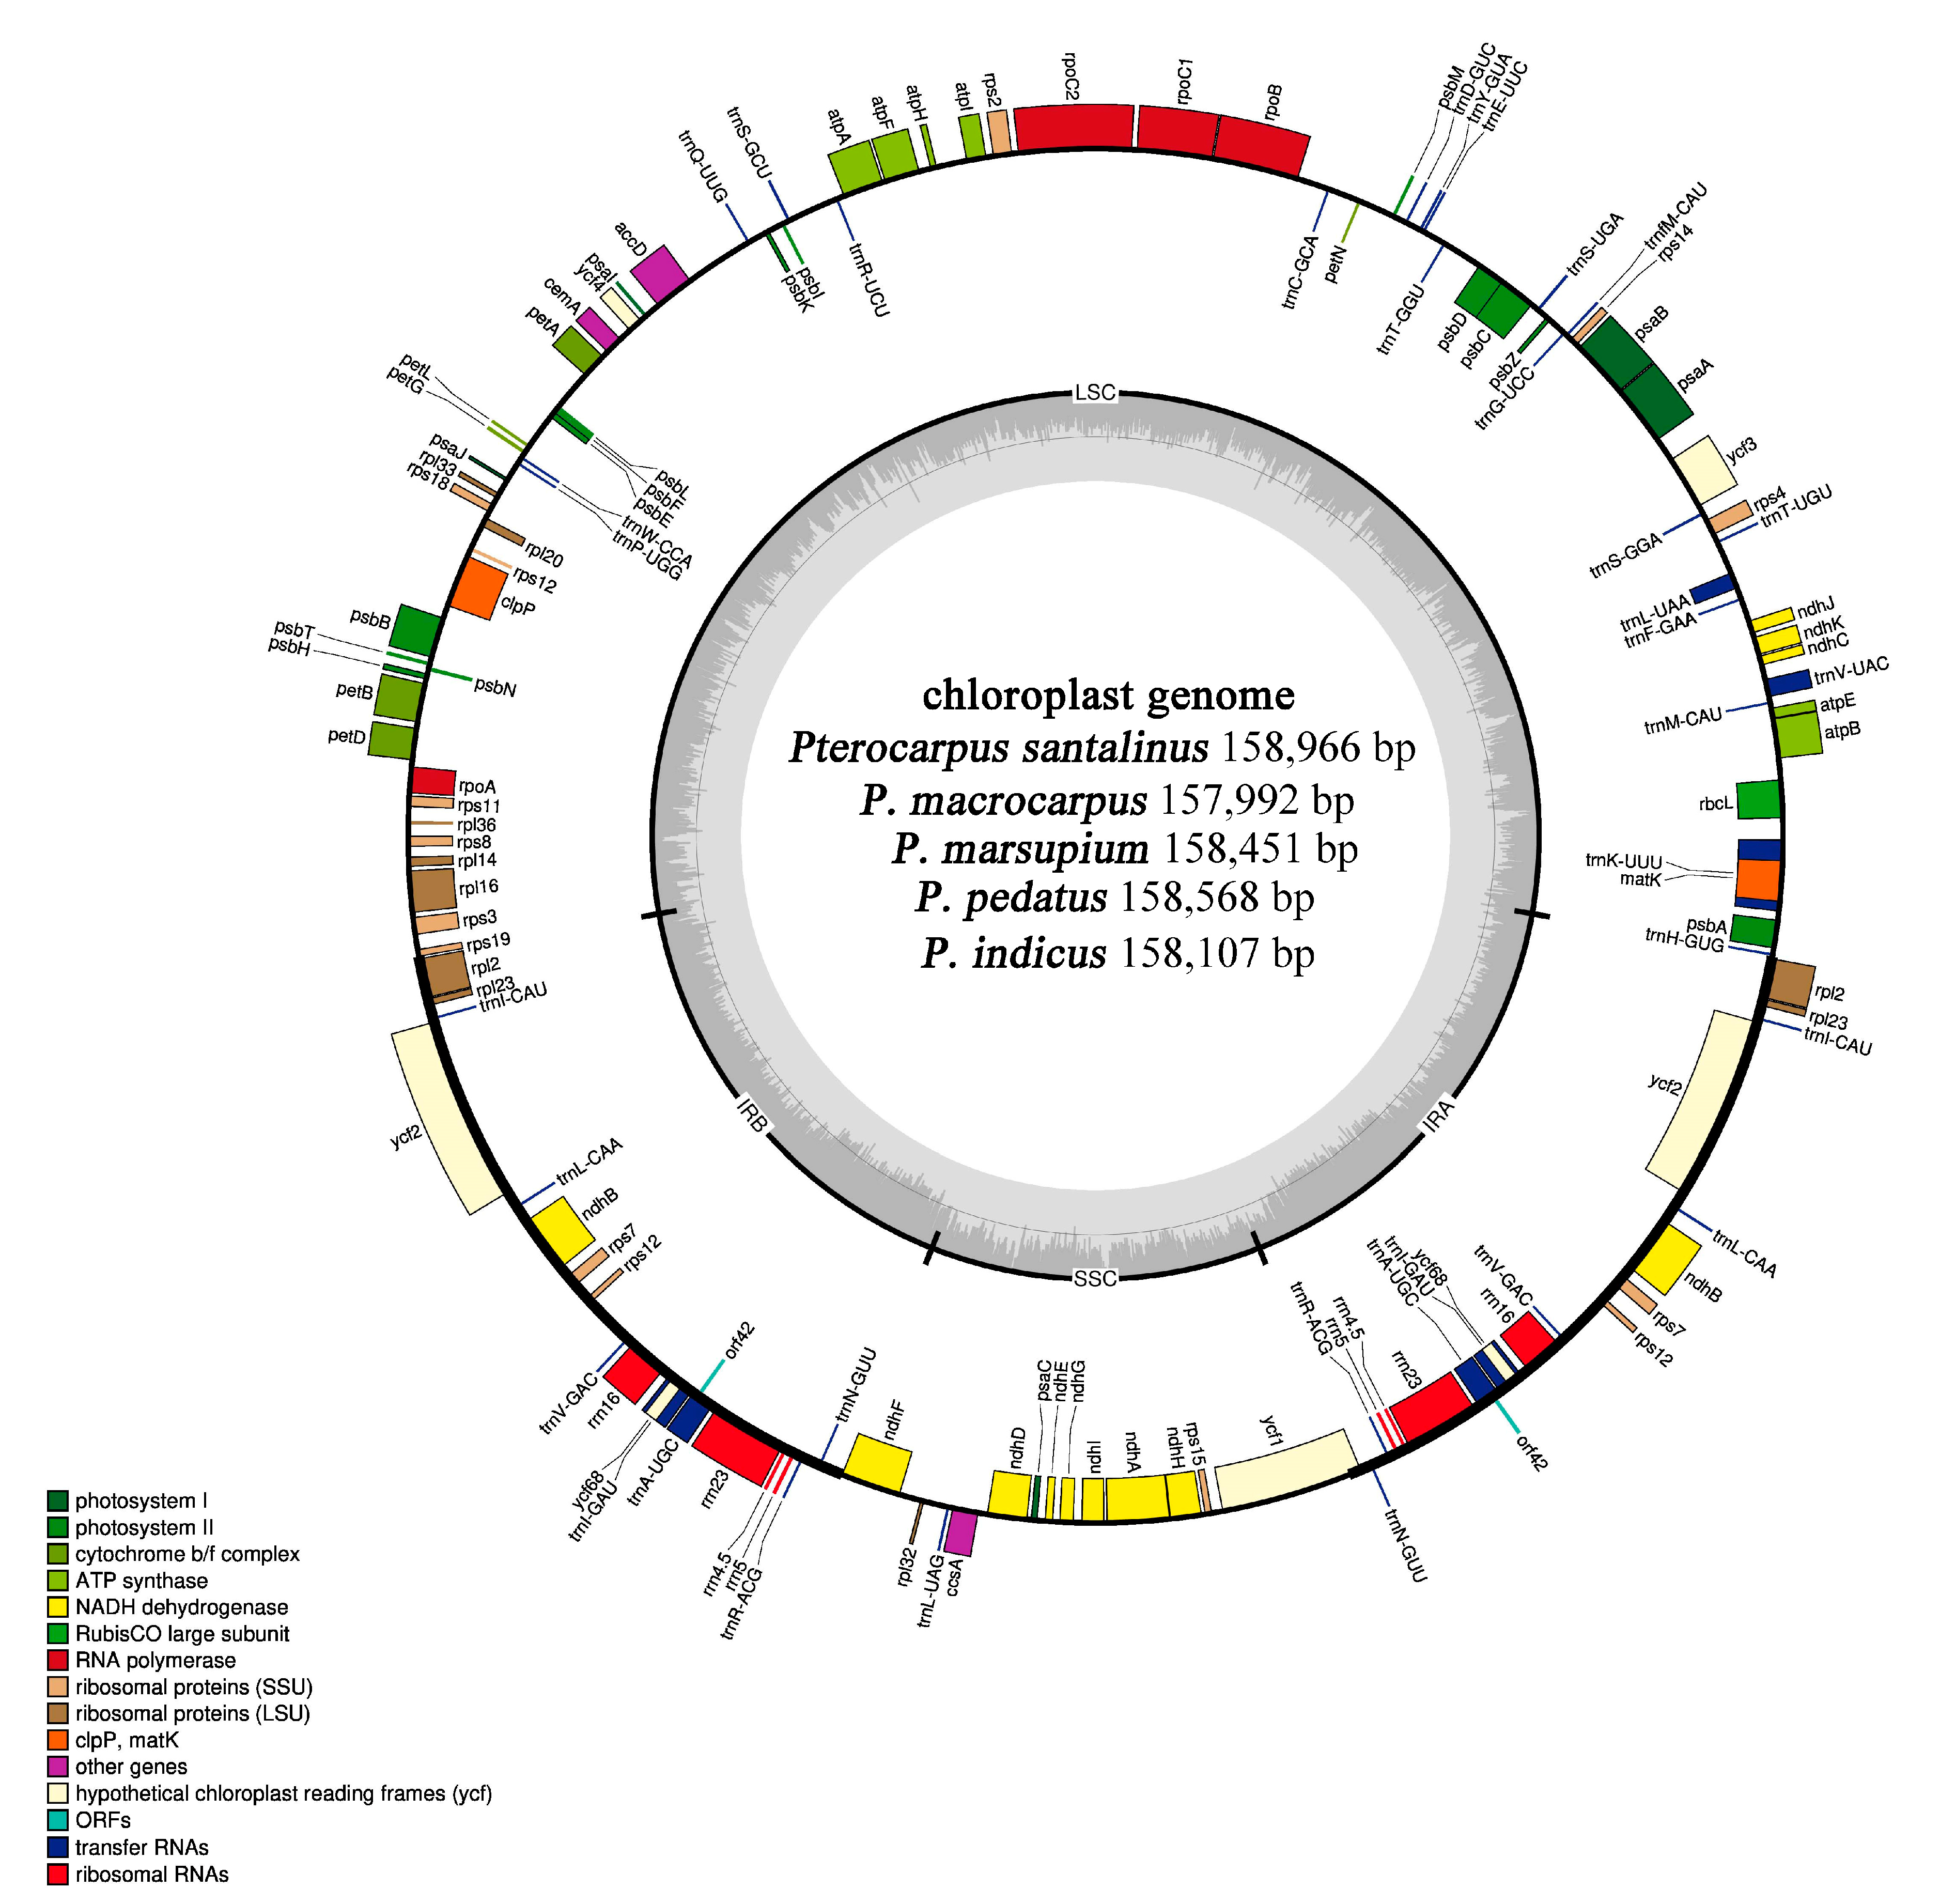
2.1. Genomic Characteristics of Chloroplast

Using Illumina Hiseq and PacBio sequencing platforms, we obtained 3666-4403 M (Illumina reads) and 77-335 M PacBio high-quality sequence fragments from five Pterocarpus species. After assembly, the length of M-S-I-P-M2 cp genomes were 157,992 bp, 158,966 bp, 158,107 bp, 158,568 bp, and 158,451 bp, respectively. The cp genomes all had a typical quadripartite structure: large single copy region (LSC), small single copy region (SSC), and two inverted repeat regions (IRs) (Figure 1). The length of the LSC region in M-S-I-P-M2 cp genomes is from 87,789 to 88,460 bp, the length of SSC is from 18,723 to 19,122 bp, and the length of IRb is from 25,689 to 25,711 bp (IRa: 25,691–25,713 bp) (Supplementary Table S1). All cp genomes have been uploaded to NCBI (Genebank: MT249113–MT249117).
Through gene annotation, we found that the chloroplast genome of five Pterocarpus species (M-S-I-P-M2) showed similar genome structures, containing 110 unique genes (77 protein coding genes, 4 rRNA, and 29 tRNA). Eighteen of the genes (atpF, matK, ndhA, ndhB, ndhI, petB, petD, rpl16, rpl2, rpoC1, rpoC2, rps12, trnA-UGC, trnI-GAU, trnK-UUU, trnL-UAA, trnV-UAC, ycf68) contain one intron and two genes (ycf3; clpP) contain two introns (Table 1). There is one intron in the ycf1 gene of P. marsupium, P. pedatus, and P. santalinus, but it is absent in P. indicus or P. macrocarpus. In all the cp genomes of Pterocarpus, the ycf1 gene spans the SSC and IRa junction. The rps12 is a trans-spliced gene similar to those found in the genera Diospyros and Ziziphus [32,33]. The 5 end is located in LSC region, and the 3 end in the IRa and IRb region. Protein-coding genes account for 49.4–49.7% of the total genome length while intergenic regions and introns account for 50.3–50.6%. In M-S-I-P-M2 cp genomes were AT-rich, with 63.61–63.69% of the genome made up of A/T nucleotides. The A/T content of protein coding genes, tRNA and rRNA among the five Pterocarpus cp genomes was similar, with 62.3–62.32%, 46.72%, and 44.54% A/T content respectively (Supplementary Table S1).

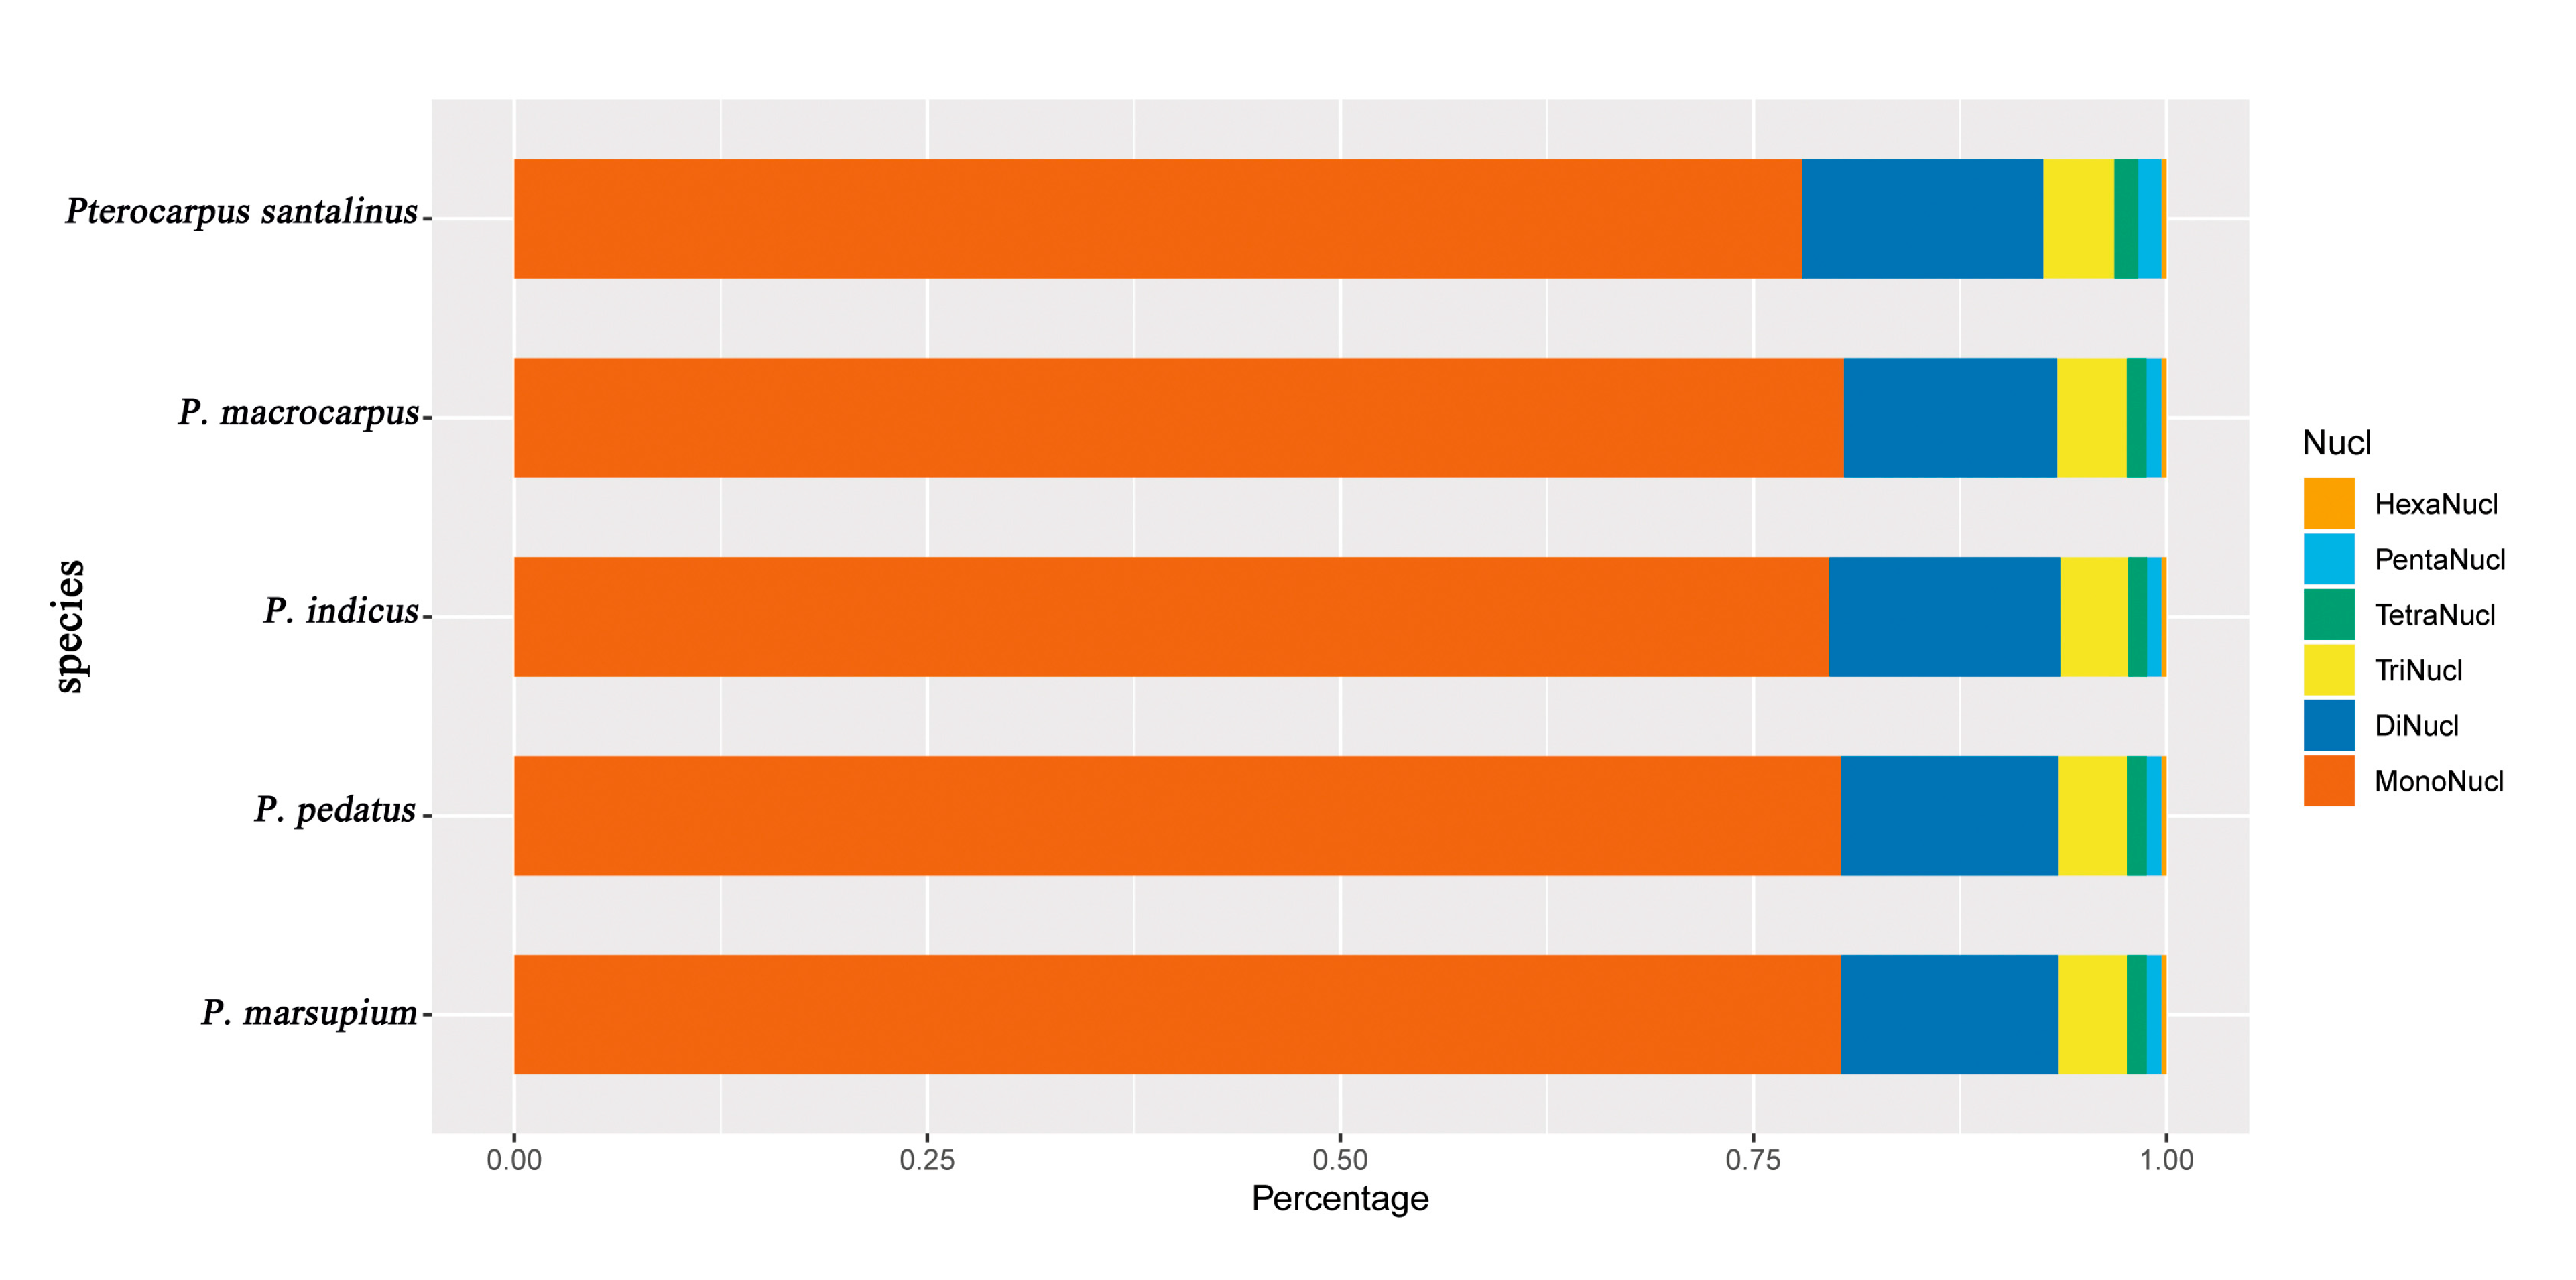
2.2. Detection of Chloroplast Repeat Sequences and SSRs

In this study, we identified 107, 136, 127, 138, and 95 repeat sequences in M-S-I-P-M2 cp genomes respectively, of which palindromic was the most common type, accounting for 37.5–42.1% of all the repeats, followed by forward (27.5–33.6%), reverse (15.8–21.3%), and complementary (9.4–14.7%). Most of the repeats in the genomes were found in the non-coding regions, with some in the coding regions accD, ndhF, ndhI, psaA, psaB, rpoC2, rps19, trnR-UCU, trnS-GCU, trnS-GGA, trnS-UGA, ycf1, and ycf2 (Supplementary Table S2).
We detected 333, 349, 343, 335, and 335 SSR loci in M-S-I-P-M2 cp genomes, respectively. The majority of the SSRs were A/T homopolymers (proportion of A/T in SSRs: 72.8–76.4%; proportion of C/G in SSRs: 3.9–5.8%). The single nucleotide repeats motifs accounted for 77.9–80.5% of all the SSR types and of those, repeats of 7–11 accounted for 85.1–87.5% of the single nucleotide repeats. There were 43–51 dinucleotide repeats, accounting for 12.9–14.6% of the SSRs. In the di-nucleotide repeat category, AT/AT repeats were more frequent in Pterocarpus with 90.7–92.2% of the loci being this type. For trinucleotide repeats in Pterocarpus, the AAT/ ATT were observed most frequently with 92.9–93.3% of trinucleotide SSRs being of this type (AAG/CTT: 6.7–7.1%), with all trinucleotide repeats together accounting for 3.8–4% of all SSRs. The frequency of other repeat types (tetranucleotide, pentanucleotide, hexanucleotide) was very low in Pterocarpus, accounting for a total of 2.4–3.2% (Figure 2). In all cp genomes, the number of SSRs present in all kinds of groups was 39.6–40.7% in the total number of SSRs (Supplementary Table S3).

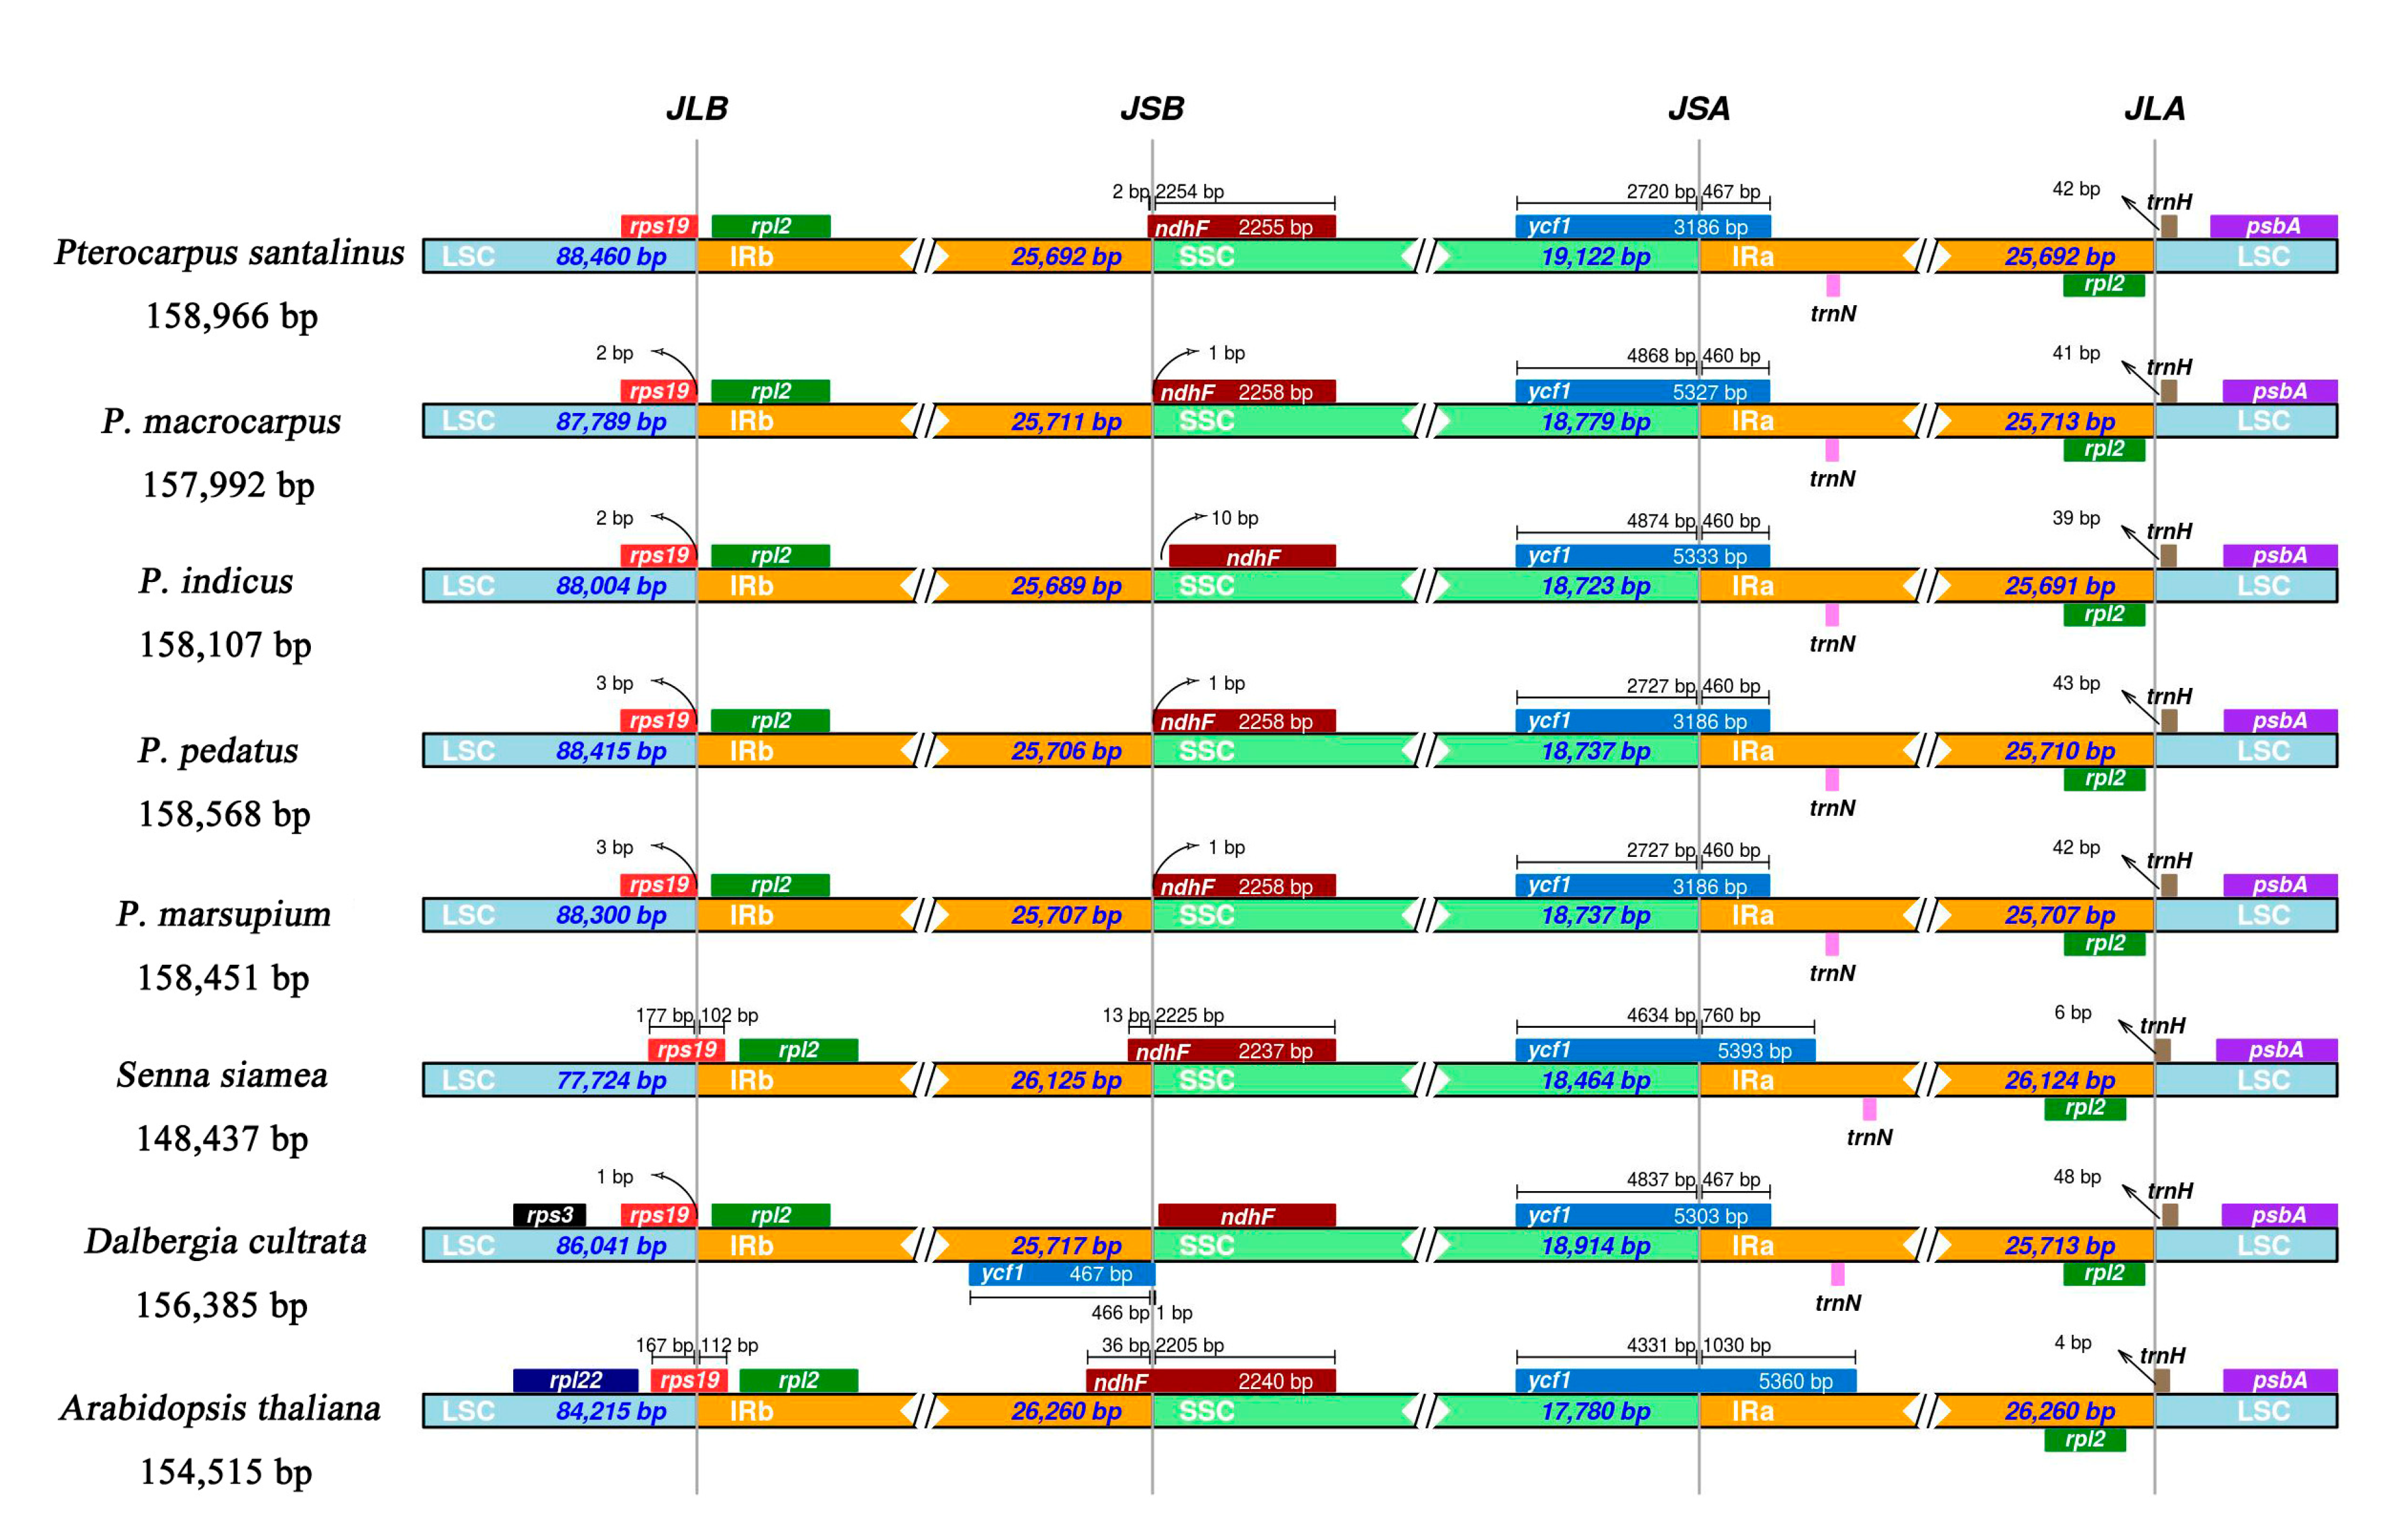
2.3. IR Expansion and Contraction

We analyzed the junctions of the IRs and the two single copy regions, along with placement of adjacent genes in the M-S-I-P-M2 cp genomes and three reference cp genomes (Senna siamea, Mn 525772; Dalbergia culturata, NC_044117; Arabidopsis thaliana, KX 551970). The genes located at the junctions included (IRs, LSC, SSC) rps19, rpl2, ndhF, ycf1, and trnH. The rps19 and rpl2 genes were detected at the junction of LSC and IRb. The rpl2 gene is entirely located within the IR regions. The rps19 gene of all Pterocarpus and D. culturata is similar in location, and both are located in the LSC region, 0–3 bp away from the LSC and IRb boundary, which is different from the rpl2 gene in Senna siamea and Arabidopsis thaliana which span the LSC and IRb boundary. The ndhF gene of P. macrocarpus, P. indicus, P. pedatus, and P. marsupium is located in the SSC region, 1–10 bp away from the boundary of IRb-SSC. The ndhF gene of P. santalinus, Senna siamea and Arabidopsis thaliana is mainly located in SSC region, but spans the junction 2 bp, 13 bp, and 36 bp into the IRb region, respectively. The ycf1 gene in all genomes compared herein spans the SSC, IRa junction with the majority of the gene located in the SSC region. The length of the ycf1 gene in the IRa ranges from 460–467 bp in Pterocarpus and D. culturata. The length of ycf1 gene in the IRa of Senna siamea and Arabidopsis thaliana is 760 bp and 1030 bp respectively. The trnH gene is located at the junction of IRa and LSC, and it is totally contained in the LSC region (distance from IRa / LSC boundary: P. santalinus, 42 bp; P. macrocarpus, 41 bp; P. indicus, 39 bp; P. pedatus, 43 bp; P. marsupium, 42 bp; Senna siamea, 6 bp; D. culturata, 48 bp; Arabidopsis thaliana, 4 bp). Pterocarpus and D. culturata ycf1 genes are 39–48 bp away from IRa LSC junction, while Senna siamea and Arabidopsis thaliana are 4–6 bp away. The length of the IR region of the chloroplast genomes in M-S-I-P-M2 and D. culturata is similar (IRb: 25,689–25,717 bp; IRa: 25,691–25,713 bp). In terms of chloroplast genome and IRs region length, there is a sizeable difference between M-S-I-P-M2 (IRb: 25,689–25,711 bp; IRa: 25,691–25,713 bp; chloroplast genomes: 157,992–158,966 bp), Senna siamea (IRb: 26,125 bp; IRa:26,124 bp; chloroplast genome: 148,437 bp), and Arabidopsis thaliana (IRb: 26,260 bp; IRa: 26,260 bp; chloroplast genome: 154,515 bp) (Figure 3).

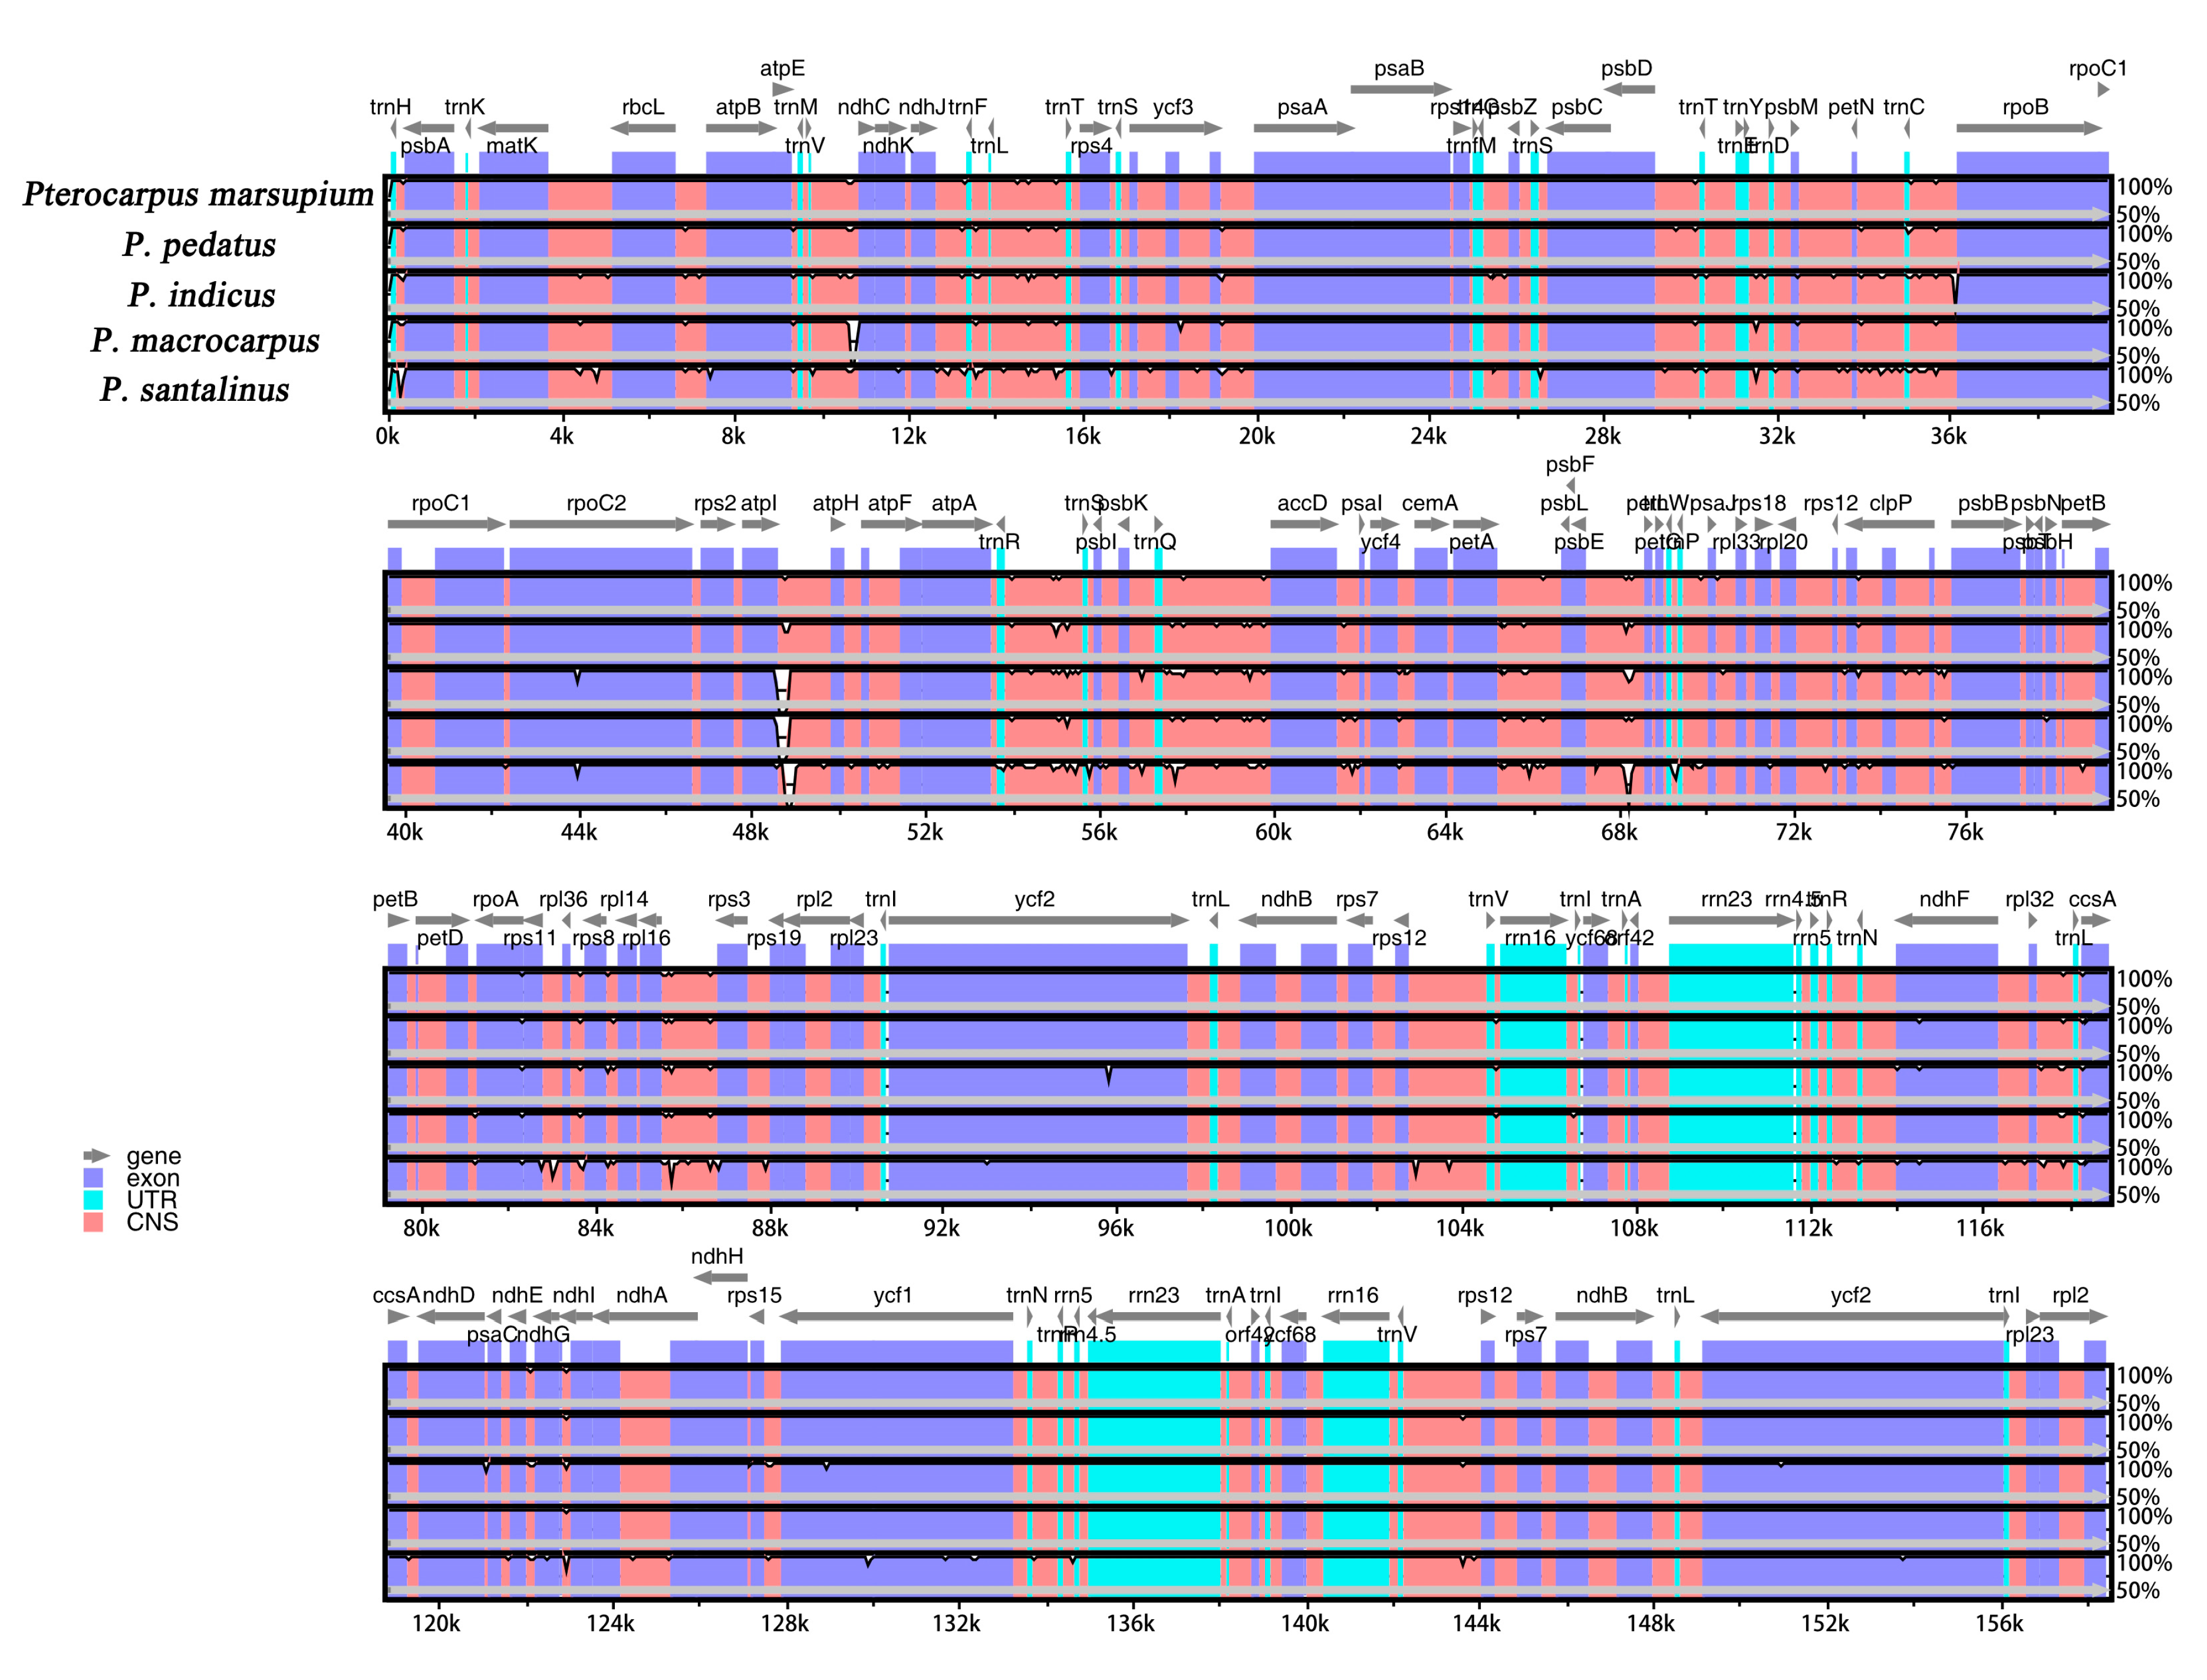
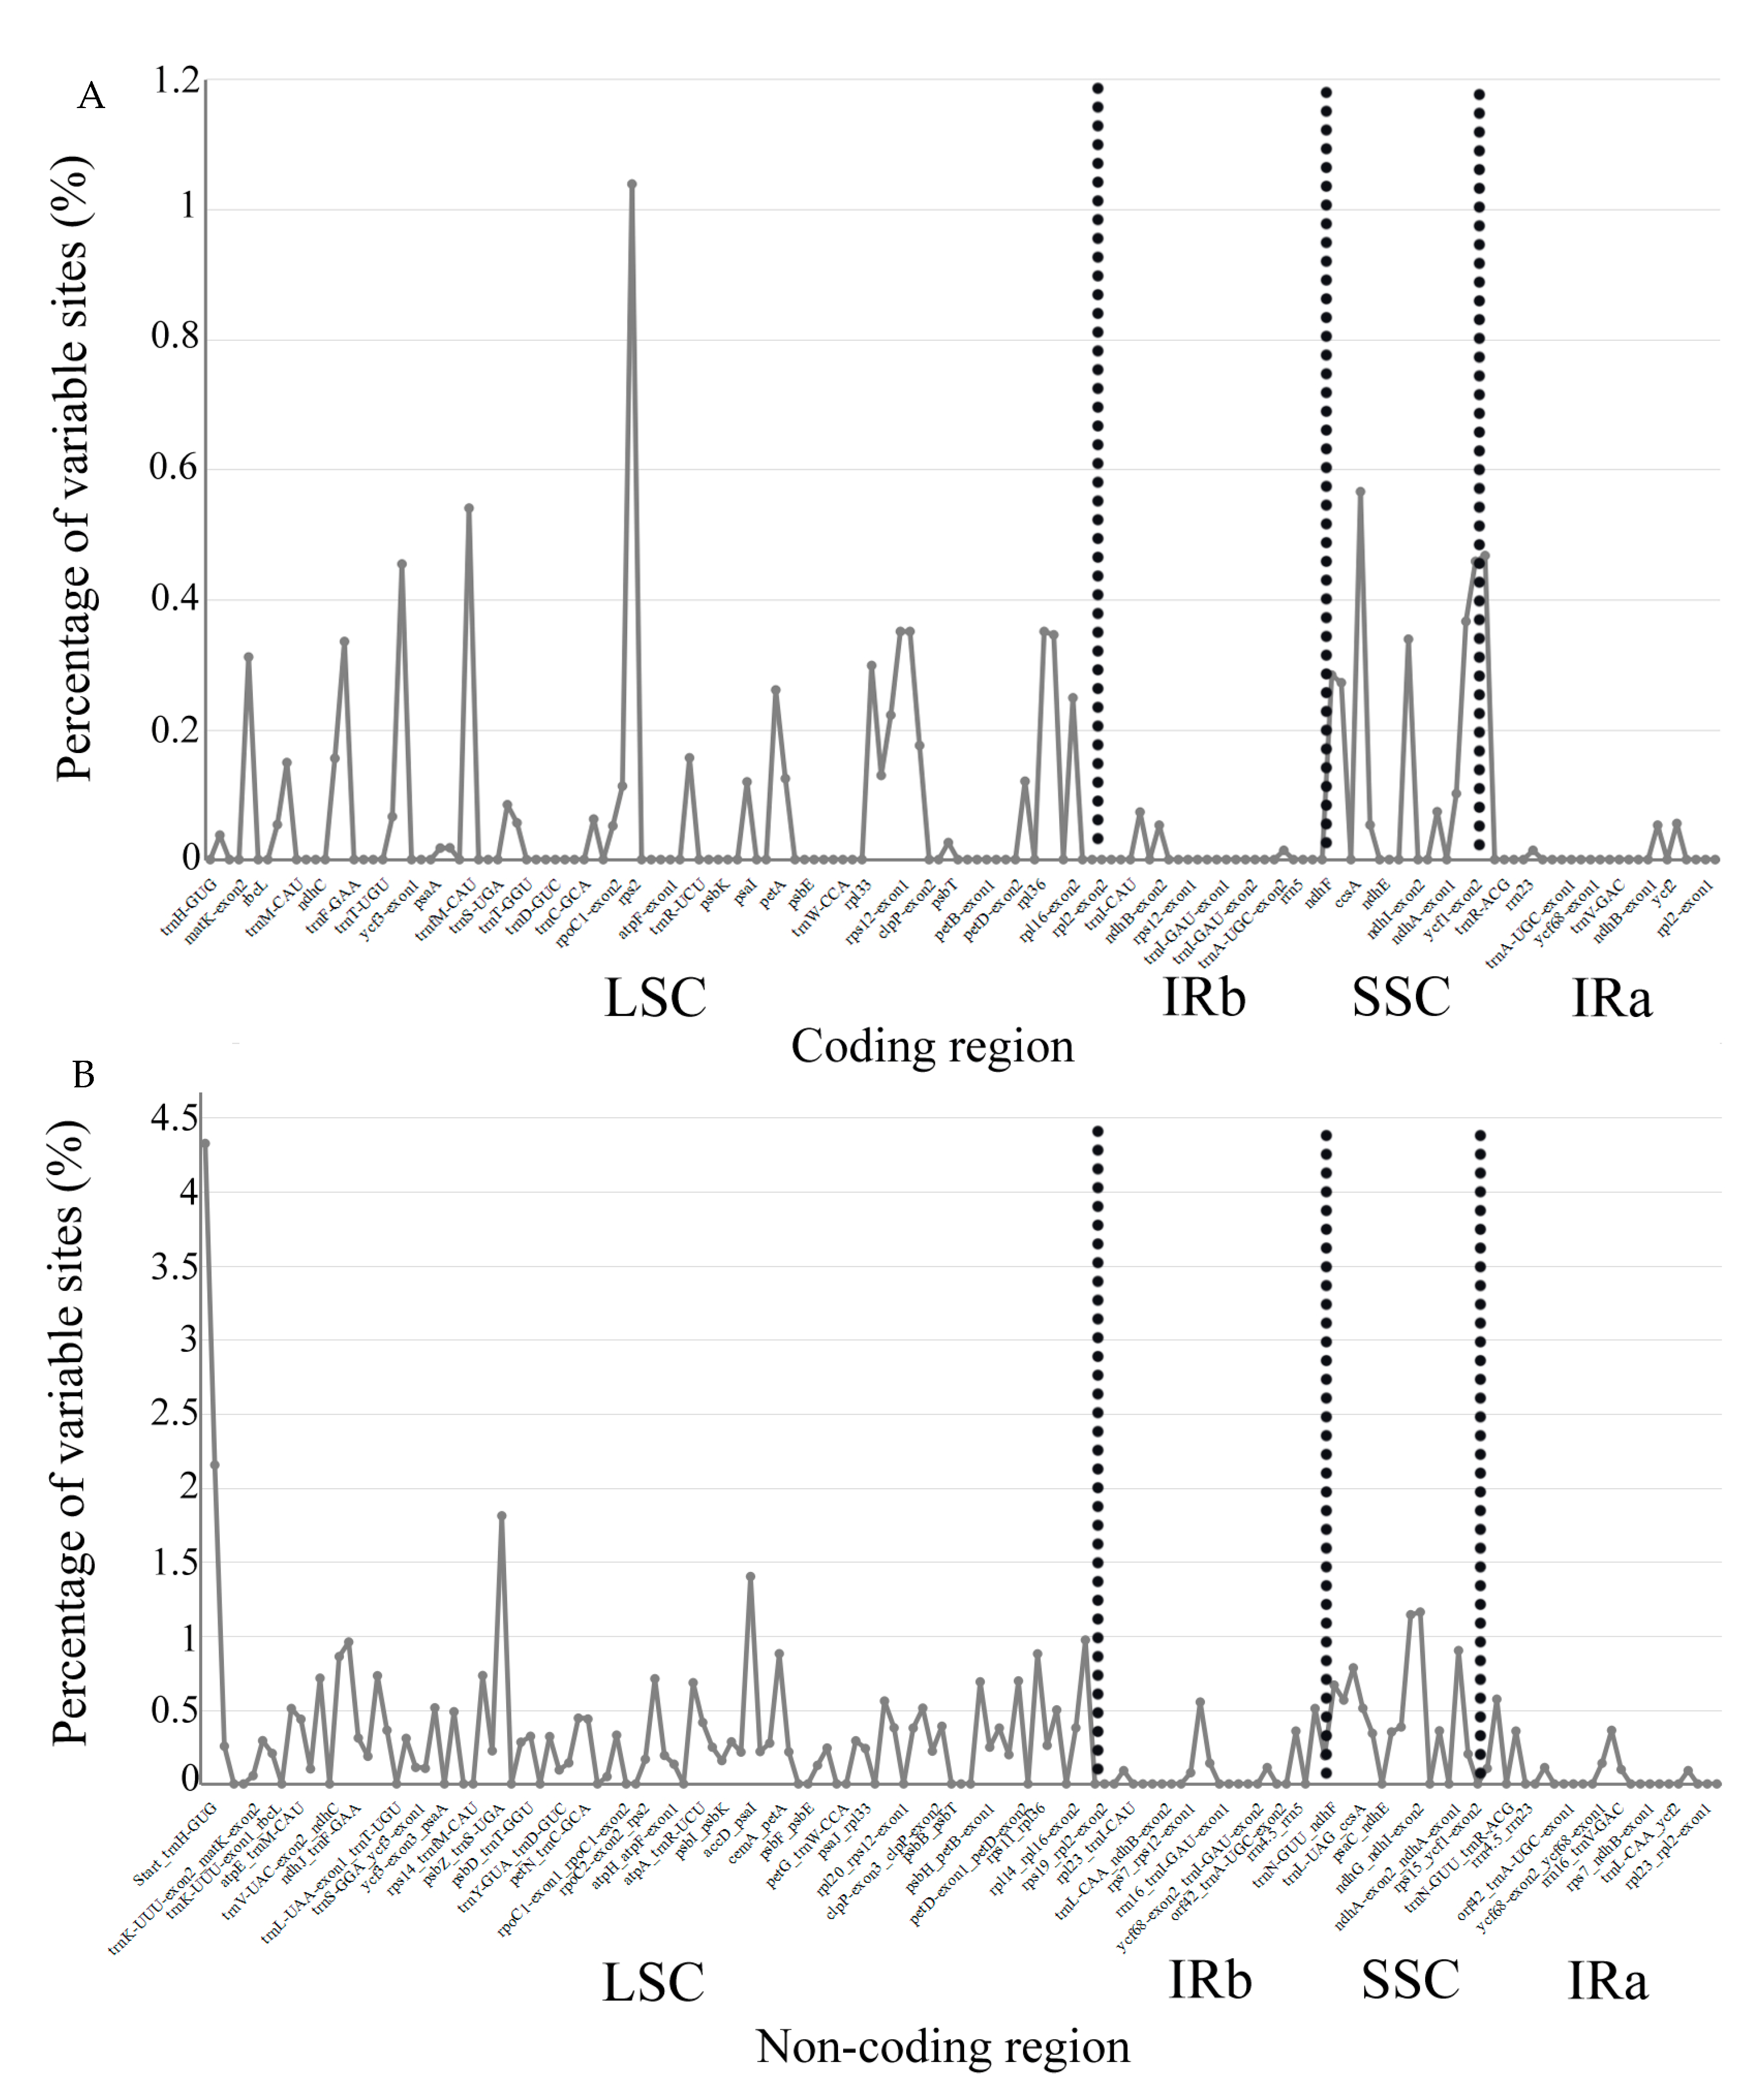
2.4. Sequence Variation of Chloroplast Genome

We analyzed the sequence differences of M-S-I-P-M2 cp genomes using mVISTA. All Pterocaprus cp genome sequences showed very high sequence similarities. The highly variable regions were mainly concentrated in the non-coding sequences, while the exons, introns and ncRNA generally had little variation between genomes (Figure 4). In the non-coding regions, the regions with large variation are Start_trnH-GUG, trnH-GUG_psbA, trnS-UGA_psbC, accD_psaI, ndhI-exon2_ndhI-exon1, and ndhG_ndhI-exon2 (Pi > 0.01). In the coding regions, the most variable gene was rpoC2-exon2 (Pi = 0.01), followed by ccsA (Pi = 0.006) and trnfM-CAU (Pi = 0.005). The most variable regions in the genomes were located in LSC and SSC regions, with the IR regions remaining relatively conserved across the genus (Figure 5).

2.5. Selection on Functional Genes

In order to find patterns of selection in protein coding genes, the synonymous and non-synonymous changes were compared from the five Pterocaprus cp genomes using P. santalinus as the reference. The Ka /Ks of 77 protein coding genes in five chloroplast genomes was calculated and compared. The Ka range of M-S-I-P-M2 cp genomes was from 1.94 × 10⁻⁶ to 2.27 × 10⁻², and the Ks range was from 1.76 × 10⁻⁵ to 6.75 × 10⁻². The genes inferred to be undergoing positive selection were (ω > 1) accD, ndhB, ndhD, rpl32, rps4, and ycf2 (the highest ratio of Ka/Ks was for the ycf2 gene between P. santalinus and P. indicus, ω =50). Protein coding genes inferred to be undergoing purifying selection (ω < 1) across all five Pterocaprus cp genomes include atpB, clpP, ndhH, psaA, psbB, psbC, rpl36, and rps12 (ω = 0.001) (Table 1).

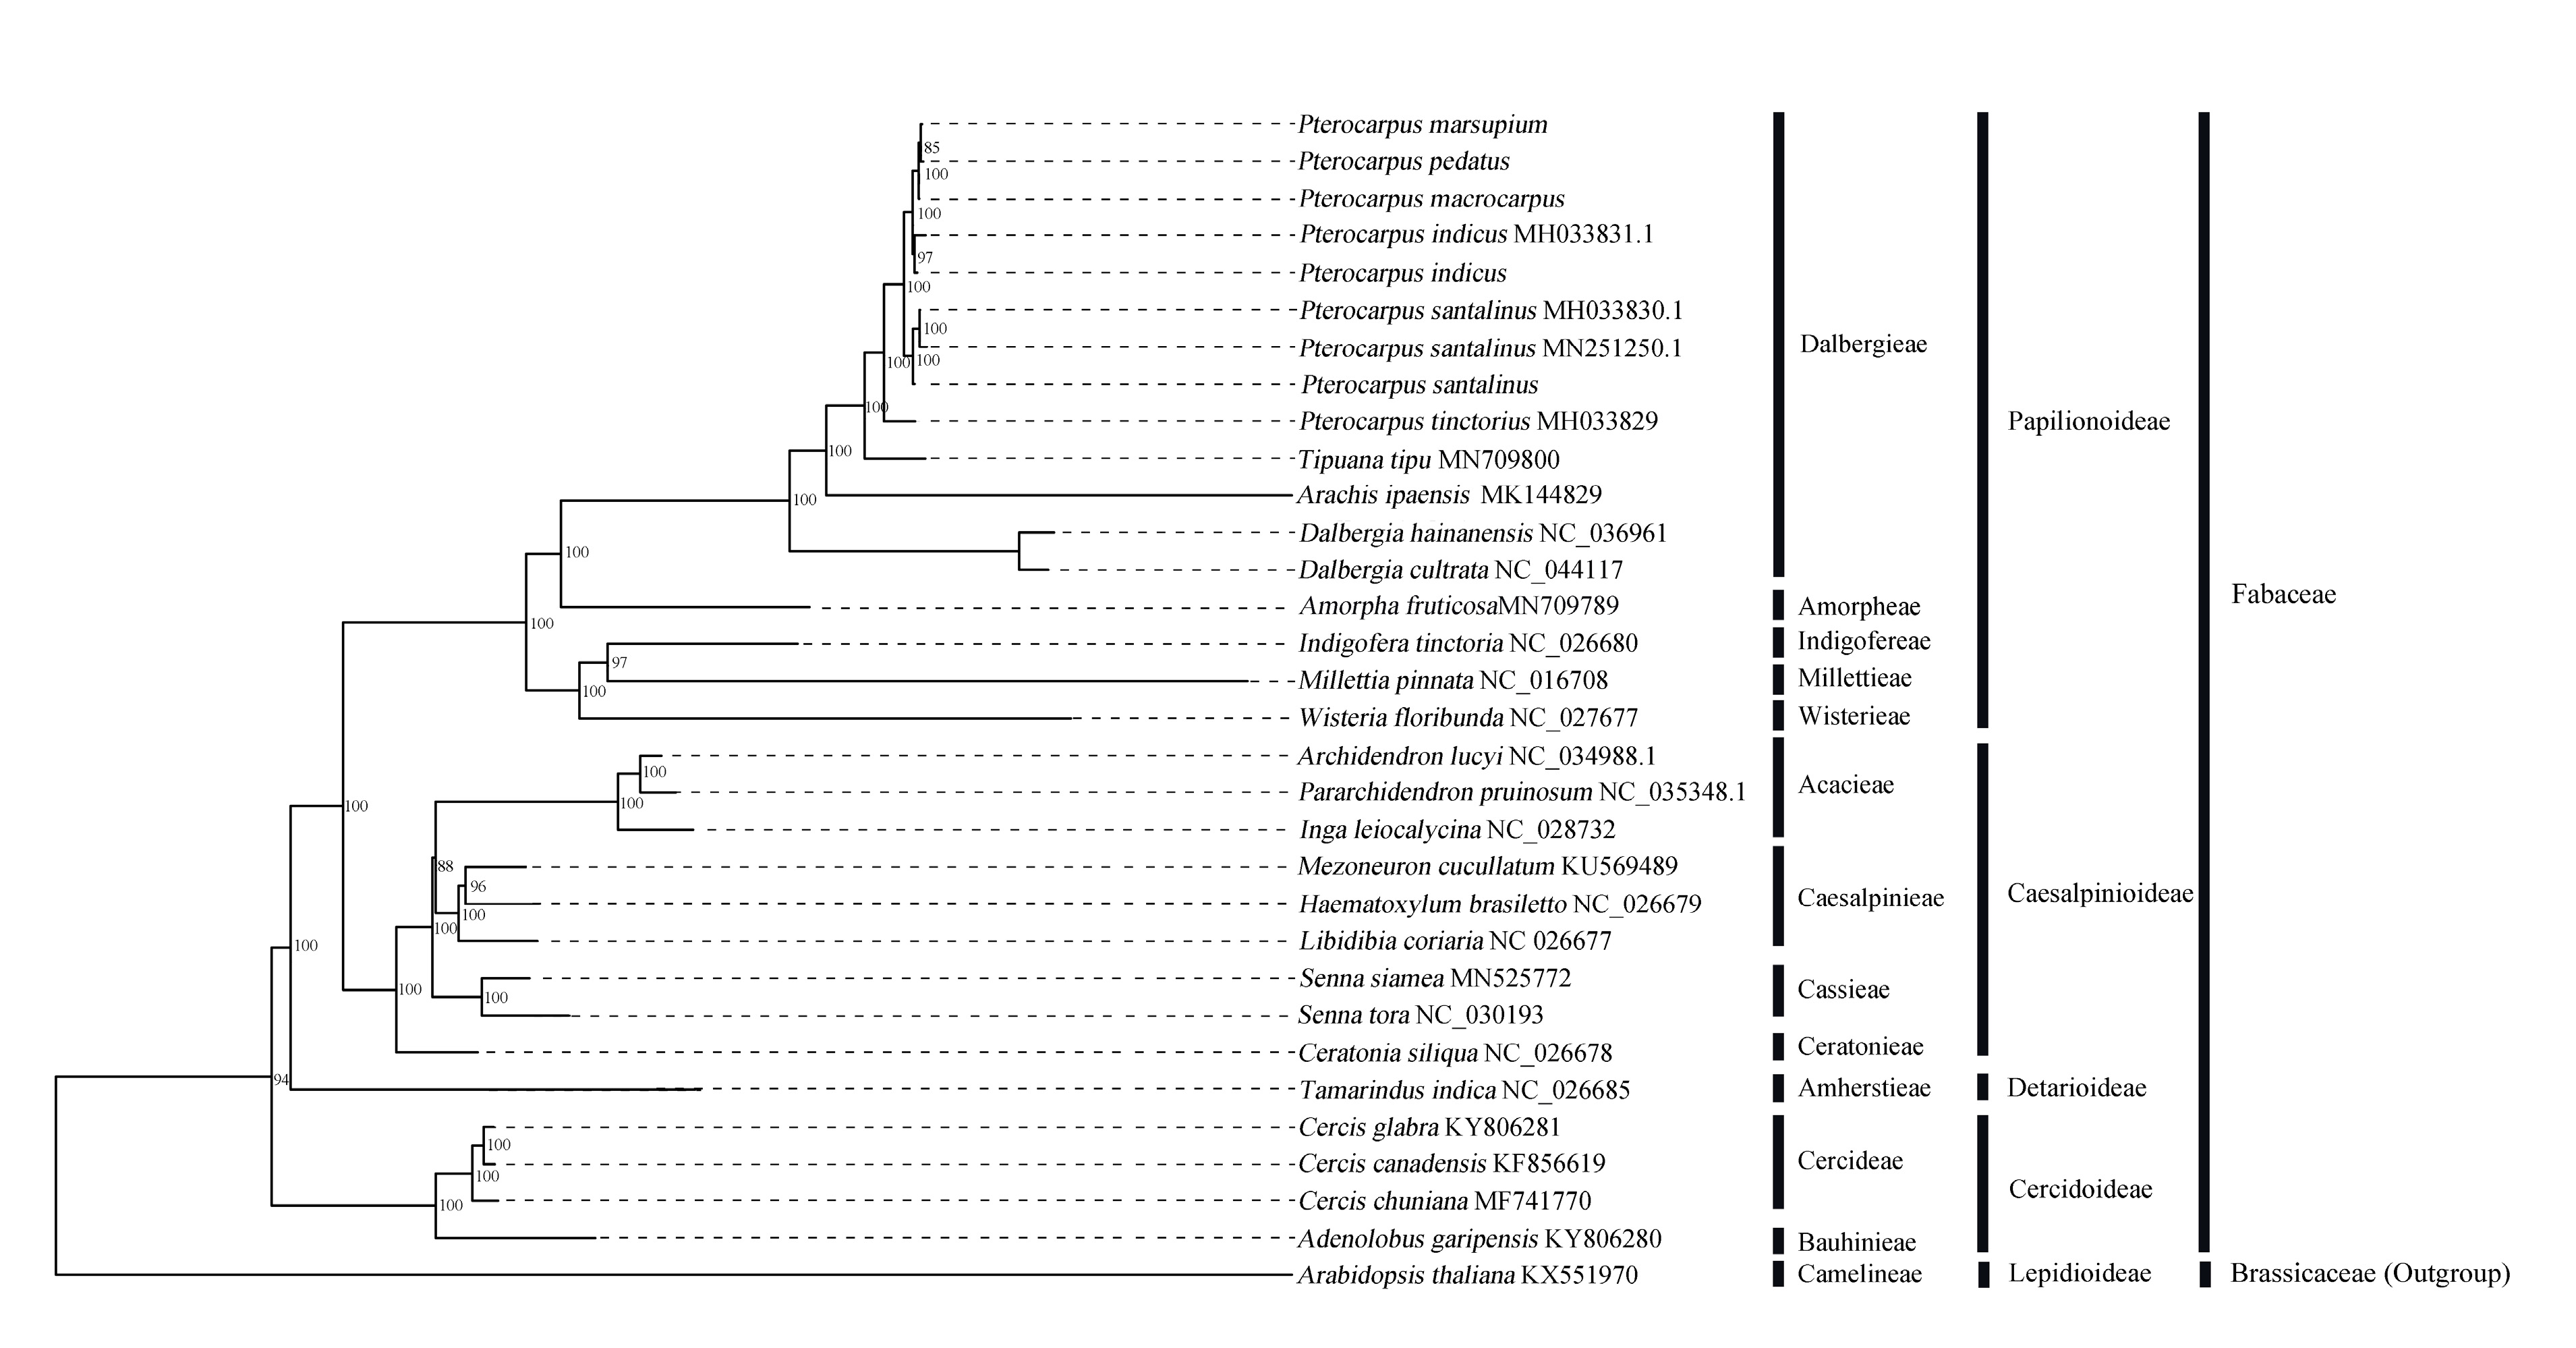
2.6. Phylogenetic Analysis Based on Chloroplast Genome

We adopted the six subfamilies proposed by the Legume Phylogeny Working Group and employed 32 cp genomes (including the five Pterocaprus cp genomes newly sequenced in this study) from four of these subfamilies to infer phylogenetic relationships by employing the maximum likelihood (ML) and Bayesian inference (BI) methods. Support values (BS) across the phylogenetic tree are consistently very high except for the branch leading to Acacieae and Caesalpinieae (BS = 88 for ML and 1.0 for BI, Supplementary Figure S1). Seven species (including nine individuals) of Pterocarpus (M-S-I-P-M2, P. tinctorius and P. santalinus) formed a monophyletic group with high support (BS = 100 for ML). The branch support value (BS = 85) for P. marsupium and P. pedatus was lower than the other branch support values in Pterocaprus. All chloroplast sequences from individuals with the same taxonomic designation resolved in the same clade with high support. However, these chloroplast sequences from the same species did not resolve in a polytomy indicated that within species differences are present in the chloroplast. Within the tribe Dalbergieae, Pterocarpus was resolved as sister to Tipuana tipu. Further, Dalbergia was resolved as an early diverging lineage in this clade (BS = 100, Figure 6). Increased samplings of species within this group could be added to the current dataset to correctly infer the relationships of unresolved taxa. In addition, we calculated the divergence times among the 32 sampled individuals and found that the chloroplast genome dataset provided similar divergence times as those from other genetic datasets (Supplementary Figure S2) [34].

3. Discussion

From the whole cp genomes sequenced thus far in plants, a length 120–160 kb has been found [35,36]. In this study, we sequenced the cp genomes of M-S-I-P-M2, with a length of 157,992–158,966 bp. Therefore, Pterocarpus cp genomes are among some of the larger cp genomes sequenced thus far, even when compared to other species in Fabaceae (Figure 3, Senna siamea 148,437 bp). The expansion of cp genomes is often correlated with expansion and contraction IR/SC junctions [37] which is evident in the comparisons of Pterocaprus species to Senna siamea and Arabidopsis thaliana (Figure 3). Like most angiosperms, the five Pterocarpus cp genomes are similar in structure and consistent to other plant cp genomes with 110 genes [38,39,40] and a high A /T content, which was found to be as high as 63% [33,41,42]. The lower G/C content may be related to the spontaneous mutations in genomes of Pterocarpus [43].
SSR markers have high mutation rates and can be used as a molecular marker for population genetics, phylogenetic inference, and biogeographic studies [44,45,46]. In this study, we detected 333–349 SSR loci in M-S-I-P-M2 cp genomes. The proportion of single nucleotide repeats of A/T is the highest among all the repeat types (72.8–76.4%). This suggests that cp genome contains not only abundant A /T content, but also a large number of short polyadenine (PolyA) /polythymine (poly T) repeats which are associated with polyadenylation at the terminus of mRNA genes [33]. The mono-nucleotide repeats were the most abundant repeats and accounted for 77.9–80.5%. In di-nucleotide repeats, the AT/TA motif was most common. In tri-nucleotide repeats, the AAT/ ATT motif was most common. The SSR loci containing A and T are more common in Pterocarpus. With the increase in motif length, the frequency of SSRs decreased. These are similar to the structural characteristics of chloroplast SSR in dicots. SSR polymorphism is a repeat length polymorphism caused by the elongation or shortening of repeat units [47]. It is widely used for population genetic diversity or population classification analysis [46,48]. At present, the molecular mechanism for the origin of microsatellites is not completely clear. Replication slippage, unequal crossing over, and nucleotide substitution are all possible mechanisms for creating microsatellite variations but do not explain the origin of SSRs [49,50,51]. The SSR marker is one of the common molecular means to study the evolution of species [52,53]. SSR markers can be easily genotyped and often can be used as molecular markers in many related species [54,55,56]. Therefore, SSRs identified from the chloroplast genomes in this study could be valuable markers for future studies in ecology, evolution and tracking of timber.
The IR region is highly conserved and is thought to play an important role in stabilizing the structure of cp genomes [57]. The contraction and expansion of IR regions is a common phenomenon in cp genome evolution, which can contribute to overall length variation of cp genomes [33]. By comparison, we found that the length of M-S-I-P-M2 cp genomes and IR regions were tightly associated in length variation (changes in the length of chloroplast genome ≤ 974 bp; changes in the length of IR region ≤ 22 bp). Compared with Pterocarpus, Arabidopsis thaliana and Senna siamea have longer IR regions and smaller genomes. This has resulted in differences of gene placement at the IR/SC boundaries (rps19, ndhF cross LSC / IRb and IRb / SSC boundaries respectively; trnH distance from IRa / SSC boundary ≤ 6 bp) between them and M-S-I-P-M2 cp genomes (Figure 3) [58]. Our results show that the cp genomes of Pterocarpus may be conserved in gene content in comparison to other angiosperms but have expanded in overall genome length suggesting ongoing evolution in Pterocarpus cp genomes [33,59]. All genes are similarly located across all five species in Pterocarpus (and Dalbergia) in respect to the IR/SC junctions, suggesting that expansion and contraction in the IR and SC regions has not resulted in large changes to the junction boundaries in Dalbergieae.
Because of the highly conserved structure and nucleotide content of plant cp genomes mutational hotspots can be easily identified using comparative analyses. These mutational hotspots flanked by conserved sequences are the basis for highly variable markers (DNA barcodes) often used in population genetic or phylogenetic research [60,61]. In this study, we used mVISTA to compare the whole cp genome sequences of five Pterocarpus species and calculated the percentages of variable characters in the coding region and non-coding regions in order to identify such variable regions. We found that, similar to previous plant studies, the non-coding regions were more variable than the coding regions [62,63,64]. Similar to Artemisia annua and Panax notoginseng, the variation of the SC regions in Pterocarpus cp genomes is greater than that in IR regions [65,66]. In the analysis of chloroplast genome sequence variation, we detected nine highly variable regions in coding (rpoC2-exon2, ccsA, and trnfM-CAU) and non-coding regions (Start_ trnH-GUG, trnH-GUG_psbA, trnS-UGA_psbC, accD-psaI, ndhI-exon2_ndhI-exon1, and ndhG_ndhi-exon2). In previous studies, in addition to the Start_ trnH-GUG and ndhI-exon2_ndhI-exon1 regions, seven highly variable regions have been used as DNA barcodes in other plants or are in the process of being developed as DNA barcodes [67,68,69,70,71]. Our results showed that the Pi of ndhI-exon2_ndhI-exon1 in Pterocarpus is more than 0.01, which is considered a highly variable region. We suggest that trnH-GUG_psbA, trnS-UGA_psbC, accD-psaI, ndhI-exon2_ndhI-exon1, ndhG_ndhi-exon2, rpoC2-exon2, ccsA, and trnfM-CAU, the regions with the highest degree of variation in the chloroplast genome of Pterocarpus, be used as DNA barcodes. These highly variable regions may also be useful for the resolution of interspecific relationships of Pterocarpus in the phylogeny of legumes.
Non-synonymous (Ka) and synonymous (Ks) mutations, and the ratio between these (ω = Ka/Ks) when compared across different species or populations, can be used to infer what type of selection is acting upon different genes [72]. Because the cp genome is a non-recombining genome [73], it is rare to have a large number of recombination events, resulting in a low DNA replacement rate and gene conservation [62,74,75,76]. Despite the lack of recombination, purifying selection is still an important mechanism in cp genomes for maintaining a given gene function through time [77]. In this study, we found that most of the genes of P. santalinus, compared with those of P. macrocarpus, P. indicus, P. pedatus and P. marsupium, has ω < 1 suggesting that purifying selection has been important in maintaining conserved gene residues. The regions with high purifying selection pressure were mainly found among the genes related to photosynthesis (Subunits of photosystem II and Subunits of ATP synthase; Table 1). Similar to the evolution of WRKY family in Gramineae, strong purifying selection conserves specific gene residues and gene functions across species in Pterocarpus [78]. Other genes of Pterocarpus were inferred to be under strong positive selection and were mainly found in genes for self-replication (large subunits of ribosome and small subunits of ribosome), photosynthesis (subunits of NADH dehydrogenase), and genes of unknown function (ycf genes) (Table 1). As such, positive selection may promote the functional divergence between these genes [79].
In this study, the M-S-I-P-M2 cp genomes were used to analyze the phylogenetic relationship of Pterocarpus and the phylogenetic position of Pterocarpus in Fabaceae. The phylogenetic analysis shows that Pterocarpus is a monophyletic group [80]. Among the seven cp genomes of Pterocarpus (M-S-I-P-M2, P. tinctorius, and P. santalinus), P. tinctorius was resolved as early diverging [4]. The results from our phylogenetic analyses concur with those from other studies demonstrating the utility of cp phylogenomic in plant systematics studies of Fabaceae [28,81,82]. In addition, the branching pattern among samples from the same species of Pterocarpus indicate that the chloroplast data could be used for studying intraspecific relationships in this genus.

4. Materials and Methods

4.1. Plant Material

We collected fresh leaves from five species of Pterocarpus for DNA extraction. The leaf material of P. macrocarpus was collected in Baan Loom Soom, Saiyok, Kanchanaburi, Thailand (14.22° N, 99.20° E). The leaf material of P. santalinus was collected from Calcutta, West Bengal, India (23.35° N, 88.52° E) and the P. indicus leaf material was collected from Hoskote, Bangalore, Karnataka, India (13.1° N, 77.8° E). The leaf material of P. pedatus and P. marsupium were collected at the Experimental Station of Research Institute of Tropical Forestry, Chinese Academy of Forestry, Jianfeng Town, Ledong Li Autonomous County, China (18.69° N, 108.79° E).

4.2. DNA Extraction and Sequencing

We extracted high-quality DNA from fresh leaves using an E.Z.N.A® Plant DNA kit (Omega Bio-Tek Inc., Norcross, GA, USA). The DNA quality was assessed with an Agilent 2100 Bioanalyzer (UC Davis Genome Center, Davis, CA, USA) [83]. The total DNA was sequenced on an Illumina HiSeq X Ten platform, a Hiseq 4000 (Illumina Inc., San Diego, CA, USA) and using long read sequencing on a Pacific Biosciences (Shanghai, China; PacBio; Preparing Arabidopsis Genomic DNA for Size-Selected~ 20 kb SMRTbell™ Libraries) Sequel platform at the same time. For Illumina sequencing, libraries with the paired-end short-insert of 450 bp were generated for the HiSeq X Ten platform. The, the DNA libraries were also sequenced on Illumina Hiseq 4000 [84]. For PacBio sequencing, 20 kb libraries were generated and sequenced on the PacBio Sequel instrument [85].

4.3. Sequence Assembly of cp Genomes

The raw sequencing data from the Illumina reads was first filtered and quality controlled through Trimmomatic v0.39 (available online: http://www.usadellab.org/cms/?page=trimmomatic) to remove the reads of low quality (>10% Ns, > 40% low quality bases or small segments with length less than 75 bp after pruning). The clean reads were initially assembled with ABySS v2.0.2 (available online: http://www.bcgsc.ca/platform/bioinfo/software/abyss). The long read PacBio data were corrected by mapping the high depth Illumina reads onto the PacBio scaffolds [86]. Assembly of chloroplast genome (illumina data+ PacBio data) was done using SPAdes-3.13.0 (available online: http://cab.spbu.ru/software/spades/) [87]. The assembled sequences were then checked against the Nucleotide Sequence Database (GeneBank; available online: https://www.ncbi.nlm.nih.gov/) to confirm the chloroplast scaffold sequences. The chloroplast assembly results were optimized by aligning with the original clean Illumina reads using the Burrows-Wheeler Aligner (available online: http://bio-bwa.sourceforge.net/) and base correction is then performed with Pilon v1.22 (available online: https://github.com/broadinstitute/pilon). [88].

4.4. Gene Annotation

The reference genome (Saccharum hildebrandtii, GenBank: MF563371.1) was used to correct the starting position of the assembled chloroplast genomes and determine the position and direction of the chloroplast junction boundaries (LSC / IRa / SSC / IRb). The genes of the chloroplasts were annotated using DOGMA via the online server [89]. To remove the redundancy of the predicted genes, the Saccharum hildebrandii chloroplast genome sequence (GenBank: MF563371.1) was used as a reference to manually correct the head and tail of the gene and exon / intron boundaries. The gene map of the cp genomes was drawn using OrganellarGenomeDRAW v1.3.1 (available online: https://chlorobox.mpimp-golm.mpg.de/OGDraw.html) [90]. BLAST searches (E-value <= 1E-5, minimal alignment length percentage >= 40%) for whole chloroplast genome were performed against 5 databases. Kyoto Encyclopedia of Genes and Genomes [91,92,93,94], Clusters of Orthologous Groups [95], Non-Redundant Protein Database databases [96], Swiss-Prot [97], and Gene Ontology [98] were used to properly annotate the functional information of each coding gene.

4.5. Identification of Repeat Sequences and Simple Sequence Repeats (SSR)

Repeat sequences in the cp genomes were identified using the program REPuter (available online: http://bibiserv.techfak.uni-bielefeld.de/reputer/) and included four types of repeat: forward repeat (F), reverse repeat (R), complementary repeat (C) and palindromic repeat (P). Detection parameter settings were as minimum repeat size 30 bp, and an edit distance of 3.
SSR identification was carried out on the cp genome sequences by MIcroSAtellite identification tool (MISA; available online: http://pgrc.ipk-gatersleben.de/misa/http://pgrc.ipk-gatersleben.de/misa/) with the parameter settings: unit-size (nucleotide) _min-repeats: 1_8, 2_5, 3_4, 4_3, 5_3, 6_3. The minimum distance between two SSRs was set to 100 bp [99].

4.6. Polymorphism Analysis, Comparison of Genome Structure, and IR Region Contraction and Expansion Analysis of M-S-I-P-M2 cp Genomes

The divergence among different cp genomes and the identification of mutational hot spots was done by quantifying nucleotide variability in DnaSP v5.10 on coding and non-coding sequences separately [100]. The multiple sequence alignment for cp genome was conducted using MAFFT v.7 [101]. The expansion and contraction of the IR regions will change the length and structure of cp genome overall, which can change the copy number of adjacent genes and lead to the formation of pseudogenes [102]. Eight cp genomes (M-S-I-P-M2; Dalbergia cultrata, NC_044117; Senna siamea, MN 525772; and Arabidopsis thaliana, KX 551970) were selected to compare the location of IRs, the SSC and LSC junctions in different genomes. The boundary differences among the five Pterocarpus cp genomes (M-S-I-P-M2) were visualized using mVISTA (default parameters and Shuffle-LAGAN mode) [103].

4.7. Gene Selective Pressure Analysis

In order to assess the selection pressure of genes in the cp genomes of Pterocarpus, we calculated the synonymous (Ks) and non-synonymous (Ka) mutation rates of exons of orthologous coding genes (77) in the M-S-I-P-M2 cp genomes (P. santalinus was used as a reference) using Geneious v9.0.5 (Biomatters, Auckland, New Zealand). The analysis of selection pressure is calculated by the ratio of non-synonymous (Ka) to the synonymous mutation rate (Ks) (ω = Ka / Ks). We also combined all the coding gene as one huge data matrix to evaluate the selection for this Pterocarpus clade by using the PAML method.

4.8. Phylogenetic Analysis of Chloroplast Genomes

In this study, in addition to the five new sequenced M-S-I-P-M2 cp genomes of Pterocarpus, an additional 27 cp genomes (from 2 families, 5 subfamilies and 12 tribes, outgroup: Arabidopsis thaliana, Supplementary Table S4) were downloaded from NCBI to resolve a chloroplast phylogenetic tree. The sequences were aligned using ClustalW (v2.0.12) with the default settings. The DNA substitution model chose was assessed using the Akaike information criterion (AIC) method [104]. Maximum likelihood (ML) phylogenetic inference was done using RAxMLv8.2.6 with 1000 bootstrap pseudo-replicates to assess branch support [105,106]. Bayesian inference (BI) using MrBayes3.1.2 was also employed based on the method from Wu et al. [107].

5. Conclusions

In this study, the complete cp genomes of five species of Pterocarpus (P. macrocarpus, P. santalinus, P. indicus, P. pedatus and P. marsupium) were sequenced by high-throughput sequencing for the first time. Through comparison, we found that the cp genomes of five species have similar structural characteristics and have the typical four-part structure as other land plants. The chloroplast genome contains abundant SSR loci (A/T as the main component). Through nucleotide variation analysis, we found that eight mutational hot spots (trnH-GUG_psbA, trnS-UGA_psbC, accD-psaI, ndhI-exon2_ndhI-exon1, ndhG_ndhi-exon2, rpoC2-exon2, ccsA and trnfM-CAU) could be used as DNA barcode regions for Pterocarpus. In the comparison of gene selection pressures (P. santalinus as the reference genome), purifying selection was found to be important in maintaining conserved gene function. Phylogenetic analysis shows that Pterocarpus is a monophyletic group. The finished cp genomes of Pterocarpus and comparative analyses provide numerous different types of genetic markers with uses ranging from population genetic studies to the tracking of the origin of timber.

Supplementary Materials

Supplementary materials can be found at https://www.mdpi.com/1422-0067/21/11/3758/s1. Table S1. The M-S-I-P-M2 cp genomes of Pterocarpus assembly, size, and features. Table S2. The repeats (≥30 bp) identified in M-S-I-P-M2 cp genomes (repetition type; F: Forward, R: Reverse, C: Complement, P: Palindromic). Table S3. The SSR positions in M-S-I-P-M2 cp genomes. Table S4. The information of 22 chloroplast genomes downloaded from Genebank (NCBI, https://www.ncbi.nlm.nih.gov/). Figure S1. Phylogenetic tree for 32 species in Fabaceae (Arabidopsis thaliana as an outgroup) using Bayesian inference (BI), based on alignments of complete chloroplast genomes.; Figure S2. Divergence times among the 32 sampled individuals based on Bayesian inference.

Author Contributions

Z.H. conceived and designed the study. K.Z. performed the experiments. Z.Y., N.Z. and J.G. contributed materials and data analysis. Z.H. and Z.W. wrote the paper. Z.W., L.R.T. and D.X. revised the paper. All authors have read and agreed to the published version of the manuscript.

Funding

This study was co-supported by the Research Funds for the Central Non-profit Research Institution of Chinese Academy of Forestry (CAFYBB2020SZ005, CAFYBB2018SZ002) and National Natural Science Foundation of China (31500537).

Acknowledgments

We sincerely thank Shanghai BIOZERON Biotechnology Co., Ltd. for performing the high throughput sequencing.

Conflicts of Interest

The authors declare no conflict of interest.

References

  1. Ng, F.S.P. Pterocarpus Indicus-the Majestic N-fixing Tree; NFT Highlights; Nitrogen Fixing Tree Association (NFTA): Waimanalo, HI, USA, 1992; pp. 92–94. [Google Scholar]
  2. Jansen, P.C.M.; Westphal, E.; Sosef, M.S.M.; Soerianegara, I.; Lemmens, R. Plant Resources of South-East Asia 5-1. Timber Trees: Major Commercial Timbers; Bogor: Wageningen, The Netherlands, 1993; pp. 102–106. [Google Scholar]
  3. Chen, Q.D.; Li, X.M.; Zeng, J.; Li, C.W. Introduction status and perspectives of Pterocarpus in China. Sci. Technol. 2004, 2, 38–41. [Google Scholar]
  4. Saslis-Lagoudakis, C.H.; Klitgaard, B.B.; Forest, F.; Francis, L.; Savolainen, V.; Williamson, E.M.; Hawkins, J.A. The use of phylogeny to interpret cross-cultural patterns in plant use and guide medicinal plant discovery: An example from Pterocarpus (Leguminosae). PLoS ONE 2011, 6, e22275. [Google Scholar] [CrossRef] [PubMed] [Green Version]
  5. Waeber, P.O.; Schuurman, D.; Ramamonjisoa, B.; Langrand, M.; Barber, C.V.; Innes, J.L.; Lowry II, P.P.; Wilmé, L. Uplisting of Malagasy precious woods critical for their survival. Biol. Conserv. 2019, 235, 89–92. [Google Scholar] [CrossRef]
  6. Dumenu, W.K. Assessing the impact of felling/export ban and CITES designation on exploitation of African rosewood (Pterocarpus erinaceus). Biol. Conserv. 2019, 236, 124–133. [Google Scholar] [CrossRef]
  7. Frankham, R.; Ballou, J.; Briscoe, D. Introduction to Conservation Genetics; Cambridge University Press: Cambridge, UK, 2002; p. 617. [Google Scholar]
  8. IUCN. IUCN red list of threatened species. Version 2017, 2017, 3. [Google Scholar]
  9. He, T.; Jiao, L.; Wiedenhoeft, A.C.; Yin, Y. Machine learning approaches outperform distance-and tree-based methods for DNA barcoding of Pterocarpus wood. Planta 2019, 249, 1617–1625. [Google Scholar] [CrossRef]
  10. Zhang, M.; Zhao, G.J.; Liu, B.; He, T.; Guo, J.; Jiang, X.; Yin, Y. Wood discrimination analyses of Pterocarpus tinctorius and endangered Pterocarpus santalinus using DART-FTICR-MS coupled with multivariate statistics. IAWA J. 2019, 40, 58–74. [Google Scholar] [CrossRef] [Green Version]
  11. Yadav, V.K.; Mishra, A. In vitro & in silico study of hypoglycemic potential of Pterocarpus marsupium heartwood extract. Nat. Prod. Res. 2019, 33, 3298–3302. [Google Scholar]
  12. Karthick, M.; Parthiban, K. Chemical characterization of Pterocarpus santalinus wood using GC-MS. J. Pharmacogn. Phytochem. 2019, 8, 380–382. [Google Scholar]
  13. Tip-pyang, S.; Aree, T.; Sichaem, J. Pterocarpans and Isoflavones from the Heartwood of Pterocarpus indicus. Chem. Nat. Compd. 2019, 55, 121–123. [Google Scholar] [CrossRef]
  14. Thanuja, P.; Nadukeri, S.; Kolakar, S.S. Effect of pre sowing seed treatments on seed germination and seedling growth in Rakta Chandana (Pterocarpus santalinus L.): An Endangered medicinal plant. J. For. Environ. Sci. 2019, 7, 1577–1580. [Google Scholar]
  15. Musa, F.; Jayeoba, F.; Olayiwola, V.; Adekunle, E.; Abiodun, F. Residual effect of organic manure (biochar and cowdung) on the growth of Pterocarpus osun. Curr. J. Appl. Sci. Technol. 2019, 37, 1–6. [Google Scholar] [CrossRef] [Green Version]
  16. Xu, C.; Zhang, S.; Li, C. Pathogen isolation and identification of a serious leaf disease of red sandalwood (Pterocarpus santalinus) seedlings. Agric. Biotechnol. 2017, 6, 45–48. [Google Scholar]
  17. Degen, B.; Fladung, M. Use of DNA-markers for tracing illegal logging. In Proceedings of the International Workshop “Fingerprinting Methods for the Identification of Timber Origins”, Bonn, Germany, 8–9 October 2007; pp. 8–9. [Google Scholar]
  18. Gray, M.W. The evolutionary origins of organelles. Trends Genet. 1989, 5, 294–299. [Google Scholar] [CrossRef]
  19. Howe, C.J.; Barbrook, A.C.; Koumandou, V.L.; Nisbet, R.E.R.; Symington, H.A.; Wightman, T.F. Evolution of the chloroplast genome. Philos. Trans. R. Soc. Lond. Ser. B Biol. Sci. 2003, 358, 99–107. [Google Scholar] [CrossRef] [Green Version]
  20. Wu, F.H.; Chan, M.T.; Liao, D.C.; Hsu, C.T.; Lee, Y.W.; Daniell, H.; Duvall, M.R.; Lin, C.S. Complete chloroplast genome of Oncidium Gower Ramsey and evaluation of molecular markers for identification and breeding in Oncidiinae. BMC Plant Biol. 2010, 10, 68. [Google Scholar] [CrossRef] [Green Version]
  21. Li, P.; Lu, R.S.; Xu, W.Q.; Ohi-Toma, T.; Cai, M.Q.; Qiu, Y.X.; Cameron, K.M.; Fu, C.X. Comparative genomics and phylogenomics of East Asian tulips (Amana, Liliaceae). Front. Plant Sci. 2017, 8, 451. [Google Scholar] [CrossRef] [Green Version]
  22. Bi, Y.; Zhang, M.F.; Xue, J.; Dong, R.; Du, Y.P.; Zhang, X.H. Chloroplast genomic resources for phylogeny and DNA barcoding: A case study on Fritillaria. Front. Plant Sci. 2018, 8, 1184. [Google Scholar] [CrossRef] [Green Version]
  23. Lu, R.S.; Li, P.; Qiu, Y.X. The complete chloroplast genomes of three Cardiocrinum (Liliaceae) species: Comparative genomic and phylogenetic analyses. Front. Plant Sci. 2017, 7, 2054. [Google Scholar] [CrossRef]
  24. Niu, Y.T.; Florian, J.; Russell, L. Combining complete chloroplast genome sequences with target loci data and morphology to resolve species limits in Triplostegia (Caprifoliaceae). Mol. Phylogenet. Evol. 2018, 129, 15–26. [Google Scholar] [CrossRef]
  25. Pinard, D.; Myburg, A.A.; Mizrachi, E. The plastid and mitochondrial genomes of Eucalyptus grandis. BMC Genom. 2019, 20, 132. [Google Scholar] [CrossRef] [PubMed]
  26. Coyne, J.A.; Orr, H.A. Speciation; Sinauer Associates: Sunderland, MA, USA, 2004; Volume 276, p. 281. [Google Scholar]
  27. Mallet, J. Hybrid speciation. Nature 2007, 446, 279–283. [Google Scholar] [CrossRef] [PubMed]
  28. Borges, L.; Bruneau, A.; Cardoso, D.; Crisp, M.; Delgado-Salinas, A.; Doyle, J.; Egan, A.; Herendeen, P.; Hughes, C.; Kenicer, G. Towards a new classification system for legumes: Progress report from the 6th International Legume Conference. S. Afr. J. Bot. 2013, 89, 3–9. [Google Scholar] [CrossRef] [Green Version]
  29. Wojciechowski, M.F.; Lavin, M.; Sanderson, M.J. A phylogeny of legumes (Leguminosae) based on analysis of the plastid matK gene resolves many well-supported subclades within the family. Am. J. Bot. 2004, 91, 1846–1862. [Google Scholar] [CrossRef]
  30. Klitgård, B.B.; Forest, F.; Booth, T.J.; Saslis-Lagoudakis, C.H. A detailed investigation of the Pterocarpus clade (Leguminosae: Dalbergieae): Etaballia with radially symmetrical flowers is nested within the papilionoid-flowered Pterocarpus. S. Afr. J. Bot. 2013, 89, 128–142. [Google Scholar] [CrossRef] [Green Version]
  31. Jiao, L.; Lu, Y.; He, T.; Li, J.; Yin, Y. A strategy for developing high-resolution DNA barcodes for species discrimination of wood specimens using the complete chloroplast genome of three Pterocarpus species. Planta 2019, 250, 95–104. [Google Scholar] [CrossRef]
  32. Huang, J.; Chen, R.; Li, X. Comparative analysis of the complete chloroplast genome of four known Ziziphus species. Genes 2017, 8, 340. [Google Scholar] [CrossRef] [Green Version]
  33. Fu, J.M.; Liu, H.M.; Hu, J.J.; Liang, Y.Q.; Liang, J.J.; Wu, T.N. Five complete chloroplast genome sequences from Diospyros: Genome organization and comparative analysis. PLoS ONE 2016, 11, e0159566. [Google Scholar] [CrossRef] [Green Version]
  34. Xie, Y.P.; Meng, Y.; Sun, H.; Nie, Z.L. Molecular phylogeny of Gueldenstaedtia and Tibetia (Fabaceae) and their biogeographic differentiation within Eastern Asia. PLoS ONE 2006, 11, e0162982. [Google Scholar] [CrossRef]
  35. Zhang, Y.; Li, L.; Yan, T.L.; Liu, Q. Complete chloroplast genome sequences of Praxelis (Eupatorium catarium Veldkamp), an important invasive species. Gene 2014, 549, 58–69. [Google Scholar] [CrossRef]
  36. Curci, P.L.; De Paola, D.; Danzi, D.; Vendramin, G.G.; Sonnante, G. Complete chloroplast genome of the multifunctional crop globe artichoke and comparison with other Asteraceae. PLoS ONE 2015, 10, e0120589. [Google Scholar] [CrossRef] [PubMed]
  37. Wang, W.; Messing, J. High-throughput sequencing of three Lemnoideae (duckweeds) chloroplast genomes from total DNA. PLoS ONE 2011, 6, e24670. [Google Scholar] [CrossRef] [PubMed] [Green Version]
  38. Jansen, R.K.; Cai, Z.; Raubeson, L.A.; Daniell, H.; Depamphilis, C.W.; Leebens-Mack, J.; Müller, K.F.; Guisinger-Bellian, M.; Haberle, R.C.; Hansen, A.K. Analysis of 81 genes from 64 plastid genomes resolves relationships in angiosperms and identifies genome-scale evolutionary patterns. Proc. Natl. Acad. Sci. USA 2007, 104, 19369–19374. [Google Scholar] [CrossRef] [PubMed] [Green Version]
  39. Ng, W.L.; Cai, Y.; Wu, W.; Zhou, R. The complete chloroplast genome sequence of Melastoma candidum (Melastomataceae). Mitochondrial DNA Part B 2017, 2, 242–243. [Google Scholar] [CrossRef] [Green Version]
  40. Gu, C.; Tembrock, L.R.; Zheng, S.; Wu, Z. The complete chloroplast genome of Catha edulis: A comparative analysis of genome features with related species. Int. J. Mol. Sci. 2018, 19, 525. [Google Scholar] [CrossRef] [Green Version]
  41. Yi, D.K.; Kim, K.J.; Zhang, J.W. Complete chloroplast genome sequences of important oilseed crop Sesamum indicum L. PLoS ONE 2012, 7, e35872. [Google Scholar] [CrossRef] [Green Version]
  42. Mariotti, R.; Cultrera, N.G.; Díez, C.M.; Baldoni, L.; Rubini, A. Identification of new polymorphic regions and differentiation of cultivated olives (Olea europaea L.) through plastome sequence comparison. BMC Plant Biol. 2010, 10, 211. [Google Scholar] [CrossRef] [Green Version]
  43. Schmid, P.; Flegel, W.A. Codon usage in vertebrates is associated with a low risk of acquiring nonsense mutations. J. Transl. Med. 2011, 9, 87. [Google Scholar] [CrossRef] [Green Version]
  44. Gong, W.L.; Ma, L.; Gong, P.; Liu, X.Q.; Wang, Z.; Zhao, GQ. Development and application of EST–SSRs markers for analysis of genetic diversity in erect milkvetch (Astragalus adsurgens Pall.). Mol. Biol. Rep. 2019, 46, 1323–1326. [Google Scholar] [CrossRef]
  45. Pauwels, M.; Vekemans, X.; Godé, C.; Frérot, H.; Castric, V.; Saumitou-Laprade, P. Nuclear and chloroplast DNA phylogeography reveals vicariance among European populations of the model species for the study of metal tolerance, Arabidopsis halleri (Brassicaceae). New Phytol. 2012, 193, 916–928. [Google Scholar] [CrossRef]
  46. Zhao, K.K.; Landrein, S.; Barrett, R.; Sakaguchi, S.; Maki, M.; Mu, W.; Yang, T.; Zhu, Z.; Liu, H.; Wang, H.F. Phylogeographic analysis and genetic structure of an endemic Sino-Japanese disjunctive genus Diabelia (Caprifoliaceae). Front. Plant Sci. 2019, 10, 913. [Google Scholar] [CrossRef] [PubMed] [Green Version]
  47. Sonah, H.; Deshmukh, R.K.; Sharma, A.; Singh, V.P.; Gupta, D.K.; Gacche, R.N.; Rana, J.C.; Singh, N.K.; Sharma, T.R. Genome-wide distribution and organization of microsatellites in Plants: An insight into marker development in Brachypodium. PLoS ONE 2011, 6, e21298. [Google Scholar] [CrossRef] [PubMed] [Green Version]
  48. Xu, X.L.; Xu, L.A.; Huan, M.R.; Wang, Z.R. Genetic diversity of microsatellites (SSRs) of natural populations of Quercus variabilis. Hereditas (Beijing) 2004, 26, 683–688. [Google Scholar]
  49. Levinson, G.; Gutman, G.A. Slipped-strand mispairing: A major mechanism for DNA sequence evolution. Mol. Biol. Evol. 1987, 4, 203–221. [Google Scholar]
  50. Schlotterer, C.; Tautz, D. Slippage synthesis of simple sequence DNA. Nucleic Acids Res. 1992, 20, 211–215. [Google Scholar] [CrossRef] [Green Version]
  51. Hancock, J.M. Microsatellites and other simple sequences: Genomic context and mutational mechanisms. In Microsatellites: Evolution and Applications; Goldstein, D., Schlotterer, C., Eds.; Oxford University Press: New York, NY, USA, 1999; pp. 1–9. [Google Scholar]
  52. Wang, L.Y.; Liu, B.Y.; Jiang, Y.H.; Duan, Y.S.; Cheng, H.; Zhou, J.; Tang, Y.C. Phylogenetic analysis of interspecies in section Thea through SSR markers. J. Tea Sci. 2009, 29, 341–346. [Google Scholar]
  53. Shi, J.X.; Qiao, Y.; Ma, Y.Q.; Ji, W.Q.; He, P.R.; Weng, Y.J. Analysis on genetic evolution relation of A, B genomes between Triticum aestivum and T. dicoccoides by SSR. Acta Bot. Boreali Occident. Sin. 2003, 23, 933–937. [Google Scholar]
  54. Deng, S.Y.; Wen, Q.; Li, K.Q.; Ye, J.S.; Zhu, P.L. Screening and application of SSR primers in plants of Clerodendrum L. Chin. Tradit. Herb. Drugs 2014, 63, 3317–3322. [Google Scholar]
  55. Han, Q.; Wang, H.; Wang, J.M.; Zhao, J.R.; Yang, M.-S. Genertic diversity analysis of salicaceae cultivars by transferablity of SSR primers. Mol. Plant Breed. 2009, 5, 904–911. [Google Scholar]
  56. Zhong, M.; Cheng, X.Z.; Wang, L.X.; Wang, S.H.; Wang, X. Transferability of mungbean genomic-SSR markers in other Vigna species. Acta Agron. Sin. 2012, 38, 223–230. [Google Scholar] [CrossRef]
  57. Maréchal, A.; Brisson, N. Recombination and the maintenance of plant organelle genome stability. New Phytol. 2010, 186, 299–317. [Google Scholar] [CrossRef] [PubMed]
  58. Mo, Z.H.; Lou, W.R.; Chen, Y.Q.; Jia, X.D.; Zhai, M.; Guo, Z.R.; Xuan, J.P. The Chloroplast Genome of Carya illinoinensis: Genome Structure, Adaptive Evolution, and Phylogenetic Analysis. Forests 2020, 11, 207. [Google Scholar] [CrossRef] [Green Version]
  59. Fajardo, D.; Senalik, D.; Ames, M.; Zhu, H.; Steffan, S.A.; Harbut, R.; Polashock, J.; Vorsa, N.; Gillespie, E.; Kron, K. Complete plastid genome sequence of Vaccinium macrocarpon: Structure, gene content, and rearrangements revealed by next generation sequencing. Tree Genet. Genomes 2013, 9, 489–498. [Google Scholar] [CrossRef]
  60. Kuang, D.Y.; Wu, H.; Wang, Y.L.; Gao, L.M.; Zhang, S.Z.; Lu, L. Complete chloroplast genome sequence of Magnolia kwangsiensis (Magnoliaceae): Implication for DNA barcoding and population genetics. Genome 2011, 54, 663–673. [Google Scholar] [CrossRef] [PubMed] [Green Version]
  61. Mehmood, F.; Shahzadi, I.; Waseem, S.; Mirza, B.; Ahmed, I.; Waheed, M.T. Chloroplast genome of Hibiscus rosa-sinensis (Malvaceae): Comparative analyses and identification of mutational hotspots. Genomics 2020, 112, 581–591. [Google Scholar]
  62. Clegg, M.T.; Gaut, B.S.; Learn, G.H.; Morton, B.R. Rates and patterns of chloroplast DNA evolution. Proc. Natl. Acad. Sci. USA 1994, 91, 6795–6801. [Google Scholar] [CrossRef] [Green Version]
  63. Perry, A.S.; Wolfe, K.H. Nucleotide substitution rates in legume chloroplast DNA depend on the presence of the inverted repeat. J. Mol. Evol. 2002, 55, 501–508. [Google Scholar] [CrossRef]
  64. Huang, H.; Shi, C.; Liu, Y.; Mao, S.-Y.; Gao, L.-Z. Thirteen Camellia chloroplast genome sequences determined by high-throughput sequencing: Genome structure and phylogenetic relationships. BMC Evol. Biol. 2014, 14, 151. [Google Scholar] [CrossRef] [Green Version]
  65. Shen, X.F.; Wu, M.L.; Liao, B.S.; Liu, Z.X.; Bai, R.; Xiao, S.M.; Li, X.W.; Zhang, B.L.; Xu, J.; Chen, S.L. Complete chloroplast genome sequence and phylogenetic analysis of the medicinal plant Artemisia annua. Molecules 2017, 22, 1330. [Google Scholar] [CrossRef]
  66. Dong, W.P.; Liu, H.; Xu, C.; Zuo, Y.J.; Chen, Z.J.; Zhou, S.L. A chloroplast genomic strategy for designing taxon specific DNA mini-barcodes: A case study on ginsengs. BMC Genet. 2014, 15, 138. [Google Scholar] [CrossRef] [Green Version]
  67. Chat, J.; Decroocq, S.; Decroocq, V.; Petit, R. A case of chloroplast heteroplasmy in kiwifruit (Actinidia deliciosa) that is not transmitted during sexual reproduction. J. Hered. 2002, 93, 293–300. [Google Scholar] [CrossRef] [PubMed] [Green Version]
  68. Hu, C.Y.; Zheng, X.Y.; Teng, Y.W. Characterization and phylogenetic utility of non-coding chloroplast regions trnL-trnF and accD-psaI in Pyrus. Acta Hortic. Sin. 2011, 38, 2261–2272. [Google Scholar]
  69. Liston, A.; Wheeler, J.A. The phylogenetic position of the genus Astragalus (Fabaceae): Evidence from the chloroplast genes rpoC1 and rpoC2. Biochem. Syst. Ecol. 1994, 22, 377–388. [Google Scholar] [CrossRef]
  70. Scarcelli, N.; Barnaud, A.; Eiserhardt, W.; Treier, U.A.; Seveno, M.; d’Anfray, A.; Vigouroux, Y.; Pintaud, J.-C. A set of 100 chloroplast DNA primer pairs to study population genetics and phylogeny in monocotyledons. PLoS ONE 2011, 6, e19954. [Google Scholar] [CrossRef] [PubMed] [Green Version]
  71. Shen, J.; Li, X.; Zhu, X.; Huang, X.; Jin, S. The Complete Plastid Genome of Rhododendron pulchrum and Comparative Genetic Analysis of Ericaceae Species. Forests 2020, 11, 158. [Google Scholar] [CrossRef] [Green Version]
  72. Liu, L.X.; Li, R.; Worth, J.R.; Li, X.; Li, P.; Cameron, K.M.; Fu, C.X. The complete chloroplast genome of Chinese bayberry (Morella rubra, Myricaceae): Implications for understanding the evolution of Fagales. Front. Plant Sci. 2017, 8, 968. [Google Scholar] [CrossRef]
  73. Raubeson, L.A.; Jansen, R.K. Chloroplast genomes of plants. In Plant Diversity and Evolution: Genotypic and Phenotypic Variation in Higher Plants; Henry, R.J., Ed.; CABI Publishing: Wallingford, UK, 2005; pp. 45–68. [Google Scholar]
  74. Muse, S.V.; Gaut, B.S. Comparing patterns of nucleotide substitution rates among chloroplast loci using the relative ratio test. Genetics 1997, 146, 393–399. [Google Scholar]
  75. Wolfe, K.H.; Li, W.H.; Sharp, P.M. Rates of nucleotide substitution vary greatly among plant mitochondrial, chloroplast, and nuclear DNAs. Proc. Natl. Acad. Sci. USA 1987, 84, 9054–9058. [Google Scholar] [CrossRef] [Green Version]
  76. Timmis, J.N.; Ayliffe, M.A.; Huang, C.-Y.; Martin, W. Endosymbiotic gene transfer: Organelle genomes forge eukaryotic chromosomes. Nat. Rev. Genet. 2004, 5, 123–135. [Google Scholar] [CrossRef]
  77. Erixon, P.; Oxelman, B. Whole-gene positive selection, elevated synonymous substitution rates, duplication, and indel evolution of the chloroplast clpP1 gene. PLoS ONE 2008, 3, e1386. [Google Scholar] [CrossRef] [Green Version]
  78. Jin, J.; Kong, J.J.; Qiu, J.L.; Zhu, H.S.; Peng, Y.C.; Jiang, H.Y. High level of microsynteny and purifying selection affect the evolution of WRKY family in Gramineae. Dev. Genes Evol. 2016, 226, 15–25. [Google Scholar] [CrossRef] [PubMed]
  79. Shimizu, K.K.; Purugganan, M.D. Evolutionary and ecological genomics of Arabidopsis. Plant Physiol. 2005, 138, 578–584. [Google Scholar] [CrossRef] [PubMed] [Green Version]
  80. Lavin, M.; Pennington, R.T.; Klitgaard, B.B.; Sprent, J.I.; de Lima, H.C.; Gasson, P.E. The dalbergioid legumes (Fabaceae): Delimitation of a pantropical monophyletic clade. Am. J. Bot. 2001, 88, 503–533. [Google Scholar] [CrossRef] [PubMed]
  81. Kajita, T.; Ohashi, H.; Tateishi, Y.; Bailey, C.D.; Doyle, J.J. rbcL and legume phylogeny, with particular reference to Phaseoleae, Millettieae, and allies. Syst. Bot. 2001, 26, 515–536. [Google Scholar]
  82. Compton, J.A.; Schrire, B.D.; Könyves, K.; Forest, F.; Malakasi, P.; Mattapha, S.; Sirichamorn, Y. The Callerya Group redefined and Tribe Wisterieae (Fabaceae) emended based on morphology and data from nuclear and chloroplast DNA sequences. PhytoKeys 2019, 125, 1. [Google Scholar] [CrossRef]
  83. McPherson, H.; Van der Merwe, M.; Delaney, S.K.; Edwards, M.A.; Henry, R.J.; McIntosh, E.; Rymer, P.D.; Milner, M.L.; Siow, J.; Rossetto, M. Capturing chloroplast variation for molecular ecology studies: A simple next generation sequencing approach applied to a rainforest tree. BMC Ecol. 2013, 13, 8. [Google Scholar] [CrossRef] [Green Version]
  84. Borgstrom, E.; Lundin, S.; Lundeberg, J. Large scale library generation for high throughput sequencing. PLoS ONE 2011, 6, e19119. [Google Scholar] [CrossRef] [Green Version]
  85. Jiao, Y.P.; Peluso, P.; Shi, J.H.; Liang, T.; Stitzer, M.C.; Wang, B.; Campbell, M.S.; Stein, J.C.; Wei, X.; Chin, C.S. Improved maize reference genome with single-molecule technologies. Nature 2017, 546, 524. [Google Scholar] [CrossRef]
  86. Winiarski, M.; Kuśmirek, W.; Nowak, R.M. De Novo DNA assembler for third generation sequencers’ reads based on BLASR algorithm. In Photonics Applications in Astronomy, Communications, Industry, and High-Energy Physics Experiments 2018; International Society for Optics and Photonics: Bellingham, WA, USA, 2018; p. 108083C. [Google Scholar]
  87. Antipov, D.; Korobeynikov, A.; McLean, J.S.; Pevzner, P.A. hybridSPAdes: An algorithm for hybrid assembly of short and long reads. Bioinformatics 2016, 32, 1009–1015. [Google Scholar] [CrossRef] [Green Version]
  88. Luo, R.; Liu, B.; Xie, Y.; Li, Z.; Huang, W.; Yuan, J.; He, G.; Chen, Y.; Pan, Q.; Liu, Y. SOAPdenovo2: An empirically improved memory-efficient short-read de novo assembler. Gigascience 2012, 1, 18. [Google Scholar] [CrossRef]
  89. Wyman, S.K.; Jansen, R.K.; Boore, J.L. Automatic annotation of organellar genomes with DOGMA. Bioinformatics 2004, 20, 3252–3255. [Google Scholar] [CrossRef] [PubMed] [Green Version]
  90. Lohse, M.; Drechsel, O.; Bock, R. OrganellarGenomeDRAW (OGDRAW): A tool for the easy generation of high-quality custom graphical maps of plastid and mitochondrial genomes. Curr. Genet. 2007, 52, 267–274. [Google Scholar] [CrossRef] [PubMed]
  91. Altschul, S.F.; Gish, W.; Miller, W.; Myers, E.W.; Lipman, D.J. Basic local alignment search tool. J. Mol. Biol. 1990, 215, 403–410. [Google Scholar] [CrossRef]
  92. Kanehisa, M. A database for post-genome analysis. Trends Genet. Tig 1997, 13, 375. [Google Scholar] [CrossRef]
  93. Kanehisa, M.; Goto, S.; Kawashima, S.; Okuno, Y.; Hattori, M. The KEGG resource for deciphering the genome. Nucleic Acids Res. 2004, 32, 277–280. [Google Scholar] [CrossRef] [PubMed] [Green Version]
  94. Kanehisa, M.; Goto, S.; Hattori, M.; Aoki-Kinoshita, K.F.; Itoh, M.; Kawashima, S.; Katayama, T.; Araki, M.; Hirakawa, M. From genomics to chemical genomics: New developments in KEGG. Nucleic Acids Res. 2006, 34, 354–357. [Google Scholar] [CrossRef]
  95. Tatusov, R.L.; Koonin, E.V.; Lipman, D.J. A genomic perspective on protein families. Science 1997, 278, 631–637. [Google Scholar] [CrossRef] [Green Version]
  96. Tatusov, R.L.; Fedorova, N.D.; Jackson, J.D.; Jacobs, A.R.; Kiryutin, B.; Koonin, E.V.; Krylov, D.M.; Mazumder, R.; Mekhedov, S.L.; Nikolskaya, A.N. The COG database: An updated version includes eukaryotes. BMC Bioinform. 2003, 4, 41. [Google Scholar] [CrossRef] [Green Version]
  97. Magrane, M. UniProt Knowledgebase: A hub of integrated protein data. Database 2011, 2011, bar009. [Google Scholar] [CrossRef] [Green Version]
  98. Ashburner, M.; Ball, C.A.; Blake, J.A.; Botstein, D.; Butler, H.; Cherry, J.M.; Davis, A.P.; Dolinski, K.; Dwight, S.S.; Eppig, J.T. Gene ontology: Tool for the unification of biology. Nat. Genet. 2000, 25, 25–29. [Google Scholar] [CrossRef] [Green Version]
  99. Thiel, T.; Michalek, W.; Varshney, R.K.; Graner, A.; Thiel, T. Exploiting EST databases for the development and characterization of gene-derived SSR-markers in barley (Hordeum vulgare L.). Theor. Appl. Genet. 2003, 106, 411–422. [Google Scholar] [CrossRef] [PubMed]
  100. Librado, P.; Rozas, J. DnaSP v5: A software for comprehensive analysis of DNA polymorphism data. Bioinformatics 2009, 25, 1451–1452. [Google Scholar] [CrossRef] [PubMed] [Green Version]
  101. Katoh, K.; Standley, D.M. MAFFT multiple sequence alignment software version 7: Improvements in performance and usability. Mol. Biol. Evol. 2013, 30, 772–780. [Google Scholar] [CrossRef] [Green Version]
  102. Liu, W.Z.; Kong, H.H.; Zhou, J.; Fritsch, P.W.; Hao, G.; Gong, W. Complete chloroplast genome of Cercis chuniana (Fabaceae) with structural and genetic comparison to six species in Caesalpinioideae. Int. J. Mol. Sci. 2018, 19, 1286. [Google Scholar] [CrossRef] [PubMed] [Green Version]
  103. Frazer, K.A.; Pachter, L.; Poliakov, A.; Rubin, E.M.; Dubchak, I. VISTA: Computational tools for comparative genomics. Nucleic Acids Res. 2004, 32, 273–279. [Google Scholar] [CrossRef]
  104. Miller, M.A.; Pfeiffer, W.; Schwartz, T. Creating the CIPRES Science Gateway for inference of large phylogenetic trees. In Gateway Computing Environments Workshop; IEEE Computer Society: New Orleans, LA, USA, 2010; pp. 1–8. [Google Scholar]
  105. Stamatakis, A. RAxML version 8: A tool for phylogenetic analysis and post-analysis of large phylogenies. Bioinformatics 2014, 30, 1312–1313. [Google Scholar] [CrossRef]
  106. Felsenstein, J. Confidence limits on phylogenies: An approach using the bootstrap. Evolution 1985, 39, 783–791. [Google Scholar] [CrossRef]
  107. Wu, Z.Q.; Tembrock, L.R.; Ge, S. Are differences in genomic data sets due to true biological variants or errors in genome assembly: An example from two chloroplast genomes. PLoS ONE 2015, 10, e0118019. [Google Scholar] [CrossRef]
Figure 1. The assembly, size and features of M-S-I-P-M2 cp genomes (Pterocarpus). The genes outside the circle are transcribed in the counter clockwise direction, and the genes inside the circle are transcribed in the clockwise direction. Different colors in genes represent different functions. The dark gray area and light gray area of inner circle represent the GC content to AT content of the genome respectively.
Ijms 21 03758 g001
Figure 2. The abundance of different SSR types in the five chloroplast genomes of Pterocarpus (M-S-I-P-M2 cp genomes).
Ijms 21 03758 g002
Figure 3. Comparison of LSC, IRb, SSC, and IRa border regions in five species of Pterocarpus, Dalbergia cultrata, and Arabiopsis thaliana.
Ijms 21 03758 g003
Figure 4. Global alignment of five (M-S-I-P-M2) chloroplast genomes of Pterocarpus using mVISTA. Y-axis indicates the range of identity (50–100%). Alignment was performed using Pterocarpus marsupium as a reference.
Ijms 21 03758 g004
Figure 5. Comparison of nucleotide variability in coding region (A) and non-coding region (B) among our new sequenced five species of Pterocarpus.
Ijms 21 03758 g005
Figure 6. Phylogenetic tree for 32 species in Fabaceae (Arabidopsis thaliana as an outgroup) using maximum likelihood (ML), based on alignments of complete chloroplast genomes. Numbers at the nodes indicate bootstrap values from 1000 replicates. If the bootstrap values are as 100, this number was not shown on the nodes.
Ijms 21 03758 g006
Table 1. List of genes encoded by five species of Pterocarpus chloroplast genome. (×2) indicates that the gene has two copies. * and ** indicate genes containing one/ two introns. The ycf1 gene of Pterocarpus pedatus, Pterocarpus marsupium and Pterocarpus santalinus contains one intron. The cp genome of P. santalinus was used as the reference, + indicates that the gene is inferred to be under positive selection (ω > 1) and − indicates that the gene is inferred to be under purifying selection (ω = 0.001).
CategoryGroupGenes
PhotosynthesisSubunits_of_photosystem_IpsaA-, psaB, psaI, psaJ, psaC
Subunits_of_photosystem_IIpsbA, psbZ, psbC-, psbD, psbM, psbI, psbK, psbL, psbF, psbE, psbB-, psbT, psbN, psbH
Subunits_of_NADH_dehydrogenasendhC, ndhK, ndhJ, ndhB(×2) * +, ndhF, ndhD+, ndhE, ndhG, ndhI *, ndhA *, ndhH-
Subunits_of_cytochrome_b/f_complexpetN, petA, petL, petG, petB *, petD *
Subunits_of_ATP_synthaseatpB-, atpE, atpI, atpH, atpF *, atpA
Large_subunit_of_RubiscorbcL
Self-replicationLarge_subunits_of_ribosomerpl33, rpl20, rpl36-, rpl14, rpl16 *, rpl2(×2) *, rpl32+, rpl23(×2)
Small_subunits_of_ribosomerps4+, rps14, rps2, rps18, rps11, rps8, rps3, rps19, rps12 *- (×2,part), rps15, rps7(×2)
DNA-dependent_RNA_polymeraserpoB, rpoC1 *, rpoC2 *, rpoA
Ribosomal_RNAsrrn5, rrn4.5, rrn23, rrn16
Transfer_RNAstrnH-GUG, trnK-UUU *, trnM-CAU, trnV-UAC *, trnF-GAA, trnL-UAA *, trnT-UGU, trnS-GGA, trnfM-CAU, trnG-UCC, trnS-UGA, trnT-GGU, trnE-UUC, trnY-GUA, trnD-GUC, trnC-GCA, trnR-UCU, trnS-GCU, trnQ-UUG, trnW-CCA, trnP-UGG, trnI-CAU, trnL-CAA, trnV-GAC, trnI-GAU *, trnA-UGC *, trnR-ACG, trnN-GUU, trnL-UAG
Other genesMaturasematK *
ProteaseclpP **-
Envelope_membrane_proteincemA
Acetyl-CoA_carboxylaseaccD+
C-type_cytochrome_synthesis_geneccsA
Genes of unknown functionProteins_of_unknown_functionycf3 **, ycf4, ycf68(×2) *, ycf1, orf42(×2), ycf2(×2) +

