Article

Transcriptomic Analyses Reveal 2 and 4 Family Members of Cytochromes P450 (CYP) Involved in LPS Inflammatory Response in Pharynx of Ciona robusta

1
Dipartimento di Scienze e Tecnologie Biologiche, Chimiche e Farmaceutiche-Università di Palermo, Via Archirafi 18, 90128 Palermo, Italy
2
Istituto per la Ricerca e l’Innovazione Biomedica-Consiglio Nazionale delle Ricerche, Via Ugo La Malfa 153, 90146 Palermo, Italy
3
Istituto di Calcolo e Reti ad Alte Prestazioni-Consiglio Nazionale delle Ricerche, Via Ugo La Malfa 153, 90146 Palermo, Italy
*
Author to whom correspondence should be addressed.
Int. J. Mol. Sci. 2021, 22(20), 11141; https://doi.org/10.3390/ijms222011141
Submission received: 28 August 2021 / Revised: 1 October 2021 / Accepted: 12 October 2021 / Published: 15 October 2021
(This article belongs to the Special Issue Cytochromes P450: Drug Metabolism, Bioactivation and Biodiversity 3.0)

Abstract

:
Cytochromes P450 (CYP) are enzymes responsible for the biotransformation of most endogenous and exogenous agents. The expression of each CYP is influenced by a unique combination of mechanisms and factors including genetic polymorphisms, induction by xenobiotics, and regulation by cytokines and hormones. In recent years, Ciona robusta, one of the closest living relatives of vertebrates, has become a model in various fields of biology, in particular for studying inflammatory response. Using an in vivo LPS exposure strategy, next-generation sequencing (NGS) and qRT-PCR combined with bioinformatics and in silico analyses, compared whole pharynx transcripts from naïve and LPS-exposed C. robusta, and we provide the first view of cytochrome genes expression and miRNA regulation in the inflammatory response induced by LPS in a hematopoietic organ. In C. robusta, cytochromes belonging to 2B,2C, 2J, 2U, 4B and 4F subfamilies were deregulated and miRNA network interactions suggest that different conserved and species-specific miRNAs are involved in post-transcriptional regulation of cytochrome genes and that there could be an interplay between specific miRNAs regulating both inflammation and cytochrome molecules in the inflammatory response in C. robusta.

1. Introduction

Cytochrome P450 enzymes (CYPs) consist of a large group of haemoproteins that catalyse a wide range of reactions involved in the oxidative metabolism of xenobiotics, such as drugs, pesticides, and environmental chemicals, or in the metabolism of endogenous compounds, such as steroid hormones, fatty acids, eicosanoids, and vitamins [1,2,3,4]. CYP genes are widely distributed in all domains of life, from bacteria, archaea, and viruses to higher plants and animals and may be classified in class, group, clan, family and subfamily [5]. The CYPs constitute one of the most diverse eukaryotic genes, with a wide complexity within and between species. CYP enzymes use molecular oxygen to modify substrate structure, critical in a huge number of physiological, ecological and toxicological processes. In chordates CYP genes, created by the 2R whole genome duplications, 11 distinct clans have been identified, each containing one or more CYP gene families. CYP constitutes a large gene class descended from a single common ancestor, termed the “cytochrome P450 genesis locus”. Duplicated in tandem of progenitor CYP gene gave rise to a set of genes that were precursors of the 11 animal CYP clans: CYP Clans 2, 3, 4, 7, 19, 20, 26, 46, 51, 74 and mitochondrial [6]. The concept of whole-genome duplication (WGD) during animal evolution is essential background for considering CYP gene evolution [7]. Analysis of the Ciona genome confirmed the 2R hypothesis [8], as did the recent sequencing of the amphioxus (lancelet) genome [8]. Evolutionarily, the 2R events have been bracketed in time between the divergence of tunicates from vertebrates and the origin of the gnathostomes (jawed vertebrates) [9,10], and in addition, a third-round (3R) has occurred in the vertebrate line leading to ray-finned (actinopterygian) fishes including zebrafish and medaka [11,12]. Not all animals have the 11 animal CYP clans, in fact, the Ecdysozoa (insects, crustaceans, nematodes) only have Clans 2, 3, 4 and mitochondrial and other protostomes such as molluscs and annelids may have additional clans (7, 20, 26 and 51) [13].
In humans, 57 functional genes and 58 pseudogenes have been identified [14], grouped according to their sequence similarity into 18 families and 44 subfamilies. Expression of CYPs is influenced by genetic polymorphisms, induction by xenobiotics, regulation by cytokines, hormones, epigenetic factors, including DNA methylation, histone modification, and ncRNA regulation [15,16]. Furthermore, it was demonstrated that LPS regulated the xenobiotic-induced expression of representative CYP genes and increased the levels of mRNAs of Tumour necrosis factor (TNF) and interleukin (IL)-1. The changes in these cytokines, which are well-known pro-inflammatory mediators, correlate with the changes in CYP expression and enzymatic activity during infection and inflammation [17,18,19,20].
The ascidian Ciona robusta, which shows a close phylogenetic relationship with vertebrates [21,22,23,24], is a powerful animal model to study comparative immunity [25] and the evolution of transcriptional and post-transcriptional regulatory mechanisms in genes expression. In C. robusta a strong inflammatory response can be induced by inoculating LPS into the body wall (tunic and contiguous pharynx). The pharynx (haematopoietic organ) occupies a large part of the adult body and consists of two epithelial monolayers perforated by dorso-ventrally aligned rows of elongated elliptical, ciliated stigmata [26,27] enclosed in a mesh of vessels (also called transversal and longitudinal bars), where the haemolymph, containing abundant mature and immature haemocytes, flows. Recently, C. robusta has become an excellent model for the study of distinct functional categories of immune genes such as effector genes as mannose-binding lectin-like (Mbl-like) [28], galectin-like (Gal-like) [29] and cytokines as interleukins 17 (Il-17) [30], Tumour growth factor (Tgf-ß) [31] and Macrophage migration inhibitory factors (Mif1 and Mif2) [32] that are coordinately and temporally regulated by mechanisms that control transcriptional and post-transcriptional regulation. In the C. robusta pharynx, the Tgf-β, Wnt, Hedgehog and FoxO pathways, which are involved in tissue homeostasis, resulted in regulated in an integrated network by different conserved and species-specific miRNAs, pseudogenes and 3′UTR mRNA elements [33].
In the present study, we used an in vivo strategy to compare C. robusta pharynx transcripts from naïve and LPS-exposed and qRT-PCR, and we indicate the involvement of 2 and 4 family members of Cytochrome in inflammation. Moreover, miRNA targets prediction analyses of cytochrome genes and immune genes suggest that, as humans, conserved and species-specific miRNAs can be involved in post-transcriptional control in the LPS-mediated inflammatory response.

2. Results

2.1. Next-Generation Sequencing Transcriptomics Analysis of Ciona robusta Highlights the Effects of LPS on Cytochrome P450 Transcripts Involved in Inflammation

Next-generation sequencing (NGS) analysis of the differential gene expression in immunocompetent organ (pharynx) under physiological and challenging conditions (4-h LPS exposure) treatment in vivo were performed to profile the C. robusta inflammatory response. NGS identified 16,504 transcripts annotated in the Ensembl database (ensemble.org), and for each of them, log-fold changes, p-values and adjusted p-values were calculated (data not shown). The analysis evidenced 1227 differentially expressed (DE) genes (up-regulated and down-regulated) (Figure 1) [34]. They were filtered for the Log2FoldChange (LogFC) threshold of 1.5, with a p-value and adjusted p-value thresholds <0.05.
For functional annotations, unigenes (1227) were aligned to Gene Ontology (GO) terms based on the Protein ANalysis THrough Evolutionary Relationships (PANTHER) classification system for gene ontology annotations (pantherdb.org, 16.0 release); that it is connected to the Clusters of Orthologous Genes (COG) database (geneontology.org, release February 2021). The C. robusta transcripts were classified in the three GO subcategories: (i) GO Biological Processes (BP) (Figure 2a); (ii) GO Molecular Functions (MF) (Figure 2b); (iii) GO Cellular Components (CC) (Figure 2c).
Between genes responsive to LPS, different positively (+) enriched classes belonging to the following GO terms were evidenced: (i) Biological Processes: response to xenobiotic stimulus, response to chemicals, response to stimulus, response to drugs, response to immune system processes and organic acid metabolic processes; (ii) Cellular Components: extracellular space, extracellular region and extracellular region part; (iii) Molecular Function: monosaccharide binding, heme binding, tetrapyrrole binding, monooxygenase activity, amino acid transmembrane transport, oxidoreductase activity.
These results strongly indicated the presence of DE genes linked to Cytochrome P450 (Cyp 450) families and inflammatory response.
Indeed cytochrome P450 enzymes catalyze a wide range of reactions involved in the oxidative metabolism of xenobiotic, or in the metabolism of endogenous compounds; moreover, they use molecular oxygen to modify substrate structure, critical in a huge number of physiological, and toxicological processes.
Finally, the expression of xenobiotic-induced cytochromes is mediated by LPS stimulation, which also increases different cytokines which are well-known pro-inflammatory mediators, thus correlating a potential link between these molecules and immunity response processes.
A deeper investigation on DE genes evidenced different families of cytochromes that resulted in deregulation in NGS experiments. In particular, cytochrome P450 components of 2 and 4 families were deregulated (Table 1).

2.2. Alignment and Phylogenetic Analysis of C. robusta Cytochrome P450 LPS Deregulated Genes

The Cytochrome P450 LPS deregulated genes (Table 1) were aligned with vertebrate and invertebrate Cytochrome P450 2 and 4 family members (Figure 3). Multiple alignments showed that all the 2 and 4 family members of C. robusta Cytochrome P450 possess the characteristic conserved motif of Cytochrome P450 (Figure 3; Table 2). The cysteine residue coordinating heme iron result conserved in all the sequences, in a consensus sequence well-conserved in cytochrome P450 (FXXGX(H/R)XCXG), together with the EX1X2R motif located in helix K involved in salt bridge interactions, that are important for its tertiary structure and the correct incorporation of the heme cofactor, (AG)Gx(DE)T(TS) located in I helix and FDDER located in M Coil (Figure 3; Table 2).
To understand the evolutionary relationship between the known 2 and 4 family members of Cytochrome P450 in vertebrates, invertebrates and C. robusta, we performed a phylogenetic analysis looking for orthologous sequences retrieved in the NCBI database (https://www.ncbi.nlm.nih.gov) (Accessed on 15 June 2021). Orthologous molecules were aligned using the ClustalW algorithm and neighbour-joining trees were constructed. A phylogenetic tree was constructed using the amino-acid sequence of D. melanogaster as an out-group (MEGA X program) (Figure 4). The Cytochrome P450 in vertebrates and C. robusta formed two distinct major clusters. The first cluster includes the group of vertebrates, invertebrates and C. robusta Cytochrome P450 belong to 2 family members, the second group includes the group of vertebrates, invertebrates and C. robusta cytochrome P450 belong to 4 family members (Figure 4). The phylogenetic analysis supported the idea of a conserved evolution of Cytochrome P450 from a common ancestral gene among protochordates and vertebrates.

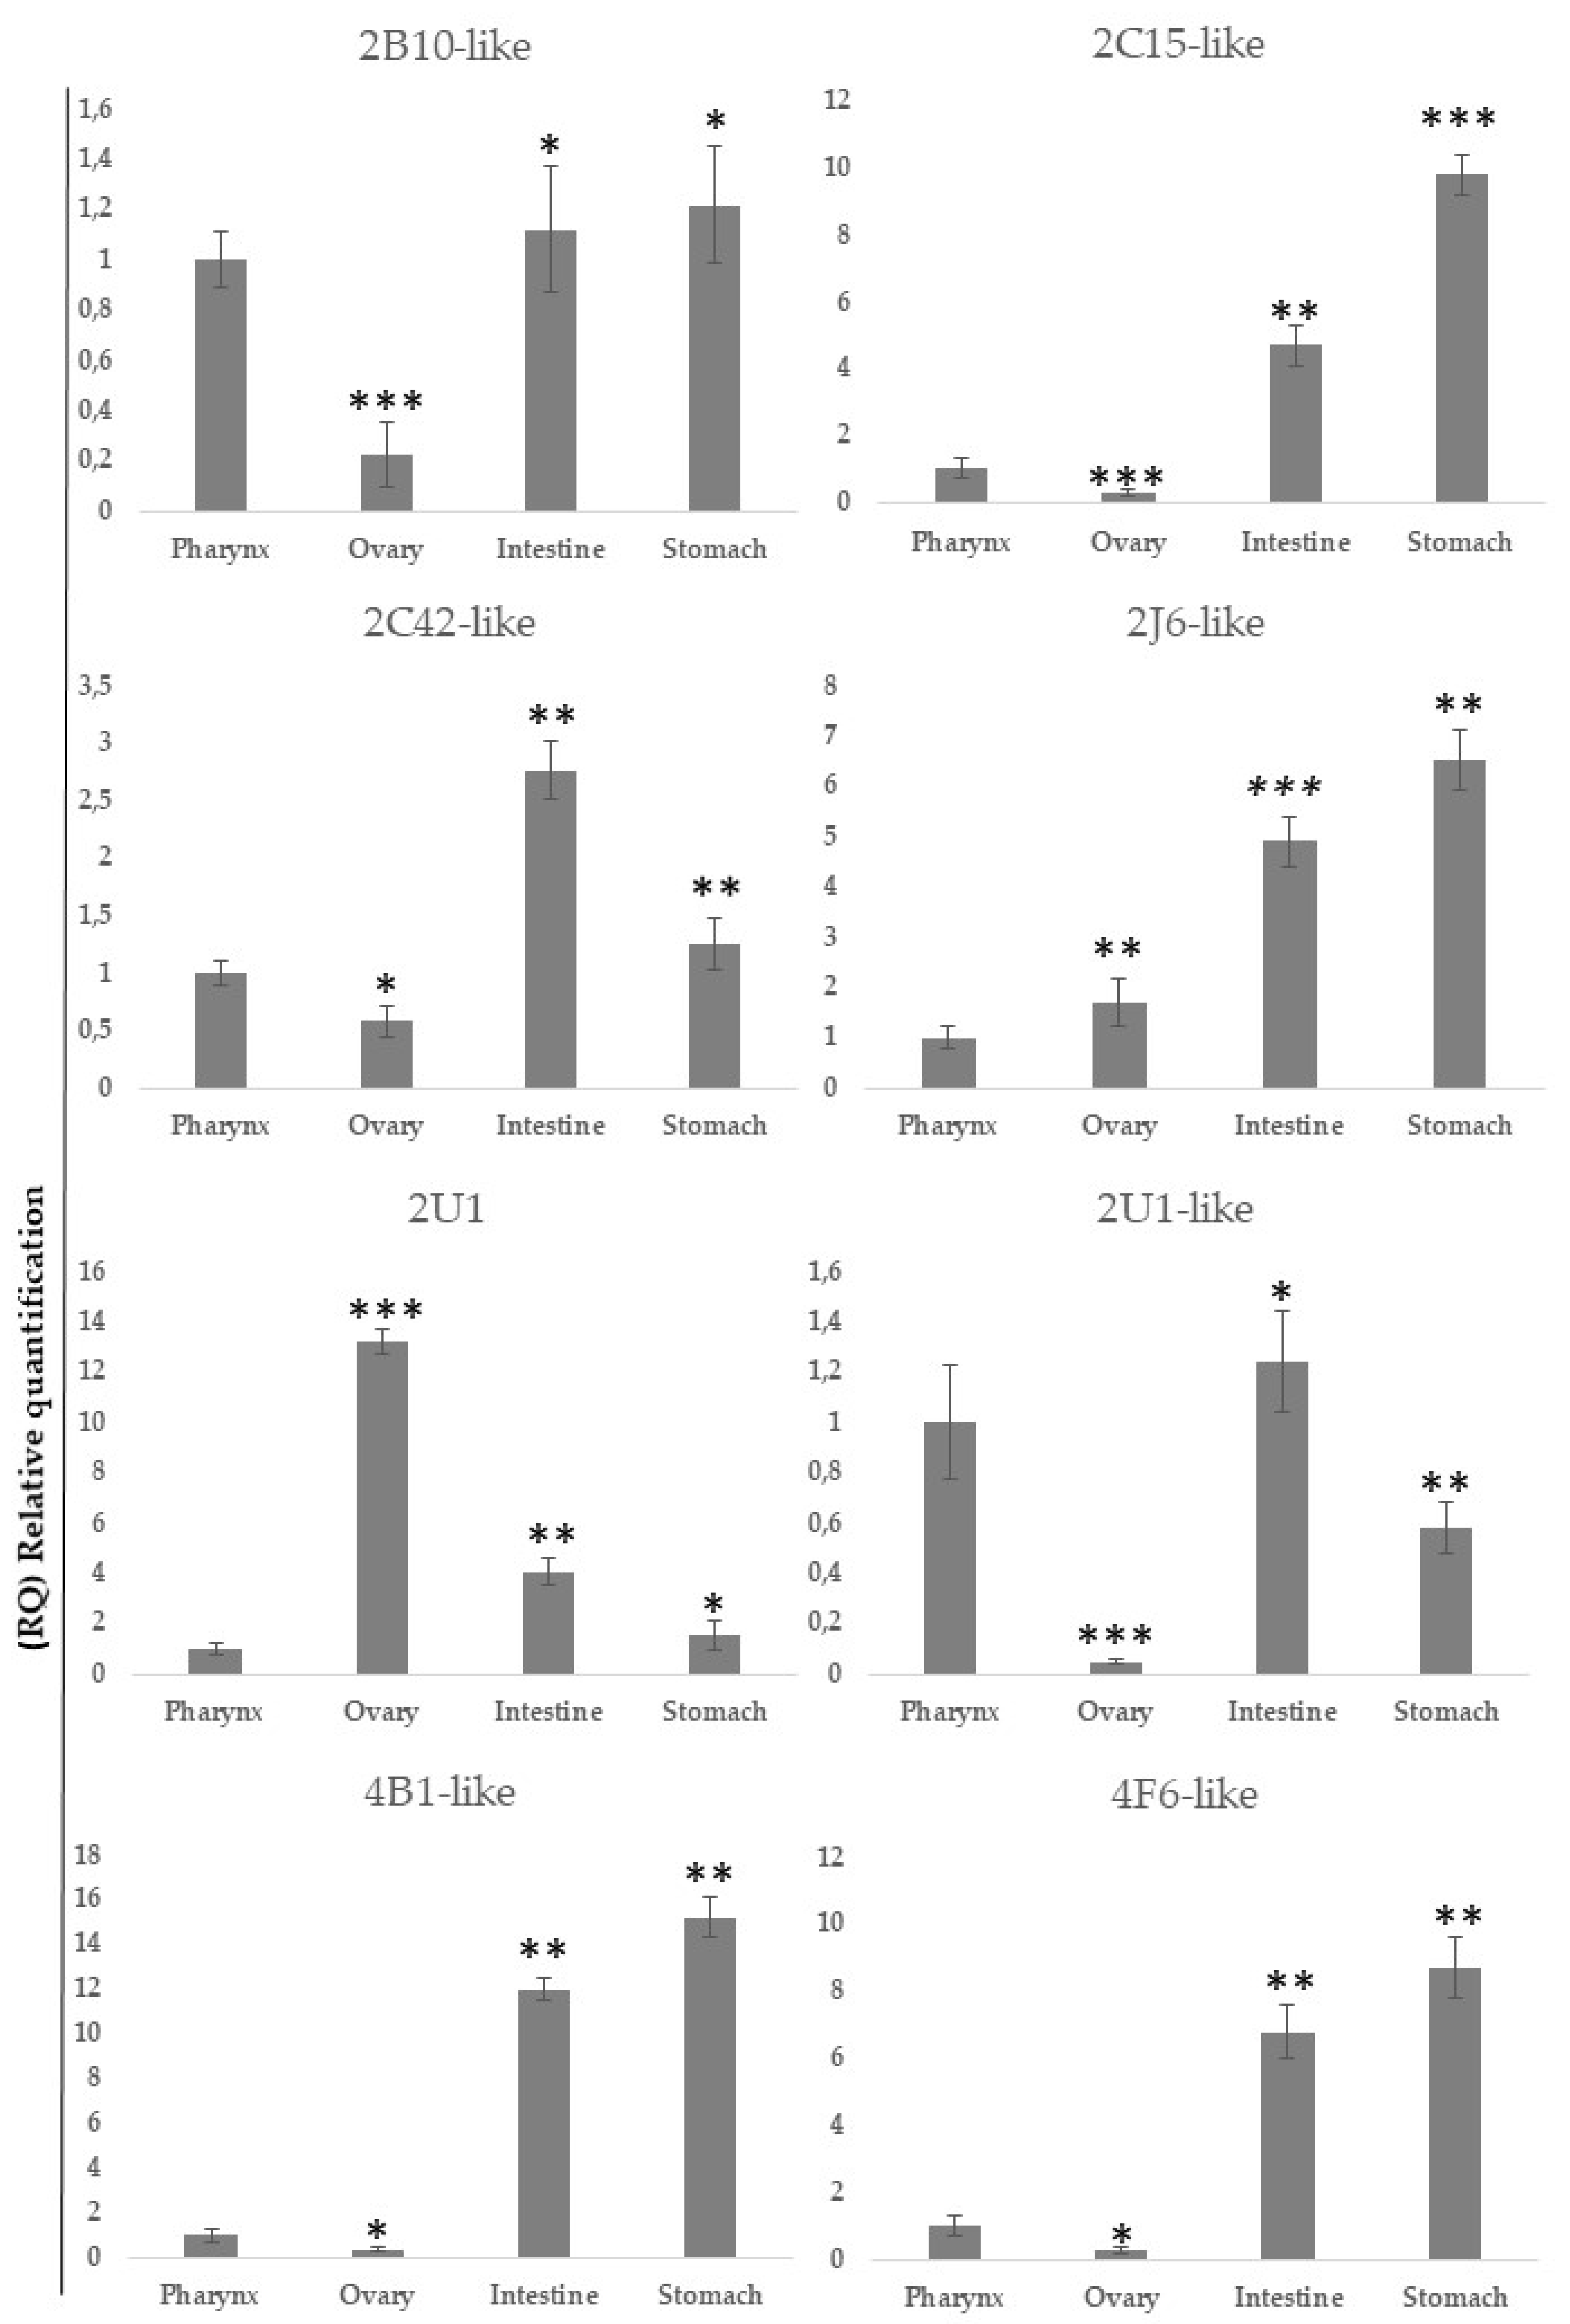
2.3. Differential Gene Expression of Cytochrome P450 Genes in Different Tissues

The spatial expression pattern of Cytochrome mRNA (Table 1) in adult C. robusta was investigated by qRT-PCR analysis of total RNA samples from different tissue involved in inflammatory response (pharynx, ovary, stomach and intestine). As shown in Figure 5, Cytochrome P450 expression was higher in the stomach and the intestine, and lower in the ovary and pharynx tissue; 2B10, 2C15, 2J6, 4B1 and 4F6 family members expression was higher in the intestine and the stomach, and lower in the ovary and pharynx tissue; 2U1 family member expression was higher in the ovary, and lower in the intestine, the stomach and pharynx tissue; 2U1-like family member expression was higher in the pharynx and intestine and lower in the stomach and ovary tissue.

2.4. Analyses of the Expression of Cytochrome 450 and Cytokines Genes under LPS Exposure

Analyses of the time-course expression of Cytochrome and Cytokines in the pharynx inflammatory response induced by LPS in C. robusta were performed at time points from 0 to 48 h post-LPS challenge by qRT-PCR (Figure 6). The heatmap shows that cytochrome transcripts were significantly modulated in response to LPS during the 48-h period of LPS exposure (p-value < 0.05). Based on the expression patterns of the transcripts, two major clusters were highlighted: the first includes pro-inflammatory cytokines Mif1, Mif2, Il-17–1, Il-17–2, and Tnf-α and Cyp450 2C15, 2J6, 2C42 and the second comprises Nf-κB and Tgf-β, Il-17–3 and Cyp450 2U1, 2U1-like, 2B10-like, 4B1, 4F6. Specifically, the heatmap highlighted that the inflammatory cytokines Mif1, Il-17–1, Il-17–3, and Tnf-α were upregulated between 1 and 4 h of LPS exposure (p-value < 0.05) and Tnf-α reached its maximum expression level after 2 h of LPS exposure. Notably, Nf-κB and transforming growth factor β (Tgf-β) transcripts displayed a significant increase after 4 h of LPS exposure (p-value < 0.05). On the other hand, after 8 h of exposure, Il-17–1, Il-17–2 levels began to increase at 1 h. Nf-κB and Tgf-β show a second significant increase after 48 h of exposure (p-value < 0.05). Cyp450 2C15, 2J6, 2C42 mRNA were upregulated between 1 and 2 h of LPS exposure, while Cyp450 2U1,2U1-like, 2B10-like, 4B1, 4F6 were upregulated between 1 and 4 h of LPS exposure. These findings suggest an involvement of cytokines in modulating the expression of Cytochromes in response to LPS exposure.

2.5. miRNA-Target Interaction Prediction

miRNA-target interaction of deregulated genes belonging to cytochrome (Table 1) and inflammation was investigated, by using the miRNA Target Interactor Predictor (miRNATIP) algorithm to explore how deregulation of Cytochrome P450 enzymes may be driven by non-coding RNA intervention during the inflammation process. miRNA-target prediction evidenced several miRNAs interacting with both DE genes linked to the Cytochrome P450 family and inflammation. A total of 10,002 interactions were predicted for DE Cytochromes and 3905 interactions were predicted for DE cytokines. Results were then filtered for the lowest free energy values (free energy < −12 Kcal/mol). Table 3 shows a detailed list of miRNA-target interactions, showing just interactions with more than two mRNA targets for each miRNA are showed. A total of 42 of all miRNAs identified by the miRNATIP algorithm were common to the two differentially expressed genes classes, and they belong to 36 different miRNA families. Seven of 36 families were conserved through species and 29 were species-specific.
The distinction between conserved and specie-specific miRNAs was made using different web services (MirGeneDB 2.0 (https://mirgenedb.org, MirGene DB 2.0 release) (Accessed on 21 July 2021); miREval 2.0 (http://mimirna.centenary.org.au/mireval/) (Accessed on 21 July 2021)and miRBase database (http://www.mirbase.org, release October 2018) (Accessed on 21 July2021) that study evolution pattern of conserved C. robusta homologues miRNA in the animal genome.
See Table 4 for a detailed list of predicted miRNAs, conserved through species and species-specific, that are common to the Cytochrome P450 and inflammation genes. See supplementary material for all miRNA-target interactions (Supplementary Materials).

2.6. Cytochrome and Inflammation miRNA-Target Network Reconstruction

miRNA-target interaction network reconstruction allows to easily visualise relevant interactions between different molecules. To build the graph, different steps were required: first, DE genes of Cytochromes and inflammation networks were downloaded into the Search Tool for Recurring Instances of Neighbouring Genes (STRING) database (string-db.org, release 11.5, accessed on 12 August 2021), second, the two different networks produced (cytochromes and inflammation) were imported into Cytoscape app (httos://cytoscape.org, release March 2017) (Accessed on 13 August 2021), to generate graph.ml files, and third, the networks were analysed using R package and R studio (https://www.r-project.org/, release October 2020) (Accessed on 17 August 2021); (https://rstudio. com/products/rstudio/, release October 2020) (Accessed on 17 August 2021), and finally miRNA prediction results were integrated into two different networks (Figure 7).
The miRNA-target network reconstruction put in evidence that some miRNAs interacting with more of two different targets, some regulating different Cytochrome genes, others regulating both genes of Cytochrome and cytokines (Table 3).
Indeed, between conserved miRNAs, cin-let-7d-3p, interacts with ENSCING00000013600 (transforming growth factor beta superfamily signalling ligand (Tgf-ß-na2) and ENSCING00000013919 (Cyp450 2C42-like). Other members of the same let-7 family also interact with genes of cytochrome and inflammation processes: cin-let-7e interacts with ENSCING00000006967 (Il-17-1) and ENSCING00000004714 (Cyp450 4B1-like); cin-let-7f-5p interacts with ENSCING00000005269 (Il-17-3) and
ENSCING00000004714 (Cyp450 4B1-like); cin-miR-92e-5p interacts with
ENSCING00000004714 (Cyp450 4B1-like) and ENSCING00000023704 (Cyp450 2B-10, male-specific-like).
Interestingly, cin-miR-196-3p interacts with four different targets:
ENSCING00000013600 (Tgf-ß-na2), ENSCING00000005269 (Il-17-3), ENSCING00000004714 (Cyp450 4B1-like) and ENSCING00000009298 (Cyp450 2U1-like).
Three species-specific miRNAs (cin-miR-5596b-3p, cin-miR-4085-3p and cin-miR4036-3p) also have more common targets. The first interacts with ENSCING00000004714 (Cyp450 4B1-like), ENSCING00000013919 (Cyp450 2C42-like), ENSCING00000017012 (Cyp450 2J6-like) and ENSCING00000005903 (Cyp450 2U1); the second interacts with ENSCING00000022988 (Cyp450 4F4-like), ENSCING00000004714 (Cyp450 4B1-like) and ENSCING00000006967 (Il-17-1); and the third interacts with ENSCING00000009298 (Cyp450 2U1-like), ENSCING00000013919 (Cyp450 2C42-like) and ENSCING00000008093 (transforming growth factor beta superfamily signalling ligand (Tgf-ß-na1)).
These in silico pieces of evidence let us hypothesize that there could be an interplay between specific miRNAs regulating both the inflammation process and cytochrome molecules.

2.7. Transcription Factor Orthologue Identification of Cyp450 Response Elements

After network reconstruction, Cyp450 gene transcriptional regulation by specific transcription factors (TFs) was investigated. Indeed, as known by scientific literature, TFs bind gene response elements and activate mRNA transcription of target genes.
To this aim we searched for orthologue genes in C. robusta through the National Center of Biotechnology Information (NCBI) (https://www.ncbi.nlm.nih.gov/gene, 244 release, accessed on 15 June 2021), orthologue database (orthoDB) (orthoDB; https://www.orthodb.org/v9, release v10.1) (Accessed on 20 August 2021) and through REGULATOR tool (https://www.bioinformatics.org/regulator, release 27.0) (Accessed on 20 August 2021), hypothesising that different TFs can potentially interact with Cyp450 response elements, to regulate mRNA Cyp450 expression.
Transcription factors identified in C. robusta genome are ci-Hnf-1 (ncbi gene ID: 778644), ci-Hnf-4 (ncbi gene ID: 778645), ci-AhR (ncbi gene ID: 778536), ci-Rxr (ncbi gene ID: 778746), ci-C/Ebp (ncbi gene ID: 778557) and ci-Vdr-a (ncbi gene ID: 778791). In silico analyses of TF binding sites prediction were finally carried out. Site Tracking and Recognition (SiTaR) tool (https://sbi.hki-jena.de/sitar/, V 0.1) (Accessed on 24 August 2021) was applied to all mentioned TFs and deregulated Cytochrome genes produced by NGS. Result analysis showed that just the ci-Vdr-a transcription factor potentially interacts with most deregulated cytochrome genes analysed (see Supplementary Material for detailed analysis results). Figure 8 shows a schematic representation of the potential transcriptional regulation of Cyp450 genes in response to TFs and non-coding RNAs.

3. Discussion

Cytochrome P450 (CYP) enzymes are an ancient superfamily of monooxygenase proteins found in all domains of life [35]. Genome sequencing of diverse species showed ~12,000 known CYP genes [36]. Cytochromes are expressed in many different tissues of the human body. They are found mostly in intestinal and hepatic tissues. In this study by an in vivo LPS exposure strategy and next-generation sequencing (NGS), we found that in Ciona robusta, the closest phylogenetically to vertebrates, 57 gene encoding for Cytochrome belong to 2,3,4,10,26 family members and 2B10, 2J6, 2C15, 2C42, 2U1, 2U1-like and 4 B1,4F6 subfamily members result involved in inflammatory response LPS induced. The CYP2 family has been primarily studied in vertebrate species and results in the largest and most diverse of the vertebrate CYPs [14,37]. Comparison of CYP2 subfamilies in vertebrate genomes suggests there are lineage-specific CYP2 subfamilies in mammals (CYP 2A, 2B, 2C, 2E, 2F, 2G, 2S, 2W), fish (CYP 2K, 2M, 2N, 2P, 2V, 2X, 2Y, 2Z, 2AA, 2AD, 2AE), birds (CYP2H), and amphibians. The CYP2U and CYP2R genes were present in the vertebrate ancestor and are shared across all vertebrate classes; CYP2D and CYP2J are not found in actinopterygian (ray-finned fish) species [37]. Members of this family were found in arthropods and crustacean species, such as CYP2L in lobster [38], and a significant number of CYP2-like genes were found in the sea urchin [39]. In C. robusta LPS Analyses of the time-course expression of Cytochrome P 450 and Cytokines in the pharynx inflammatory response induced by LPS showed that Cyp450 2C15, 2J6, 2C42 were upregulated between 1 and 2 h. In contrast Cyp450 2U1,2U1-like, 2B10-like, 4F3,4F6 were upregulated between 1 and 4 h. While pro-inflammatory cytokine Tnf-α reached its maximum expression level after 2 h of LPS exposure and Nf-κB and transforming growth factor β (Tgf-β) transcripts displayed a significant increase after 4 h of LPS exposure. These findings suggest an involvement of cytokines and Nf-κB in downregulation of the Cytochromes response upon LPS exposure after 4h. In humans, rats, and mice [40,41,42] variations in hepatic CYP expression are common responses to infection and inflammation. Morgan [43] reported that levels of constitutively expressed CYP genes were downregulated in the rat liver when inflammation was induced with lipopolysaccharide (LPS). Furthermore, the changes of pro-inflammatory mediators TNF and IL-1 correlate with the changes in CYP expression and enzymatic activity during infection and inflammation [18,19,20]. Increasing these cytokines appears to strongly affect the pathways regulating inducible CYP expression and LPS markedly alters CYPs’ expression levels during inflammation as Cyp2c29 and Cyp 2B10 mRNA in the liver [44]. Lipopolysaccharide (LPS) treatment of rats suppresses Cyp 4F4 and 4F5 expression by 50 and 40%, respectively. In this animal model, a change in the expression of Cyp 4F4 and 4F5 mRNA was observed at 24 h compared to the controls. At time points after 24 h the expression of both isoforms increases dramatically reaching the highest levels at 2 weeks post-injury. These results are consistent with the notion that immediately after injury, concentrations of leukotriene and prostaglandin mediators immediately after injury are elevated by decreased Cyp 4F concentrations. Increased Cyp 4F expression leads to diminished concentrations of leukotriene and prostaglandin mediators and then to recovery and repair [45] In vitro models NF-kB can control the expression of CYP1A1, CYP2B1, CYP2C11, CYP2D5, CYP2E1, and CYP3A7 via interaction with the promoters of these genes, leading to downregulation [46]. In vitro models show that distinct mechanisms are involved in the downregulation of CYP enzyme expression and Cytokine-mediated alteration of gene transcription. De jong [47] suggests that they can be the main regulatory mechanism accountable for changing Cyp450 activity upon inflammation [47]. The mechanisms of downregulation of Cytochromes P450 upon inflammation is an area of intense study. Increasing attention is being given to the potential post-transcriptional mechanisms that could regulate P450 enzymes in inflammation, as the involvement of MicroRNAs. MicroRNAs (miRNAs) inhibit gene expression largely in a posttranscriptional manner by interacting with miRNA response elements (MREs) in the mRNA 3′-UTRs of the target genes [48]. In C. robusta the NGS strategy identified transcripts that were classified as non-coding RNA (ncRNA). Of these 201, 90 were miRNAs. Both conserved (cin-let- 7d-5p, cin-mir-153-5p, and cin-mir-92c-5p) and species-specific miRNAs were found involved in post-transcriptional regulation of four pathways (Tgf-β,Wnt, FoxO, and Hh) linked to pharynx tissue homeostasis [33]. Bioinformatics and miRNA-target prediction analysis show that conserved and species-specific miRNAs can be involved in regulating post-transcriptional mechanisms of both gene categories: Cytochrome P450 and cytokines. Particularly cin-let-7 and cin-miR-92 seem vastly involved in post-transcriptional regulation during LPS induced inflammatory processes. In vertebrates, regulation of hepatic CYP levels is involved a wide variety of ligand-activated transcription factors and nuclear receptors. In inflammation, in the regulation of CYP mRNA levels, have involved Transcription factors including the nuclear receptors pregnane X receptor (PXR), the constitutive androstane receptor (CAR), their dimerization partner retinoid X receptor (RXR), the aryl hydrocarbon receptor (AhR) and human nuclear factors (HNFs) that are also responsible for the downregulation of Cytochromes P450 in inflammation. Nuclear Receptors as CAR increase transcription of the human CYP3A4/5, CYP2C9, CYP2C19, and CYP1A2 genes upon drug treatment [49,50,51]. Nuclear receptor PXR and CAR are involved in the mechanism of changes in gene transcription of major Cytochromes in inflammation. Vast evidence shows that inflammation represses PXR levels, leading to downregulation of important CYP enzymes [52,53] and LPS treatment in mice led to functional repression of PXR’s dimerization partner RXR [54]. A likely scenario is that the suppressive action of inflammation on PXR expression is mediated through NF-kB activation since Zhou X et al. showed that NF-kB directly interacts with a functional binding site in the PXR promotor to suppress its transcriptional expression [55]. C. robusta genome reveals only a single putative orthologue to vertebrate nuclear receptors PXR which was most similar to mammalian PXRs [56] with the ability to adapt to different ligands [57]. Furthermore, in silico analysis showed that the nuclear transcription factor ci-Vdr-a belongs to a nuclear hormone receptor family that is homologue to human PXR (ncbi ID: 8856), can potentially interact with many of deregulated Cytochrome genes identified by NGS. Thus, we suggest that ci-Vdr-a could potentially act as its orthologue protein PXR, intervening in the transcriptional regulation of Cytochrome genes during the inflammation process.
Concluding, we assume that in C. robusta (Figure 8) the modulation of cytochromes belonging to 2B, 2C, 2J, 2U, 4B and 4F subfamilies genes expression during inflammation may proceed through transcriptional downregulation of transcription factors, interference with dimerization/translocation of (nuclear) transcription factors, involvement of NF-kB, and inhibition gene expression in a posttranscriptional manner by interacting with miRNA. The control of Cytochrome P450 gene expression happens in a coordinated manner with the control of gene expression of immune genes as Cytokines and NF-kB according to highly conserved mechanisms during evolution.

4. Materials and Methods

4.1. Tunicates and LPS Injection

The animal model Ciona robusta was formerly classified as Ciona intestinalis. Molecular studies have confirmed that C. intestinalis constitutes a compilation of species rather than a single speciements [57,58,59,60,61]. C. robusta were collected from Sciacca harbour (Sicily, Italy) and were acclimatized and maintained as reported in Arizza et al. [34]. An LPS solution (Escherichia coli 055:B5, LPS, SIGMA-ALDRICH, Saint-Louis, MI, USA) was prepared in a sterile salt medium (12 mM CaCl2, 11 mM KCl, 26 mM MgCl2, 43 mM Tris HCl, 0.4 M NaCl, pH 8.0). One hundred microliters of the LPS-containing suspension was injected into the tunic matrix surrounding the pharynx wall (median body region) at a final LPS concentration of 100 μg. C. robusta not exposed to LPS (naïve) were used as controls. Fragments of pharynx tissue (200 mg) explanted at various times (from 1 to 48 h) and pharynx, ovary, intestine and stomach tissues of naïve were immediately soaked in RNAlater tissue collection solution (AMBION, Austin, TX, USA) and stored at −80 °C. Total RNA extraction was performed using an RNAqueous-Midi kit purification system (AMBION, Austin, TX, USA) as reported in Arizza et al. [34].

4.2. RNA Sequencing (RNA-Seq)

The RNA purity and quality of total RNA extracted from the pharynx of C. robusta that were naïve 3 replicates (n = 3) and that were exposed to LPS for 4 h 3 replicates (n = 3) were examined by NanoDrop and Agilent RNA 6000 Nano kits on an Agilent 2100 Bioanalyser (AGILENT, Santa Clara, CA, USA), respectively. High-quality RNA samples (A260/A280 = 1.9–2.1, RIN _ 7) were used for cDNA library construction. RNA sequencing (RNA-Seq) was performed by BMR Genomics (Padua, Italy) on an Illumina platform in a single-end format 75 bp (1_75 bp) containing ~40 million _ 10% of reads/sample [34]. All transcripts produced by NGS were annotated by Ensembl database (https://www.ensembl.org/index.html, release August 2020) (Accessed on 3 March 2021). Differential expression between treated (4hrs LPS induction) and untreated genes was performed by BMR genomics [34]. It was performed using edgeR software. It allows to estimate the negative binomial variance parameter globally across all genes. All the data were then normalized by setting the false discovery rate (FDR) to ≤0.05 and the absolute value of the log2 fold change (logFC) to 1.5. A MA plot was performed to visualize the up-regulated and down-regulated genes from RNA-sequencing. The plot visualizes the differences between measurements taken in two samples, by transforming the data onto M (log ratio) and A (mean average) scales, then plotting these values. Results were calculated using ggpubr pakage of CRAN library (https://cran.r-project.org/web/packages/ggpubr/index.html) (Accessed on 30 September 2021).
To visualize the data, the log2 mean expression is calculated, which is the mean of values of treated samples, plus the log2 of the mean of values of controls, all divided by 2. We also provided a PCA plot to show the distribution of LPS-treated and untreated samples. The PCA clearly shows two different cluster samples, one grouping LPS treated samples and one grouping controls. We made a PCA plot of normalized data, showing the first two principal components (PCs) of treated and untreated samples. Results were calculated using PCA tool R library (https://bioconductor.org/packages/release/bioc/vignettes/PCAtools/inst/doc/PCAtools.html#conduct-principal-component-analysis-pca) (Accessed on 30 September 2021).

4.3. Alignments and Phylogenetic Analyses

Multiple alignments of sequences were carried out using CLC (Version 7.0.0). Phylogenetic trees were designed in MEGA X maintaining the bootstrap value of 1000 bootstrap iterations (neighbour-joining method). The accession numbers are listed in Table 5.

4.4. qRT-PCR

The differential expression of Cytochrome P450 LPS responsive genes was studied by qRT-PCR using the SYBR-Green method and the specific sets of primers listed in Table 6. qRT-PCR analysis was performed using an Applied Biosystems 7500 Real-time PCR system [34]. Differential expression was determined in a 25 μL PCR mixture containing 2 μL of cDNA converted from 250 ng of total RNA, 300 nM primer (forward and reverse), and 12.5 μL of Power SYBR-Green PCR MasterMix (Applied Biosystems, Waltham, MA, USA). Amplification specificity was tested by real-time PCR melting analysis. To obtain sample quantification, the 2−ΔΔCt method was used, and the relative changes in gene expression were analyzed as described in the Applied Biosystems Use Bulletin N.2 (P/N 4303859). The transcript levels from different tissues were normalized to that of actin to compensate for variations in the amount of RNA input. Relative expression was determined by dividing the normalized value of the target gene in each tissue by the normalized value obtained from the untreated tissue. To examine the time course of the response, LPS-treated ascidians 4 replicates (n = 4) were examined at incremental post-inoculation time points (1, 2, 4, 8, 12, 24, and 48 h). Untreated ascidians (naïve) 4 replicates (n = 4) were used as controls.
Heatmap generation of real-time data was made using Heatmapper web tool (http://www.heatmapper.ca) (Accessed on 20 June 2021). It allows users to generate, cluster and visualize expression-based heat maps from transcriptomic data. To compute the heatmap, Complete linkage was applied as clustering algorithm, and Pearson correlation was used as the method of distance measurement. Additionally, a z-score is calculated. It is a measure that describes a value’s relationship to the mean of a group of values. Z-score is measured in terms of standard deviations from the mean [62].

4.5. Functional Enrichment Analysis

Gene enrichment of C. robusta transcripts produced by NGS was made through The Clusters of Orthologous Genes (COG) database (geneontology.org, release February 2021). The three Gene Ontology (GO) subcategories were investigated, and they are the following: (i) Biological Process (BP); (ii) Molecular Functions (MF); (iii) Cellular Components (CC); (iii) p-value and adjusted p-value thresholds were set to <0.05 to have statistically significant results.
The Protein Analysis Through Evolutionary Relationships (PANTHER GO-slim analysis tool) (pantherdb.org, 16.0 release) System connected to the COG database was used to expand the annotation data of the gene and protein families obtained from GO. The PANTHER “GO-slim” analysis mode was selected to have more reliable and accurate results compared to the GO “GO-complete” annotation mode.

4.6. miRNA–mRNA Target Interaction Prediction

RNA–RNA interaction predictions (miRNA–mRNA target) were performed through the miRNA target interaction predictor (miRNATIP) algorithm [63]. The algorithm filters out wrongly predicted interactions, by means of the computation of the binding free energy (free energy threshold <−12Kcal/mol). This last step allows for the strengthening of the power of predicted interactions calculated by the algorithm. Indeed, as it is known, the lower the free energy of two paired RNA strands, the more energy is needed to disrupt this duplex formation, thus deducing that the stronger RNA–RNA binding is when the binding energy is low, and there is a more stable state thermodynamically. To test the best free energy thresholds in the miRNATIP algorithm we did some experiments in C. elegans and in H. sapiens to verify the most favorable ∆G values of binding sites, and they were <−6 and <−7kcal/mol. As some other scientific papers related to RNA–RNA interaction prediction tools used lower energy thresholds to evaluate RNA–RNA stability, we decided then to lower these energy thresholds to <−12kcal/mol energy values also in C. robusta samples [64].

4.7. Study of Evolution Pattern of C. robusta Homologues microRNA in Animal Genome

To study the evolution pattern of conserved C. robusta homologues microRNA in the animal genome, we used different web resources as MirGeneDB 2.0 (https://mirgenedb.org, MirGene DB 2.0 release) (Accessed on 21 July 2021); miREval 2.0 (http://mimirna.centenary.org.au/mireval/) (Accessed on 21 July 2021) and miRBase database (http://www.mirbase.org, release October 2018) (Accessed on 21 July 2021).

4.8. Network Construction and Visualisation

To build interaction networks between DE genes linked to Cytochrome and inflammation and interacting miRNAs, different steps were achieved: first, both DE cytochrome and inflammation genes were downloaded in the STRING database (db) (string-db.org, release 11.5, accessed on 12 August 2021). STRING db, is an open-source platform for reconstructing interaction networks by using direct, indirect and functional interactions between molecules. In the second step, the two different networks previously produced (Cytochrome and inflammation) were imported into the Cytoscape app (https://cytoscape.org, release March 2017) (Accessed on 13 August 2021), to generate graph.ml files.
Cytoscape is an open-source software platform for visualizing molecular interaction networks and biological pathways and integrating these networks with annotations.
In the third step of the analysis, R package and R studio (https://www.r-project.org/, release October 2020) (Accessed on 17 August 2021); (https://rstudio.com/products/rstudio/, release October 2020) (Accessed on 17 August 2021) were used to integrate miRNA-targets networks from cytochrome and inflammation networks.
In particular, “igraph” package of R was used to analyses networks produced by STRING and to generate the image of integrated networks.

4.9. Transcription Factor Orthologue Identification and TF Binding Site Prediction

Cyp450 gene regulation by transcription factors was investigated. We searched for orthologue TFs in C. robusta through the use of different web services: National Center of Biotechnology Information (NCBI) (https://www.ncbi.nlm.nih.gov/gene, 244 release, accessed on 15 June 2021), orthologue database (orthoDB), (https://www.orthodb.org/v9, release v10.1) (Accessed on 20 August 2021), and REGULATOR web tool (https://www.bioinformatics.org/regulator, release 27.0) (Accessed on 20 August 2021).
Both orthoDB and REGULATOR collect and documents the transcription factors of metazoan species, between which C. robusta, giving information on the divergence in species evolution. The tools are also linked to other web resources such as InerPro, IntAct, Pfam, STRING, GO annotation, NCBI.
Transcription Factor binding site prediction was also made to predict if orthologue TFs can potentially interact with genomic sequences of deregulated Cytochrome genes. The analysis was performed using the Site Tracking and Recognition (SiTaR) tool (https://sbi.hki-jena.de/sitar/, V 0.1) (Accessed on 24 August 2021). The method is based on the idea that it can be calculated several motifs with a given nucleotide content and a given number of mismatches in a random sequence. These predicted numbers can then be compared with the real occurrences of motifs in a query sequence. Moreover, this method uses a novel approach compared with position weight matrices (PWM) and Hidden Markow Models, and it is based on the research of motifs on input sequence, where for each motif found, scores are assigned depending on the non-randomness of the motif’s occurrence, the number of matching searching motifs and the number of mismatches. The method also has the advantage to significantly reduce the number of false-positive predictions significantly.

4.10. Statistical Methods

Fisher’s exact test performed statistical assessments of GO term enrichment and pathway analyses in combination with a robust false discovery rate (FDR) correction for multiple testing. The row p-value and FDR threshold were set as <0.05.
Minitab 17 statistical software was used for the qRT-PCR data analysis. Statistical differences were estimated by one-way ANOVA, and the significance of differences among groups was determined by Tukey’s t-test. The level of significance was set at a p-value ≤0.05. The data are presented as the means ± SD (n = 4).

Supplementary Materials

The following are available online at https://www.mdpi.com/article/10.3390/ijms222011141/s1.

Author Contributions

A.V., V.A. contributed to the conception and design of the study. L.L.P., A.U., A.F. and M.L.R. performed bioinformatics analysis, M.M., A.B. and M.V. performed investigation. A.V. and L.L.P. analyzed the data and wrote the manuscript. A.V. and V.A. funding acquisition. All authors have read and agreed to the published version of the manuscript.

Funding

FFR-D15-160403 Funding for University Research.

Institutional Review Board Statement

Not applicable.

Informed Consent Statement

Not applicable.

Data Availability Statement

Not applicable.

Conflicts of Interest

The authors declare no conflict of interest.

References

  1. Ortiz de Montellano, P.R. (Ed.) Substrate oxidation by cytochrome P450 enzymes. In Cytochrome P450: Structure, Mechanism and Biochemistry, 4th ed.; Kluwer Academic/Plenum Publishers: New York, NY, USA, 2015; pp. 111–1762. [Google Scholar]
  2. Palrasu, M.; Siddavaram, N. Cytochrome P450 Structure, Function and Clinical Significance: A Review. Curr. Drug Targets 2018, 19, 38–54. [Google Scholar]
  3. Guengerich, F.P.; Munro, A.W. Unusual cytochrome P450 enzymes and reactions. J. Biol. Chem. 2013, 288, 17065–17073. [Google Scholar] [CrossRef] [PubMed] [Green Version]
  4. Guengerich, F.P. Human cytochrome P450 enzymes. In Cytochrome P450: Structure, Mechanism and Biochemistry, 4th ed.; Ortiz de Montellano, P.R., Ed.; Kluwer Academic/Plenum Publishers: New York, NY, USA, 2015; pp. 523–785. [Google Scholar]
  5. Gotoh, O. Evolution of Cytochrome P450 Genes from the Viewpoint of Genome Informatics. Biol. Pharm. Bull. 2012, 35, 812–817. [Google Scholar] [CrossRef] [PubMed] [Green Version]
  6. Nelson, D.R.; Goldstone, J.V.; Stegeman, J.J. The cytochrome P450 genesis locus: The origin and evolution of animal cytochrome P450s. Philos. Trans. R. Soc. B Biol. Sci. 2013, 368, 20120474. [Google Scholar] [CrossRef] [PubMed] [Green Version]
  7. Ohno, S. Evolution by Gene Duplication; Springer: Berlin/Heidelberg, Germany, 2013. [Google Scholar]
  8. Putnam, N.H.; Butts, T.; Ferrier, D.E.K.; Furlong, R.F.; Hellsten, U.; Kawashima, T.; Robinson-Rechavi, M.; Shoguchi, E.; Terry, A.; Yu, J.-K.; et al. The amphioxus genome and the evolution of the chordate karyotype. Nature 1970, 453, 1064–1071. [Google Scholar] [CrossRef] [Green Version]
  9. Kuraku, S. Insights into cyclostome phylogenomics: Pre-2R or post-2R. Zool. Sci. 2008, 25, 960–968. [Google Scholar] [CrossRef]
  10. Kuraku, S.; Meyer, A.; Kuratani, S. Timing of genome duplications relative to the origin of the vertebrates: Did cyclostomes diverge before or after? Mol. Biol. Evol. 2009, 26, 47–59. [Google Scholar] [CrossRef] [Green Version]
  11. Meyer, A.; Van de Peer, Y. From 2R to 3R: Evidence for a fish-specific genome duplication (FSGD). BioEssays 2005, 27, 937–945. [Google Scholar] [CrossRef] [Green Version]
  12. Siegel, N.; Hoegg, S.; Salzburger, W.; Braasch, I.; Meyer, A. Comparative genomics of ParaHox clusters of teleost fishes: Gene cluster breakup and the retention of gene sets following whole genome duplications. BMC Genom. 2007, 8, 312. [Google Scholar] [CrossRef] [Green Version]
  13. Cohen, M.B.; Feyereisen, R.A. Cluster of cytochrome P450 genes of the CYP6 family in the house fly. DNA Cell Biol. 1995, 14, 73–82. [Google Scholar] [CrossRef]
  14. Nelson, D.R.; Zeldin, D.C.; Hoffman, S.M.G.; Maltais, L.J.; Wain, H.M.; Nebert, D.W. Comparison of cytochrome P450 (CYP) genes from the mouse and human genomes, including nomenclature recommendations for genes, pseudogenes and alternative-splice variants. Pharmacogenetics 2004, 14, 1–18. [Google Scholar] [CrossRef] [PubMed] [Green Version]
  15. Tang, X.; Chen, S. Epigenetic regulation of cytochrome P450 enzymes and clinical implication. Curr. Drug Metab. 2015, 16, 86–96. [Google Scholar] [CrossRef]
  16. Zanger, U.M.; Schwab, M. Cytochrome P450 enzymes in drug metabolism: Regulation of gene expression, enzyme activities, and impact of genetic variation. Pharmacol. Ther. 2013, 138, 103–141. [Google Scholar] [CrossRef]
  17. Moriya, N.; Kataoka, H.; Fujino, H.; Nishikawa, J.; Kugawa, F. Effect of lipopolysaccharide on the xenobiotic-induced expression and activity of hepatic cytochrome P450 in mice. Biol. Pharm. Bull. 2012, 35, 473–480. [Google Scholar] [CrossRef] [PubMed] [Green Version]
  18. Li, X.Y.; Zhang, C.; Wang, H.; Ji, Y.L.; Wang, S.F.; Zhao, L.; Chen, X.; Xu, D.X. Tumor necrosis factor alpha partially contributes to lipopolysaccharide induced downregulation of CYP3A in fetal liver: Its repression by a low dose LPS pretreatment. Toxicol. Lett. 2008, 179, 71–77. [Google Scholar] [CrossRef]
  19. Warren, G.W.; Poloyac, S.M.; Gary, D.S.; Mattson, M.P.; Blouin, R.A. Hepatic cytochrome P-450 expression in tumor necrosis factor-alpha receptor (p55/p75) knockout mice after endotoxin administration. J. Pharmacol. Exp. Ther. 1999, 288, 945–950. [Google Scholar]
  20. Siewert, E.; Bort, R.; Kluge, R.; Heinrich, P.C.; Castell, J.; Jover, R. Hepatic cytochrome P450 down-regulation during aseptic inflammation in the mouse is interleukin 6 dependent. Hepatology 2000, 32, 49–55. [Google Scholar] [CrossRef]
  21. Delsuc, F.; Brinkmann, H.; Chourrout, D.; Philippe, H. Tunicates and not cephalochordates are the closest living relatives of vertebrates. Nature 2006, 439, 965–968. [Google Scholar] [CrossRef] [PubMed]
  22. Tsagkogeorga, G.; Turon, X.; Hopcroft, R.R.; Tilak, M.-K.; Feldstein, T.; Shenkar, N.; Loya, Y.; Huchon, D.; Douzery, E.J.P.; Delsuc, F. An updated 18S rRNA phylogeny of tunicates based on mixture and secondary structure models. BMC Evol. Biol. 2009, 9, 187. [Google Scholar] [CrossRef] [PubMed] [Green Version]
  23. Zeng, L.; Swalla, B.J. Molecular phylogeny of the protochordates: Chordate evolution. Can. J. Zool. 2005, 83, 24–33. [Google Scholar] [CrossRef]
  24. Satoh, N. The ascidian tadpole larva: Comparative molecular development and genomics. Nat. Rev. Genet. 2003, 4, 285–295. [Google Scholar] [CrossRef]
  25. Vizzini, A. Gene expression and regulation of molecules involved in pharynx inflammatory response induced by LPS in Ciona intestinalis. Invertebr. Surviv. J. 2017, 14, 119–128. [Google Scholar]
  26. Giacomelli, S.; Melillo, D.; Lambris, J.D.; Pinto, M.R. Immune competence of the Ciona intestinalis pharynx: Complement system-mediated activity. Fish Shellfish Immunol. 2012, 33, 946–952. [Google Scholar] [CrossRef] [PubMed]
  27. Martinucci, G.B.; Dallai, R.; Burighel, P.; Lane, N.J. Different functions of tight junctions in the ascidian branchial basket. Tissue Cell 1988, 20, 119–132. [Google Scholar] [CrossRef]
  28. Bonura, A.; Vizzini, A.; Salerno, G.; Parrinello, N.; Longo, V.; Colombo, P. Isolation and expression of a novel MBL-like collectin cDNA enhanced by LPS injection in the body wall of the ascidian Ciona intestinalis. Mol. Immunol. 2009, 46, 2389–2394. [Google Scholar] [CrossRef] [PubMed] [Green Version]
  29. Vizzini, A.; Parrinello, D.; Sanfratello, M.A.; Salerno, G.; Cammarata, M.; Parrinello, N. Inducible galectins are expressed in the inflamed pharynx of the ascidian Ciona intestinalis. Fish Shellfish Immunol. 2012, 32, 101–109. [Google Scholar] [CrossRef] [PubMed] [Green Version]
  30. Vizzini, A.; Falco, F.D.; Parrinello, D.; Sanfratello, M.A.; Mazzarella, C.; Parrinello, N.; Cammarata, M. Ciona intestinalis interleukin 17-like genes expression is upregulated by LPS challenge. Dev. Comp. Immunol. 2015, 48, 129–137. [Google Scholar] [CrossRef] [Green Version]
  31. Vizzini, A.; Di Falco, F.; Parrinello, D.; Sanfratello, M.A.; Cammarata, M. Transforming growth factor b (CiTGF-b) gene expression is induced in the inflammatory reaction of Ciona intestinalis. Dev. Comp. Immunol. 2016, 55, 102–110. [Google Scholar] [CrossRef] [Green Version]
  32. Vizzini, A.; Parisi, M.G.; Di Falco, F.; Cardinale, L.; Cammarata, M.; Arizza, V. Identification of CPE and GAIT elements in 3’UTR of macrophage migration inhibitory factor (MIF) involved in inflammatory response induced by LPS in Ciona robusta. Mol. Immunol. 2018, 9, 66–74. [Google Scholar] [CrossRef]
  33. Vizzini, A.; Bonura, A.; La Paglia, L.; Fiannaca, A.; La Rosa, M.; Urso, A.; Arizza, V. ceRNA Network Regulation of TGF-β, WNT, FOXO, Hedgehog Pathways in the Pharynx of Ciona robusta. Int. J. Mol. Sci. 2021, 22, 3497. [Google Scholar] [CrossRef]
  34. Arizza, V.; Bonura, A.; La Paglia, L.; Urso, A.; Pinsino, A.; Vizzini, A. Transcriptional and in silico analyses of MIF cytokine and T LR signalling interplay in the LPS inflammatory response of Ciona robusta. Sci. Rep. 2020, 10, 11339. [Google Scholar] [CrossRef]
  35. Nelson, D.R.; Kamataki, T.; Waxman, D.J.; Guengerich, F.P.; Estabrook, R.W.; Feyereisen, R.; Gonzalez, F.J.; Coon, M.J.; Gunsalus, I.C.; Gotoh, O.; et al. The P450 superfamily: Update on new sequences, gene mapping, accession numbers, early trivial names of enzymes, and nomenclature. DNA Cell Biol. 1993, 12, 1–51. [Google Scholar] [CrossRef]
  36. Nelson, D.R. The cytochrome P450 homepage. Hum. Genom. 2009, 4, 59–65. [Google Scholar] [CrossRef] [Green Version]
  37. Nelson, D.R. Metazoan cytochrome P450 evolution. Comp. Biochem. Physiol. Part C Pharmacol. Toxicol. Endocrinol. 1998, 121, 15–22. [Google Scholar] [CrossRef]
  38. Rewitz, K.F.; Styrishave, B.; Lobner-Olsen, A.; Andersen, O. Marine invertebrate cytochrome P450: Emerging insights from vertebrate and insects analogies. Comp. Biochem. Physiol. Part C Toxicol. Pharmacol. 2006, 143, 363–381. [Google Scholar] [CrossRef] [PubMed]
  39. Goldstone, J.V.; Hamdoun, A.; Cole, B.J.; Howard-Ashby, M.; Nebert, D.W.; Scally, M.; Dean, M.; Epel, D.; Hahn, M.E.; Stegeman, J.J. The chemical defensome: Environmental sensing and response genes in the Strongylocentrotus purpuratus genome. Dev. Biol. 2006, 300, 366–384. [Google Scholar] [CrossRef] [PubMed] [Green Version]
  40. Iber, H.; Sewer, M.B.; Barclay, T.B.; Mitchell, S.R.; Li, T.; Morgan, E.T. Modulation of drug metabolism in infectious and inflammatory diseases. Drug Metab. Rev. 1999, 31, 29–41. [Google Scholar] [CrossRef]
  41. Aitken, A.E.; Richardson, T.A.; Morgan, E.T. Regulation of drug metabolizing enzymes and transporters in inflammation. Annu. Rev. Pharmacol. Toxicol. 2006, 46, 123–149. [Google Scholar] [CrossRef] [PubMed]
  42. Yang, K.H.; Lee, M.G. Effects of endotoxin derived from Escherichia coli lipopolysaccharide on the pharmacokinetics of drugs. Arch. Pharmacal Res. 2008, 31, 1073–1086. [Google Scholar] [CrossRef] [PubMed]
  43. Morgan, E.T. Suppression of constitutive cytochrome P-450 gene expression in livers of rats undergoing an acute phase response to endotoxin. Mol. Pharmacol. 1989, 36, 699–707. [Google Scholar]
  44. Moriya, N.; Kataoka, H.; Fujino, H.; Nishikawa, J.; Kugawa, F. Different expression patterns of hepatic cytochrome P450s during anaphylactic or lipopolysaccharide-induced inflammation. Pharmazie 2014, 69, 142–147. [Google Scholar] [PubMed]
  45. Cuia, X.; Kalsotraa, A.; Robidab, A.M.; Matzilevichc, D.; Moorec, A.N.; Boehmea, C.L.; Morgan, E.T.; Dashc, P.K.; Strobela, H.W. Expression of cytochromes P450 4F4 and 4F5 in infection and injury models of inflammation . Biochim. Biophys. Acta BBA Gen. Subj. 2003, 1619, 325–331. [Google Scholar] [CrossRef]
  46. Zordoky, B.; El-Kadi, A. Role of NF-kB in the Regulation of Cytochrome P450 Enzymes. Curr. Drug Metab. 2009, 10, 164–178. [Google Scholar] [CrossRef] [PubMed]
  47. De Jong, L.M.; Jiskoot, W.; Swen, J.J.; Manson, M.L. Distinct Effects of Inflammation on Cytochrome P450 Regulation and Drug Metabolism: Lessons from Experimental Models and a Potential Role for Pharmacogenetics. Genes 2020, 11, 1509. [Google Scholar] [CrossRef] [PubMed]
  48. Guo, H.; Ingolia, N.T.; Weissman, J.S.; Bartel, D.P. Mammalian microRNAs predominantly act to decrease target mRNA levels. Nature 2010, 466, 835–840. [Google Scholar] [CrossRef] [Green Version]
  49. Chen, Y.; Ferguson, S.S.; Negishi, M.; Goldstein, J.A. Identification of constitutive androstane receptor and glucocorticoid receptor binding sites in the CYP2C19 promoter. Mol. Pharmacol. 2003, 64, 316–324. [Google Scholar] [CrossRef] [Green Version]
  50. Ferguson, S.S.; Lecluyse, E.L.; Negishi, M.; Goldstein, J.A. Regulation of human CYP2C9 by the constitutive androstane receptor: Discovery of a new distal binding site. Mol. Pharmacol. 2002, 62, 737–746. [Google Scholar] [CrossRef] [Green Version]
  51. Xie, W.; Barwick, J.L.; Simon, C.M.; Pierce, A.M.; Safe, S.; Blumberg, B.; Guzelian, P.S.; Evans, R.M. Reciprocal activation of xenobiotic response genes by nuclear receptors SXR/PXR and CAR. Genes Dev. 2000, 14, 3014–3023. [Google Scholar] [CrossRef] [Green Version]
  52. Pascussi, J.M.; Gerbal-Chaloin, S.; Pichard-Garcia, L.; Daujat, M.; Fabre, J.M.; Maurel, P.; Vilarem, M.J. Interleukin-6 negatively regulates the expression of pregnane X receptor and constitutively activated receptor in primary human hepatocytes. Biochem. Biophys. Res. Commun. 2000, 274, 707–713. [Google Scholar] [CrossRef]
  53. Sun, H.Y.; Yan, Y.J.; Li, Y.H.; Lv, L. Reversing effects of ginsenosides on LPS-induced hepatic CYP3A11/3A4 dysfunction through the pregnane X receptor. J. Ethnopharmacol. 2019, 229, 246–255. [Google Scholar] [CrossRef]
  54. Beigneux, A.P.; Moser, A.H.; Shigenaga, J.K.; Grunfeld, C.; Feingold, K.R. Reduction in cytochrome P-450 enzyme expression is associated with repression of CAR (constitutive androstane receptor) and PXR (pregnane X receptor) in mouse liver during the acute phase response. Biochem. Biophys. Res. Commun. 2002, 293, 145–149. [Google Scholar] [CrossRef]
  55. Zhou, X.; Li, X.; Wang, X.; Jin, X.; Shi, D.; Wang, J.; Bi, D. Cecropin B represses CYP3A29 expression through activation of the TLR2/4-NF-_ B/PXR signaling pathway. Sci. Rep. 2016, 6, 27876. [Google Scholar] [CrossRef]
  56. Yagi, K.; Satou, Y.; Mazet, F.; Shimeld, S.M.; Degnan, B.; Rokhsar, D.; Levine, M.; Kohara, Y.; Satoh, N. A genomewide survey of developmentally relevant genes in Ciona intestinalis. III. Genes for Fox, ETS, nuclear receptors and NF-kB. Dev. Genes Evol. 2003, 213, 235–244. [Google Scholar] [CrossRef] [PubMed]
  57. Krasowski, M.D.; Reschly, E.J.; Ekins, S. Intrinsic disorder in nuclear hormone receptors. J. Proteome Res. 2008, 7, 4359–4372. [Google Scholar] [CrossRef] [Green Version]
  58. Brunetti, R.; Gissi, C.; Pennati, R.; Manni, L. Morphological evidence that the molecularly determined Ciona intestinalis type A and type B are different species: Ciona robusta and Ciona intestinalis. J. Zool. Syst. Evol. Res. 2015, 53, 186–193. [Google Scholar] [CrossRef]
  59. Pennati, R.; Ficetola, G.F.; Brunetti, R.; Caicci, F.; Gasparini, F.; Griggio, F.; Sato, A.; Stach, T.; Kaul-Strehlow, S.; Gissi, C.; et al. Morphological differences between larvae of the Ciona intestinalis species complex: Hints for a valid taxonomic definition of distinct species. PLoS ONE 2015, 10, e0122879. [Google Scholar] [CrossRef] [PubMed] [Green Version]
  60. Caputi, L.; Andreakis, N.; Mastrototaro, F.; Cirino, P.; Vassillo, M.; Sordino, P. Cryptic speciation in a model invertebrate chordate. Proc. Natl. Acad. Sci. USA 2007, 104, 9364–9369. [Google Scholar] [CrossRef] [PubMed] [Green Version]
  61. Iannelli, F.; Pesole, G.; Sordino, P.; Gissi, C. Mitogenomics reveals two cryptic species in Ciona intestinalis. Trends Genet. 2007, 23, 419–422. [Google Scholar] [CrossRef] [Green Version]
  62. Wang, L.; Yu, X.; Wu, C.; Zhu, T.; Wang, W.; Zheng, X.; Jin, H. RNA sequencing-based longitudinal transcriptomic profiling gives novel insights into the disease mechanism of generalized pustular psoriasis. BMC Med. Genom. 2018, 11, 52. [Google Scholar] [CrossRef] [PubMed] [Green Version]
  63. Fiannaca, A.; La Rosa, M.; La Paglia, L.; Rizzo, R.; Urso, A. MiRNATIP: A SOM-based miRNA-target interactions predictor. BMC Bioinform. 2016, 17, 321. [Google Scholar] [CrossRef] [Green Version]
  64. Miranda, K.C.; Huynh, T.; Tay, Y.; Ang, Y.S.; Tam, W.L.; Thomson, A.M.; Lim, B.; Rigoutsos, I. A pattern-based method for the identification of microRNA binding sites and their corresponding heteroduplexes. Cell 2006, 126, 1203–1217. [Google Scholar] [CrossRef] [PubMed] [Green Version]
Figure 1. MA plot (a). X axis reports the Log2 mean expression of genes; Y axis reports the log2FC (threshold = 1.5). Red points are upregulated genes, blue points are down-regulated genes. PCA plot (b). Principal Component 1 (PC1) and PC2 of normalized data are reported in Y and X axis. Blue points represent C. robusta exposed to LPS (n = 3) and red points represent untreated ascidians (n = 3). The number of total points in PCA is the number of replicates used for NGS experiment (n = 6).
Ijms 22 11141 g001
Figure 2. GO analysis of the three different GO subclasses for all the deregulated genes of NGS. (a) Biological Process (BP), Cellular Components (CC) (b) and (c) Molecular Functions (MF) are showed. Y axis: log10 fold enrichment; X axis: respectively BP, MF and CC ontology classes.
Ijms 22 11141 g002
Figure 3. Multiple amino acid sequence alignment of Cytochrome P450 2 and 4 family members from invertebrates, vertebrates and C. robusta.
Ijms 22 11141 g003
Figure 4. Phylogenetic tree of Cytochrome P450 2 and 4 family members in vertebrates and invertebrates. The tree was constructed by the neighbour-joining method and bootstrap analysis. The bootstrap value indicates the number of particular node occurrences per 1000 trees, as generated by bootstrapping the sequences, expressed as a percentage. The bar indicates the number of amino acid residue substitutions per site.
Ijms 22 11141 g004
Figure 5. qRT-PCR analysis: Tissue expression of Cytochrome p 450 of C. robusta. Values, plotted as mean ± SD, were inferred from four ascidians. * p < 0.05, ** p < 0.005, *** p < 0.001.
Ijms 22 11141 g005
Figure 6. Heatmap based on the qRT-PCR analysis of the differentially expressed Cytochromes P450, Nf-κB and cytokines at different times of exposure to LPS (1–48 h). Time course of gene expression in the pharynx of C. robusta exposed to LPS compared with the gene expression in untreated ascidians. To compute the heatmap was chosen to use the Complete linkage as clustering algorithm, and the Pearson correlation as distance measurement method. Values are represented according to the z-score, which is measured in terms of standard deviations from the mean.
Ijms 22 11141 g006
Figure 7. Interaction network between miRNAs (green), DE Cytochrome genes (blue) and DE inflammatory cytokines (yellow). The network analysis was performed using R package and R studio, and miRNA prediction results were integrated into the two different networks of DE Cytochrome genes and inflammatory cytokines.
Ijms 22 11141 g007
Figure 8. Schematic representation of potential transcriptional and post-transcriptional mechanisms that could regulate Cytochrome P450 enzymes in inflammation: conserved and species-specific miRNAs regulate the transcription of different Cytochrome genes, and also the signalling pathway linked to inflammatory-like reactions and cytokines. Moreover, TFs, as ci-Vdr-a can potentially bind Cyp450 response elements, activating Cyp450 transcription.
Ijms 22 11141 g008
Table 1. Deregulated Cytochrome families identified by NGS.
ENSEMBL IDNAMELogFCLogCPMp-ValueAdj p-ValueLogp ValueChr. Position
ENSCING00000023704cytochrome P450 2B10 (LOC101242210)2.326276709−0.9540649037.85 × 10−50.0019787254.104962459Chromosome 11: 2,221,309–2,225,001 reverse strand.
ENSCING00000014704cytochrome P450 2C15-like (LOC100186646)2.080359810.1498825585.87 × 10−50.0015515454.23164033Chromosome 10: 1,471,100–1,473,817
ENSCING00000017012cytochrome P450 2J6-like (LOC100175185)3.28873837−1.4202637982.46 × 10−60.0001055945.608489757Chromosome 8: 5,194,025–5,197,825 reverse strand.
ENSCING00000005903cytochrome P450 2U1(LOC100185251)1.5118498540.6138487590.0027215310.0350086892.565186709Scaffold HT001236.1: 8,305–10,991
ENSCING00000004714cytochrome P450 4B1-like (LOC100182965)2.2515305531.6698100986.12 × 10−60.0002310355.213430612Chromosome 1: 7,364,051–7,366,204 forward strand
ENSCING00000006567cytochrome P450 4F6-like (LOC100186171)2.2289363782.878921544.97 × 10−60.0001948295.303654163Chromosome 7: 1,548,748–1,552,535 forward strand.
ENSCING00000009298cytochrome P450 2U1-like (LOC100182684)-2.6110644655.3039356947.82 × 10−85.38 × 10−67.106747277Chromosome 5: 2,876,599–2,880,776 forward strand.
ENSCING00000013919cytochrome P450 2C42-like (LOC100184869)-3.4584072147.3898351396.28 × 10−121.17 × 10−911.20175682Chromosome 10: 3,837,453–3,843,016 reverse strand.
Table 2. Conserved Cytochrome P450 motifs in the Ciona robusta. “Length” indicates the total length of the translated protein sequence.
Cyp P450 LenghI-Helix
[AG]G-x-[DE]T[TS]
K-Helix
E-x-x-R
Meander Coil FDDERHeme Loop
F-x-x-G-x-R-x-C-x-G
2B10-like365AGTETSESLR -------------CL-
2C15509AGTETSKQLLFRPERFSVGLRSCIG
2C42506AGVETTDQLXFNPHRFSIGPRYCMG
2U1501AGTDTTEQLFFKPDRFNVGQRSCLG
2U1-like506AGTETTLQLLFKPERFSVGPRQCLG
2J6504AGNETTLQLCFDPSRFSLGPRQCIG
4B1439--DIEFNPDRFSAGSRNCIG
4F6538EGHDTTKEIRYDPERFSAGPRNCIG
Table 3. Table shows miRNA-mRNA target interactions for deregulated genes linked to cytochrome (blue) and inflammation (red). All interactions showed in the table are divided for conserved and species-specific miRNAs. They are filtered for energy values and are ordered by number of interacting gene for each miRNA. Just results of miRNA-target interactions with more than two interacting targets are showed.
Conserved
miRNAs
Target Gene ID
cin-miR-196-3pENSCING00000004714ENSCING00000009298ENSCING00000005269ENSCING00000013600
(cyp450 4B1-like)(cyp450 2U1-like)(Il-17-3)(Tgf-ß-na2)
cin-miR-92e-5pENSCING00000004714ENSCING00000022988ENSCING00000023704
(cyp450 4B1-like)(cyp450 2U1-like)(cyp450 2C13, male-specific-like)
cin-let-7f-5pENSCING00000014704ENSCING00000005269 (Il-17-3)
(cyp450 4B1-like)
cin-let-7d-5pENSCING00000022988ENSCING00000006967
(cyp450 4F4-like)(Il-17-1)
cin-let-7eENSCING00000004714 (cyp450 4B1-like)ENSCING00000006967 (Il-17-1)
cin-let-7d-3pENSCING00000013919 (cyp450 2C42-like)ENSCING00000013600 (Tgf-ß-na2)
cin-miR-200-3pENSCING00000008093ENSCING00000023704
(Tgf-ß-na1)(cyp450 2C13, male-specific-like)
Specie-Specific miRNAsTarget Gene ID
cin-miR-5596b-3pENSCING00000005903ENSCING00000013919ENSCING00000014704ENSCING00000017012
(cyp450 2U1)(cyp450 2C42-like)(cyp450 4B1-like)(cyp450 2J6-like)
cin-miR-4085-3pENSCING00000022988ENSCING00000014704ENSCING00000006967
(cyp450 4F4-like)(cyp450 4B1-like)(Il-17-1)
cin-miR-4036-3pENSCING00000009298ENSCING00000013919ENSCING00000008093
(cyp450 2U1-like)(cyp450 2C42-like)(Tgf-ß-na1)
cin-miR-4200-3pENSCING00000006567ENSCING00000017012
(cyp450 4F6-like)(cyp450 2J6-like)
cin-miR-4148-5pENSCING00000005903ENSCING00000006567
(cyp450 2U1)(cyp450 4F6-like)
cin-miR-4116-5pENSCING00000005903ENSCING00000006967
(cyp450 2U1)(Il-17-1)
cin-miR-4119-3pENSCING00000006567ENSCING00000006967
(cyp450 4F6-like)(Il-17-1)
cin-miR-4011a-5pENSCING00000006567ENSCING00000008093
(cyp450 4F6-like)(Tgf-ß-na1)
cin-miR-4064-5pENSCING00000013919ENSCING00000008093
(cyp450 2C42-like)(Tgf-ß-na1)
cin-miR-5604-3pENSCING00000017012ENSCING00000008093
(cyp450 2J6-like)(Tgf-ß-na1)
cin-miR-4020b-5pENSCING00000005269ENSCING00000013600
(Il-17-3)(Tgf-ß-na2)
cin-miR-4065-3pENSCING00000006567ENSCING00000013600
(cyp450 4F6-like)(Tgf-ß-na2)
cin-miR-4121-3pENSCING00000014704ENSCING00000013600
(cyp450 4B1-like)(Tgf-ß-na2)
cin-miR-4203-3pENSCING00000022988ENSCING00000013919
(cyp450 4F4-like)(cyp450 2C42-like)
cin-miR-4083-5pENSCING00000005903ENSCING00000014704
(cyp450 2U1)(cyp450 4B1-like)
cin-miR-5596a-3pENSCING00000005903ENSCING00000014704
(cyp450 2U1)(cyp450 4B1-like)
cin-miR-4001b-5pENSCING00000014704ENSCING00000017012
(cyp450 4B1-like)(cyp450 2J6-like)
cin-miR-5605-3pENSCING00000005903ENSCING00000017012
(cyp450 2U1)(cyp450 2J6-like)
Table 4. Table shows all miRNAs that are common to deregulated cytochrome genes and cytokines, filtered for low energy values.
Conserved miRNASSpecies-Specific miRNAs
cin-let-7dcin-miR-3575-3p
cin-let-7ecin-miR-4001b-1-3p
cin-let-7f-5pcin-miR-4009a-3p
cin-miR-183-5pcin-miR-4009b-5p
cin-miR-196-3pcin-miR-4011a-5p
cin-miR-200-5pcin-miR-4020b-3p
cin-miR-672cin-miR-4036-3p
cin-miR-7-5pcin-miR-4037-5p
cin-miR-92c-5pcin-miR-4043-5p
cin-miR-92e-5pcin-miR-4047-3p
cin-miR-4058-5p
cin-miR-4064-5p
cin-miR-4064-5p
cin-miR-4065-3p
cin-miR-4077d-5p
cin-miR-4102-5p
cin-miR-4115-5p
cin-miR-4116-5p
cin-miR-4117-5p
cin-miR-4119-3p
cin-miR-4121-3p
cin-miR-4148-5p
cin-miR-4187-5p
cin-miR-4207-3p
cin-miR-4219-5p
cin-miR-5596a-3p
cin-miR-5596b-3p
cin-miR-5603-3p
cin-miR-5607-3p
cin-miR-5609-5p
cin-miR-5612-5p
cin-miR-4219-5p
Table 5. Access numbers.
NameGenBank no.
Ciona robusta Cyp P450 2B10-likeXP_026692382.1
Branchiostoma floridae Cyp P450 2J6-like XP_035667220
Branchiostoma floridae Cyp 450 2U1-like XP_035667221.1
Homo sapiens Cyp 450 2B6 NP_000758.1
Homo sapiens Cyp 450 1A1 NP_000490.1
Homo sapiens Cyp 450 2D6 NP_000097.3
Homo sapiens Cyp 450 26A1 NP_000774.2
Homo sapiens Cyp 450 4A22 NP_001010969.2
Homo sapiens Cyp 450 4A11 NP_000769.2
Homo sapiens Cyp 450 2C18NP_000763.1
Homo sapiens Cyp 450 2A7 NP_000755.2
Ciona robusta Cyp 450 2C15-likeXP_002123518.1
Branchiostoma floridae Cyp 450 2C15-likeXP_035694363.1
Drosophila melanogaster C15 NP_476873.2
Ciona robusta Cyp 450 2C42-likeXP_018669209.2
Sus scrofa Cyp 450 2C42 NP_001161307.1
Aplysia californica Cyp 450 2C42 XP_012936173.2
Crassostrea gigas Cyp 450 2C42 XP_011452086.2
Bos Taurus Cyp 450 2C42XP_005225699.1
Ciona robusta Cyp 450 2J6-like XP_002129285.1
Mus musculus Cyp 450 2J6NP_034138.3
Haplochromis burtoni Cyp 450 2J6XP_014186874.1
Xenopus tropicalis Cyp 450 2J6 XP_002935636.1
Strongylocentrotus purpuratus Cyp 450 2J6XP_001178133.3
Ciona robusta Cyp 450 2U1 XP_002119562.1
Homo sapiens Cyp 450 2U1 NP_898898.1
Mus musculus Cyp 450 2U1NP_082092.2
Ciona robusta Cyp 450 2U1-licke XP_026690452.1
Homo sapiens Cyp 450 4F2sp|P78329.1|
Homo sapiens Cyp 450 4F3sp|Q08477.2|
Homo sapiens Cyp 450 4B1 NP_001093242.1
Mus musculus Cyp 450 4B1 NP_031849.1
Bos taurus Cyp 450 4B1NP_001069670.1
Haplochromis burtoni Cyp 450 4B1XP_014190098.1
Xenopus tropicalis Cyp 450 4B1 XP_012817051.1
Branchiostoma floridae Cyp 450 4B1-likeXP_035680110.1
Drosophila melanogaster Cyp 450 AAC47424.1
Ciona robusta 4B1XP_002125043.1
Ciona robusta 4F6XP_002123011.3
Table 6. Primers used for qRT-PCR.
GenePrimer Sequence (5′-3′)
Mif15′-GCTTGCAGCGCTTTTGATG-3′
5′-AAACGGGTTCCAGAAACTCCTAA-3′
Mif25′-CCATGAAGCAACGAGGGAAA-3′
5′-TTCTTGGCTGCGAGTTGGT-3′
Cyp 2B105′-CAAGGCCCAGCGTTTCAG-3′
5′-CATTGCTGTGGGCTTCGAT-3′
Cyp 2C155′-CAACGACAAGCATCGAACTCA-3′
5′-TTGGCGATAACAGGCATACCA-3′
Cyp 2C425′-TCGTCATTTTAGGTCGGTGATG-3′
5′-TCAGTCATAGCTCGATACGAATACG-3′
Cyp 2J65′-TCCTAAATGGCAAGATCGCATA-3′
5′-AAACTCCGTTCTCACCGATATTG-3′
Cyp 2U15′-TGGTCGAAGATCCGAACGA-3′
5′-ACAACTGCTCTTTGTTCCACCAT-3′
Cyp 2U1-like5′-AATGCAAAAATGGAGCAGAAAGT-3′
5′-CCCGGCTCCCCATACG-3′
Cyp 4B15′-AAAACGAGCCCAACGTACCA-3′
5′-TAAAGGTCCAAACCATGTTGTCA-3′
Cyp 4F65′-GGAGATGGTCTGTTGACAAGCA-3′
5′-CAGGCGTTAGAAGCCTTCTGTT-3′
Tgfβ5′-TTTCAGGGACCCAAAAACGA-3′
5′-GCCAGCTATAATGACATCCAAGGT-3′
Tnfα5′-GCCTCCCATAGACCGTTGTTAA-3′
5′-CGGGACACCTTCAGCACAT-3′
Il17-15′- GCCGGGAACGTGACAGAA- 3′
5′-GGCATGTTGATTGCGACCTT- 3′
Il17-25′-GTGTAGCGGGTGCATTGCT-3′
5′-GGCACCGACTTCCCAACA-3
Il17-35′-CAAAGCGGAGCCTTCAATGT-3′
5′-GCTTCTTTGCTCGACACTTGTG-3′
Nf-kB5′-GCCGACGTACTGCTTTGCA-3
5′-GCCAGCCACCACGATGTT-3″
Actin5′-TGATGTTGCCGCACTCGTA-3
5′-TCGACAATGGATCCGGT-3″
Publisher’s Note: MDPI stays neutral with regard to jurisdictional claims in published maps and institutional affiliations.

