Article

Dissecting the Molecular Regulation of Natural Variation in Growth and Senescence of Two Eutrema salsugineum Ecotypes

1
Shandong Provincial Key Laboratory of Plant Stress, College of Life Sciences, Shandong Normal University, Jinan 250014, China
2
Yellow Sea Fisheries Research Institute, Chinese Academy of Fishery Sciences, Qingdao 266071, China
*
Authors to whom correspondence should be addressed.
These authors contributed equally to this work.
Int. J. Mol. Sci. 2022, 23(11), 6124; https://doi.org/10.3390/ijms23116124
Submission received: 8 May 2022 / Revised: 22 May 2022 / Accepted: 27 May 2022 / Published: 30 May 2022
(This article belongs to the Special Issue Mechanisms of Plant Salt Resistance)

Abstract

:
Salt cress (Eutrema salsugineum, aka Thellungiella salsuginea) is an extremophile and a close relative of Arabidopsis thaliana. To understand the mechanism of selection of complex traits under natural variation, we analyzed the physiological and proteomic differences between Shandong (SD) and Xinjiang (XJ) ecotypes. The SD ecotype has dark green leaves, short and flat leaves, and more conspicuous taproots, and the XJ ecotype had greater biomass and showed clear signs of senescence or leaf shedding with age. After 2-DE separation and ESI-MS/MS identification, between 25 and 28 differentially expressed protein spots were identified in shoots and roots, respectively. The proteins identified in shoots are mainly involved in cellular metabolic processes, stress responses, responses to abiotic stimuli, and aging responses, while those identified in roots are mainly involved in small-molecule metabolic processes, oxidation-reduction processes, and responses to abiotic stimuli. Our data revealed the evolutionary differences at the protein level between these two ecotypes. Namely, in the evolution of salt tolerance, the SD ecotype highly expressed some stress-related proteins to structurally adapt to the high salt environment in the Yellow River Delta, whereas the XJ ecotype utilizes the specialized energy metabolism to support this evolution of the short-lived xerophytes in the Xinjiang region.

1. Introduction

Salt cress (Eutrema salsugineum, also known as Thellungiella salsuginea or Thellungiella halophila in older literature) is a typical halophyte to study abiotic stress tolerance [1,2,3,4,5]. Not only does it have a high tolerance to extreme salt stress, but it also has a high tolerance to freezing, nitrogen deficiency, and drought stress [2,4,6,7]. From the perspective of genetic research, E. salsugineum has the characteristics of small plant size, a short life cycle, a large number of seeds, and strong self-pollination ability. In addition, E. salsugineum and Arabidopsis thaliana show a high degree of sequence identity at both the cDNA and amino acid levels [8,9,10].
The ubiquitous heterogeneity of natural habitats makes it difficult to extract plant resources and seriously affects the growth, reproduction, and distribution of plants [11,12]. Phenotypic plasticity is an important ecological strategy for plants to adapt to heterogeneous habitats [13]. Plants growing in heterogeneous habitats have high phenotypic plasticity, which can maximize resource acquisition and optimize resource allocation between organs and tissues, thereby improving resource utilization efficiency and ultimately improving plant adaptability. Phenotypic plasticity can play a key role in the successful colonization of adaptive halophytes such as Eutrema, and this plasticity can lead to the formation of ecotypes in geographical regions. Ecotypes are common in many plants and are used to describe genetically distinct populations adapted to specific environmental conditions [14,15]. Local selection of different habitats plays a crucial role in the generation and maintenance of genetic diversity [16].
In China, salt cress is distributed from the Yellow River basin to the Yellow River estuary in Dongying City, Shandong Province, resulting in many naturally occurring ecotypes. Among them, Shandong and Xinjiang ecotypes grow in different natural habitats and are typical representatives. Xinjiang is located inland and has a continental temperate dry climate. Dongying City is located in the Yellow River Delta and has a temperate monsoon climate with frequent rainfall [17]. To adapt to the different living environments, the two salt cress ecotypes can adopt complex mechanisms, including developmental, morphological, physiological, and biochemical coping and adaptation strategies.
Current research on salt cress has focused on comparing its response to abiotic stress with that of A. thaliana [18]. However, comparative studies on the growth, development, and responses to abiotic stress of different salt cress ecotypes are still sporadic, and comparative studies on the proteomics of different salt cress ecotypes have not yet been reported. As we know, proteome analysis can help us gain more intuitive and accurate knowledge to uncover natural variations. In this study, two E. salsugineum ecotypes, Shandong (SD) and Xinjiang (XJ), were selected to study their morphological and physiological differences. In addition, proteomic comparisons were performed under optimal growth conditions to reveal the evolutionary differences at the protein level between these two ecotypes.

2. Results

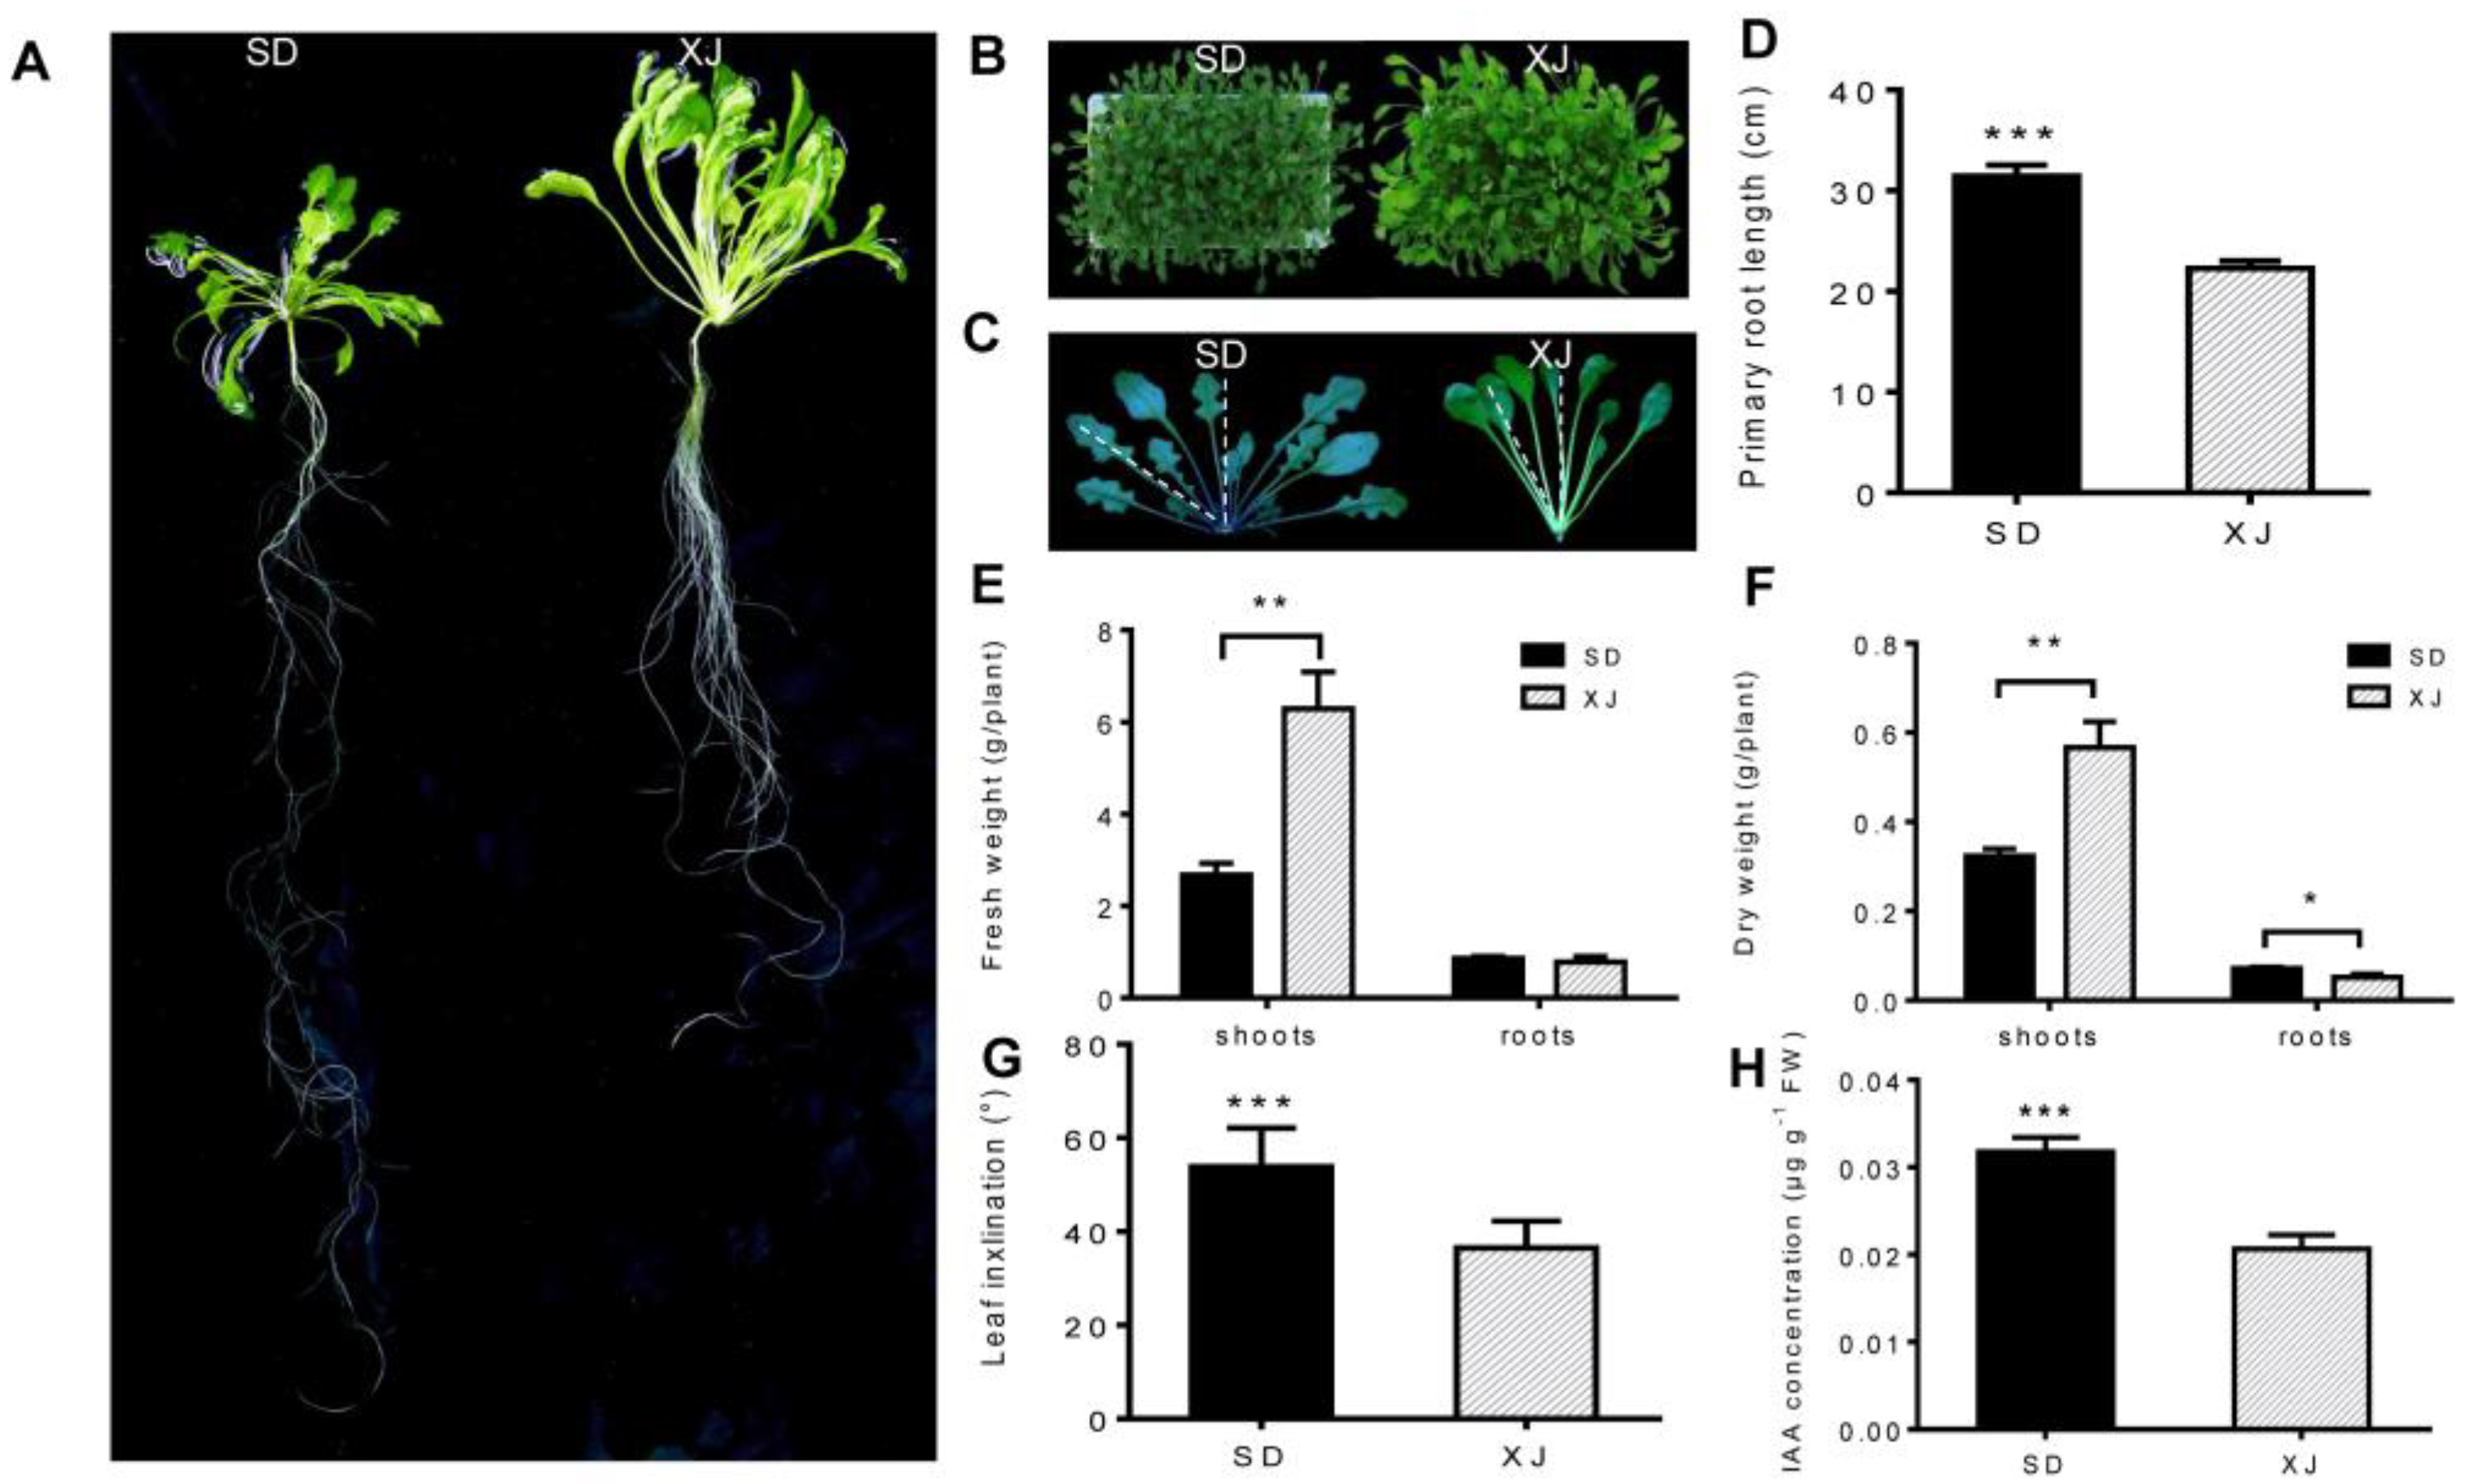
2.1. Morphological and Physiological Comparison

After culturing the two Eutrema ecotypes in a hydroponic system for 6 weeks, there were significant differences in the morphology of shoots and roots between the two ecotypes. The leaves of the SD ecotype Eutrema are dark green, short and flat; The leaves of the XJ ecotype Eutrema are light green, long and curly (Figure 1A,B). Although the root system of each ecotype is the taproot, there are major differences between root systems. SD Eutrema ecotype has an obvious taproot, and XJ Eutrema ecotype has a short taproot and developed lateral roots (Figure 1A). In addition, the SD ecotype Eutrema had longer taproots than the XJ ecotype (Figure 1D). Biomass analysis showed that the fresh weight of shoots of XJ Eutrema was higher, while the difference in fresh weight of roots was not significant (Figure 1E). The average dry weight of the XJ ecotype was also larger than that of the SD ecotype (Figure 1F). When comparing the leaf inclination angle of the two ecotypes, we found that the leaf pitch angle of the SD ecotype Eutrema was significantly greater than that of the XJ ecotype (Figure 1C,G). The IAA concentration of the SD ecotype was significantly higher than that of the XJ ecotype, which may be closely related to leaf margin shape. (Figure 1C,H) [19].
During hydroponics, we found that the XJ ecotype Eutrema showed clear signs of senescence or leaf loss (Figure 2A). Therefore, we compared the degree of leaf senescence of the two ecotypes and found that the number of etiolated leaves and the chlorosis extent of same-position leaves of the XJ ecotype were higher than those of the SD ecotype, showing obvious leaf yellowing symptoms (Figure 2B). Meanwhile, the chlorophyll content of the SD ecotype leaves was about 1.7 times higher than that of the XJ ecotype (Figure 2C). This result is consistent with the phenomenon of leaf senescence. Further comparing the leaf area of the two Eutrema, we found that the leaf area of the XJ ecotype was significantly larger than that of the SD ecotype (Figure 2D). To elucidate the role of phytohormones in Eutrema leaf senescence, the cytokinin (CK) concentrations of the SD ecotype were measured, and the results showed that the SD ecotype had significantly higher cytokinin concentrations than the XJ ecotype. (Figure 2E). This result suggests that cytokinin (CK) plays an important role in leaf senescence in both ecotypes. To further elucidate the mechanism of the leaf senescence differences between the two ecotypes, the expression of leaf senescence marker genes senescence-associated gene 12 (SAG12) and SAG113 was analyzed. Additionally, we found that the expression of these two genes was decreased in the SD ecotype (Figure 2F), which reflected the molecular basis of the difference in leaf senescence between these two ecotypes. Therefore, our results suggest that the XJ ecotype leaves are more susceptible to age-dependent senescence.

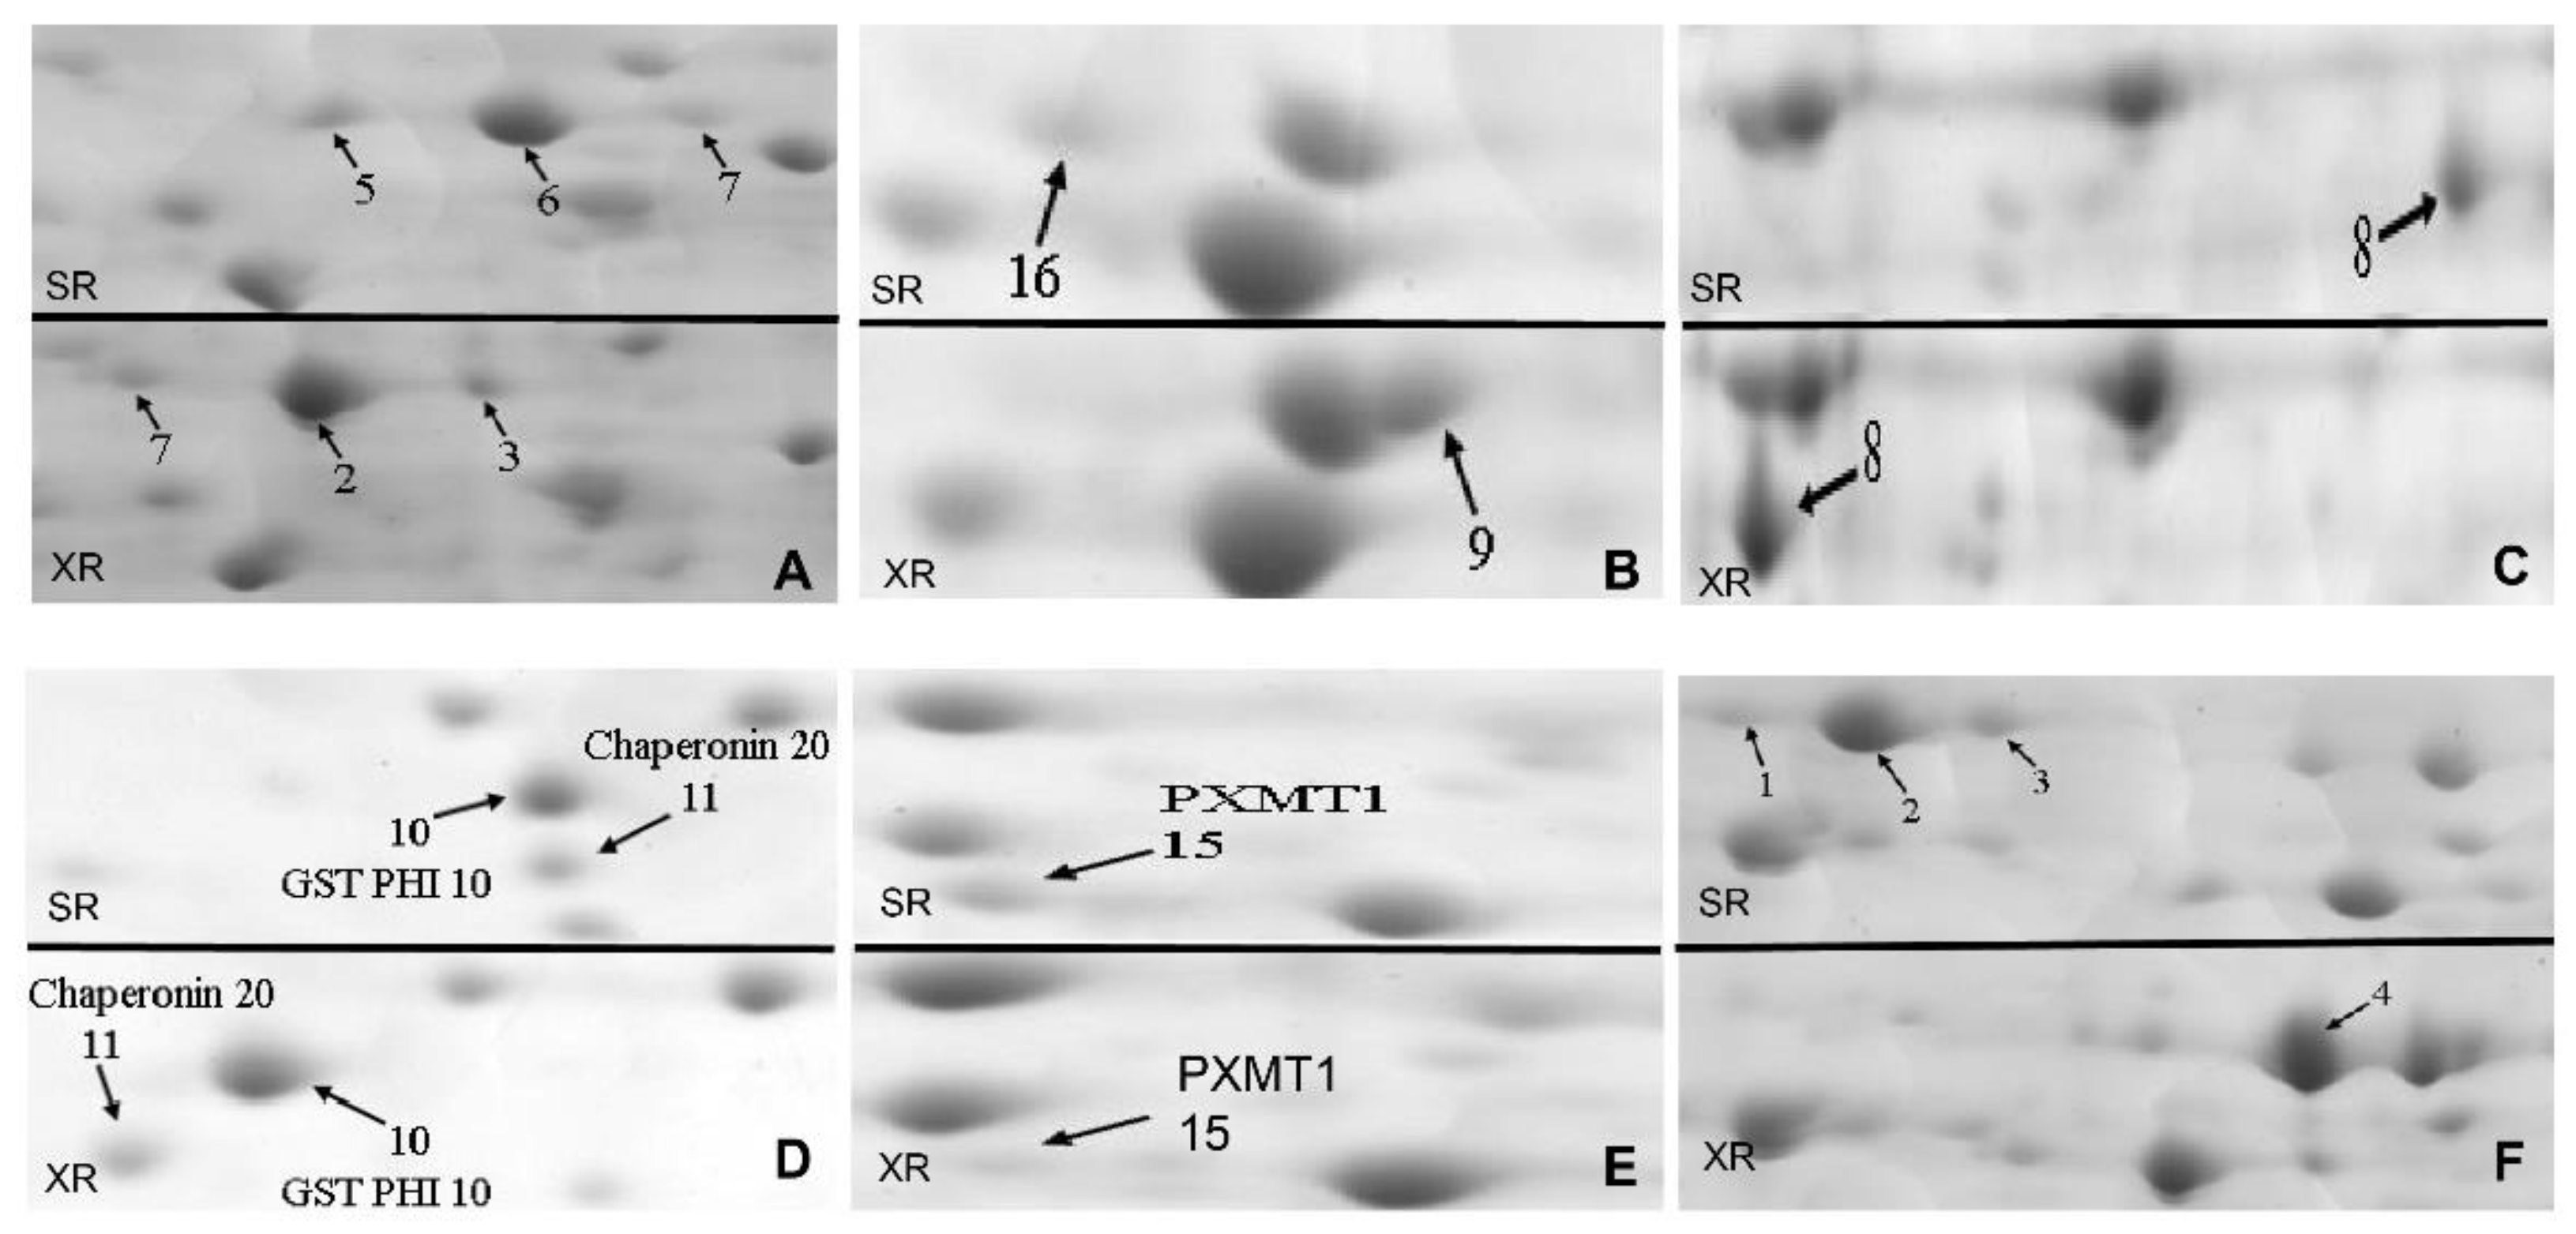
2.2. Identification of Differently Expressed Protein Spots from Two Ecotypes by 2-DE and ESI-MS/MS

To investigate the mechanisms underlying the morphological and physiological differences between the two Eutrema ecotypes, a comparative proteomic analysis of Eutrema was performed. Proteins were extracted from the shoots or roots of 6-week-old seedlings of both ecotypes and separated by IEF/SDS-PAGE, respectively. After image analysis, more than 900 protein spots were reproducibly detected and matched in the shoot gel, and more than 700 protein spots were reproducibly detected and matched in the root gel. A representative 2-DE gel image is shown in Figure 3. Proteins were well separated in both dimensions. The isoelectric points (pI) of the spots range from 4 to 7, and the molecular mass ranges from 10 to 80 kDa. Only the protein spots exhibiting significant changes (>2 fold or <0.5 fold and p-value < 0.05) between different ecotypes were employed for further analysis.
Quantitative image analysis revealed that 66 protein spots from shoot gels and 34 protein spots from root gels showed significant differences between the two ecotype samples (Figure 3). Most proteins in shoots were completely absent in SD or XJ ecotype samples, and some protein spots were increased or decreased in SD or XJ ecotype samples. While most proteins in roots were characterized by the acid-base properties of pI, only 4 proteins appeared in SD or XJ ecotype samples compared with each other. The differentially expressed protein spots were excised, digested with trypsin, and identified by ESI-MS/MS. The identified protein has two or more peptide fragments (Supplementary Tables S1 and S2). The results showed that 25 protein spots in shoots and 28 protein spots in roots were identified by ESI-MS/MS (Table 1 and Table 2).
Interestingly, three proteins were identified in shoots in the Eutrema SD ecotype, such as 2,3-bisphosphoglycerate-independent phosphoglycerate mutase 1 (spots SS4 and 5), plasma membrane-associated cation-binding protein 1 (spots SS6, 7, and 8), and 2-Cys peroxiredoxin BAS1 (spots SS11, 12). In the roots of the SD ecotype Eutrema, jacalin-related lectin 34 (spots SR1, 2, and 3) and 2,3-bisphosphoglycerate-independent phosphoglycerate mutase 1 (spots SR5, 6, and 7) were identified. Likewise, the 2,3-bisphosphoglycerate-independent phosphoglycerate mutase 1 was found in the roots of the XJ ecotype Eutrema (spot XR2, 3, and 7). Further examination of the gel map shows that the experimental values of isoelectric point or molecular mass deviate from the theoretical values. This phenomenon may be due to the presence of different protein isoforms and post-translational modifications or degradation, which may alter the protein’s molecular weight and/or charge. Alternatively, proteins appearing at multiple sites may be due to the translation of alternatively spliced mRNAs [20].

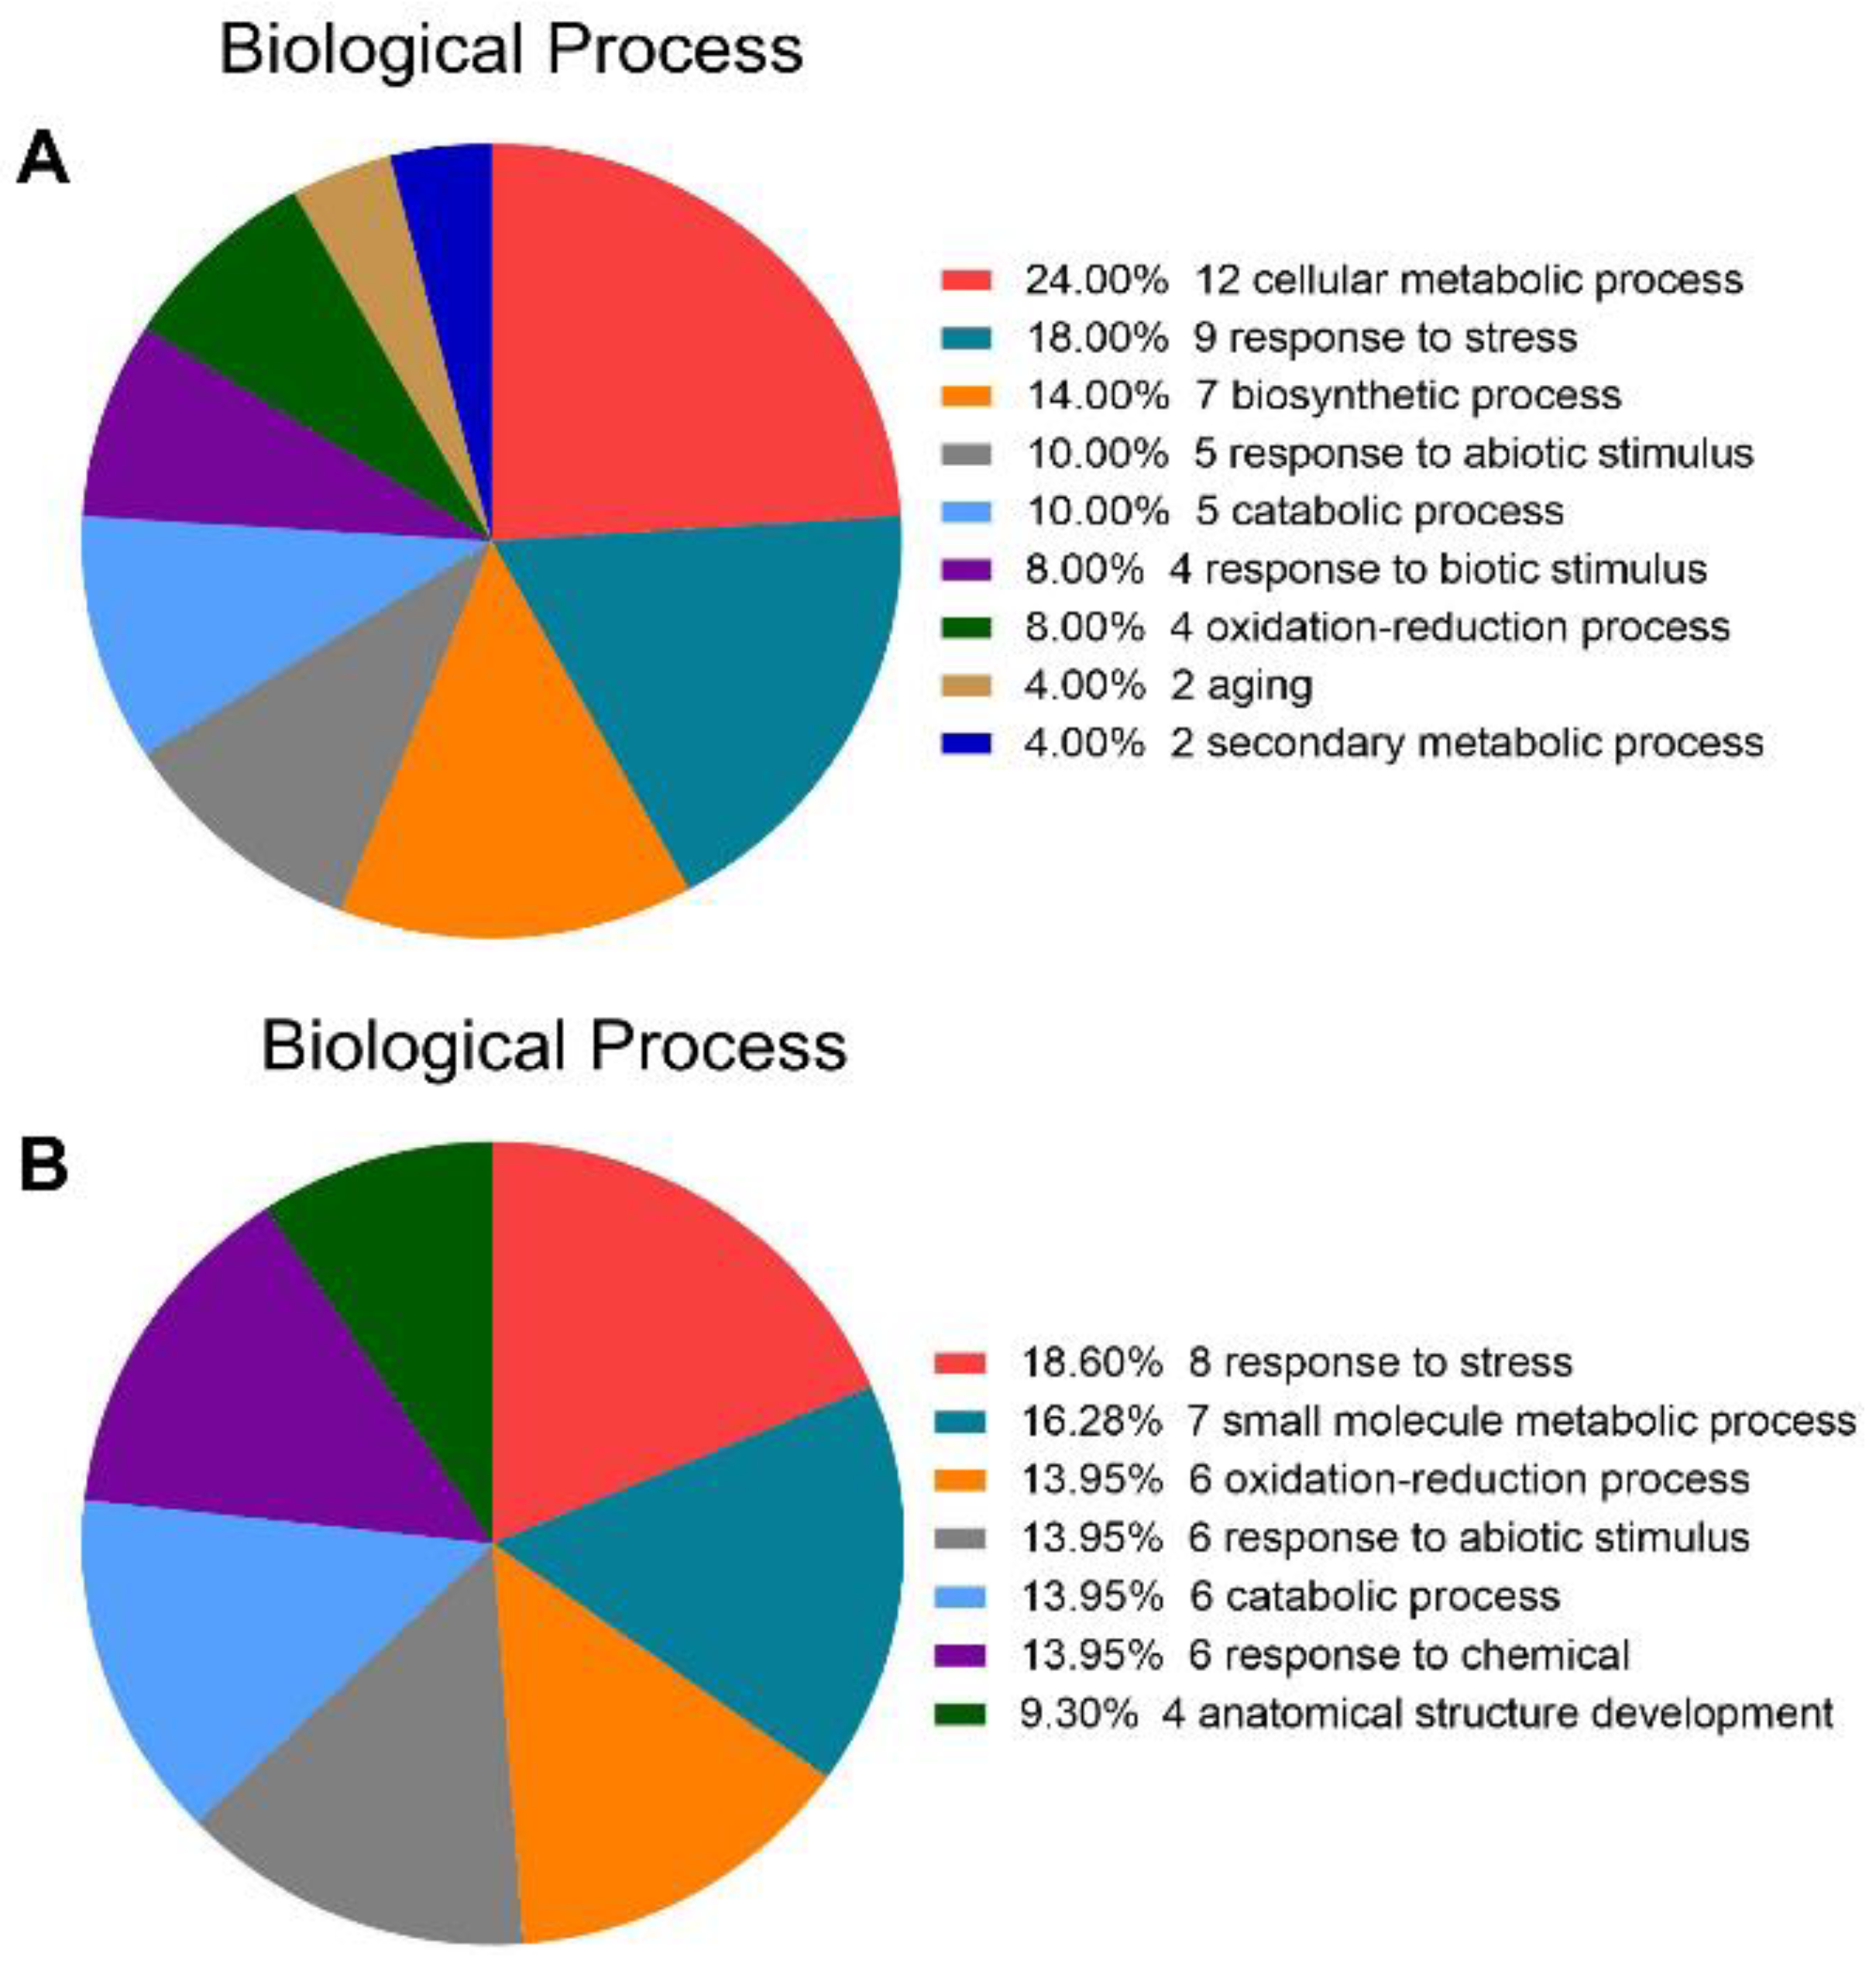
2.3. Functional Annotation of Different Proteins

To further functionally classify differentially expressed proteins, GO enrichment analysis following biological processes was performed. Representative GO terms were involved in the cellular metabolic process (24%), response to stress (18%), response to abiotic stimulus (10%), and aging (4%), etc., in the two ecotype shoots (Figure 4A). In the root system, the stress response was the largest (18.6%), followed by the small molecule metabolic process (16.28%), oxidation-reduction process (13.95%), and the response to abiotic stimulus (13.95%) (Figure 4B). This finding suggests that metabolism-related proteins and stress-related and defense-related proteins might play important roles in the evolution of distinct intrinsic traits of the two ecotypes.

2.4. Analysis of Differentially Expressed Protein Spots from Two Ecotypes

Proteins associated with cellular metabolic processes such as ketoacid reductase isomerase (KARI) (spot XS4, Figure 5A), glutathione synthetase (GSH2) (spot XS19, Figure 5A), and L-diaminopimelate aminotransferase (AGD2) (spot XS8, Table 1) appear in shoots of the XJ ecotype. As a major bifunctional enzyme, KARI catalyzes a two-step reaction in branched-chain amino acid biosynthesis to produce the precursors of valine, leucine, and isoleucine [21]. Glutathione synthetase encodes the enzyme that converts γ-glutamylcysteine (γ-EC) to glutathione. In plants, glutathione, as a powerful non-enzymatic antioxidant, plays a key role in various physiological responses such as redox homeostasis and ROS scavenging, detoxification of heavy metals, and development [22,23,24]. Under normal conditions, root growth is reduced due to impaired glutathione biosynthesis [25]. LL-diaminopimelate aminotransferase plays a role in plant lysine biosynthesis [26]. Based on these results, we believe that the increase in metabolism-related proteins helps XJ ecotype plants generate more energy from carbon and nitrogen assimilation, leading to faster growth and increased biomass, which is consistent with our previous physiological evidence. On the other hand, the contents of other proteins related to cellular metabolic processes were also increased in SD ecotype plants. Among them, 2,3-bisphosphoglycerate-independent phosphoglycerate mutase 1 (iPGAM1) (spots SS4 and 5, Figure 5A) catalyzes the reversible conversion of 3-phosphoglycerate to 2-phosphoglycerate during glycolysis. ATP sulfurylase 1 (APS1) (spots SS27, Figure 5A) increased less than 2-fold in SD ecotype plants shoot compared to XJ ecotype. APS catalyzes the first step of sulfate assimilation in plant plastids and cytosol, activating inorganic sulfate to adenosine-5′-phosphosulfate, which, in turn, is converted to a variety of sulfides such as cysteine (Cys), methionine (Met), glutathione (GSH) associated with plant tolerance to various abiotic stresses [27]. Therefore, we hypothesized that increasing APS1 in SD ecotypes would accelerate sulfur assimilation and improve SD ecotype tolerance to abiotic and biotic stresses.
In addition, four proteins involved in the stress response were significantly elevated in the SD ecotype, including plasma membrane-associated cation-binding protein 1 (PCAP1) (spots SS6, 7, and 8, Figure 5B), pathogenicity-associated protein 5 (PR5) (spot SS10, Figure 5B), endochitinase (CHI) (spot SS14, Figure 5B) and glucan endo-1,3-beta-glucosidase (BG1) (spot SS29, Figure 5B). PCAP1 is a hydrophilic cation-binding protein that localizes to the plasma membrane via N-myristoylation on glycine 2 and interacts with calmodulin and phosphatidylinositol phosphate [28]. PR5, CHI, and BG1 are pathogenesis-related (PR) proteins that are key components of the plant’s innate immune system, particularly systemic acquired resistance (SAR) [29]. In addition to biotic stress, the PR gene can also be induced by a variety of abiotic stresses such as salt, drought, and cold, which enhances the resistance against abiotic stress [30]. In this study, the expression of three PR proteins, PR5, CHI, and BG1, were upregulated in SD ecotype plants, suggesting that SD ecotype plants may have a higher tolerance to biotic and abiotic stress than the XJ ecotype. In addition to the SD ecotype, the XJ ecotype shoots also show a small increase in abiotic stimulation-related proteins such as 20 kDa chaperonin (Cpn20) (spot XS12, Figure 5B). Chloroplast Cpn20 is a plastid-specific co-chaperone that is essential for assisting Cpn60 in protein folding. Meanwhile, Cpn20 might be an iron chaperone for iron superoxide dismutase (FeSOD) activation, independent of its co-chaperonin role in the Arabidopsis chloroplasts [31,32]. Therefore, we speculate that the high expression of Cpn20 in leaves may confer resistance to the abiotic environment in XJ ecotype plants, thereby promoting the growth and accumulation of above-ground biomass in XJ ecotype plants.
1-Aminocyclopropane-1-carboxylic acid oxidase (ACO), an aging-related protein, is the rate-limiting enzyme for ethylene production in certain dedicated processes [33]. Ethylene affects plant growth and development, including fruit ripening and leaf senescence [34]. In this report, we found that the expression of 1-aminocyclopropane-1-carboxylate oxidase 4 (ACO4) (spot XS6, Figure 5C) in shoots of the XJ ecotype was significantly higher than that of the SD ecotype. Further analysis of ACO concentrations in both ecotypes also showed a trend consistent with ACO4 expression (Figure 5D). These results suggest that upregulation of ACO4 protein expression in leaves of the XJ ecotype may lead to earlier leaf senescence and a shorter life cycle compared with the SD ecotype.
In the roots proteome, various proteins have been detected during the small molecule metabolic process, such as 2,3-bisphosphoglycerate-independent phosphoglycerate mutase 1 (iPGAM1) (spots SR5, 6, and 7, spots XR7, 2, and 3, Figure 6A), pyruvate kinase (PK) (spot XR5, Table 2) and pyruvate dehydrogenase E1 component subunit beta-1 (MAB1) (spots SR16, XR9, Figure 6B). In our study, the differences in iPGAM1 were mainly reflected in isoelectric point shifts between SD and XJ ecotypes. Phosphoglycerate mutase catalyzes the interconversion of 3-phosphoglycerate to 2-phosphoglycerate [35]. This glycolytic enzyme has been reported to be a key component in providing energy and/or metabolites for multiple metabolic pathways [36]. Pyruvate kinase (PK) is a key metabolic enzyme that catalyzes the final step of glycolysis, transferring a high-energy phosphate group from phosphoenolpyruvate (PEP) to ADP to generate ATP and pyruvate [37]. In our study, PK was present in the roots of XJ Eutrema but not in the roots of the SD ecotype. Likewise, MAB1 also increased in the roots of the XJ ecotype. In plants, the mitochondrial pyruvate dehydrogenase complex consists of the following three structural components: E1, E2, and E3. E1 (pyruvate dehydrogenase) is responsible for the oxidative decarboxylation of pyruvate. Based on the above results, we speculate that the increase in root metabolic proteins in the XJ ecotype may contribute to the uptake of sufficient inorganic elements to maintain a higher aboveground biomass than the SD ecotype.
In addition to metabolism-related proteins, oxidation-reduction process-related proteins were increased or present only in XJ ecotype roots, including NADH dehydrogenase [ubiquinone] iron-sulfur protein 1 (CI76) (spot XR1, Table 2), NAD(P)H dehydrogenase (quinone) (FQR1) (spot XR13, Table 2), monodehydroascorbate reductase 2 (MDAR2) (spots SR8, XR8, Figure 6C). In particular, methylmalonate-semialdehyde dehydrogenase (MMSDH) (spot XR6, Table 2) was highly expressed in XJ Eutrema roots but not in the SD ecotypes. CI76 encodes the subunit of the 400 kDa subcomplex of the mitochondrial NADH dehydrogenase (complex I), the first complex of the respiratory chain and the main entrance site for electrons into the respiratory electron transfer chain, and plays a role in maintaining redox balance in plant cells [38]. FQR1 belongs to the family of flavin mononucleotide-binding quinone reductases, catalyzes the electron transfer of NADH and NADPH to multiple substrates, and functions as a quinone reductase in plants. Its gene, FQR1, is the main gene of the auxin response. Hence, it is speculated that FQR1 might be involved as a detoxification enzyme in the auxin-induced redox process [39]. As a key component of the ascorbate-glutathione cycle, MDAR2 plays a role in scavenging toxic reactive oxygen species, such as H2O2, a byproduct of aerobic metabolism in plant chloroplasts, mitochondria, and peroxisomes [40]. Aldehyde dehydrogenases (ALDHs) represent a protein superfamily of NAD(P)+-dependent enzymes that oxidize various endogenous and exogenous aliphatic and aromatic aldehydes to the corresponding carboxylic acids. ALDHs play an important role in regulating aldehyde homeostasis, and overexpression of some ALDHs can improve abiotic stress tolerance in plants [41]. Different expression patterns of ALDH7B4 and ALDH10A8 in Arabidopsis and E. salsugineum contribute to salt tolerance [42]. MMSDH (ALDH6B2), a member of the ALDH family, plays an important role in root development and leaf sheath elongation in rice [43]. Collectively, these antioxidant proteins play an important role in maintaining root redox homeostasis in the XJ ecotype and providing protection for root adaptation to the environment.
Some proteins that respond to abiotic stimuli are also found in the root proteome, such as alcohol dehydrogenase class-P (ADH1) (spot SR9, Table 2), glutathione S-transferase F10 (GST PHI10) (spots SR10, XR10, Figure 6D), 20 kDa chaperonin (Cpn20) (spots SR11, XR11, Figure 6D), paraxanthine methyltransferase 1 (PXMT1) (spot SR15, Figure 6E) and jacalin-related lectin 34 (JRL34) (spots SR1, 2, 3 and spot XR4, Figure 6F). The protein expression levels of ADH1 and PXMT1 in the SD ecotype were higher than those in the XJ ecotype, while GST PHI10 and Cpn20 were up-regulated in the roots of the XJ ecotype. ADH1 catalyzes the reversible conversion of acetaldehyde to ethanol while simultaneously oxidizing NADH to NAD+ in response to hypoxic stress. This is essential for Arabidopsis survival under hypoxic conditions and contributes to other biotic and abiotic stress reactions [44]. Plant glutathione S-transferases (GSTs) are a class of multifunctional proteins that are induced by a variety of stimuli. GST PHI10 is a member of the Phi subfamily, particularly in plants [45]. Furthermore, we found in our study that the isoelectric point of JRL34 is significantly different between the two Eutrema ecotypes. Studies have shown that this protein is a phosphorylated protein [46], so we speculate that post-translational modifications may contribute to the isoelectric point difference of this protein between the two ecotypes. In addition, jacalin-related lectins (JRLs) are a subset of proteins binding carbohydrates and having one or more jacalin domains. Many JRLs have been shown to be associated with resistance to abiotic and biotic stresses and are induced by stress hormones such as ABA, SA, and JA [47]. Therefore, we speculate that changes in JRL34 may partly determine the differences in the responses of the two ecotypes to different abiotic stimuli.

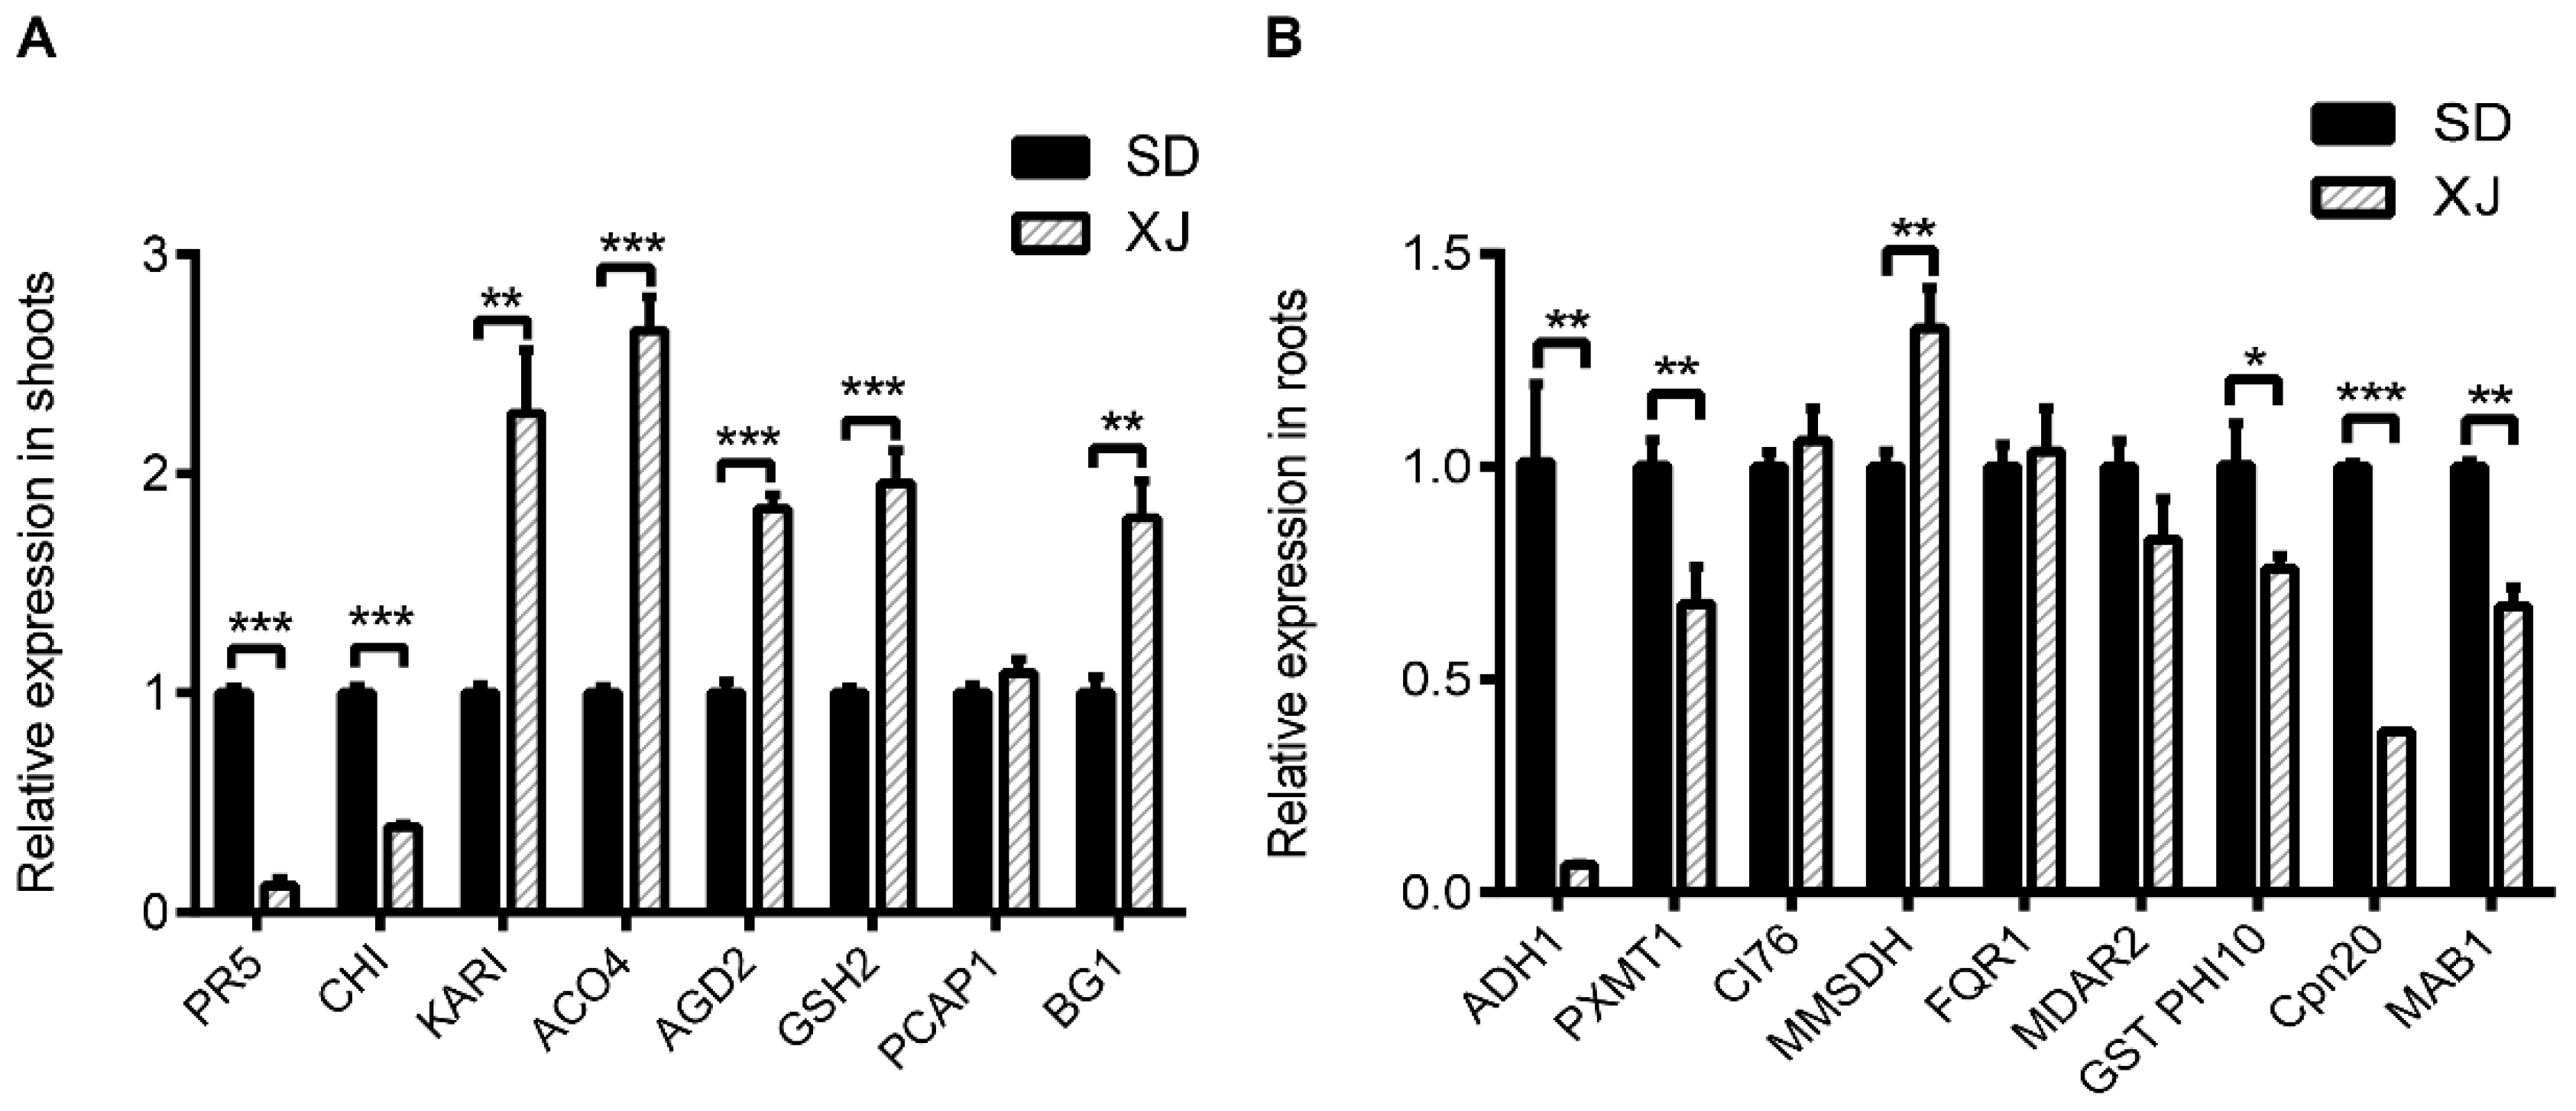
2.5. Comparison the Expression Patterns of Genes Encoding Some Differential Proteins

To examine changes in gene expression at the mRNA level, qRT-PCR analysis was performed on randomly selected genes encoding some differently expressed proteins in 6-week-old seedlings under hydroponic conditions.
Compared with the XJ ecotype, we found that under normal conditions, the SD ecotype had increased the expression of two genes in plants, namely, PR5 and CHI. In contrast, five genes, KARI, ACO4, AGD2, GSH2, and BG1, were significantly up-regulated in XJ ecotype plants. Among them, the abundance of ACO4 transcripts in XJ ecotype shoots was significantly higher than that in SD shoots, which was consistent with the expression of ACO4 at the protein level (Figure 7A).
Changes in genes encoding root differential proteins were compared at the mRNA level. As shown in Figure 7B, genes and proteins such as ADH1, PXMT1, MMSDH, GST PHI10, and Cpn 20 had similar patterns of alteration. However, some root DEPs showed inconsistent expression patterns at the mRNA and protein levels. Our results confirm that gene expression at the transcriptional level does not correlate well with expression at the protein level [48], underscoring the importance of using the proteome to reveal the biochemical mechanisms of natural variation between the two Eutrema ecotypes.

3. Discussion

Salt cress is an extremophile that has been proposed as a model for studying the mechanism of abiotic stress tolerance and is widespread throughout the world [1]. The broad geographic distribution encompasses substantial variation in growth environments, and phenotypic variation among accessions is expected to reflect the genetic variation that is important for adaptation to specific conditions. In recent years, research based on the analysis of the natural genetic variation of species has received increasing attention [49,50]. Until recently, the physiological mechanisms adopted by two ecotypes of SD and XJ Eutrema to perceive and acclimate to their environment were seldom discussed in a biochemical context or from a biochemical perspective. In this study, a proteomic approach was used to compare the morpho-physiological properties of two different Eutrema ecotypes and their protein expression profiles in shoots and roots. Through the comprehensive analysis of these differentially expressed proteins, we have a preliminary understanding of the protein-level regulatory mechanism behind the phenotypic differences between the two ecotypes and provide important information for understanding the natural mechanism of variation of Eutrema.

3.1. Variations in Morpho-Physiological Traits

The two ecotypes of salt cress seedlings had great differences in morphological and physiological characteristics. The biomass and leaf area of XJ ecotype plants are larger than those of SD ecotype plants. While the primary root system of SD ecotype plants is more significant than that of XJ ecotype plants, the leaf inclination angle is larger, and the serrated leaf margin is even more evident (Figure 1). These differences may be due to long-term adaptation to different natural habitats, resulting in intrinsic differences in gene expression, metabolic pathways, and hormone levels between the two ecotypes. Furthermore, we found that the expression and concentration of 1-aminocyclopropane-1-carboxylic acid oxidase 4, a key enzyme in ethylene synthesis, was increased in the XJ ecotype (Figure 1C,G and Figure 5C,D), which could be related to leaf senescence and leaf inclination. The previous study indicates that higher levels of ethylene stimulate a more vertical orientation of the petioles (hyponasty) and enhance elongation [51]. There is evidence that differences between species and ecotypes in the effects of ethylene on growth may be related to the altitude of the original habitat [51]. Furthermore, our data suggest that the SD ecotype plants have higher IAA concentrations than the XJ ecotype (Figure 1H) and that intrinsic differences in auxin levels may be reflected in differences in leaf margin shape to a certain extent (Figure 1C) [19]. These changes suggest that morphological and physiological changes between SD and XJ ecotypes are triggered by different regulatory mechanisms.

3.2. Stress and Defense-Related Proteins in Shoots

Biological or abiotic stresses reduce crop yields worldwide. Many attempts have been made to confer pathogen resistance and increase abiotic stress tolerance on agronomically valuable plants. Defense-related proteins have been used to alter plant resistance to pathogens and other environmental challenges. In our study, some stress- and defense-related proteins, such as PCAP1 (spots SS6, 7, and 8, Figure 5B), PR5 (spot SS10, Figure 5B), CHI (spot SS14, Figure 5B), and BG1 (spot SS29, Figure 5B), were highly expressed in SD ecotype plants, which may improve plant resistance to various pathogens and abiotic stresses. PCAP1 is a hydrophilic cation-binding protein with the ability to bind Ca2+, Mg2+, and Cu2+. At the same time, it can be fixed to the plasma membrane by N-myristoylation [28,52,53], and participate in intracellular signal transduction by interacting with PtdInsPs and calmodulin [54]. Thus, PCaP1 has multiple physiological roles, including partial involvement in stoma closure [55] and inhibition of microtubule polymerization by binding to tubulin [56]. The occurrence of PCAP1 in SD ecotype Eutrema shoots suggests that SD ecotype Eutrema may have increased stress tolerance. PR5 is an important defense-related protein in plants and is involved in various stress responses [30]. Chitinases are part of the plant defense system, are nontoxic to plants and higher vertebrates, and are involved in plant defenses against pathogens [57,58]. Previous reports have shown that the expression of chitinase genes increases resistance to various fungal diseases [59,60,61]. Recent studies have shown that chitinase is also involved in the abiotic stress responses of plants, helping plants survive in stressful environments [62]. Beta-1,3-glucanase, also known as pathogenesis-related protein (PR) and found in many plant tissues, catalyzes the hydrolysis of beta-1,3-glucan. β-1,3-glucanase has been shown to participate in defenses against fungal pathogens and abiotic stresses such as salt and drought stress [63,64,65]. In conclusion, compared with the XJ ecotype, the SD ecotype of Eutrema strongly expresses some key components of the plant’s innate immune system, especially systemic acquired resistance, thereby improving the plant’s resistance to biotic and abiotic stresses. However, this plant’s fight against stress upsets the balance between energy production and energy expenditure and reduces the plant’s ability to grow [66]. The SD ecotype salt cress, naturally situated in the Yellow River Delta, where most of the soils are salinized to different degrees, may need to adopt this strategy to form and maintain its intrinsic adaptive mechanism to the environment. Therefore, even under normal growth conditions, the SD ecotype salt cress still highly expresses resistance-related proteins that require more metabolites and energy, thereby slowing down its growth. A balanced mechanism between plant growth and stress resistance helps plants develop, maintain growth, and yield in stressful environments.

3.3. The Mechanism of Natural Variation of Leaf Senescence between Two Eutrema Ecotypes

Senescence is the final step in leaf development and is usually accompanied by a color change from green to yellow or brown [67]. Leaf yellowing is not only related to age, but can also be caused by many other factors, including biotic stress, mechanical damage, harvesting, darkness, nutrient deficiencies, environmental stress, and phytohormones. The results showed that the rosettes of XJ ecotype Eutrema appeared more marked by senescence with aging than those of the SD ecotype (Figure 2A,B). Furthermore, our previous work revealed that the protein expression level and concentration of 1-aminocyclopropane-1-carboxylic acid oxidase 4 (ACO4) were higher in XJ ecotype shoots than in SD ecotype plants (Figure 5C,D). ACO, a key enzyme in ethylene biosynthesis, catalyzes the conversion of 1-aminocyclopropane-1-carboxylic acid to ethylene [68,69], suggesting that XJ ecotype plants have higher ethylene content than SD Eutrema. Ethylene is an important gaseous phytohormone that promotes fruit ripening and leaf senescence [34]. Ethylene can only induce leaf senescence from a certain age but cannot directly regulate the onset of leaf senescence [70,71]. Furthermore, glutathione can induce ethylene biosynthesis by regulating the transcription and protein levels of its key enzymes ACS2, ACS6, and ACO1 [72]. Here, we found that GSH2 (spot XS19, Figure 5A) is also present in the XJ ecotype but not in the SD ecotype. As with ACO1, the appearance of ACO4 may be related to glutathione synthetase, leading to increased ethylene synthesis and earlier leaf senescence in XJ ecotype leaves. In a sense, the differences in ethylene content caused by ACO4 and/or GSH2 between the two ecotypes Eutrema are the result of their developmental diversity, and conversely, differences in ethylene content boost their distinctions in the leaf senescence process. In addition to ethylene, other plant hormones such as cytokinins and auxins also affect leaf senescence. However, unlike ethylene, both cytokinin and auxin can delay leaf senescence [73,74]. The results also showed that the levels of cytokinin and auxin (IAA) in the XJ ecotype leaves were significantly lower than those of the SD ecotype leaves, consistent with their different leaf senescence symptoms (Figure 1H and Figure 2E). In addition, studies have shown that 2,3-bisphosphoglycerate-independent enzyme 1 (iPGAM1) is also involved in chlorophyll synthesis, photosynthesis, and chloroplast development. The deficiency of a 2,3-bisphosphoglycerate-independent enzyme leads to chlorosis, chloroplast deformities, and impaired photosynthesis [75]. Our result that iPGAM1 is only present in shoots of the SD ecotype (spots SS4 and 5, Figure 5A) can interpret the physiological differences between the two ecotypes, namely, the SD ecotype plants have higher chlorophyll content and a slower rate of aging than the XJ ecotype.
Leaf senescence is also genetically controlled and requires differential expression of specific genes. Among them, a large number of age-related genes, SAG12, SAG13, and SAG113, are upregulated during aging. SAG12 encodes a cysteine protease and is an important aging-related reference gene, and its encoding protein or mRNA level is significantly increased in aging tissues [76]. SAG113 encodes a member of the Golgi protein phosphatase 2C family involved in chlorophyll degradation, abscisic acid (ABA) regulation of stomatal motility, and water loss during leaf senescence [77]. Therefore, SAG12 and SAG113 play a central role in the aging process. In particular, transcripts of SAG12 and SAG113 were also significantly increased in XJ Eutrema leaves compared to SD ecotypes (Figure 2F). These results explain the molecular mechanism underlying the different rates of leaf senescence between the two Eutrema ecotypes. Combined with previous research and our experimental data, we speculate that ethylene, cytokinin, and auxin signaling may connect other genetic regulators to form a complex regulatory network that regulates the natural variation in leaf senescence in the two Eutrema ecotypes.

3.4. Proteins Related to Energy Metabolism in Roots

Plant roots need water and nutrients to grow through the soil, which is an important resource for plant growth and productivity [78]. Root growth requires substantial amounts of energy, and this energy comes mainly from the carbohydrates’ catabolism. In addition, aerobic oxidation of carbohydrates is one of the major catabolic pathways, including glycolysis, oxidation of pyruvate to acetyl-CoA, and the tricarboxylic acid (TCA) cycle and subsequent oxidative phosphorylation at the inner membrane of mitochondria [36,79].
Among the many enzymes involved in catabolic processes, 2,3-biphosphoglycerate-independent phosphoglycerate mutase (iPGAM1) is widespread in plants, algae, many invertebrates, fungi, and bacteria, and is relatively conserved among these species, suggesting it plays a key role in maintaining normal glycolysis [80,81]. In glycolysis, iPGAM1 catalyzes the reversible conversion of 3-phosphoglycerate to 2-phosphoglycerate, a precursor generating phosphoenolpyruvate (PEP), a high-energy compound [36]. The difference in iPGAM1 isoelectric points between the two ecotypes may indicate some intrinsic differences in the amino acid sequence or modification state of the two enzymes. Pyruvate kinase (PK) is one of the three rate-limiting enzymes in glycolysis, which catalyzes the transfer of phosphoenolpyruvate to ADP, yielding one molecule of pyruvate and one molecule of ATP [37]. Pyruvate enters the mitochondria to generate ATP via the tricarboxylic acid (TCA) cycle and oxidative phosphorylation [82]. Increasing evidence suggests that PK may play an important role in cell growth [83]. In plants, PK is an enzyme present in cytoplasmic (PKc) and plastid (PKp) isozymes [84]. Downregulation of PKc in T-DNA insertion mutants affects the glycolytic pathway, leading to dwarfism [85]. Therefore, the occurrence of PK only in the roots of XJ plants is of great importance for growth and development. The mitochondrial pyruvate dehydrogenase complex consists of the following three components: E1, E2, and E3 in all organisms and is the main entry point for carbon into the tricarboxylic acid cycle. The E1 component of the pyruvate dehydrogenase complex consists of an E1α catalytic subunit and an E1β regulatory subunit. In the experimental results, we found that one of the important components of this complex, the pyruvate dehydrogenase E1 component subunit β-1 (MAB1), was more strongly expressed in XJ roots than in SD roots, indicating that MAB1 has an important role in the XJ ecotype root metabolism.
Glycolysis and the tricarboxylic acid (TCA) cycle are two important pathways for the aerobic oxidation of carbohydrates, which are responsible for providing energy and carbon skeletons, and are essential for various physiological activities and morphogenesis in plants. The above-mentioned proteins involved in the aerobic oxidation of carbohydrates play an important role in both energy production and plant growth and development. Therefore, the accumulation of these proteins in the roots of the XJ ecotype can help roots absorb enough inorganic elements from the external environment to support the growth of the aerial parts.

4. Materials and Methods

4.1. Plant Materials and Growth Conditions

About 100 seeds were surface sterilized using a sodium hypochlorite solution (0.7% available chlorine) containing 0.1% (v/v) Tween 80 for 10 min. The seeds were washed 6 times, then spread on solid MS medium (MS + 3% sucrose (w/v) + 0.7% (w/v) agar, pH 5.8) and stratified in the dark at 4 °C for 7 days. After stratification, MS plates were transferred into a growth chamber (20 ± 2 °C, 75% relative humidity, 16 h/8 h light-dark regime, under an optimal light intensity of 110 μmol m−2 s−1). Four-day-old seedlings were transferred from MS plates onto the hydroponic culture system (the detail see Supplementary Method).

4.2. Growth Parameter Measurements and Morphological Analysis

After 6 weeks of growth in the hydroponic system, the primary root lengths of SD group and XJ group were measured, respectively. The fresh weights (FW) of shoots and roots were determined immediately after sampling. The dry weight (DW) was then determined after drying the shoots and roots at 80 °C for 48 h. Nine plants were used for each biological replicate and 3 independent biological replicates were produced for each ecotype. To analyze the morphological characteristics of each ecotype, we measured leaf inclination and leaf area. After the hydroponic seedlings were grown for 6 weeks, the shoots of SD and XJ plants were taken out and cut into two longitudinally with the central axis of the seedling as the center. The angle between the central axis and the penultimate leaf blade was measured (Figure 1C). At the same time, the leaves of 9th–14th were peeled with tweezers, and the leaf area was measured by the ImageJ to the collected images.

4.3. Determination of Chlorophyll Content

After 6 weeks of growth in the hydroponic system, the 9th–14th leaves were collected, washed, and cut into small pieces. Chlorophyll (Chl) was extracted from about 0.1 g of leaves with 5 mL of 80% (v/v) acetone. The absorbance of the extracted chlorophyll a (Chl a) and chlorophyll b (Chl b) was measured at 645 nm and 663 nm, respectively. The levels of Chl a, Chl b, and total Chl (Ct) in the samples were calculated as previously described [86].

4.4. Phytohormone Analysis

After 6 weeks of growth under hydroponic conditions, all shoots of the SD and XJ salt cress ecotypes were collected, snap-frozen with liquid nitrogen, and stored at −80 °C. The concentrations of cytokinins (CKs) were determined by Enzyme-linked Immunosorbent Assay (Suzhou Keming Biotechnology Co., Ltd., Suzhou, China), and indole-3-acetic acid (IAA) was measured by Agilent 1100 high-performance liquid chromatograph and Kromasil C18 column (250mm × 4.6mm, 5 µm).

4.5. The Measurement of ACO Concentration

Similarly, whole shoots from 6-week-old SD ecotype and XJ ecotype seedlings were collected, and the concentration of 1-aminocyclopropane-1-carboxylate oxidase (ACO) was determined by Enzyme-Linked Immunosorbent Assay (Shanghai Enzyme-Linked Biotechnology Co., Ltd., Shanghai, China) using the RT-6100 Microplate Reader (Rayto, Shenzhen, China).

4.6. Protein Extraction and 2-DE Analysis

Total protein was extracted from plant tissue as described by Giavalisco [87], with minor modifications. Frozen plant tissue was ground to a fine powder under liquid nitrogen, and then proteins were extracted in ice-cold extraction solution [10% (w/v) tricarboxylic acid (TCA) in acetone with 0.07% (v/v) β-mercaptoethanol] for 1 h at −20 °C. Homogenates were centrifuged at 40,000× g for 30 min at 4 °C. After removing the supernatant, the precipitate was suspended in 100% acetone solution, cooled at −20 °C for 1 h and centrifuged at 40,000× g for 30 min at 4 °C. This process was repeated 2–3 times until the supernatant was colorless. The precipitate was then vacuum dried and stored at −80 °C or proceeded to the next step. The remaining pellets were dissolved in lysis buffer [7 M urea, 2.5 M Thiourea, 65 mM DTT, 4% (w/v) CHAPS] at room temperature for 1 h, and centrifuged at 40,000× g for 30 min at 4 °C. The supernatant was collected and stored at −80 °C. The protein concentration of each extract was determined by the Bradford method [88].
For each sample, 1.5 mg protein dissolved in lysis buffer was adjusted to a final volume of 450 µL with rehydration buffer containing 8 M urea, 15 mM DTT, 2% (w/v) CHAPS, 0.5% (v/v) IPG buffer (pH 4–7), and then it was loaded onto linear 24 cm dry IPG strips (pH 4–7, GE Healthcare Life Science, USA). These strips were then used for the IEF of the Ettan IPGphor II isoelectric focusing system using the following settings according to the manufacturer’s instructions (Amersham Biosciences, Uppsala, Sweden): 150 V for 1 h, 30 V for 6 h, 60 V for 6 h, 200 V for 1 h, 500 V for 1 h, 1000 V for 1 h, gradient to 8000 V for 1 h, and finally 8000 V for 7 h. Before separation in the second dimension, the strips were equilibrated twice for 15 min in equilibration buffer (50 mM Tris-HCl, pH 8.8, 6 M urea, 30% glycerol (v/v), 2% SDS (w/v), and 0.002% (w/v) bromophenol blue) with 1% DTT for first time, and for second time, 2.5% iodoacetamide instead of 1% DTT in the equilibration solution). The second dimensional SDS-PAGE was performed on a 1 mm thick 12.5% SDS-PAGE gel [89]. The 2-DE experiment was repeated 3 times using protein samples prepared from SD and XJ Eutrema, respectively. Proteins were visualized by Coomassie brilliant blue R250 staining, and gel images were taken using an image scanner (GE Healthcare, Chicago, IL, USA). Image analysis was performed using Image Master 2D Platinum software version 5.0 (Amersham Biosciences, Uppsala, Sweden). The experimental Mr (kDa) for each protein was estimated by comparison to protein markers, and the experimental pI was determined by its migration across the IPG strip. The frequency of each protein spot was estimated in percent by volume (% Vol). Only those proteins with significant and reproducible changes were considered as differentially expressed proteins.

4.7. Protein Digestion and Identification via ESI-MS/MS

Digestion and identification of protein were performed according to the method of Peng et al. [90] with some modifications. Selected protein spots were manually excised from each 2-DE gel, cut into 1 mm3 gel slices, placed in 1.5 mL centrifuge tubes, and destained with 50 mM ammonium bicarbonate and 50% (v/v) methyl alcohol for 5–6 times until the gel slices are transparent. After the destaining solution was completely discarded, acetonitrile (ACN) was added to shrink the gel pieces. The acetonitrile (ACN) was then removed, and the shrunken gel pieces were vacuum dried. The dried gel slices were swollen at an ice bath in 50 mM ammonium bicarbonate (pH 8.0–8.5) containing gel sequencing grade trypsin (10 µg/mL; Promega, Madison, WI, USA), then digested at 37 °C for 16–18 h. The digested peptides were extracted from the gel slices with 50% acetonitrile containing 5% formic acid. The pooled peptides were lyophilized and then resuspended in 0.1% formic acid (FA) to a final volume of 50 µL. The 50 µL peptide fragments were automatically injected into the strong cation exchange column of the multidimensional liquid chromatography system by the autosampler of the ProteomeX workstation (Thermo Finnigan, USA). Peptides were eluted from the SCX column (0.32 × 100 mm, Thermo Hypersil-Keystone BioBasic) by salt steps with increasing NH4Cl concentration (0, 50, 70, 100, 150, 400, 700, 1000 mM NH4Cl). These peptide fractions were collected and desalted onto two reverse-phase C18 columns (0.18 × 100 mm, Thermo Hypersil-Keystone BioBasic) and then treated with a gradient of acetonitrile solvent B (ACN in 0.1% FA) from 5 to 65% screened over 31 min, from 65 to 80% for 5 min, then hold 5 min at 80%, reset 5% for 1 min, rebalance 5% for 15 min. SCX and RP gradients were alternately synchronized over 140 min. The eluted peptides were directly loaded into an LCQ-Deca XP plus mass spectrometer (Thermo Electron, USA) for ESI-MS/MS detection. MS/MS data with default parameters were searched using the SEQUEST algorithm. The TurboSEQUEST program in Bioworks 3.0 software retrieved Arabidopsis data from the SWISS-PROT/TrEMBL proteome database. The identified peptides were further evaluated by charge state and cross-correlation number (Xcorr). Peptide matching criteria for cross-correlation scores were as follows: Xcorr > 1.5 for singly-charged ions, Xcorr > 2.0 for doubly-charged ions, and Xcorr > 2.5 for triply-charged ions and a correlation score (ΔCn) > 0.100. Only the best matching peptides are considered [91].

4.8. Quantitative Real Time PCR

Total RNA was extracted from two ecotypes of Eutrema plants by the method of Chomczynski and Sacchi [92]. In total, 2 µg of total RNA was reverse transcribed, and cDNA was generated using the FastQuant RT kit (with gDNase, TIANGEN). The collected cDNA was used as a template for quantitative real-time PCR (qRT-PCR). The actin 2 gene served as a control to normalize target gene quantities [93]. The gene-specific qRT-PCR primers are listed in Supplementary Table S3. qRT-PCR was performed in a Light Cycler® 96 thermal cycler Instrument (Roche Applied Science, Penzberg, Germany) using SYBR Green I (Roche): for the following reactions: 94 °C 30 s; 94 °C 5 s, 60 °C 30 s for 40 cycles and 95 °C 15 s, 60 °C 60 s, 95 °C 1 s. All reactions were replicated from three independent experiments. The formula for calculating the relative expression is as follows: ratio = 2−ΔΔCt = 2 −(ΔCtt–ΔCtc) [94].

4.9. Functional Annotation

Protein spots identified by mass spectrometry were amplified in A. thaliana NCBI. The enriched GO terms of Arabidopsis homologues of these protein stains were detected using Goatools [95].

4.10. Statistical Analysis

All data obtained in this study were performed with at least three biological replicates. SPSS 17.0 software was used for statistical analysis and t-test and the significance level was 5%. Data are presented as mean ± standard deviation.

5. Conclusions

By comparing the proteome of shoots or roots of Eutrema SD and XJ ecotypes, this study identified several proteins that are closely related to defense and stress, aging, and energy metabolism. In China, Eutrema is distributed in Xinjiang along the Yellow River to the mouth of the Yellow River (Dongying, Shandong). Located in the Yellow River Delta, Shandong has a temperate monsoon climate, and its rainfall is 4–5 times that of Urumqi, Xinjiang. It can be seen that there are some proteins related to defense and stress resistance in the Eutrema SD ecotype. The relationship between defensive resistance and stress avoidance mechanisms is further explored. Xinjiang is a landlocked area with a temperate continental dry climate with little rainfall and seasonal concentrated precipitation. XJ Eutrema has evolved into a short life cycle xerophyte with a stress avoidance mechanism due to its high expression of senescence and metabolism-related proteins. Proteomic studies of Eutrema will help us to understand the specificity of extremophile physiological and metabolic devices, summarize the evolutionary process of halophytes, and provide a valuable resource for further deciphering the genetic mechanisms of local adaptation in this model plant.

Supplementary Materials

The following supporting information can be downloaded at: https://www.mdpi.com/article/10.3390/ijms23116124/s1.

Author Contributions

F.W., Z.S. and M.Z. contributed equally to this work. F.W. and Z.S. performed the experiments, analyzed data, and wrote the manuscript; M.Z. performed partial experiments and data analysis; Q.Z. revised the manuscript; Y.S. performed mass spectrometric analyses; W.S., C.W. and C.M. participated in project design and data analysis; T.L. and Y.Z. (Yiwu Zhao) analyzed the mass spectrometry data; Z.W., Y.Z. (Yanxiu Zhao) and H.Z. designed the experiments, interpreted data, lead the work, and revised the manuscript. All authors have read and agreed to the published version of the manuscript.

Funding

This work was supported in part by the National Natural Science Foundation of China (Grant No. 31970302), the Natural Science Foundation of Shandong Province, China (Grant No. ZR2017MC035), Science and Technology Development Plan of Shandong Province, China (Grant No. 2012GGB01136), and by the Granary science and technology demonstration project in the Bohai Sea (2019BHLC001).

Institutional Review Board Statement

Not applicable.

Informed Consent Statement

Informed consent was obtained from all subjects involved in the study.

Data Availability Statement

The raw mass spectrometry data and SEQUEST search results list corresponding to proteomic analysis were deposited in Proteome Xchange Consortium via the PRIDE partner repository with the data set identifier ‘PXD018751’.

Conflicts of Interest

The authors declare no conflict of interest.

References

  1. Bressan, R.A.; Zhang, C.; Zhang, H.; Hasegawa, P.M.; Bohnert, H.J.; Zhu, J.-K. Learning from the Arabidopsis experience. Plant Physiol. 2001, 127, 1354–1360. [Google Scholar] [CrossRef]
  2. Inan, G.; Zhang, Q.; Li, P.; Wang, Z.; Cao, Z.; Zhang, H.; Zhang, C.; Quist, T.M.; Goodwin, S.M.; Zhu, J.; et al. Salt cress. A halophyte and cryophyte Arabidopsis relative model system and its applicability to molecular genetic analyses of growth and development of extremophiles. Plant Physiol. 2004, 135, 1718–1737. [Google Scholar] [CrossRef] [PubMed] [Green Version]
  3. Taji, T.; Seki, M.; Satou, M.; Sakurai, T.; Kobayashi, M.; Ishiyama, K.; Narusaka, Y.; Narusaka, M.; Zhu, J.K.; Shinozaki, K. Comparative genomics in salt tolerance between Arabidopsis and Arabidopsis-related halophyte salt cress using Arabidopsis microarray. Plant Physiol. 2004, 135, 1697–1709. [Google Scholar] [CrossRef] [PubMed] [Green Version]
  4. Gong, Q.; Li, P.; Ma, S.; Indu Rupassara, S.; Bohnert, H.J. Salinity stress adaptation competence in the extremophile Thellungiella halophila in comparison with its relative Arabidopsis thaliana. Plant J. 2005, 44, 826–839. [Google Scholar] [CrossRef] [PubMed]
  5. Li, P.; Mane, S.P.; Sioson, A.A.; Robinet, C.V.; Heath, L.S.; Bohnert, H.J.; Grene, R. Effects of chronic ozone exposure on gene expression in Arabidopsis thaliana ecotypes and in Thellungiella halophila. Plant Cell Environ. 2006, 29, 854–868. [Google Scholar] [CrossRef] [Green Version]
  6. Griffith, M.; Timonin, M.; Wong, A.C.E.; Gray, G.R.; Akhter, S.R.; Saldanha, M.; Rogers, M.A.; Weretilnyk, E.A.; Moffatt, B. Thellungiella: An Arabidopsis-related model plant adapted to cold temperatures. Plant Cell Environ. 2007, 30, 529–538. [Google Scholar] [CrossRef]
  7. Kant, S.; Bi, Y.-M.; Weretilnyk, E.; Barak, S.; Rothstein, S.J. The Arabidopsis halophytic relative Thellungiella halophila tolerates nitrogen-limiting conditions by maintaining growth, nitrogen uptake, and assimilation. Plant Physiol. 2008, 147, 1168–1180. [Google Scholar] [CrossRef] [Green Version]
  8. Zhu, J.K. Plant salt tolerance. Trends Plant Sci. 2001, 6, 66–71. [Google Scholar] [CrossRef]
  9. Wang, Z.-L.; Li, P.-H.; Fredricksen, M.; Gong, Z.-Z.; Kim, C.S.; Zhang, C.; Bohnert, H.J.; Zhu, J.-K.; Bressan, R.A.; Hasegawa, P.M.; et al. Expressed sequence tags from Thellungiella halophila, a new model to study plant salt-tolerance. Plant Sci. 2004, 166, 609–616. [Google Scholar] [CrossRef]
  10. Wong, C.E.; Li, Y.; Labbe, A.; Guevara, D.; Nuin, P.; Whitty, B.; Diaz, C.; Golding, G.B.; Gray, G.R.; Weretilnyk, E.A.; et al. Transcriptional profiling implicates novel interactions between abiotic stress and hormonal responses in Thellungiella, a close relative of Arabidopsis. Plant Physiol. 2006, 140, 1437–1450. [Google Scholar] [CrossRef] [Green Version]
  11. Jackson, R.B.; Caldwell, M.M. The scale of nutrient heterogeneity around individual plants and its quantification with geostatistics. Ecology 1993, 74, 612–614. [Google Scholar] [CrossRef]
  12. Yu, F.C.; Fei Hai, Y.; Ming, D. Scale-dependent spatial heterogeneity of vegetation in Mu Us sandy land, a semi-arid area of China. Plant Ecol. 2002, 162, 135–142. [Google Scholar]
  13. Mal, T.K.; Lovett-Doust, J. Phenotypic plasticity in vegetative and reproductive traits in an invasive weed, Lythrum salicaria (Lythraceae), in response to soil moisture. Am. J. Bot. 2005, 92, 819–825. [Google Scholar] [CrossRef] [PubMed]
  14. Kawecki, T.J.; Ebert, D. Conceptual issues in local adaptation. Ecol. Lett. 2004, 7, 1225–1241. [Google Scholar] [CrossRef] [Green Version]
  15. Turesson, G. The species and the variety as ecological units. Hereditas 1922, 3, 100–113. [Google Scholar] [CrossRef]
  16. Savolainen, O.; Lascoux, M.; Merila, J. Ecological genomics of local adaptation. Nat. Rev. Genet. 2013, 14, 807–820. [Google Scholar] [CrossRef]
  17. Guevara, D.R.; Champigny, M.J.; Tattersall, A.; Dedrick, J.; Wong, C.E.; Li, Y.; Labbe, A.; Ping, C.-L.; Wang, Y.; Nuin, P. Transcriptomic and metabolomic analysis of Yukon Thellungiella plants grown in cabinets and their natural habitat show phenotypic plasticity. BMC Plant Biol. 2012, 12, 175. [Google Scholar] [CrossRef] [Green Version]
  18. Amtmann, A. Learning from evolution: Thellungiella generates new knowledge on essential and critical components of abiotic stress tolerance in plants. Mol. Plant. 2009, 2, 3–12. [Google Scholar] [CrossRef] [Green Version]
  19. Bar, M.; Ori, N. Leaf development and morphogenesis. Development 2014, 141, 4219–4230. [Google Scholar] [CrossRef] [Green Version]
  20. Ishikawa, T.; Yoshimura, K.; Tamoi, M.; Takeda, T.; Shigeoka, S. Alternative mRNA splicing of 3′-terminal exons generates ascorbate peroxidase isoenzymes in spinach (Spinacia oleracea) chloroplasts. Biochem. J. 1997, 328, 795–800. [Google Scholar] [CrossRef] [Green Version]
  21. Ahn, H.J.; Eom, S.J.; Yoon, H.-J.; Lee, B.I.; Cho, H.; Suh, S.W. Crystal structure of class I acetohydroxy acid isomeroreductase from Pseudomonas aeruginosa. J. Mol. Biol. 2003, 328, 505–515. [Google Scholar] [CrossRef]
  22. Cummins, I.; Dixon, D.P.; Freitag-Pohl, S.; Skipsey, M.; Edwards, R. Multiple roles for plant glutathione transferases in xenobiotic detoxification. Drug Metab. Rev. 2011, 43, 266–280. [Google Scholar] [CrossRef] [PubMed]
  23. Foyer, C.H.; Noctor, G. Ascorbate and glutathione: The heart of the redox hub. Plant Physiol. 2011, 155, 2–18. [Google Scholar] [CrossRef] [PubMed] [Green Version]
  24. Considine, M.J.; Foyer, C.H. Redox regulation of plant development. Antioxid. Redox Signal. 2014, 21, 1305–1326. [Google Scholar] [CrossRef] [Green Version]
  25. Urbancsok, J.; Bones, A.M.; Kissen, R. Arabidopsis mutants impaired in glutathione biosynthesis exhibit higher sensitivity towards the glucosinolate hydrolysis product allyl-isothiocyanate. Sci. Rep. 2018, 8, 9809. [Google Scholar] [CrossRef]
  26. Hudson, A.O.; Singh, B.K.; Leustek, T.; Gilvarg, C. An LL-diaminopimelate aminotransferase defines a novel variant of the lysine biosynthesis pathway in plants. Plant Physiol. 2006, 140, 292–301. [Google Scholar] [CrossRef] [Green Version]
  27. Anjum, N.A.; Gill, R.; Kaushik, M.; Hasanuzzaman, M.; Pereira, E.; Ahmad, I.; Tuteja, N.; Gill, S.S. ATP-sulfurylase, sulfur-compounds, and plant stress tolerance. Front. Plant Sci. 2015, 6, 210. [Google Scholar] [CrossRef] [Green Version]
  28. Ide, Y.; Nagasaki, N.; Tomioka, R.; Suito, M.; Kamiya, T.; Maeshima, M. Molecular properties of a novel, hydrophilic cation-binding protein associated with the plasma membrane. J. Exp. Bot. 2007, 58, 1173–1183. [Google Scholar] [CrossRef]
  29. Stintzi, A.; Heitz, T.; Prasad, V.; Wiedemann-Merdinoglu, S.; Kauffmann, S.; Geoffroy, P.; Legrand, M.; Fritig, B. Plant "pathogenesis-related" proteins and their role in defense against pathogens. Biochimie 1993, 75, 687–706. [Google Scholar] [CrossRef]
  30. Mishina, T.E.; Zeier, J. Pathogen-associated molecular pattern recognition rather than development of tissue necrosis contributes to bacterial induction of systemic acquired resistance in Arabidopsis. Plant J. 2007, 50, 500–513. [Google Scholar] [CrossRef]
  31. Kuo, W.Y.; Huang, C.H.; Liu, A.C.; Cheng, C.P.; Li, S.H.; Chang, W.C.; Weiss, C.; Azem, A.; Jinn, T.L. CHAPERONIN 20 mediates iron superoxide dismutase (FeSOD) activity independent of its co-chaperonin role in Arabidopsis chloroplasts. New Phytol. 2013, 197, 99–110. [Google Scholar] [CrossRef] [PubMed]
  32. Kuo, W.Y.; Huang, C.H.; Jinn, T.L. Chaperonin 20 might be an iron chaperone for superoxide dismutase in activating iron superoxide dismutase (FeSOD). Plant Signal. Behav. 2013, 8, e23074. [Google Scholar] [CrossRef] [PubMed] [Green Version]
  33. Houben, M.; Van de Poel, B. 1-Aminocyclopropane-1-Carboxylic Acid Oxidase (ACO): The enzyme that makes the plant hormone ethylene. Front. Plant Sci. 2019, 10, 695. [Google Scholar] [CrossRef] [PubMed] [Green Version]
  34. Abeles, F.B.; Morgan, P.W.; Saltveit, M.E. Ethylene in Plant Biology; Academic Press: London, UK, 1992. [Google Scholar]
  35. Johnsen, U.; Schonheit, P. Characterization of cofactor-dependent and cofactor-independent phosphoglycerate mutases from Archaea. Extremophiles 2007, 11, 647–657. [Google Scholar] [CrossRef]
  36. Zhao, Z.; Assmann, S.M. The glycolytic enzyme, phosphoglycerate mutase, has critical roles in stomatal movement, vegetative growth, and pollen production in Arabidopsis thaliana. J. Exp. Bot. 2011, 62, 5179–5189. [Google Scholar] [CrossRef] [Green Version]
  37. Fernie, A.R.; Carrari, F.; Sweetlove, L.J. Respiratory metabolism: Glycolysis, the TCA cycle and mitochondrial electron transport. Curr. Opin. Plant Biol. 2004, 7, 254–261. [Google Scholar] [CrossRef]
  38. Klodmann, J.; Braun, H.P. Proteomic approach to characterize mitochondrial complex I from plants. Phytochemistry 2011, 72, 1071–1080. [Google Scholar] [CrossRef]
  39. Laskowski, M.J.; Dreher, K.A.; Gehring, M.A.; Abel, S.; Gensler, A.L.; Sussex, I.M. FQR1, a novel primary auxin-response gene, encodes a flavin mononucleotide-binding quinone reductase. Plant Physiol. 2002, 128, 578–590. [Google Scholar] [CrossRef]
  40. Saxena, I.; Srikanth, S.; Chen, Z. Cross talk between H2O2 and interacting signal molecules under plant stress response. Front. Plant Sci. 2016, 7, 570. [Google Scholar] [CrossRef] [Green Version]
  41. Stiti, N.; Missihoun, T.D.; Kotchoni, S.O.; Kirch, H.H.; Bartels, D. Aldehyde dehydrogenases in Arabidopsis thaliana: Biochemical requirements, metabolic pathways, and functional analysis. Front. Plant Sci. 2011, 2, 65. [Google Scholar] [CrossRef] [Green Version]
  42. Hou, Q.C.; Bartels, D. Comparative study of the aldehyde dehydrogenase (ALDH) gene superfamily in the glycophyte Arabidopsis thaliana and Eutrema halophytes. Ann. Bot. 2015, 115, 465–479. [Google Scholar] [CrossRef] [PubMed] [Green Version]
  43. Tanaka, N.; Takahashi, H.; Kitano, H.; Matsuoka, M.; Akao, S.; Uchimiya, H.; Komatsu, S. Proteome approach to characterize the methylmalonate-semialdehyde dehydrogenase that is regulated by gibberellin. J. Proteome Res. 2005, 4, 1575–1582. [Google Scholar] [CrossRef] [PubMed]
  44. Shi, H.; Liu, W.; Yao, Y.; Wei, Y.; Chan, Z. Alcohol dehydrogenase 1 (ADH1) confers both abiotic and biotic stress resistance in Arabidopsis. Plant Sci. 2017, 262, 24–31. [Google Scholar] [CrossRef]
  45. Dixon, D.P.; Adrian, L.; Robert, E. Plant glutathione transferases. Genome Biol. 2002, 3, 1–10. [Google Scholar] [CrossRef] [PubMed] [Green Version]
  46. de la Fuente van Bentem, S.; Anrather, D.; Dohnal, I.; Roitinger, E.; Csaszar, E.; Joore, J.; Buijnink, J.; Carreri, A.; Forzani, C.; Lorkovic, Z.J.; et al. Site-specific phosphorylation profiling of Arabidopsis proteins by mass spectrometry and peptide chip analysis. J. Proteome Res. 2008, 7, 2458–2470. [Google Scholar] [CrossRef]
  47. Song, M.; Xu, W.; Xiang, Y.; Jia, H.; Zhang, L.; Ma, Z. Association of jacalin-related lectins with wheat responses to stresses revealed by transcriptional profiling. Plant Mol.Biol. 2013, 84, 95–110. [Google Scholar] [CrossRef]
  48. Li, J.; Steen, H.; Gygi, S.P. Protein profiling with cleavable isotope-coded affinity tag (cICAT) reagents: The yeast salinity stress response. Mol. Cell. Proteomics 2003, 2, 1198–1204. [Google Scholar] [CrossRef] [Green Version]
  49. Vallejo, A.J.; Yanovsky, M.J.; Botto, J.F. Germination variation in Arabidopsis thaliana accessions under moderate osmotic and salt stresses. Ann. Bot. 2010, 106, 833–842. [Google Scholar] [CrossRef] [Green Version]
  50. Shi, H.; Wang, Y.; Cheng, Z.; Ye, T.; Chan, Z. Analysis of natural variation in bermudagrass (Cynodon dactylon) reveals physiological responses underlying drought tolerance. PLoS ONE 2012, 7, e53422. [Google Scholar] [CrossRef] [Green Version]
  51. Millenaar, F.F.; Cox, M.C.; van Berkel, Y.E.; Welschen, R.A.; Pierik, R.; Voesenek, L.A.; Peeters, A.J. Ethylene-induced differential growth of petioles in Arabidopsis. Analyzing natural variation, response kinetics, and regulation. Plant Physiol. 2005, 137, 998–1008. [Google Scholar] [CrossRef] [Green Version]
  52. Nagasaki-Takeuchi, N.; Miyano, M.; Maeshima, M. A plasma membrane-associated protein of Arabidopsis thaliana AtPCaP1 binds copper ions and changes its higher order structure. J. Biochem. 2008, 144, 487–497. [Google Scholar] [CrossRef]
  53. Nagasaki, N.; Tomioka, R.; Maeshima, M. A hydrophilic cation-binding protein of Arabidopsis thaliana, AtPCaP1, is localized to plasma membrane via N-myristoylation and interacts with calmodulin and the phosphatidylinositol phosphates PtdIns(3,4,5)P3 and PtdIns(3,5)P2. FEBS J. 2008, 275, 2267–2282. [Google Scholar] [CrossRef]
  54. Kato, M.; Nagasaki-Takeuchi, N.; Ide, Y.; Tomioka, R.; Maeshima, M. PCaPs, possible regulators of PtdInsP signals on plasma membrane. Plant Signal. Behav. 2010, 5, 848–850. [Google Scholar] [CrossRef] [Green Version]
  55. Nagata, C.; Miwa, C.; Tanaka, N.; Kato, M.; Suito, M.; Tsuchihira, A.; Sato, Y.; Segami, S.; Maeshima, M. A novel-type phosphatidylinositol phosphate-interactive, Ca-binding protein PCaP1 in Arabidopsis thaliana: Stable association with plasma membrane and partial involvement in stomata closure. J. Plant Res. 2016, 129, 539–550. [Google Scholar] [CrossRef]
  56. Li, J.; Wang, X.; Qin, T.; Zhang, Y.; Liu, X.; Sun, J.; Zhou, Y.; Zhu, L.; Zhang, Z.; Yuan, M.; et al. MDP25, a novel calcium regulatory protein, mediates hypocotyl cell elongation by destabilizing cortical microtubules in Arabidopsis. Plant Cell 2011, 23, 4411–4427. [Google Scholar] [CrossRef] [Green Version]
  57. Mauch, F.; Mauch-Mani, B.; Boller, T.J.P. Antifungal hydrolases in pea tissue: II. Inhibition of fungal growth by combinations of chitinase and β-1,3-glucanase. Plant Physiol. 1988, 88, 936–942. [Google Scholar] [CrossRef] [Green Version]
  58. Mauch, F.; Hadwiger, L.A.; Boller, T. Antifungal hydrolases in pea tissue: I. Purification and characterization of two chitinases and two β-1,3-glucanases differentially regulated during development and in response to fungal infection. Plant Physiol. 1988, 87, 325–333. [Google Scholar] [CrossRef] [Green Version]
  59. Bolar, J.P.; Norelli, J.L.; Wong, K.-W.; Hayes, C.K.; Harman, G.E.; Aldwinckle, H.S. Expression of endochitinase from Trichoderma harzianum in transgenic apple increases resistance to apple scab and reduces vigor. Phytopathology 2000, 90, 72–77. [Google Scholar] [CrossRef] [Green Version]
  60. Emani, C.; Garcia, J.M.; Lopata-Finch, E.; Pozo, M.J.; Uribe, P.; Kim, D.J.; Sunilkumar, G.; Cook, D.R.; Kenerley, C.M.; Rathore, K.S. Enhanced fungal resistance in transgenic cotton expressing an endochitinase gene from Trichoderma virens. Plant Biotechnol. J. 2003, 1, 321–336. [Google Scholar] [CrossRef] [Green Version]
  61. Gentile, A.; Deng, Z.; La Malfa, S.; Distefano, G.; Domina, F.; Vitale, A.; Polizzi, G.; Lorito, M.; Tribulato, E. Enhanced resistance to Phoma tracheiphila and Botrytis cinerea in transgenic lemon plants expressing a Trichoderma harzianum chitinase gene. Plant Breed. 2007, 126, 146–151. [Google Scholar] [CrossRef]
  62. Cao, S.; Wang, Y.; Li, Z.; Shi, W.; Gao, F.; Zhou, Y.; Zhang, G.; Feng, J. Genome-wide identification and expression analyses of the chitinases under cold and osmotic stress in Ammopiptanthus nanus. Genes 2019, 10, 472. [Google Scholar] [CrossRef] [PubMed] [Green Version]
  63. Kong, L.; Anderson, J.M.; Ohm, H.W. Induction of wheat defense and stress-related genes in response to Fusarium graminearum. Genome 2005, 48, 29–40. [Google Scholar] [CrossRef] [PubMed] [Green Version]
  64. Song, Y.; Zhang, C.; Ge, W.; Zhang, Y.; Burlingame, A.L.; Guo, Y. Identification of NaCl stress-responsive apoplastic proteins in rice shoot stems by 2D-DIGE. J. Proteomics 2011, 74, 1045–1067. [Google Scholar] [CrossRef] [PubMed] [Green Version]
  65. Budak, H.; Akpinar, B.A.; Unver, T.; Turktas, M. Proteome changes in wild and modern wheat leaves upon drought stress by two-dimensional electrophoresis and nanoLC-ESI–MS/MS. Plant Mol.Biol. 2013, 83, 89–103. [Google Scholar] [CrossRef] [PubMed]
  66. Gong, Z.; Xiong, L.; Shi, H.; Yang, S.; Herrera-Estrella, L.R.; Xu, G.; Chao, D.-Y.; Li, J.; Wang, P.-Y.; Qin, F.; et al. Plant abiotic stress response and nutrient use efficiency. Sci. China-Life Sci. 2020, 63, 635–674. [Google Scholar] [CrossRef]
  67. Koyama, T. A hidden link between leaf development and senescence. Plant Sci. 2018, 276, 105–110. [Google Scholar] [CrossRef]
  68. Hamilton, A.J.; Lycett, G.W.; Grierson, D. Antisense gene that inhibits synthesis of the hormone ethylene in transgenic plants. Nature 1990, 346, 284–287. [Google Scholar] [CrossRef]
  69. Ververidis, P.; John, P. Complete recovery in vitro of ethylene-forming enzyme activity. Phytochemistry 1991, 30, 725–727. [Google Scholar] [CrossRef]
  70. Jing, H.C.; Sturre, M.J.G.; Hille, J.; Dijkwel, P.P. Arabidopsis onset of leaf death mutants identify a regulatory pathway controlling leaf senescence. Plant J. 2002, 32, 51–63. [Google Scholar] [CrossRef] [Green Version]
  71. Jing, H.-C.; Schippers, J.H.M.; Jacques, H.; Dijkwel, P.P. Ethylene-induced leaf senescence depends on age-related changes and OLD genes in Arabidopsis. J. Exp. Bot. 2005, 56, 421. [Google Scholar] [CrossRef]
  72. Datta, R.; Kumar, D.; Sultana, A.; Hazra, S.; Bhattacharyya, D.; Chattopadhyay, S. Glutathione regulates 1-aminocyclopropane-1-carboxylate synthase transcription via WRKY33 and 1-aminocyclopropane-1-carboxylate oxidase by modulating messenger RNA stability to induce ethylene synthesis during stress. Plant Physiol. 2015, 169, 2963. [Google Scholar] [PubMed]
  73. Gan, S.; Amasino, R.M. Making sense of senescence. Plant Physiol. 1997, 113, 313–319. [Google Scholar] [CrossRef] [PubMed] [Green Version]
  74. Kucerova, Z.; Rac, M.; Mikulik, J.; Plihal, O.; Pospisil, P.; Bryksova, M.; Sedlarova, M.; Dolezal, K.; Spundova, M. The Anti-Senescence Activity of Cytokinin Arabinosides in Wheat and Arabidopsis Is Negatively Correlated with Ethylene Production. Int. J. Mol. Sci. 2020, 21, 8109. [Google Scholar] [CrossRef] [PubMed]
  75. Lin, D.; Zhang, L.; Mei, J.; Chen, J.; Piao, Z.; Lee, G.; Dong, Y. Mutation of the rice TCM12 gene encoding 2,3-bisphosphoglycerate-independent phosphoglycerate mutase affects chlorophyll synthesis, photosynthesis and chloroplast development at seedling stage at low temperatures. Plant Biol. 2019, 21, 585–594. [Google Scholar] [CrossRef]
  76. James, M.; Poret, M.; Masclaux-Daubresse, C.; Marmagne, A.; Coquet, L.; Jouenne, T.; Chan, P.; Trouverie, J.; Etienne, P. SAG12, a major cysteine protease involved in nitrogen allocation during senescence for seed production in Arabidopsis thaliana. Plant Cell Physiol. 2018, 59, 2052–2063. [Google Scholar] [CrossRef] [Green Version]
  77. Zhang, K.; Gan, S.-S. An abscisic acid-AtNAP transcription factor-SAG113 protein phosphatase 2C regulatory chain for controlling dehydration in senescing Arabidopsis leaves. Plant Physiol. 2012, 158, 961–969. [Google Scholar] [CrossRef] [Green Version]
  78. Colombi, T.; Herrmann, A.M.; Vallenback, P.; Keller, T. Cortical cell diameter is key to energy costs of root growth in wheat. Plant Physiol. 2019, 180, 2049–2060. [Google Scholar] [CrossRef] [Green Version]
  79. Johnson, L.R.; Johnson, T.K.; Desler, M.; Luster, T.A.; Nowling, T.; Lewis, R.E.; Rizzino, A. Effects of B-Myb on gene transcription. J. Biol. Chem. 2002, 277, 4088–4097. [Google Scholar] [CrossRef] [Green Version]
  80. Grana, X.; De Lecea, L.; El-Maghrabi, M.R.; Urena, J.; Caellas, C.; Carreras, J.; Puigdomenech, P.; Pilkis, S.; Climent, F. Cloning and sequencing of a cDNA encoding 2,3-bisphosphoglycerate-independent phosphoglycerate mutase from maize. Possible relationship to the alkaline phosphatase family. J. Biol. Chem. 1992, 267, 12797–12803. [Google Scholar] [CrossRef]
  81. Graña, X.; de la Ossa, P.P.; Broceño, C.; Stöcker, M.; Garriga, J.; Puigdomènech, P.; Climent, F. 2,3-Bisphosphoglycerate-independent phosphoglycerate mutase is conserved among different phylogenic kingdoms. Comp. Biochem. Physiol. B-Biochem. Mol. Biol. 1995, 112, 287–293. [Google Scholar] [CrossRef]
  82. Steffens, B.; Steffen-Heins, A.; Sauter, M. Reactive oxygen species mediate growth and death in submerged plants. Front. Plant Sci. 2013, 4, 179. [Google Scholar] [CrossRef] [PubMed] [Green Version]
  83. Israelsen, W.J.; Dayton, T.L.; Davidson, S.M.; Fiske, B.P.; Hosios, A.M.; Bellinger, G.; Li, J.; Yu, Y.; Sasaki, M.; Horner, J.W.; et al. PKM2 isoform-specific deletion reveals a differential requirement for pyruvate kinase in tumor cells. Cell 2013, 155, 397–409. [Google Scholar] [CrossRef] [PubMed] [Green Version]
  84. Plaxton, W.C. The organization and regulation of plant glycolysis. Annu. Rev. Plant Physiol. Plant Mol. Biol. 1996, 47, 185. [Google Scholar] [CrossRef] [Green Version]
  85. Zhang, Y.; Xiao, W.; Luo, L.; Pang, J.; Rong, W.; He, C. Downregulation of OsPK1, a cytosolic pyruvate kinase, by T-DNA insertion causes dwarfism and panicle enclosure in rice. Planta 2012, 235, 25–38. [Google Scholar] [CrossRef]
  86. Porra, R.J. The chequered history of the development and use of simultaneous equations for the accurate determination of chlorophylls a and b. Photosynth. Res. 2002, 73, 149–156. [Google Scholar] [CrossRef]
  87. Giavalisco, P.; Nordhoff, E.; Lehrach, H.; Gobom, J.; Klose, J. Extraction of proteins from plant tissues for two-dimensional electrophoresis analysis. Electrophoresis 2003, 24, 207–216. [Google Scholar] [CrossRef]
  88. Bradford, M.M. A rapid and sensitive method for the quantitation of microgram quantities of protein utilizing the principle of protein-dye binding. Anal. Biochem. 1976, 72, 248–254. [Google Scholar] [CrossRef]
  89. Wang, X.; Chang, L.; Wang, B.; Wang, D.; Li, P.; Wang, L.; Yi, X.; Huang, Q.; Peng, M.; Guo, A. Comparative proteomics of Thellungiella halophila leaves from plants subjected to salinity reveals the importance of chloroplastic starch and soluble sugars in halophyte salt tolerance. Mol. Cell. Proteomics 2013, 12, 2174–2195. [Google Scholar] [CrossRef] [Green Version]
  90. Peng, J.; Schwartz, D.; Elias, J.E.; Thoreen, C.C.; Cheng, D.; Marsischky, G.; Roelofs, J.; Finley, D.; Gygi, S.P. A proteomics approach to understanding protein ubiquitination. Nat. Biotechnol. 2003, 21, 921–926. [Google Scholar] [CrossRef]
  91. Henzel, W.J.; Billeci, T.M.; Stults, J.T.; Wong, S.C.; Grimley, C.; Watanabe, C. Identifying proteins from two-dimensional gels by molecular mass searching of peptide fragments in protein sequence databases. Proc. Natl. Acad. Sci. USA 1993, 90, 5011–5015. [Google Scholar] [CrossRef] [Green Version]
  92. Chomczynski, P.; Sacchi, N. The single-step method of RNA isolation by acid guanidinium thiocyanate-phenol-chloroform extraction: Twenty-something years on. Nat. Protoc. 2006, 1, 581–585. [Google Scholar] [CrossRef] [PubMed]
  93. Shamustakimova, A.O.; Leonova, T.G.; Taranov, V.V.; de Boer, A.H.; Babakov, A.V. Cold stress increases salt tolerance of the extremophytes Eutrema salsugineum (Thellungiella salsuginea) and Eutrema (Thellungiella) botschantzevii. J. Plant Physiol. 2017, 208, 128–138. [Google Scholar] [CrossRef] [PubMed]
  94. Livak, K.J.; Schmittgen, T.D. Analysis of relative gene expression data using real-time quantitative PCR and the 2(-Delta Delta C(T)) method. Methods 2001, 25, 402–408. [Google Scholar] [CrossRef] [PubMed]
  95. Klopfenstein, D.V.; Zhang, L.; Pedersen, B.S.; Ramírez, F.; Warwick Vesztrocy, A.; Naldi, A.; Mungall, C.J.; Yunes, J.M.; Botvinnik, O.; Weigel, M.; et al. GOATOOLS: A python library for gene ontology analyses. Sci. Rep. 2018, 8, 10872. [Google Scholar] [CrossRef] [PubMed]
Figure 1. Growth and morphological analysis of SD and XJ plants cultured in a hydroponic system for 6 weeks. (A,B) Growth status of SD and XJ plants. (C) Comparison of leaf inclination angles of SD and XJ plants after 6 weeks of hydroponics. (DF) The primary root length, fresh weight (FW), and dry weight (DW) of two Eutrema were examined. (G) Leaf inclination angle measurements were made between the central axis and the penultimate leaf of two Eutrema. (H) Concentration of IAA in shoots. Data were expressed as means ± SD and t-test was used for statistical analysis. (* p < 0.05, ** p < 0.01 and *** p < 0.001). All experiments were tripled, and each experiment contained at least 9 plants.
Ijms 23 06124 g001
Figure 2. Senescence analysis of SD and XJ plants cultured in a hydroponic system for 6 weeks. (A) The growth state of the shoots. (B) Comparison of SD and XJ plants with 9th–14th leaves. Bars = 1 cm. (C) Total chlorophyll content in leaves of SD and XJ plants. (D) Leaf area values for SD and XJ plants. (E) The concentration of CK in SD and XJ shoots. Concentrations of CK in SD and XJ. (F) Expression of SAG12 and SAG113 in leaves of two ecotypes. Data are presented as means ± SD and t-test was used for statistical analysis. (** p < 0.01 and *** p < 0.001).
Ijms 23 06124 g002
Figure 3. The 2-DE profiles of SD and XJ Eutrema proteins under normal hydroponic conditions for 6 weeks. The marked spots were identified by ESI-MS/MS. (A) 2-DE protein gel was from SD Eutrema shoots. (B) 2-DE protein gel was from XJ Eutrema shoots. (C) 2-DE protein gel extracted from SD Eutrema root. (D) 2-DE protein gel extracted from XJ Eutrema root.
Ijms 23 06124 g003
Figure 4. Functional annotation of different proteins under normal hydroponic conditions. (A) Biological processes of proteins identified in shoots. (B) Biological processes of proteins identified in roots.
Ijms 23 06124 g004
Figure 5. Expression patterns of representative differentially expressed proteins in shoots from two Eutrema ecotypes under normal hydroponic conditions. (A) Quantitative analysis of differentially expressed protein (DEPs) species spots related to cellular metabolic processes. (B) Quantification of DEPs spots related to stress responses. (C) Changes in the expression of the ACO4 protein spot in the shoot. (D) ACO concentrations in SD and XJ shoots. Statistical analysis was performed on the normalized volume percentage (% Vol) of protein spots in 3 replicate biological samples using the mean ± SD method and statistical calculations were performed using the t-test. (** p < 0.01 and *** p < 0.001). The abbreviations for Figure 5 were: SS, shoot of SD ecotype; XS, shoot of XJ ecotype; KARI, ketoacid reductase isomerase; GSH2, glutathione synthetase; iPGAM1, 2,3-bisphosphoglycerate-independent phosphoglycerate mutase 1; iPGAM1−1, spot SS4; iPGAM1−2, spot SS5; APS1, ATP sulfurylase 1; PCAP1, plasma membrane-associated cation-binding protein 1; PCAP1−1, spot SS6; PCAP1−2, spot SS7; PCAP1−3, spot SS8; PR5, pathogenesis-related protein 5; CHI, endochitinase; BG1, glucan endo−1, 3-beta-glucosidase; Cpn 20, 20 kDa chaperonin; ACO4, 1-aminocyclopropane-1-carboxylate oxidase 4.
Ijms 23 06124 g005
Figure 6. Expression patterns of some root protein spots on the 2-DE map. Marked points are differentially expressed proteins. (A) 2,3-bisphosphoglycerate-independent phosphoglycerate mutase 1 (iPGAM1) (spots SR5, 6 and 7, spots XR7, 2 and 3). (B) pyruvate dehydrogenase E1 component subunit beta-1 (MAB1) (spots SR16, XR9). (C) monodehydroascorbate reductase 2 (MDAR2) (spots SR8, XR8). (D) glutathione S-transferase F10 (GST PHI10) (spots SR10, XR10) and 20 kDa chaperonin (Chaperonin 20, Cpn20) (spots SR11, XR11). (E) paraxanthine methyltransferase 1 (PXMT1) (spots SR15, XR15) and (F) jacalin-related lectin 34 protein (JRL34) (spots SR1, 2, 3, and spots XR4). The abbreviations for Figure 6 were: SR, root of SD ecotype; XR, root of XJ ecotype.
Ijms 23 06124 g006
Figure 7. Relative transcript levels in two Eutrema plants under normal hydroponic conditions for 6 weeks. (A) Differentially expressed genes in shoots. (B) Differentially expressed genes in roots. Data are presented as mean ± SD obtained from 3 biological replicates. t-test was used to analyze the changes in the gene expression (* p < 0.05, ** p < 0.01, and *** p < 0.001). The abbreviations for Figure 7 were: PR5, pathogenesis-related protein 5; CHI, endochitinase; ACO4, 1-aminocyclopropane-1-carboxylate oxidase 4; AGD2, LL-diaminopimelate aminotransferase; GSH2, glutathione synthetase; PCAP1, plasma membrane-associated cation-binding protein 1; BG1, glucan endo-1,3-beta-glucosidase; KARI, ketoacid reductase isomerase; ADH1, alcohol dehydrogenase class-P; PXMT1, paraxanthine methyltransferase 1; CI76, NADH dehydrogenase [ubiquinone] iron-sulfur protein 1; MMSDH, methylmalonate-semialdehyde dehydrogenase; FQR1, NAD(P)H dehydrogenase (quinone); MDAR2, monodehydroascorbate reductase 2; GST PHI10, glutathione S-transferase F10; Cpn20, 20 kDa chaperonin; MAB1, pyruvate dehydrogenase E1 component subunit beta-1.
Ijms 23 06124 g007
Table 1. Differentially expressed proteins identified in shoots of SD and XJ ecotype of Eutrema.
Spot NCBI Accession Exper. eTheor. f
No. aLocus. bNo. cProtein Name. dpI/MrpI/MrScore. gNP. hPattern. i
Cellular metabolic process
XS4At3g58610XP_006402768ketol-acid reductoisomerase5.8/565.64/57.3202appear
XS19At5g27380XP_024007192glutathione synthetase5.8/565.52/53.9202appear
XS8At4g33680XP_024005372LL-diaminopimelate aminotransferase5.6/446.38/46.5202appear
SS4At1g09780XP_0064175392,3-bisphosphoglycerate-independent phosphoglycerate mutase 15.45/595.32/60.5787decrease
SS5At1g09780XP_0064175392,3-bisphosphoglycerate-independent phosphoglycerate mutase 15.6/595.32/60.538436appear
SS27At3g22890XP_006406118ATP sulfurylase 16/446.34/51.5707increase
XS28At3g22890XP_006406118ATP sulfurylase 16/446.34/51.5606decrease
SS21At1g12050XP_006417270fumarylacetoacetase5.6/445.23/46.1404appear
XS33At2g40010XP_00641124560S acidic ribosomal protein P0-15.3/345.19/33.71009equal
Response to stress
SS6At4g20260XP_006413890plasma membrane-associated cation-binding protein 15/364.65/24.7988appear
SS7At4g20260XP_006413890plasma membrane-associated cation-binding protein 15/364.65/24.7665appear
SS8At4g20260XP_006413890plasma membrane-associated cation-binding protein 15/374.65/24.71349appear
SS10At1g75040XP_006390358pathogenesis-related protein 55/254.65/22.820020increase
SS14At2g43570XP_006397529endochitinase CHI5.3/275.84/29.8404increase
SS29At3g57270XP_006409034probable glucan endo-1,3-beta-glucosidase BG15.3/358.94/37.7202increase
XS15At2g30860XP_024004280glutathione S-transferase F96.7/256.17/24.1303decrease
Response to abiotic stimulus
XS12At5g20720XP_02401149320 kDa chaperonin5.3/255.23/21.417016increase
SS11At3g11630XP_0064074282-Cys peroxiredoxin BAS15/235.01/22.446046increase
SS12At3g11630XP_0064074282-Cys peroxiredoxin BAS15.3/245.01/22.4303decrease
XS11At3g11630XP_0064074282-Cys peroxiredoxin BAS15/245.01/22.4889decrease
Aging
XS6At1g05010XP_0064180701-aminocyclopropane-1-carboxylate oxidase 45/375.24/36.7604appear
Unknown
SS26At3g01500XP_006408514beta carbonic anhydrase 16.3/336.14/25.6807equal
XS27At3g01500XP_006408514beta carbonic anhydrase 16.3/26.36.14/25.6662equal
SS30At1g55480XP_006392635protein MET15.3/348.36/37.4303equal
XS32At1g55480XP_006392635protein MET15.3/358.19/37.425623equal
a Assigned spot number as indicated in Figure 3. SS refers to the shoots of SD ecotype of Eutrema. XS refers to the shoots of XJ ecotype of Eutrema. SR refers to the roots of SD ecotype of Eutrema. XR refers to the roots of XJ ecotype of Eutrema. b Gene symbol in Arabidopsis. c Database accession numbers of Eutrema from the NCBI database. d The identified proteins name in Eutrema. e Experiment mass (kDa) and pI of identified proteins. f Theoretical mass (kDa) and pI of identified proteins. g The sequest score. h Number of peptides sequenced. i Pattern of protein spots on 2D gel. “Appear” means that this spot appears in one ecotype, and there is no corresponding spot in the other ecotype. “Increase” means that the optical density of the corresponding spot in the ecotype is greater than or equal to 2 times (p < 0.05). “Decrease” indicates that the optical density of the corresponding spot in the ecotype is less than 1/2 (p < 0.05). “Acid” means that the spot in one ecotype is more acidic than its corresponding spot in another ecotype. “Basic” means that the spot in one ecotype is more basic than the spot in another ecotype.
Table 2. Differentially expressed proteins identified in roots of SD and XJ ecotype of Eutrema.
Spot NCBI Accession Exper. eTheor. f
No. aLocus. bNo. cProtein Name. dpI/MrpI/MrScore. gNP. hPattern. i
Small molecule metabolic process
SR5At1g09780XP_0064175392,3-bisphosphoglycerate-independent phosphoglycerate mutase 15.68/655.32/60.6687basic
SR6At1g09780XP_0064175392,3-bisphosphoglycerate-independent phosphoglycerate mutase 15.72/655.32/60.649042basic
SR7At1g09780XP_0064175392,3-bisphosphoglycerate-independent phosphoglycerate mutase 16/655.32/60.6807basic
XR2At1g09780XP_0064175392,3-bisphosphoglycerate-independent phosphoglycerate mutase 15.5/655.27/60.512812acid
XR3At1g09780XP_0064175392,3-bisphosphoglycerate-independent phosphoglycerate mutase 15.6/655.27/60.515414acid
XR7At1g09780XP_0064175392,3-bisphosphoglycerate-independent phosphoglycerate mutase 15.4/655.27/60.5806acid
XR5At5g08570XP_006399365pyruvate kinase6.3/645.93/55706appear
SR16At5g50850XP_006402055pyruvate dehydrogenase E1 component subunit beta-15.1/385.11/35.9324decrease acid
XR9At5g50850XP_006402055pyruvate dehydrogenase E1 component subunit beta-15.3/365.11/35.9585increase basic
SR4At2g45290XP_024010889transketolase-25.7/675.64/68.9504appear
Oxidation-reduction process
XR1At5g37510XP_006405867NADH dehydrogenase [ubiquinone] iron-sulfur protein 16/685.72/77.9706appear
XR13At5g54500XP_006401566NAD(P)H dehydrogenase (quinone) FQR16.3/255.96/21.813611increase
SR8At5g03630XP_024011589monodehydroascorbate reductase 26.3/455.25/47.516612decrease basic
XR8At5g03630XP_024011589monodehydroascorbate reductase 25.7/435.25/47.51089increase acid
XR6At2g14170XP_006409665methylmalonate-semialdehyde dehydrogenase [acylating]6.3/648.97/64.7827appear
Response to abiotic stimulus
SR9At1g77120XP_006390122alcohol dehydrogenase class-P6.5/455.83/41.212012increase
SR10At2g30870XP_006410185glutathione S-transferase F105.5/255.49/24.150.115decrease basic
XR10At2g30870XP_006410185glutathione S-transferase F105.3/255.49/24.114815increase acid
SR11At5g20720XP_02401149320 kDa chaperonin5.5/255.23/21.428426decrease basic
XR11At5g20720XP_02401149320 kDa chaperonin5.2/255.23/21.426221increase acid
SR15At1g66700XP_006391421paraxanthine methyltransferase 15/425.34/39.8686increase
SR1At3g16460XP_006406833jacalin-related lectin 345.3/685.31/72.5505acid
SR2At3g16460XP_006406833jacalin-related lectin 345.4/685.31/72.514814acid
SR3At3g16460XP_006406833jacalin-related lectin 345.5/685.31/72.5404acid
XR4At3g16460XP_006406833jacalin-related lectin 345.6/675.31/72.524023basic
Unknown
SR18At1g48090XP_006393484uncharacterized LOC180104855.3/266.33/46.1424appear
XR14At1g28680XP_006415631spermidine sinapoyl-CoA acyltransferase6.1/565.65/49.7343appear
XR16At5g43060XP_006403303probable cysteine protease RD21B4.6/505.89/32.514013equal
a Assigned spot number as indicated in Figure 3. SS refers to the shoots of SD ecotype of Eutrema. XS refers to the shoots of XJ ecotype of Eutrema. SR refers to the roots of SD ecotype of Eutrema. XR refers to the roots of XJ ecotype of Eutrema. b Gene symbol in Arabidopsis. c Database accession numbers of Eutrema from the NCBI database. d The identified proteins name in Eutrema. e Experiment mass (kDa) and pI of identified proteins. f Theoretical mass (kDa) and pI of identified proteins. g The sequest score. h Number of peptides sequenced. i Pattern of protein spots on 2D gel. “Appear” means that this spot appears in one ecotype, and there is no corresponding spot in the other ecotype. “Increase” means that the optical density of the corresponding spot in the ecotype is greater than or equal to 2 times (p < 0.05). “Decrease” indicates that the optical density of the corresponding spot in the ecotype is less than 1/2 (p < 0.05). “Acid” means that the spot in one ecotype is more acidic than its corresponding spot in another ecotype. “Basic” means that the spot in one ecotype is more basic than the spot in another ecotype.
Publisher’s Note: MDPI stays neutral with regard to jurisdictional claims in published maps and institutional affiliations.

