Genetic Diversity of Paeonia rockii (Flare Tree Peony) Germplasm Accessions Revealed by Phenotypic Traits, EST-SSR Markers and Chloroplast DNA Sequences

Beijing Advanced Innovation Center for Tree Breeding by Molecular Design, Peony International Institute, Beijing Key Laboratory of Ornamental Plants Germplasm Innovation & Molecular Breeding, National Engineering Research Center for Floriculture, Key Laboratory of Genetics and Breeding in Forest Trees and Ornamental Plants of Ministry of Education, School of Landscape Architecture, Beijing Forestry University, Beijing 100083, China
*
Author to whom correspondence should be addressed.
Forests 2020, 11(6), 672; https://doi.org/10.3390/f11060672
Submission received: 16 May 2020
/
Revised: 7 June 2020
/
Accepted: 10 June 2020
/
Published: 12 June 2020
(This article belongs to the Special Issue Genetic and Phenotypic Variation in Tree Crops Biodiversity)
Abstract
:Research Highlights: This study, based on the first collection of cultivated Paeonia rockii (flare tree peony, FTP) germplasm across the main distribution area by our breeding desires, comprehensively evaluates these accessions by using phenotypic traits, expressed sequence tag (EST)-simple sequence repeat (SSR) markers and chloroplast DNA sequences (cpDNA). The results show that these accessions collected selectively by us can represent the genetic background information of FTP as a germplasm of tree crops. Background and Objectives: FTP has high cultural, ornamental and medicinal value traditionally, as well as recently presenting a significance as an emerging edible oil with high α-linolenic acid contents in the seeds. The objectives of this study are to reveal the characteristics of the genetic diversity of FTP, as well as to provide scientific suggestions for the utilization of tree peony breeding and the conservation of germplasm resource. Materials and Methods: Based on the phenotypic traits, EST-SSR markers and chloroplast DNA sequence variation, we studied the diversity of a newly established population of 282 FTP accessions that were collected and propagated by ourselves in our breeding project in recent years. Results: (1) There was an abundant variation in phenotype of the accessions, and the phenotypic variation was evenly distributed within the population, without significant hierarchical structure, (2) the EST-SSR data showed that these 282 accessions had relatively high genetic diversity, in which a total of 185 alleles were detected in 34 pairs of primers. The 282 accessions were divided into three distinct groups, and (3) the chloroplast DNA sequences (cpDNA) data indicated that these accessions had a higher genetic diversity than the population level and a lower genetic diversity than the species level of wild P. rockii, and the existing spatial genetic structure of these accessions can be divided into two branches. Conclusions: From the results of the three analyses, we found that these accessions can fully reflect the genetic background information of FTP germplasm resources, so their protection and utilization will be of great significance for genetic improvement of woody peonies.
1. Introduction
Tree peony or Mudan, known as “the king of flowers” in China, has high cultural, ornamental and medicinal value traditionally, as well as recently presenting a significance as an emerging edible oil with high unsaturated fatty acid (>90%) and α-linolenic acid (>40%) contents in the seeds [1,2]. Tree peony belonging to the section Moutan in the genus Paeonia and all wild species are endemic to China. It has been cultivated since the Tang Dynasty (618–906 AD) and is now widespread in temperate regions of China and other countries. At present, there are more than 1500 germplasm accessions of tree peony in the world, included in about 17 cultivar groups. In China, long-term and repeated domestication and selection breeding have formed ten groups, about 1000 germplasm accessions, with diverse genetic background [3].
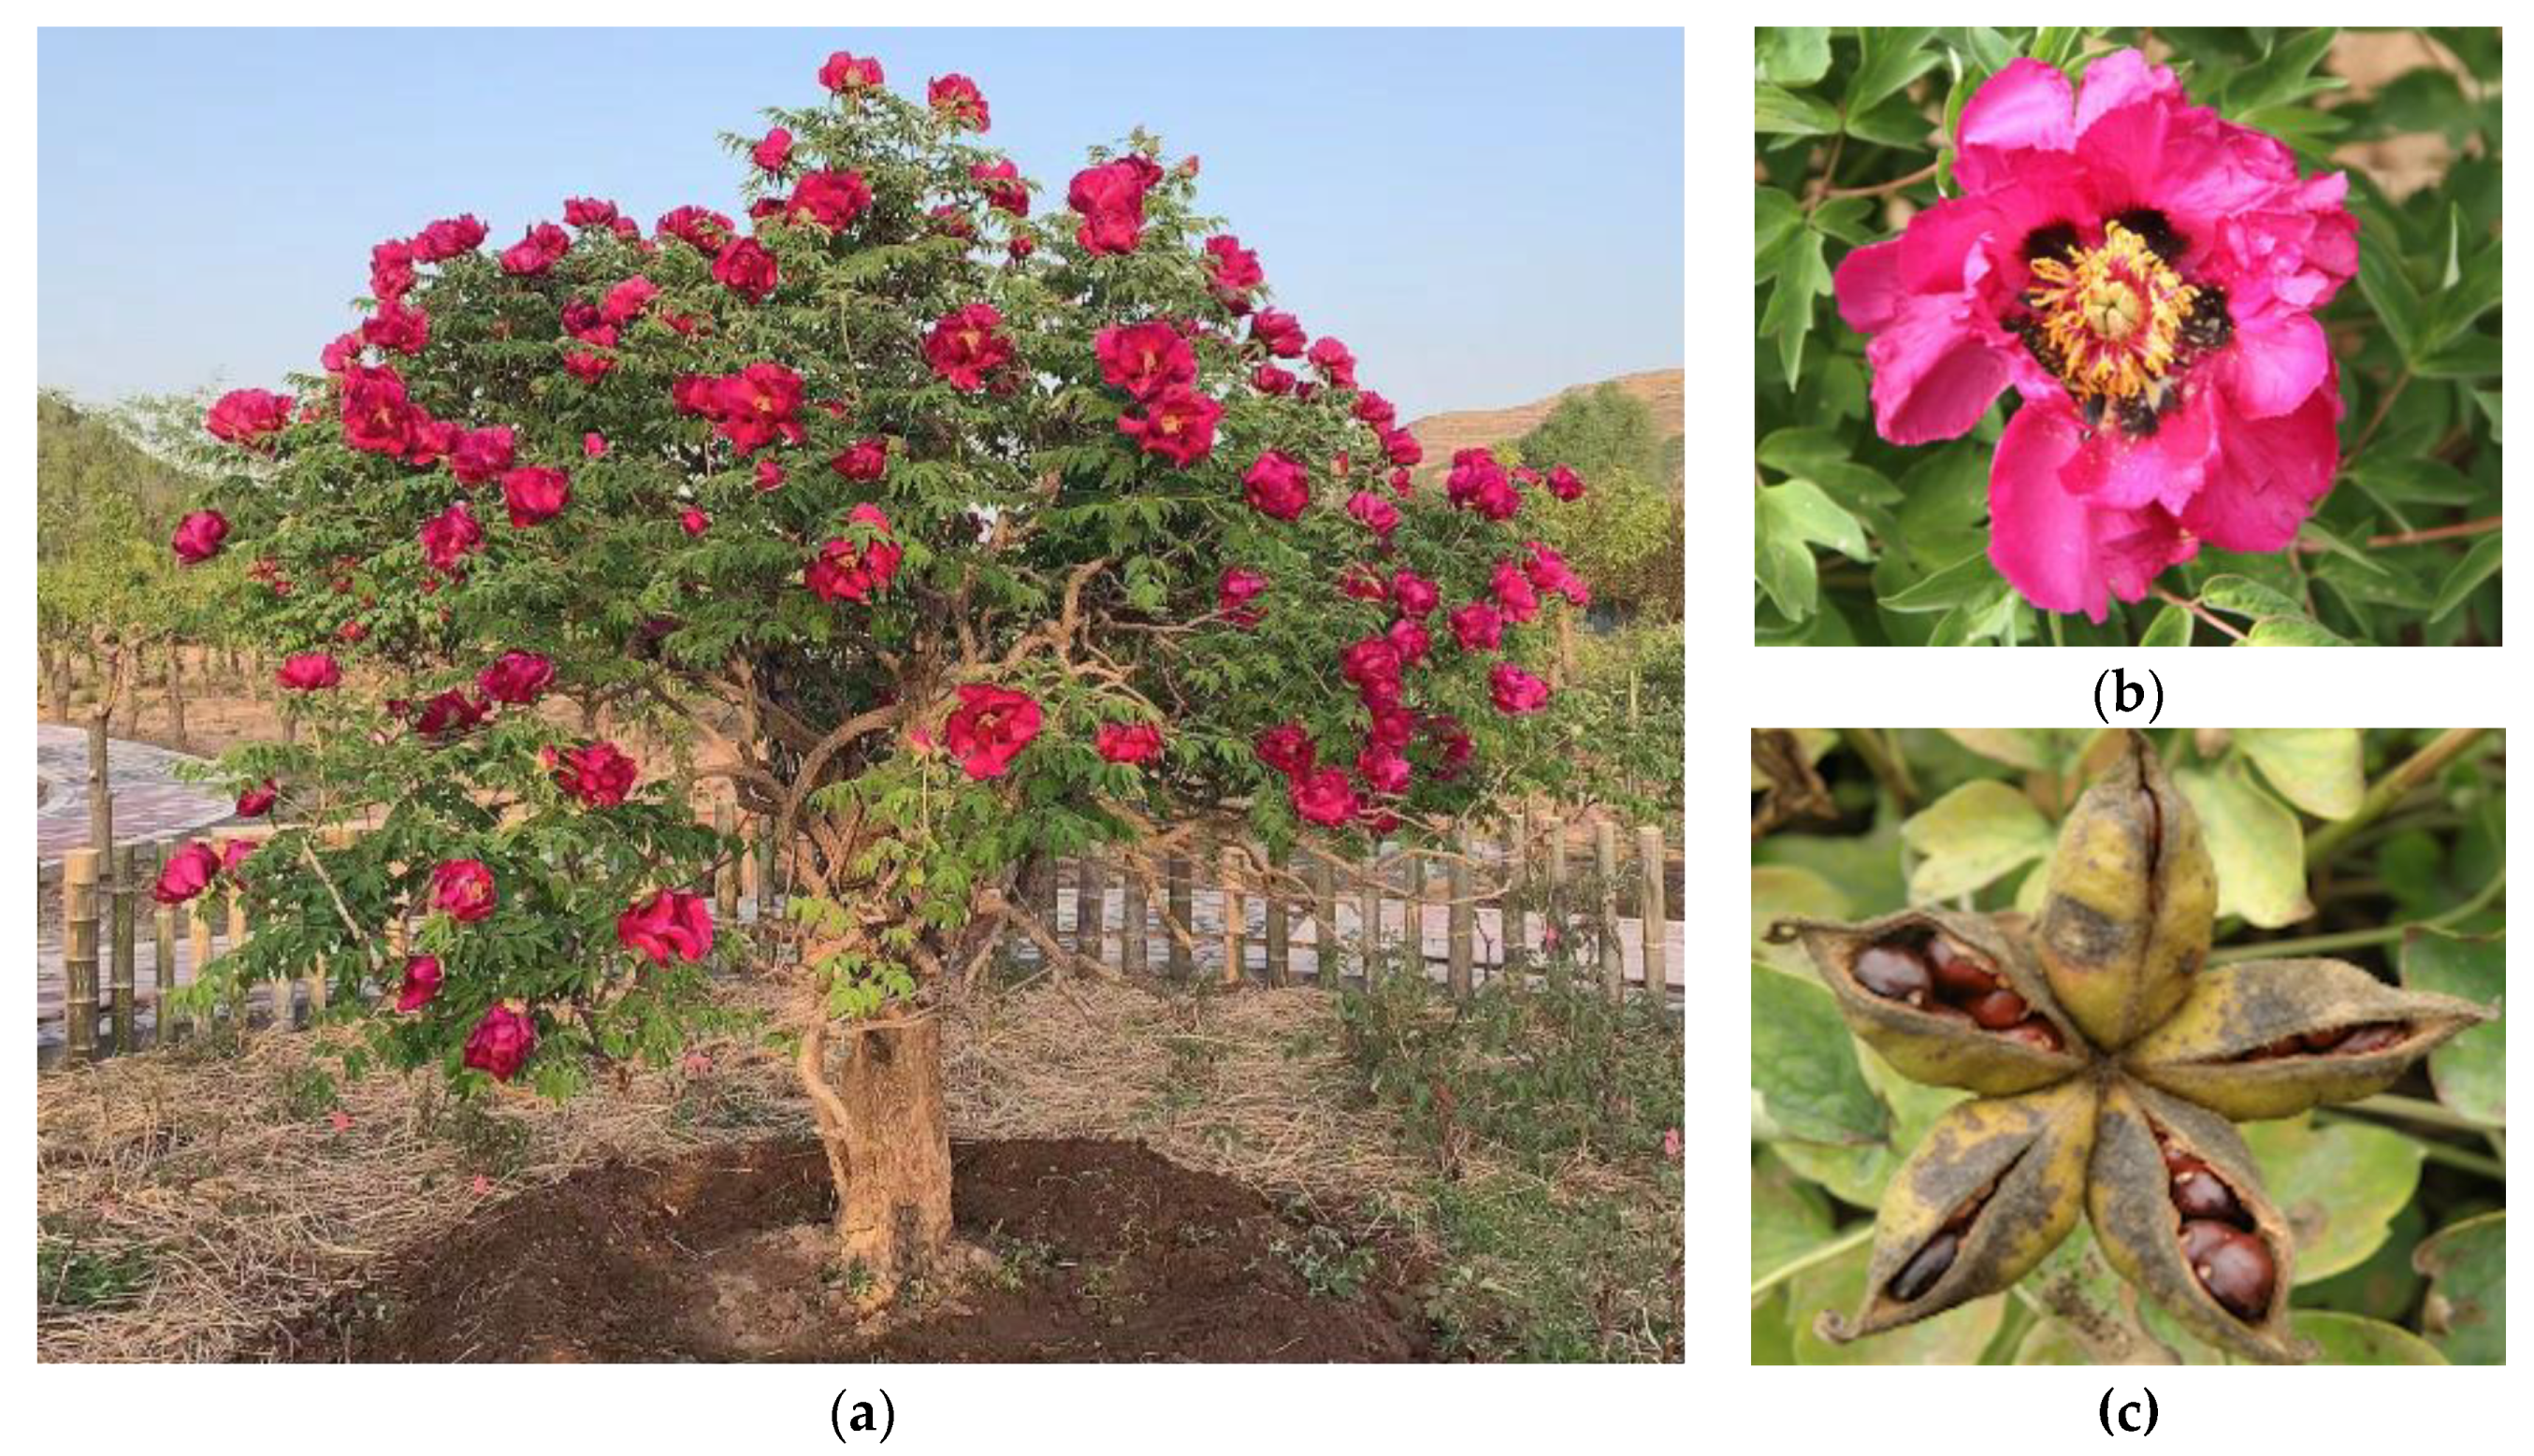
As the representative of the most-widely cultivated tree peonies, Paeonia suffruticosa Andrews or the common tree peony (CTP), includes the germplasm accessions traditionally cultivated in China and Japan, while the germplasm accessions originated from P. rockii or the flare tree peony (FTP) have established a distinct group from CTP and are known well, with a colored flare at the base of petals [3]. Compared to CTP, FTP is more fertile in most cases as well as more resistant to stress conditions like coldness, drought and poor soil. FTP is distinct from CTP in many other features, like more fragrant blossoms, and taller and stronger plants with more longevity (Figure 1) [1,4]. Since many studies [1,5,6,7,8,9,10,11] have confirmed that FTP is a valuable genetic resource of tree peonies, greatly promising in the breeding and industry of peonies, the further in-depth study of FTP has become obviously required for the utilization and protection of FTP as a germplasm resource of tree crops.
The analysis of genetic diversity can provide beneficial data for collection of germplasm resources, breeding application and researches on origin and evolution [12]. Phenotypic variation analysis is one of the most important, basic, intuitive but indispensable methods for the development and application of plant germplasm resources. In tree peonies (Paeonia Sect. Moutan), researchers have focused on the genetic diversity of phenotypic traits in different species and cultivated germplasm, including P. delavayi [13], P. ostii [14,15], P. delavayi var lutea [16], P. suffruticosa [17,18,19] and so on. In recent years, the emergence of molecular markers has greatly accelerated the development of genetics and genomics and is expected to be a powerful tool to accelerate the research of tree peony breeding. Researchers had used random amplification polymorphic DNA (RAPD), inter-simple sequence repeat (ISSR), sequence-related amplified polymorphism (SRAP), conserved DNA-derived polymorphism (CDDP), inter-primer binding site (iPBS), target region amplified polymorphism (TRAP), expressed sequence tags microsatellite markers (EST-SSR), chloroplast DNA sequences (cpDNA) and EST-SSR with cpDNA to analyze the genetic diversity of P. suffruticosa [20,21,22,23,24,25,26], P. x yananensis [27], P. rockii [28,29], P. delavayi [30], P. ludlowii [31], Paeonia subsect. Delavayanae [32,33], P. decomposita [34], P. jishanensis [35], P. ostii [36] and P. quii [37]. In P. rockii, Yuan et al. [28,29] used cpDNA and SSR to analyze the genetic diversity in 20 wild populations, showing that wild P. rockii had high genetic diversity at the level of species and can be divided into three genetically distinct clusters corresponding to three geographically distributed regions. Xu et al. [37] used cpDNA and EST-SSR to analyze the genetic diversity of P. rockii, P. jishanensis and P. qiui to discover that the genetic diversity of P. rockii among the three tree peony species was relatively low. In the population of 462 cultivated P. rockii seedlings, Wu et al. [38] used 40 EST-SSR markers to reveal a medium genetic diversity and the genetic structure composed of three subgroups. These studies provided us with very useful references to carry out further research on the genetic diversity of tree peony germplasm.
With high polymorphism, codominance and ease of operation, EST-SSR molecular markers have been applied more and more in the study of genetic diversity [39]. Chloroplast genome is maternal lineage and retains ancestral patterns of genetic diversity longer than nuclear DNA [40]. Moreover, in the cross-breeding system, the effective population size of cpDNA is only half of that of nuclear DNA, which may lead to higher genetic differentiation and more significant genetic structure [41]. Chloroplast non-coding region sequences have higher mutation rates than coding region sequences, which can be used for population genetics research [42,43].
Based on the phenotypic traits, EST-SSR markers and chloroplast DNA sequence variation, this paper reports the research of genetic diversity in the newly established population of 282 FTP accessions that were collected, propagated and mostly named as cultivars by us in our breeding project in recent years. Our objectives are to reveal the characteristics of genetic diversity of these accessions, as well as to provide scientific suggestions for the utilization in peony breeding and the conservation of FTP germplasm resource.
2. Materials and Methods
2.1. Plant Materials and DNA Extraction
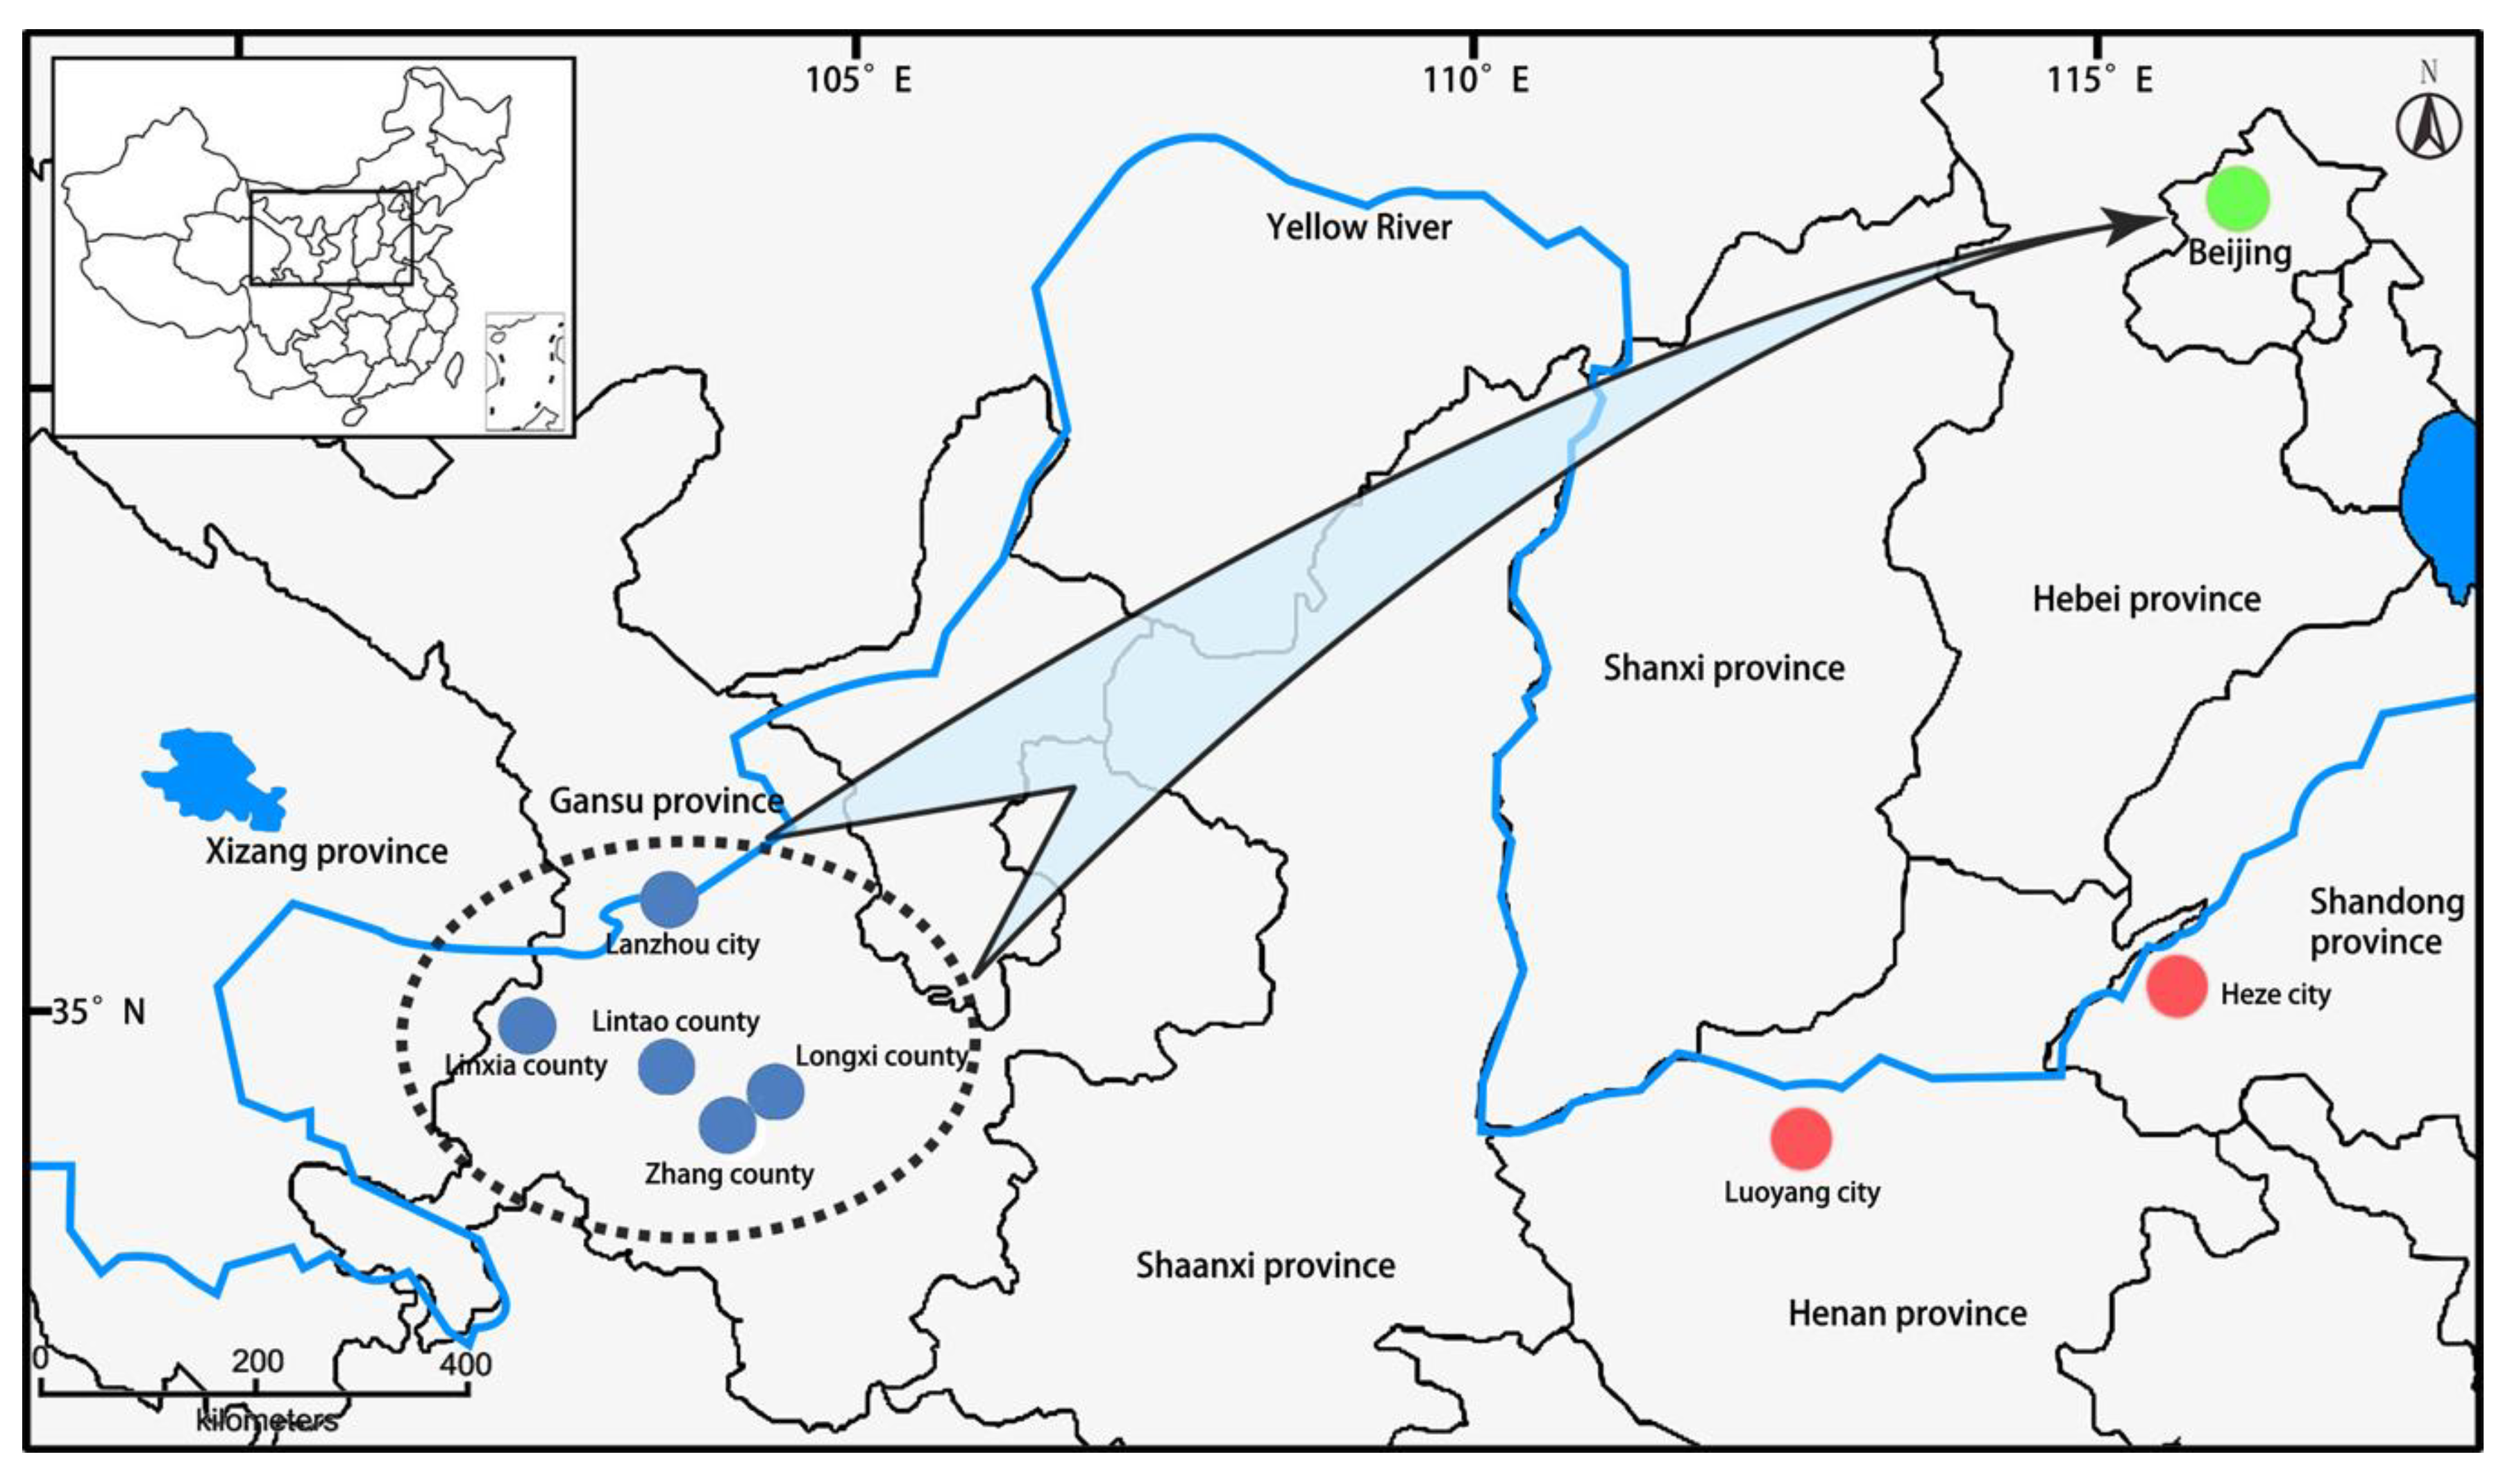
Germplasm resources of FTP had been selectively collected by our breeding desires across the main cultivation area of the FTP, Lanzhou city, Zhang county, Longxi county, Lintao county and Linxia county of Gansu province in Northwest China since 1990, propagated by grafting in Guose Peony Garden of Yan Qing district, Beijing, China (40°46′ N, 116°07′ E) since 2011 (Figure 2). The plants of the 282 accessions used in this study are randomly planted in the same nursery field and maintained under the same condition of water and fertilizer throughout the year.
In March 2018, the young leaves of all accessions were individually collected and dried in silica gel, from which total genomic DNA was extracted by using a DNAsecure plant kit (Tiangen Biotech, Beijing, China). The extracted DNA was detected by electrophoresis using 2% agarose gels and a UnicoUV–visible Spectrophotometer (Agilent, Palo Alto, CA, USA), respectively. The samples were diluted to 20–30 ng/μL with deionized water and then stored in the refrigerator at −20 °C.
A total of 282 accessions, of those collected above, were used for EST-SSR analysis, and the phenotypic traits were investigated only in the completely matured 15-year-old plants of 180 accessions. The color of flowers is genetically stable for every specific accession and in the studied accessions can be classified into five groups: 89 white, 33 pink, 32 red, 116 purplish red and 12 purplish black. By this color group, we selected the accessions for cpDNA sequencing, including 24 white, 10 pink, 8 red, 35 purplish red and 3 purplish black accessions, with the proportions of 26.97%, 30.30%, 25.00%, 30.17% and 25.00%, respectively (Supplementary Table S1).
2.2. Measurement of Phenotypic Traits
We recorded 28 phenotypic traits according to the measurement standard (Table 1) during the flowering time from April to May and the seed ripening time from August to September in 2019. In April to May, three plants were randomly selected for each accession as three replicates and three branches with flowers were randomly selected for each plant. The number of flowers, plant height, crown breadth and tiller number of three plants were measured first, then nine flower diameters were measured, and nine carpel numbers were counted. A random outer petal was selected from each flower to measure the length and width of each petal and flare. Then, the number of petals of each flower was counted. Finally, the second or third compound leaf from bottom to top of each branch was selected for leaf trait investigation. From August to September, we chose the three plants and three branches of each plant that we had measured in the blooming period. First, we counted the fruit number of three plants and fruit weight per plant. Then, we measured individual fruit weight, number of seeds per fruit, seed weight per fruit and effective carpel number. Lastly, we randomly selected a single carpel of each follicle to measure fruit length, fruit width, fruit height and pericarp thickness.
2.3. Microsatellites Markers
From 72 pairs of EST-SSR primers distributed in 5 linkage groups of the first high-density genetic map of P. suffruticosa [44,45], we screened out 34 pairs of primers with high amplification efficiency and rich polymorphism. The sequences of the primers used in this study are listed in Table 2, and all the forward primers were respectively labeled with 5-Carboxyfluorescein (5-FAM), 5-Hexachlorofluorescein (5-HEX), 5-Carboxytetramethylrhodamine (5-TAMRA), 5-Carboxy-X-rhodamine (5-ROX). The polymerase chain reaction (PCR) was conducted in a 10 µL solution, including: 5 µL 2× Power Taq PCR Master MIX (Aidlab Biotechnologies, Beijing, China), 0.5 µL and 10 µmol/L each of forward and reverse primer, 1 µL and 20–25 ng/μL genomic DNA and 3 µL ddH2O. The SSR-PCR amplification procedure was run as described by Wu et al. [45]. The amplified fragment results were detected by capillary electrophoresis using an ABI3730xl DNA Analyzer with a GeneScan-500LIZ size standard (Applied Biosystems, Carlsbad, CA, USA).
2.4. Chloroplast DNA Sequences
Since the same chloroplast gene fragment has different evolutionary rates in different plants, the optimal chloroplast fragment should be selected for different species [46,47,48]. From the reported chloroplast fragments, three pairs of chloroplast gene spacer fragments, petB-petD, accD-psaI and psbE-petL, which can be amplified stably and have high polymorphism, were screened out on the basis of existing common primers [26,49]. Primer information is shown in Table 3. Three chloroplast DNA primers were selected to access the genetic diversity of 80 accessions that can represent the typical flower colors from 282 accessions. The PCR amplification reaction was conducted in a 50 µL solution, including: 25 µL 2× Power Taq PCR Master MIX (Aidlab Biotechnologies, Beijing, China), 2.5 µL and 10 µmol/L each of forward and reverse primer, 2 µL and 20–25 ng/μL genomic DNA and 18 µL ddH2O. The PCR procedure was as follows: 5 min at 94 °C, followed by 35 cycles of 30 s at 94 °C, 30 s at 52–54 °C and 50 s at 72 °C, and lastly, 7 min at 72 °C. The amplified fragment results were detected by capillary electrophoresis using an ABI3730xl DNA Analyzer (Applied Biosystems, Carlsbad, CA, USA).
2.5. Statistical Analyses
2.5.1. Analysis of Phenotypic Data
The average values per plant were used in the statistical analysis and the data were analyzed using the statistics software SPSS version 18.0 (IBM Inc., Chicago, IL, USA) [50]. One-way analysis of variance (ANOVA; with post hoc Duncan’ s multiple range test with a probability p < 0.05 and p < 0.01) was used to analyze the 28 traits’ variation and Pearson’s correlations between traits were calculated. Prior to the ANOVA and Pearson’s correlation analysis, all data were tested for normality with the Shapiro–Wilk W test and for homogeneity of variance with the Levene’s test, and the non-normal data were logarithmic transformed. We adjusted the p-value for Pearson’s correlation using the Benjamini–Hochberg (BH) false discovery rate (FDR) correction. Coefficient of variation (%) = (standard deviation/mean) × 100. Principal component analysis (PCA) was performed for 28 traits. Maximum deviation method was used for factor rotation, and the principal components were extracted according to Kaiser criterion (characteristic root > 1). Then, with the first principal component (PC-1) and the second principal component (PC-2) as the main coordinates, the distribution diagrams of 28 quantitative traits and 180 accessions were plotted, respectively.
2.5.2. Analysis of EST-SSR Data
GeneMarker V2.2.0 was used to analyze the capillary electrophoresis data. GenAIEx version 6.5 [51] was used to calculate the following indicators: Number of Different Alleles (Na), Number of Effective Alleles (Ne), Shannon’s Information Index (I), Observed Heterozygosity (Ho), Expected Heterozygosity (He), Inbreeding coefficients (FIS) and Nei’s genetic diversity (GD). Polymorphism information content (PIC) was calculated for each locus by using a Microsatellite Toolkit. GENEPOP version 4.2 [52] was used to detect whether microsatellite loci deviated from the Hardy–Weinberg equilibrium (HWE). Additionally, a Neighbor-Joining phylogenetic tree based on Nei’s unbiased genetic distance was constructed with MEGA-X [53]. Finally, Principal Coordinates Analysis (PCoA) was carried out using GenAIEx version 6.5 based on Nei’s genetic distance of all accessions.
2.5.3. Analysis of Chloroplast DNA Sequences
MAFFT version 7 [54] was used to conduct multi-sequence alignment and adjustment. SequenceMatrix 1.7.8 [55] was used to splice three chloroplast non-coding regions, accD-psaI, psbE-petL and petB-petD, into a sequence. Values of haplotype diversity (Hd), haplotype number (Hap) and nucleotide diversity (Pi) were calculated by DnaSP 5.0 [56]. PopART [57] and the Median-Joining network (MJ) algorithm were used to construct the association map of the chloroplast DNA haplotypes. MEGA-X [53] was used to construct the phylogenetic tree of 3 haplotypes based on the maximum likelihood method (ML). Meanwhile, phylogenetic trees were constructed for the sequences of 80 accessions based on the Maximum Parsimony method (MP) with PAUP 4.0 [58]. The consistency index was 1.000000, the retention index was 1.000000, and the composite index was 1.000000 for all sites and parsimony-informative sites (in parentheses).
3. Results
3.1. Genetic Diversity Based on Phenotypic Traits
3.1.1. Phenotypic Traits Variation
ANOVA analysis on phenotypic variation showed that in addition to the number of flowers per plant, the other 27 quantitative traits showed very significant differences in 180 accessions (p < 0.01) (Table 4). Since all investigated plants were adult with stable characteristics growing in a consistent cultivation condition, it could be considered that the phenotypic variation was mainly due to genotypic differences. Descriptive statistical analysis was conducted at the whole population level, and it was found that the coefficient of variation of flower traits, stem and leaf traits and fruit traits ranged from 12.33% to 108.73%, with a very high degree of variation. Among the flower traits, the coefficient of variation ranged from 12.33–108.73%. The variation of petal number (108.73%) was very obvious, but the other flower traits varied weakly in various accessions, among which the variation coefficients of flower diameter (12.33%) and petal length (12.33%) were the smallest. As for the branch and leaf traits, the variation coefficients of tillers’ number (90.53%), fruits (66.86%) and flowers (57.43%) per plant were relatively higher. The variation coefficient of the fruit traits ranged from 17.84% to 99.93% (average 48.50%). Among them, the variation coefficient of seed weight per fruit was the largest (99.93%), followed by seed number per fruit (94.30%). So, significant phenotypic differences of phenotypic variation in the FTP accessions provide valuable germplasm resources for selective breeding of tree peonies.
3.1.2. Distribution of Phenotypic Traits Variation in the Population
PCA on 28 quantitative traits showed that the cumulative contribution rate of 8 principal components reached 70.516% (Table 5). The explanatory contribution rate of the first principal component was 17.722%. The traits that determined the first principal component were, in order, seed weight per fruit, individual fruit weight, number of seeds per fruit, fruit width, fruit height, fruit length and fruit weight per plant, all of which were fruit traits. Therefore, the first principal component represented the variation of fruit traits, which can be defined as the fruit character factor. The traits that determined the second principal component were fruit number, flower number, east-west crown breadth, north-south crown breadth and fruit weight per plant. The third principal component mainly consisted of petal length, petal width, flower diameter, flare length and flare width, all of which were floral traits, which can be defined as the flower character factor. The fourth principal component consisted of compound leaf length, petiole length, compound leaf width, terminal leaflet length and terminal leaflet width, all of which were stem and leaf traits. Length and width of the terminal leaflet majorly affected the character of the fifth principal component. The fourth and fifth principal components can be defined as the branch and leaf character factor. The PCA of quantitative traits explained the variation distribution of phenotypic traits in the whole population.
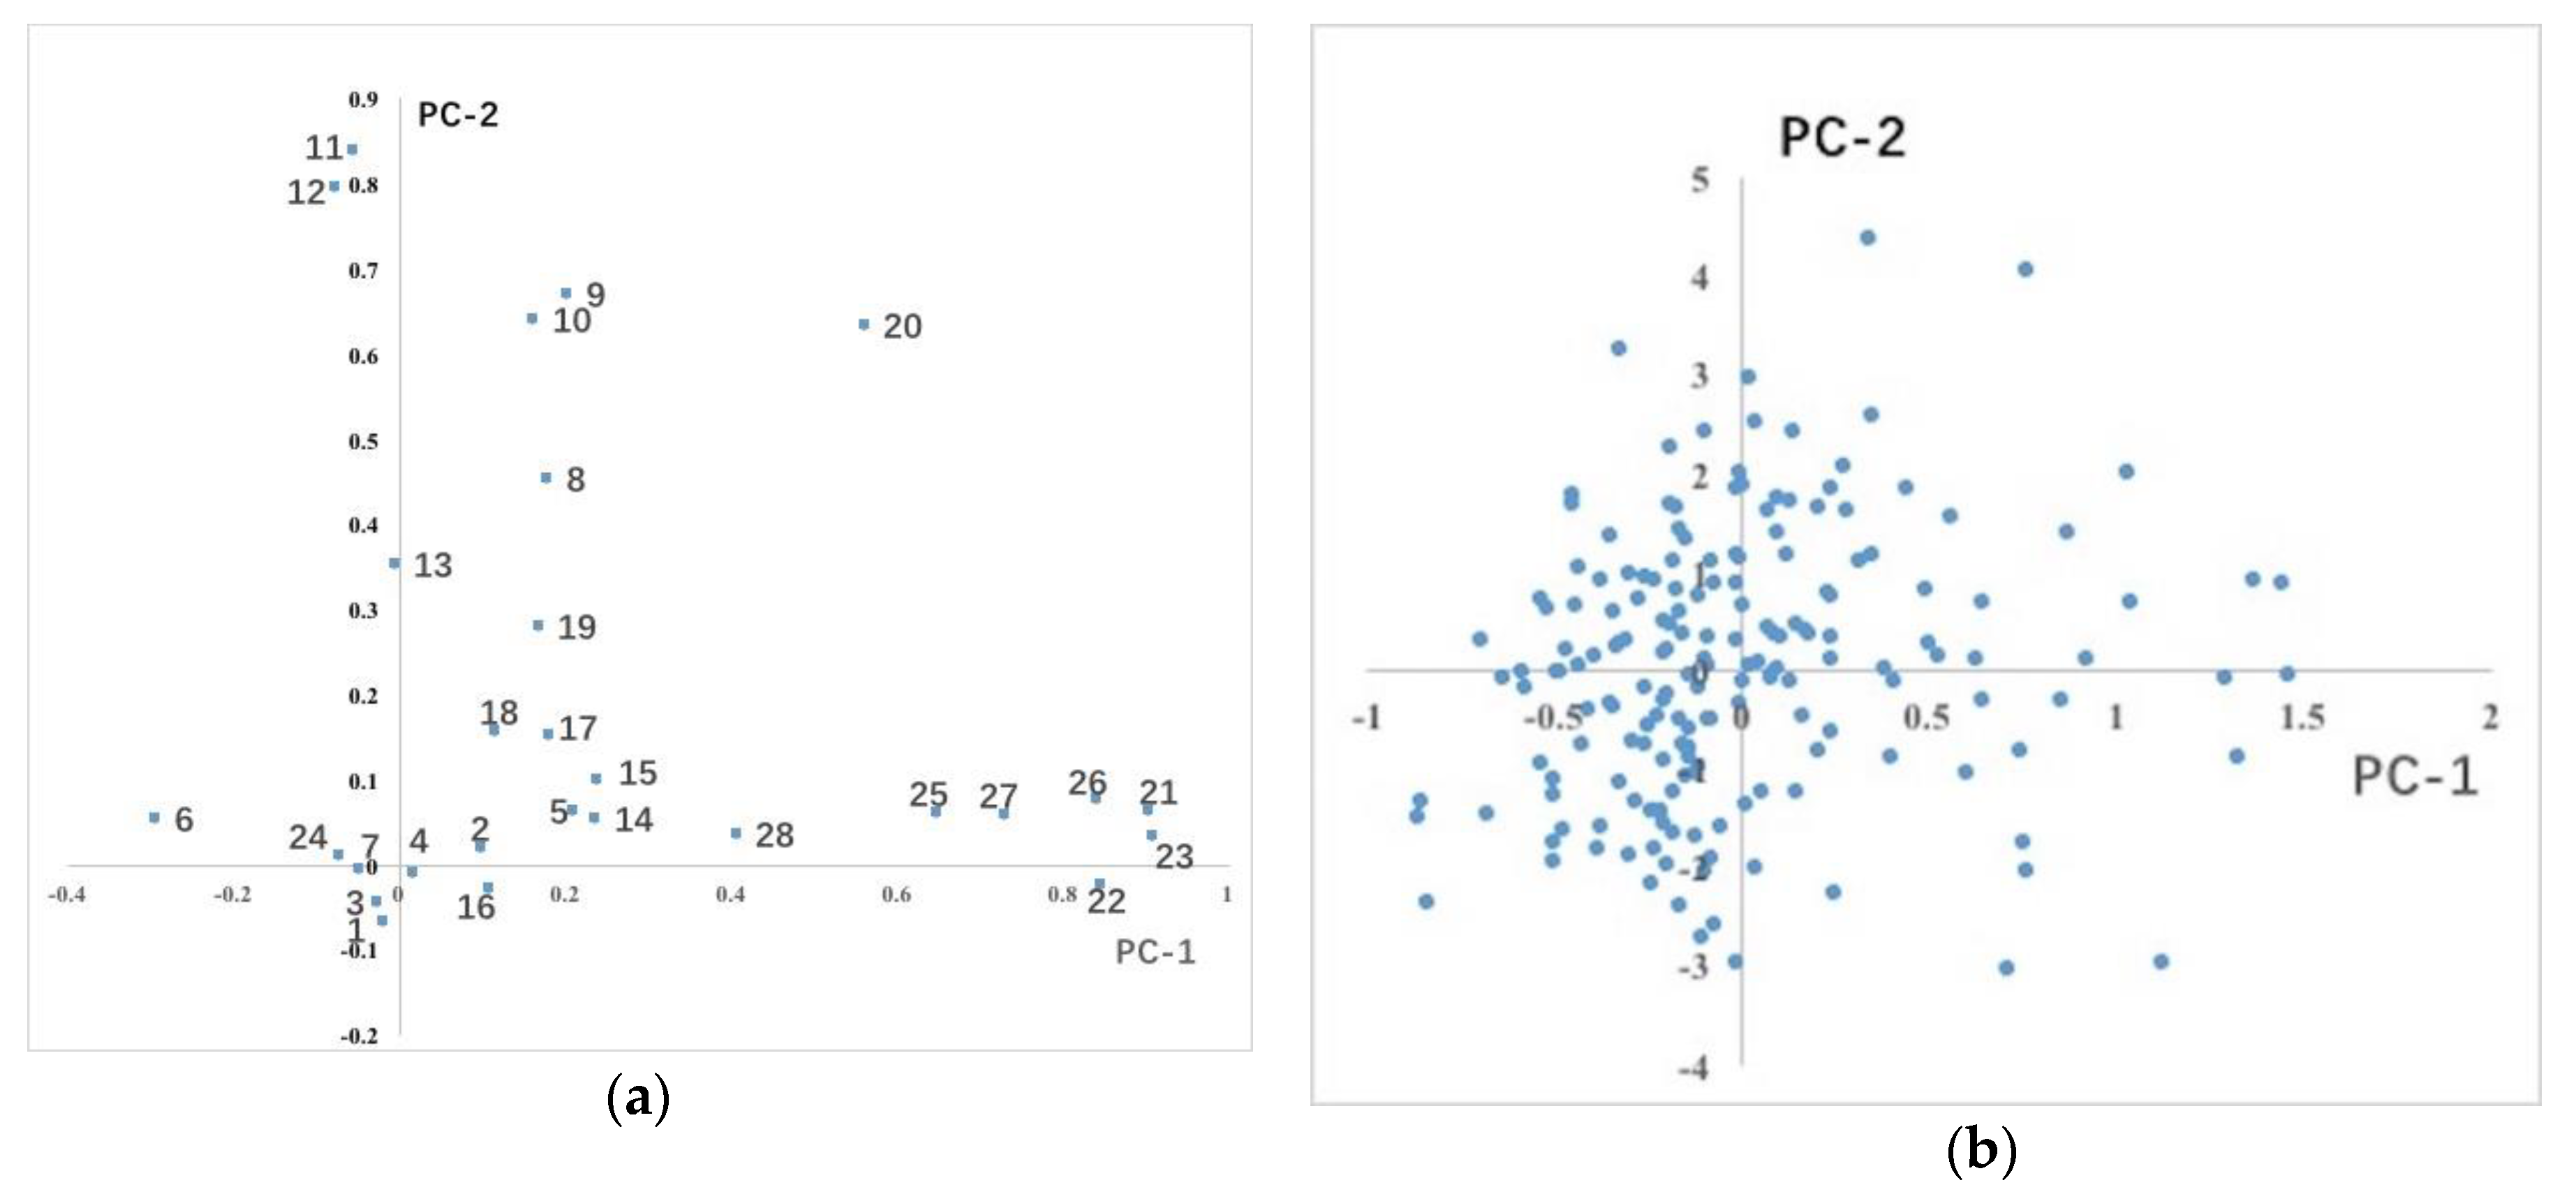
In addition, among the principal coordinate distributions of all quantitative traits, we found that fruit traits were distributed along the horizontal axis, stem and leaf traits along the vertical axis, and flower traits were distributed near the origin (Figure 3a). The 180 accessions were evenly distributed on the coordinate axes composed of the first principal component and the second principal component (Figure 3b), indicating that the variation of these phenotypic traits was evenly distributed in the population and no obvious hierarchical structure was formed.
3.1.3. Correlation Analysis of Quantitative Traits
Correlation analysis on 28 quantitative traits showed that there were different degrees of correlation among all traits (Table 6). Among the 378 pairs of combinations, 205 pairs of all traits showed significant correlation (p < 0.05), among which 191 pairs showed very significant correlation (p < 0.01). In tree peony breeding for ornamental uses, we mainly focused on the improvement of the flower diameter and the petal number. There were 17 traits that were very significantly positively correlated with flower diameter, including all floral traits except petal numbers and all fruit traits except effective carpel number. Petal number was negatively correlated with flower diameter, and only positively correlated with effective carpel number. This indicated that the traits of flower and fruit were closely related and the two ornamental traits we want to improve are opposite. For the breeding of oil tree peony, we need accessions that have more fruit number per plant and more seed weight per fruit. In Table 6, we can find that the trait that was very significantly positively correlated with these two traits was fruit weight per plant. For conventional breeders, it is not necessary to peel off the pericarp to weigh the seeds, but simply to weigh the fruit weight per plant to make a preliminary selection of high seed yield accessions.
3.2. Genetic Diversity Based on the EST-SSR
3.2.1. EST-SSR Polymorphism
Amplification of 282 accessions using 34 SSR pairs generated 185 alleles and the number of alleles detected per locus was in a range of two to thirteen, with an average of 5.441 alleles (Table 2). Observed heterozygosity (Ho) and expected heterozygosity (He) ranged from 0.004 to 0.993 and 0.004 to 0.815, with means of 0.537 and 0.489, respectively. Among all 34 SSR loci, PS004, PS026, PS047, PS068, PS073, PS074, PS095, PS119, PS139, PS157, PS166, PS187, PS221, PS260, PS265, PS296, PS309, PS311, PS337, PS345, PS356 and PS367 had lower He than Ho. Overall, the mean of Ho was higher than that of He, indicating that there was a heterozygote excess in these accessions. The effective number of alleles (Ne) was 2.291 ± 0.166. Shannon diversity index (I) was 0.908 ± 0.072, and the range of PIC at 34 SSR pairs of 282 accessions was 0.004~0.792. According to the Shannon’s Information Index, the genetic diversity of PS095 (I = 1.857) was the highest, followed by primers PS074 (I = 1.457), PS166 (I = 1.455) and PS356 (I = 1.476). Primer PS323 has the lowest genetic diversity. The mean value of SSR marker polymorphism information content (PIC) in this study was 0.611. In addition, 24 SSR sites deviated significantly from the HWE (p < 0.001), and 2 SSR sites deviated significantly from the HWE (p < 0.01).
3.2.2. Genetic Relationships among 282 Accessions
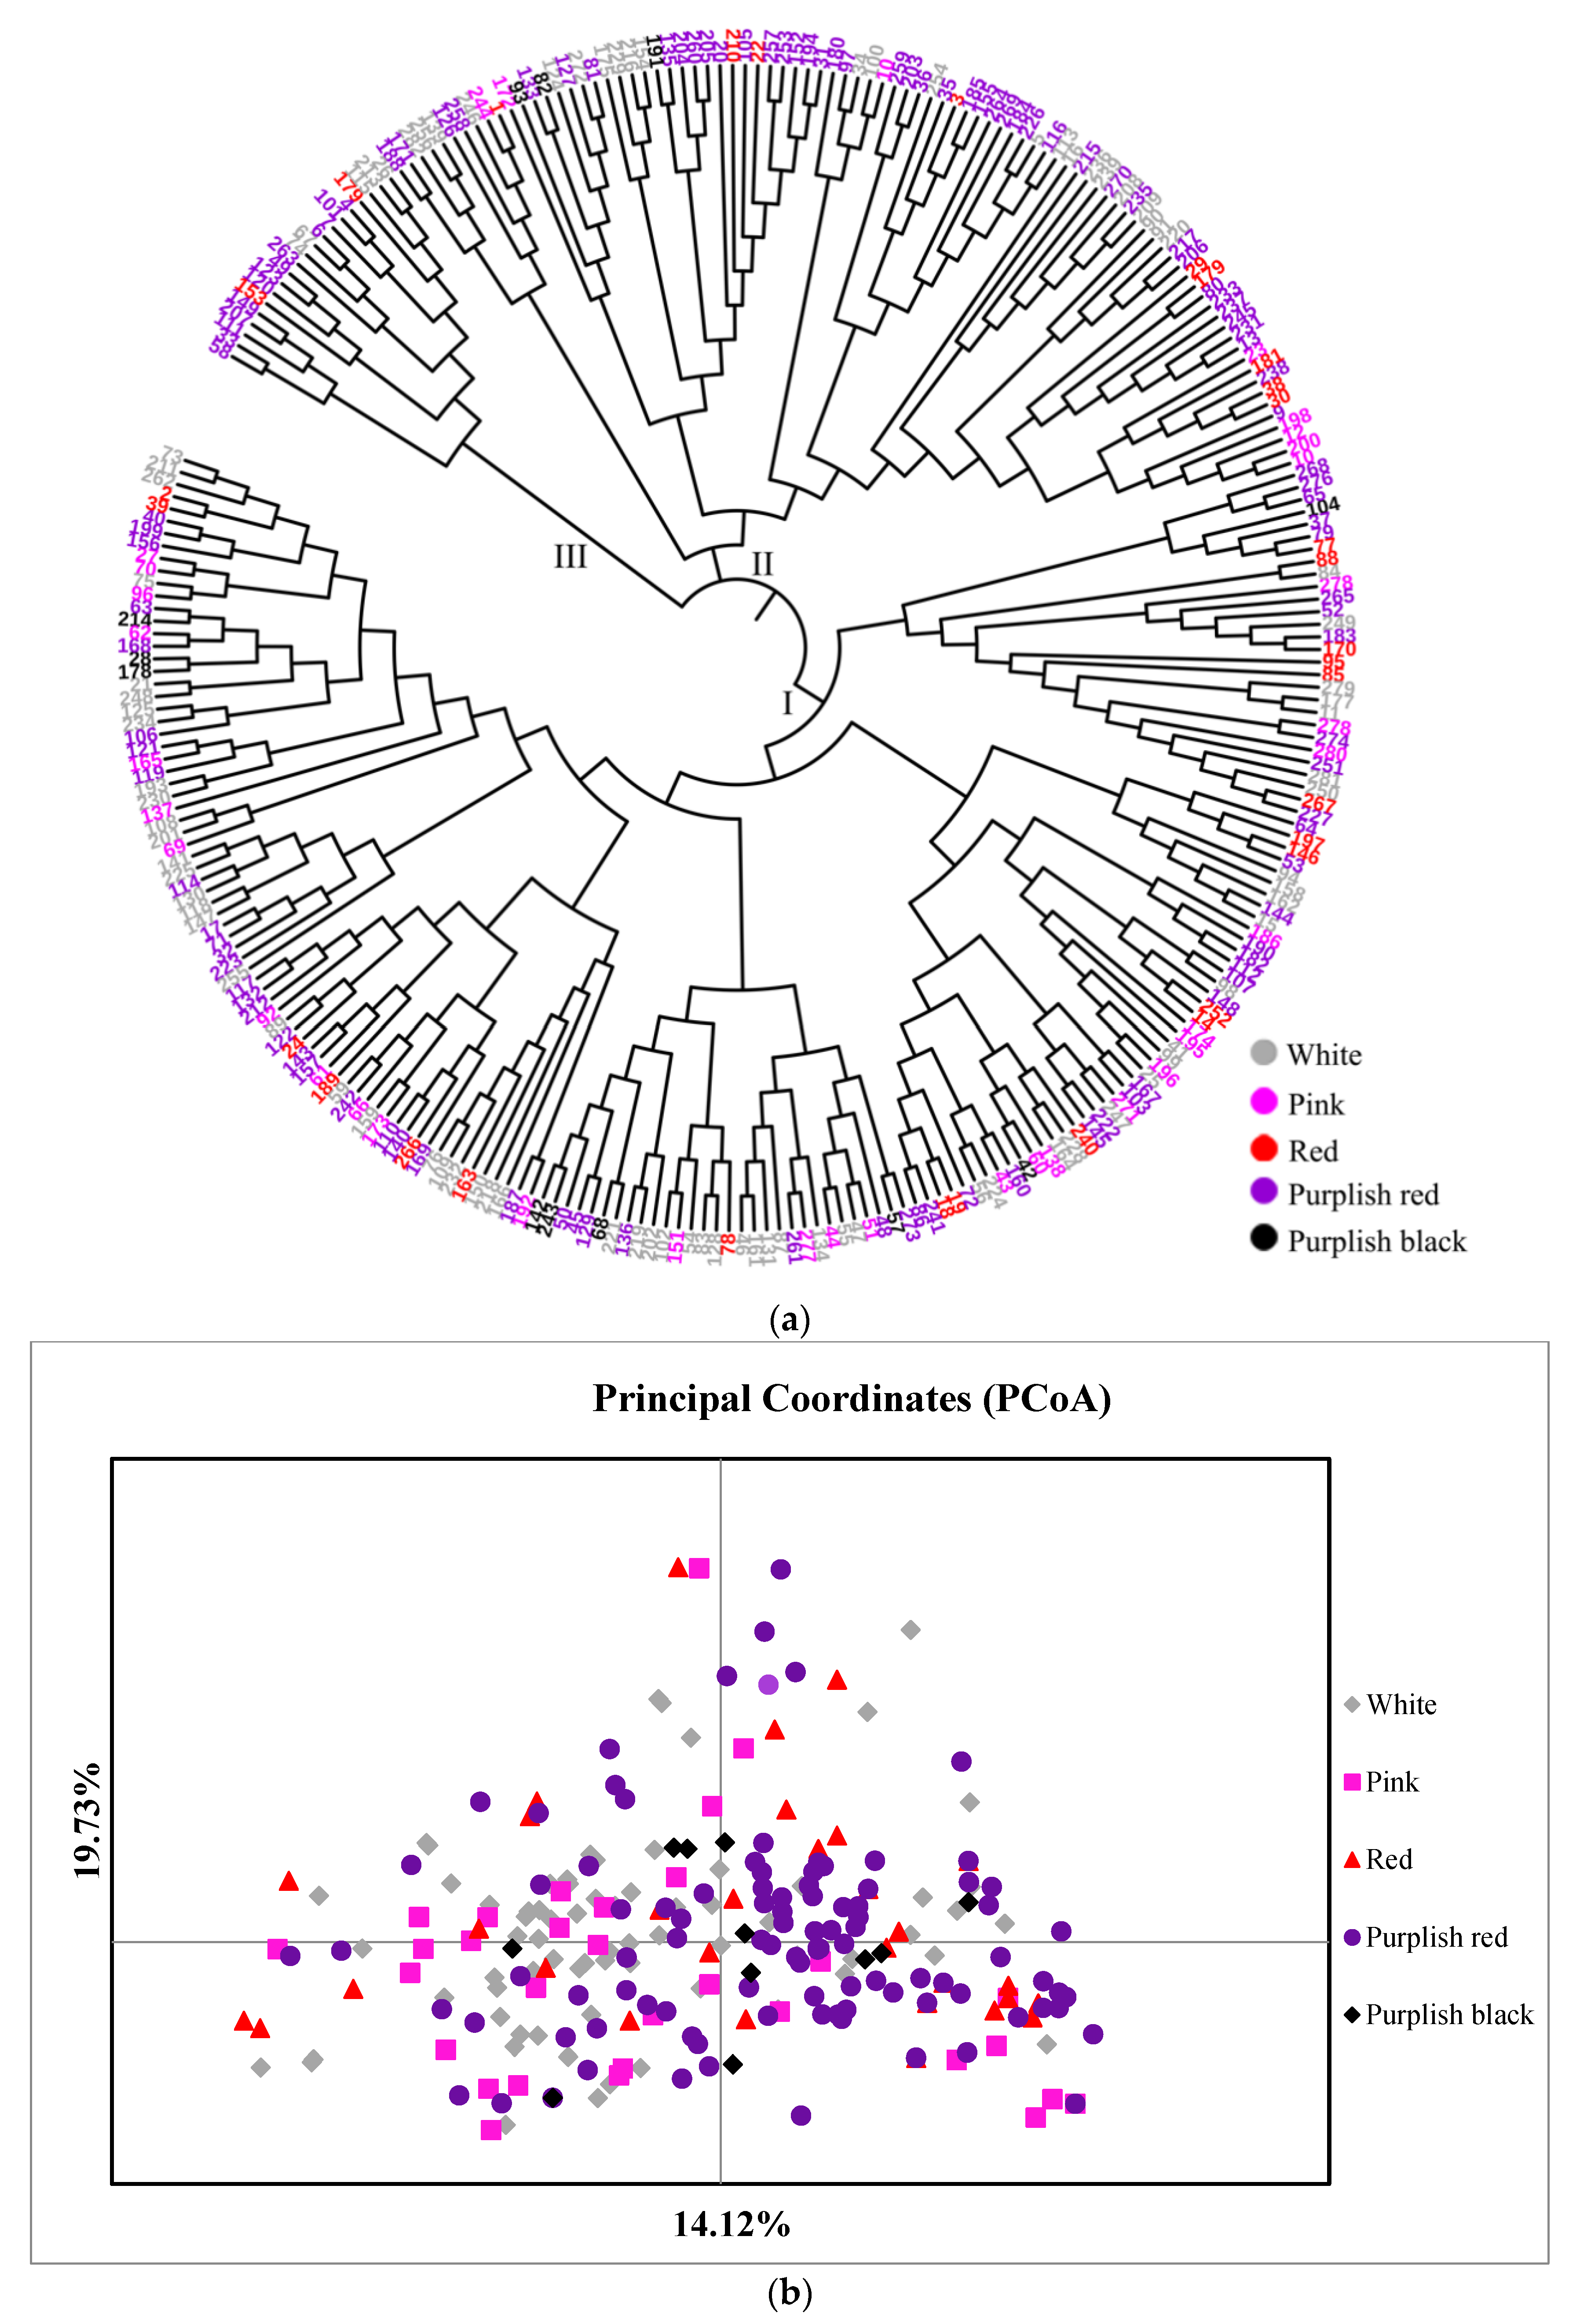
It was found that 282 accessions were firstly divided into 3 major branches (Figure 4a), comprising 175, 87 and 20 accessions. Branch I; included 61 white, 25 pink, 21 red, 59 purplish red and 9 purplish black accessions, branch II included 23 white, 8 pink, 9 red, 44 purplish red and 3 purplish black accessions, and branch III included 5 white, 2 red and 13 purplish red accessions. The accessions of each color were relatively evenly distributed on each cluster, which showed the same results as the PCoA analysis (Figure 4b) and showed no regular distribution. Some accessions with similar traits have a relatively long genetic distance, while some with great phenotypic differences have relatively short genetic distances. For example, accessions ‘73’ and ‘74’, both of which had single white flowers, were very distantly related, while accessions ‘40’ and ‘75’, one purplish red double and one white single, were particularly closely related. This also indicated that there was no direct relationship between the relative distance and the color of the accessions.
3.3. Genetic Diversity Based on the cpDNA
The accD-psaI, psbE-petL and petB-petD fragments of three chloroplast non-coding regions were used to detect 80 accessions. After combination, the total length of the three fragments was 1580 bp. A total of 4 mutation sites were detected in the combined fragment, all of which were single base mutations and corresponding to three haplotypes. The petB-petD fragment had 2 variation loci, the other two fragments were each one, respectively (Table 7). According to the calculation results of the three combined fragments by DnaSP 5.0, the total Hd was 0.164 and Pi was 0.28 × 10⁻³.
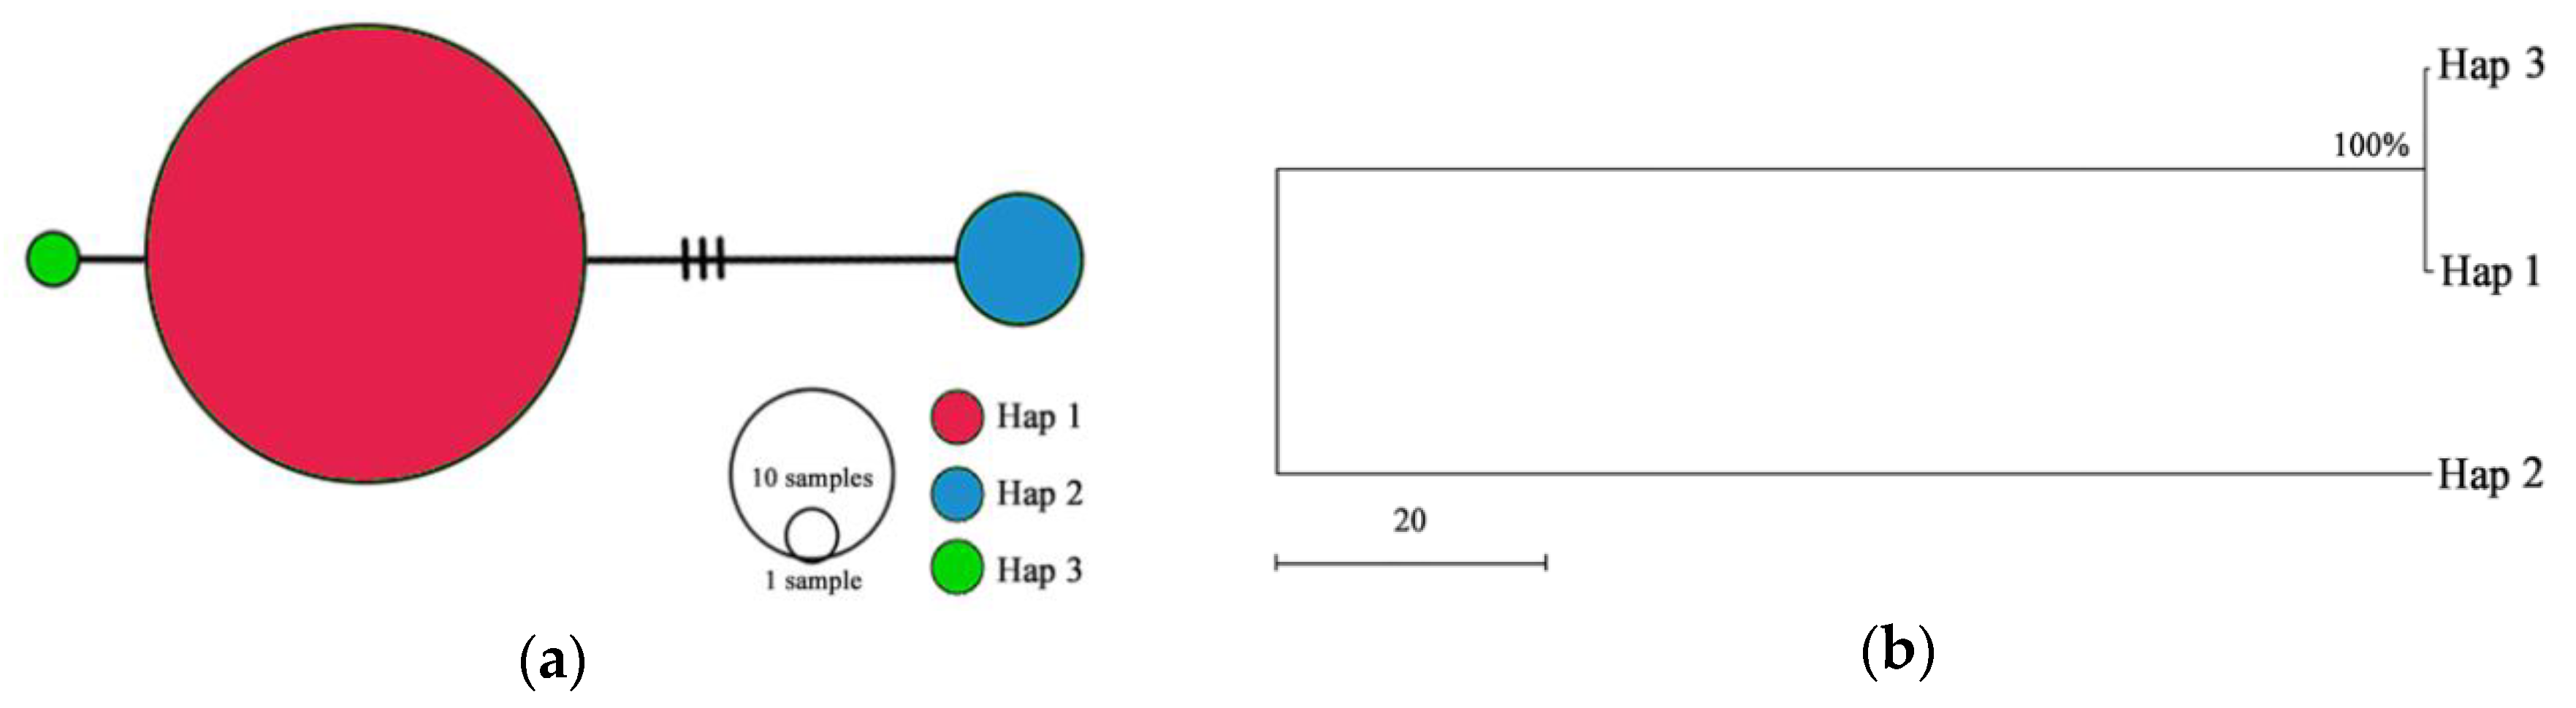
In the haplotype spectrum diagram (Figure 5a), Haplotype 1 was located in the center of the network, which was an obvious widespread haplotype. It appeared in 73 accessions, which may be the original haplotype. Haplotype 2 and 3 contained 6 and 1 accessions, which were ‘98’, ‘120’, ‘140’, ‘146’, ‘150’, ‘187’ and ‘128’, respectively. According to Figure 5a, Haplotype 1 was closer to Haplotype 3 than Haplotype 2, showing the same result with phylogenetic relationship of 3 haplotypes (Figure 5b). Three haplotypes were clustered into two branches in the tree, and Haplotype 2 formed a single branch.
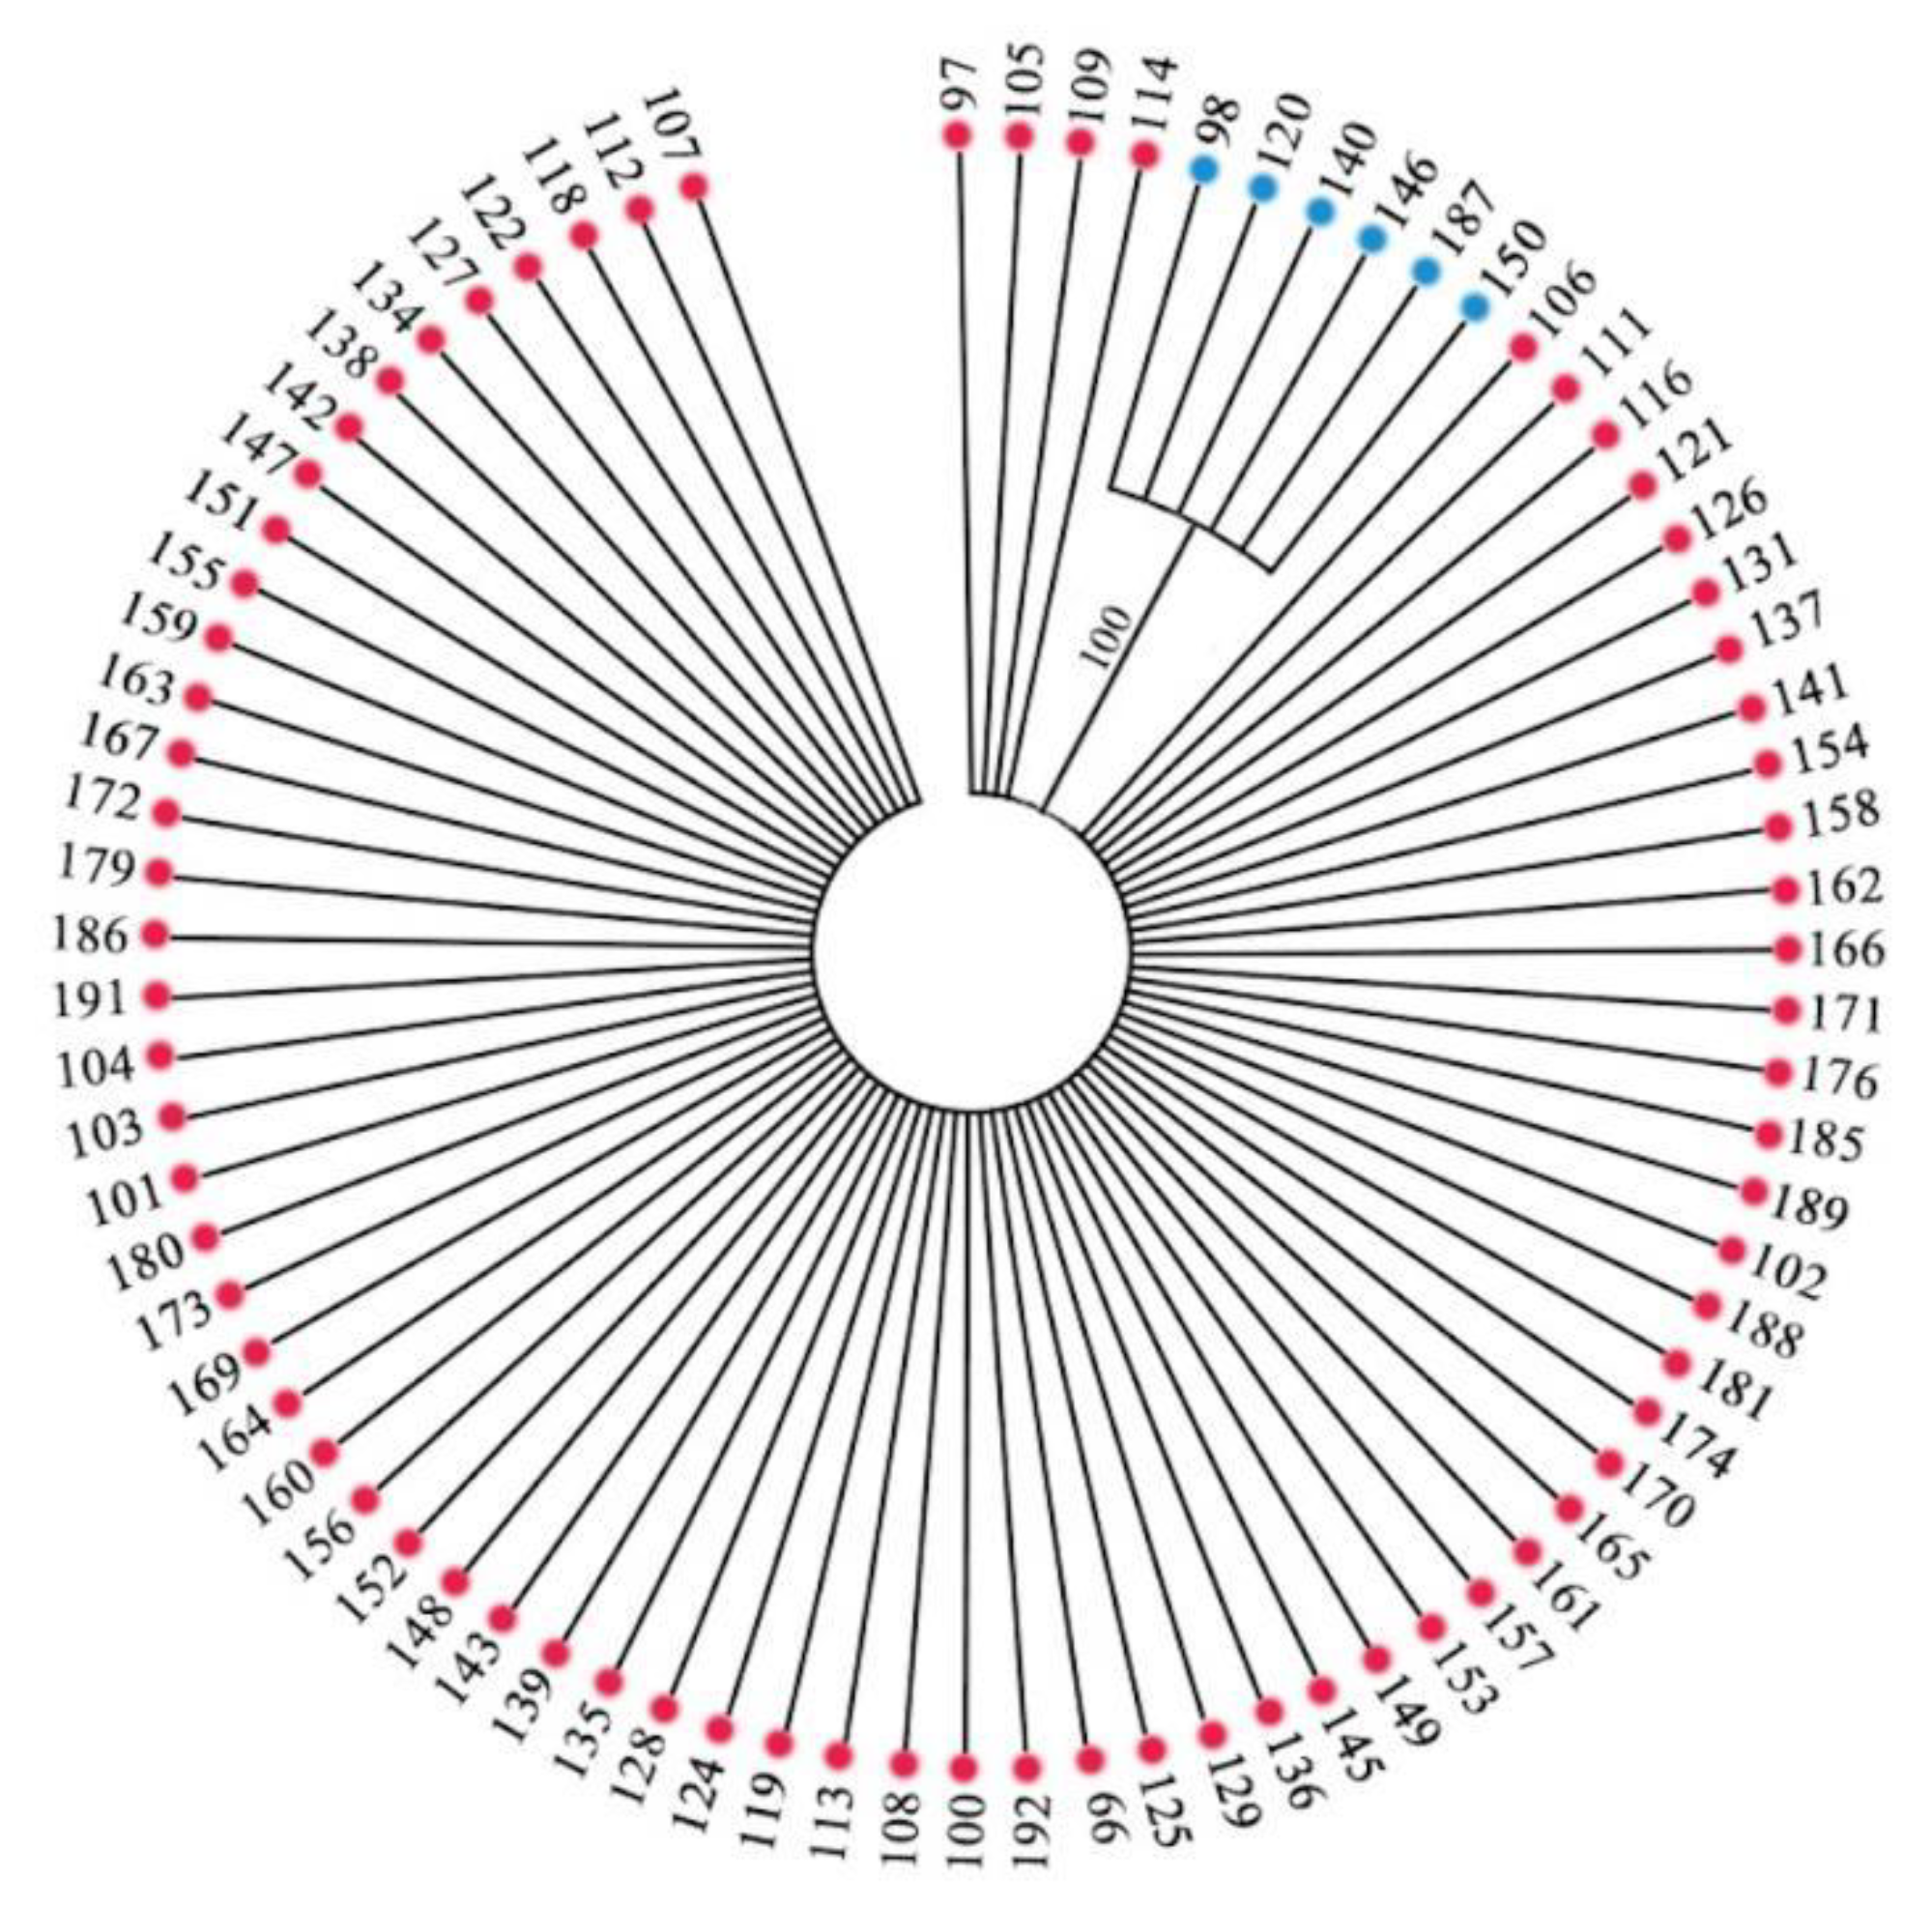
Meanwhile, phylogenetic trees were constructed for the sequences of 80 accessions. The accessions were divided into two distinct branches (Figure 6). The first branch consisted of 6 germplasms of Haplotype 2, including ‘98’, ‘120’, ‘140’, ‘146’, ‘150’ and ‘187’, and the second branch consisted of 74 accessions of Haplotype 1 and Haplotype 3, which also indicated that the phylogenetic relationship of Haplotype 1 and 3 were closer than that of Haplotype 2.
4. Discussion
4.1. Diversity of Phenotypic Traits
Because the phenotype is the result of the interaction of genotype and external environment and the diversity of phenotypic traits is the manifestation of genotype difference in morphology, the phenotypic variation in the population mainly depends on the genotype difference when all accessions used in this study were grown in the same condition. In FTP, Pang et al. [59] reported phenotypic variation coefficients ranging from 10% to 30% based on 32 traits of 150 accessions, but Wu et al. [60], on the diversity of 29 quantitative traits of 462 accessions, found that the coefficient of genetic variation was 9.52–112.1%. By the genetic diversity of 28 quantitative traits of 180 accessions, this study revealed a genetic variation coefficient of 12.33–108.73%, which was similar to Wu et al. [60]. As the plants used both by Wu et al. and by this study are widely selected and collected from the main cultivation area of the FTP, Gansu province (Figure 2), we felt that the accession population of this study should be large enough to represent the overall situation of FTP as a germplasm resource. Moreover, each accession collected in this study has been clonally propagated and most of them were named as the cultivars (Supplementary Table S1) and can be released into the industry as crop germplasm resources.
Studies on phenotypic variation can not only improve our understanding of the biological basis of plants, but also have very important breeding value [61]. In FTP used in this study, the fact that the number of petals varied from 9 petals to 238.33 petals (Table 4) indicates that these accessions have diverse flower types, from single through to semi-double to double [1]. Such various flower types are really valuable for breeding new cultivars for ornamental plants like tree peonies. Moreover, the tree peonies have been recently developed rapidly as an emerging oil crop and the selection of high-yield accessions has become very crucial for increasing cultivation. Among the accessions used in this study, some of them with single flower, in most cases, are fertile for the formation of fruits (seeds) and can be screened as the high-yield oil germplasms, in which the maximum fruit weight per plant was up to 2661.64 g (Table 4).
4.2. Genetic Diversity Based on SSR Markers
The primary task of evaluating all kinds of samples in germplasm resources is to determine their genetic constitution in the repository. We can also compare newly collected cultivated or wild plants from various locations with existing germplasm accessions to facilitate identification. With the advent of molecular technologies and methods, it has become more efficient and scientific to use genetic information at the genome level to analyze accession differences in genetic resources and compare these samples with germplasm collections elsewhere [62].
This study detected a total of 185 alleles in 34 pairs of EST-SSR primers in 282 FTP accessions, and the average number of different alleles (Na) was 5.441 (Table 2), which was smaller than in 20 populations (Na = 9.15) of 335 P. rockii wild individuals [29], but larger than in 40 pairs of primers in 462 P. rockii seedlings (Na = 4.5) [38]. Such differences might be caused by the different primers used in the different studies, but it was very clear that the wild germplasm resources of P. rockii do have more abundant allele variation than that of cultivated FTP. The average inbreeding coefficients (FIS) was negative, and the expected heterozygosity (He) of 22 pairs of primers was lower than the observed heterozygosity (Ho) (Table 2), indicating that there was a surplus of heterozygotes in this FTP population [29]. Yuan et al. [63] believed that the higher observed heterozygote meant higher diversity of the population, as their results showed that the wild P. rockii (Ho = 0.475) has significant diversity compared to CTP (Ho = 0.61) and FTP (Ho = 0.58). In FTP used in this study, the observed heterozygote was 0.537, which was larger in wild P. rockii (Ho = 0.475) but smaller in CTP (Ho = 0.61), and closer to FTP of Yuan et al. (Ho = 0.58). This study by Neighbor-joining tree based on microsatellite analysis identified the 282 FTP accessions into three distinct groups and there was no direct relationship between the genetic distance and the flower color. The grouping was consistent with the studies on 335 wild P. rockii individuals of 20 populations and 462 P. rockii seedlings, which were also divided into three groups [29,38]. Guo et al. [64] used SRAP to classify 16 accessions of P. suffruticosa, which also indicated that the genetic distance had no correlation with the color: white, green, yellow and black accessions formed a group, while blue, pink and/or multi-colored flowers formed another group.
To sum up, SSR data showed that the number of alleles for FTP used in this study was less than that of wild P. rockii, but more than that of cultivated P. rockii seedlings. The heterozygosity of FTP is less than that of CTP, larger than that of wild P. rockii, and close to that of cultivated P. rockii seedlings. This also showed that wild plants have abundant allele variation but low population heterozygosity, and cultivated germplasm have less allele variation but high population heterozygosity, which just indicates that gene exchange is more frequent and more heterozygosity is retained artificially under cultivation conditions [65]. Most woody perennial species are obligately outcrossing, resulting in high heterozygosity [66]. The longer the culture history of tree peony, the higher the heterozygous, and these individuals maintained high heterozygosity by asexual reproduction or clonal propagation under cultivation conditions. The FTP accessions were divided into three groups, which were consistent with the wild P. rockii and cultivated P. rockii seedlings. So, we speculate that the germplasm resources of FTP in this study, to a large extent, can represent the genetic background information of species tree peony P. rockii germplasm.
4.3. Genetic Diversity Based on the cpDNA
According to Yuan et al. [28], the mean nucleotide haplotype diversity (Hd) and the mean nucleotide diversity (Pi) of the chloroplast (cpDNA) in 335 P. rockii wild individuals at the population level was 0.0686 and 0.765 × 10⁻⁴ respectively, while Hd and Pi at the species level was 0.887 and 0.185 × 10⁻², which was significantly higher than population level. Based on the analysis of three cpDNA sequences, Xu et al. [37] measured the diversity of 214 individuals in 24 populations of P. rockii and obtained the same results as Hd and Pi at the species level, 0.874 and 0.294 × 10⁻², which were significantly higher than Hd (0.1097) and Pi (0.383 × 10⁻⁴) at the population level. This shows that wild P. rockii has a low genetic diversity at the population level and a higher genetic diversity at the species level. This situation was consistent with other tree peony species, P. delavayi [33], P. ludlowii [33], P. qiui [37] and P. jishanensis [37]. However, Hd and Pi in FTP accessions in this study were 0.164 and 0.28 × 10⁻³, which were higher than the population level and lower than the species level in populations of wild P. rockii. Considering these accessions as a population to compare with wild P. rockii, we found that the genetic diversity of the FTP under cultivation conditions is really different from its ancestor species in the habitats in forming genetic diversity or evolution. This is probably because wild plants of P. rockii reproduce by seeds in the same population, while gene exchange does not occur due to geographical isolation between populations. The chloroplast diversity of all individuals in the same population was lower, while it was higher at the species level because each population has distinct haplotypes. In this study, the accessions of FTP were selected and collected from various places of Gansu province without geographic isolation, and gene exchange may have occurred during the formation of germplasms through repeated hybridization, which finally resulted in a higher chloroplast diversity at the population level after long cultivation.
Meanwhile, based on the results of phylogenetic tree of chloroplast gene fragments (Figure 6) and haplotype spectrum (Figure 5b) analysis, the existing spatial genetic structure of the FTP can be divided into two branches, which was consistent with Yuan et al. [27] using chloroplast fragment to divide the genetic structure of wild P. rockii into two branches.
4.4. Conversation and Utilization of FTP Germplasm Accessions
Research on genetic diversity and structure is the theoretical basis for the protection and utilization of species. One of the goals of species protection is to maximize the conservation of genetic diversity of the species [67,68]. The accessions we investigated have abundant phenotypic variations and represent FTP germplasm, from which we have selected to name some cultivars for ornamental oil uses. The next step is to establish multi-site repositories and a multi-year, comprehensive phenotypic database of FTP germplasm resources. Germplasm accessions are crucial resources for studying crucial characteristics like plant resistance and flowering time through multi-year and multi-site observations. Similarly, using these germplasms to study phenotypic variation may be significant to researching phenotypic limberness as they react to changing climatic and different living environments.
With the results from SSR and cpDNA analysis, the FTP accessions can represent the genetic background information of P. rockii germplasm resources and have relatively high genetic diversity. In order to protect this diversity, a germplasm resource bank should be established to conserve as many accessions as possible. Analysis of chloroplast sequence variation showed that three haplotypes were found in 80 accessions. One haplotype consists of 73 accessions, but the other two haplotypes only consist of six and one, respectively. This suggests that the presence of seven accessions is closely related to the genetic diversity of P. rockii germplasms, and their disappearance will bring about an irreversible loss of diversity. Therefore, special protection should be given to these unique accessions.
Due to the rapid change of global climate caused by human activities, the selection pressure of woody ornamental plant commercialization is increasing, and the diversity of existing germplasm resources has more important breeding value [69]. As a kind of high-quality germplasm resource with strong resistance, high ornamental value and great potential for oil use, P. rockii accessions play an important role in the improvement of tree peony. At the level of DNA, this cultivated P. rockii population we have established can represent the basic level of P. rockii germplasm resources. In terms of phenotypic diversity, the variation of each trait is also extremely rich. Therefore, the value of these accessions is especially obvious for breed improvement and development of tree peonies. Meanwhile, the germplasm resources contain various plant genetic resources, which is of great significance to the basic research of plant biology. In order to explore the potential excellent characters within these accessions, we are required to continue to explore the phenotypes, genotypes and preservation of these resources. In this study, we planted these accessions from the traditional cultivation area of Gansu province to Beijing. It is necessary to continuously observe and measure these characters to explore the adaptability of the FTP to the different environment. Ultimately, germplasm collections should not simply be viewed as tools for conservation, but as resources with unique benefits that hold immense value for sustaining the future of woody perennials and their wild relatives. The comprehensive evaluation and utilization of these cultivated accessions is to protect the germplasm of P. rockii tree peony and its derivatives.
5. Conclusions
This study is the first to analyze the genetic diversity of FTP accessions newly selected by us using phenotypic traits, EST-SSR markers and chloroplast DNA sequences. Phenotypic data indicated that these accessions have abundant phenotypic variations and are representative of woody peony P. rockii germplasm. SSR data showed that the FTP accessions used in this study had relatively high genetic diversity and were composed of three distinct groups, like their wild relatives. The cpDNA data indicated that the genetic diversity of chloroplast genome in the FTP accessions had a higher genetic diversity than the population level and a lower genetic diversity than the species level of wild P. rockii, and they can be divided into two branches based on this. The FTP accessions fully reflected the genetic diversity and current situation of species tree peony P. rockii germplasm to a large extent, so they can be regarded as the core germplasm resources and their protection and utilization will be of great significance both for genetic improvement and biological studies of tree peonies and for sustaining development of the peony industry.
Supplementary Materials
The following are available online at https://www.mdpi.com/1999-4907/11/6/672/s1: Table S1: The numbers, names, flower colors and grouping results of 282 accessions.
Author Contributions
Conceptualization, X.G. and F.C.; validation, X.G. and F.C.; formal analysis, X.G.; investigation, X.G.; data curation, X.G.; writing—original draft preparation, X.G.; writing—review and editing, X.G., F.C. and Y.Z.; visualization, X.G.; supervision, F.C.; project administration, F.C. All authors have read and agreed to the published version of the manuscript.
Funding
This research was funded by the National High Technology Research and Development Program of China, grant number 2011AA100207 and the Science and Technology Project of Beijing, grant number Z181100002518001.
Acknowledgments
We would like to thank Xinyun Cheng and Xiwen Tao for their efforts in maintaining living plant materials for this study.
Conflicts of Interest
The authors declare no conflict of interest. In this study, Beijing Guose Peony Technologies Co., Ltd. carried out the collection and management of plant materials.
References
- Cheng, F.Y.; Li, J.J.; Chen, D.Z.; Zhang, Z.S. Chinese Paeonia rockii; Chinese Forestry Publishing House: Beijing, China, 2005; pp. 20–30. [Google Scholar]
- Han, P.; Ruan, C.J.; Ding, J.; Wu, B.; Zhang, W.C.; Ruan, D.; Xiong, C.W.; Liu, W.H.; Wang, G.H. Polygene regulation of high accumulation of carbon 18 unsaturated fatty acids in seeds of Paeonia suffruticosa. Mol. Plant Breed. 2019, 17, 2101–2108. (In Chinese) [Google Scholar]
- Cheng, F.Y. Advances in the breeding of tree peonies and a cultivar system for the cultivar group. Int. J. Plant Breed. 2007, 1, 90–104. [Google Scholar]
- Cheng, F.Y.; Yu, X.N. Flare tree peonies (Paeonia rockii hybrids) and the origin of the cultivar group. Acta Horticulturae 2008, 766, 375–382. [Google Scholar] [CrossRef]
- Li, J.J. Chinese Tree Peony (Xibei, Xinan, Jiangnan Volume); Chinese Forestry Publishing House: Beijing, China, 2005; pp. 73–82. [Google Scholar]
- Zhang, Q.Y.; Niu, L.X.; Yu, R.; Zhang, X.X.; Bai, Z.Z.; Duan, K.; Gao, Q.H.; Zhang, Y.L. Cloning, characterization, and expression analysis of a gene encoding a putative lysophosphatidic acid acyltransferase from seeds of Paeonia rockii. Appl. Biochem. Biotech. 2017, 182, 721–741. [Google Scholar] [CrossRef]
- Shi, Q.Q.; Li, L.; Zhang, X.X.; Luo, J.R.; Li, X.; Zhai, L.J.; He, L.X.; Zhang, Y.L. Biochemical and Comparative Transcriptomic Analyses Identify Candidate Genes Related to Variegation Formation in Paeonia rockii. Molecules 2017, 22, 1364. [Google Scholar] [CrossRef] [Green Version]
- Zhang, Q.Y.; Yu, R.; Sun, D.Y.; Bai, Z.Z.; Li, H.; Xue, L.; Zhang, Y.L.; Niu, L.X. PrLPAAT4, a putative lysophosphatidic acid acyltransferase from Paeonia rockii, plays an important role in seed fatty acid biosynthesis. Molecules 2017, 22, 1694. [Google Scholar] [CrossRef]
- Cui, H.L.; Chen, C.R.; Huang, N.Z.; Cheng, F.Y. Association analysis of yield, oil and fatty acid content, and main phenotypic traits in Paeonia rockii as an oil crop. J. Hortic. Sci. Biotechnol. 2017, 93, 425–432. [Google Scholar] [CrossRef]
- Shi, Q.Q.; Zhang, X.X.; Li, X.; Zhai, L.J.; Luo, X.N.; Luo, J.R.; He, L.X.; Zhang, Y.L.; Li, L. Identification of microRNAs and their targets involved in Paeonia rockii petal variegation using high-throughput sequencing. J. Am. Soc. Hortic. Sci. 2019, 144, 118–129. [Google Scholar] [CrossRef] [Green Version]
- Liu, N.; Cheng, F.Y.; Zhong, Y.; Guo, X. Comparative transcriptome and coexpression network analysis of carpel quantitative variation in Paeonia rockii. BMC Genomics 2019, 20, 683. [Google Scholar] [CrossRef] [Green Version]
- Soltis, P.S.; Soltis, D.E. Genetic variation in endemic and widespread plant species. Aliso J. Syst. Evolut. Bot. 1991, 13, 215–223. [Google Scholar] [CrossRef] [Green Version]
- Wang, X.Q. Studies on Genetic Diversity of Paeonia delavayi in Shangri-la. Ph.D. Thesis, Beijing Forestry University, Beijing, China, 2009. Available online: https://kns.cnki.net/KCMS/detail/detail.aspx?dbcode=CDFD&dbname=CDFD0911&filename=2009134629.nh&v=MTA1MDExMjdGN0s3R3RmT3BwRWJQSVI4ZVgxTHV4WVM3RGgxVDNxVHJXTTFGckNVUjdxZlplUnFGQ25sVzd2S1Y= (accessed on 12 June 2020). (In Chinese).
- Wang, J. Genetic Diversity of Paeonia ostii and Germplasm Resources of Tree Peony Cultivars from Chinese Jiangnan Area. Ph.D. Thesis, Beijing Forestry University, Beijing, China, 2009. (In Chinese). [Google Scholar]
- Peng, L.P.; Cheng, F.Y.; Zhong, Y.; Xu, X.X.; Xian, H.L. Phenotypic variation in cultivar populations of Paeonia ostii. Plant Sci. J. 2018, 36, 170–180. (In Chinese) [Google Scholar]
- Li, Z.Y.; Zhang, H.Y. Morphological variation and diversity in populations of Paeonia lutea. J. Northwest. For. Univ. 2011, 26, 117–122. (In Chinese) [Google Scholar]
- Li, B.Y. Studies on Genetic Diversity and Construction of Core Collection of the Tree Peony Cultivars from Chinese Central Plains. Ph.D. Thesis, Beijing Forestry University, Beijing, China, 2007. (In Chinese). [Google Scholar]
- Yuan, T.; Wang, L.Y. Discussion on the origination of Chinese tree-peony cultivars according to pollen grain morphology. J. Beijing Fore. Univ. 2002, 24, 5–11. (In Chinese) [Google Scholar]
- Zhou, B.; Jiang, H.D.; Zhang, X.X.; Xue, J.Q.; Shi, Y.T. Morphological diversity of some introduced tree peony cultivars. Biodiv. Sci. 2011, 19, 543–550. (In Chinese) [Google Scholar] [CrossRef]
- Hosoki, T.; Kimura, D.; Hasegawa, R.; Nagasako, T.; Nishimoto, K.; Ohta, K.; Sugiyama, M.; Haruki, K. Comparative study of Chinese tree peony cultivars by random amplified polymorphic DNA (RAPD) analysis. Sci. Hortic. 1997, 70, 67–72. [Google Scholar] [CrossRef]
- Yu, H.P.; Cheng, F.Y.; Zhong, Y.; Cai, C.F.; Wu, J.; Cui, H.L. Development of simple sequence repeat (SSR) markers from Paeonia ostii to study the genetic relationships among tree peonies (Paeoniaceae). Sci. Hortic. 2013, 164, 58–64. [Google Scholar] [CrossRef]
- Wang, X.W.; Fan, H.M.; Li, Y.Y.; Sun, X.; Sun, X.Z.; Wang, W.L.; Zheng, C.S. Analysis of genetic relationships in tree peony of different colors using conserved DNA-derived polymorphism markers. Sci. Hortic. 2014, 175, 68–73. [Google Scholar] [CrossRef]
- Suo, Z.L.; Li, W.Y.; Yao, J.; Zhang, H.J.; Zhang, Z.M.; Zhao, D.X. Applicability of leaf morphology and intersimple sequence repeat markers in classification of tree peony (Paeoniaceae) cultivars. Hortscience 2005, 40, 329–334. [Google Scholar] [CrossRef] [Green Version]
- Zhang, J.J.; Shu, Q.Y.; Liu, Z.A.; Ren, H.X.; Wang, L.S.; De Keyser, E. Two EST-derived marker systems for cultivar identification in tree peony. Plant Cell Rep. 2012, 31, 299–310. [Google Scholar] [CrossRef]
- Duan, Y.B.; Guo, D.L.; Guo, L.L.; Wei, D.F.; Hou, X.G. Genetic diversity analysis of tree peony germplasm using iPBS markers. Genet. Mol. Res. 2015, 14, 7556–7566. [Google Scholar] [CrossRef]
- Suo, Z.L.; Zhang, C.H.; Zheng, Y.Q.; He, L.X.; Jin, X.B.; Hou, B.X.; Li, J.J. Revealing genetic diversity of tree peonies at micro-evolution level with hyper-variable chloroplast markers and floral traits. Plant Cell Rep. 2012, 31, 2199–2213. [Google Scholar] [CrossRef] [PubMed]
- Yuan, J.H.; Cheng, F.Y.; Zhou, S.L. Hybrid origin of Paeonia × yananensis revealed by microsatellite markers, chloroplast gene sequences, and morphological characteristics. Int. J. Plant Sci. 2010, 171, 409–420. [Google Scholar] [CrossRef]
- Yuan, J.H.; Cheng, F.Y.; Zhou, S.L. The phylogeographic structure and conservation genetics of the endangered tree peony, Paeonia rockii (Paeoniaceae), inferred from chloroplast gene sequences. Conserv. Genet. 2011, 12, 1539–1549. [Google Scholar] [CrossRef]
- Yuan, J.H.; Cheng, F.Y.; Zhou, S.L. Genetic structure of the tree peony (Paeonia rockii) and the Qinling Mountains as a geographic barrier driving the fragmentation of a large population. PLoS ONE 2012, 7, e34955. [Google Scholar] [CrossRef] [PubMed] [Green Version]
- Ren, X.X.; Zhang, Y.; Xue, J.Q.; Zhu, F.Y.; Shi, F.R.; Wang, S.L.; Zhang, X.X. Genetic diversity analysis of natural populations in Paeonia delavayi. J. Plant Gen. Res. 2015, 16, 772–780. (In Chinese) [Google Scholar]
- Tang, Q.; Zeng, X.L.; Liao, M.A.; Pan, G.T.; Zha, X.; Gong, J.H.; Ci Ren, Z.G. SRAP analysis of genetic diversity of Paeonia ludlowii in Tibet. Sci. Silva. Sin. 2012, 48, 70–76. (In Chinese) [Google Scholar]
- Zhang, J.M.; Liu, J.; Sun, H.L.; Yu, J.; Wang, J.X.; Zhou, S.L. Nuclear and chloroplast SSR markers in Paeonia delavayi (Paeoniaceae) and cross-species amplification in P. ludlowii. Am. J. Bot. 2011, 98, e346–e348. [Google Scholar] [CrossRef] [Green Version]
- Zhang, J.M.; López-Pujol, J.; Gong, X.; Wang, H.F.; Vilatersana, R.; Zhou, S.L. Population genetic dynamics of Himalayan-Hengduan tree peonies, Paeonia subsect. Delavayanae. Mol. Phylogenet. Evol. 2018, 125, 62–77. [Google Scholar] [CrossRef] [Green Version]
- Tong, F.; Xie, D.F.; Zeng, X.M.; He, X.J. Genetic diversity of Paeonia decomposita and Paeonia decomposita subsp. rotundiloba detected by ISSR markers. Acta Bot. Boreal.-Occident. Sin. 2016, 36, 1968–1976. (In Chinese) [Google Scholar]
- Xu, X.X.; Cheng, F.Y.; Xian, H.L.; Peng, L.P. Genetic diversity and population structure of endangered endemic Paeonia jishanensis in China and conservation implications. Biochem. Syst. Ecol. 2016, 66, 319–325. [Google Scholar] [CrossRef]
- Peng, L.P.; Cai, C.F.; Zhong, Y.; Xu, X.X.; Xian, H.L.; Cheng, F.Y.; Mao, J.F. Genetic analyses reveal independent domestication origins of the emerging oil crop Paeonia ostii, a tree peony with a long-term cultivation history. Sci. Rep. 2017, 7, 5340–5352. [Google Scholar] [CrossRef] [PubMed] [Green Version]
- Xu, X.X.; Cheng, F.Y.; Peng, L.P.; Sun, Y.Q.; Hu, X.G.; Li, S.Y.; Xian, H.L.; Jia, K.H.; Abbott, R.J.; Mao, J.F. Late Pleistocene speciation of three closely related tree peonies endemic to the Qinling-Daba Mountains, a major glacial refugium in Central China. Ecol. Evol. 2019, 9, 7528–7548. [Google Scholar] [CrossRef] [PubMed]
- Wu, J.; Cheng, F.Y.; Cai, C.F.; Zhong, Y.; Jie, X. Association mapping for floral traits in cultivated Paeonia rockii based on SSR markers. Mol. Genet. Genom. 2016, 292, 187–200. [Google Scholar] [CrossRef] [PubMed]
- Weber, J.L.; May, P.E. Abundant class of human DNA polymorphisms which can be typed using the polymerase chain reaction. Am. J. Hum. Genet. 1989, 44, 388–396. [Google Scholar] [PubMed]
- Dumolin, S.; Demesure, B.; Petit, R.J. Inheritance of chloroplast and mitochondrial genomes in pedunculate oak investigated with an efficient PCR method. Theor. Appl. Genet. 1995, 91, 1253–1256. [Google Scholar] [CrossRef]
- Comes, H.P.; Kadereit, J.W. The effect of Quaternary climatic changes on plant distribution and evolution. Trends Plant Sci. 1998, 3, 1360–1385. [Google Scholar] [CrossRef]
- Qiu, Y.X.; Fu, C.X.; Comes, H.P. Plant molecular phylogeography in China and adjacent regions: Tracing the genetic imprints of Quaternary climate and environmental change in the world’s most diverse temperate flora. Mol. Phylogenet. Evol. 2011, 59, 225–244. [Google Scholar] [CrossRef]
- Cheng, Y.P.; Hwang, S.Y.; Lin, T.P. Potential refugia in Taiwan revealed by the phylogeographical study of Castanopsis carlesii Hayata (Fagaceae). Mol. Ecol. 2005, 14, 2075–2085. [Google Scholar] [CrossRef]
- Cai, C.F. High-Density Genetic Linkage Map Construction and QTLs Analyses for Phenotypic Traits in Tree Peony. Ph.D. Thesis, Beijing Forestry University, Beijing, China, 2015. (In Chinese). [Google Scholar]
- Wu, J.; Cai, C.F.; Cheng, F.Y.; Cui, H.L.; Zhou, H. Characterisation and development of EST-SSR markers in tree peony using transcriptome sequences. Mol. Breed. 2014, 34, 1853–1866. [Google Scholar] [CrossRef]
- Bousquet, J.; Strauss, S.H.; Doerksen, A.H.; Price, R.A. Extensive variation in evolutionary rate of rbcL gene sequences among seed plants. Proc. Natl. Acad. Sci. USA 1992, 89, 7844–7848. [Google Scholar] [CrossRef] [Green Version]
- Gaut, B.S.; Muse, S.V.; Clark, Z.W.D.; Clegg, M.T. Relative rates of nucleotide substitution at the rbcl locus of monocotyledonous plants. J. Mol. Evol. 1992, 35, 292–303. [Google Scholar] [CrossRef]
- Baker, W.J.; Hedderson, T.A.; Dransfield, J. Molecular phylogenetics of subfamily Calamoideae (Palmae) based on nrDNA ITS and cpDNA rps16 intron sequence data. Mol. Phylogenet. Evol. 2000, 14, 195–217. [Google Scholar] [CrossRef] [PubMed] [Green Version]
- Grivet, D.; Heinze, B.; Vendramin, G.G.; Petit, R.J. Genome walking with consensus primers application to the large single copy region of chloroplast DNA. Mol. Ecol. Notes 2001, 1, 345–349. [Google Scholar] [CrossRef]
- Davis, J.W. Handbook of univariate and multivariate data analysis and interpretation with SPSS; CRC Press: Boca Raton, FL, USA, 2008. [Google Scholar] [CrossRef]
- Peakall, R.; Smouse, P.E. GenAlEx 6.5: Genetic analysis in Excel. Population genetic software for teaching and research—An update. Bioinformatics 2012, 28, 2537–2539. [Google Scholar] [CrossRef] [PubMed] [Green Version]
- Rousset, F. Genepop’007: A complete re-implementation of the genepop software for Windows and Linux. Mol. Ecol. Resour. 2008, 8, 103–106. [Google Scholar] [CrossRef]
- Kumar, S.; Stecher, G.; Li, M.; Knyaz, C.; Tamura, K.; Battistuzzi, F.U. MEGA X: Molecular evolutionary genetics analysis across computing platforms. Mol. Biol. Evol. 2018, 35, 1547–1549. [Google Scholar] [CrossRef]
- Katoh, K.; Misawa, K.; Kuma, K.-i.; Miyata, T. MAFFT a novel method for rapid multiple sequence alignment based on fast Fourier transform. Nucleic Acids Res. 2002, 30, 3059–3066. [Google Scholar] [CrossRef] [Green Version]
- Vaidya, G.; Lohman, D.J.; Meier, R. SequenceMatrix: Concatenation software for the fast assembly of multi-gene datasets with character set and codon information. Cladistics 2011, 27, 171–180. [Google Scholar] [CrossRef]
- Librado, P.; Rozas, J. DnaSP v5: A software for comprehensive analysis of DNA polymorphism data. Bioinformatics 2009, 25, 1451–1452. [Google Scholar] [CrossRef] [Green Version]
- Leigh, J.W.; Bryant, D.; Nakagawa, S. Popart: Full-feature software for haplotype network construction. Methods Ecol. Evol. 2015, 6, 1110–1116. [Google Scholar] [CrossRef]
- Swofford, D.L. Paup*: Phylogenetic Analysis Using Parsimony (*and other Methods); Version 4; Sinauer: Sunderland, MA, USA, 2003; pp. 233–234. [Google Scholar]
- Pang, L.Z.; Cheng, F.Y.; Zhong, Y.; Cai, C.F.; Cui, H.L. Phenotypic analysis of association population for flare tree peony. J. Beijing Fore. Univ. 2012, 34, 115–120. (In Chinese) [Google Scholar]
- Wu, J. Dissection of Allelic Variation Underling Imoortant Traits in Paeonia rockii by Using Association Mapping. Ph.D. Thesis, Beijing Forestry University, Beijing, China, 2016. (In Chinese). [Google Scholar]
- Warschefsky, E.; Penmetsa, R.V.; Cook, D.R.; Von Wettberg, E.J.B. Back to the wilds: Tapping evolutionary adaptations for resilient crops through systematic hybridization with crop wild relatives. Am. J. Bot. 2014, 101, 1791–1800. [Google Scholar] [CrossRef]
- Bernard, A.; Lheureux, F.; Dirlewanger, E. Walnut: Past and future of genetic improvement. Tree Genet. Genomes 2017, 14, 1–28. [Google Scholar] [CrossRef] [Green Version]
- Yuan, J.H.; Cornille, A.; Giraud, T.; Cheng, F.Y.; Hu, Y.H. Independent domestications of cultivated tree peonies from different wild peony species. Mol. Ecol. 2014, 23, 82–95. [Google Scholar] [CrossRef] [PubMed]
- Guo, D.L.; Hou, X.G.; Zhang, J. Sequence-related amplified polymorphism analysis of tree peony (Paeonia suffruticosa Andrews) cultivars with different flower colours. J. Hortic. Sci. Biotechnol. 2015, 84, 131–136. [Google Scholar] [CrossRef]
- Nielsen, R. Molecular signatures of natural selection. Annu. Rev. Genet. 2005, 39, 197–218. [Google Scholar] [CrossRef] [PubMed] [Green Version]
- Miller, A.J.; Gross, B.L. From forest to field: Perennial fruit crop domestication. Am. J. Bot. 2011, 98, 1389–1414. [Google Scholar] [CrossRef] [PubMed] [Green Version]
- Margules, C.R.; Pressey, R.L. Systematic conservation planning. Nature 2000, 405, 243–253. [Google Scholar] [CrossRef]
- Rodrigues, L.; van den Berg, C.; Póvoa, O.; Monteiro, A. Low genetic diversity and significant structuring in the endangered Mentha cervina populations and its implications for conservation. Biochem. Syst. Ecol. 2013, 50, 51–61. [Google Scholar] [CrossRef]
- Migicovsky, Z.; Warschefsky, E.; Klein, L.L.; Miller, A.J. Using living germplasm collections to characterize, improve, and conserve woody perennials. Crop Sci. 2019, 59, 2365–2380. [Google Scholar] [CrossRef] [Green Version]
Figure 1.
The morphological characteristics of P. rockii plant: (a) P. rockii has more fragrant blossoms, and taller and stronger plants with more longevity, (b) there is a colored flare at the base of petals, and (c) with strong fertility, the ripe follicles contain a large number of seeds.
Figure 1.
The morphological characteristics of P. rockii plant: (a) P. rockii has more fragrant blossoms, and taller and stronger plants with more longevity, (b) there is a colored flare at the base of petals, and (c) with strong fertility, the ripe follicles contain a large number of seeds.

Figure 2.
Geographic origins of the flare tree peony (FTP) accessions used in this study. These accessions were selectively collected in the cultivation center (dotted area) of FTP in the middle of Gansu province where the blue dots represent the concrete places, and then propagated clonally and transplanted into the conservation site of Beijing (the green dot). The red dots represent Luoyang and Heze, the two traditional cultivation centers of common tree peony (CTP) in China.

Figure 3.
Principal component (PC) coordinate distribution of traits and accessions: (a) Distribution of 28 quantitative traits of the population on the PC-1 and PC-2 axis. The traits corresponding to the serial number are shown in Table 1. (b) Distribution of 180 accessions on the PC-1 and PC-2 axis.

Figure 4.
Relationships among 282 accessions: (a) Neighbor-Joining (NJ) phylogenetic tree based on the data of 34 EST-SSR markers, (b) Principal coordinates analysis (PCoA) based on Nei’s unbiased genetic distance.
Figure 4.
Relationships among 282 accessions: (a) Neighbor-Joining (NJ) phylogenetic tree based on the data of 34 EST-SSR markers, (b) Principal coordinates analysis (PCoA) based on Nei’s unbiased genetic distance.

Figure 5.
Analysis of cpDNA haplotypes: (a) Network of 3 cpDNA haplotypes (Hap 1–Hap 3), (b) Phylogenetic relationship of 3 haplotypes based on the Maximum Parsimony (MP) method analysis.
Figure 5.
Analysis of cpDNA haplotypes: (a) Network of 3 cpDNA haplotypes (Hap 1–Hap 3), (b) Phylogenetic relationship of 3 haplotypes based on the Maximum Parsimony (MP) method analysis.

Figure 6.
Strict consensus tree of 80 accessions using the Maximum Parsimony (MP) method (the numbers in the figure represent the number of the accessions).
Figure 6.
Strict consensus tree of 80 accessions using the Maximum Parsimony (MP) method (the numbers in the figure represent the number of the accessions).


Table 1.
Traits investigated of 180 accessions and the measurement standard.
| Type | Code | Trait | Measurement Standard |
|---|---|---|---|
| Floral trait | 1 | Petal length | The length of the outer petal (cm) |
| 2 | Petal width | The width of the outer petal (cm) | |
| 3 | Flare length | The length of flare (cm) | |
| 4 | Flare width | The width of flare (cm) | |
| 5 | Flower diameter | The maximum width of flower at full bloom (cm) | |
| 6 | Petal number | The number of petals in the whole flower (score) | |
| 7 | Carpel number | The number of carpels in the whole flower (score) | |
| Branch and leaf trait | 8 | Plant height | The aboveground height of the whole plant (cm) |
| 9 | East-west crown breadth | The width of a plant in the east-west direction (cm) | |
| 10 | North-south crown breadth | The width of a plant in the north-south direction (cm) | |
| 11 | Fruit number | The number of follicles per plant (score) | |
| 12 | Flower number | The number of flowers per plant (score) | |
| 13 | Tiller number | The number of branches at the base of a plant (score) | |
| 14 | Compound leaf length | The length from tip of compound leaf to petiole (cm) | |
| 15 | Compound leaf width | The length at widest part of compound leaf (cm) | |
| 16 | Petiole length | The length of petiole (cm) | |
| 17 | Leaflet number | The number of leaflets in a compound leaf (score) | |
| 18 | Terminal leaflet length | The length of terminal leaflet (cm) | |
| 19 | Terminal leaflet width | The width of terminal leaflet (cm) | |
| Fruit trait | 20 | Fruit weight per plant | The weight of fruits per plant (g) |
| 21 | Individual fruit weight | The weight of one fruit (g) | |
| 22 | Number of seeds per fruit | The number of seeds per fruit (score) | |
| 23 | Seed weight per fruit | The weight of seeds per fruit (g) | |
| 24 | Effective carpel number | The number of carpels that produce seeds (score) | |
| 25 | Fruit length | The length of a single carpel of mature follicles (mm) | |
| 26 | Fruit width | The width of a single carpel of mature follicles (mm) | |
| 27 | Fruit height | The height of a single carpel of mature follicles (mm) | |
| 28 | Pericarp thickness | The thickness of pericarp of mature follicles (mm) |
Table 2.
Characterization of 34 simple sequence repeat loci based on 282 accessions.
| Locus | Primer Sequence | Tm (°C) | Expected Size (bp) | Modified Type | Na | Ne | I | Ho | He | FIS | PIC | p |
|---|---|---|---|---|---|---|---|---|---|---|---|---|
| PS004 | F: GTGCTTAGCCTCTAATCTG R: CTTTGCTCCAAGTCTGTC | 50.5 | 274 | 5-FAM | 7 | 2.859 | 1.330 | 0.688 | 0.650 | −0.058 | 0.611 | 0.000 *** |
| PS026 | F: TTCCCTCCATTCTAACAC R: ACCCTAGCCTCTGACATT | 54 | 187 | 5-FAM | 5 | 1.761 | 0.715 | 0.475 | 0.432 | −0.100 | 0.358 | 0.000 *** |
| PS030 | F: ACCCTCCACCACCATCTT R: TACTCCATCTCGTGACCC | 57 | 237 | 5-HEX | 3 | 1.290 | 0.414 | 0.216 | 0.225 | 0.038 | 0.203 | 0.000 *** |
| PS047 | F: AGACGACGAGCAAAGATAT R: AAAGGGCAAGATTGGAAAT | 54 | 126 | 5-FAM | 4 | 1.643 | 0.735 | 0.397 | 0.391 | −0.015 | 0.356 | 0.343 ns |
| PS061 | F: CTCCTCCAACATTGACCC R: CACCCTCCCAAACATCTC | 57 | 154 | 5-FAM | 7 | 2.178 | 0.901 | 0.532 | 0.541 | 0.017 | 0.436 | 0.000 *** |
| PS068 | F: CTTTGGCATTCTCATTCA R: GGTGGTATTGGGCTTCTT | 52.5 | 174 | 5-FAM | 6 | 3.231 | 1.335 | 0.738 | 0.690 | −0.068 | 0.641 | 0.000 *** |
| PS073 | F: GTCGGTGAATGAAGGGTT R: ATTTCTGGTCAATGTGGC | 53.5 | 269 | 5-HEX | 5 | 2.066 | 0.780 | 0.574 | 0.516 | −0.113 | 0.400 | 0.000 *** |
| PS074 | F: TGCCTTGCTCCTCCTTGT R: CGGTTAGCCATGAATCCC | 57 | 236 | 5-HEX | 13 | 2.947 | 1.457 | 0.702 | 0.661 | −0.063 | 0.621 | 0.000 *** |
| PS095 | F: TCCCAAGACCTCAAACAAC R: CCATCAATACGAGCCAAC | 55 | 394 | 5-TAMRA | 9 | 5.394 | 1.857 | 0.819 | 0.815 | −0.006 | 0.792 | 0.000 *** |
| PS119 | F: GCAAAGACAACAGCCTCG R: CTCACCATCCAATCCCAC | 57 | 289 | 5-HEX | 4 | 3.627 | 1.331 | 0.745 | 0.724 | −0.028 | 0.673 | 0.000 *** |
| PS139 | F: CAACAATTTAACACGCAGAG R: GCCTTAGACGGAGACCAG | 56.5 | 482 | 5-FAM | 7 | 1.765 | 0.853 | 0.447 | 0.433 | −0.031 | 0.391 | 0.000 *** |
| PS144 | F: CAACCTACAATCCGACAATG R: CGACTTCCCTTCAATACA | 54.5 | 317 | 5-TAMRA | 6 | 1.378 | 0.553 | 0.273 | 0.274 | 0.005 | 0.252 | 0.000 *** |
| PS149 | F: AGTCGCCTCCTACACCTC R: TCCGTAAAGCCCACAATAC | 55.5 | 173 | 5-FAM | 5 | 1.777 | 0.798 | 0.426 | 0.437 | 0.027 | 0.391 | 0.741 ns |
| PS157 | F: CTCCCTGAACTCCCTACC R: CTTTCTAAACAGCCAACG | 56 | 322 | 5-TAMRA | 4 | 2.565 | 1.091 | 0.677 | 0.610 | −0.110 | 0.551 | 0.000 *** |
| PS158 | F: TTTCCCTGCTTCTTCTGAC R: CACCTCCTTCCTTTCTTACT | 55 | 423 | 5-ROX | 7 | 2.976 | 1.298 | 0.638 | 0.664 | 0.039 | 0.608 | 0.000 *** |
| PS159 | F: CCTCCATTCATTCCTGTC R: GCAATAAATAGCCGTCCT | 52 | 124 | 5-FAM | 11 | 2.384 | 1.134 | 0.567 | 0.581 | 0.023 | 0.506 | 0.000 *** |
| PS166 | F: TTCAGTGGGCAAGACCTAC R: TAGCCAATACAGAACAAACC | 55 | 337 | 5-TAMRA | 10 | 3.698 | 1.455 | 0.805 | 0.730 | −0.103 | 0.683 | 0.000 *** |
| PS180 | F: CCCCGAAATGGAGGAGTC R: AGGGCAGTAGCAGAAGAAAGTC | 60 | 188 | 5-FAM | 6 | 1.331 | 0.485 | 0.238 | 0.248 | 0.044 | 0.226 | 0.992 ns |
| PS187 | F: AAGCGGCGTCCATCATAC R: TCACAAGCCCAACCCAGA | 57 | 233 | 5-HEX | 4 | 2.399 | 1.000 | 0.784 | 0.583 | −0.344 | 0.498 | 0.000 *** |
| PS221 | F: GATACAAGGCGGAAAGTG R: AGAGTTGGGAACCAGACC | 56 | 301 | 5-TAMRA | 5 | 2.488 | 1.007 | 0.823 | 0.598 | −0.375 | 0.514 | 0.000 *** |
| PS260 | F: ATTCACGCCAGTATCAAAG R: TGTAAATGCCCATGTCTAG | 53 | 349 | 5-TAMRA | 2 | 1.595 | 0.560 | 0.376 | 0.373 | −0.007 | 0.304 | 0.905 ns |
| PS265 | F: TTTTATGGGTCCTGTTGC R: GAAGAGTAAGCCTTTGTCG | 54 | 290 | 5-TAMRA | 4 | 1.897 | 0.759 | 0.564 | 0.473 | −0.192 | 0.386 | 0.008 ** |
| PS271 | F: AGAATCCACCTCCTGTCAC R: AACCCTGCCCTAAACTAAAC | 56.5 | 406 | 5-ROX | 4 | 3.516 | 1.317 | 0.716 | 0.716 | −0.001 | 0.664 | 0.903 ns |
| PS276 | F: CTGTATCCTATCGGTTCTT R: CCTCATCTGCCTTTATCT | 52.5 | 447 | 5-ROX | 4 | 2.029 | 0.749 | 0.436 | 0.507 | 0.140 | 0.389 | 0.000 ns |
| PS296 | F: CTCTTTCGCTGCCACAAC R: CTCTGCTCTTCCCGTCTT | 57.5 | 419 | 5-ROX | 4 | 1.985 | 0.937 | 0.521 | 0.496 | −0.051 | 0.456 | 0.002 ** |
| PS309 | F: AAGCAAAGCCGTGGAGAT R: GTGCGTGAAAAGGAGACAGAAC | 55 | 257 | 5-HEX | 7 | 1.321 | 0.536 | 0.255 | 0.243 | −0.051 | 0.230 | 0.000 *** |
| PS311 | F: AACGCCACCATCACCTTT R: CACCTGAACTCACCCTCC | 60 | 277 | 5-HEX | 2 | 1.988 | 0.690 | 0.915 | 0.497 | −0.841 | 0.374 | 0.000 *** |
| PS323 | F: CTCACCCGTTCTAAAGTCA R: CCTCCTCCCTGTTCTTCT | 53 | 466 | 5-FAM | 2 | 1.004 | 0.013 | 0.004 | 0.004 | −0.002 | 0.004 | 0.976 ns |
| PS335 | F: TAATCACCCAATGAGCCA R: CGTCGTCGCCGAATACTT | 50 | 395 | 5-ROX | 5 | 1.172 | 0.340 | 0.096 | 0.147 | 0.347 | 0.141 | 0.000 *** |
| PS337 | F: ATCCTCTTCACGGCAATC R: CGTCCACTCTTCCTCCTC | 53.5 | 448 | 5-ROX | 5 | 1.638 | 0.695 | 0.461 | 0.390 | −0.183 | 0.338 | 0.013 * |
| PS339 | F: TGAGGCAGCCAAAGAATT R: GGCAGGTGTAGGGTATGTT | 50 | 175 | 5-FAM | 3 | 1.025 | 0.074 | 0.021 | 0.025 | 0.134 | 0.024 | 0.000 *** |
| PS345 | F: TGAAGTGAATCGAAGCAT R: CAACAGGCAGAAGAAAGG | 48 | 366 | 5-ROX | 4 | 2.078 | 0.944 | 0.589 | 0.519 | −0.135 | 0.469 | 0.000 *** |
| PS356 | F: TCAAGCCCAAGGTCATTC R: ACTTGCTCACCTCGCTCT | 53 | 354 | 5-TAMRA | 7 | 3.647 | 1.476 | 0.730 | 0.726 | −0.006 | 0.683 | 0.000 *** |
| PS367 | F: AGACGGACGGAAATAGGG R: ACGAGCGATCTCAACCAT | 53.5 | 265 | 5-HEX | 4 | 3.238 | 1.267 | 0.993 | 0.691 | −0.437 | 0.636 | 0.000 *** |
| Mean | 5.441 | 2.291 | 0.908 | 0.537 | 0.489 | −0.074 | 0.611 | |||||
| SE | 0.429 | 0.166 | 0.072 | 0.043 | 0.035 | 0.034 | 0.358 |
Note: F = forward primer, R = reverse primer, Tm = annealing temperature; ns = not significant, * p < 0.05, ** p < 0.01, *** p < 0.001.
Table 3.
Information of 3 chloroplast DNA sequence (cpDNA) primers used in 80 accessions.
| Number | Loci | Primer Pairs | Primer Sequences (5′-3′) | Tm (°C) |
|---|---|---|---|---|
| 1 | petB-petD | petB | CTATCGTCCRACCGTTACWGAGGCT | 54 |
| petD | CAAAYGGATAYGCAGGTTCACC | |||
| 2 | accD-psaI | accD-psaI-21F | AACATTGAATAAGACAGTACCTGAG | 52 |
| accD-psaI-747R | GTAAGTTAAGAGTTGTCATAGGATGG | |||
| 3 | psbE-petL | psbE-petL-356F | CCTTCTTCTGACACAGCAATG | 52 |
| psbE-petL-1219R | TTACCATTATAGACAGCACTAACAA |
Table 4.
Descriptive statistics for quantitative traits measured in 180 accessions.
| Trait | Mean | Standard Deviation | Minimum | Maximum | F-Value | p-Value | Variable Coefficient |
|---|---|---|---|---|---|---|---|
| 1 | 7.54 | 0.93 | 4.80 | 10.07 | 15.96 | 0.00 | 12.33 |
| 2 | 7.41 | 1.19 | 2.73 | 9.80 | 18.11 | 0.00 | 16.06 |
| 3 | 2.71 | 0.63 | 1.57 | 4.37 | 16.09 | 0.00 | 23.25 |
| 4 | 1.97 | 0.58 | 0.67 | 3.77 | 18.43 | 0.00 | 29.44 |
| 5 | 15.41 | 1.90 | 9.67 | 19.63 | 6.97 | 0.00 | 12.33 |
| 6 | 32.55 | 35.39 | 9.00 | 238.33 | 22.72 | 0.00 | 108.73 |
| 7 | 5.28 | 1.05 | 0.00 | 10.33 | 8.08 | 0.00 | 19.89 |
| 8 | 125.92 | 22.56 | 71.33 | 206.67 | 7.42 | 0.00 | 17.92 |
| 9 | 149.02 | 32.42 | 78.67 | 276.00 | 4.15 | 0.00 | 21.76 |
| 10 | 163.84 | 34.41 | 75.33 | 277.00 | 5.37 | 0.00 | 21.00 |
| 11 | 28.24 | 18.88 | 0.00 | 97.33 | 2.99 | 0.00 | 66.86 |
| 12 | 32.04 | 18.40 | 4.33 | 86.00 | 1.56 | 0.08 | 57.43 |
| 13 | 21.02 | 19.03 | 1.00 | 169.33 | 7.71 | 0.00 | 90.53 |
| 14 | 36.98 | 6.24 | 20.67 | 55.84 | 9.46 | 0.00 | 16.87 |
| 15 | 23.13 | 5.57 | 11.67 | 45.07 | 7.26 | 0.00 | 24.08 |
| 16 | 12.00 | 2.52 | 6.97 | 21.57 | 9.96 | 0.00 | 21.00 |
| 17 | 15.15 | 3.41 | 9.00 | 31.00 | 14.87 | 0.00 | 22.51 |
| 18 | 6.95 | 1.46 | 3.53 | 11.13 | 10.99 | 0.00 | 21.01 |
| 19 | 7.06 | 2.07 | 3.13 | 15.30 | 5.21 | 0.00 | 29.32 |
| 20 | 478.26 | 408.66 | 25.33 | 2661.64 | 4.95 | 0.00 | 85.45 |
| 21 | 62.26 | 31.57 | 16.89 | 237.01 | 3.75 | 0.00 | 50.71 |
| 22 | 33.66 | 31.74 | 0.00 | 151.33 | 4.15 | 0.00 | 94.30 |
| 23 | 15.01 | 15.00 | 0.00 | 79.67 | 3.32 | 0.00 | 99.93 |
| 24 | 5.49 | 1.20 | 2.33 | 12.33 | 19.08 | 0.00 | 21.86 |
| 25 | 40.75 | 7.27 | 23.74 | 75.64 | 11.29 | 0.00 | 17.84 |
| 26 | 15.43 | 3.27 | 7.60 | 25.24 | 10.12 | 0.00 | 21.19 |
| 27 | 14.79 | 2.91 | 6.97 | 29.07 | 10.73 | 0.00 | 19.68 |
| 28 | 2.51 | 0.64 | 0.79 | 4.52 | 12.65 | 0.00 | 25.50 |
Note: p < 0.05: Significant difference; p < 0.01: Very significant difference. The traits corresponding to the serial number are shown in Table 1.
Table 5.
The principal component analysis (PCA) of 28 quantitative traits.
| Trait | Principal Component | |||||||
|---|---|---|---|---|---|---|---|---|
| 1 | 2 | 3 | 4 | 5 | 6 | 7 | 8 | |
| 1 | −0.019 | −0.068 | 0.831 | 0.150 | 0.076 | −0.065 | −0.064 | −0.017 |
| 2 | 0.100 | 0.019 | 0.776 | 0.043 | 0.134 | 0.153 | −0.277 | 0.148 |
| 3 | −0.025 | −0.044 | 0.669 | −0.164 | −0.204 | 0.238 | 0.165 | −0.273 |
| 4 | 0.019 | −0.010 | 0.543 | −0.182 | −0.030 | 0.525 | 0.125 | −0.138 |
| 5 | 0.211 | 0.063 | 0.688 | 0.146 | 0.040 | −0.211 | −0.133 | 0.163 |
| 6 | −0.293 | 0.053 | −0.196 | 0.065 | 0.027 | −0.077 | 0.633 | 0.286 |
| 7 | −0.047 | −0.007 | 0.167 | −0.069 | −0.053 | 0.001 | −0.629 | 0.413 |
| 8 | 0.180 | 0.453 | 0.129 | 0.377 | 0.068 | 0.379 | 0.203 | 0.222 |
| 9 | 0.203 | 0.669 | 0.184 | 0.083 | 0.084 | 0.006 | 0.398 | 0.176 |
| 10 | 0.163 | 0.641 | 0.342 | 0.144 | 0.103 | 0.030 | 0.308 | 0.092 |
| 11 | −0.053 | 0.839 | −0.153 | −0.001 | −0.057 | −0.160 | −0.074 | −0.136 |
| 12 | −0.076 | 0.796 | −0.144 | −0.073 | 0.054 | −0.017 | −0.126 | 0.042 |
| 13 | −0.005 | 0.352 | 0.077 | 0.026 | −0.144 | −0.684 | 0.140 | −0.099 |
| 14 | 0.237 | 0.053 | 0.059 | 0.866 | 0.120 | 0.006 | −0.012 | −0.036 |
| 15 | 0.240 | 0.098 | 0.160 | 0.569 | −0.029 | 0.466 | −0.042 | −0.060 |
| 16 | 0.110 | −0.029 | −0.018 | 0.842 | 0.043 | −0.175 | 0.129 | −0.038 |
| 17 | 0.181 | 0.153 | 0.071 | 0.206 | −0.675 | 0.193 | −0.137 | 0.073 |
| 18 | 0.116 | 0.156 | 0.079 | 0.438 | 0.716 | 0.179 | 0.083 | −0.049 |
| 19 | 0.169 | 0.279 | −0.015 | 0.315 | 0.494 | 0.251 | −0.070 | −0.165 |
| 20 | 0.562 | 0.633 | −0.031 | 0.133 | −0.018 | −0.193 | −0.102 | −0.144 |
| 21 | 0.904 | 0.063 | 0.074 | 0.249 | 0.115 | 0.032 | −0.050 | 0.017 |
| 22 | 0.846 | −0.024 | −0.032 | 0.047 | −0.247 | −0.033 | −0.196 | −0.066 |
| 23 | 0.909 | 0.033 | −0.003 | 0.105 | −0.130 | −0.031 | −0.132 | −0.022 |
| 24 | −0.070 | 0.011 | 0.001 | −0.077 | −0.078 | 0.030 | 0.009 | 0.795 |
| 25 | 0.648 | 0.060 | 0.160 | 0.287 | 0.311 | 0.107 | 0.210 | −0.128 |
| 26 | 0.842 | 0.076 | 0.077 | 0.015 | 0.117 | 0.086 | 0.072 | 0.034 |
| 27 | 0.730 | 0.059 | 0.088 | 0.136 | 0.297 | 0.085 | 0.080 | −0.032 |
| 28 | 0.408 | 0.036 | 0.144 | 0.062 | 0.566 | 0.105 | −0.106 | 0.091 |
| Total variance/% | 17.722 | 11.066 | 10.356 | 9.328 | 7.026 | 5.387 | 5.207 | 4.423 |
| Cumulative total variance/% | 17.722 | 28.789 | 39.144 | 48.472 | 55.499 | 60.886 | 66.093 | 70.516 |
Note: The traits corresponding to the serial number are shown in Table 1.
Table 6.
Pearson correlation coefficients of phenotypic traits of 180 accessions.
| Trait | 1 | 2 | 3 | 4 | 5 | 6 | 7 | 8 | 9 | 10 | 11 | 12 | 13 | 14 | 15 | 16 | 17 | 18 | 19 | 20 | 21 | 22 | 23 | 24 | 25 | 26 | 27 | 28 |
|---|---|---|---|---|---|---|---|---|---|---|---|---|---|---|---|---|---|---|---|---|---|---|---|---|---|---|---|---|
| 1 | ||||||||||||||||||||||||||||
| 2 | 0.657 ** | |||||||||||||||||||||||||||
| 3 | 0.505 ** | 0.294 ** | ||||||||||||||||||||||||||
| 4 | 0.354 ** | 0.469 ** | 0.655 ** | |||||||||||||||||||||||||
| 5 | 0.519 ** | 0.539 ** | 0.309 ** | 0.272 ** | ||||||||||||||||||||||||
| 6 | −0.167 * | −0.287 ** | −0.081 | −0.122 | −0.170 ** | |||||||||||||||||||||||
| 7 | 0.102 | 0.220 ** | 0.163 * | 0.115 | 0.148 ** | −0.111 * | ||||||||||||||||||||||
| 8 | 0.135 * | 0.232 ** | 0.034 | 0.180 ** | 0.146 ** | 0.016 | 0.048 | |||||||||||||||||||||
| 9 | 0.160 * | 0.126 | 0.062 | 0.052 | 0.117 * | 0.049 | −0.013 | 0.577 ** | ||||||||||||||||||||
| 10 | 0.192 ** | 0.146 * | 0.096 | 0.095 | 0.165 ** | −0.031 | 0.050 | 0.652 ** | 0.708 ** | |||||||||||||||||||
| 11 | −0.119 | −0.041 | −0.123 | −0.058 | 0.010 | −0.018 | −0.046 | 0.176 ** | 0.291 ** | 0.281 ** | ||||||||||||||||||
| 12 | −0.134 | −0.021 | −0.171 | −0.087 | 0.008 | 0.056 | −0.013 | 0.284 ** | 0.317 ** | 0.357 ** | 0.581 ** | |||||||||||||||||
| 13 | −0.037 | −0.118 | −0.108 | −0.191 ** | −0.044 | 0.001 | −0.105 | −0.106 | 0.203 ** | 0.124 * | 0.167 ** | 0.199 | ||||||||||||||||
| 14 | 0.167 ** | 0.115 ** | −0.008 | 0.039 | 0.160 ** | 0.027 | −0.014 | 0.211 ** | 0.150 ** | 0.212 ** | −0.025 | −0.067 | −0.005 | |||||||||||||||
| 15 | 0.164 ** | 0.191 ** | 0.097 * | 0.160 ** | 0.143 ** | 0.030 | −0.015 | 0.345 ** | 0.241 ** | 0.265 ** | −0.022 | −0.034 | −0.065 | 0.570 ** | ||||||||||||||
| 16 | 0.102 ** | −0.032 | −0.046 | −0.084* | 0.044 | 0.027 | −0.091 | 0.056 | 0.049 | 0.081 | −0.021 | −0.046 | 0.089 | 0.723 ** | 0.310 ** | |||||||||||||
| 17 | 0.048 | 0.050 | −0.017 | −0.024 | 0.081 | −0.162 ** | 0.066 | 0.165 ** | 0.154 ** | 0.144 ** | 0.106 | 0.057 | 0.108 | 0.043 | 0.054 * | −0.056 * | ||||||||||||
| 18 | 0.114 ** | 0.110 ** | 0.040 | 0.131 ** | 0.084 | 0.145 * | −0.036 | 0.218 * * | 0.143 ** | 0.181 ** | −0.001 | 0.078 | −0.086 | 0.532 ** | 0.389 ** | 0.310 ** | −0.327 ** | |||||||||||
| 19 | 0.054 | 0.121 ** | 0.028 | 0.11 2** | 0.133 * | 0.026 | −0.032 | 0.222 ** | 0.197 ** | 0.143 ** | 0.130 * | 0.162 | −0.038 | 0.357 ** | 0.298 ** | 0.185 ** | −0.164 ** | 0.538 ** | ||||||||||
| 20 | 0.029 | 0.109 | −0.067 | 0.007 | 0.164 ** | −0.181 ** | −0.076 | 0.229 ** | 0.345 ** | 0.310 ** | 0.570 ** | 0.381 ** | 0.059 | 0.237 ** | 0.163 ** | 0.144 ** | 0.099 | 0.107 * | 0.162 ** | |||||||||
| 21 | 0.147 * | 0.207 ** | 0.021 | 0.111 | 0.266 ** | −0.206 ** | −0.085 | 0.242 ** | 0.181 ** | 0.198 ** | 0.057 | 0.017 | −0.082 | 0.402 ** | 0.333 ** | 0.224 ** | 0.044 | 0.239 ** | 0.199 ** | 0.615 ** | ||||||||
| 22 | 0.023 | 0.040 | −0.034 | 0.008 | 0.155 ** | −0.211 ** | −0.096 | 0.005 | 0.006 | −0.038 | 0.081 | 0.000 | 0.038 | 0.174 ** | 0.191 ** | 0.106 * | 0.133 * | −0.048 | 0.019 | 0.467 ** | 0.696 ** | |||||||
| 23 | 0.061 | 0.094 | −0.031 | 0.027 | 0.185 ** | −0.199 ** | −0.101 | 0.070 | 0.064 | 0.031 | 0.074 | 0.036 | 0.019 | 0.262 ** | 0.231 ** | 0.148 ** | 0.093 | 0.059 | 0.085 | 0.541 ** | 0.817 ** | 0.952 ** | ||||||
| 24 | 0.085 * | 0.115 ** | 0.114 * | 0.082 | 0.029 | 0.167 ** | 0.397** | 0.053 | 0.025 | −0.014 | −0.042 | 0.088 | −0.069 | 0.003 | 0.014 | −0.027 | −0.017 | 0.029 | 0.018 | −0.007 | −0.003 | −0.094 * | −0.079 | |||||
| 25 | 0.197 ** | 0.182 ** | 0.059 | 0.154 ** | 0.186 ** | −0.073 | −0.163 ** | 0.254 ** | 0.217 ** | 0.232 ** | 0.011 | −0.020 | −0.066 | 0.316 ** | 0.279 ** | 0.152 ** | −0.009 | 0.258 ** | 0.171 ** | 0.359 ** | 0.675 ** | 0.367 ** | 0.467 ** | −0.160 ** | ||||
| 26 | 0.161 ** | 0.204 ** | −0.012 | 0.115 ** | 0.165 ** | −0.185 * * | −0.086 | 0.182 ** | 0.137 ** | 0.176 ** | 0.064 | −0.016 | −0.127* | 0.248 ** | 0.207 ** | 0.115 ** | 0.082** | 0.122 ** | 0.135 ** | 0.453 ** | 0.684 ** | 0.463 ** | 0.534 ** | −0.108 ** | 0.652 ** | |||
| 27 | 0.178 ** | 0.212 ** | −0.007 | 0.124 ** | 0.184 ** | −0.171 ** | −0.115 | 0.184 ** | 0.119 * | 0.173 ** | −0.010 | 0.006 | −0.189 ** | 0.251 ** | 0.201 ** | 0.121 ** | 0.052 | 0.153 ** | 0.147 ** | 0.394 ** | 0.674 ** | 0.358 ** | 0.463 ** | −0.151 ** | 0.625 ** | 0.718 ** | ||
| 28 | 0.220 ** | 0.286 ** | 0.042 | 0.197 ** | 0.193 ** | −0.149 ** | 0.009 | 0.136 ** | 0.130 ** | 0.183 ** | −0.063 | −0.025 | −0.159 ** | 0.263 ** | 0.189 ** | 0.081 ** | −0.031 | 0.231** | 0.178 ** | 0.285 ** | 0.502 ** | 0.087 * | 0.199 ** | 0.001 | 0.450 ** | 0.518 ** | 0.515 ** | 1 |
Note: ns = not significant, * p < 0.05, ** p < 0.01. The traits corresponding to the serial number are shown in Table 1.
Table 7.
The variations in accD-psaI, psbE-petL and petB-petD regions among 80 accessions.
| Domain | Variation Site | Hap 1 | Hap 2 | Hap 3 |
|---|---|---|---|---|
| accD-psaI | 1 | A | C | C |
| psbE-petL | 2 | G | A | A |
| petB-petD | 3 | T | C | C |
| 4 | G | G | A |
Note: A, T, C and G are bases, respectively.
© 2020 by the authors. Licensee MDPI, Basel, Switzerland. This article is an open access article distributed under the terms and conditions of the Creative Commons Attribution (CC BY) license (http://creativecommons.org/licenses/by/4.0/).
Share and Cite
MDPI and ACS Style
Guo, X.; Cheng, F.; Zhong, Y. Genetic Diversity of Paeonia rockii (Flare Tree Peony) Germplasm Accessions Revealed by Phenotypic Traits, EST-SSR Markers and Chloroplast DNA Sequences. Forests 2020, 11, 672. https://doi.org/10.3390/f11060672
AMA Style
Guo X, Cheng F, Zhong Y. Genetic Diversity of Paeonia rockii (Flare Tree Peony) Germplasm Accessions Revealed by Phenotypic Traits, EST-SSR Markers and Chloroplast DNA Sequences. Forests. 2020; 11(6):672. https://doi.org/10.3390/f11060672
Chicago/Turabian StyleGuo, Xin, Fangyun Cheng, and Yuan Zhong. 2020. "Genetic Diversity of Paeonia rockii (Flare Tree Peony) Germplasm Accessions Revealed by Phenotypic Traits, EST-SSR Markers and Chloroplast DNA Sequences" Forests 11, no. 6: 672. https://doi.org/10.3390/f11060672
Note that from the first issue of 2016, this journal uses article numbers instead of page numbers. See further details here.