Mycobiota of Fine Roots of Pseudotsuga menziesii Introduced to the Native Forest Environment
by
 , , , ,
Marta Damszel
1 ,
,
Hanna Szmidla
2,*,
Katarzyna Sikora
2,
Agata Młodzińska
3,
Sławomir Piętka
1 and
Zbigniew Sierota
4 1
Department of Entomology, Phytopathology and Molecular Diagnostics, Warmia and Mazury University in Olsztyn, Prawocheńskiego 17, 10-720 Olsztyn, Poland
2
Department of Forest Protection, Forest Research Institute in Sękocin Stary, Braci Lesnej 3, 05-090 Raszyn, Poland
3
Bioidea Company, Bruzdowa 100J/12, 02-991 Warsaw, Poland
4
Department of Forestry and Forest Ecology, Warmia and Mazury University in Olsztyn, Pl. Łódzki 2, 10-720 Olsztyn, Poland
*
Author to whom correspondence should be addressed.
Forests 2021, 12(12), 1766; https://doi.org/10.3390/f12121766
Submission received: 14 October 2021
/
Revised: 19 November 2021
/
Accepted: 9 December 2021
/
Published: 14 December 2021
(This article belongs to the Section Forest Ecology and Management)
Abstract
:The mycobiota of the fine roots of Pseudotsuga menziesii were studied as a measure of the adaptation of this alien species to new soil and climatic conditions. We hypothesized that after approximately 130 years of growth in a given habitat, the fungal community colonizing the fine roots of introduced trees would resemble the biota of Pinus sylvestris and Fagus sylvatica in surrounding stands of similar age and site conditions. The genetic material isolated from the fine roots was subjected to metagenomic analysis. We recorded 33, 97 and 95 OTUs exclusively from root samples of Douglas fir, beech and pine, respectively; 124 were common to all sample types. The biota from the roots of P. menziesii featured a less diverse taxonomic composition and were characterized by the highest proportion of symbiotrophs (71.8%) versus saprothrophs (5.6%) and pathogens (0.24%). Some fungal taxa (19) in the roots of P. menziesii were common with the biota in the roots of other adjacent trees, while some (7) were unique to Douglas fir. Our results indicate a locally differentiated strategy of naturalness of fungi inhabiting soil and roots of P. menziesii, although 130 years have passed since the introduction of the species.
1. Introduction
Some of the most important components of soil microbial communities are fungi. Fungal communities in soil are remarkably diverse and perform many important ecological functions in forest ecosystems, including decomposition and element cycling, and are involved in biotic interactions such as mycorrhizal symbioses [1]. To better understand the factors that shape fungal diversity, community structure and spatial patterns are some of the central topics in soil microbial ecology [2]. The composition and spatial distribution of soil fungal communities depend on many environmental factors, such as nutrient availability [3], soil texture and water availability [4], and plant community composition [5]. These factors are also controlled by geographic differentiation [6], changes in plant communities due to forest management and associated effects on soil conditions [4,7,8].
Studies of soil fungal diversity and community structure at geographic sites differing in soil, land use, or vegetation yielded conflicting results. Green et al. [7] reported geographic differentiation in soil fungal community structure. On the other hand, Kasel et al. [4] found weak regional differences, while land use was important within regions.
Most studies in temperate forests have focused on ectomycorrhizal fungi and root-associated communities because this ecological group of fungi plays a dominant role in these ecosystems. They control the acquisition of soil resources by plants (e.g., nitrogen and phosphorus) [9,10] and soil carbon dynamics [11]. Many authors have argued that spatial variation in fungal communities in temperate forests is related to changes in soil environment, stand age, host tree species, and herbaceous plant cover [12,13,14,15,16,17,18]. Buée et al. [13] reported that spatial heterogeneity of soil fungal communities in temperate forests can also be explained by host tree species and soil environment. The recently published results of a study conducted in Douglas fir-dominated forests of western Canada showed that temperature, precipitation, and soil C:N ratio influenced fungal community dissimilarity and host tree species abundance, but not fungal α-diversity [19].
The development of high-throughput sequencing methods such as 454 Pyrosequencing (454 Inc., Branford, CT, USA) or Illumina Sequencing (Illumina Inc., San Diego, CA, USA) dramatically increased the capacity to identify fungi in the 2000s [20,21]. These so-called second- or next- generation sequencing methods increased the number of reads by 2–6 orders of magnitude and the number of samples that could be processed simultaneously by 1–2 orders of magnitude. These metabarcoding methods [22] allowed comprehensive estimation of fungal diversity from environmental DNA (eDNA) at the level of individual samples and facilitated comparisons at the global level [23,24]. Next-generation sequencing (NGS) (e.g., 454 pyrosequencing, Illumina MiSeq) has been successfully used to assess fungal diversity in soil, among other applications [5,13,25,26,27,28]. These techniques allow the analysis of fungal communities in forest ecosystems composed of functionally distinct trophic groups represented by symbiotrophic (mycorrhizal fungi, lichens, endophytes), pathotrophic and saprotrophic fungi [24]. Recent research using the NGS technique addresses, among other things, changes in soil fungal community depending on the functional group and the type of forest disturbance [29], the importance of environmental factors (weather and climatic factors) [30] and anthropogenic factors (forest management) on fungal community changes [31]. Applying the NGS technique to a large-scale analysis of the soil fungal community at geographically separated forest sites dominated by the same tree species could help to clarify the relative contribution of geographical location and soil chemical parameters to soil fungal community structure.
We analyzed soil fungal community structure and fungal diversity in four experimental 130 year-old stands dominated by Douglas fir (Pseudotsuga menziesii (Mirb.) Franco) distributed across four sites in Poland (Figure 1). These stands were a part of the Prussian experimental stations (1881–1890). In these stands, experiments were conducted on the development of alien tree species introduced to Germany and Prussia from North America. The seeds or seedlings of 70 alien tree species were imported and brought to selected forest districts by Schwappach [32,33]. Circular, clearcut areas of 2–12 acres, or quadrangles of similar size, were nest-chiseled at Mortzfeld [34] and planted with native species (pine and beech) about ten years later. Currently, nine of these territories are located in northeastern Poland. Research on the growth, population and health of the trees of some North American species introduced to East Prussia in the 19th century, currently in the Warmia-Masurian region (North-Eastern Poland), was begun in the 1960s by Tumiłowicz [35,36].
Douglas fir is one of the most promising exotic tree species in European forestry [37,38,39]. Compared to native European tree species, this tree species features a high potential to cope with warmer climates and a higher resistance to drought and subsequent faster recovery [19,40,41].
This may be due to maintaining strong connections with local fungal communities, especially mycorrhizal [19]. Ectomycorrhiza is an important symbiotic process through which many plant species in temperate climates cope with infertile soils and water shortages. Ectomycorrhizal fungal species (EMF) are more host-specific than arbuscular mycorrhizal fungi or endophytic fungi [1], and the absence of ectomycorrhiza originally hindered the success of many tree species in new regions of the world [42,43]. For example, the introduction of Pinus spp. in Australia failed due to the lack of pine-specific EMF species [44]. Dickie et al. [45] showed that the non-native Pinus contorta Dougl. ex Loud. was successfully introduced into New Zealand, mainly through the co-invasion of EMF species and the formation of ectomycorrhizal associations with cosmopolitan EMF species, rather than through the addition of new fungi. This was also demonstrated by Tedersoo et al. [46] for Pinus caribea Morelet, which maintained EMF species co-introduced with seedlings in the Seychelles Islands. On the other hand, Kohout et al. [47] showed that the non-native Pinus strobus L. effectively adopted EMF assemblages with native fungi in a mesocosm experiment in the Czech Republic. Similarly, the exotic Picea engelmannii Parry ex Engelm. in North America [48] and Quercus rubra L., growing in Germany, accepted a wide range of native EMF species [49]. Troch and al. [50] found that native Quercus robur L. featured 120% higher EMF species richness than non-native Q. rubra, while native Pinus sylvestris L. featured 25% lower EMF species richness than non-native Pinus nigra Arn. 35 years after planting.
In this study, we aimed to determine the fungal metagenomic variability in root samples of previously implanted P. menziesii clumps and companion trees of native species growing (i) on two different stand sites (mixed broadleaf-conifer forest, broadleaf forest) and (ii) in two climatic mesoregions. The objective of our study was to investigate the taxonomic composition of fungi inhabiting the roots of old Douglas fir compared to the roots of pine and beech trees in the region. We hypothesized that after approximately 130 years of Douglas fir growth in a given soil and climatic habitat, the fungal communities inhabiting the root systems of both conifers (P. menziesii and P. sylvestris) would be similar in taxonomic composition, in contrast to the communities inhabiting the roots of Fagus sylvatica L., which differ according to soil and site type. This could mean that the more than 100 year adaptation period of the introduced Pseudotsuga was more consistent with the soil fungal community structure typical of the native P. sylvestris than with that of the equally native deciduous species Fagus. The results may indicate a locally differentiated naturalness of P. menziesii fungal communities colonizing roots while 130 years have passed since the species was introduced into local habitats. Although local root mycobiota affect non-native trees in many different ways, research on this topic expands our understanding of why exotic trees species can be so successful, and it broadens our view of the drivers of natural community organization.
2. Materials and Methods
2.1. Research Area
Stands with Douglas fir groups were situated in the Masurian Lakeland region (Figure 1), with a mean annual temperature of 7 ± 7.5 °C and a cumulative annual precipitation of 500–630 mm [51]. Stands occupy flat areas (~130 m a.s.l.) affected by the fourth Baltic glaciation (12,000 years BC), with numerous lakes forming the lakeland landscape, increasing air and soil humidity. We established plots in two forest site types, mixed broadleaf-coniferous forest and broadleaf forest, located in four Forest Districts (FD) of the Olsztyn Regional Directorate of State Forests in Poland, The sites were situated in the same physico-geographical province of the East European Plain, according to regionalization implementing the European Landscape Convention [52], but in different mesoregions: (a) Olsztynek Plain (number of mesoregion—842.88): Dobrocin FD and Stare Jabłonki FD; (b) Masurian Plain (number—842.87): Jedwabno FD and Szczytno FD (Figure 1). The average volume of Douglas fir in the plots studied was over 1000 m3 ha and was significantly higher than that of the native tree species—European beech (F. sylvatica) and Scots pine (P. sylvestris). All the trees had similar ages of about 130 years and grew in managed stands.
2.2. Soil and Roots Samples
Eight soil samples with roots were collected from four groups of Pseudotsuga menziesii trees (clumps) with three replicates at the turn of summer to autumn (September 2019), when mycorrhizal and saprotrophic fungi reached their seasonal maxima [53]. The samples were obtained with a sampler covering an area of 20 × 20 cm from a depth of ~25 cm, next to two trees: A—P. menziesii, and, B—arbitrarily selected P. sylvestris or F. sylvatica, respectively, growing inside the same clump (Table 1). The first sample was ~2 m close to the tree, and the two other samples were taken 3 and 4 m further; all the samples were situated towards the south. Prior to sampling, the litter layer was removed. The three replicates of each sample were combined to obtain one composite sample representing one variant [54,55]. The research material (soil with roots) was packed in plastic bags and transported to the laboratory, where it was stored at −10 °C prior to analysis.
The soil samples were analyzed in the certified laboratory (PCA AB277) of the Regional Chemical-Agricultural Station in Olsztyn for pHKCl, P2O5, K2O, Mg (mg/100 g), Ntotal, C, and soil humus (%). Soil type was assigned according to the Polish Soil Classification (SGP6) [56].
The roots were carefully removed from each thawed soil sample by sieving (2-mm sieve), washed under running water [35], and stored in ethyl alcohol in sterile plastic containers before genetic analysis. We collected a total of eight samples of roots from four forest districts. Each group was represented by two composite samples from three sample points (one from Pseudotsuga roots, the second from the other tree species). From each sample, 20 randomly selected fine root tips were separated for DNA analysis.
2.3. DNA Extraction, Amplification, and Sequencing
We collected eight samples in total from four forest districts. Each group was represented by two samples. For each sample, the DNA from two subsamples of 20 randomly selected fine root tips (regardless of their morphology) was isolated with a NucleoSpin Plant II Kit (Macherey–Nagel), using a PL1 lysis buffer with the addition of chloroform. Subsequently, the two subsamples were combined to obtain one analytical sample and purified to remove inhibitors, using a CleanUp Kit (A&A Biotechnology). The quantity and quality of DNA were measured using a NanoDrop spectrophotometer. A DNA concentration of 30 ng/µL was subjected to metagenomic analysis.
Amplicon libraries of rhizosphere mycobiota were generated by amplifying the ITS1 (Internal Transcribed Spacer 1) region using primers ITS1FI2 5′-GAACCWGCGGARGGATCA-3′ [27] and 5.8S 5′-CGCTGCGTT CTTCATCG-3′ [57]. The PCR mixture (25 µL) consisted of 12.5 µL 2 × REDTaq® ReadyMix™ (Sigma Aldrich, Saint Louis, MO, USA), 0.2 µM of each primer, and 1 µL of DNA. The PCR reaction was performed under the following conditions: denaturation at 94 °C for 5 min, followed by 35 cycles of denaturation at 94 °C for 30 s, annealing at 56 °C for 30 s, and elongation at 72 °C for 30 s, with a final elongation step at 72 °C for 10 min. The resulting products of the first PCR reaction were purified, followed by indexing PCR using Nexter XT indices (two-sided indexing). The sequencing was performed on a MiSeq sequencer (Illumina Inc., San Diego, CA, USA), in paired-end technology, using v2 reagents (Illumina Inc., San Diego, CA, USA) in the Next-Generation Sequencing Laboratory of Genomed SA, Poland.
2.4. Bioinformatic Analysis
An automatic initial data analysis was performed on the MiSeq apparatus (Illumina Inc., San Diego, CA, USA) using the software MiSeq Reporter (MSR) v. 2.6. A further bioinformatics analysis, ensuring the classification of the sequence reads represented by operational taxonomic units (OTUs) to taxonomy levels, were performed in the QIIME2 software [58]. After the deletion of adapter fragments, the quality-filtered sequences (quality < 20, minimum length 30) were paired, and the remaining sequences were clustered in OTUs, with a 97% sequence identity with the UPARSE-OTU algorithm [59]. The resulting representative sequences for each cluster were subjected to chimera detection and removal using the USEARCH 6.1 software [59]. The resulting sequences were compared with already deposited sequences in the UNITE v. 8.0 [60] reference sequence base for the taxonomic identification assignment with UCLUST algorithm [59]. Taxonomies were assigned to each OTU with a minimum 90% of sequence identity.
2.5. Statistical Analyses
To compare the microbiome composition of the samples, relative abundances were calculated as the percentage composition of reads assigned to an OTU relative to the total number of reads in the sample. In order to choose the appropriate statistical test, the Shapiro–Wilk test was performed on the collected data. As a result, the data were not normally distributed and non-parametric tests were used (one-way ANOVA on ranks (Kruskal–Wallis test by ranks), PERMANOVA). To compare the identified microbiomes between the sample groups, alpha and beta diversity calculations were performed based on the number of reads assigned to the OTUs. The samples were normalized to the smallest number of reads (112,341) present in the sample SZ; F. sylvatica from Szczytno Forest District. Alpha diversity was applied to analyze the microbiome complexity of each sample with five ecological indices, namely Chao1 [61], observed-species, Faith [62], Shannon [63], and Simpson [64]. The statistical analysis of the alpha diversity indices results in each sample were carried out by one-way ANOVA on ranks (Kruskal–Wallis test by ranks). Beta diversity was applied to analyze the phylogenetic distances and correlations between groups of samples with four ecological indices, namely weighted and unweighted UniFrac metrics [65], the Bray–Curtis index [66], and the Jaccard index [67]. The statistical analysis of the beta diversity indices was performed with the use of PERMANOVA pseudo-F test with 999 permutations. All the statistical analyses were performed with QIIME 2 and the Statistica v. 13.0 package (Dell Inc., Round Rock, TX, USA). In order to examine the overall influence of environmental factors on community structure, the Spearman correlation was performed for the identified OTUs and species-level composition and soil parameters. The most significant differences are presented in this publication. The other results are presented in Supplementary Materials (Tables S1 and S2). The Spearman correlations between the identified microbiome and soil properties were analyzed with QIIME observation_metadata_correlation.py program, with the Fisher z-transform p-value assignment method [68]. The most interesting results were analyzed and visualized using the ggpubr R package [47]. A critical value of p < 0.05 was used throughout this study. A comparison analysis between groups and the Kruskall–Wallis rank sum test were performed for the normalized abundance values of the species representing the symbiothropic and saprotropic groups in the root samples studied. The boxplot plot and statistical analysis were performed using the R package.
3. Results
3.1. Site Characteristics and Soil Parameters
The selected areas were situated in the fertile mesic biotopes of mixed forest (Jedwabno FD and Stare Jabłonki FD) and oligotrophic forest habitat (Dobrocin FD and Szczytno FD) (Table 1).
The soils were characterized in terms of nutritional properties. The contents of carbon and nitrogen were typical for soils consisting for sandy sediments. Soil organic carbon (SOC) and total nitrogen were highest in Jedwabno, both under Douglas fir and Scots pine, and in Szczytno, only under beech (Table 2). Significant differences in SOC content were observed between the mesoregions Masurian and Olsztynek; by contrast, the total nitrogen values were similar in all analyzed variants (Table 3). The C:N ratio in all the analyzed sites was within the typical range for forest soils in temperate regions, indicating high soil biological activity. The only significant differences between the forest types were found for the C:N ratio and K2O content. The analyzed soils were highly acidic, which was the result of the low magnesium content; the lowest values were found in Stare Jabłonki and Szczytno (only under Douglas fir). The analyzed potassium (K2O) and phytoavailable phosphorus (P2O5) contents were well below the standards for forest soils [69], and sufficient values were found only for the St. Jabłonki site. The nutrient composition of forest soils between the variants was similar, and the only difference was observed in potassium content in fresh and mixed fresh forest types. The highest humus content was found in soil from Jedwabno and Szczytno (beech) sites, and the values were significantly higher in Masurian than in Olsztynek Plain.
3.2. Taxonomic Analyses of Fungal Communities
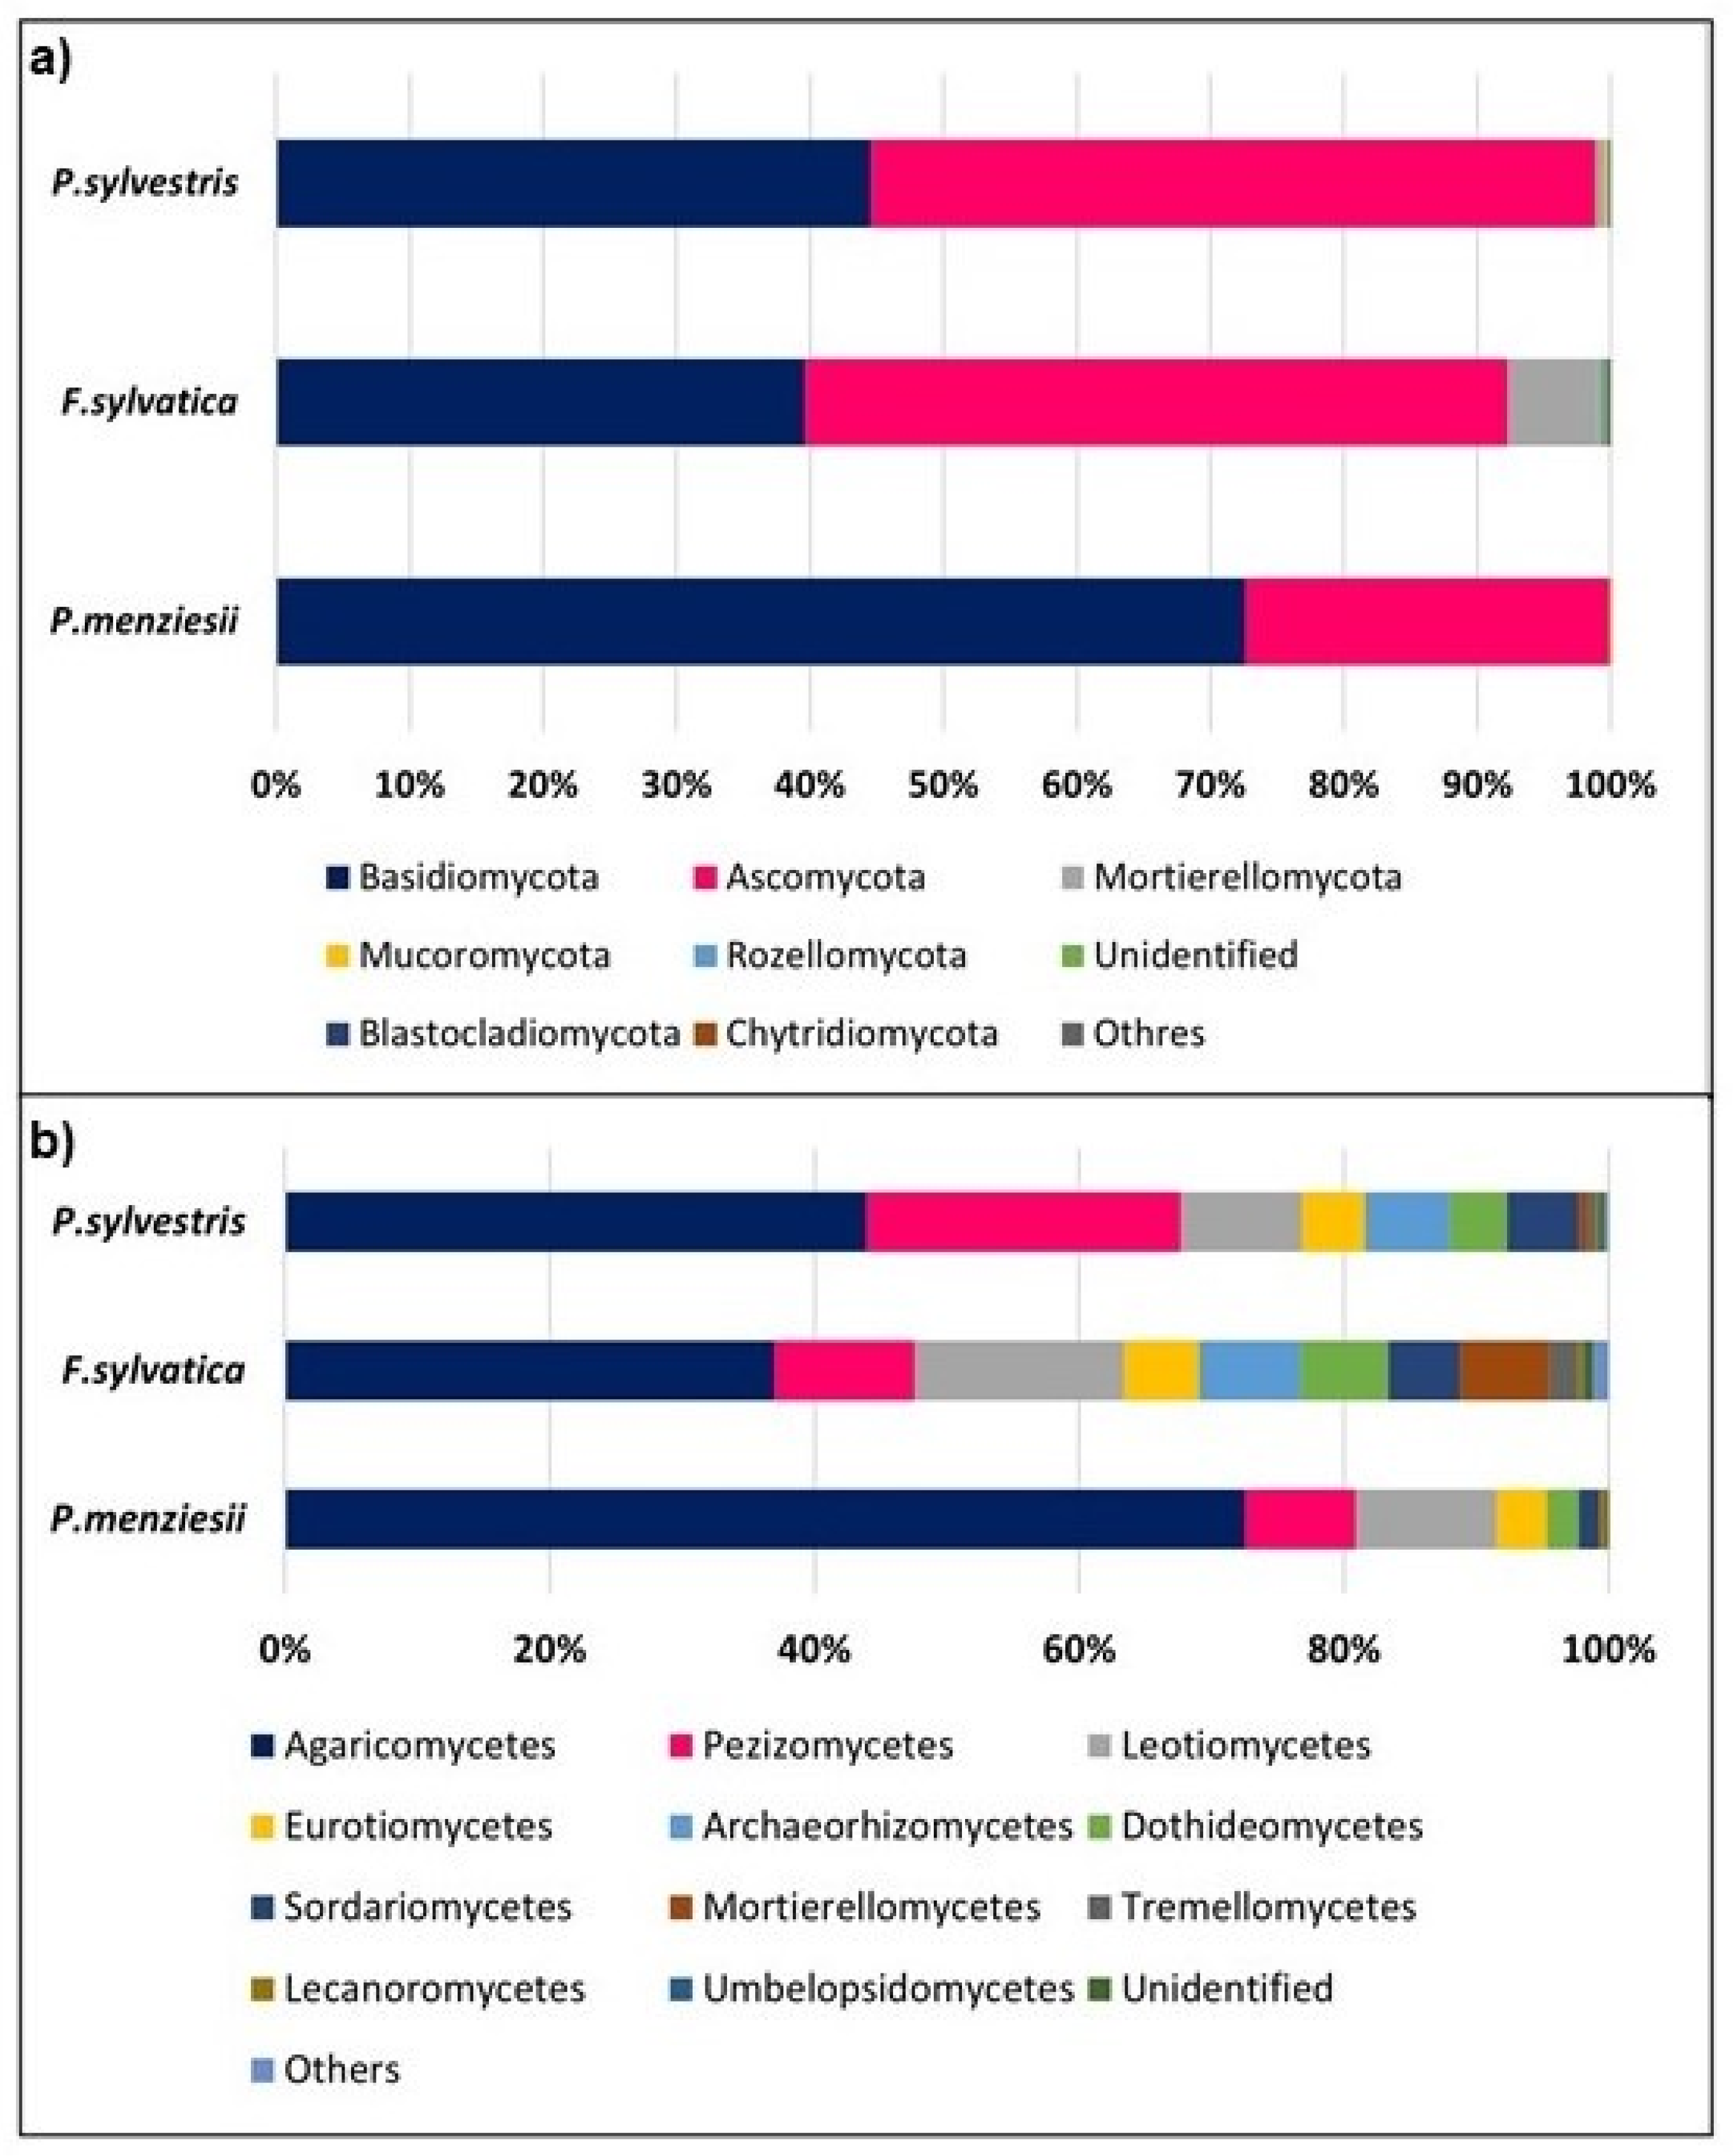
In total, we found 580 fungal OTUs from the Douglas fir (P. menziesii), European beech (F. sylvatica), and Scots pine (P. sylvestris) root samples. Among those, 33, 97, and 95 OTUs were found exclusively in, root samples of Douglas fir, beech, and pine respectively, and 124 were common to all sample types. Of all OTUs found on roots, 32 occurred on both Douglas fir and beech; 52 OTUs were found on roots of Douglas fir and pine, and 147 OTUs were observed on pine and beech roots. Among the fungal OTUs 579 (95.7% of reads) were identified to phylum, 558 (91.6% of reads) to order, 499 (77.0% of reads) to genus and 418 (52.0% of reads) to species. A total of 12 phyla were observed in all the root samples from all the tree species (Figure 2a). Basidiomycota (average relative abundance 57.4%) and Ascomycota (average relative abundance 40.3%) phyla were dominant in all the tree samples. The abundance of OTUs of Basidiomycota and Ascomycota observed in each sample did not significantly differ among the tree species (p > 0.05).
At the class level, Agaricomycetes (average 54.45%), Pezizomycetes (12.76%), and Leotiomycetes (11.59%) were the dominant taxa in all the samples of the 43 classes detected (Figure 2b). The abundances of Agaricomycetes, Pezizomycetes, and Leotiomycetes did not significantly differ among the samples from different tree species (p > 0.05).
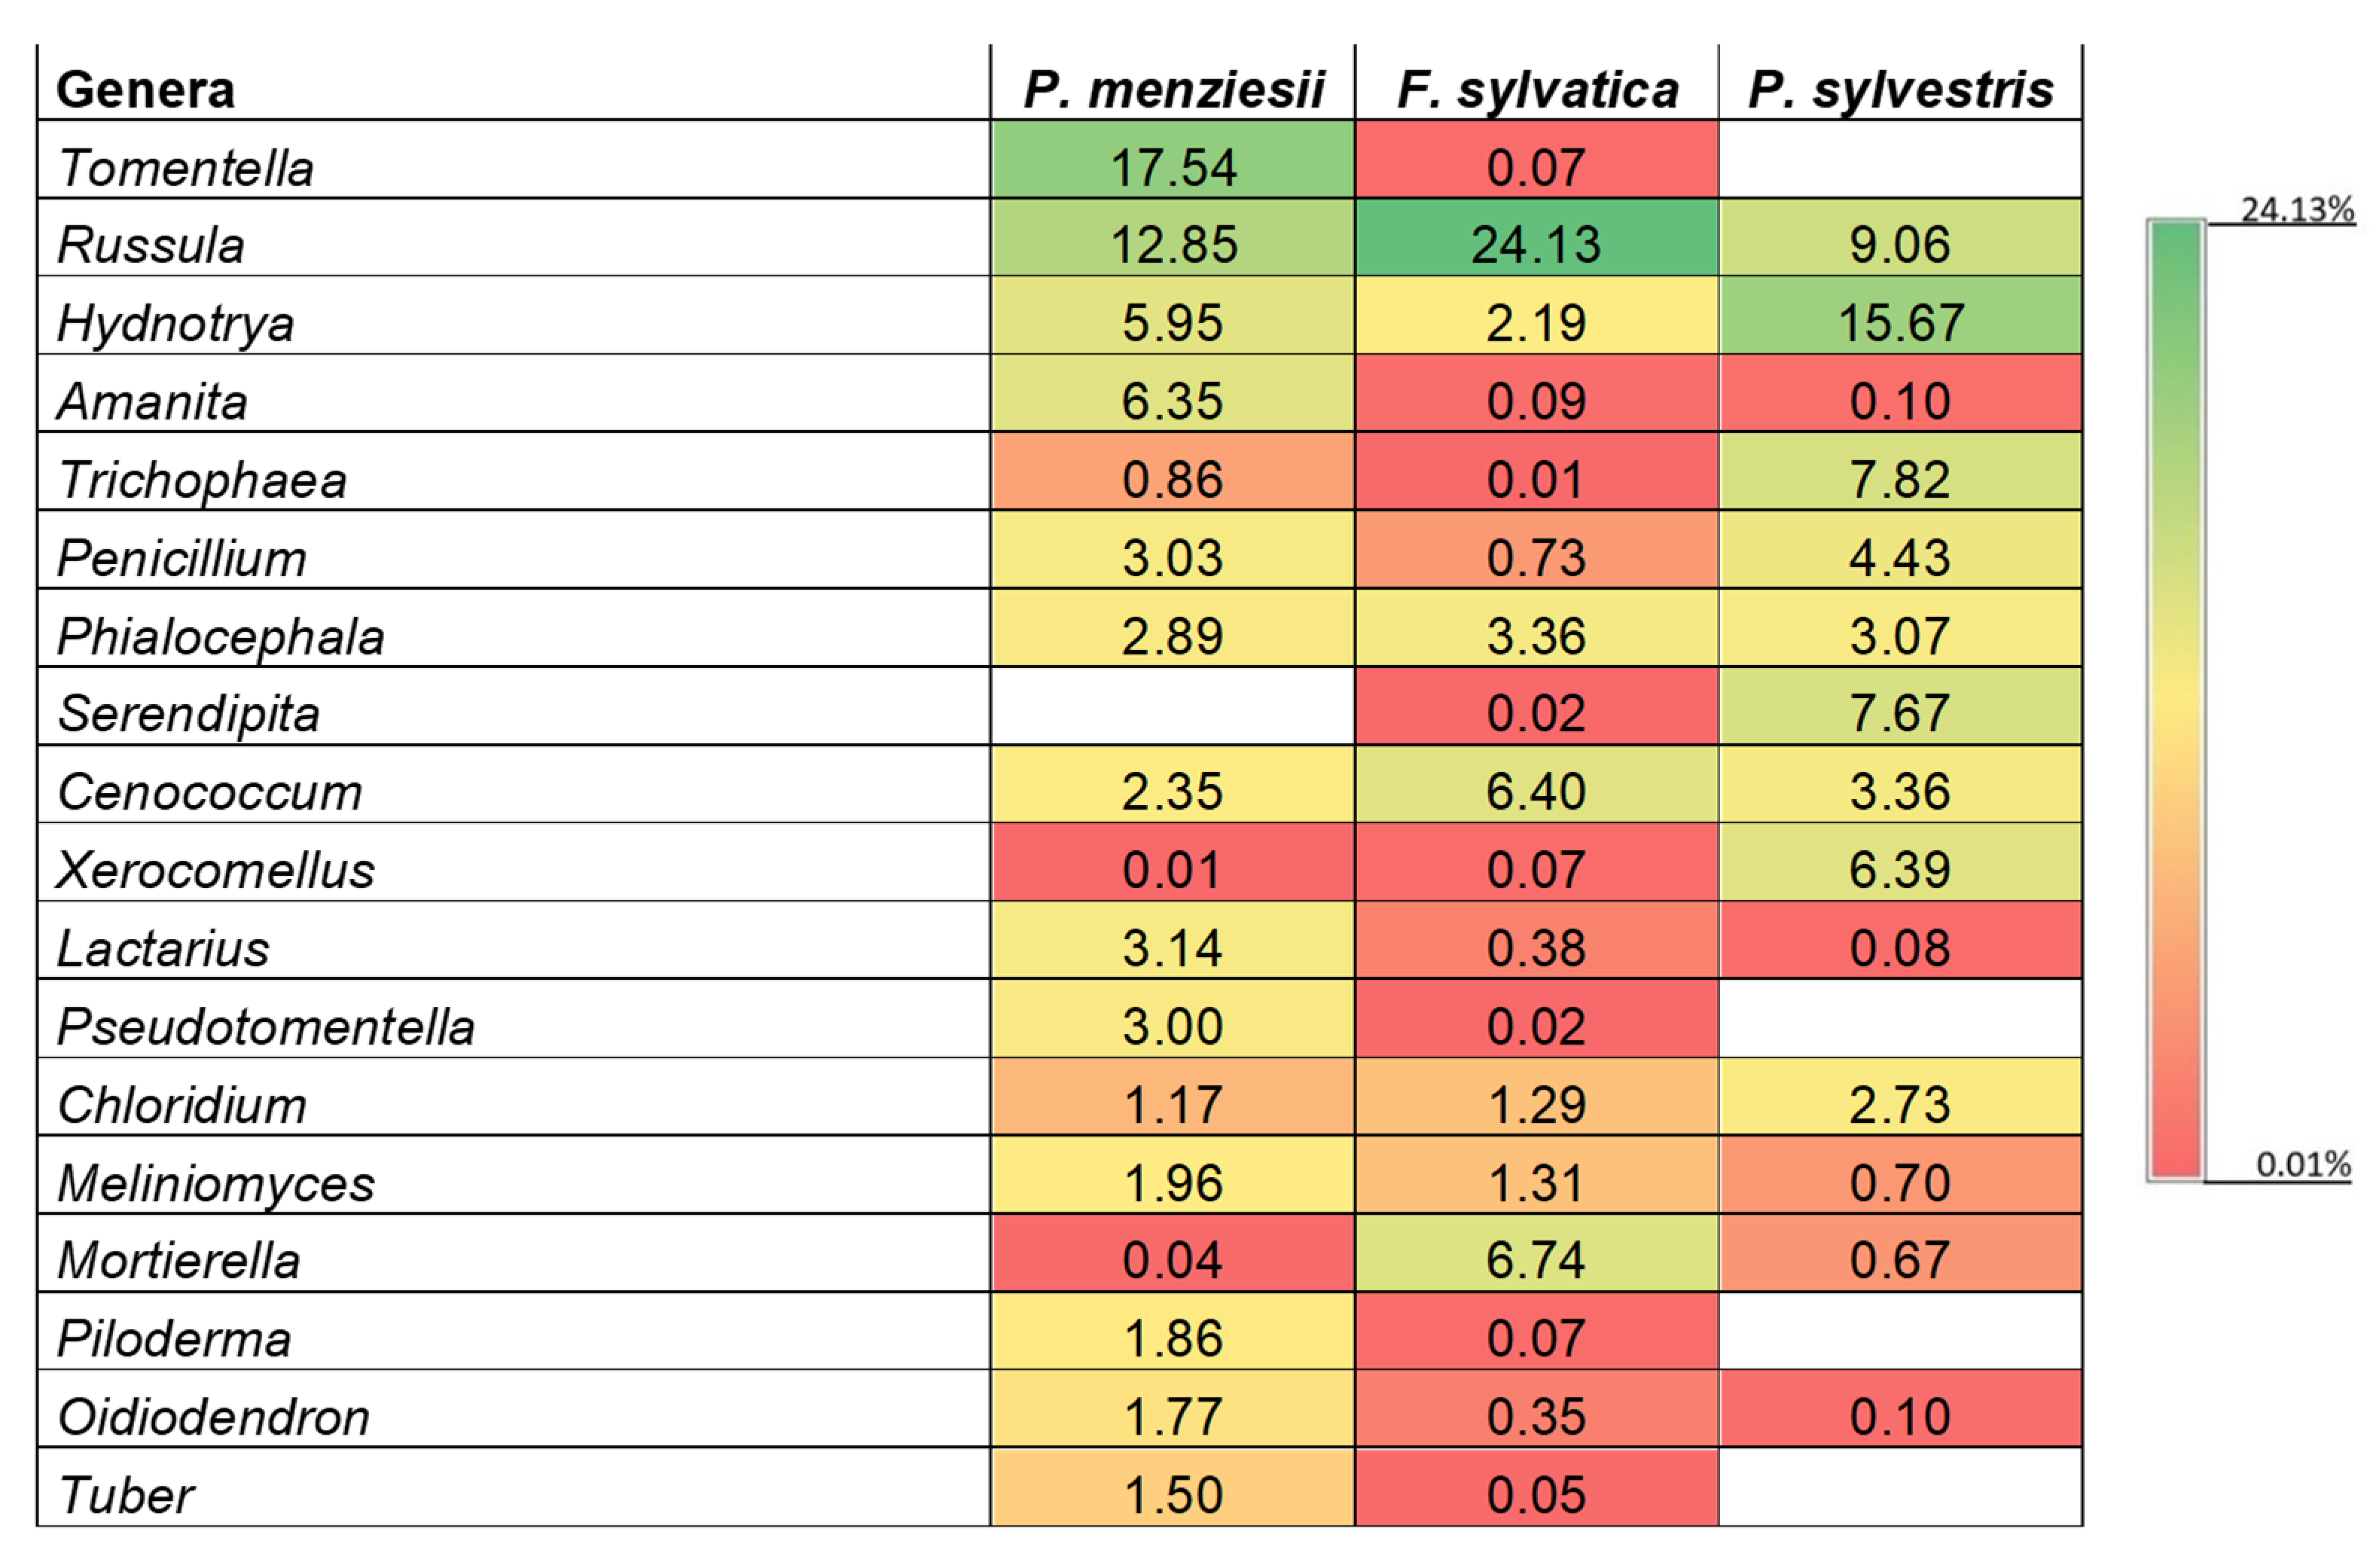
A total of 371 genera were observed, of which 19 were detected in all the samples. The most abundant observed genera were Tomentella (relative abundance of 11.02%, for P. menziesii, even 17.54%), Russula (10.73%), Thelephoraceae unidentified genus (9.00%), and Hydnotrya (7.30%) (Figure 3). These genera were detected in the roots of all the analyzed tree species. Archaeorhizomyces and Serendipita were not detected in the Douglas fir roots, whereas Pseudotomentella, Piloderma, and Tuber were not detected in the Scots pine root samples.
The fungal trophic modes and functional groups of the OTUs were defined using FUNGuild v. 1.1 [70] and recorded in Supplementary Table S1. Regarding the trophic mode of the fungal community (Figure 4a), the analyzed samples showed a higher abundance of symbiotrophs (average relative abundance 66.33%) in comparison to the other trophic groups. In particular, the fungal community of Douglas fir roots was dominated by symbiotrophs (71.8%) compared to the other studied species (Scots pine 59.3, beech 39.6%). On the other hand, saprotroph-symbiotroph and saprotroph OTUs were more abundant in beech roots (23.8 and 32.6%, respectively) than in Douglas fir (20.0 and 5.6%, respectively) and Scots pine (18.4 and 19.3%, respectively). However, the abundance of OTUs classified under each trophic mode did not significantly differ among the analyzed tree species (p > 0.05).
Regarding the fungal functional group (Figure 4b), all the samples were dominated by OTUs classified as ectomycorrhizal (average relative abundance 59.33%). The relative abundance of ectomycorrhizal OTUs in the Douglas fir samples (66.0%) was higher than in Scots pine and beech (42.5 and 31.9%, respectively). The Douglas fir (5.3%) and Scots pine (4.3%) contained less endophyte OTUs than beech (10.4%). The soil saprotrophs in the beech and Scots pine roots (23.6 and 10.3%, respectively) were more abundant than in the Douglas fir (0.02%). Nevertheless, the abundance of OTUs classified to each group did not significantly differ among the analyzed tree species (p > 0.05).
A total of 87 ectomycorrhizal taxa were observed, of which 19 were detected in the roots of all the tree species (Table 4). The 21 EC taxa were found only in the samples from F. sylvatica and P. sylvestris. By contrast, 10 EC fungi occurred only on the Douglas fir and Scots pine roots, and 7 were observed on Douglas fir and beech roots. Seven ectomycorrhizal fungi were exclusively associated with Douglas fir; by contrast, beech was associated with 16 ectomycorrhizal fungal taxa. Five ectomycorrhizal fungal taxa were found in the samples from Scots pine only. Notably, the most common ectomycorrhizal OTU in Douglas fir was the basidiomycete fungus Pseudotomentella tristis (P. Karst.) M.J. Larsen, whose relative abundance was over 3.5%. This was the highest relative abundance among the ectomycorrhizal fungal species inhabiting the roots of only one plant-host species.
3.3. Correlations: Fungi and Soil
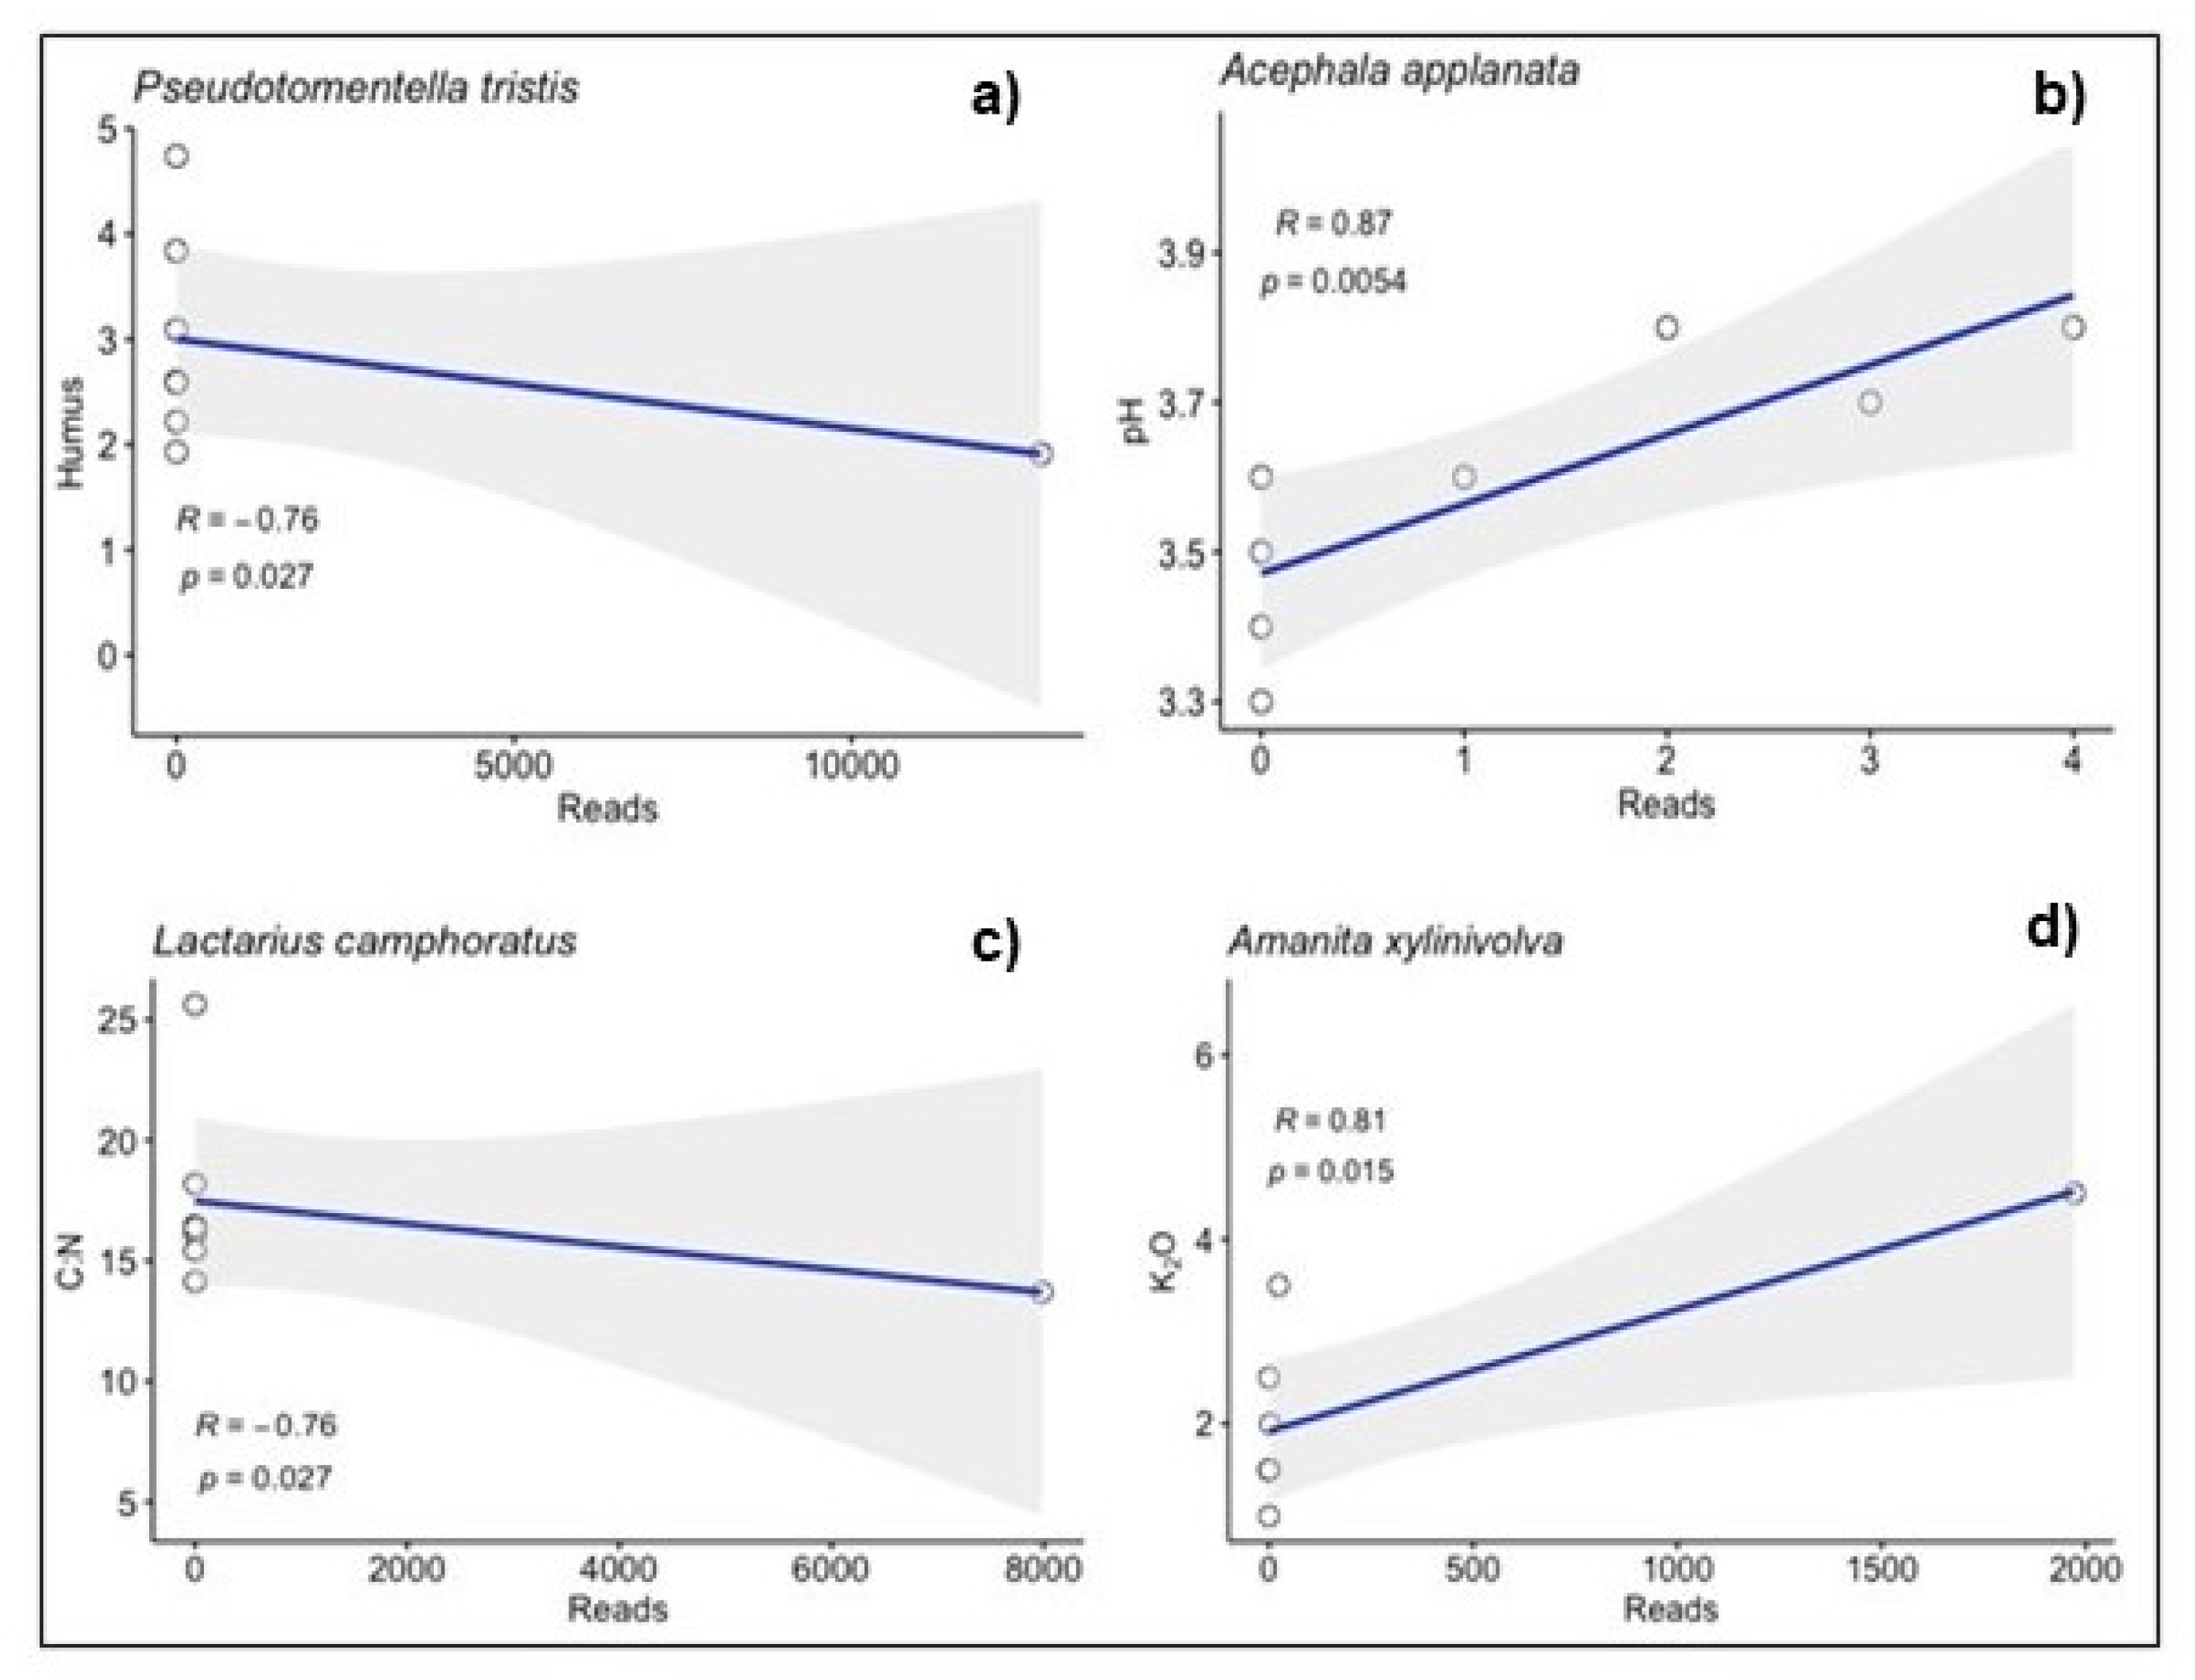
The assessment of the significance of the influences of some soil parameters on the occurrence of specific fungal species in the studied communities confirmed such a relationship in 46 cases (Supplementary Table S2). An illustration of the course of correlation lines for selected cases is presented in Figure 5.
We found P. tristis in communities of P. menziesii roots only with the strongest correlation with humus content (Figure 5a). Acephala applanata Grünig & T.N. Sieber, in turn, was present in the roots of all the assessed tree species, with the strongest correlation with soil pH (Figure 5b). Lactarius camphoratus (Bull.) Fr. was found only in the roots of P. menziesii and F. sylvestris and was significantly correlated with the C:N index (Figure 5c), whereas Amanita xylinivolva Tulloss, Ovrebo & Halling, present in the roots of P. menziesii and P. sylvestris, was significantly correlated with the amount of K2O (Figure 5d).
3.4. Diversity Indices of Fungal Communities
High-throughput sequencing was used to detect the differences in fungal diversity in the P. menziesii, F. sylvatica, and P. sylvestris roots. The analysis of estimated richness indices (observed species and Chao1) revealed that the pine and beech roots exhibited the highest values, whereas the Douglas fire root samples showed the lowest fungal richness (Table 5). The Shannon diversity index and the phylogenetic diversity index (Faith PD) indicated that fungal diversity was highest in the pine and beech and lowest in Douglas fire roots. These differences were, however, not statistically significant (p > 0.05).
The Beta biodiversity analysis, which included calculations of weighted and unweighted UniFrac metrics, Bray-Curtis, and Jaccard indicators, showed how the fungal microbes differed among the analyzed groups: forest district, mesoregion, tree, or site. The results of the PERMANOVA showed some significant statistical differences, revealing phylogenetic distances between the groups of samples. The unweighted Unifrac metrics showed the difference in the microbiome between tree types (P. menziesii vs. other species) at the level of p = 0.05 (Figure 6a). This difference was especially noticeable in the case of the P. sylvestris JK biome, shown as a red dot in the upper left corner of this chart. On the other hand, the weighted Unifrac metric revealed differences in the microbiome at the level of p = 0.05, depending on the selected mesoregion (Figure 6b). In addition, an interesting relationship was shown by the analysis of the Bray–Courtis index; the largest differences in the microbiome were observed between the DR Forest District and the others, with p = 0.026 (Figure 6c). However, the biodiversity analysis for the Jaccard index showed no differences in microbiomes between the site, mesoregion, tree and forest district groups analyzed.
4. Discussion
Microbes inhabiting the rhizosphere are predominantly composed of bacteria and fungi [71]. Microbial communities in forest soil take part in the decomposition of dead plant biomass and contribute to a range of essential soil processes involved in the local and global cycling of carbon, nitrogen, and phosphorus [72,73,74]. The abundance and community structure of the soil microbiome are affected by the diversity of forest tree species and result from obligate ecological associations [75]. Based on previous studies, tree species diversity influences aboveground biomass production, litter decomposition, fine root biomass, and the soil biota, thus affecting soil chemical properties [76,77]. Several studies [78,79] show that conifers and broadleaves have different impacts on soil properties in different soil layers (forest floor, 0–10 cm, 10–20 cm). Generally, conifers increase the soil C stock and the C:N ratio and decrease pH, particularly in the forest floor and topsoil layers [80]. However, a notable exception among conifers is Douglas fir, with an unusually low C:N ratio in the forest floor [81]. Based on the results of the FunDivEUROPE project, analyzing soil chemical properties across European forests, Poland, on average, features the lowest soil pH (4.0 in the 10–20-cm layer) and the lowest nitrogen and carbon stocks (2.9 and 52 Mg ha−1, respectively) compared to other European countries [77]. In our study, the soil carbon and nitrogen levels were low (1.11–2.75% and 0.068–0.168%, respectively), and, on average, significantly varied between mesoregions only. However, the C:N ratio varied between sites—in mixed fresh sites in assessed forest districts, the ratio (18.61) was significantly higher than in fresh sites (15.41). The correct C:N ratio of organic substrate should be 20–30:1, even in temperate zones, because about 30% of the carbon is derived by microbial decomposition [82]. A higher value means that the microorganisms take up available nitrogen from the soil (nitrogen immobilization). A C:N value below 20:1 results in higher mineralization rates when available nitrogen in the mineral form (NH4+, NO3−) appears, and any excess either leaches out of the soil or evaporates [83,84]. According to ICP Forest data, 95% of the mineral topsoil (0–10 cm) C:N ratios range between 10 and 32. The ratios significantly decrease with depth to a relatively stable level below 20 cm [81]. The C:N values of the soils analyzed in this study were within the typical value range, indicating their high biological activity; this was also confirmed by the values of the ecological indices.
Humus quantity and quality accumulated in soil are essential for soil fertility and the effective operation of ecosystems. In forest soils, the main factors affecting the properties of humic substances are tree stand species composition and stand age [85]. Both assessed mesoregions varied significantly (3.40 vs. 2.33) regarding soil humus, with better soil trophic conditions on the Masurian Plain, especially under F. sylvatica trees. Still, these values were lower than what Eremin [86] described for leached chernozems of the Trans-Ural Forest-Steppe Zone (4.04–4.18%). Better habitat conditions in this mesoregion also had a positive effect on the average diameter and height of P. menziesii, which is indirectly related to the greater activity of the development of root systems and the fungi inhabiting them, including mycorrhizal fungi, that supply the trees with water and mineral nutrients [87]. A further noteworthy aspect is the lower acidifying effect on soil compared to P. sylvestris [88].
Some taxa were positively correlated with particular soil properties. For example, P2O5 with P. tristis found in the P. menziesii fine roots only and in high OTU amount or K2O with A. xylinivolva occurring together in the P. menziesii and P. sylvestris roots. A long list of taxa inhabiting fine roots of the assessed three tree species significantly correlated with different soil compounds, indicating the important influence of the site on soil mycobiota. Fungi occupying roots of adjacent trees together, such as P. menziesii and F. sylvatica (7 taxa), were three times less numerous than those inhabiting the roots of P. sylvestris and F. sylvatica (21 taxa). These results indicate the greater degree of adaptation of fungi to the colonization of the roots of local trees than the introduced P. menziesii, even though 130 years have passed. It is worth noting that the biomes of P. menziesii SZ and P. menziesii JK were almost identical (for Simpson and Shannon indexes the p-value of Kruskal-Wallis test was 1), which could be due to the fact that they are located in the same mesoregion, despite a different habitat and different species of the neighboring trees (see Table 1).
The obtained diversity indicators showed the lowest values for communities isolated from the roots of P. menziesii compared to the samples collected from the roots of P. sylvestris and F. sylvatica. With a twice smaller number of species living in the roots of P. menziesii, this suggests the relatively exact composition of the community, dominated by mycorrhizal species, especially Tomentella, Russula, and Thelephora sp. This suggests a lack of competitiveness of the introduced alien species against native fungal communities of a given habitat, or even a weak “molecular dialogue” with horizontal gene transfer [89,90,91]. Such a possibility of P. menziesii invasiveness towards various species of Nothofagaceae has been indicated in a study by Salgado Salomón et al. [92]. The presence of some species of mycorrhizal fungi shared by conifers P. menziesii and P. sylvestris, both several EM and AM (Wilcoxina rehmii Chin S. Yang & Korf, Endogone spp.), and by broadleaf F. sylvatica (7 species of EM, mainly Lactarius spp.) indicate that this is a local adaptation by adjacent trees. The presence of as many as 21 species of mycorrhizal fungi common for the roots of the three studied species with cosmopolitan distribution, both pioneers and generalists, confirm this assumption. We should note that several species of mycorrhizal fungi were characteristic for P. menziesii only: P. tristis, Tuber puberulum Berk. & Broome, Lactarius sp., and Amphinema sp.; these associations have also been stated by Larsen [93] and Bonito et al. [94].
The results indicate that communities of the root fungi of P. menziesii are characterized by the dominance of symbiotrophs (71.8%) over pathogens (0.24%) compared to the roots of P. sylvestris and F. sylvatica. These are two functional groups of fungi that have a strong influence on root growth and performance due to their significant impact. For the standardized OTU abundance of species representing symbiotrophs and saprotrophs found in the root samples studied, the comparison analysis and the Kruskall–Wallis rank sum test (p-value ~0.1) showed that the occurrence of species in specific trophic groups differed quantitatively, with symbiotrophs predominating. Pathogens that are present in the native range may not be present in the introduced range, giving the introduced species a competitive advantage over the native species [43,95]. This phenomenon is consistent with the enemy release hypothesis, which states that non-native species thrive in their new range because they are no longer hindered by their natural enemies [96]. For plants that rely on symbiotrophic fungi in the soil (e.g., ectomycorrhizal fungi), several strategies have been proposed to facilitate invasion. Plants are not hindered in their new range if they are able to associate with novel mutualists, associate with commonly distributed symbionts, or invade together with their native symbionts [97,98]. The obtained results indicate that P. menziesii finds favorable conditions for the establishment of mutualistic contacts in the conditions of North-Eastern Poland, allows local populations of symbiotic fungi, and is attacked by pathogenic organisms to a small extent [99]. This confirms that Douglas fir offers high potential as an introduced species for forestry in Central Europe, especially on better sites in Poland.
5. Conclusions
We found differences in fungal communities between mesoregions, especially in the samples from the Masurian Plain, which were characterized by a higher proportion of C, N, C:N and humus in the soil. The biota from the roots of P. menziesii growing in the stands of SZ and JK Forest Districts, but in the same mesoregion, were almost identical. The communities from the Forest District DR, representing a different mesoregion, were different from the others. The biota from the roots of P. menziesii exhibited poorer and more deficient taxonomic composition than those from the other adjacent tree species, and Agaricomycetes predominated. The biota from the fine roots of P. menziesii were characterized by the highest proportion of symbiotrophs, including ectomycorrhizal fungi. Some fungal species in the roots of P. menziesii were common with the biota in the roots of other trees in adjacent stands, mainly F. sylvatica, while some (seven species) were found only in Douglas fir.
The results suggest that the degree of naturalness of fungi colonizing the roots of P. menziesii is still differentiated compared to the biota of native species, despite the 130 years that have passed.
Supplementary Materials
The following are available online at https://www.mdpi.com/article/10.3390/f12121766/s1. Table S1: The fungal trophic mode and functional group of the OTUs defined by FUNGuild v1.1. Table S2: The Spearman correlations between identified microbiome and soil properties (p < 0.05).
Author Contributions
The general conception of the project was provided by Z.S. and M.D. M.D., Z.S. and S.P.—sampling, field data and carrying out the experiment, M.D., K.S. and H.S.—microbiological analysis, A.M.—bioinformatics analysis, and A.M., H.S. and S.P.—statistical analysis and interpretation. All authors contributed to conceptualization, drafting and preparation of the manuscript, review and editing the text. All authors have read and agreed to the published version of the manuscript.
Funding
This article was supported in part by University of Warmia and Mazury (Project No. 30.610.019-110) and State Forests—National Forest Holding in Poland (Project No. 500 465; Contract No. EO.271.3.2.2020).
Institutional Review Board Statement
Not applicable.
Informed Consent Statement
Not applicable.
Data Availability Statement
The data presented in this study are openly available in FigShare at https://doi.org/10.6084/m9.figshare.17185883.v1 or Supplementary Material.
Acknowledgments
The authors would like to thank the anonymous reviewers for their valuable comments and suggestions.
Conflicts of Interest
Authors declare no personal circumstances or interests that may be perceived as inappropriately influencing the representation or interpretation of reported research results.
References
- Smith, S.; Read, D. Mycorrhizal Symbiosis, 3rd ed.; Academic Press: San Diego, CA, USA, 2008. [Google Scholar]
- Green, J.; Bohannan, B.J.M. Spatial scaling of microbial biodiversity. Trends Ecol. Evol. 2006, 21, 501–507. [Google Scholar] [CrossRef]
- Lauber, C.L.; Strickland, M.S.; Bradford, M.A.; Fierer, N. The influence of soil properties on the structure of bacterial and fungal communities across land-use types. Soil Biol. Biochem. 2008, 40, 2407–2415. [Google Scholar] [CrossRef]
- Kasel, S.; Bennett, L.T.; Tibbits, J. Land use influences soil fungal community composition across central Victoria, South-Eastern Australia. Soil Biol. Biochem. 2008, 40, 1724–1732. [Google Scholar] [CrossRef]
- Toju, H.; Sato, H.; Tanabe, A.S. Diversity and spatial structure of belowground plant-fungal symbiosis in a mixed subtropical forest of ectomycorrhizal and arbuscular mycorrhizal plants. PLoS ONE 2014, 9, e86566. [Google Scholar] [CrossRef] [PubMed]
- Goldmann, K.; Schröter, K.; Pena, R.; Schöning, I.; Schrumpf, M.; Buscot, F.; Polle, A.; Wubet, T. Divergent habitat filtering of root and soil fungal communities in temperate beech forests. Sci. Rep. 2016, 6, 31439. [Google Scholar] [CrossRef]
- Green, J.L.; Holmes, A.J.; Westoby, M.; Oliver, I.; Briscoe, D.; Dangerfield, M.; Gillings, M.; Beattie, A.J. Spatial scaling of microbial eukaryote diversity. Nature 2004, 432, 747–750. [Google Scholar] [CrossRef]
- Goldmann, K.; Schöning, I.; Buscot, F.; Wubet, T. Forest management type influences diversity and community composition of soil fungi across temperate forest ecosystems. Front. Microbiol. 2015, 6, 1300. [Google Scholar] [CrossRef] [Green Version]
- Read, D.J.; Perez-Moreno, J. Mycorrhizas and nutrient cycling in ecosystems—A journey towards relevance? New Phytol. 2003, 157, 475–492. [Google Scholar] [CrossRef]
- Van Der Heijden, M.G.A.; Horton, T.R. Socialism in soil? The importance of mycorrhizal fungal networks for facilitation in natural ecosystems. J. Ecol. 2009, 97, 1139–1150. [Google Scholar] [CrossRef]
- Simard, S.; Austin, M. The role of mycorrhizas in forest soil stability with climate change. In Climate Change and Variability; Simard, S.W., Ed.; InTech Open Access: Rijeka, Croatia, 2010. [Google Scholar]
- Aponte, C.; García, L.V.; Marañón, T.; Gardes, M. Indirect host effect on ectomycorrhizal fungi: Leaf fall and litter quality explain changes in fungal communities on the roots of co-occurring Mediterranean oaks. Soil Biol. Biochem. 2010, 42, 788–796. [Google Scholar] [CrossRef] [Green Version]
- Buée, M.; Reich, M.; Murat, C.; Morin, E.; Nilsson, R.H.; Uroz, S.; Martin, F. 454 Pyrosequencing analyses of forest soils reveal an unexpectedly high fungal diversity. New Phytol. 2009, 184, 449–456. [Google Scholar] [CrossRef]
- Burke, D.J.; López-Gutiérrez, J.C.; Smemo, K.A.; Chan, C.R. Vegetation and Soil Environment Influence the Spatial Distribution of Root-Associated Fungi in a Mature Beech-Maple Forest. Appl. Environ. Microbiol. 2009, 75, 7639–7648. [Google Scholar] [CrossRef] [Green Version]
- Koide, R.T.; Fernandez, C.; Petprakob, K. General principles in the community ecology of ectomycorrhizal fungi. Ann. For. Sci. 2011, 68, 45–55. [Google Scholar] [CrossRef] [Green Version]
- Tedersoo, L.; Suvi, T.; Jairus, T.; Kõljalg, U. Forest microsite effects on community composition of ectomycorrhizal fungi on seedlings of Picea abies and Betula pendula. Environ. Microbiol. 2008, 10, 1189–1201. [Google Scholar] [CrossRef]
- Lance, A.C.; Carrino-Kyker, S.R.; Burke, D.J.; Burns, J.H. Individual plant-soil feedback effects influence tree growth and rhizosphere fungal communities in a femperate forest restoration experiment. Front. Ecol. Evol. 2020, 7, 500. [Google Scholar] [CrossRef] [Green Version]
- Wang, M.; Shi, S.; Lin, F.; Jiang, P. Response of the soil fungal community to multi-factor environmental changes in a temperate forest. Appl. Soil Ecol. 2014, 81, 45–56. [Google Scholar] [CrossRef]
- Defrenne, C.E.; Philpott, T.J.; Guichon, S.H.A.; Roach, W.J.; Pickles, B.J.; Simard, S.W. Shifts in ectomycorrhizal fungal communities and exploration types relate to the environment and fine-root traits across interior Douglas-Fir forests of Western Canada. Front. Plant Sci. 2019, 10, 643. [Google Scholar] [CrossRef] [Green Version]
- Margulies, M.; Egholm, M.; Altman, W.E.; Attiya, S.; Bader, J.S.; Bemben, L.A.; Berka, J.; Braverman, M.S.; Chen, Y.-J.; Chen, Z.; et al. Genome sequencing in microfabricated high-density picolitre reactors. Nature 2005, 437, 376–380. [Google Scholar] [CrossRef]
- Van Dijk, E.L.; Auger, H.; Jaszczyszyn, Y.; Thermes, C. Ten years of next-generation sequencing technology. Trends Genet. 2014, 30, 418–426. [Google Scholar] [CrossRef]
- Taberlet, P.; Coissac, R.; Pompanon, F.; Brochmann, C.; Willerslev, E. Towards next-generation biodiversity assessment using DNA metabarcoding. Mol. Ecol. 2012, 21, 2045–2050. [Google Scholar] [CrossRef]
- Sun, X.; Hu, Y.-H.; Wang, J.; Fang, C.; Li, J.; Han, M.; Wei, X.; Zheng, H.; Luo, X.; Jia, Y. Efficient and stable metabarcoding sequencing data using a DNBSEQ-G400 sequencer validated by comprehensive community analyses. Gigabyte 2021, 2021, 1–15. [Google Scholar] [CrossRef]
- Tedersoo, L.; Bahram, M.; Põlme, S.; Kõljalg, U.; Yorou, N.S.; Wijesundera, R.; Ruiz, L.V.; Vasco-Palacios, A.M.; Thu, P.Q.; Suija, A.; et al. Global diversity and geography of soil fungi. Science 2014, 346, 1256688. [Google Scholar] [CrossRef] [PubMed] [Green Version]
- Bullington, L.S.; Larkin, B.G. Using direct amplification and next-generation sequencing technology to explore foliar endophyte communities in experimentally inoculated western white pines. Fungal Ecol. 2015, 17, 170–178. [Google Scholar] [CrossRef]
- Jumpponen, A.; Jones, K.L.; Mattox, J.D.; Yaege, C. Massively parallel 454-sequencing of fungal communities in Quercus spp. ectomycorrhizas indicates seasonal dynamics in urban and rural sites. Mol. Ecol. 2010, 19, 41–53. [Google Scholar] [CrossRef] [PubMed]
- Schmidt, P.-A.; Bálint, M.; Greshake, B.; Bandow, C.; Römbke, J.; Schmitt, I. Illumina metabarcoding of a soil fungal community. Soil Biol. Biochem. 2013, 65, 128–132. [Google Scholar] [CrossRef]
- Toju, H.; Yamamoto, S.; Sato, H.; Tanabe, A.S.; Gilbert, G.S.; Kadowaki, K. Community composition of root-associated fungi in a Quercus-dominated temperate forest: ‘codominance’ of mycorrhizal and root-endophytic fungi. Ecol. Evol. 2013, 3, 1281–1293. [Google Scholar] [CrossRef]
- Rodriguez-Ramos, J.C.; Cale, J.A.; Cahill, J.F., Jr.; Simard, S.W.; Karst, J.; Erbilgin, N. Changes in soil fungal community composition depend on functional group and forest disturbance type. New Phytol. 2021, 229, 1105–1117. [Google Scholar] [CrossRef]
- Burke, D.J.; Carrino-Kyker, S.R.; Burns, J.H. Is it climate or chemistry? Soil fungal communities respond to soil nutrients in a multi-year high-resolution analysis. Ecosphere 2019, 10, e02896. [Google Scholar] [CrossRef] [Green Version]
- Kujawska, M.B.; Rudawska, M.; Wilgan, R.; Leski, T. Similarities and differences among soil fungal assemblages in managed forests and formerly managed forest reserves. Forests 2021, 12, 353. [Google Scholar] [CrossRef]
- Schwappach, A. Die Ergebnisse der in Preussischen Staatsforsten Ausgeführthen Anbauversuche Mit Fremdländischen Holzarten; Sonderabdruck aus der Zeitschrift für Forst- und Jagdwesen: Berlin, Germany, 1901; p. 57. [Google Scholar]
- Schwappach, A. Die Weitere Entwicklund der Versuchemitfremdlandischen Holzarten in Preussen. Z. Forst Jagdwes. 1911, 43, 757–782. [Google Scholar]
- Blike, G. Mortzfeld’s Stands—A Way of Forest Conversion in Northeast Germany (Mortzfeld’sche Lochbestände—ein Weg für den Waldumbau in Nordostdeutschland, in Germany); Ökologisch; Eberswalder Forstliche Schriftenreihe: Eberswalde, Germany, 2005. [Google Scholar]
- Tumiłowicz, J. The evaluation of results of introduction of some foreign tree species in forests of the Mazuria-Podlasie region. Part I (Ocena wyników wprowadzenia niektórych obcych gatunków drzew w lasach Krainy Mazursko-Podlaskiej. Cześć I). Rocz. Dendrol. 1967, 21, 135–169. [Google Scholar]
- Tumiłowicz, J. The evaluation of results of introduction of some foreign tree species in forests of the Mazuria-Podlasie region. Part II (Ocena wyników wprowadzania niektórych obcych gatunków drzew w lasach krainy Mazursko-Podlaskiej. Część II.). Rocz. Dendrol. 1968, 22, 1115–1148. [Google Scholar]
- Castaldi, C.; Marchi, M.; Vacchiano, G.; Corona, P. Douglas-fir climate sensitivity at two contrasting sites along the southern limit of the European planting range. J. For. Res. 2020, 31, 2193–2204. [Google Scholar] [CrossRef] [Green Version]
- Isaac-Renton, M.G.; Roberts, D.R.; Hamann, A.; Spiecker, H. Douglas-fir plantations in Europe: A retrospective test of assisted migration to address climate change. Glob. Chang. Biol. 2014, 20, 2607–2617. [Google Scholar] [CrossRef]
- Schmid, M.; Pautasso, M.; Holdenrieder, O. Ecological consequences of Douglas fir (Pseudotsuga menziesii) cultivation in Europe. Eur. J. For. Res. 2014, 133, 13–29. [Google Scholar] [CrossRef] [Green Version]
- Panka, S. Gatunki drzew obcego pochodzenia na le nych powierzchniach do wiadczalnych Brandenburgii (Alien tree species in experimental forest plots in Brandenburg). Rocz. Pol. Tow. Dendro. 2012, 60, 21–42. [Google Scholar]
- Smolnikar, P.; Brus, R.; Jarni, K. Differences in growth and log quality of Douglas-Fir (Pseudotsuga menziesii (Mirb.) Franco) provenances. Forests 2021, 12, 287. [Google Scholar] [CrossRef]
- Briscoe, C.B. Early results of mycorrhizal inoculation of pine in Puerto Rico. Carribean For. 1959, 73–77. [Google Scholar]
- Reinhart, K.O.; Callaway, R.M. Soil biota and invasive plants. New Phytol. 2006, 170, 445–457. [Google Scholar] [CrossRef]
- Nuñez, M.A.; Horton, T.R.; Simberloff, D. Lack of belowground mutualisms hinders Pinaceae invasions. Ecology 2009, 90, 2352–2359. [Google Scholar] [CrossRef] [Green Version]
- Dickie, I.A.; Bolstridge, N.; Cooper, J.A.; Peltzer, D.A. Co-invasion by Pinus and its mycorrhizal fungi. New Phytol. 2010, 187, 475–484. [Google Scholar] [CrossRef] [PubMed]
- Tedersoo, L.; Suvi, T.; Beaver, K.; Kõljalg, U. Ectomycorrhizal fungi of the Seychelles: Diversity patterns and host shifts from the native Vateriopsis seychellarum (Dipterocarpaceae) and Intsia bijuga (Caesalpiniaceae) to the introduced Eucalyptus robusta (Myrtaceae), but not Pinus caribea (Pinaceae). New Phytol. 2007, 175, 321–333. [Google Scholar] [CrossRef]
- Kohout, P.; Sýkorová, Z.; Bahram, M.; Hadincová, V.; Albrechtová, J.; Tedersoo, L.; Vohník, M. Ericaceous dwarf shrubs affect ectomycorrhizal fungal community of the invasive Pinus strobus and native Pinus sylvestris in a pot experiment. Mycorrhiza 2011, 21, 403–412. [Google Scholar] [CrossRef]
- Cullings, K.; Raleigh, C.; Vogler, D.R. Effects of severe dwarf mistletoe infection on the ectomycorrhizal community of a Pinus contorta stand in Yellowstone Park. Can. J. Bot. 2005, 83, 1174–1180. [Google Scholar] [CrossRef]
- Gebhardt, S.; Neubert, K.; Wöllecke, J.; Münzenberger, B.; Hüttl, R.F. Ectomycorrhiza communities of red oak (Quercus rubra L.) of different age in the Lusatian lignite mining district, East Germany. Mycorrhiza 2007, 17, 279–290. [Google Scholar] [CrossRef]
- Trocha, L.K.; Kałucka, I.; Stasińska, M.; Nowak, W.; Dabert, M.; Leski, T.; Rudawska, M.; Oleksyn, J. Ectomycorrhizal fungal communities of native and non-native Pinus and Quercus species in a common garden of 35-year-old trees. Mycorrhiza 2012, 22, 121–134. [Google Scholar] [CrossRef] [PubMed] [Green Version]
- Banaszkiewicz, B.; Grabowska, K.; Panfil, M. Characterisation of atmospheric precipitation of Iława and Chełmińsko-Dobrzyńskie Lake Districts in the years 1951–2000. Acta Agrophys. 2009, 13, 575–585. [Google Scholar]
- Solon, J.; Borzyszkowski, J.; Bidłasik, M.; Richling, A.; Badora, K.; Balon, J.; Brzezińska-Wójcik, T.; Chabudziński, Ł.; Dobrowolski, R.; Grzegorczyk, I.; et al. Physico-geographical mesoregions of Poland: Varification and adjustment of boundaries on the basis of contemporary spatial data. Geogr. Pol. 2018, 91, 143–170. [Google Scholar] [CrossRef]
- Vořiškova, J.; Brabcová, V.; Cajthaml, T.; Baldrian, P. Seasonal dynamics of fungal communities in a temperate oak forest soil. New Phytol. 2014, 201, 269–278. [Google Scholar] [CrossRef]
- Avis, P.G.; McLaughlin, D.J.; Dentinger, B.C.; Reich, P.B. Long-term increase in nitrogen supply alters above- and below-ground ectomycorrhizal communities and increases the dominance of Russula spp. in a temperate oak savanna. New Phytol. 2003, 160, 239–253. [Google Scholar] [CrossRef] [Green Version]
- Gehring, C.A.; Whitham, T.G. Reduced mycorrhizae on Juniperus monosperma with mistletoe: The influence of environmental stress and tree gender on a plant parasite and a plant-fungal mutualism. Oecologia 1992, 89, 298–303. [Google Scholar] [CrossRef] [PubMed]
- Smreczak, B.; Łachacz, A. Soil types specified in the bonitation classification and their analogues in the sixth edition of the Polish Soil Classification (Typy gleb wyróżniane w klasyfikacji bonitacyjnej i ich odpowiedniki w 6. wydaniu Systematyki gleb Polski, in Polish). Soil Sci. Annu. 2019, 70, 115–136. [Google Scholar] [CrossRef]
- Vilgalys, R.; Gonzalez, D. Organization of ribosomal DNA in the basidiomycete Thanatephorus praticola. Curr. Genet. 1990, 18, 277–280. [Google Scholar] [CrossRef] [PubMed]
- Bolyen, E.; Rideout, J.R.; Dillon, M.R.; Bokulich, N.A.; Abnet, C.C.; Al-Ghalith, G.A.; Alexander, H.; Alm, E.J.; Arumugam, M.; Asnicar, F.; et al. Reproducible, interactive, scalable and extensible microbiome data science using QIIME 2. Nat. Biotechnol. 2019, 37, 852–857. [Google Scholar] [CrossRef]
- Edgar, R.C. Search and clustering orders of magnitude faster than BLAST. Bioinformatics 2010, 26, 2460–2461. [Google Scholar] [CrossRef] [PubMed] [Green Version]
- Abarenkov, K.; Henrik Nilsson, R.; Larsson, K.-H.; Alexander, I.J.; Eberhardt, U.; Erland, S.; Høiland, K.; Kjøller, R.; Larsson, E.; Pennanen, T.; et al. The UNITE database for molecular identification of fungi—Recent updates and future perspectives. New Phytol. 2010, 186, 281–285. [Google Scholar] [CrossRef]
- Chao, A. Nonparametric estimation of the number of classes in a population. Scand. J. Stat. 1984, 11, 265–270. [Google Scholar]
- Faith, D.P. Conservation evaluation and phylogenetic diversity. Biol. Conserv. 1992, 61, 1–10. [Google Scholar] [CrossRef]
- Shannon, C.E. A mathematical theory of communication. Bell Syst. Tech. J. 1948, 27, 379–423. [Google Scholar] [CrossRef] [Green Version]
- Simpson, E.H. Measurement of diversity. Nature 1949, 163, 688. [Google Scholar] [CrossRef]
- Lozupone, C.; Knight, R. UniFrac: A New Phylogenetic method for comparing microbial communities. Appl. Environ. Microbiol. 2005, 71, 8228–8235. [Google Scholar] [CrossRef] [Green Version]
- Bray, J.R.; Curtis, J.T. An ordinatioil of thc upland forest communities of southern Wisconsin. Ecol. Monogr. 1957, 27, 125–349. [Google Scholar] [CrossRef]
- Real, R.; Vargas, J.M. The Probabilistic basis of Jaccard’s index of similarity. Syst. Biol. 1996, 45, 380–385. [Google Scholar] [CrossRef]
- Caporaso, J.G.; Kuczynski, J.; Stombaugh, J.; Bittinger, K.; Bushman, F.D.; Costello, E.K.; Fierer, N.; Peña, A.G.; Goodrich, J.K.; Gordon, J.I.; et al. QIIME allows analysis of high-throughput community sequencing data. Nat. Methods 2010, 7, 335–336. [Google Scholar] [CrossRef] [Green Version]
- Suchting, H.F. A Short Textbook of Soil Science and Plant Nutrition for the Forester and Also for the Agriculturist, the Gardener and the Naturalist (Kurzes Lehrbuch der Bodenkunde und Pflanzenernahrung fur Forstwirte und Auch fur Landwirte, Gartner und Naturwissenschaf; Landbuchverlag G.M.B.H.: Hanover, Germany, 1949. [Google Scholar]
- Nguyen, N.H.; Song, Z.; Bates, S.T.; Branco, S.; Tedersoo, L.; Menke, J.; Schilling, J.S.; Kennedy, P.G. FUNGuild: An open annotation tool for parsing fungal community datasets by ecological guild. Fungal Ecol. 2016, 20, 241–248. [Google Scholar] [CrossRef]
- Mendes, L.W.; Kuramae, E.E.; Navarrete, A.A.; van Veen, J.A.; Tsai, S.M. Taxonomical and functional microbial community selection in soybean rhizosphere. ISME J. 2014, 8, 1577–1587. [Google Scholar] [CrossRef] [PubMed]
- Kaur, B.; Gupta, S.R.; Singh, G. Soil carbon, microbial activity and nitrogen availability in agroforestry systems on moderately alkaline soils in northern India. Appl. Soil Ecol. 2000, 15, 283–294. [Google Scholar] [CrossRef]
- Thornton, P.E.; Doney, S.C.; Lindsay, K.; Moore, J.K.; Mahowald, N.; Randerson, J.T.; Fung, I.; Lamarque, J.-F.; Feddema, J.J.; Lee, Y.-H. Carbon-nitrogen interactions regulate climate-carbon cycle feedbacks: Results from an atmosphere-ocean general circulation model. Biogeosciences 2009, 6, 2099–2120. [Google Scholar] [CrossRef] [Green Version]
- Frac, M.; Jezierska-Tys, S. Microbial diversity of soil environment (Roznorodnosc mikroorganizmow srodowiska glebowego, in Polish). Postępy Mikrobiol. 2010, 49, 47–58. [Google Scholar]
- Cesarz, S.; Ruess, L.; Jacob, M.; Jacob, A.; Schaefer, M.; Scheu, S. Tree species diversity versus tree species identity: Driving forces in structuring forest food webs as indicated by soil nematodes. Soil Biol. Biochem. 2013, 62, 36–45. [Google Scholar] [CrossRef]
- Jucker, T.; Bouriaud, O.; Avacaritei, D.; Coomes, D.A. Stabilizing effects of diversity on aboveground wood production in forest ecosystems: Linking patterns and processes. Ecol. Lett. 2014, 17, 1560–1569. [Google Scholar] [CrossRef] [Green Version]
- Dawud, S.M.; Raulund-Rasmussen, K.; Ratcliffe, S.; Domisch, T.; Finér, L.; Joly, F.; Hättenschwiler, S.; Vesterdal, L. Tree species functional group is a more important driver of soil properties than tree species diversity across major European forest types. Funct. Ecol. 2017, 31, 1153–1162. [Google Scholar] [CrossRef]
- Vesterdal, L.; Schmidt, I.K.; Callesen, I.; Nilsson, L.O.; Gundersen, P. Carbon and nitrogen in forest floor and mineral soil under six common European tree species. For. Ecol. Manag. 2008, 255, 35–48. [Google Scholar] [CrossRef]
- Augusto, L.; De Schrijver, A.; Vesterdal, L.; Smolander, A.; Prescott, C.; Ranger, J. Influences of evergreen gymnosperm and deciduous angiosperm tree species on the functioning of temperate and boreal forests. Biol. Rev. 2015, 90, 444–466. [Google Scholar] [CrossRef]
- Vesterdal, L.; Clarke, N.; Sigurdsson, B.D.; Gundersen, P. Do tree species influence soil carbon stocks in temperate and boreal forests? For. Ecol. Manag. 2013, 309, 4–18. [Google Scholar] [CrossRef]
- Cools, N.; Vesterdal, L.; De Vos, B.; Vanguelova, E.; Hansen, K. Tree species is the major factor explaining C:N ratios in European forest soils. For. Ecol. Manag. 2014, 311, 3–16. [Google Scholar] [CrossRef]
- Yan, Z.; Song, Z.; Li, D.; Yuan, Y.; Liu, X.; Zheng, T. The effects of initial substrate concentration, C/N ratio, and temperature on solid-state anaerobic digestion from composting rice straw. Bioresour. Technol. 2015, 177, 266–273. [Google Scholar] [CrossRef] [PubMed]
- Paul, E.A.; Clark, F.E. Soil Microbiology and Biochemistry; Academic Press: San Diego, CA, USA, 1996. [Google Scholar]
- Brady, N.C.; Weil, R.R. The Nature and Properties of Soils, 14th ed.; Prentice Hall Upper Saddle River: Hoboken, NJ, USA, 2008; Volume 13. [Google Scholar]
- Gonet, S.; Debska, B.; Zaujec, A.; Banach-Szott, M. Properties of humus of natural forest soil and arable soil. Ekológia 2008, 27, 351–366. [Google Scholar]
- Eremin, D.I. Changes in the content and quality of humus in leached chernozems of the Trans-Ural forest-steppe zone under the impact of their agricultural use. Eurasian Soil Sci. 2016, 49, 538–545. [Google Scholar] [CrossRef]
- Mauer, O.; Palátová, E. Root system development in Douglas fir (Pseudotsuga menziesii [Mirb.] Franco) on fertile sites. J. For. Sci. 2012, 58, 400–409. [Google Scholar] [CrossRef] [Green Version]
- Kupka, I.; Podrázský, V.; Kubeček, J. Soil-forming effect of Douglas fir at lower altitudes-a case study. J. For. Sci. 2013, 59, 345–351. [Google Scholar] [CrossRef] [Green Version]
- Friesen, T.L.; Stukenbrock, E.H.; Liu, Z.; Meinhardt, S.; Ling, H.; Faris, J.D.; Rasmussen, J.B.; Solomon, P.S.; McDonald, B.A.; Oliver, R.P. Emergence of a new disease as a result of interspecific virulence gene transfer. Nat. Genet. 2006, 38, 953–956. [Google Scholar] [CrossRef]
- Manning, V.A.; Pandelova, I.; Dhillon, B.; Wilhelm, L.J.; Goodwin, S.B.; Berlin, A.M.; Figueroa, M.; Freitag, M.; Hane, J.K.; Henrissat, B.; et al. Comparative genomics of a plant-pathogenic fungus, Pyrenophora tritici-repentis, Reveals Transduplication and the impact of repeat elements on pathogenicity and population divergence. G3 Genes Genomes Genet. 2013, 3, 41–63. [Google Scholar] [CrossRef] [Green Version]
- Kirkland, T.N.; Muszewska, A.; Stajich, J.E. Analysis of transposable elements in Coccidioides species. J. Fungi 2018, 4, 13. [Google Scholar] [CrossRef] [PubMed] [Green Version]
- Salgado Salomón, M.E.; Dresch, P.; Horak, E.; Galleguillos, F.; Barroetaveña, C.; Peintner, U. The enigmatic Cortinarius magellanicus complex occurring in Nothofagaceae forests of the Southern Hemisphere. Fungal Biol. 2018, 122, 1077–1097. [Google Scholar] [CrossRef] [PubMed]
- Larsen, M.J. Notes on Tomentelloid fungi V. additional new species of Pseudotomentella. Mycologia 1983, 75, 556–562. [Google Scholar] [CrossRef]
- Bonito, G.; Trappe, J.M.; Rawlinson, P.; Vilgalys, R. Improved resolution of major clades within Tuber and taxonomy of species within the Tuber gibbosum complex. Mycologia 2010, 102, 1042–1057. [Google Scholar] [CrossRef] [PubMed] [Green Version]
- Callaway, R.M.; Thelen, G.C.; Rodriguez, A.; Holben, W.E. Soil biota and exotic plant invasion. Nature 2004, 427, 731–733. [Google Scholar] [CrossRef]
- Keane, R.M.; Crawley, M.J. Exotic plant invasions and the enemy release hypothesis. Trends Ecol. Evol. 2002, 17, 164–170. [Google Scholar] [CrossRef]
- Nuñez, M.A.; Dickie, I.A. Invasive belowground mutualists of woody plants. Biol. Invasions 2014, 16, 645–661. [Google Scholar] [CrossRef]
- DeBellis, T.; Kembel, S.W.; Lessard, J.-P. Shared mycorrhizae but distinct communities of other root-associated microbes on co-occurring native and invasive maples. PeerJ 2019, 7, e7295. [Google Scholar] [CrossRef] [PubMed]
- Hoff, J.A.; Klopfenstein, N.B.; McDonald, G.I.; Tonn, J.R.; Kim, M.-S.; Zambino, P.J.; Hessburg, P.F.; Rogers, J.D.; Peever, T.L.; Carris, L.M. Fungal endophytes in woody roots of Douglas-fir (Pseudotsuga menziesii) and ponderosa pine (Pinus ponderosa). For. Pathol. 2004, 34, 255–271. [Google Scholar] [CrossRef] [Green Version]
Figure 1.
Localities of forest districts of the Olsztyn Regional Directorate of State Forests (RDSF) in Poland) with selected Douglas fir stands situated in broadleaf-conifer mixed forest sites (yellow squares) and broadleaf forest sites (red triangles); image with forest district borders and forest cover (gray areas) adapted from the RDSF map.

Figure 2.
Taxonomic composition of fungal communities associated with Pseudotsuga menziesii, Fagus sylvatica, and Pinus sylvestris roots at the phylum (a) and class (b) levels on experimental plots.
Figure 2.
Taxonomic composition of fungal communities associated with Pseudotsuga menziesii, Fagus sylvatica, and Pinus sylvestris roots at the phylum (a) and class (b) levels on experimental plots.

Figure 3.
Heat map of the most abundant fungal genera on Pseudotsuga menziesii, Fagus sylvatica, and Pinus sylvestris roots in the experimental plots. The relative abundance of the sample at genus level increases with the increase of the color block value.
Figure 3.
Heat map of the most abundant fungal genera on Pseudotsuga menziesii, Fagus sylvatica, and Pinus sylvestris roots in the experimental plots. The relative abundance of the sample at genus level increases with the increase of the color block value.

Figure 4.
Fungal trophic mode (a) and functional group (b) in Pseudotsuga menziesii, Fagus sylvatica, and Pinus sylvestris roots on experimental plots, inferred through FUNGuild.
Figure 4.
Fungal trophic mode (a) and functional group (b) in Pseudotsuga menziesii, Fagus sylvatica, and Pinus sylvestris roots on experimental plots, inferred through FUNGuild.

Figure 5.
Examples of correlations between selected fungal species (Pseudotomentella tristis (a), Acephala applanate (b), Lactarius camphoratus (c), Amanita xylinivolva (d)) and soil parameters.
Figure 5.
Examples of correlations between selected fungal species (Pseudotomentella tristis (a), Acephala applanate (b), Lactarius camphoratus (c), Amanita xylinivolva (d)) and soil parameters.

Figure 6.
Graphical results of microbiome beta biodiversity analysis: (a) for trees, where P.m.—Pseudotsuga menziesii and other–tree of adjacent tree species, (b) for mesoregions, where M.P.—Masurian Plain and O.P.—Olsztynek Plain, (c) for Forest Districts (abbreviations—see Table 1).
Figure 6.
Graphical results of microbiome beta biodiversity analysis: (a) for trees, where P.m.—Pseudotsuga menziesii and other–tree of adjacent tree species, (b) for mesoregions, where M.P.—Masurian Plain and O.P.—Olsztynek Plain, (c) for Forest Districts (abbreviations—see Table 1).


Table 1.
Characteristics of investigated areas with Douglas fir on mixed broadleaf-conifer forest site 1 and broadleaf forest site 2 (obtained from the Forest Data Bank and from the authors’ measures).
Table 1.
Characteristics of investigated areas with Douglas fir on mixed broadleaf-conifer forest site 1 and broadleaf forest site 2 (obtained from the Forest Data Bank and from the authors’ measures).
| Forest District | Jedwabno JK 1 | Szczytno SZ 2 | Stare Jabłonki SJ 1 | Dobrocin DR 2 |
|---|---|---|---|---|
| Mesoregion | Masurian Plain | Olsztynek Plain | ||
| Forest sub-district | Kot 156d 53°45′81.; 20°67′05. | Gizewo 15a 53°54′91.; 20°95′34. | Laski 119g 53°72′19.; 20°11′78. | Roje 209c 53°96′71.; 20°02′81. |
| Forest site | Mixed broadleaf conifer forest | Broadleaf forest | Mixed broadleaf-conifer forest | Broadleaf forest |
| Co-dominant species in stand | Pinus sylvestris | Fagus sylvatica | Pinus sylvestris | Fagus sylvatica |
| Soil type | Brown-rusty soil | Brown-rusty soil | Typical rusty soil | Brown-rusty soil |
| Trophic status of forest habitat | Mesotrophic | Oligotrophic | Mesotrophic | Oligotrophic |
| Humus type | Mull-moder | Mull-moder | Vermimull | Mull-moder |
| Average age (years) | 130 | 132 | 115 | 115 |
| Average dbh (cm) | 62.5 | 67.5 | 60.1 | 55.8 |
| Average height (m) | 35.0 | 40.6 | 39.4 | 37.2 |
| Vegetation cover | Vaccinium myrtillus L. Dryopteris filix-mas (L.) Schott Pleurozium schreberi (Willd. ex Brid.) Mitt. Fragaria vesca L. Oxalis acetosella L. | Pleurozium schreberi (Willd. ex Brid.) Mitt. Oxalis acetosella L. | Vaccinium myrtillus L. Pleurozium schreberi (Willd. ex Brid.) Mitt. Oxalis acetosella L. | Oxalis acetosella L. Maianthemum bifolium (L.) F.W. Schmidt Mycelis muralis (L.) Dumort. Viola reichenbachiana Boreau Polytrichum commune Hedw. Moehringia trinervia (L.) Clairv. |
| Plant community | Tilio-Carpinetum calamagrostietosum | Tilio-Carpinetum calamagrostietosum | Tilio-Carpinetum calamagrostietosum | Tilio-Carpinetum calamagrostietosum |
Table 2.
Values of some soil properties in samples around particular trees.
| Forest District | Assessed Tree | pH KCl | C (%) | Ntotal (%) | C:N | P2O5 (mg/100 g) | K2O (mg/100 g) | Mg (mg/100 g) | Humus (%) |
|---|---|---|---|---|---|---|---|---|---|
| Jedwabno JK | P. menziesii | 3.5 | 2.75 | 0.168 | 16.37 | 4.8 | 4.5 | 3.6 | 4.74 |
| P. sylvestris | 3.3 | 1.79 | 0.116 | 15.43 | 4.1 | 3.5 | 1.7 | 3.09 | |
| Szczytno SZ | P. menziesii | 3.8 | 1.12 | 0.068 | 16.47 | 8.3 | 1.0 | 1.1 | 1.93 |
| F. sylvatica | 3.8 | 2.23 | 0.087 | 25.63 | 9.0 | 1.5 | 1.3 | 3.84 | |
| Dobrocin DR | P. menziesii | 3.6 | 1.51 | 0.083 | 18.19 | 5.4 | 1.5 | 1.3 | 2.60 |
| F. sylvatica | 3.4 | 1.50 | 0.106 | 14.15 | 2.1 | 2.5 | 1.6 | 2.59 | |
| St. Jabłonki SJ | P. menziesii | 3.7 | 1.11 | 0.081 | 13.70 | 13.7 | 2.0 | 1.1 | 1.91 |
| P. sylvestris | 3.6 | 1.29 | 0.080 | 16.13 | 14.5 | 1.5 | 0.7 | 2.22 |
Table 3.
Average values of analyzed soil properties in comparable variants and descriptive statistics.
Table 3.
Average values of analyzed soil properties in comparable variants and descriptive statistics.
| Mesoregion | Site | Tree Species | ||||||
|---|---|---|---|---|---|---|---|---|
| MP | OP | Olig | Meso | Pm | Ps | Fs | ||
| pHKCl | 3.60 a | 3.58 a | 3.53 a | 3.65 a | 3.65 a | 3.45 a | 3.60 a | |
| SD | 0.23 | 0.12 | 0.16 | 0.18 | 0.13 | 0.21 | 0.28 | |
| SE | 0.08 | 0.04 | 0.06 | 0.06 | 0.06 | 0.15 | 0.20 | |
| V | 0.06 | 0.03 | 0.04 | 0.05 | 3.53 | 6.15 | 7.86 | |
| C (%) | 1.97 a | 1.35 b | 1.74 a | 1.59 a | 1.62 a | 1.54 a | 1.87 a | |
| SD | 0.64 | 0.18 | 0.68 | 0.43 | 0.77 | 0.35 | 0.52 | |
| SE | 0.23 | 0.06 | 0.24 | 0.15 | 0.39 | 0.25 | 0.37 | |
| V | 0.32 | 0.13 | 0.39 | 0.27 | 47.72 | 22.95 | 27.62 | |
| Ntotal (%) | 0.110 a | 0.088 a | 0.111 a | 0.086 a | 0.100 a | 0.098 a | 0.097 a | |
| SD | 0.040 | 0.011 | 0.038 | 0.014 | 0.050 | 0.030 | 0.010 | |
| SE | 0.014 | 0.004 | 0.014 | 0.005 | 0.020 | 0.020 | 0.010 | |
| V | 0.37 | 0.13 | 0.34 | 0.17 | 46.13 | 28.28 | 14.14 | |
| C:N | 18.48 a | 15.54 a | 15.41 b | 18.61 a | 16.18 a | 15.78 a | 19.89 a | |
| SD | 4.44 | 1.90 | 1.12 | 4.60 | 1.85 | 0.49 | 8.12 | |
| SE | 1.57 | 0.67 | 0.39 | 1.62 | 0.93 | 0.35 | 5.74 | |
| V | 0.24 | 0.12 | 0.07 | 0.25 | 11.46 | 3.14 | 40.81 | |
| P205 (mg/100 g) | 6.55 a | 8.93 a | 9.28 a | 6.20 a | 8.05 a | 9.30 a | 5.55 a | |
| SD | 2.28 | 5.68 | 5.17 | 2.91 | 4.06 | 7.35 | 4.88 | |
| SE | 0.80 | 2.01 | 1.83 | 1.03 | 2.03 | 5.20 | 3.45 | |
| V | 0.35 | 0.64 | 0.56 | 0.47 | 50.50 | 79.07 | 87.91 | |
| K20 (mg/100 g) | 2.63 a | 1.88 a | 2.88 a | 1.63 b | 2.25 a | 2.50 a | 2.00 a | |
| SD | 1.53 | 0.44 | 1.27 | 0.58 | 1.55 | 1.41 | 0.71 | |
| SE | 0.54 | 0.16 | 0.45 | 0.21 | 0.78 | 1.00 | 0.50 | |
| V | 0.58 | 0.24 | 0.44 | 0.36 | 69.09 | 56.57 | 35.36 | |
| Mg (mg/100 g) | 1.93 a | 1.18 a | 1.78 a | 1.33 a | 1.78 a | 1.20 a | 1.45 a | |
| SD | 1.06 | 0.35 | 1.19 | 0.19 | 1.22 | 0.71 | 0.21 | |
| SE | 0.37 | 0.12 | 0.42 | 0.07 | 0.61 | 0.50 | 0.15 | |
| V | 0.55 | 0.30 | 0.67 | 0.14 | 68.75 | 58.93 | 14.63 | |
| Humus (%) | 3.40 a | 2.33 b | 2.99 a | 2.74 a | 2.80 a | 2.66 a | 3.22 a | |
| SD | 1.10 | 0.31 | 1.17 | 0.74 | 1.34 | 0.62 | 0.88 | |
| SE | 0.39 | 0.11 | 0.42 | 0.26 | 0.67 | 0.44 | 0.63 | |
| V | 0.32 | 0.13 | 0.39 | 0.27 | 47.79 | 23.17 | 27.49 | |
MP—Masurian Plain, OP—Olsztynek Plain, Olig—Oligotrophic, Meso—Mesotrophic, Pm—Pseudotsuga. menziesii Ps—Pinus sylvestris, Fs—Fagus sylvatica. —mean; SD—standard deviation; V—coefficient of variation; SE—standard error. Different lowercase letters indicate significant differences between the means (Mann–Whitney U test; ANOVA Kruskal–Wallis, followed by Dunn or Bonferroni post hoc tests, α = 0.05).
Table 4.
Identified EM and AM taxa inhabiting Pseudotsuga menziesii, Fagus sylvatica, and Pinus sylvestris fine roots. In brackets: relative abundance >0.003% and soil parameters significantly correlated (p < 0.05).
Table 4.
Identified EM and AM taxa inhabiting Pseudotsuga menziesii, Fagus sylvatica, and Pinus sylvestris fine roots. In brackets: relative abundance >0.003% and soil parameters significantly correlated (p < 0.05).
| No. | Tree Species | ||||||
|---|---|---|---|---|---|---|---|
| On One Tree Species Only | Occurring Together | ||||||
| P. menziesii | F. sylvatica | P. sylvestris | P. menziesii, F. sylvatica, and P. sylvestris | P. menziesii and F. sylvatica | P. menziesii and P. sylvestris | F. sylvatica and P. sylvestris | |
| 1 | Pseudotomentella tristis (P. Karst.) M.J. Larsen (3.74) | Elaphomyces granulatus Fr. (0.36) | Russula laccata Huijsman (0.64) | Acephala applanata Grünig & T.N. Sieber | Cortinarius transatlanticus Ammirati, Liimat. & Niskanen | Amanita xylinivolva Tulloss, Ovrebo & Halling | Amanita olivaceogrisea Kalamees |
| 2 | Tuber puberulum Berk. & Broome (1.99) | Sarcosphaera coronaria (Jacq.) J. Schröt. (0.31) | Unidentified Tylospora (0.12) | Amanita rubescens Pers. | Lactarius camphoratus (Bull.) Fr. | Endogone lactiflua Berk. | Cortinarius croceus (Schaeff.) Gray |
| 3 | Unidentified Amphinema (1.21) | Russula aurora Krombh. (0.19) | Amanita wellsii (Murrill) Murril (0.09) | Amphinema byssoides (Pers.) J. Erikss | Lactarius glyciosmus (Fr.) Fr. | Boletus edulis Bull. | Inocybe napipes J.E. Lange |
| 4 | Lactarius sp. (1.58) | Hydnum repandum L. (0.1) | Lactarius quietus (Fr.) Fr. (0.08) | Cenococcum geophilum Fr. | Lactarius tabidus Fr. | Cortinarius parvannulatus Kühner | Inocybe soluta Velen. |
| 5 | Piloderma olivaceum (Parmasto) Hjortstam (0.13) | Tuber sp. (0.09) | Tricholoma equestre (L.) P. Kumm. (0.002) | Chloridium paucisporum C.J.K. Wang & H.E. Wilcox | Unidentified Pseudotomentella | Russula velenovskyi Melzer & Zvára | Laccaria laccata (Scop.) Cooke |
| 6 | Inocybe geophylla P. Kumm. (0.12) | Amanita muscaria (L.) Lam. (0.08) | Clavulina coralloides (L.) J. Schröt. | Russula badia Quél. | Tomentella lapida (Pers.) Stalpers | Lactarius helvus (Fr.) Fr. | |
| 7 | Russula heterophylla (Fr.) Fr. (0.08) | Amanita submembranacea (Bon) Gröger (0.05) | Genea hispidula Berk. ex Tul. & C. Tul. | Unidentified Tomentella | Wilcoxina rehmii Chin S. Yang & Korf | Lactarius rufus (Scop.) Fr. | |
| 8 | Tuber anniae W. Colgan & Trappe (0.06) | Hydnotrya tulasnei (Berk.) Berk. & Broome | Unidentified Endogone | Naucoria bohemica Velen. | |||
| 9 | Sistotrema oblongisporum M.P. Christ. & Hauerslev (0.04) | Inocybe assimilate Britzelm. | Unidentified Hydnum | Ramaria cyaneigranosa Marr & D.E. Stuntz | |||
| 10 | Unidentified Sistotrema (0.04) | Meliniomyces vraolstadiae (Hambl. & Sigler) Vohník, Fehrer & Réblová | Unidentified Russula | Russula cyanoxantha (Schaeff.) Fr. | |||
| 11 | Cortinarius scaurus (Fr.) Fr.(0.02) | Russula ionochlora Romagn. | Russula fellea (Fr.) Fr. | ||||
| 12 | Inocybe rhodella Matheny, Aime & M.E. Sm. (0.02) | Russula ochroleuca Fr. | Russula puellaris Fr. | ||||
| 13 | Lyophyllum leucophaeatum (P. Karst.) P. Karst. (0.02) | Sistotrema brinkmannii (Bres.) J. Erikss. | Unidentified Cenococcum | ||||
| 14 | Phaeocollybia fallax A.H. Sm. (0.02) | Tomentella stuposa (Link) Stalpers | Unidentified Clavulina | ||||
| 15 | Tylospora fibrillosa(Burt) Donk (0.02) | Xerocomellus cisalpinus (Simonini, H. Ladurner & Peintner) Klofac | Unidentified Craterellus | ||||
| 16 | Scleroderma camassuense M.P. Martín, Baseia & B.D.B. Silva (0.003) | Unidentified Meliniomyces | Unidentified Lactifluus | ||||
| 17 | Unidentified Piloderma | Unidentified Sebacina | |||||
| 18 | Unidentified Atheliaceae | Unidentified Thelephora | |||||
| 19 | Unidentified Thelephoraceae | Unidentified Wilcoxina | |||||
| 20 | Unidentified Helotiaceae | ||||||
| 21 | Unidentified Inocybaceae | ||||||
Table 5.
Values of ecological indices for the tested variants (mean ± SD). Values followed by different lowercase letters are significantly different (p < 0.05) between the tested variants.
Table 5.
Values of ecological indices for the tested variants (mean ± SD). Values followed by different lowercase letters are significantly different (p < 0.05) between the tested variants.
| Tree Species | Observed Species | Chao1 | Faith PD | Shannon | Simpson |
|---|---|---|---|---|---|
| P. sylvestris | 536.50 ± 439.11 a | 614.29 ± 449.13 a | 127.80 ± 88.18 a | 4.32 ± 0.45 a | 0.90 ± 0.00 a |
| F. sylvatica | 506.00 ± 622.25 a | 532.68 ± 608.88 a | 115.48 ± 140.60 a | 4.02 ± 3.74 a | 0.72 ± 0.36 a |
| P. menziesii | 215.25 ± 24.60 a | 266.00 ± 43.81 a | 63.40 ± 10.11 a | 3.17 ± 0.69 a | 0.79 ± 0.07 a |
Publisher’s Note: MDPI stays neutral with regard to jurisdictional claims in published maps and institutional affiliations. |
© 2021 by the authors. Licensee MDPI, Basel, Switzerland. This article is an open access article distributed under the terms and conditions of the Creative Commons Attribution (CC BY) license (https://creativecommons.org/licenses/by/4.0/).
Share and Cite
MDPI and ACS Style
Damszel, M.; Szmidla, H.; Sikora, K.; Młodzińska, A.; Piętka, S.; Sierota, Z. Mycobiota of Fine Roots of Pseudotsuga menziesii Introduced to the Native Forest Environment. Forests 2021, 12, 1766. https://doi.org/10.3390/f12121766
AMA Style
Damszel M, Szmidla H, Sikora K, Młodzińska A, Piętka S, Sierota Z. Mycobiota of Fine Roots of Pseudotsuga menziesii Introduced to the Native Forest Environment. Forests. 2021; 12(12):1766. https://doi.org/10.3390/f12121766
Chicago/Turabian StyleDamszel, Marta, Hanna Szmidla, Katarzyna Sikora, Agata Młodzińska, Sławomir Piętka, and Zbigniew Sierota. 2021. "Mycobiota of Fine Roots of Pseudotsuga menziesii Introduced to the Native Forest Environment" Forests 12, no. 12: 1766. https://doi.org/10.3390/f12121766
Note that from the first issue of 2016, this journal uses article numbers instead of page numbers. See further details here.