
Chemical-Anatomical Characterization of Stems of Asparagaceae Species with Potential Use for Lignocellulosic Fibers and Biofuels

1
Instituto de Biología, Universidad Nacional Autónoma de México, Mexico City 04510, Mexico
2
Programa de Botánica, Colegio de Postgraduados, Montecillo 56230, Mexico
*
Author to whom correspondence should be addressed.
Forests 2022, 13(11), 1853; https://doi.org/10.3390/f13111853
Submission received: 3 October 2022
/
Revised: 29 October 2022
/
Accepted: 3 November 2022
/
Published: 6 November 2022
(This article belongs to the Special Issue The Diversity of Wood and Non-Wood Forest Products: Anatomical, Physical and Chemical Properties, and Potential Applications)
Abstract
:During the last decades, the possibility of using species resistant to droughts and extreme temperatures has been analyzed for use in the production of lignocellulosic materials and biofuels. Succulent species are considered to identify their potential use; however, little is known about Asparagaceae species. Therefore, this work aimed to characterize chemically-anatomically the stems of Asparagaceae species. Stems of 10 representative species of Asparagaceae were collected, and samples were divided into two. One part was processed to analyze the chemical composition, and the second to perform anatomical observations. The percentage of extractives and lignocellulose were quantified, and crystalline cellulose and syringyl/guaiacyl lignin were quantified by Fourier transform infrared spectroscopy. Anatomy was observed with epifluorescence microscopy. The results show that there were significant differences between the various species (p < 0.05) in the percentages of extractives and lignocellulosic compounds. In addition, there were anatomical differences in fluorescence emission that correlated with the composition of the vascular tissue. Finally, through the characterization of cellulose fibers together with the proportion of syringyl and guaiacyl, it was obtained that various species of the Asparagaceae family have the potential for use in the production of lignocellulosic materials and the production of biofuels.
1. Introduction
Asparagaceae is one of the most important families in Mexico due to its biological, economic, and cultural importance [1]. Several species are used in the production of fibers, intoxicating drinks, food preparation, and the consumption of plant parts (flower, stem, and leaf) [2]. Asparagaceae has several subfamilies, including Agavoideae with Agave, Furcraea, Manfreda, and Polianthes; Yuccoideae including Yucca, Hesperaloae, and Hesperoyucca [3], and the subfamily Nolinoideae that includes the genera Beaucarnea and Nolina [4]. Most of the species of Agavoideae and Nolinoideae are distributed in arid and semiarid, and warm temperate regions of North and Central America [3] and in other parts of the world naturally or introduced. Several species of Agave have been used and studied the most because ethanol is produced in the form of intoxicating beverages such as mezcal and tequila [5].
In recent years, mainly the fibers and bagasse waste of several agave species, mainly A. tequilana [6,7], A. angustifolia [8], and A. salmiana [9] have been studied because a large amount of waste is produced annually from the production of tequila and mezcal. In addition, the subfamilies Agavoideae and Nolinoideae present acid metabolism of the crassulacean (CAM), which is considered raw material for the production of biofuel [10,11]. Furthermore, these species are part of the second generation of plants focused on biofuels. They are not part of the plants essential for human consumption [12], and they tolerate drought conditions and high temperatures [13].
Other species within the group of the second generation are cacti, such as Opuntia spp. [14], which also withstand extreme drought conditions and have CAM metabolism [15]. However, except for some genera such as Opuntia spp. and Selenicereus spp. [16,17], the other cacti species have slow vegetative development or very small sizes [18], so they could not be profitable in their use as biofuels or production of paper, while in species of the genus Agave growth and yield are higher [19].
However, even though many species of Asparagaceae exist in Mexico, there is not much information on the composition of the main lignocellulosic structural components, the anatomical distribution, or the potential use for farmers to cultivate and protect the plants in their natural environment [1]. Therefore, the objectives were to characterize the different Asparagaceae species with the extractives and lignocellulosic percentages, obtain crystallinity indexes, syringyl/guaiacyl (S/G) lignin ratio, and the anatomical distribution, with which it will be possible to identify the potential use of the different species as biofuels or in the paper industry, in addition to the possible biological implications.
2. Materials and Methods
2.1. Plant Materials and Extractives
Healthy adult plants were donated from the Universidad Nacional Autónoma de México (UNAM) Botanical Garden collection (Table 1), located at 19°18′44″ N, 99°11′46″ O and 2320 m a. s. l. The climate of the area is temperate, with rain in summer, with the rainy season from June to October, and the dry season from November to May. It has an average annual temperature of 15.6 °C and a rainfall of 833 mm. The plants were collected in their natural populations and grew in the garden. The leaves and stems of the ten species were cut, and only the stem was selected for the study. Stem samples were cut into pieces and dried in an oven for two weeks at 70 °C. Subsequently, the samples were ground (40–60 mesh size, Cyclone Sample Mill, (UDY Corporation, Fort Collins, CO, USA) until a particle size of 0.4 mm was obtained.
The samples were analyzed in triplicate based on the TAPPI T-222 om-02 standard and based on the method proposed by Maceda et al. [20,21]. From each ground sample, 2 g were taken, which were placed in filter paper cartridges to carry out successive extractions for six hours in a Soxhlet with ethanol-benzene (1:2 v/v) and subsequently in ethanol (96%). After each extraction, the cartridges were allowed to dry for 24 h at 70 °C to record their constant weight.
Subsequently, the cartridges were discarded, and the samples were kept in a reflux system for 1 h in water at 90 °C. The samples were filtered through a medium pore Büchner filter and dried at 70 °C for 24 h to record constant dry weight. The formula used was the following:
where A is the weight lost (g) after extraction with ethanol:benzene, B is the weight lost (g) after extraction with ethanol (96%), C is the weight lost (g) after extraction with water at 90 °C, and W0 is the initial weight of each sample. The percentage of extractive-free lignocellulose was obtained by subtracting from 100% the initial weight of the total percentage of extractives.
Total extractives (%) = [(A + B + C)/W0] × 100
2.2. Lignocellulosic Purification
Klason lignin. From the extractive-free lignocellulose of each species, 0.2 g were taken, and 15 mL of concentrated sulfuric acid (72%) was added at a temperature of 2 °C. The mixture was kept under constant stirring and at room temperature (18 °C) for 2 h. Then, 560 mL of distilled water was added, and the mixture was refluxed and boiled for 4 h. The samples were filtered through a fine-pore Büchner filter and dried at 105 °C for 24 h to record constant dry weight. Lignin was quantified as follows:
where WL is the obtained weight of lignin (g), and WW is the extractives-free lignocellulose (g).
Klason lignin (%) = (WL/WW) × 100
Cellulose. From the extractive-free lignocellulose, 0.2 g were taken to purify the cellulose using the Kûshner-Höffer method [21]. Twenty-five mL of HNO3/ethanol (1:4 v/v) were added to each sample and kept in a reflux system, and boiled for one hour. The sample was allowed to decant to discard the HNO3/ethanol solution, and another 25 mL was added again. This cycle was repeated three more times, and in the last cycle, 25 mL of an aqueous solution of KOH at 1% was added and kept for 30 min at reflux and boiling to finally filter the sample through a fine-pore Büchner filter. The sample was left to dry at 70 °C for 12 h to record the constant dry weight and obtain the percentage of cellulose based on the following formula:
where WC is the obtained weight of cellulose(g), and /WW is the extractives-free lignocellulose (g).
Cellulose (%) = (WC/WW) × 100
Hemicellulose. The purification was carried out based on the methodology proposed by Li. et al. [22]. From the extractive-free lignocellulose, 0.5 g were taken and placed in a reflux system with 10 mL of water for 3 h (solid-to-liquid ratio 1:20 g/mL). The system was cooled to room temperature and filtered. The filtrate was concentrated at 1.25 mL and purified into 3.75 mL of ethanol (95%) with stirring. The mixture was held for 1 h without stirring, and the hemicellulose precipitated. In order to obtain the dry weight (H0), the sample was centrifuged at 4500× g for 4 min, and then lyophilized. The residue insoluble in water was dried at 60 °C for 16 h, then successive extractions were performed with different concentrations of KOH (0.6, 1.0, 1.5, 2.0, and 2.5%) in a ratio of 1:20 (g/mL) at 75 °C for 3 h in each extraction. In the last concentration of 2.5% KOH, ethanol (99.7%) was added in a ratio of 2:3. The five mixtures were filtered and acidified to pH 5.5 with glacial acetic acid and concentrated to 1.25 mL. The mixtures were poured into 3.75 mL of ethanol (95%) with constant stirring. The mixtures were kept for 1 h and finally were centrifuged (4500× g for 4 min) and lyophilized. The constant dry weight was recorded in each extraction stage (H0.6, H1.0, H1.5, H2.0, H2.5), and the percentage of cellulose was obtained with the following formula:
where WH is the sum of H0.6 to H2.5 and WW is the extractive-free lignocellulose (g).
Hemicellulose (%) = (WH/WW) × 100
2.3. Fourier Transform Infrared Spectroscopy Analysis
Lignin analysis. The ratio of syringyl/guaiacyl monomers (S/G) was obtained by Fourier transform infrared spectroscopy (FTIR) analysis. Klason lignin samples were kept dry until analyzed by FTIR (30 scans with a resolution of 4 cm−1, 15 s per repeat). Three FTIR readings (Agilent Cary 630 FTIR) were made from each sample, and then the baseline correction was performed to separate the peaks of the fingerprints (wavelength of 800–1800 cm−1) [23] in the MicroLab PC program (Agilent Technologies). The peaks of 1269 to 1272 cm−1 and 1328 to 1330 cm−1 were used to quantify the proportion of guaiacyl (G) and syringyl (S), respectively [24]. The value of each peak was obtained by drawing a line connecting the lowest values and a similar line for the highest values of each peak. A vertical line was drawn from the base of the X-axis to the highest part of the peak. The portion of the line between the top and the base is the value of each peak, so the S/G ratio was calculated by dividing the values of each peak [24].
Cellulose analysis. The proportion of crystalline cellulose was obtained by analyzing the dried samples with FTIR [21]. From each sample and doing the analyzes in triplicate, a small portion of the sample was placed in the FTIR Spectrometer (Agilent Cary 630 FTIR), and the spectrum was obtained in a range of 400–650 cm−1 (30 scans with a resolution of 4 cm−1, 15 s per repeat). Samples were converted from transmittance to absorbance, and spectra were averaged using the Resolution Pro FTIR Software program (Agilent Technologies, Santa Clara, CA, United States).
The crystallinity indices used were: Total crystallinity index (TCI) proposed by Nelson and O’Connor [25] or also called the crystallinity ratio [26,27]. The lateral order index (LOI) [25,27] or second proportion of crystallinity [26]; and hydrogen bonding intensity (HBI) [28]. TCI was calculated with the ratio between the absorption intensity of the peaks 1370 cm−1 and 2900 cm−1 [27], LOI was calculated from the ratio between the absorption intensity of the peaks 1430 cm−1 and 893 cm−1 [26], while HBI was calculated with the ratio between 3350 cm−1 and 1315 cm−1 [28].
2.4. Statistical Analysis
The data obtained from the percentages of extractives and lignocellulosic components were analyzed with the non-parametric Kruskal-Wallis test and Dunn’s post hoc analysis since the values did not present normality based on the results of Kolmogorov-Smirnov and Shapiro-Wilk, even when they were transformed with the square root of the arc sine. In addition, a multivariate principal component analysis was performed to separate the groups based on the values of the structural components.
2.5. Lignocellulosic Anatomical Distribution
Stem fragments were saved from each sample and were fixed, embedded, and cut based on the procedures of Arias and Terrazas [29] for succulent hardwood species. The transverse sections were stained with acridine orange and calcofluor [30] to observe the distribution of cellulose and lignin in the stem, in addition to comparing the anatomical results with the chemical ones.
3. Results
3.1. Extractives and Lignocellulosic Structural Compounds
The Asparagaceae species had significant differences between species (Table 2) in the variables of extractives and lignocellulosic components. The percentages of extractives were heterogeneous between the species of the same genus; however, the differences occurred mainly between Agave and Yucca-Nolina. In Table 3 and Table 4, the means and standard deviation of the extractives are presented, and the different superscript capital letters show the species that are significantly different. In the ethanol extractives, A. striata had the lowest percentage and was significantly different from Y. gigantea, which had the highest percentage (Table 3). In hot water extractives, a similar situation was shown; A. convallis had the highest percentage, while N. excelsa and Y. periculosa had the lowest percentage. In the ethanol:benzene extractives, the statistical differences were presented between N. excelsa, with the lowest percentage, and F. longaeva, with the highest percentage. The species with the highest content of extractives and the lowest content of lignified tissue were A. convallis and Y. gigantea. On the contrary, the species with the lowest content of extractives and the highest amount of lignified tissue were N. excelsa and Y. periculosa.
The percentages of lignocellulosic components had significant differences in the percentages of lignin between Y. filifera and F. longaeva (Table 4). In cellulose, the species that had the lowest percentage were A. celsii and A. convallis, and N. excelsa was the species with the highest percentage. Finally, in the hemicelluloses, Y. gigantea presented the least quantity and Y. filifera the largest.
In the Principal Component (PC) analysis, the first two PCs had eigenvalues above 1, while PC3 was less than 1; however, PC3 was considered in the analysis due that it explained 11% of the variance, so the three PCs explained 84.5% of the total variation (Table 5). In each PC, the highest negative or positive values were those that influenced the separation of each species, as shown in Figure 1. For PC1, the variables that determined the separation of the different groups were hot water extractives and extractive-free lignocellulose. In PC2, the determinant variables of the variation were hemicelluloses and ethanol extractives, while in PC3 was the cellulose percentage (Table 5).
When plotting the species based on the first three PCs and the variables that influenced each PC (Figure 1), the species were separated into four groups. The first group (blue points) included the species of N. excelsa and Y. periculosa, which were the species with the lowest content of hot water extractives and higher extractive-free lignocellulose content. The second group (green point), represented by Y. filifera had the highest percentage of hemicelluloses. The third group (pink point), conformed by Y. gigantea was separated from the other Yuccas and the other species because they had lower percentages of hemicelluloses, but it was one of the species with the highest percentage of cellulose and percentage of total extractives. In the fourth group (orange points), the remaining species that belong to Agave, F. longaeva, and B. gracilis were clustered (Figure 1).
3.2. Cellulose Crystallinity
In the cellulose spectra (Figure 2) and Table 6, the main cellulose peaks are observed. In order to determine the purity of the cellulose, the absence of xylans and hemicellulose was obtained by not detecting the peak at 1735 cm−1. Lignin was not detected with the peaks 1595 cm−1, 1512 cm−1, and 1463 cm−1. Only weak lignin signals were observed in A. striata and Y. periculosa. In addition, the absence of hemicellulose was observed without the presence of the 1269 cm−1 peak, except for A. celsii, which had a weak peak.
In the crystallinity indexes (Table 7), the TCI values showed that most of the species had values above one because they had a higher percentage of crystalline cellulose, except A. striata, B. gracilis, and Y. periculosa, which presented a higher percentage of amorphous cellulose. In LOI, the species that had the highest value was A. striata, while the species that had the lowest value was F. longaeva, which had the highest value in TCI. In HBI, similarly, A. striata had the lowest value, while B. gracilis had the highest value.
3.3. Lignin S/G Ratio
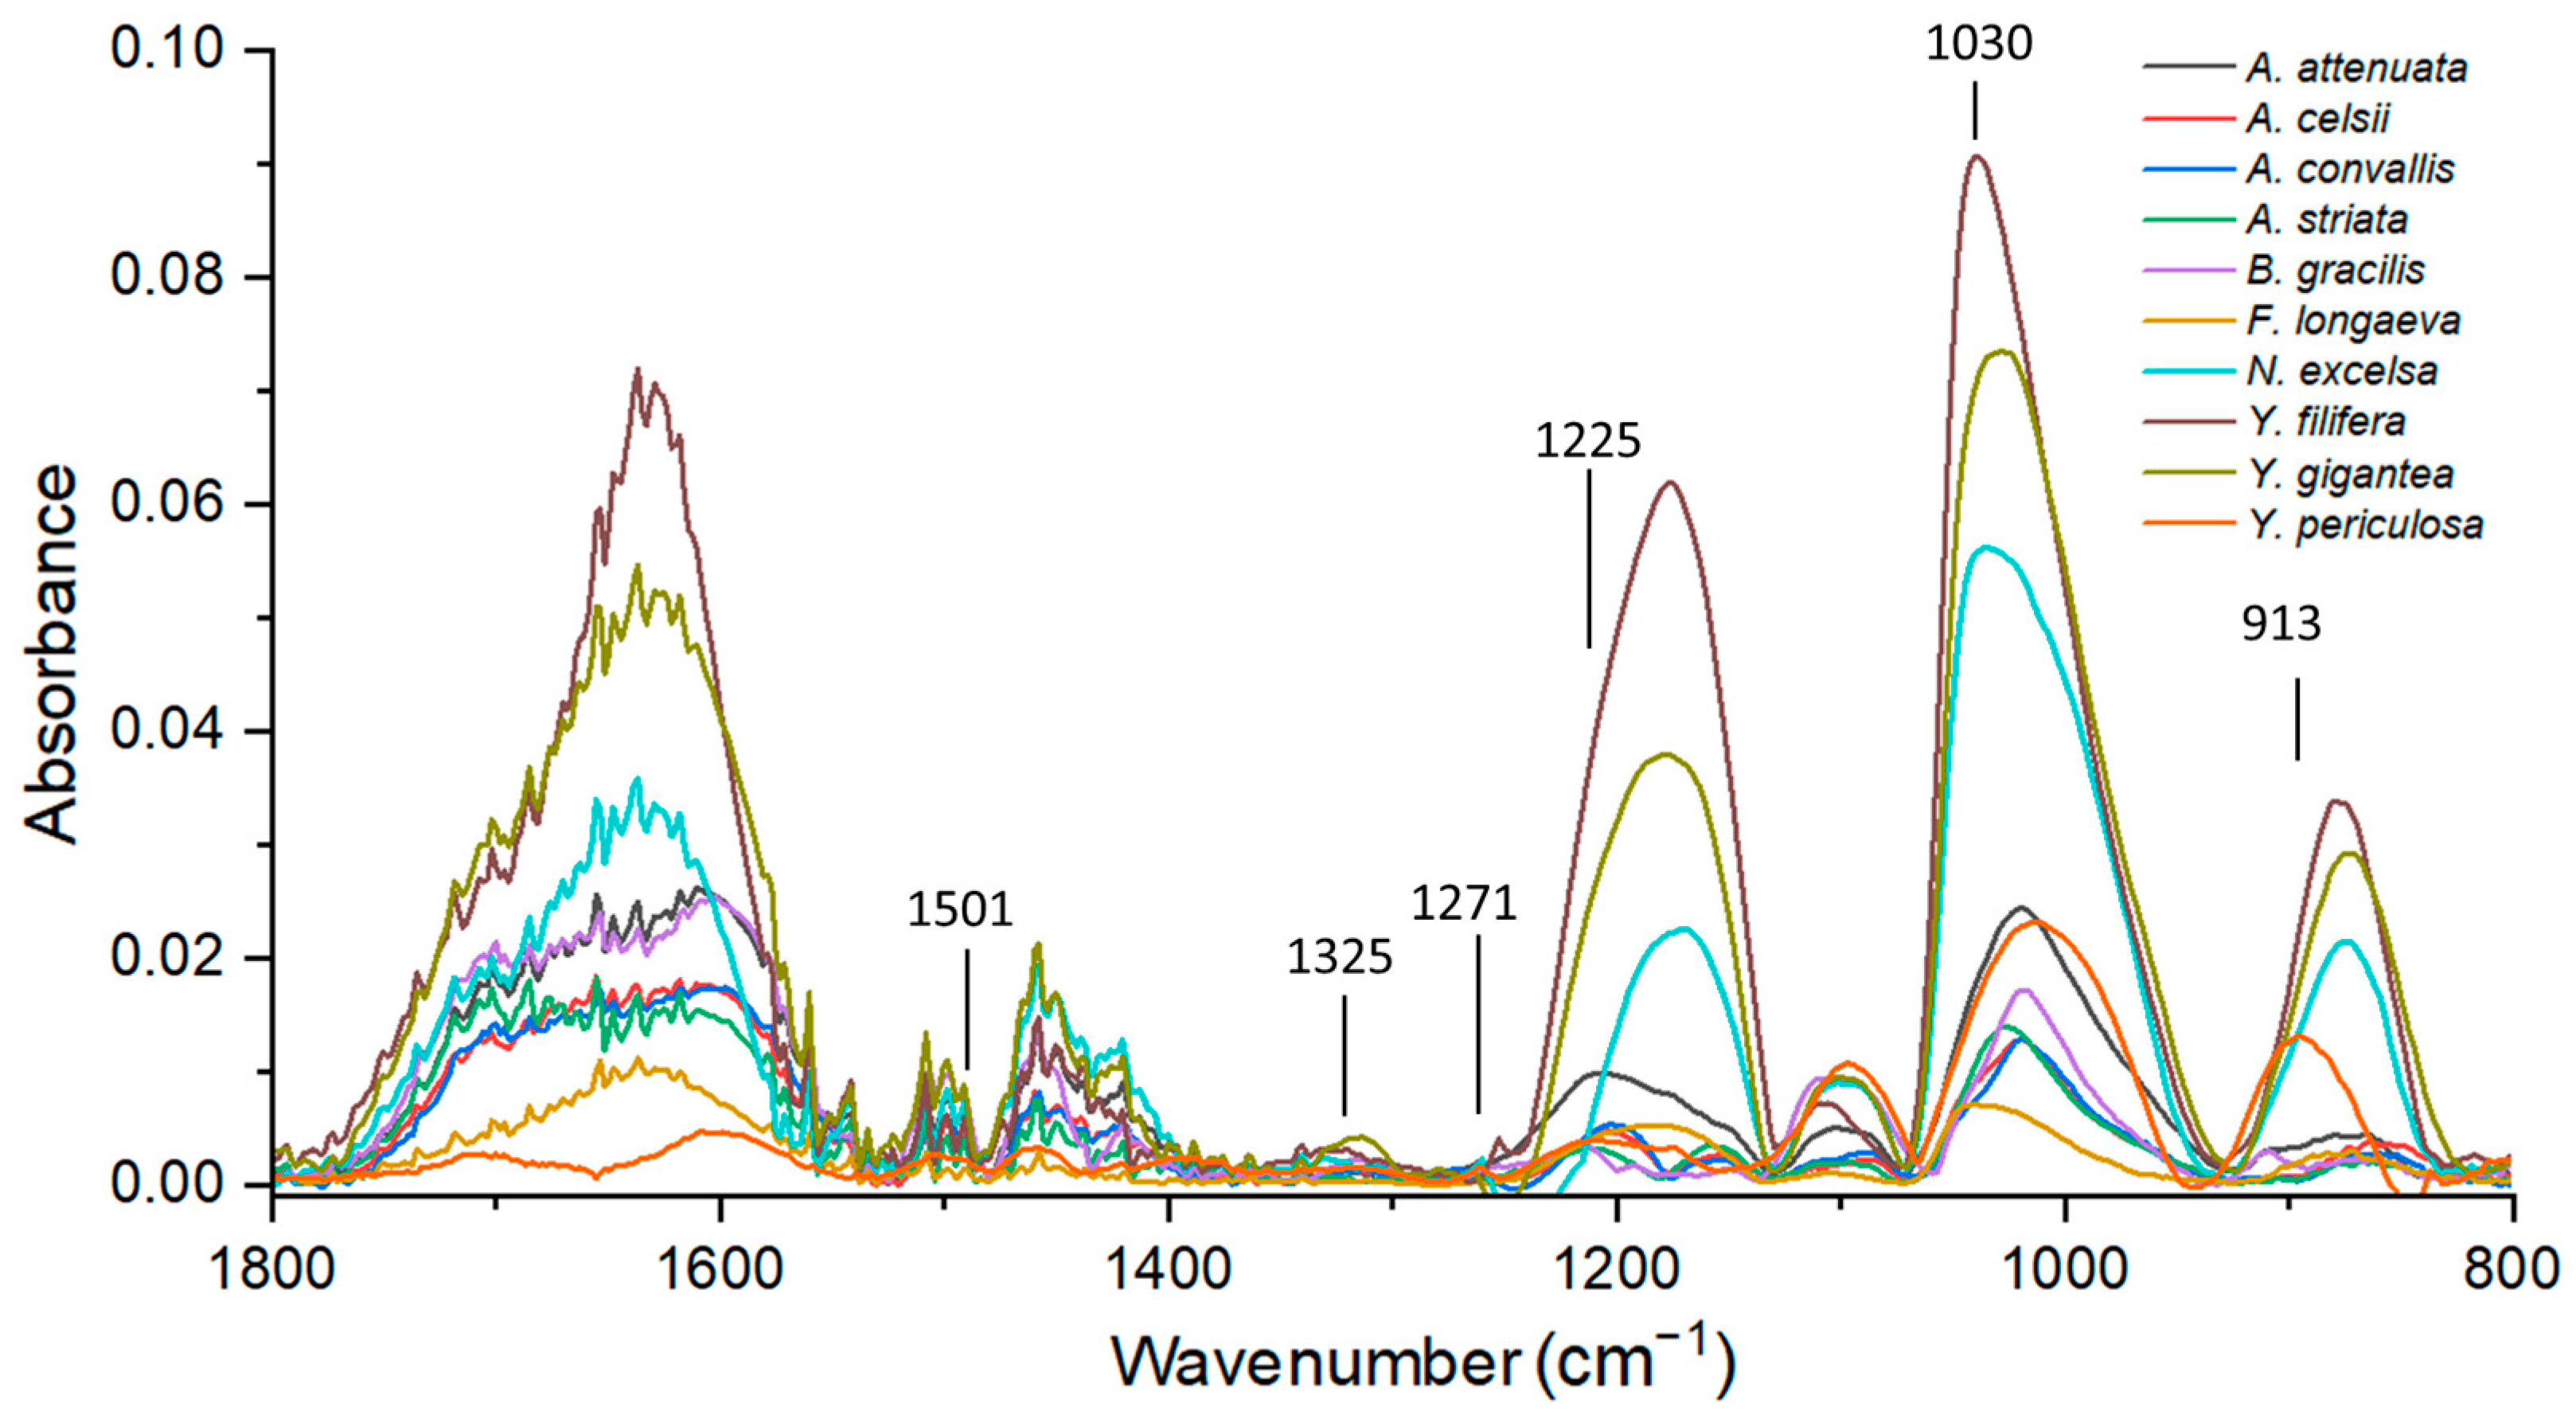
Figure 3 shows the FTIR spectra for the 10 species of Asparagaceae. Representative peaks of lignin were 1501 cm−1 which showed the C=C aromatic ring vibration of syringyl and guaiacyl monomers. The 1325 cm−1 peak reflected the breathing of the ring of syringyl in addition to C-O stretching. The 1271 cm−1 and 1225 cm−1 peaks reflected the symmetric vibration of C-O and the glucopyranose cycle of guaiacyl and syringyl, respectively. The 1030 cm−1 peak reflected the C-H in-plane deformation of guaiacyl and C-O deformation in primary alcohol; finally, the 913 cm−1 peaks showed the =CH out-of-plane deformation in the aromatic ring of syringyl and guaiacyl monomers (Figure 3).
Whit the peaks 1325 and 1271 cm−1 the S/G ratio was calculated (Table 8). The species with the lowest proportion of S/G was A. attenuata because it had a higher percentage of guaiacyl in its structure, while in the genus Yucca, the three species presented high values of syringyl, for which the proportion of S/G was in the range of 2.8 to 3.9. The other species had similar proportions, so the syringyl monomer prevailed except in A. convallis.
3.4. Anatomical Distribution
The species of Asparagaceae studied showed the same type of vascular tissue, with closed vascular bundles forming isolated patches or two or more patches joined through lignified parenchyma. In the vascular bundle, the presence of tracheary elements with mainly reticular type of secondary wall thickenings was observed, with completely lignified fibers and non-lignified phloem with contents inside with fluorescence emission in bluish tones (Figure 4). In most species, patches of non-lignified parenchyma were observed on the edges of the stem, while in the center, the parenchyma was completely lignified. In the species A. attenuata and A. convallis, the fluorescence tones of the tracheary elements and fibers predominated in yellow-green tones, while in the Yucca species, the fluorescence emission was observed in green to bluish-green tones. In all species, the presence of crystals was observed, mainly raphides and prisms. Cellulose fluoresced in bluish tones but differed from lignin due to the intensity of fluorescence emission since the cellulose had lower intensity compared to lignin.
4. Discussion
The Asparagaceae family presented heterogeneity in the percentages of the structural components that allow its grouping based on the values of extractive compounds, hemicellulose, and cellulose. In addition, the presence of high percentages of cellulose, a majority proportion of crystalline cellulose, and the presence of S/G ratios greater than one make it possible to use in biofuels and cellulosic compounds.
4.1. Extractives and Lignocellulose
Asparagaceae species had similar percentages of extractives when extracted with ethanol: benzene and ethanol. However, hot water extractives were low except for A. convallis (Table 3). Compared with the literature on other Agave species (Table 9), the extractive percentages in water were similar to the values reported here. A. tequilana, A. angustifolia, and A. salmiana have values between 4.4%–6.0% (Table 9). On the contrary, the values reported in Agave for the percentages of extractives in ethanol: benzene and ethanol (Table 9) were low (1.5%–4.0% in ethanol: benzene and 1.3%–5.0% in ethanol) compared to the values reported here (Table 3). For the genera Beaucarnea, Furcraea, and Nolina, there are no reports of extractive percentages in their stems or leaves. In the Yucca genus, the literature report that Y. gloriosa presents a percentage of total extractives of 1.1 [31], which is low compared to the percentages obtained here (Table 3).
Although extractives in ethanol: benzene and in ethanol are hardly reported in the literature for the species of the genera analyzed here, they have been reported for other succulent species such as cacti [20,21], which had lower percentages of ethanol: benzene (2.5%–4.2%), similar in ethanol (1.0%–9.1%), higher in hot water (8.2%–44.5%) and total extractives (16.7–49.2 %).
In the percentages of lignocellulosic compounds, Table 4 shows that there was heterogeneity in the results within the same genus. In the species that are considered arborescent, it was obtained that the percentages of lignin were low. However, the percentage of cellulose was higher (37.3%–52.2%) and in herbaceous species was lower (31.6%–37.1%). In the hemicelluloses, there is homogeneity between the agaves (20.9%–27.1%), while in the Yucca genus, notable differences are observed between Y. gigantea (5.7%) concerning the other two species of Yucca (21.0% and 30.7%). The differences possibly were due to the type of environment in which they live; Y. gigantea is distributed in regions with higher humidity [32], while Y. filifera [33,34] and Y. periculosa [35] grow in arid zones and semi-desert, respectively. In celluloses, the percentages reported in the literature (Table 9) were high compared to those obtained here (Table 4), possibly due to the differences in the species or the conditions in which they have been developed [36,37].
When comparing the results obtained with succulent species such as cacti, it was observed that the percentages of lignocellulose, in general, are higher in agave species than in non-fibrous wood cacti species [20], while in fibrous species, the percentages were similar [38].

Table 9.
Percentages of extractives and lignocellulosic compounds of Agave, Furcraea, and Yucca.
| Species | S * | Ce | He | Li | TE | W | E-B | Et | Ref |
|---|---|---|---|---|---|---|---|---|---|
| A. angustifolia A. lechuguilla A. salmiana A. tequilana | L | 33.2–44.3 | 2.6–3.5 | 2.1–2.9 | − | − | − | − | [9] |
| A. americana | L | 68.4 | 15.7 | 4.9 | − | − | − | − | [39] |
| A. americana | St | 65.0 | 32.0 | 3.0 | − | − | − | − | [40] |
| A. angustifolia | F | 55.0 | 34.1 | 20.7 | 5.3 | 4.4 | 1.5 | − | [8] |
| A. angustifolia | F | 67.0 | 25.2 | 6.3 | − | − | − | − | [41] |
| A. angustifolia | F | 64.0 | 25.0 | 6.5 | 2.5 | − | − | − | [42] |
| A. lechuguilla | St | 17.7 | 17.5 | 7.3 | 45.3 | [43] | |||
| A. lechuguilla | St | − | − | 9.1 | 25.7 | − | − | − | [44] |
| A. lechuguilla A. fourcroudes | L | 79.8 77.6 | 3–6 5.0–7.0 | 15.3 13.1 | − | − | − | − | [45] |
| A. salmiana | F | 48.9 | − | 8.5 | − | − | − | − | [46] |
| A. salmiana | B | 47.3 | 12.8 | 4.9 | − | − | − | − | [47] |
| A. salmiana A. americana A. tequilana | L St | 39.7–45.0 | 7.3–11.9 | − | 6.0–15.1 | − | 1.3–3.2 | [48] | |
| A. salmiana A. tequilana A. americana | L St | − | − | 9.8 11.9 8.2 | − | − | − | − | [49] |
| A. sisalana | − | 43.0 | 32.0 | 15.0 | − | − | − | − | [50] |
| A. tequilana | F | 49.4 | − | 21.1 | − | 10.6 | 2.9 | − | [51] |
| A. tequilana | F | 41.9 | − | 7.2 | − | 5.8 | 3.1 | − | [52] |
| A. tequilana | L St | 40.0 and 51.0 | − | − | − | − | − | − | [53] |
| A. tequilana | B | 56.0–69.0 | − | − | − | − | − | − | [54] |
| A. tequilana | B | 40.9 | − | − | − | − | − | − | [55] |
| A. tequilana | B | 42.0 | 18.5 | 14.0 | − | − | − | − | [56] |
| A. tequilana | B | − | − | − | − | − | − | − | [57] |
| A. tequilana | B | 44.5 | 20.1 | 25.3 | − | 3.7 | 3.6 | − | [58] |
| A. tequilana | L | 24.7–33.5 | 10.7–15.2 | 15.6–19.5 | − | − | − | − | [59] |
| A. tequilana A. americana | L | 47.0 50.0 | 16.0 22.0 | 9.0 13.0 | − | − | − | − | [6] |
| A. lechuguilla | L | 46.0–48.0 | 30.0 | 11.0 | − | 4.0 | 4.0 | 5.0 | [60] |
| Agave spp. | B | 70.0–80.0 | 5.0–10.0 | 15.0–20.0 | − | − | − | − | [61] |
| Furcraea foetida | F | 68.4 | 11.5 | 12.3 | − | − | − | − | [62] |
| Yucca aloifolia | L | 52.5 | 20.5 | 20.0 | − | − | − | − | [63] |
| Yucca gloriosa | F | 66.4 | 17.5 | 6.7 | 1.1 | − | − | − | [31] |
S: sample; Ce: cellulose, He: hemicellulose, Li: lignin, TE: total extractives, W: hot water extractives, E−B: ethanol−benzene extractives, Et: ethanol, Ref: references. * B: Bagasse, F: Fiber, L: Leaf, St: Stem.
The differences in the extractive and lignocellulosic compounds between species allowed us to identify four groups through the principal component analysis. The first group with N. excelsa and Y. periculosa presented a lower amount of hot water and total extractives. This could have implications for their use because various authors consider the hot water and total extractives to represent the nonstructural sugars that are used in fermentation processes for the production of ethanol [8,48,51]. However, in the case of N. excelsa, the percentage of cellulose presented in the stem would allow it to be used to obtain cellulosic products (Table 4). The characteristic that distinguishes Y. filifera from the other species studied was the presence of a large amount of hemicellulose. This hemicellulose can be transformed into usable sugars either through enzymatic hydrolysis processes or with temperature [9], in addition to the fact that Y. filifera presented lower percentages of lignin so that the purification of cellulose would be more efficient [64]. The main characteristic of Y. gigantea was the lower amount of hemicelluloses; however, it had a high percentage of cellulose that could be used to obtain cellulosic fibers. The three species of Yucca studied here revealed the higher differences in the extractives and lignocellulosic compounds between them, and other species of Yucca should be studied in the future to support these findings. All agave species plus Beaucarnea and Furcraea were grouped together by similar values in the extractive compounds (Table 4). In the lignocellulosic components, the agaves had low percentages of cellulose and lignin; however, they had a higher percentage of hemicelluloses. Finally, chromatographic analyzes can be carried out on all the extractives compounds to identify components with potential use, such as flavonoids and triterpenes, which have the antioxidant capacity and can be used mainly in the food and cosmetic industries [65]. In addition, lignocellulose can be treated in different ways to obtain various derivatives, as mentioned by Palomo-Briones et al. [66] for Agave tequilana: through the elimination of lignin by alkaline, organosolv or enzymatic methods, lignin can be solubilized and fermented to obtain ethanolic derivatives. Hemicelluloses and celluloses can be degraded by acids or enzymes to obtain insoluble fractions and use microcrystalline and nanocrystalline cellulose, while the solubilized carbohydrates can be used in the fermentation to obtain ethanol. Solubilized carbohydrates can also be fermented by anaerobic digestion or dark fermentation to obtain biogas and H2 which can be used to obtain energy [66]. Therefore, the species analyzed in this work could be used in different ways, both energetically and in the production of paper or cellulose components [21].
4.2. Cellulose Crystallinity
The crystallinity indexes allowed identifying the species that had the highest proportion of crystalline cellulose. The purity of the cellulose could affect these indexes by presenting hemicellulose or lignin residues that alter the peaks [67]. The FTIR spectra can determine the purity of the samples and calculate the proportion of crystalline cellulose [68,69] by the absence of peaks belonging to hemicelluloses [70] and lignin [71].
The most commonly used indexes in conjunction with FTIR are TCI, LOI, and HBI [68,72]. The TCI index provides information about the amount of crystalline or amorphous cellulose in a sample. The peak indicating the presence of crystalline cellulose is 1370 cm−1, while the peak of 2900 cm−1 [27] indicates the presence of amorphous cellulose. Therefore, if the value of the ratio is greater than one, there will be a greater amount of crystalline cellulose [28]. The LOI index is related to the order of crystalline cellulose, in addition to the fact that the 1430 cm−1 peak shows the presence of crystalline cellulose of type I and the peak 893 cm−1 the presence of type II crystalline cellulose and cellulose amorphous [73]. The order of the crystalline cellulose and LOI peaks can be altered by the type of chemical extraction, and the type of purification used [74]. The HBI index reflects the crystallinity of the sample and its water absorption. Low values reflect a greater amount of crystalline cellulose, while high values indicate the presence of cellulose II or amorphous [27], however, TCI and HBI values are related in terms of cellulose structure and stability, so if they are similar, the cellulose structure has greater stability [28].
Generally, the samples had a higher proportion of crystalline cellulose; however, the type of extraction modifies the order of the cellulose, so the low LOI values reflect the presence of type II crystalline cellulose [75], in addition to possibly the presence of NaOH during purification and the temperature used would alter the order of the crystalline [73]. Furthermore, LOI is correlated with the overall degree of cellulose order, while TCI is directly proportional to the percentage of crystalline cellulose [28]. The similar values of HBI with TCI confirm that the highest proportion of crystalline cellulose predominates among the Asparagaceae species, except the species A. striata, B. gracilis, and Y. periculosa, which had lower crystalline cellulose, and this is reflected in the LOI values that were also the highest [76].
The presence of a greater amount of crystalline cellulose (between 50 and 56% so that the proportion of TCI is 1 to 1.27) in most of the Asparagaceae species agrees with that reported for stems (Table 10). Furthermore, the percentages were also similar for other structures such as fibers in Agave (50.07 [46]), Furcraea (52.6% [62]), and Yucca spp. (55–56% [77]). The other structures have a higher percentage, possibly due to the species analyzed, the type of sample, such as bagasse that no longer has extractives, and some structural sugars, such as hemicelluloses. However, in future studies, X-ray diffraction analysis [78] could be used to confirm the proportion of crystalline cellulose in samples of Asparagaceae species.
4.3. Lignin S/G Ratio
The proportion of S/G obtained for the 10 species reflected that most of the species presented high percentages of syringyl monomers, except for A. attenuata (36.9%) and A. convallis (48%). The species with the highest percentage was of the Yucca genus since it had percentages of 73.9 to 79.5%. The presence of higher percentages of syringyl in species with stem potential allows the purification of cellulose and the degradation of lignin by hydrolytic processes to be more efficient [80] by presenting more bonds of the β-O-4 type and being less condensed [81]. In species with higher percentages of guaiacyl, the stem tissue is hard, and the lignin is difficult to degrade, which is why it is called recalcitrant lignin [82].
Therefore, in the Yucca species and generally in the other species of Agave, Beaucarnea, Furcraea, and Nolina, by presenting a higher percentage of syringyl, the hydrolyzation process with Kraft would be more efficient [83]. In the literature, there are few reports on the proportion of S/G for A. fourcroydes, proportions are reported in fibers (1.05) and spines (1.2) [84], in leaves of A. sisalana (2.0) [85], and leaf fibers (3.0–3.5) [86]. In stems, S/G values have been reported for A. americana (1.27), A. angustifolia (1.29), A. fourcroydes (1.40), A. salmiana (1.33) y A. tequilana (1.57) in untreated samples [11], while for A. tequilana S/G values of 4.3 have also been reported in untreated samples [87] while in A. sisalana the proportion of S/G in stem fibers is 3.6 [88]. In the other genera analyzed here, there are no reports on the composition of lignin. In general, it is observed that the values obtained are similar to those reported by the aforementioned authors.
The presence of high percentages of syringyl in lignin has also been reported in various fibrous species where it provides resistance to and cellular support [89,90,91]. However, in succulent species such as cacti, the presence of syringyl monomers is more associated with tissues with non-lignified parenchyma and not fibers [38,92,93], so the presence of syringyl could be associated with a defense mechanism against pathogens [93] as it has been reported for bryophytes, conifers and angiosperms [94,95,96,97,98].
4.4. Cellulose and Lignin Anatomical Distribution
Analyzing the anatomical distribution of lignin and cellulose in the vascular bundles of Asparagaceae species was useful in identifying the location of the main structural components, in addition to explaining the results obtained both in the percentages of lignocellulosic components and in the proportion of S/G [49,99].
In Figure 4, the fluorescence emitted by the tracheary elements, the fibers, and the non-lignified and lignified parenchyma showed that lignin had different emissions in its fluorescence since it ranged from bluish tones to yellow tones. In the species of A. attenuata and A. convallis, the presence of yellow tones was observed, which would be related to the type of lignin present in the lignified walls. As proposed by Maceda et al. [93], based on a tone scale, yellow to green tones would reflect the presence of guaiacyl-type lignin, while syringyl-type lignin would have shades of lime-green to blue. The difference in the tones in the emission of fluorescence has already been reported for various species with similar tones [100]. The presence of blue tones in fibers in species with S/G ratios above two [93], as for Ferocactus hamatacanthus and F. pilosus, whose S/G ratio is 11.7 and 3.5, respectively [38]. Therefore, in the species of Yuccas, whose proportion ranges from 2.8 to 3.9, the presence of fibers and tissue in blue tones responds to the presence of lignin of the syringyl type.
The presence of lignified parenchyma in the stems of the Yucca species (Figure 4c–f) agrees with the lignin percentages shown in Table 4 since these species, except for B. gracilis, had high lignin values, in contrast to the species of A. convallis and A. attenuata (Figure 4a,b). Therefore, the presence of lignin is a structural support factor for species of tall size and arborescent shape. However, these species also had high percentages of cellulose (Table 4), with a predominance of crystalline cellulose (Table 7). Cellulose and lignin not only provide structural rigidity but also the proportion of S/G, and the presence of crystalline cellulose could improve water conduction in tracheary elements [101] in addition to protecting against pathogens [91,102]. The species analyzed in this study are naturally distributed in Mexico and Y. guatemalensis in Mexico and Guatemala, so it would be interesting to expand the number of genera to determine if there is heterogeneity in a greater number of species of the same genus or if they present homogeneity in the composition of cellulose and lignin.
5. Conclusions
The presence of high percentages of cellulose, the predominance of syringyl-type lignin, percentages above 10% of total extractive components, and the high percentages of holocellulose (structural sugars) show that Asparagaceae species have potential in the use of both productions as biofuels as in the production of paper. In addition, the chemical composition that Asparagaceae species present would be related to biological implications such as conduction, support, and protection against pathogens.
Author Contributions
Conceptualization, A.M. and T.T.; methodology, A.M., M.S.-H. and T.T.; validation, A.M. and T.T.; investigation, A.M. and T.T.; resources, T.T.; writing—review and editing, A.M., T.T. and M.S.-H. All authors have read and agreed to the published version of the manuscript.
Funding
Funding was provided by DGAPA-UNAM postdoctoral fellowship (document number: CJ IC/CTIC I5OO7I2O2I) to AM.
Data Availability Statement
Raw data and FTIR spectra are available in the Figshare repository: https://doi.org/10.6084/m9.figshare.21259230.v1 https://figshare.com/articles/dataset/Chemical-anatomical_characterization_of_stems_of_Asparagaceae_species_with_potential_use_for_lignocellulosic_fibers_and_biofu-els/21259230 (accessed on 3 November 2022)
Acknowledgments
The authors thank Abisaí Josué García for providing the plants from the Botanic Garden, UNAM; thanks to Rubén San Miguel-Chávez for allowing us to use the FTIR in COLPOS. Thanks to Elizabeth Navarro Cerón for allowing us to use the laboratory LANISAF, thanks to Pedro Mercado Ruaro from Laboratorio de Morfo-Anatomía y Citogenética (LANABIO, UNAM), and thanks to Steffany Aguilar Moreno for the support and the laboratory glassware provided.
Conflicts of Interest
The authors declare no conflict of interest.
References
- Delgado-Lemus, A.; Casas, A.; Téllez, O. Distribution, abundance and traditional management of Agave potatorum in the Tehuacán Valley, Mexico: Bases for sustainable use of non-timber forest products. J. Ethnobiol. Ethnomed. 2014, 10, 63. [Google Scholar] [CrossRef] [PubMed] [Green Version]
- Martínez Jiménez, R.; Ruiz-Vega, J.; Caballero Caballero, M.; Silva Rivera, M.E.; Montes Bernabé, J.L. Agaves silvestres y cultivados empleados en la elaboración de mezcal en Sola de vega, Oaxaca, México. Trop. Subtrop. Agroecosyst. 2019, 22, 477–485. [Google Scholar]
- García-Mendoza, A.J.; Franco Martínez, I.S.; Sandoval Gutiérrez, D. Cuatro especies nuevas de Agave (Asparagaceae, Agavoideae) del sur de México. Acta Bot. Mex. 2019, 126, e1461. [Google Scholar] [CrossRef]
- Seberg, O.; Petersen, G.; Davis, J.I.; Chris Pires, J.; Stevenson, D.W.; Chase, M.W.; Fay, M.F.; Devey, D.S.; Jørgensen, T.; Sytsma, K.J.; et al. Phylogeny of the Asparagales based on three plastid and two mitochondrial genes. Am. J. Bot. 2012, 99, 875–889. [Google Scholar] [CrossRef] [Green Version]
- Pérez Hernández, E.; Del Carmen Chávez Parga, M.; González Hernández, J.C. Revisión del agave y el mezcal. Rev. Colomb. Biotecnol. 2016, 18, 148–164. [Google Scholar] [CrossRef]
- Corbin, K.R.; Byrt, C.S.; Bauer, S.; Debolt, S.; Chambers, D.; Holtum, J.A.M.; Karem, G.; Henderson, M.; Lahnstein, J.; Beahan, C.T.; et al. Prospecting for energy-rich renewable raw materials: Agave leaf case study. PLoS ONE 2015, 10, e0135382. [Google Scholar] [CrossRef] [Green Version]
- Flores-Gómez, C.A.; Escamilla Silva, E.M.; Zhong, C.; Dale, B.E.; Da Costa Sousa, L.; Balan, V. Conversion of lignocellulosic agave residues into liquid biofuels using an AFEXTM-based biorefinery. Biotechnol. Biofuels 2018, 11, 1–18. [Google Scholar] [CrossRef]
- Hidalgo-Reyes, M.; Caballero-Caballero, M.; Hernández-Gómez, L.H.; Urriolagoitia-Calderón, G. Chemical and morphological characterization of Agave angustifolia bagasse fibers. Bot. Sci. 2015, 93, 807–817. [Google Scholar] [CrossRef] [Green Version]
- Jiménez-Muñóz, E.; Prieto-García, F.; Prieto-Méndez, J.; Acevedo-Sandoval, O.A.; Rodríguez-Laguna, R. Physicochemical characterization of four species of agaves with potential in obtaining pulp for paper making. DYNA 2016, 83, 232–242. [Google Scholar] [CrossRef]
- Davis, S.C.; Dohleman, F.G.; Long, S.P. The global potential for Agave as a biofuel feedstock. GCB Bioenergy 2011, 3, 68–78. [Google Scholar] [CrossRef]
- Pérez-Pimienta, J.A.; Mojica-Álvarez, R.M.; Sánchez-Herrera, L.M.; Mittal, A.; Sykes, R.W. Recalcitrance assessment of the agro-industrial residues from five Agave species: Ionic liquid pretreatment, saccharification and structural characterization. BioEnergy Res. 2018, 11, 551–561. [Google Scholar] [CrossRef]
- Hill, J.; Nelson, E.; Tilman, D.; Polasky, S.; Tiffany, D. Environmental, economic, and energetic costs and benefits of biodiesel and ethanol biofuels. Proc. Natl. Acad. Sci. USA 2006, 103, 11206–11210. [Google Scholar] [CrossRef] [PubMed] [Green Version]
- Sims, R.E.H.; Mabee, W.; Saddler, J.N.; Taylor, M. An overview of second generation biofuel technologies. Bioresour. Technol. 2010, 1570–1580. [Google Scholar] [CrossRef] [PubMed]
- Comparetti, A.; Febo, P.; Greco, C.; Mammano, M.M.; Orlando, S. Potential production of biogas from prinkly pear (Opuntia ficus-indica L.) in Sicilian uncultivated areas. Chem. Eng. Trans. 2017, 58, 559–564. [Google Scholar] [CrossRef]
- Gilman, I.S.; Edwards, E.J. Crassulacean acid metabolism. Curr. Biol. 2019, 30, 51–63. [Google Scholar] [CrossRef] [Green Version]
- López Collado, C.J.; Vázquez, A.M.; López-Collado, J.; García-Pérez, E.; Sánchez, Á.S. Crecimiento de Opuntia ficus-indica (L.) Mill. en la zona central de Veracruz. Rev. Mex. Cienc. Agríc. 2013, 4, 1005–1014. [Google Scholar] [CrossRef] [Green Version]
- Garbanzo-León, G.; Chavarría-Pérez, G.; Vega-Villalobos, E.V. Correlaciones alométricas en Hylocereus costaricensis y H. monocanthus (pitahaya): Una herramienta para cuantificar el crecimiento. Agron. Mesoam. 2019, 30, 425–436. [Google Scholar] [CrossRef] [Green Version]
- Loza-Cornejo, S.; Terrazas, T.; López-Mata, L.; Trejo, C. Características morfo-anatómicas y metabolismo fotosintético en plántulas de Stenocereus queretaroensis (Cactaceae): Su significado adaptativo. Interciencia 2003, 28, 83–89. [Google Scholar]
- Zúñiga-Estrada, L.; Rosales Robles, E.; Yáñez-Morales, M.d.J.; Jacques-Hernández, C. Características y productividad de una planta MAC, Agave tequilana desarrollada con fertigación en Tamaulipas, México. Rev. Mex. Cienc. Agríc. 2018, 9, 553–564. [Google Scholar]
- Maceda, A.; Soto-Hernández, M.; Peña-Valdivia, C.B.; Terrazas, T. Chemical composition of cacti wood and comparison with the wood of other taxonomic groups. Chem. Biodivers. 2018, 15, e1700574. [Google Scholar] [CrossRef]
- Maceda, A.; Soto-Hernández, M.; Peña-Valdivia, C.B.; Trejo, C.; Terrazas, T. Characterization of lignocellulose of Opuntia (Cactaceae) species using FTIR spectroscopy: Possible candidates for renewable raw material. Biomass Convers. Biorefin. 2020. [Google Scholar] [CrossRef]
- Li, R.; Yang, G.; Chen, J.; He, M. The characterization of hemicellulose extract from corn stalk with stepwise alkali extraction. Palpu Chongi Gisul/J. Korea Tech. Assoc. Pulp Pap. Ind. 2017, 49, 29–40. [Google Scholar] [CrossRef]
- Popescu, C.-M.; Popa, V.I. Analytical methods for lignin characterization. II. Spectroscopic studies. Cellul. Chem. Technol. 2006, 40, 597–621. [Google Scholar]
- Pandey, K.K. Study of the effect of photo-irradiation on the surface chemistry of wood. Polym. Degrad. Stab. 2005, 90, 9–20. [Google Scholar] [CrossRef]
- Nelson, M.L.; O’Connor, R.T. Relation of certain infrared bands to cellulose crystallinity and crystal latticed type. Part I. Spectra of lattice types I, II, III and of amorphous cellulose. J. Appl. Polym. Sci. 1964, 8, 1311–1324. [Google Scholar] [CrossRef]
- Ciolacu, D.; Ciolacu, F.; Popa, V.I. Amorphous cellulose-structure and characterization. Cellul. Chem. Technol. 2011, 45, 13–21. [Google Scholar]
- Poletto, M.; Ornaghi, H.L.; Zattera, A.J. Native cellulose: Structure, characterization and thermal properties. Materials 2014, 7, 6105–6119. [Google Scholar] [CrossRef] [Green Version]
- Cichosz, S.; Masek, A. IR study on cellulose with the varied moisture contents: Insight into the supramolecular structure. Materials 2020, 13, 4573. [Google Scholar] [CrossRef]
- Arias, S.; Terrazas, T. Variación en la anatomía de la madera de Pachycereus pecten-aboriginum (Cactaceae). An. Inst. Biol. Univ. Nac. Autón. Méx. 2001, 72, 157–169. [Google Scholar]
- Nakaba, S.; Kitin, P.; Yamagishi, Y.; Begum, S.; Kudo, K.; Nugroho, W.D.; Funada, R. Three-dimensional imaging of cambium and secondary xylem cells by confocal laser scanning microscopy. Plant Microtech. Protoc. 2015, 431–465. [Google Scholar] [CrossRef]
- Taban, E.; Mirzaei, R.; Faridan, M.; Samaei, E.; Salimi, F.; Tajpoor, A.; Ghalenoei, M. Morphological, acoustical, mechanical and thermal properties of sustainable green Yucca (Y. gloriosa) fibers: An exploratory investigation. J. Environ. Health Sci. Eng. 2020, 18, 883–896. [Google Scholar] [CrossRef]
- Nataren-Velazquez, J.; Del Angel-Pérez, A.L.; Megchún-García, J.V.; Ramírez-Herrera, E.; Ibarra-Pérez, F. Colecta y caracterización morfologica de izote (Yucca elephantipes) y cruceta (Acanthocereus tetragonus), del estado de Veracruz. In Prospectiva, de la Investigación Agrícola en el Siglo XXI en México; Avendaño Ruiz, B.D., Bautista Ortega, J., Del Angel-Pérez, A.L., Ireta Paredes, A.d.R., Martinez-Trejo, G., Pérez Hernández, P., Schwentesius Ridermann, R., Eds.; Universidad Autónoma de Chapingo and Plaza y Valdés, S.L.: Texcoco, México, 2020; pp. 137–149. [Google Scholar]
- Mora-Olivo, A.; Hurtado-González, M.; Gaona-García, G.; Treviño-Carreón, J. Las flores comestibles del desierto. CienciaUAT 2009, 4, 10–13. [Google Scholar]
- Granados-Sánchez, D.; Sánchez-González, A.; Granados-Victorino, R.L.; de la Rosa, A.B. Ecología de la vegetación del desierto chihuahuense. Rev. Chapingo Ser. Cienc. For. Y Ambient. 2011, 18, 111–130. [Google Scholar] [CrossRef]
- Hernández-Moreno, M.M.; Téllez-Valdés, O.; Martínez-Meyer, E.; Islas-Saldaña, L.A.; Salazar-Rojas, V.M.; Macías-Cuéllar, H. Distribución de la cobertura vegetal y del uso del terreno del municipio de Zapotitlán, Puebla, México. Rev. Mex. Biodivers. 2021, 92, e923649. [Google Scholar] [CrossRef]
- Moura, J.C.M.S.; Bonine, C.A.V.; de Oliveira Fernandes Viana, J.; Dornelas, M.C.; Mazzafera, P. Abiotic and biotic stresses and changes in the lignin content and composition in plants. J. Integr. Plant Biol. 2010, 52, 360–376. [Google Scholar] [CrossRef] [PubMed]
- Lipiec, J.; Doussan, C.; Nosalewicz, A.; Kondracka, K. Effect of drought and heat stresses on plant growth and yield: A review. Int. Agrophys. 2013, 27, 463–477. [Google Scholar] [CrossRef]
- Reyes-Rivera, J.; Canché-Escamilla, G.; Soto-Hernández, M.; Terrazas, T. Wood chemical composition in species of Cactaceae the relationship between lignification and stem morphology. PLoS ONE 2015, 10, e0123919. [Google Scholar] [CrossRef]
- Mylsamy, K.; Rajendran, I. Investigation on physio-chemical and mechanical properties of raw and alkali-treated Agave americana fiber. J. Reinf. Plast. Compos. 2010, 29, 2925–2935. [Google Scholar] [CrossRef]
- Krishnadev, P.; Subramanian, K.S.; Janavi, G.J.; Ganapathy, S.; Lakshmanan, A. Synthesis and characterization of nano-fibrillated cellulose derived from green Agave americana L. Fiber. BioResources 2020, 15, 2442–2458. [Google Scholar] [CrossRef]
- Rosli, N.A.; Ahmad, I.; Abdullah, I. Isolation and characterization of cellulose nanocrystals from Agave angustifolia fibre. BioResources 2013, 8, 1893–1908. [Google Scholar] [CrossRef] [Green Version]
- Teli, M.D.; Jadhav, A.C. Effect of alkali treatment on the properties of Agave augustifolia v. marginata fibre. Int. Res. J. Eng. Technol. 2016, 3, 2754–2761. [Google Scholar]
- Carmona, J.E.; Morales-Martínez, T.K.; Mussatto, S.I.; Castillo-Quiroz, D.; Ríos-González, L.J. Chemical, structural and functional properties of lechuguilla (Agave lechuguilla Torr.). Rev. Mex. Cienc. For. 2017, 8, 100–122. [Google Scholar]
- Ortíz-Méndez, O.H.; Morales-Martínez, T.K.; Rios-González, L.J.; Rodríguez-De La Garza, J.A.; Quintero, J.; Aroca, G. Bioethanol production from Agave lechuguilla biomass pretreated by autohydrolysis. Rev. Mex. Ing. Quím. 2017, 16, 467–476. [Google Scholar]
- Vieira, M.C.; Heinze, T.; Antonio-Cruz, R.; Mendoza-Martinez, A.M. Cellulose derivatives from cellulosic material isolated from Agave lechuguilla and A. fourcroydes. Cellulose 2002, 9, 203–212. [Google Scholar] [CrossRef]
- De Dios Naranjo, C.; Alamilla-Beltrán, L.; Gutiérrez-Lopez, G.F.; Terres-Rojas, E.; Solorza-Feria, J.; Romero-Vargas, S.; Yee-Madeira, H.T.; Areli, F.-M.; Mora-Escobedo, R. Aislamiento y caracterización de celulosas obtenidas de fibras de Agave salmiana aplicando dos métodos de extracción ácido-alcali. Rev. Mex. Cienc. Agríc. 2016, 7, 31–43. [Google Scholar]
- Bernardo, G.R.R.; Rene, R.M.J. Contribution of agro-waste material main components (hemicelluloses, cellulose, and lignin) to the removal of chromium (III) from aqueous solution. J. Chem. Technol. Biotechnol. 2009, 84, 1533–1538. [Google Scholar] [CrossRef]
- Li, H.; Foston, M.B.; Kumar, R.; Samuel, R.; Gao, X.; Hu, F.; Ragauskas Cd, A.J.; Wyman, C.E. Chemical composition and characterization of cellulose for Agave as a fast-growing, drought-tolerant biofuels feedstock. RSC Adv. 2012, 2, 4951–4958. [Google Scholar] [CrossRef]
- Li, H.; Pattathil, S.; Foston, M.B.; Ding, S.Y.; Kumar, R.; Gao, X.; Mittal, A.; Yarbrough, J.M.; Himmel, M.E.; Ragauskas, A.J.; et al. Agave proves to be a low recalcitrant lignocellulosic feedstock for biofuels production on semi-arid lands. Biotechnol. Biofuels 2014, 7, 50. [Google Scholar] [CrossRef] [Green Version]
- McDougall, G.J.; Morrison, I.M.; Stewart, D.; Weyers, J.D.B.; Hillman, J.R. Plant fibres: Botany, chemistry and processing for industrial use. J. Sci. Food Agric. 1993, 62, 1–20. [Google Scholar] [CrossRef]
- Kestur G., S.; Flores-Sahagun, T.H.S.; Dos Santos, L.P.; Dos Santos, J.; Mazzaro, I.; Mikowski, A. Characterization of blue agave bagasse fibers of Mexico. Compos. Part A Appl. Sci. Manuf. 2013, 45, 153–161. [Google Scholar] [CrossRef]
- Iñiguez, G.; Acosta, N.; Martínez, L.; Parra, J.; González, O. Utilización de supbroductos de la industria tequilera. Parte 7. Compostaje de bagazo de agave y vinazas tequileras. Rev. Int. Contam. Ambient. 2005, 21, 37–50. [Google Scholar]
- Robles, E.; Fernández-Rodríguez, J.; Barbosa, A.M.; Gordobil, O.; Carreño, N.L.V.; Labidi, J. Production of cellulose nanoparticles from blue agave waste treated with environmentally friendly processes. Carbohydr. Polym. 2018, 183, 294–302. [Google Scholar] [CrossRef] [PubMed]
- Hernández, J.A.; Romero, V.H.; Escalante, A.; Toriz, G.; Rojas, O.J.; Sulbarán, B.C. Agave tequilana bagasse as source of cellulose nanocrystals via organosolv treatment. BioResources 2018, 13, 3603–3614. [Google Scholar] [CrossRef]
- Robles-García, M.Á.; Del-Toro-Sánchez, C.L.; Márquez-Ríos, E.; Barrera-Rodríguez, A.; Aguilar, J.; Aguilar, J.A.; Reynoso-Marín, F.J.; Ceja, I.; Dórame-Miranda, R.; Rodríguez-Félix, F. Nanofibers of cellulose bagasse from Agave tequilana Weber var. azul by electrospinning: Preparation and characterization. Carbohydr. Polym. 2018, 192, 69–74. [Google Scholar] [CrossRef] [PubMed]
- Ramírez-Cortina, C.; Alonso-Gutiérrez, M.S.; Rigal, L. Tratamiento alcalino de los residuos agroindustriales de la producción del tequila, para su uso como complemento de alimento de rumiantes. Rev. AIDIS Ing. Y Cienc. Ambient. 2012, 5, 69–77. [Google Scholar]
- Espino, E.; Cakir, M.; Domenek, S.; Román-Gutiérrez, A.D.; Belgacem, N.; Bras, J. Isolation and characterization of cellulose nanocrystals from industrial by-products of Agave tequilana and barley. Ind. Crop. Prod. 2014, 62, 552–559. [Google Scholar] [CrossRef]
- Palacios Hinestroza, H.; Hernández Diaz, J.A.; Esquivel Alfaro, M.; Toriz, G.; Rojas, O.J.; Sulbarán-Rangel, B.C. Isolation and characterization of nanofibrillar cellulose from Agave tequilana Weber bagasse. Adv. Mater. Sci. Eng. 2019, 2019, 1342547. [Google Scholar] [CrossRef] [Green Version]
- Rijal, D.; Walsh, K.B.; Subedi, P.P.; Ashwath, N. Quality estimation of Agave tequilana leaf for bioethanol production. J. Near Infrared Spectrosc. 2017, 24, 453–465. [Google Scholar] [CrossRef] [Green Version]
- Márquez, A.; Cazaurang, N.; González, I.; Colunga-GarciaMarin, P. Extraction of chemical cellulose from the fibers of Agave lechuguilla Torr. Econ. Bot. 1996, 50, 465–468. [Google Scholar] [CrossRef]
- Ponce-Reyes, C.E.; Chanona-Pérez, J.J.; Garibay-Febles, V.; Palacios-González, E.; Karamath, J.; Terrés-Rojas, E.; Calderón-Domínguez, G. Preparation of cellulose nanoparticles from agave waste and its morphological and structural characterization. Rev. Mex. Ing. Quím. 2014, 13, 897–906. [Google Scholar]
- Manimaran, P.; Senthamaraikannan, P.; Sanjay, M.R.; Marichelvam, M.K.; Jawaid, M. Study on characterization of Furcraea foetida new natural fiber as composite reinforcement for lightweight applications. Carbohydr. Polym. 2018, 181, 650–658. [Google Scholar] [CrossRef] [PubMed]
- do Nascimento, H.M.; dos Santos, A.; Duarte, V.A.; Bittencourt, P.R.S.; Radovanovic, E.; Fávaro, S.L. Characterization of natural cellulosic fibers from Yucca aloifolia L. leaf as potential reinforcement of polymer composites. Cellulose 2021, 28, 5477–5492. [Google Scholar] [CrossRef]
- Razali, N.A.M.; Sohaimi, R.M.; Othman, R.N.I.R.; Abdullah, N.; Demon, S.Z.N.; Jasmani, L.; Yunus, W.M.Z.W.; Ya’acob, W.M.H.W.; Salleh, E.M.; Norizan, M.N.; et al. Comparative study on extraction of cellulose fiber from rice straw waste from chemo-mechanical and pulping method. Polymers 2022, 14, 387. [Google Scholar] [CrossRef] [PubMed]
- Álvarez-Chávez, J.; Villamiel, M.; Santos-Zea, L.; Ramírez-Jiménez, A.K. Agave by-products: An overview of their nutraceutical value, current applications, and processing methods. Polysaccharides 2021, 2, 720–743. [Google Scholar] [CrossRef]
- Palomo-Briones, R.; López-Gutiérrez, I.; Islas-Lugo, F.; Galindo-Hernández, K.L.; Munguía-Aguilar, D.; Rincón-Pérez, J.A.; Cortés-Carmona, M.A.; Alatriste-Mondragón, F.; Razo-Flores, E. Agave bagasse biorefinery: Processing and perspectives. Clean Technol. Environ. Policy 2018, 20, 1423–1441. [Google Scholar] [CrossRef]
- Fuller, M.E.; Andaya, C.; McClay, K. Evaluation of ATR-FTIR for analysis of bacterial cellulose impurities. J. Microbiol. Methods 2018, 144, 145–151. [Google Scholar] [CrossRef]
- Zaltariov, M.-F. FTIR investigation on crystallinity of hydroxypropyl methyl cellulose-based polymeric blends. Cellul. Chem. Technol. Cellul. Chem. Technol. 2021, 55, 981–988. [Google Scholar] [CrossRef]
- Kruer-Zerhusen, N.; Cantero-Tubilla, B.; Wilson, D.B. Characterization of cellulose crystallinity after enzymatic treatment using Fourier transform infrared spectroscopy (FTIR). Cellulose 2018, 25, 37–48. [Google Scholar] [CrossRef]
- Chen, C.J.; Luo, J.J.; Huang, X.P.; Zhao, S.K. Analysis on cellulose crystalline and FTIR spectra of artocarpus heterophyllus Lam wood and its main chemical compositions. Adv. Mater. Res. 2011, 236–238, 369–375. [Google Scholar] [CrossRef]
- Lionetto, F.; Del Sole, R.; Cannoletta, D.; Vasapollo, G.; Maffezzoli, A. Monitoring wood degradation during weathering by cellulose crystallinity. Materials 2012, 5, 1910–1922. [Google Scholar] [CrossRef] [Green Version]
- Poletto, M.; Pistor, V.; Santana, R.M.C.; Zattera, A.J. Materials produced from plant biomass: Part II: Evaluation of crystallinity and degradation kinetics of cellulose. Mater. Res. 2012, 15, 421–427. [Google Scholar] [CrossRef] [Green Version]
- Široký, J.; Blackburn, R.S.; Bechtold, T.; Taylor, J.; White, P. Attenuated total reflectance Fourier-transform Infrared spectroscopy analysis of crystallinity changes in lyocell following continuous treatment with sodium hydroxide. Cellulose 2010, 17, 103–115. [Google Scholar] [CrossRef]
- Hofmann, D.; Fink, H.P.; Philipp, B. Lateral crystallite size and lattice distortions in cellulose II samples of different origin. Polymer 1989, 30, 237–241. [Google Scholar] [CrossRef]
- Kljun, A.; Benians, T.A.S.; Goubet, F.; Meulewaeter, F.; Knox, J.P.; Blackburn, R.S. Comparative analysis of crystallinity changes in cellulose i polymers using ATR-FTIR, X-ray diffraction, and carbohydrate-binding module probes. Biomacromolecules 2011, 12, 4121–4126. [Google Scholar] [CrossRef]
- Colom, X.; Carrillo, F. Crystallinity changes in lyocell and viscose-type fibres by caustic treatment. Eur. Polym. J. 2002, 38, 2225–2230. [Google Scholar] [CrossRef]
- Kamali Moghaddam, M.; Torabi, T. Cellulose microfibers isolated from Yucca leaves: Structural, chemical, and thermal properties. J. Nat. Fibers 2022. [Google Scholar] [CrossRef]
- Beluns, S.; Gaidukovs, S.; Platinieks, O.; Gaidukova, G.; Mierina, I.; Grase, L.; Starkova, O.; Brazdausks, P.; Thakur, V.K. From wood and hemp biomass wastes to sustainable nanocellulose foams. Ind. Crop. Prod. 2021, 170, 113780. [Google Scholar] [CrossRef]
- Moghaddam, M.K.; Karimi, E. Structural and physical characteristics of the yucca fiber. J. Ind. Text. 2020, 51, 8018S–8034S. [Google Scholar] [CrossRef]
- Alves, A.; Simoes, R.; Stackpole, D.J.; Vaillancourt, R.E.; Potts, B.M.; Schwanninger, M.; Rodrigues, J. Determination of the syringyl/guaiacyl ratio of Eucalyptus globulus wood lignin by near infrared-based partial least squares regression models using analytical pyrolysis as the reference method. J. Near Infrared Spectrosc. 2011, 19, 343–348. [Google Scholar] [CrossRef]
- Wang, C.; Li, H.; Li, M.; Bian, J.; Sun, R. Revealing the structure and distribution changes of Eucalyptus lignin during the hydrothermal and alkaline pretreatments. Sci. Rep. 2017, 7, 593. [Google Scholar] [CrossRef] [Green Version]
- Li, M.; Pu, Y.; Ragauskas, A.J. Current understanding of the correlation of lignin structure with biomass recalcitrance. Front. Chem. 2016, 4, 45. [Google Scholar] [CrossRef] [PubMed] [Green Version]
- Ralph, J.; Landucci, L.L. NMR of Lignins. In Lignin and Lignans; Advances in Chemistry; Heitner, C., Dimmel, D.R., Schmidt, J.A., Eds.; Taylor & Francis Group: Boca Raton, FL, USA, 2010; pp. 137–234. [Google Scholar]
- Morán-Velázquez, D.C.; Monribot-Villanueva, J.L.; Bourdon, M.; Tang, J.Z.; López-Rosas, I.; Maceda-López, L.F.; Villalpando-Aguilar, J.L.; Rodríguez-López, L.; Gauthier, A.; Trejo, L.; et al. Unravelling chemical composition of agave spines: News from Agave fourcroydes Lem. Plants 2020, 9, 1642. [Google Scholar] [CrossRef] [PubMed]
- Del Río, J.C.; Rencoret, J.; Marques, G.; Gutiérrez, A.; Ibarra, D.; Santos, J.I.; Jiménez-Barbero, J.; Zhang, L.; Martínez, Á.T. Highly Acylated (acetylated and/or p-coumaroylated) native lignins from diverse herbaceous plants. J. Agric. Food Chem. 2008, 56, 9525–9534. [Google Scholar] [CrossRef] [PubMed]
- Del Río, J.C.; Prinsen, P.; Cadena, E.M.; Ngel, A.; Martínez, T.; Gutiérrez, A.; Rencoret, J. Lignin-carbohydrate complexes from sisal (Agave sisalana) and abaca (Musa textilis): Chemical composition and structural modifications during the isolation process. Planta 2016, 243, 1143–1158. [Google Scholar] [CrossRef]
- Perez-Pimienta, J.A.; Flores-Gómez, C.A.; Ruiz, H.A.; Sathitsuksanoh, N.; Balan, V.; da Costa Sousa, L.; Dale, B.E.; Singh, S.; Simmons, B.A. Evaluation of Agave bagasse recalcitrance using AFEXTM, autohydrolysis, and ionic liquid pretreatments. Bioresour. Technol. 2016, 211, 216–223. [Google Scholar] [CrossRef] [Green Version]
- Rencoret, J.; Marques, G.; Gutiérrez, A.; Ibarra, D.; Li, J.; Gellerstedt, G.; Santos, J.I.; Jiménez-Barbero, J.; Martínez, Á.T.; Del Río, J.C. Structural characterization of milled wood lignins from different eucalypt species. Holzforschung 2008, 62, 514–526. [Google Scholar] [CrossRef]
- Lee, Y.; Voit, E.O. Mathematical modeling of monolignol biosynthesis in Populus xylem. Math. Biosci. 2010, 228, 78–89. [Google Scholar] [CrossRef]
- Barros, J.; Serk, H.; Granlund, I.; Pesquet, E. The cell biology of lignification in higher plants. Ann. Bot. 2015, 115, 1053–1074. [Google Scholar] [CrossRef] [Green Version]
- Li, L.; Cheng, X.F.; Leshkevich, J.; Umezawa, T.; Harding, S.A.; Chiang, V.L. The last step of syringyl monolignol biosynthesis in angiosperms is regulated by a novel gene encoding sinapyl alcohol dehydrogenase. Plant Cell 2001, 13, 1567–1585. [Google Scholar] [CrossRef] [Green Version]
- Reyes-Rivera, J.; Soto-Hernández, M.; Canché-Escamilla, G.; Terrazas, T. Structural characterization of lignin in four cacti wood: Implications of lignification in the growth form and succulence. Front. Plant Sci. 2018, 871, 1518. [Google Scholar] [CrossRef] [Green Version]
- Maceda, A.; Reyes-Rivera, J.; Soto-Hernández, M.; Terrazas, T. Distribution and chemical composition of lignin in secondary xylem of Cactaceae. Chem. Biodivers. 2021, 18, e2100431. [Google Scholar] [CrossRef] [PubMed]
- Weng, J.-K.; Banks, J.A.; Chapple, C. Parallels in lignin biosynthesis: A study in Selaginella moellendorffii reveals convergence across 400 million years of evolution. Commun. Integr. Biol. 2008, 1, 20–22. [Google Scholar] [CrossRef] [PubMed] [Green Version]
- Weng, J.-K.; Li, X.; Stout, J.; Chapple, C. Independent origins of syringyl lignin in vascular plants. Proc. Natl. Acad. Sci. USA 2008, 105, 7887–7892. [Google Scholar] [CrossRef] [PubMed] [Green Version]
- Lange, B.M.; Lapierre, C.; Sandermann, H. Elicitor-induced spruce stress lignin: Structural similarity to early developmental lignins. Plant Physiol. 1995, 108, 1277–1287. [Google Scholar] [CrossRef] [PubMed]
- Menden, B.; Kohlhoff, M.; Moerschbacher, B.M. Wheat cells accumulate a syringyl-rich lignin during the hypersensitive resistance response. Phytochemistry 2007, 68, 513–520. [Google Scholar] [CrossRef] [PubMed]
- Skyba, O.; Douglas, C.J.; Mansfield, S.D. Syringyl-Rich lignin renders poplars more resistant to degradation by wood decay fungi. Appl. Environ. Microbiol. 2013, 79, 2560–2571. [Google Scholar] [CrossRef] [Green Version]
- Li, Y.; Mai, Y.W.; Ye, L. Sisal fibre and its composites: A review of recent developments. Compos. Sci. Technol. 2000, 60, 2037–2055. [Google Scholar] [CrossRef]
- De Micco, V.; Aronne, G. Combined histochemistry and autofluorescence for identifying lignin distribution in cell walls. Biotech. Histochem. 2007, 82, 209–216. [Google Scholar] [CrossRef]
- Pereira, L.; Domingues-Junior, A.P.; Jansen, S.; Choat, B.; Mazzafera, P. Is embolism resistance in plant xylem associated with quantity and characteristics of lignin? Trees Struct. Funct. 2018, 32, 349–358. [Google Scholar] [CrossRef]
- Martone, P.T.; Estevez, J.M.; Lu, F.; Ruel, K.; Denny, M.W.; Somerville, C.; Ralph, J. Discovery of lignin in seaweed reveals convergent evolution of cell-wall architecture. Curr. Biol. 2009, 19, 169–175. [Google Scholar] [CrossRef]
Figure 1.
The three-dimension plot of the principal components from Asparagaceae stems. Blue points: group 1, green point: group 2, pink point: group 3, brown point: group 4.
Figure 1.
The three-dimension plot of the principal components from Asparagaceae stems. Blue points: group 1, green point: group 2, pink point: group 3, brown point: group 4.

Figure 2.
Cellulose FTIR spectra of Asparagaceae species.

Figure 3.
FTIR spectra of the lignin fingerprint of the Asparagaceae species.

Figure 4.
Fluorescence images from representative Asparagaceae species. (a) A. attenuata. (b) A. convallis. (c) B. gracilis. (d) N. excelsa. (e) Y. gigantea. (f) Y. periculosa. f: fiber, v: vessel, p: parenchyma, ph: phloem, cr: crystal.
Figure 4.
Fluorescence images from representative Asparagaceae species. (a) A. attenuata. (b) A. convallis. (c) B. gracilis. (d) N. excelsa. (e) Y. gigantea. (f) Y. periculosa. f: fiber, v: vessel, p: parenchyma, ph: phloem, cr: crystal.

Table 1.
Asparagaceae Species.
| Species | Type of Stem | Life Forms | Size Category | Natural Distribution |
|---|---|---|---|---|
| Agave attenuata Salm-Dyck | Fibrous | Herbaceous | Medium | Mexico |
| Agave celsii Hook. | Fibrous | Herbaceous | Medium | Mexico |
| Agave convallis Trel. | Fibrous | Herbaceous | Medium | Mexico |
| Agave striata Zucc. | Fibrous | Herbaceous | Medium | Mexico |
| Beaucarnea gracilis Lem. | Fibrous | Arborescent | Tall | Mexico |
| Furcraea longaeva Karw. & Zucc. | Fibrous | Arborescent | Tall | Mexico |
| Nolina excelsa García-Mend. & E. Solano | Fibrous | Arborescent | Tall | Mexico |
| Yucca filifera Chabaud | Fibrous | Arborescent | Tall | Mexico |
| Yucca gigantea Lem. | Fibrous | Arborescent | Tall | Mexico, Guatemala |
| Yucca periculosa Baker | Fibrous | Arborescent | Tall | Mexico |
Table 2.
Kruskal-Wallis analysis for the lignocellulosic and extractives variables.
| Variables | χ-Square | Df | Significance |
|---|---|---|---|
| Ethanol-benzene | 21.16344 | 9 | 0.01194 |
| Ethanol 96% | 22.17698 | 9 | 0.00833 |
| Water 90 °C | 24.08278 | 9 | 0.00417 |
| Total extractives | 26.28172 | 9 | 0.00184 |
| Extractive-free lignocellulose | 26.28172 | 9 | 0.00184 |
| Lignin | 20.94839 | 9 | 0.01288 |
| Cellulose | 26.64249 | 9 | 0.00160 |
| Hemicelluloses | 24.54409 | 9 | 0.00352 |
Table 3.
Extractives percentage from the 10 Asparagaceae species.
| Extractive Compounds (%) | Extractive-Free Lignocellulose (%) | ||||
|---|---|---|---|---|---|
| Species | Ethanol-Benzene | Ethanol 96% | Water 90 °C | Total Extractives | |
| Agave attenuata | 7.5 ± 1.8 AB | 9.9 ± 1.1 AB | 4.7 ± 1.1 AB | 22.0 ± 1.8 ABC | 78.0 ± 1.8 ABC |
| Agave celsii | 6.9 ± 1.8 AB | 6.5 ± 1.1 AB | 3.9 ± 0.8 AB | 17.4 ± 0.8 ABC | 82.6 ± 0.8 ABC |
| Agave convallis | 9.4 ± 1.9 AB | 6.4 ± 1.2 AB | 10.2 ± 1.5 B | 26.0 ± 0.5 C | 74.0 ± 0.5 A |
| Agave striata | 7.6 ± 1.6 AB | 4.6 ± 0.7 A | 3.0 ± 0.7 AB | 15.3 ± 2.5 ABC | 84.7 ± 2.5 ABC |
| Beaucarnea gracilis | 5.9 ± 0.5 AB | 8.3 ± 1.9 AB | 5.3 ± 0.5 AB | 19.5 ± 1.8 ABC | 80.5 ± 1.8 ABC |
| Furcraea longaeva | 9.7 ± 0.6 B | 6.9 ± 0.7 AB | 3.7 ± 0.7 AB | 20.2 ± 0.8 ABC | 79.8 ± 0.8 ABC |
| Nolina excelsa | 4.5 ± 0.9 A | 5.1 ± 0.6 AB | 1.7 ± 0.6 A | 11.3 ± 1.1 A | 88.7 ± 1.1 C |
| Yucca filifera | 9.6 ± 0.2 AB | 6.2 ± 1.1 AB | 3.2 ± 0.2 AB | 18.9 ± 0.9 ABC | 81.1 ± 0.9 ABC |
| Yucca gigantea | 8.4 ± 1.1 AB | 11.9 ± 1.2 B | 3.8 ± 0.9 AB | 24.1 ± 2.2 BC | 75.9 ± 2.2 AB |
| Yucca periculosa | 6.1 ± 1.8 AB | 4.9 ± 1.0 AB | 1.8 ± 0.6 A | 12.9 ± 2.5 AB | 87.1 ± 2.5 BC |
Different letters in each column indicate significant differences (p < 0.05). Mean ± standard deviation (SD).
Table 4.
Lignin, cellulose, and hemicellulose percentage of dry biomass of Asparagaceae species.
| Species | Lignin (%) | Cellulose (%) | Hemicellulose (%) |
|---|---|---|---|
| Agave attenuata | 20.4 ± 2.7 AB | 35.4 ± 0.8 ABC | 22.1 ± 1.6 ABC |
| Agave celsii | 23.8 ± 0.9 AB | 31.6 ± 0.8 A | 27.1 ± 2.3 BC |
| Agave convallis | 18.2 ± 1.8 AB | 34.9 ± 1.4 AB | 20.9 ± 1.6 ABC |
| Agave striata | 24.2 ± 6.1 AB | 37.1 ± 1.9 ABC | 23.4 ± 5.9 ABC |
| Beaucarnea gracilis | 20.2 ± 1.1 AB | 38.1 ± 1.7 ABC | 22.3 ± 2.8 ABC |
| Furcraea longaeva | 26.3 ± 0.8 B | 37.3 ± 0.9 ABC | 16.2 ± 2.4 ABC |
| Nolina excelsa | 24.5 ± 3.2 AB | 52.2 ± 2.1 C | 12.0 ± 4.1 AB |
| Yucca filifera | 11.4 ± 1.1 A | 38.9 ± 1.2 ABC | 30.7 ± 0.9 C |
| Yucca gigantea | 24.9 ± 1.7 AB | 45.3 ± 1.8 BC | 5.7 ± 1.5 A |
| Yucca periculosa | 24.5 ± 0.5 AB | 41.6 ± 1.8 ABC | 21.0 ± 2.3 ABC |
Different letters in each column indicate significant differences (p < 0.05). Mean ± standard deviation (SD).
Table 5.
Vectors, eigenvalues, and cumulative proportion of the variation are explained by each variable.
Table 5.
Vectors, eigenvalues, and cumulative proportion of the variation are explained by each variable.
| Variables | PC1 | PC2 | PC3 |
|---|---|---|---|
| Ethanol-Benzene | 0.439 | 0.058 | 0.013 |
| Ethanol | 0.194 | 0.553 | −0.169 |
| Water | 0.453 * | 0.096 | 0.125 |
| Extractive-free lignocellulose | −0.492 | −0.346 | 0.015 |
| Cellulose | −0.327 | 0.302 | 0.788 |
| Lignin | −0.410 | 0.272 | −0.578 |
| Hemicellulose | 0.216 | −0.630 | −0.008 |
| Eigenvalue | 3.127 | 2.011 | 0.771 |
| Variance (%) | 44.7 | 28.7 | 11.0 |
| Accumulative variance (%) | 44.7 | 73.4 | 84.4 |
* The highest values are in bold on each PC.
Table 6.
Cellulose peaks of Asparagaceae species.
| Wavenumber (cm−1) | Assignments |
|---|---|
| 3000–3600 | OH stretching |
| 2900 | CH stretching |
| 1430 | CH2 symmetric bending (crystalline and amorphous cellulose) |
| 1370 | C-H and C-O bending vibration bonds |
| 1336 | C-O-H in-plane bending (amorphous cellulose) |
| 1315 | CH2 wagging vibration (crystalline cellulose) |
| 1163 | C-O-C asymmetrical stretching |
| 893 | Out-of-plane asymmetrical stretching of cellulose ring |
| 670 | C-O-H out-of-plane stretching |
Table 7.
Crystallinity indexes of Asparagaceae species.
| Species | TCI (A1370/A2900) | LOI (A1430/A893) | HBI (A3400/A1315) |
|---|---|---|---|
| Agave attenuata | 1.12 ± 0.01 | 0.49 ± 0.01 | 1.16 ± 0.02 |
| Agave celsii | 1.15 ± 0.05 | 0.49 ± 0.03 | 1.18 ± 0.09 |
| Agave convallis | 1.27 ± 0.03 | 0.56 ± 0.28 | 1.17 ± 0.08 |
| Agave striata | 0.85 ± 0.17 | 0.64 ± 0.03 | 0.92 ± 0.12 |
| Beaucarnea gracilis | 0.9 ± 0.01 | 0.59 ± 0.01 | 1.21 ± 0.02 |
| Furcraea longaeva | 1.18 ± 0.05 | 0.47 ± 0.02 | 1.09 ± 0.04 |
| Nolina excelsa | 1.09 ± 0.1 | 0.54 ± 0.02 | 1.09 ± 0.01 |
| Yucca filifera | 1.16 ± 0.02 | 0.52 ± 0.01 | 1.11 ± 0.02 |
| Yucca gigantea | 1.15 ± 0.03 | 0.51 ± 0.01 | 1.11 ± 0.02 |
| Yucca periculosa | 0.78 ± 0.05 | 0.59 ± 0.02 | 1.03 ± 0.05 |
Mean ± standard deviation (SD).
Table 8.
Percentages of syringyl and guaiacyl, and S/G ratio of Asparagaceae species.
| Species | Guaiacyl (%) | Syringyl (%) | S/G Ratio |
|---|---|---|---|
| Agave attenuata | 63.1 | 36.9 | 0.6 |
| Agave celsii | 47.0 | 53.0 | 1.1 |
| Agave convallis | 52.0 | 48.0 | 0.9 |
| Agave striata | 44.0 | 56.0 | 1.3 |
| Beaucarnea gracilis | 42.3 | 57.7 | 1.4 |
| Furcraea longaeva | 39.1 | 60.9 | 1.6 |
| Nolina excelsa | 49.0 | 51.0 | 1.0 |
| Yucca filifera | 26.1 | 73.9 | 2.8 |
| Yucca gigantea | 23.0 | 77.0 | 3.3 |
| Yucca periculosa | 20.5 | 79.5 | 3.9 |
Table 10.
Crystalline index Agave, Furcraea, and Yucca.
| Species | Sample | Crystalline Index | Reference |
|---|---|---|---|
| A. salmiana | Fiber | 50.07 | [46] |
| A. tequilana | Bagasse | 63–68 | [54] |
| A. salmiana A. americana A. tequilana | Leaf and stem | 45–55 | [48] |
| A. tequilana | Bagasse | 71 | [57] |
| A. tequilana | Bagasse | 60.5 | [58] |
| A. americana | Stem | 50.1–64.1 | [40] |
| Yucca spp. | Leaf | 76 | [77] |
| Yucca aloifolia | Leaf | 69.43 | [63] |
| Yucca spp. | Fiber | 55–56 | [79] |
| Furcraea foetida | Fiber | 52.6 | [62] |
Publisher’s Note: MDPI stays neutral with regard to jurisdictional claims in published maps and institutional affiliations. |
© 2022 by the authors. Licensee MDPI, Basel, Switzerland. This article is an open access article distributed under the terms and conditions of the Creative Commons Attribution (CC BY) license (https://creativecommons.org/licenses/by/4.0/).
Share and Cite
MDPI and ACS Style
Maceda, A.; Soto-Hernández, M.; Terrazas, T. Chemical-Anatomical Characterization of Stems of Asparagaceae Species with Potential Use for Lignocellulosic Fibers and Biofuels. Forests 2022, 13, 1853. https://doi.org/10.3390/f13111853
AMA Style
Maceda A, Soto-Hernández M, Terrazas T. Chemical-Anatomical Characterization of Stems of Asparagaceae Species with Potential Use for Lignocellulosic Fibers and Biofuels. Forests. 2022; 13(11):1853. https://doi.org/10.3390/f13111853
Chicago/Turabian StyleMaceda, Agustín, Marcos Soto-Hernández, and Teresa Terrazas. 2022. "Chemical-Anatomical Characterization of Stems of Asparagaceae Species with Potential Use for Lignocellulosic Fibers and Biofuels" Forests 13, no. 11: 1853. https://doi.org/10.3390/f13111853
Note that from the first issue of 2016, this journal uses article numbers instead of page numbers. See further details here.