
Structural Characterization of Trivalvaria costata Chloroplast Genome and Molecular Evolution of rps12 Gene in Magnoliids
1
School of Life Sciences, Sun Yat-Sen University, Guangzhou 510275, China
2
College of Life Sciences, South China Agricultural University, Guangzhou 510642, China
3
Research Institute of Sun Yat-Sen University in Shenzhen, Shenzhen 518057, China
*
Authors to whom correspondence should be addressed.
Forests 2023, 14(6), 1101; https://doi.org/10.3390/f14061101
Submission received: 25 April 2023
/
Revised: 22 May 2023
/
Accepted: 25 May 2023
/
Published: 26 May 2023
(This article belongs to the Section Genetics and Molecular Biology)
Abstract
:Chloroplasts (cp) are important organelles in plant cells that have been widely used in phylogenetic, molecular evolution, and gene expression studies due to their conserved molecular structure. In this study, we obtained the complete cp genome of Trivalvaria costata (Annonaceae) and analyzed its structural characteristics. Additionally, we analyzed the rps12 gene in the phylogenetic framework of magnoliids. The T. costata cp genome comprises 162,002 bp and contains 132 genes. We detected 48 simple sequence repeats (SSRs) and identified 29 high-frequency codons as well as 8 optimal codons. Our multiple analyses show that codon usage bias is mainly influenced by natural selection. For the first time, we found the rps12 gene to be entirely located in the IR region (in Annona). In groups with exon 1 located in the single-copy (SC) region and exons 2–3 located in the inverted repeat (IR) region, the transition rate and synonymous substitution rate of exon 1 were higher than those of exons 2–3. Adaptive evolution identified a positive selection site (116) located in the 310-helix region, suggesting that the rps12 gene may undergo adaptive changes during the evolutionary history of magnoliids. This study enhances our knowledge regarding genetic information on T. costata and provides support for reduced substitution rates in the IR region.
1. Introduction
Chloroplast (cp) genomes in land plants range in size from 120 kb to 160 kb and usually contain about 80 protein-coding genes, with 30 tRNA genes and 4 rRNA genes having a conserved tetrad structure: a pair of inverted repeat (IRs) regions separates a large single-copy (LSC) region from a small single-copy (SSC) division [1,2,3]. Due to their small genome size, high copy number, evolutionary conservation, and relative ease to obtain, cp genomes are often used for structural comparison, phylogenetic, and molecular evolution studies [4,5,6,7]. Simple sequence repeats (SSRs), as a characteristic of the cp genome, contain abundant genetic information and are widely used for species identification and phylogenetic studies [8,9]. Codons play an essential role in genetic information transmission. After long-term development and evolution, organisms develop a certain preference for codons. The primary goals of codon usage preferences are to optimize translation yield and accuracy, protect protein structure and function, and manage resources to optimize cellular adaptation [10]. Studying codon usage patterns is an excellent way to understand biological evolution and phylogeny, as well as predict the expression and functional dynamics of unknown genes more accurately [11].
On the cp genome, the presence of the IR region plays a crucial role in maintaining its stability, particularly by reducing the evolutionary rates of sequence when compared with the SC region. Several studies have reported a significant reduction in substitution rates within the IR region [12,13,14]. However, the rate of evolution may be influenced by gene function, and hence, to study the characteristics of the IR region, we identified a more suitable gene (rps12). The rps12 gene encodes the S12 protein in the 30S small subunit of the ribosome and is composed of two parts: the 5′ end of rps12 contains only exon 1, while the 3′ end usually contains exon 2, an intron, and exon 3 [15]. In ferns and gymnosperms [16,17], the 5′-rps12 is situated within the LSC region, while the 3′-rps12 partially or completely enters or leaves the IR region during IR expansion, contraction, or even loss. Additionally, the evolutionary rates of the rps12 gene sequences are different in different locations. Moreover, Liu et al. found variations in the substitution rates of rps12 coding sequences after the loss of introns in some ferns [18].
Angiosperms, commonly known as flowering plants, consist of five major clades: eudicots, monocots, magnoliids, Chloranthales, and Ceratophyllales. Among these, magnoliids are considered a core branch of angiosperms and include approximately 9000 species belonging to four orders: Canellales, Laurales, Magnoliales, and Piperales [19,20]. Annonaceae is a relatively advanced family in Magnoliales and has the largest number of species (around 2000 species and over 110 genera). Widely distributed in tropical and subtropical regions worldwide, it plays a vital role in lowland tropical rainforest ecosystems [21] and has considerable economic significance owing to its production of high-quality fruit, wood, aromatic essential oils, and precious Chinese medicinal materials. At present, studies on the Annonaceae cp genome are relatively scarce. As of December 2022, only 20 sequences have been published in the NCBI database.
The expansion of the IR region in Annona has been noted [22], but is unknown for other genera. Trivalvaria costata (Annonaceae) is a shrub or small tree mainly distributed in Hainan, China, and Southeast Asia [23]. In order to complement the genetic information in the cp genome database of Annonaceae, we obtained the cp genome of Trivalvaria (T. costata) for the first time and analyzed its SSR characteristics and codon usage bias. In addition, the unique structure of the rps12 gene and its distribution on the genome provide a natural opportunity to study the evolutionary rate changes in the IR region. Therefore, we selected 65 magnoliid species for molecular evolutionary analysis of the rps12 based on a phylogenetic framework constructed from shared gene datasets.
2. Materials and Methods
2.1. Sequencing and Sequence Preparation
Fresh leaves of T. costata were collected from the South China Botanical Garden, Chinese Academy of Sciences (E 113°36′, N 23°18′). The E.Z.N.A.® Plant DNA Kit (OMEGA, Shanghai) was used to extract total DNA, and the Illumina NovaSeq6000 platform was utilized for carrying out pair-end sequencing with a 150 bp reading length. For raw data, quality control and evaluation were conducted using Cutadapt v1.16 [24] and FastQC v0.11.4 [25] software, respectively. The sequences were spliced using NOVOPlasty V4.2 software [26] followed by GetOrganelle V1.7.0 + [27] for optimal assembly results. The assembled cp genome was annotated using PGA [28] and Geseq (https://chlorobox.mpimp-golm.mpg.de/geseq.html, (accessed on 5 December 2022)) [29] software. The complete cp genomes were deposited in the NCBI GenBank under the accession number OM914484.
The complete cp genome sequences of 67 other species were downloaded from the NCBI database (https://www.ncbi.nlm.nih.gov/nuccore/?term=, (accessed on 20 December 2022)), including 66 magnoliidae species covering 4 orders, 9 families, and 62 genera, while the remaining 2 belonged to the Chloranthales species and served as the outgroup (Table 1).
2.2. SSR Analysis
The prediction of SSRs was carried out using the Microsatellite Identification Tool v2.1 (MISA) website (https://webblast.ipk-gatersleben.de/misa/index.php?action=1, (accessed on 15 January 2023)), and the minimum repeats corresponding to the motif length were 1–10, 2–6, 3–5, 4–5, 5–5, and 6–5, respectively. Additionally, the composite microsatellite consisted of two microsatellites with distances less than 100 bp [30].
2.3. Codon Usage Analysis
The protein-coding genes (PCGs) of T. costata were extracted using Geneious prime 2020.0.1 software [31]. After filtering sequences with a length less than 300 bp, 53 PCGs were selected. We used CodonW 1.4.2 software (http://codonw.sourceforge.net/, (accessed on 25 January 2023)) to compute the number of codons (N), effective number of codons (ENC), and relative synonymous codon usage (RSCU) for the 53 genes. Additionally, MEGA X software [32] was employed to calculate the GC content of every sequence (GCall) and each codon position (GC1, GC2, and GC3).
To establish high- and low-expression gene banks, we selected codons with RSCU values greater than 1 and arranged the ENC values of 53 PCGs in descending order. We then chose 10% of the total genes on each end and computed their respective RSCU values (RSCUhigh-expression and RSCUlow-expression). The optimal codon was determined based on RSCU values greater than 1 and ΔRSCU (RSCUhigh-expression − RSCUlow-expression) ≥ 0.08. We drew a neutral diagram with GC3 as the x-axis and GC12 (the average of GC1 and GC2) as the y-axis, and an ENC plot with GC3 as the x-axis and ENC as the y-axis to evaluate the impact of base composition on codon usage bias.
To measure the variance between ENCactual and ENCexpectation, we calculated the ENC ratio [(ENCexpectation − ENCactual)/ENCexpectation], where ENCexpectation = 2 + GC3 + 29/[GC32 + (1 − GC3)2]. Additionally, we drew a PR2 plot with the horizontal coordinate representing the ratio of G content at the third codon base (G3) to the sum of G and C contents at the third codon base (G3 + C3), and the vertical coordinate representing the ratio of A content at the third codon base (A3) to the sum of A and T contents at the third codon base (A3 + T3).
2.4. Phylogenetic Analysis of Magnoliids
The 60 common PCGs (listed in Table S1) were extracted from the sampled species using Geneious Prime 2020.0.1 software to construct the dataset. Neighbor joining (NJ) and maximum parsimony (MP) trees were built using MEGAX and PAUP 4.0 software [33], respectively. The maximum likelihood (ML) tree was constructed using RaxML 8.0.20 software with a GTRGAMMAI nucleotide substitution model and performed 1000 bootstraps [34]. A Bayesian inference (BI) tree was constructed using Mrbayes v3.2.0 [35] software with invgamma rates and 1,000,000 mcmc ngen.
2.5. Molecule Evolution Analysis of rps12
Based on the maximum likelihood method and within the framework of phylogeny, we used HyPhy 2.2.4 software [36] to calculate the evolutionary rates of rps12. We computed the transition rate (trst) and the transversion rate (trsv), as well as the ratio of transversion rate to transition rate (ratio) in both nucleotide and HKY85 substitution models. Furthermore, we selected codon and MG94 × HKY85 × 3_4 substitution models to estimate the synonymous substitution rate (dS) and the non-synonymous substitution rate (dN), along with the ratio of non-synonymous substitution rate to synonymous substitution rate (dN/dS, ω). Rank sum test analyses were conducted using IBM SPSS v22.0 [37] software. Moreover, we predicted the rps12 protein using the online site (https://www.swissmodel.expasy.org/, (accessed on 25 January 2023)).
We carried out selection pressure and adaptive evolution analyses using the codeml program within PAML 4.9 [38]. In the branch model, M0 (one ratio) and F (free ratio) were utilized to detect whether the branches experienced positive selection. Additionally, M0 and model2 (two ratio) were employed to determine whether there is a difference in the selection pressure between the foreground branch and the background branch. The site model uses mainly the M1a (near neutral) and M2a (positive selection) models to identify sites with positive selection [39].
3. Results
3.1. Structure Characteristics of T. costata cp Genome
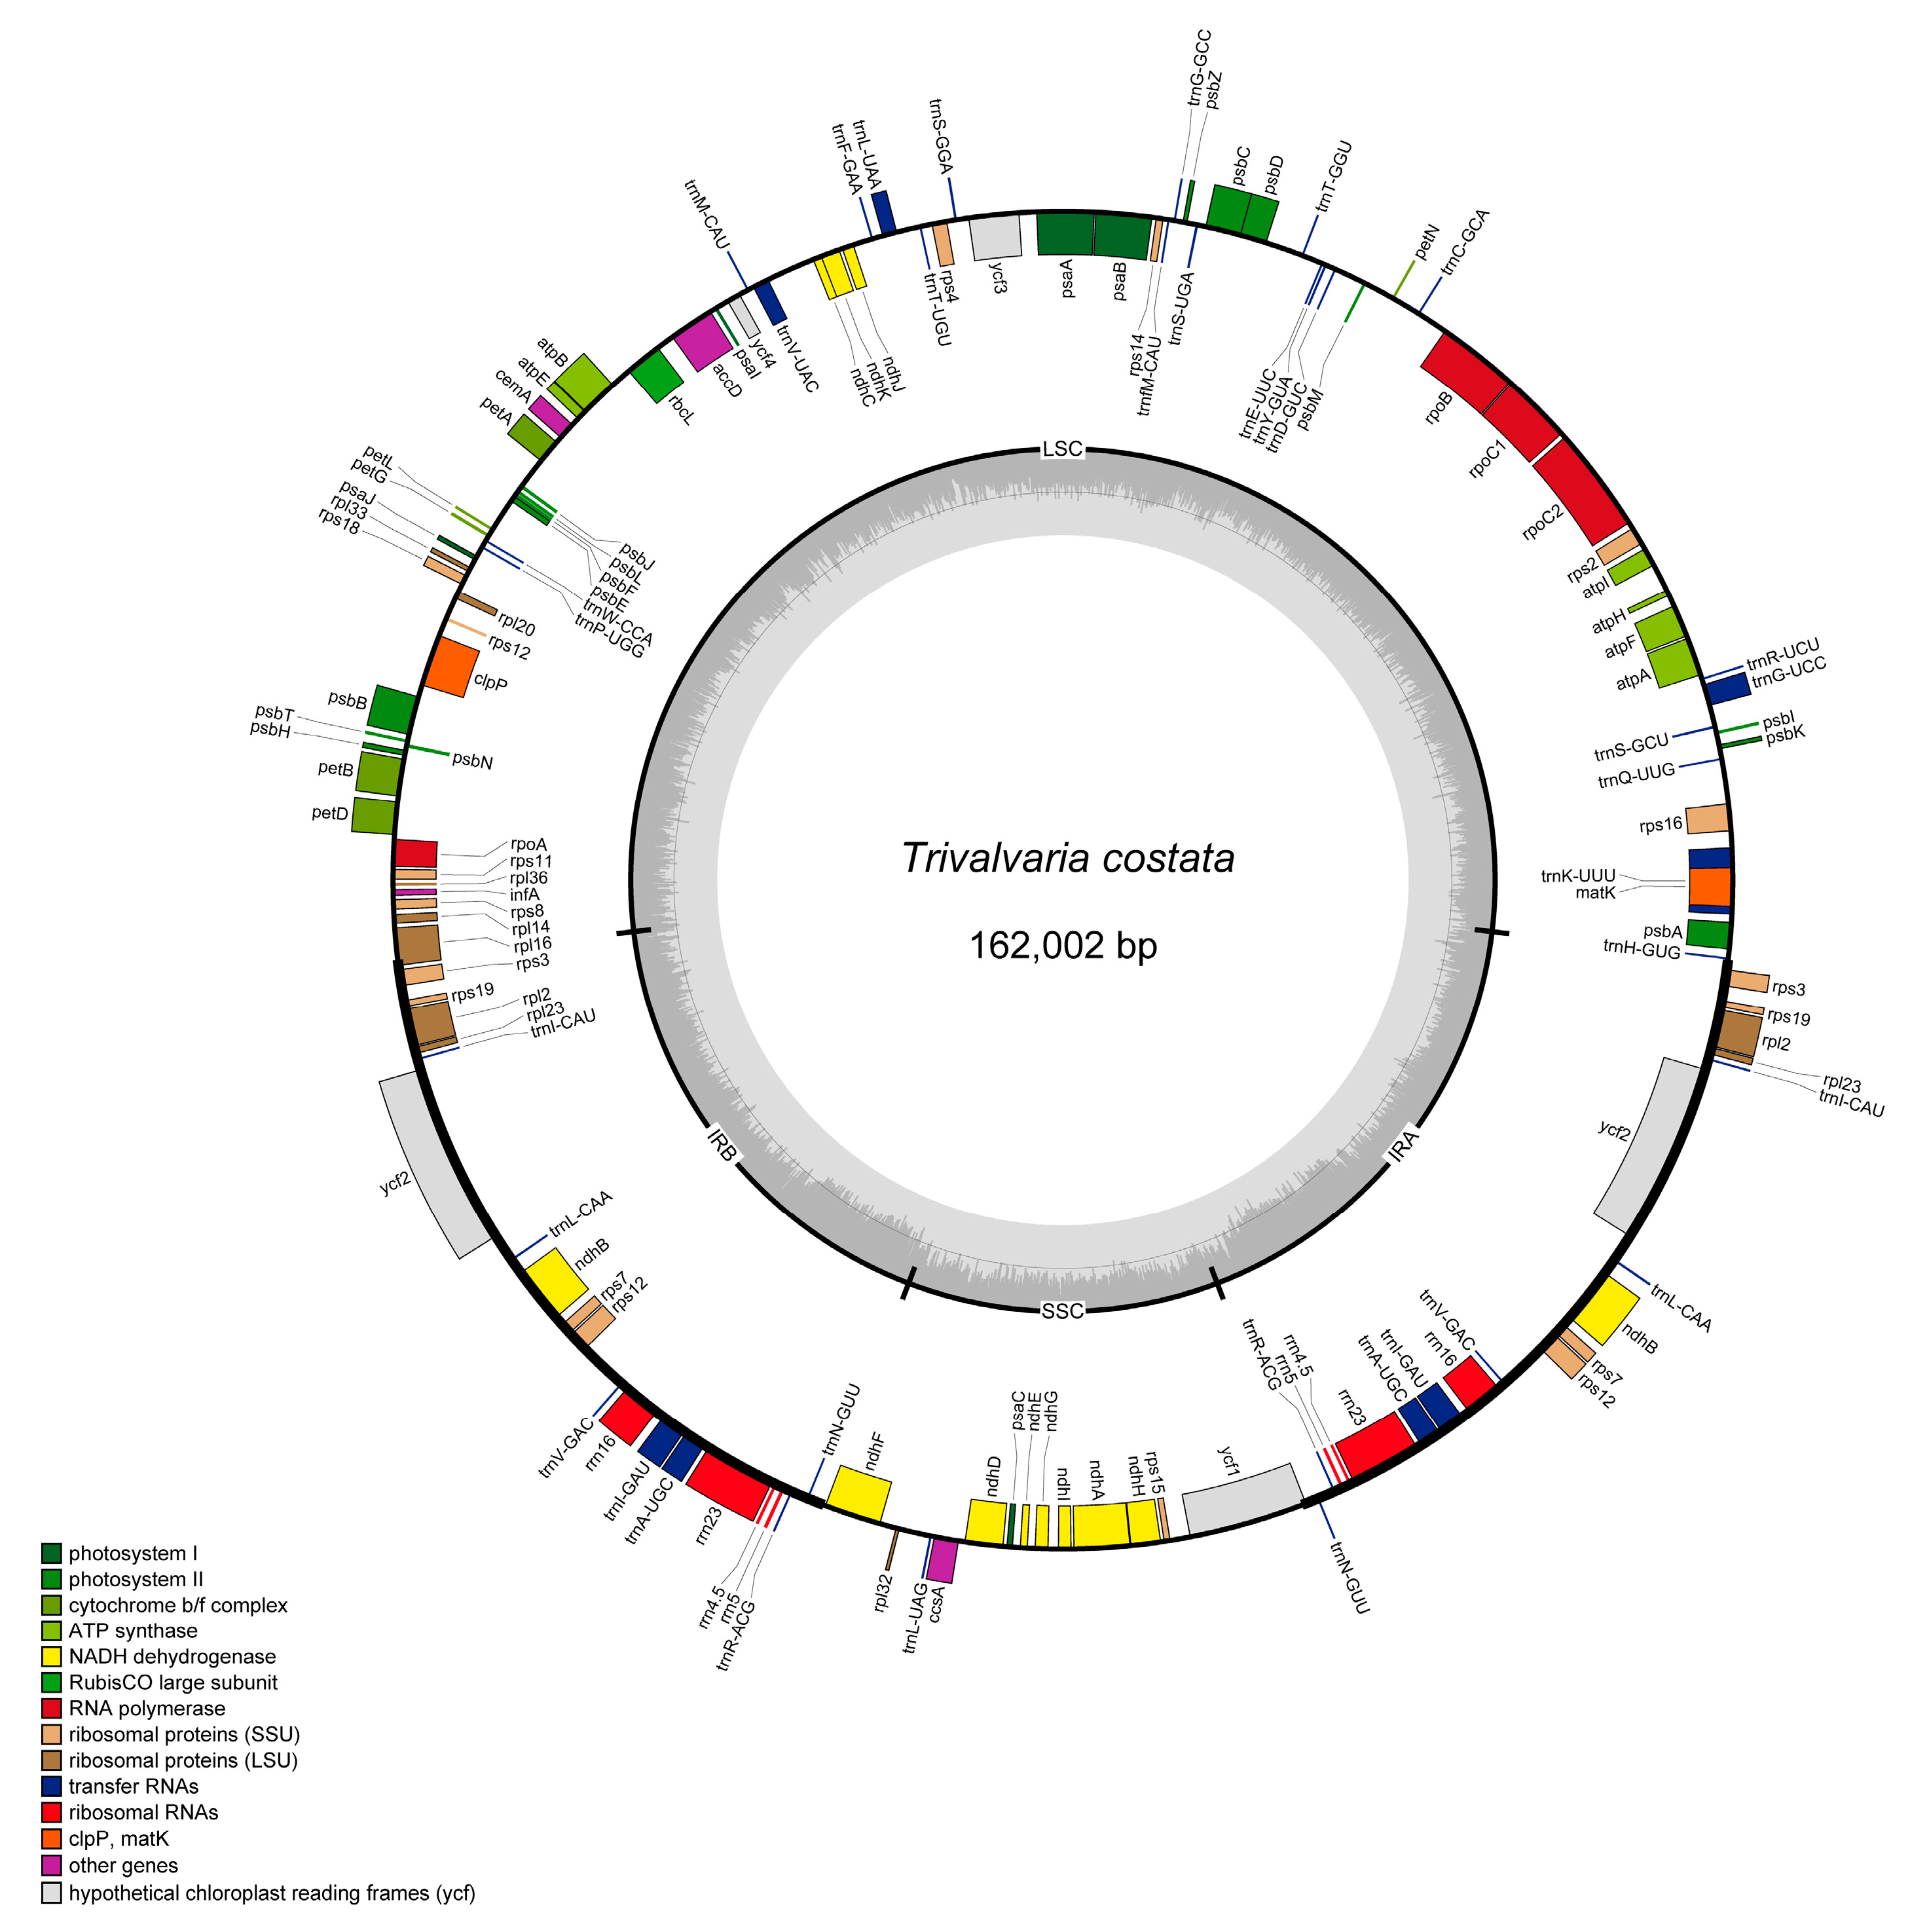
The complete cp genome of T. costata is 162,002 bp in size with a GC content of 39%. It has a typical quadripartite structure, with the large single-copy region, small single-copy region, and reverse repeat region measuring 87,143 bp, 18,817 bp, and 28,021 bp, respectively. Additionally, the GC content in these regions is 37.7%, 34.3%, and 42.8%, respectively. A total of 132 genes were encoded, consisting of 87 protein-coding genes, 37 trna genes, and 8 rrna genes (Figure 1).
A total of 48 SSRs, including two types (mononucleotide repeats and dinucleotide repeats), were detected in the cp genome of T. costata (Table S2). These repeats are composed of a/t bases (A/T and AT/AT, as shown in Figure 2a). The majority of SSRs consisted of 10–14 repetitions (39, 81.3%, as shown in Figure 2b). Most SSRs are located in the intergenic spacer (IGS) region (33, 68.8%), followed by the introns of PCGs (rpl16, atpF, and ndhA; see Table S2 and Figure 2c) in the cp genome.
3.2. Codon Usage Bias Analysis of T. costata
The 53 PCGs contain 2128 codons, with an average GC content of 39.35%. The first, second, and third positions of the codon have average GC contents of 46.95%, 39.14%, and 31.98%, respectively. ENC values ranged from 36.12 (rps14) to 58.08 (rps8), with a mean of 49.12 (Table S3). Using an ENC value of 45 as the criterion for evaluating codon usage bias, 44 genes (83.02%) had ENC values that were greater than 45, while only 9 genes had ENC values less than 45 (16.98%). The Pearson correlation test analysis results indicate that the correlation coefficients between GCall and GC1, GC2, and GC3 were 0.775, 0.698, and 0.42, respectively, which demonstrates extremely significant correlations (p < 0.01). The correlation coefficients between GC1 and GC2 and GC3 and ENC were 0.282 (p < 0.05) and 0.421 (p < 0.01), respectively (Table S4).
Furthermore, in the RSCU calculation results of the 53 PCGs, 30 codons had RSCU values greater than 1, of which 16 ended in U and 13 ended in A (Figure 3, Table S5). We also established high-expression gene banks (clpP, ccsA, rpl2, rpl22, and rps8) and low-expression gene banks (rps14, rpl16, petD, psbA, and ndhE) according to their ENC values. Using RSCU > 1 and ΔRSCU ≥ 0.08 as the criteria, we identified a total of 11 optimal codons: UUU(F), UUA(L), CAA(Q), AAU(N), GAU(D), UCA(S), CCA(P), CGA(R), AGU(S), AGA(R), and GGA(G) (Table S3).
The analysis results of the neutral plot showed (Figure 4a, Table S3) that the majority of genes were distributed far away from the diagonal, with GC12 ranging from 0.359 to 0.536 and GC3 ranging from 0.224 to 0.413. The Pearson correlation test results showed that the correlation coefficient between GC12 and GC3 was 0.033 and this was not a statistically significant correlation (p = 0.812).
The results of the ENC plot analysis showed that most genes deviated from the standard curve (Figure 4b). The statistical results of ENC ratios showed that 25 genes (47.2%) had ENC ratios ranging from 0.05 to −0.05, while the remaining 28 genes (52.8%) had enc ratios ranging from −0.15 to −0.05 and 0.05 to 0.35 (Table S6).
As shown in the PR2 plot results (Figure 4c, Table S3), the central point was represented as A = T and C = G, and the vector sent from the central point to the remaining points indicated the degree and direction of the bias of each gene. The analysis showed that A3/(A3 + T3) ranged from 0.30 to 0.59, with 40 (75.47%) genes having a value less than 0.5, and G3/(G3 + C3) ranged from 0.37 to 0.71, with 39 genes (73.58%) having a value greater than 0.5.
3.3. Information on cp Genome and rps12 in Sample Species
There were differences in the size of the magnolia cp genome among different groups, as shown in Table 1. In contrast to the outgroup, several species in Annonaceae (Annona, Fissistigma, Uvaria, Artabotrys, Trivalvaria, and Cananga) experienced a large expansion in their IR region. The IR region of three Annona species was dramatically expanded, leading to the entry of rps12 into the IR region and, thus, these three species had the largest genome size among those sampled. Asarum sieboldii, which had the largest genome of all other species (193,356 bp), also enlarged its IR region and “annexed” the SSC region, but the 5′-rps12 did not enter the IR region. Therefore, only three species had rps12 fully enter the IR region, which divided the 66 magnolia species into two groups: IR-3 and SC-63 (Figure 5).
The size of rps12 ranges from 900 bp to 914 bp, and the coding sequences are all 372 bp in length, consisting of exon 1 (114 bp), exon 2 (232 bp), and exon 3 (26 bp). The lengths of introns range from 528 bp to 542 bp (as shown in Table S7). rps12 encodes 123 amino acids, with 122 (99.2%) and 113 (91.9%) consistent sites in IR-3 and SC-63, respectively. Exon 1 encodes 38 amino acids, with 38 (100%) and 33 (86.8%) consistent sites in IR-3 and SC-63, respectively. Exon 2 and exon 3 (exons 2–3) encode a total of 85 amino acids, and there are 84 (98.8%) and 80 (94.1%) consistent sites in IR-3 and SC-63, respectively (shown in Figure 6). The consistent sites across the 66 magnolia species were the same as SC-63, with the variation sites being 5 (K/R), 11 (T/I), 16 (R/I), 18 (V/I), 21 (S/A/T), 74 (S/L), 98 (V/I), 105 (A/V), 109 (D/N), and 116 (K/Q).
3.4. Evolutionary Rates and Selection Pressure of rps12
Chloranthus spicatus and Sarcandra glabra were taken as outgroups. Four phylogenetic trees based on shared genes showed that the cladistic relationships of both ML and BI trees are essentially the same. All groups can form monophyletic groups at the family and order level, and most branches of both trees are highly supported. The only difference is that Lindera glauca, Laurus nobilis, and Parasassafras confertiflorum are parallel cladistic in BI trees. In the NJ and MP trees, two species of Aristolochiaceae are nested in turn outside of the clade consisting of Piperaceae and Saururaceae, meaning they do not form monophyletic groups. Additionally, the phylogenetic position of Cassytha filiformis is different from that of ML and BI trees. In addition, the phylogenetic positions of Alcimandra cathcartii, Laurus nobilis, and Neolitsea palens in NJ trees are different from those of other trees (Figure S1). Overall, the four trees show that Magnoliales + Laurales and Piperales + Canellale are sister groups, and the phylogenetic relationship of ML tree construction is the most clear. Therefore, ML trees are used as a phylogenetic framework for molecular evolutionary analysis (Figure 7).
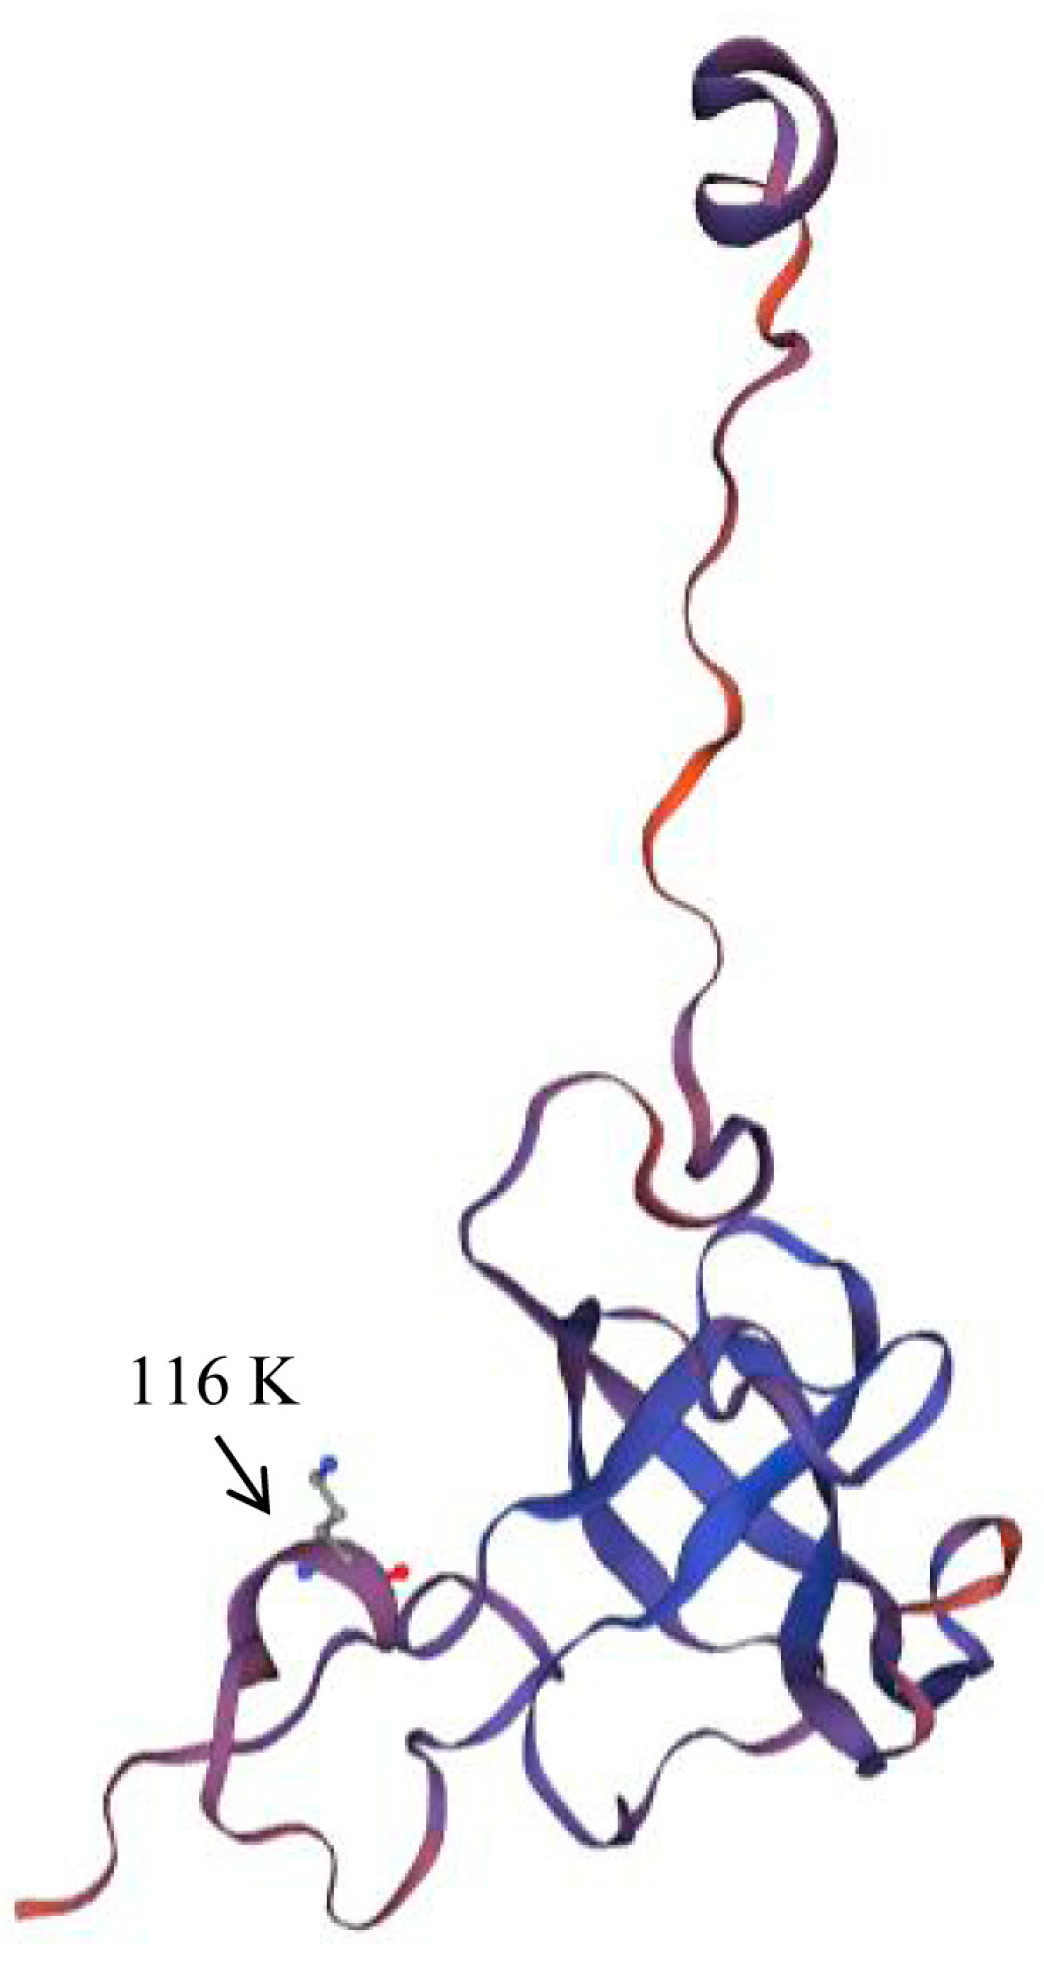
In the branch model, the likelihood ratio test results of the M0 and F models showed that all branches have the same ω value (0.2). To detect the difference in selection pressure between the IR-3 group and other species clades, we used IR-3 as the foreground clade and other clades as the background clade in the M2 model. The likelihood ratio test results of M0 and M2 showed that the coding sequence of rps12 (rps12-CDS) and exon 1 had no significant difference between the foreground and background branches (p > 0.05), while exons 2–3 showed a significant difference between them (p = 0); ωforeground branch = 999, ωbackground branch = 0.413. The site model was based on the likelihood ratio test results of M1a and M2a, and we detected one positive selection site (116 K) (Table 2 and Table 3). The rps12 protein model shows that site 116 (k) is located in a 310-helix secondary structure (Figure 8).
For the evolutionary rates of the exon 1, exons 2–3, and rps12 sequences, the rank sum test results of the SC-63 and IR-3 groups were both greater than 0.05. For the SC-63 group, trst, dS, and ω of exon 1 were 4.9, 6.6, and 0.17 times that of exons 2–3, respectively (Ptrst = 0.03, PdS = 0.06, Pω = 0.21). For the IR-3 group, the rank sum test results between exon 1 and exon 2 were both greater than 0.05 (Table 4 and Table S8).
4. Discussion
4.1. Distribution Pattern of SSRs in T. costata
SSRs have been widely used in species identification, genetic diversity, and phylogenetic studies due to their rich genetic variation information [9,40,41]. Consistent with most studies [7,42,43], the SSRs of T. costata are mainly composed of A/T bases and are located in gene spacer regions. However, with some exceptions, the SSRs in Polypodiaceae are mainly comprised of GC bases, which may be related to adaptive evolution in different environments [41,44,45]. Recent studies have shown that the distribution pattern of SSRs is lineage-specific in different taxa [46,47]. Moreover, the size of the IR region may affect the number and distribution of SSRs. In our study, we observed that the extent of IR region expansion varied among different groups in Annonaceae. This variation may influence the lineage-specific distribution pattern of SSRs among different groups and requires further investigation.
4.2. Codon Usage Bias in T. costata cp Genome
Codon usage bias in angiosperms is relatively weak, as indicated by Nair et al. [48], Zeng et al. [49], and Zhang et al. [50]. Of the genes in the T. costata cp genome, 83.02% had values greater than 45, suggesting a weak bias. In total, 28 out of the 29 high-frequency codons and 8 of the optimal codons end in A/T, indicating that codons prefer to use those ending in A/U. This result is consistent with studies on Gynogyra [50], Hemiptelea davidii [51], and Porphyra umbilicalis [52]. A significant correlation was found between GC1 and GC2, but no significant correlation was found between GC3 and GC1, suggesting that the composition of the first and second codon bases is different from that of the third codon. There was an extremely significant correlation between ENC and GC3, suggesting that the composition of the third codon base has the greatest influence on codon usage bias [53,54].
In the neutral map, most genes are distant from the diagonal line, indicating that GC12 and GC3 significantly differ, and the base composition at different positions is significantly varied. No significant correlation was observed between GC12 and GC3, indicating that the codon is mainly affected by selection pressure. The results of the ENC plot showed that most genes deviated from the standard curve, meaning codon usage bias was significantly influenced by natural selection pressure compared to mutation pressure [49]. ENC values for 25 genes were close to the expected value, indicating that the codons of these genes were mainly affected by mutations. The other genes showed significant differences between the two values, suggesting that natural selection was the main factor influencing codon usage bias. In the PR2 plot analysis, most of the genetic codons are located on the right and side of the midline, indicating a bias in the use of the third base of the codon, which is primarily T and G.
In general, natural selection is the main factor affecting codon usage bias in the cp genes of T. costata. It has been detected as a major factor influencing the codon usage bias in the cp genomes of several groups and species, for instance, in Mesona chinensis [55], Elaeagnus [56], Gynostemma [50], Juglandaceae [49], and Euphorbiaceae [53]. It has been reported that codon preference affects gene expression by regulating the accuracy and efficiency of gene translation [57]. Moreover, the higher the gene expression level, the stronger the codon preference [58,59,60]. The study of codon usage patterns can determine the best codon to design gene expression vectors for increasing the expression of target genes [61]. Furthermore, in Gynostemma, it was found that the phylogenetic tree constructed using the RSCU clustering method was more suitable for analyzing evolutionary relationships than sequence data [56]. Detecting the codon usage pattern and optimal codon in the T. costata cp genome may be crucial in exploring species evolution and enhancing exogenous gene expression.
4.3. Expansion and Reduced Substitution Rates of IR Region
Based on a tandem dataset of common protein-coding genes and four methods, the phylogenetic relationships among Magnoliales, Laurales, Piperales, and Canellales reveal that Magnoliales is sister to Laurales, while Piperales is sister to Canellales. These findings are consistent with previous research by Cai et al. [62]. The accuracy of constructing phylogenetic trees using Bayesian methods was shown to be higher than that of maximum likelihood methods in previous studies [63]. In the BI tree of this study, only nine branches had posterior probabilities ranging from 0.63 to 0.98, while the remaining branches all had a probability of 1, indicating that the BI method is more reliable for constructing phylogenetic relationships. However, there was a parallel branching pattern observed in the BI tree among P. conferiflorum, L. pungens, and L. glauca, which was not strongly supported by other trees. The high sequence similarity of the protein-coding genes among these three species may be the main reason for this lack of support in the trees. Additionally, research based on the complete cp genome sequence showed that P. conferiflorum and L. glauca are located within Lindera [64], which is not monophyletic, indicating the complex classification of these three genera.
This study is the first to observe the entire rps12 gene (exon 1 and exons 2–3) entering the IR region in Annona, which is remarkable. The shortest genomic distance between the two was 30 kb, apparently due to the rapid expansion of the IR region of Annona. At the same time, IR region expansion was observed in several species of Annonaceae. The extent of IR region expansion varied among different genera, which is very interesting and seems to be a tool for phylogenetic studies. Additionally, the rps12 gene provides another natural condition for studying the difference in evolutionary rate between the IR and SC regions [16,17]. However, no significant difference in substitution rates was found between sequences (exon 1, exon 2–3, and rps12-CDS) in the IR region and those in the SC region, mainly due to the quantitative difference between the two groups. Nonetheless, in taxa where exon 1 is located in the SC region, the transition rate of exon 1 is higher than that of exons 2–3 in the IR region. To some extent, this indicates that sequences in the IR region have reduced substitution rates.
The current database of Annonaceae sequences is very limited, and more species of Annonaceae (especially Annona) need to be sequenced to obtain more effective information. Ping et al. found that rps12 in ferns showed reduced substitution rates as it left the IR region [16]. Specifically, within the same group, the substitution rates of exon 1 in the SC region were higher than those of exons 2–3 in the IR region. In different groups, the substitution rates of exons 2–3 in the SC region were higher than those in the IR region. In gymnosperms, due to the loss of the IR region in conifer species, exons 2–3 enter the SC region, and the substitution rates of exons 2–3 are significantly increased compared to those in the IR region [17].
4.4. rps12 May Be Undergoing Adaptive Changes in Magnoliids
For the adaptive evolution of rps12, three positive selection sites (14, 16, and 74) have been detected in the evolution of ferns, which are located in the loop or irregular region, and most sites were shown to experience strong negative selection [16]. However, no positive selection sites were detected in gymnosperms [17]. In this study, one positive selection site was detected during the evolution of magnoliids, which formed the 310-helix region with sites 114 and 115. The 310-helix plays a crucial role in protein secondary structure. It can serve as a cap for one end of an α-helix and introduce bending into composite helices. Despite being a minor secondary structural element, its complex structure with α-helices and β-chains may play an essential role in different protein folding, based on the conserved nature of homologous proteins [65]. When a site experiences positive selection, this implies that it may have undergone adaptive changes during evolution.
5. Conclusions
Overall, this study provides valuable insights into the genetic features and evolutionary history of T. costata and Annonaceae. The identification of unique SSRs and codon usage bias in the cp genome can serve as molecular markers for future phylogenetic and population genetic studies. The discovery of the rps12 gene entirely located in the IR region in Annona represents a noteworthy evolutionary event, highlighting the potential importance of IR expansion in plant evolutionary history. The findings of higher substitution rates in the SC region compared to the IR region and positive selection in the rps12 gene emphasize the importance of adaptive evolution in plant evolution. Moreover, this structural change in the IR region may have phylogenetic significance, which necessitates further research. Overall, this study enhances our understanding of the genetic diversity and evolution of plant cp genomes, contributing to the broader field of plant biology and evolution.
Supplementary Materials
The following are available online at https://www.mdpi.com/article/10.3390/f14061101/s1, Figure S1: Phylogenetic relationship of sampled species. a. NJ tree, b. MP tree, c. ML tree, d. BI tree, Table S1: Common genes of sample species, Table S2: SSRs characteristics the Trivalvaria costata chloroplast genome, Table S3: GC content and ENC values of 53 protein-coding sequences, Table S4: Correlation analysis in codon usage bias, Table S5: Analysis of the optimal codon in Trivalvaria costata chloroplast genome, Table S6: Frequency distribution of ENC ratio, Table S7: GC content and size of rps12, Table S8: Evolutionary rates of rps12 in 66 magnolias.
Author Contributions
Writing—Original Draft Preparation, J.P.; Software, X.Z.; Writing—Review and Editing and Funding Acquisition, T.W. and Y.S. All authors have read and agreed to the published version of the manuscript.
Funding
This research was funded by the Natural Science Foundation of China [31670200, 31770587, 31872670, and 32071781], Guangdong Basic and Applied Basic Research Foundation [2021A1515010911], Science and Technology Projects in Guangzhou [202206010107], and Project of Department of Science and Technology of Shenzhen City, Guangdong, China [JCYJ20190813172001780 and JCYJ20210324141000001].
Data Availability Statement
Acknowledgments
We thank Yangying Gan of the Guangdong Academy of Agricultural Sciences for the material.
Conflicts of Interest
The authors declare no conflict of interest.
References
- Wicke, S.; Schneeweiss, G.M.; Depamphilis, C.W.; Müller, K.F.; Quandt, D. The evolution of the plastid chromosome in land plants: Gene content, gene order, gene function. Plant Mol. Biol. 2011, 76, 273–297. [Google Scholar] [CrossRef] [Green Version]
- Jansen, R.K.; Ruhlman, T.A. Plastid genomes of seed plants. In Genomics of Chloroplasts and Mitochondria; Bock, R., Knoop, V., Eds.; Springer: Dordrecht, Switzerland, 2012; Volume 35, pp. 103–126. [Google Scholar]
- Mower, J.P.; Vickrey, T.L. Structural diversity among plastid genomes of land plants. Adv. Bot. Res. 2018, 85, 263–292. [Google Scholar]
- Nguyen, H.Q.; Nguyen, T.N.L.; Doan, T.N.; Nguyen, T.T.N.; Phạm, M.H.; Le, T.L.; Sy, T.D.; Chu, H.H.; Chu, H.M. Complete chloroplast genome of novel Adrinandra megaphylla Hu species: Molecular structure, comparative and phylogenetic analysis. Sci. Rep. 2021, 11, 11731. [Google Scholar] [CrossRef] [PubMed]
- Jiang, Y.; Miao, Y.-J.; Qian, J.; Zheng, Y.; Xia, C.-L.; Yang, Q.-S.; Liu, C.; Huang, L.-F.; Duan, B.-Z. Comparative analysis of complete chloroplast genome sequences of five endangered species and new insights into phylogenetic relationships of Paris. Gene 2022, 833, 146572. [Google Scholar] [CrossRef] [PubMed]
- Song, Y.; Zhao, W.-J.; Xu, J.; Li, M.-F.; Zhang, Y.-J. Chloroplast genome evolution and species identification of Styrax (Styracaceae). BioMed Res. Int. 2022, 2022, 5364094. [Google Scholar] [CrossRef]
- Wu, L.-W.; Nie, L.-P.; Wang, Q.; Xu, Z.-C.; Wang, Y.; He, C.-N.; Song, J.-Y.; Yao, H. Comparative and phylogenetic analyses of the chloroplast genomes of species of Paeoniaceae. Sci. Rep. 2021, 11, 14643. [Google Scholar] [CrossRef]
- Xue, B.; Ding, H.-B.; Yao, G.; Shao, Y.-Y.; Fan, X.-J.; Tan, Y.-H. From Polyalthia to Polyalthiopsis (Annonaceae): Transfer of species enlarges a previously monotypic genus. PhytoKeys 2020, 148, 71. [Google Scholar] [CrossRef]
- Chmielewski, M.; Meyza, K.; Chybicki, I.J.; Dzialuk, A.; Litkowiec, M.; Burczyk, J. Chloroplast microsatellites as a tool for phylogeographic studies: The case of white oaks in Poland. iForest 2015, 8, 765. [Google Scholar] [CrossRef] [Green Version]
- Fages-Lartaud, M.; Hundvin, K.; Hohmann-Marriott, M.F. Mechanisms governing codon usage bias and the implications for protein expression in the chloroplast of Chlamydomonas reinhardtii. Plant J. 2022, 112, 919–945. [Google Scholar] [CrossRef]
- Rao, Y.-S.; Wu, G.-Z.; Wang, Z.-F.; Chai, X.W.; Nie, Q.H.; Zhang, X.-Q. Mutation bias is the driving force of codon usage in the Gallus gallus genome. DNA Res. 2011, 18, 499–512. [Google Scholar] [CrossRef] [Green Version]
- Wu, C.S.; Chaw, S.M. Evolutionary stasis in cycad plastomes and the first case of plastome GC-biased gene conversion. Genome Biol. Evol. 2015, 7, 2000–2009. [Google Scholar] [CrossRef] [PubMed] [Green Version]
- Li, F.W.; Kuo, L.Y.; Pryer, K.M.; Rothfels, C.J. Genes translocated into the plastid inverted repeat show decelerated substitution rates and elevated GC content. Genome Biol. Evol. 2016, 8, 2452–2458. [Google Scholar] [CrossRef] [PubMed] [Green Version]
- Zhu, A.-D.; Guo, W.-H.; Gupta, S.; Fan, W.S.; Mower, J.P. Evolutionary dynamics of the plastid inverted repeat: The effects of expansion, contraction, and loss on substitution rates. New Phytol. 2016, 209, 1747–1756. [Google Scholar] [CrossRef] [PubMed] [Green Version]
- Norihiro, Z.; Keita, T.; Kazuo, S.; Masahiro, S. Trans splicing in vivo: Joining of transcripts from the ‘divided’ gene for ribosomal protein S12 in the chloroplasts. FEBS Lett. 1987, 210, 153–156. [Google Scholar]
- Ping, J.-Y.; Li, A.-M.; Feng, P.-P.; Zhu, M.; Su, Y.-J.; Wang, T. The highly conserved rps12 gene in ferns provides strong evidence for decreased substitution rates in the inverted repeat region. Plant Syst. Evol. 2021, 307, 26. [Google Scholar] [CrossRef]
- Ping, J.-Y.; Feng, P.-P.; Hao, J.; Li, J.-Y.; Su, Y.-J.; Wang, T. The molecular evolution pattern of rps12 gene in gymnosperms. Chin. Sci. Bull. 2021, 66, 3182–3193. (In Chinese) [Google Scholar] [CrossRef]
- Liu, S.-S.; Wang, Z.; Su, Y.-J.; Wang, T. Patterns and rates of plastid rps12 gene evolution inferred in a phylogenetic context using plastomic data of ferns. Sci. Rep. 2020, 10, 9394. [Google Scholar] [CrossRef]
- Angiosperm Phylogeny Group. An update of the Angiosperm Phylogeny Group classification for the orders and families of flowering plants: APG II. Bot. J. Linn. Soc. 2003, 141, 399–436. [Google Scholar] [CrossRef] [Green Version]
- Angiosperm Phylogeny Group. An update of the Angiosperm Phylogeny Group classification for the orders and families of flowering plants: APG III. Bot. J. Linn. Soc. 2009, 161, 105–121. [Google Scholar] [CrossRef] [Green Version]
- Punyasena, S.W.; Eshel, G.; McElwain, J.C. The influence of climate on the spatial patterning of Neotropical plant families. J. Biogeogr. 2008, 35, 117–130. [Google Scholar] [CrossRef]
- Blazier, J.C.; Ruhlman, T.A.; Weng, M.L.; Rehman, S.K.; Sabir, J.S.; Jansen, R.K. Divergence of RNA polymerase α subunits in angiosperm plastid genomes is mediated by genomic rearrangement. Sci. Rep. 2016, 6, 24595. [Google Scholar] [CrossRef] [PubMed] [Green Version]
- Li, B.-T.; Gilbert, M.G. Annonaceae. In Flora of China; Wu, Z.-Y., Raven, P.H., Hong, D.-Y., Eds.; Science Press: Beijing, China; Missouri Botanical Garden Press: St. Louis, MO, USA, 2011; Volume 30, pp. 672–713. [Google Scholar]
- Martin, M. Cutadapt removes adapter sequences from high-throughput sequencing reads. EMBnet. J. 2011, 17, 10–12. [Google Scholar] [CrossRef]
- Andrews, S. FastQC: A Quality Control Tool for High Throughput Sequence Data. 2010. Available online: http://bioinformatics.babraham.ac.uk/projects/fastqc/ (accessed on 25 January 2023).
- Dierckxsens, N.; Mardulyn, P.; Smits, G. NOVOPlasty: De novo assembly of organelle genomes from whole genome data. Nucleic Acids Res. 2017, 45, e18. [Google Scholar] [PubMed] [Green Version]
- Jin, J.-J.; Yu, W.-B.; Yang, J.-B.; Song, Y.; DePamphilis, C.W.; Yi, T.-S.; Li, D.-Z. GetOrganelle: A fast and versatile toolkit for accurate de novo assembly of organelle genomes. Genome Biol. 2020, 21, 241. [Google Scholar] [CrossRef] [PubMed]
- Qu, X.-J.; Moore, M.J.; Li, D.-Z.; Yi, T.-S. PGA: A software package for rapid, accurate, and flexible batch annotation of plastomes. Plant Methods 2019, 15, 50. [Google Scholar] [CrossRef] [PubMed] [Green Version]
- Tillich, M.; Lehwark, P.; Pellizzer, T.; Ulbricht-Jones, E.S.; Fischer, A.; Bock, R.; Greiner, S. GeSeq–versatile and accurate annotation of organelle genomes. Nucleic Acids Res. 2017, 45, W6–W11. [Google Scholar] [CrossRef] [Green Version]
- Beier, S.; Thiel, T.; Münch, T.; Scholz, U.; Mascher, M. MISA-web: A web server for microsatellite prediction. Bioinformatics 2017, 33, 2583–2585. [Google Scholar] [CrossRef] [PubMed] [Green Version]
- Kearse, M.; Moir, R.; Wilson, A.; Stones-Havas, S.; Cheung, M.; Sturrock, S.; Buxton, S.; Cooper, A.; Markowitz, S.; Duran, C.; et al. Geneious basic: An integrated and extendable desktop software platform for the organization and analysis of sequence data. Bioinformatics 2012, 28, 1647–1649. [Google Scholar] [CrossRef] [Green Version]
- Kumar, S.; Stecher, G.; Li, M.; Knyaz, C.; Tamura, K. MEGA X: Molecular evolutionary genetics analysis across computing platforms. Mol. Biol. Evol. 2018, 35, 1547–1549. [Google Scholar] [CrossRef]
- Swofford, D.L. PAUP*: Phylogenetic Analysis Using Parsimony (and other Methods), Version 4.0b10; Sinauer Associates: Sun-derland, MA, USA, 2002. [Google Scholar]
- Stamatakis, A. RaxML version 8: A tool for phylogenetic analysis and post-analysis of large phylogeies. Bioinformatics 2014, 30, 1312–1313. [Google Scholar] [CrossRef] [Green Version]
- Huelsenbeck, J.P.; Ronquist, F. MRBAYES: Bayesian inference of phylogenetic trees. Bioinformatics 2001, 17, 754–755. [Google Scholar] [CrossRef] [PubMed] [Green Version]
- Pond, S.L.; Frost, S.D.; Muse, S.V. HyPhy: Hypothesis testing using phylogenies. Bioinformatics 2005, 21, 676–679. [Google Scholar] [CrossRef] [Green Version]
- IBM Corporation. SPSS Statistics (Version 22); IBM Corporation: New York, NY, USA, 2014. [Google Scholar]
- Yang, Z. PAML 4: Phylogenetic analysis by maximum likelihood. Mol. Biol. Evol. 2007, 24, 1586–1591. [Google Scholar] [CrossRef] [PubMed] [Green Version]
- Yang, Z.; Swanson, W.J.; Vacquier, V.D. Maximum-likelihood analysis of molecular adaptation in abalone sperm lysin reveals variable selective pressures among lineages and sites. Mol. Biol. Evol. 2000, 17, 1446–1455. [Google Scholar] [CrossRef] [PubMed] [Green Version]
- Xue, J.-H.; Wang, S.; Zhou, S.-L. Polymorphic chloroplast microsatellite loci in nelumbo (nelumbonaceae). Am J Bot. 2012, 99, 240–244. [Google Scholar] [CrossRef]
- Gao, R.; Wang, W.-Z.; Huang, Q.-Y.; Fan, R.-F.; Wang, X.; Feng, P.; Zhao, G.-M.; Bian, S.; Ren, H.-L.; Chang, Y. Complete chloroplast genome sequence of Dryopteris fragrans (L.) Schott and the repeat structures against the thermal environment. Sci. Rep. 2018, 8, 16635. [Google Scholar] [CrossRef] [Green Version]
- Gui, L.-J.; Jiang, S.-F.; Xie, D.-F.; Yu, L.-Y.; Huang, Y.; Zhang, Z.-J.; Liu, Y.-Y. Analysis of complete chloroplast genomes of Curcuma and the contribution to phylogeny and adaptive evolution. Gene 2020, 732, 144355. [Google Scholar] [CrossRef]
- Li, L.; Hu, Y.-F.; He, M.; Zhang, B.; Wu, W.; Cai, P.-M.; Huo, D.; Hong, Y.-C. Comparative chloroplast genomes: Insights into the evolution of the chloroplast genome of Camellia sinensis and the phylogeny of Camellia. BMC Genom. 2021, 22, 138. [Google Scholar] [CrossRef]
- Liu, S.-S.; Wang, Z.; Su, Y.-J.; Wang, T. Comparative genomic analysis of Polypodiaceae chloroplasts reveals fine structural features and dynamic insertion sequences. BMC Plant Biol. 2021, 21, 31. [Google Scholar] [CrossRef]
- Schneider, H.; Schuettpelz, E.; Pryer, K.M.; Cranfill, R.; Magallón, S.; Lupia, R. Ferns diversified in the shadow of angiosperms. Nature 2004, 428, 553–557. [Google Scholar] [CrossRef]
- Zhu, M.; Feng, P.-P.; Ping, J.-Y.; Li, J.-Y.; Su, Y.-J.; Wang, T. Phylogenetic significance of the characteristics of simple sequence repeats at the genus level based on the complete chloroplast genome sequences of Cyatheaceae. Ecol. Evol. 2022, 11, 14327–14340. [Google Scholar] [CrossRef] [PubMed]
- Ping, J.-Y.; Feng, P.-P.; Li, J.-Y.; Zhang, R.-J.; Su, Y.-J.; Wang, T. Molecular evolution and SSRs analysis based on the chloroplast genome of Callitropsis funebris. Ecol. Evol. 2021, 11, 4786–4802. [Google Scholar] [CrossRef] [PubMed]
- Nair, R.R.; Nandhini, M.B.; Monalisha, E.; Murugan, K.; Sethuraman, T.; Nagarajan, S.; Rao, N.S.P.; Ganesh, D. Synonymous codon usage in chloroplast genome of Coffea arabica. Bioinformation 2012, 8, 1096–1104. [Google Scholar] [CrossRef] [PubMed]
- Zeng, Y.-J.; Shen, L.-W.; Chen, S.-Q.; Qu, S.; Hou, N. Codon usage profiling of chloroplast genome in Juglandaceae. Forests 2023, 14, 378. [Google Scholar] [CrossRef]
- Zhang, P.-P.; Xu, W.-B.; Lu, X.; Wang, L. Analysis of codon usage bias of chloroplast genomes in Gynostemma species. Physiol. Mol. Biol. Plants 2021, 27, 2727–2737. [Google Scholar] [CrossRef]
- Liu, H.-B.; Lu, Y.-Z.; Lan, B.-L.; Xu, J.-C. Codon usage by chloroplast gene is bias in Hemiptelea davidii. J. Genet. 2020, 99, 8. [Google Scholar] [CrossRef]
- Li, G.-L.; Pan, Z.-L.; Gao, S.-C.; He, Y.-Y.; Xia, Q.-Y.; Jin, Y.; Yao, H.-P. Analysis of synonymous codon usage of chloroplast genome in Porphyra umbilicalis. Genes Genom. 2019, 41, 1173–1181. [Google Scholar] [CrossRef]
- Wang, Z.-J.; Xu, B.-B.; Li, B.; Zhou, Q.-Q.; Wang, G.-Y.; Jiang, X.-Z.; Wang, C.-C.; Xu, Z.-D. Comparative analysis of codon usage patterns in chloroplast genomes of six Euphorbiaceae species. Peer J. 2020, 8, e8251. [Google Scholar] [CrossRef] [Green Version]
- Xu, C.; Cai, X.-N.; Chen, Q.-Z.; Zhou, H.-X.; Cai, Y.; Ben, A.-L. Factors affecting synonymous codon usage bias in chloroplast genome of Oncidium Gower Ramsey. Evol. Bioinform. 2011, 7, 271–278. [Google Scholar] [CrossRef] [Green Version]
- Tang, D.; Wei, F.; Cai, Z.; Wei, Y.; Khan, A.; Miao, J.; Wei, K. Analysis of codon usage bias and evolution in the chloroplast genome of Mesona chinensis Benth. Dev. Genes Evol. 2021, 231, 1–9. [Google Scholar] [CrossRef]
- Li, C.-L.; Zhou, L.; Nie, J.-B.; Wu, S.-P.; Li, W.; Liu, Y.-H.; Liu, Y.-L. Codon usage bias and genetic diversity in chloroplast genomes of Elaeagnus species (Myrtiflorae: Elaeagnaceae). Physiol. Mol. Biol. Plants 2023, 29, 239–251. [Google Scholar] [CrossRef] [PubMed]
- Xing, Z.-B.; Cao, L.; Zhou, M.; Xiu, L.-S. Analysis on codon usage of chloroplast genome of Eleutherococcus senticosus. China J. Chin. Mater. Med. 2013, 38, 661–665. (In Chinese) [Google Scholar]
- Hao, J.; Liang, Y.-Y.; Ping, J.-Y.; Li, J.-Y.; Shi, W.-X.; Su, Y.-J.; Wang, T. Chloroplast gene expression level is negatively correlated with evolutionary rates and selective pressure while positively with codon usage bias in Ophioglossum vulgatum L. BMC Plant Biol. 2022, 22, 580. [Google Scholar] [CrossRef]
- Hershberg, R.; Petrov, D.A. Selection on codon bias. Annu. Rev. Genet. 2008, 42, 287–299. [Google Scholar] [CrossRef] [PubMed] [Green Version]
- Zhou, Z.-P.; Dang, Y.-K.; Zhou, M.; Li, L.; Yu, C.-H.; Fu, J.-J.; Chen, S.; Liu, Y. Codon usage is an important determinant of gene expression levels largely through its effects on transcription. Proc. Natl. Acad. Sci. USA 2016, 26, e6117–e6125. [Google Scholar] [CrossRef] [Green Version]
- Qi, Y.-Y.; Xu, W.-J.; Xing, T.; Zhao, M.-M.; Li, N.-N.; Yan, L.; Xia, G.-M.; Wang, M.-C. Synonymous codon usage bias in the plastid genome is unrelated to gene structure and shows evolutionary heterogeneity. New Phytol. 2015, 209, 855–870. [Google Scholar] [CrossRef] [Green Version]
- Cai, Z.; Penaflor, C.; Kuehl, J.V.; Leebens-Mack, J.; Carlson, J.E.; de Pamphilis, C.W.; Boore, J.L.; Jansen, R.K. Complete plastid genome sequences of Drimys, Liriodendron, and Piper: Implications for the phylogenetic relationships of magnoliids. BMC Evol. Biol. 2006, 6, 77. [Google Scholar] [CrossRef] [Green Version]
- Hall, B.G. Comparison of the accuracies of several phylogenetic methods using protein and DNA sequences. Mol. Biol. Evol. 2005, 22, 792–802. [Google Scholar] [CrossRef] [Green Version]
- Liao, Q.; Ye, T.; Song, Y. Complete chloroplast genome sequence of a subtropical tree, Parasassafras confertiflorum (Lauranceae). Mitochondrial DNA Part B 2018, 3, 1216–1217. [Google Scholar] [CrossRef] [Green Version]
- Pal, L.; Dasgupta, B.; Chakrabarti, P. 310-Helix adjoining α-helix and β-strand: Sequence and structural features and their conservation. Biomolecules 2005, 78, 147–162. [Google Scholar] [CrossRef]
Figure 1.
Chloroplast genome map of Trivalvaria costata.

Figure 2.
Distribution characteristics of SSRs in Trivalvaria costata. (a) Type and number of repetitive motifs. (b) Repetition number distribution of repetitive motifs. (c) Location distribution of repetitive motifs.
Figure 2.
Distribution characteristics of SSRs in Trivalvaria costata. (a) Type and number of repetitive motifs. (b) Repetition number distribution of repetitive motifs. (c) Location distribution of repetitive motifs.

Figure 3.
The RSCU values of codons. For each amino acid, the codon with higher RSCU values is highlighted in pink. There are a total of 30 codons with RSCU values greater than 1.
Figure 3.
The RSCU values of codons. For each amino acid, the codon with higher RSCU values is highlighted in pink. There are a total of 30 codons with RSCU values greater than 1.

Figure 4.
Analysis of codon usage. (a) Neutral plot. (b) ENC plot. (c) PR2 plot. All symbols in the figures are represented by 53 protein-coding genes.
Figure 4.
Analysis of codon usage. (a) Neutral plot. (b) ENC plot. (c) PR2 plot. All symbols in the figures are represented by 53 protein-coding genes.

Figure 5.
Species with expansion in the IR region. The ‘*’ represents the part of the gene that enters the IR region. As an ancestral group, the IR region of C. spicatus contains six genes (rpl2-3′-rps12). Annona’s IR region was expanded the most, as the 5′-rps12 entered the IR region.
Figure 5.
Species with expansion in the IR region. The ‘*’ represents the part of the gene that enters the IR region. As an ancestral group, the IR region of C. spicatus contains six genes (rpl2-3′-rps12). Annona’s IR region was expanded the most, as the 5′-rps12 entered the IR region.

Figure 6.
Amino acid sequence encoded by rps12 (a) The SC-63 group, with Trivalvaria costata as the reference sequence, showed a detection of 113 consistent amino acid sites. (b) The IR-3 group, with Annona cherimola as the reference sequence, showed a detection of 122 consistent amino acid sites. The “*” denotes the stop codon.

Figure 7.
The maximum likelihood (ML) tree constructed using RaxML 8.0.20 software was set up with a GTRMMI model and 1000 bootstraps. Different colors represent different families. The number at the node indicates the bootstrap support value, and the value of other nodes is 100.
Figure 7.
The maximum likelihood (ML) tree constructed using RaxML 8.0.20 software was set up with a GTRMMI model and 1000 bootstraps. Different colors represent different families. The number at the node indicates the bootstrap support value, and the value of other nodes is 100.

Figure 8.
Prediction model of RPS12. Based on the amino acid sequence of rps12 in T. costata, it is revealed that site 116 K is located within the 310-helix region.
Figure 8.
Prediction model of RPS12. Based on the amino acid sequence of rps12 in T. costata, it is revealed that site 116 K is located within the 310-helix region.


Table 1.
Information about the sample species.
| Order | Familly | Species Name | Genbank Accession No. | Cp Genome Size/bp | GC Content/% |
|---|---|---|---|---|---|
| Magnoliales | |||||
| Annonaceae | Annona cherimola | KU563738 | 201,723 | 39.60 | |
| Annona reticulata | MT742547 | 196,038 | 39.90 | ||
| Annona muricata | MT742546 | 201,906 | 39.60 | ||
| Fissistigma oldhamii | MW136266 | 187,782 | 38.90 | ||
| Fissistigma polyanthum | MW829282 | 189,920 | 38.70 | ||
| Uvaria macrophylla | MH992130 | 192,782 | 38.70 | ||
| Artabotrys hexapetalus | MZ936420 | 178,457 | 38.80 | ||
| Artabotrys pilosus | OK216144 | 178,195 | 38.80 | ||
| Polyalthiopsis verrucipes | MW018366 | 159,965 | 39.00 | ||
| Miliusa glochidioides | OM047203 | 159,789 | 39.20 | ||
| Trivalvaria costata | OM914484 | 162,002 | 39.00 | ||
| Greenwayodendron suaveolens | MH924590 | 159,031 | 39.00 | ||
| Chieniodendron hainanense | MK035708 | 160,497 | 39.00 | ||
| Cananga odorata | MN016933 | 167,946 | 39.00 | ||
| Magnoliaceae | Liriodendron chinense | NC_030504 | 159,429 | 39.57 | |
| Magnolia grandiflora | NC_020318 | 159,623 | 39.30 | ||
| Michelia × alba | NC_037005 | 160,060 | 39.25 | ||
| Houpoea officinalis | NC_020317 | 160,050 | 39.25 | ||
| Yulania denudata | NC_056770 | 160,090 | 39.24 | ||
| Manglietia fordiana | NC_058549 | 160,074 | 39.27 | ||
| Parakmeria yunnanensis | NC_024545 | 160,085 | 39.27 | ||
| Pachylarnax sinica | NC_023241 | 160,044 | 39.26 | ||
| Woonyoungia septentrionalis | NC_015892 | 159,667 | 39.26 | ||
| Lirianthe delavayi | NC_053643 | 159,478 | 39.28 | ||
| Alcimandra cathcartii | NC_023234 | 159,950 | 39.22 | ||
| Oyama sieboldii | NC_041435 | 160,770 | 39.25 | ||
| Myristicaceae | Magnolia alba | NC_060714 | 155,775 | 39.21 | |
| Endocomia macrocoma subsp. prainii | NC_042225 | 155,695 | 39.21 | ||
| Horsfieldia amygdalina | NC_060835 | 155,682 | 39.24 | ||
| Laurales | |||||
| Lauraceae | Actinodaphne lecomtei | NC_058827 | 152,863 | 39.38 | |
| Lindera glauca | NC_035953 | 152,780 | 39.73 | ||
| Cinnamomum camphora | NC_035882 | 152,570 | 39.39 | ||
| Laurus nobilis | NC_034700 | 152,750 | 39.23 | ||
| Litsea pungens | NC_050368 | 152,655 | 39.58 | ||
| Iteadaphne caudata | NC_050361 | 152,863 | 39.40 | ||
| Machilus gamblei | NC_058716 | 152,589 | 39.63 | ||
| Neocinnamomum delavayi | NC_036003 | 150,850 | 38.84 | ||
| Neolitsea pallens | NC_050370 | 152,699 | 39.33 | ||
| Ocotea guianensis | NC_061545 | 152,656 | 39.74 | ||
| Phoebe zhennan | NC_036143 | 152,831 | 39.48 | ||
| Beilschmiedia purpurascens | NC_051917 | 158,416 | 38.99 | ||
| Alseodaphnopsis hainanensis | NC_057082 | 152,829 | 39.18 | ||
| Alseodaphne gracilis | NC_037489 | 153,099 | 39.05 | ||
| Caryodaphnopsis tonkinensis | NC_050345 | 149,016 | 39.05 | ||
| Cassytha filiformis | NC_036001 | 114,622 | 36.93 | ||
| Cryptocarya chinensis | NC_036002 | 157,718 | 39.07 | ||
| Endiandra microneura | NC_051910 | 158,598 | 39.05 | ||
| Nothaphoebe cavaleriei | NC_058724 | 152,728 | 39.43 | ||
| Parasassafras confertiflorum | NC_042696 | 152,555 | 39.48 | ||
| Persea americana | NC_031189 | 152,723 | 39.04 | ||
| Potameia microphylla | NC_051913 | 158,597 | 39.04 | ||
| Sassafras tzumu | NC_045268 | 151,797 | 39.93 | ||
| Sinopora hongkongensis | NC_051914 | 158,598 | 39.01 | ||
| Syndiclis anlungensis | NC_052917 | 158,573 | 39.01 | ||
| Calycanthaceae | Idiospermum australiense | NC_042743 | 154,767 | 39.23 | |
| Chimonanthus praecox | NC_042744 | 153,252 | 39.25 | ||
| Calycanthus floridus var. glaucus | NC_004993 | 153,337 | 39.27 | ||
| Piperales | |||||
| Aristolochiaceae | Aristolochia contorta | NC_036152 | 160,576 | 38.27 | |
| Asarum sieboldii | NC_037190 | 193,356 | 36.20 | ||
| Saururaceae | Gymnotheca chinensis | NC_056145 | 161,621 | 38.30 | |
| Saururus chinensis | NC_050853 | 161,489 | 38.47 | ||
| Houttuynia cordata | NC_047437 | 160,228 | 38.36 | ||
| Piperaceae | Piper auritum | NC_034697 | 159,909 | 38.31 | |
| Canellales | |||||
| Winteraceae | Drimys granadensis | NC_008456 | 160,604 | 38.79 | |
| Pseudowintera colorata | NC_050985 | 161,675 | 38.81 | ||
| Tasmannia lanceolata | NC_050986 | 160,424 | 38.86 | ||
| Chloranthales | |||||
| Chloranthaceae | Chloranthus spicatus | NC_009598 | 157,772 | 38.89 | |
| Sarcandra glabra | NC_039621 | 158,900 | 39.23 | ||
Table 2.
Parameter estimates and log-likelihood values for different models.
| Model | df | ℓ | Parameters | Positive Selection Site |
|---|---|---|---|---|
| Branch model | None | |||
| rps12-CDS | ||||
| M0 | 136 | −1138.323 | ω = 0.200 | |
| F | 269 | −1110.448 | ω1 = 2.263, ω2 =2.381, ω3....... | |
| Model2 | 137 | −1138.466 | ω1 = 0.198, ω2 = 0.314 | |
| Exon 1 | ||||
| M0 | 136 | −411.148 | ω = 0.083 | |
| Model2 | 137 | −413.675 | ω1 = 0.085, ω2 = 0 | |
| Exons 2–3 | ||||
| M0 | 136 | −663.025 | ω = 0.405 | |
| Model2 | 137 | −653.180 | ω1 = 0.413, ω2 = 999 | |
| Site model | ||||
| M1a | 137 | −1084.387 | P0 = 0.922, ω0 = 0.009 | Note allowed |
| (Nearly Neutral) | P1 = 0.078, ω1 = 1 | |||
| M2a | 139 | −1058.347 | P0 = 0.910, ω0 = 0.009, | 116 K ** |
| (Positive Selection) | P1 = 0.082, ω1 = 1, | |||
| P2 = 0.008, ω2 = 12.760 | ||||
| M3 (Discrete) | 140 | −1059.785 | P0 = 0.929, ω0 = 0.015, | 16 R **, 18 V ** |
| P1 = 0.063, ω1 = 1.417, | 21 S **, 74 S **, | |||
| P2 = 0.008, ω2 = 12.571 | 109 D *, 116 K ** | |||
| M7 (β) | 137 | −1084.303 | P = 0.011, q = 0.077 | Note allowed |
| M8 (β and ω >1) | 139 | −1058.470 | P0 = 0.992, p = 0.012, | 116 K ** |
| q = 0.089 | ||||
| P1 = 0.008, ω = 13.023 | ||||
| M8a (β and ω = 1) | 138 | −1084.391 | P0 = 0.922, p = 1.007, | None |
| q = 99 | ||||
| P1 = 0.078, ω = 1 |
Note: * Posterior probability p > 95%. ** Posterior probability p > 99%.
Table 3.
Likelihood ratio tests for different models.
| Model | Comparison of Model | 2Δℓ | df | p-Value | |
|---|---|---|---|---|---|
| Branch model | |||||
| rps12-CDS | M0-F | 55.751 | 133 | 1 | |
| M0-Model2 | 0.286 | 1 | 0.593 | ||
| Exon 1 | M0-Model2 | 0.996 | 1 | 0.318 | |
| Exons 2–3 | M0-Model2 | 18.973 | 1 | 0 | |
| Site model | |||||
| M0-M3 | 157.077 | 4 | 0 | ||
| M1a-M2a | 52.079 | 2 | 0 | ||
| M7-M8 | 51.667 | 2 | 0 | ||
| M8-M8a | 51.842 | 1 | 0 | ||
Table 4.
Comparison of the evolutionary rates of rps12.
| trsv | trst | ratio | dN | dS | ω | ||
|---|---|---|---|---|---|---|---|
| rps12 | SC-63 | 0.003 | 0.004 | 0.031 | 0.002 | 0.011 | 0.027 |
| IR-3 | 0.002 | 0.004 | 0 | 0.003 | 0.007 | 0 | |
| P1 | 0.931 | 0.794 | 0.839 | 0.727 | 1.000 | 0.794 | |
| Exon 1 | SC-63 | 0.002 | 0.009 | 0.019 | 0.003 | 0.029 | 0.006 |
| IR-3 | 00 | 0.012 | 0 | 0 | 0.032 | 0 | |
| P1 | 0.839 | 0.794 | 0.908 | 0.862 | 0.794 | 0.931 | |
| Exons 2–3 | SC-63 | 0.003 | 0.002 | 0.020 | 0.002 | 0.004 | 0.035 |
| IR-3 | 0.003 | 0 | 0 | 0.002 | 0 | 0 | |
| P1 | 0.839 | 0.839 | 0.908 | 1.000 | 0.662 | 0.727 | |
| SC-63 | Exon 1 | 0.002 | 0.009 | 0.019 | 0.003 | 0.029 | 0.006 |
| Exons 2–3 | 0.003 | 0.002 | 0.020 | 0.002 | 0.004 | 0.035 | |
| P2 | 0.390 | 0.003 | 0.715 | 0.190 | 0.006 | 0.021 | |
| IR-3 | Exon 1 | 0 | 0.012 | 0 | 0 | 0.032 | 0 |
| Exons 2–3 | 0.003 | 0 | 0 | 0.002 | 0 | 0 | |
| P2 | 0.317 | 0.317 | 1.000 | 0.317 | 0.317 | 1.000 |
P1: Mann–Whitney rank sum test. P2: Wilcoxon rank sum test.
Disclaimer/Publisher’s Note: The statements, opinions and data contained in all publications are solely those of the individual author(s) and contributor(s) and not of MDPI and/or the editor(s). MDPI and/or the editor(s) disclaim responsibility for any injury to people or property resulting from any ideas, methods, instructions or products referred to in the content. |
© 2023 by the authors. Licensee MDPI, Basel, Switzerland. This article is an open access article distributed under the terms and conditions of the Creative Commons Attribution (CC BY) license (https://creativecommons.org/licenses/by/4.0/).
Share and Cite
MDPI and ACS Style
Ping, J.; Zhong, X.; Wang, T.; Su, Y. Structural Characterization of Trivalvaria costata Chloroplast Genome and Molecular Evolution of rps12 Gene in Magnoliids. Forests 2023, 14, 1101. https://doi.org/10.3390/f14061101
AMA Style
Ping J, Zhong X, Wang T, Su Y. Structural Characterization of Trivalvaria costata Chloroplast Genome and Molecular Evolution of rps12 Gene in Magnoliids. Forests. 2023; 14(6):1101. https://doi.org/10.3390/f14061101
Chicago/Turabian StylePing, Jingyao, Xiaona Zhong, Ting Wang, and Yingjuan Su. 2023. "Structural Characterization of Trivalvaria costata Chloroplast Genome and Molecular Evolution of rps12 Gene in Magnoliids" Forests 14, no. 6: 1101. https://doi.org/10.3390/f14061101
Note that from the first issue of 2016, this journal uses article numbers instead of page numbers. See further details here.