Article

Comparative Analyses of Acacia Plastomes to Detect Mutational Hotspots and Barcode Sites for the Identification of Important Timber Species

1
Guangdong Academy of Forestry, Guangdong Provincial Key Laboratory of Silviculture, Protection and Utilization, Guangzhou 510520, China
2
Shenzhen Branch, Guangdong Laboratory of Lingnan Modern Agriculture, Key Laboratory of Synthetic Biology, Laboratory of the Ministry of Agriculture and Rural Affairs, Agricultural Genomics Institute at Shenzhen, Chinese Academy of Agricultural Sciences, Shenzhen 518120, China
3
Department of Agricultural Biology, Colorado State University, Fort Collins, CO 80523, USA
4
Kunpeng Institute of Modern Agriculture at Foshan, Shenzhen Branch, Guangdong Laboratory of Lingnan Modern Agriculture, Agricultural Genomics Institute at Shenzhen, Chinese Academy of Agricultural Sciences, Shenzhen 518124, China
5
National Key Laboratory of Crop Genetic Improvement, Huazhong Agricultural University, Wuhan 430070, China
*
Authors to whom correspondence should be addressed.
Forests 2024, 15(2), 306; https://doi.org/10.3390/f15020306
Submission received: 6 December 2023 / Revised: 31 January 2024 / Accepted: 2 February 2024 / Published: 5 February 2024
(This article belongs to the Special Issue DNA Barcoding for Species Identification of Forest Organisms)

Abstract

:
The genus Acacia is a crucial source of industrial papermaking and timber, possessing significant economic value. Due to their nitrogen-fixing ability, rapid growth, and high tolerance to stress, Acacia species have become integral to short-term industrial timber forests, particularly in southern China and various other regions worldwide. Nevertheless, comparative genomic analyses of Acacia species remain limited, impeding the development of molecular markers for identifying and distinguishing between distinct Acacia species as well as distinguishing their wood counterparts from other tree species. To address this gap, we generated plastomic sequences from eight species commonly cultivated in Chinese plantation forests and compared them with existing data. Our findings revealed a generally conserved structure and gene content within the plastid genomes of Acacia. Notably, the dN/dS ratio of genes from distinct functional groups varied, particularly between ribosomal proteins and photosynthesis genes. Furthermore, phylogenetic analyses and sequence comparisons suggest that the introduction of Acacia to China may have been less diverse than previously thought or that interspecies introgression has occurred more frequently than previously documented. This study offers a valuable starting point for future research in this area and for improving timber quality through marker-assisted breeding.

1. Introduction

Acacia is a genus in the Fabaceae family (and Mimosoideae subfamily) containing over 1000 species of shrubs and trees [1]. Previous descriptions of the genus Acacia included a greater number of species across a larger geographic range but was found to be polyphyletic; although, the common use of the term “Acacia” is still used to refer to many of these former Acacia species. The current delimitation of Acacia results in most species being found in Australasia and the Pacific Islands (over 900 species) with only a small number in Asia (12 species), Madagascar (1 species), and the Reunion Islands (1 species) [2]. The only Acacia tree species native to southern China is Acacia confusa, from Taiwan [3]. Acacia species mostly grow in dry early and semi-dry early climate zones, vertically distributed between 0 and 1500 m above sea level, and mostly distributed between 100 and 500 m [4].
Due to their ability to fix nitrogen through root nodules, resistance to drought, tolerance of poor soil, fast growth, and high germination rates, Acacia species have become an important tree species for short-term industrial timber forests in southern China [5]. Acacia mangium, Acacia auriculiformis, Acacia crassicarpa, Acacia cincinnata, Acacia melanoxylon, and Acacia aulacocarpa introduced from Australia have shown good adaptability after introduction [6]. The species A. mangium, A. auriculiformis, A. crassicarpa, and A. cincinnata are high-quality tree species for building and furniture in China [7]. A. melanoxylon has a clear and straight trunk, a large proportion of which is heartwood bearing a mostly reddish-brown or black-brown color which is often used in decorative applications or as a flooring [8]. A. aulacocarpa is an excellent pulping raw material among Acacia species, with its wood meeting the whiteness requirements of high-end pulp after general bleaching. In addition, A. mangium and A. auriculiformis also have excellent pulping characteristics [9]. The hybrid species A. mangium × A. auriculiformis was produced from a female parent of A. mangium and a male parent of A. auriculiformis and has excellent wood characteristics. This hybrid not only has the advantages of resistance to poor soils, a straight trunk, and the small branches of A. auriculiformis, but also has the characteristics of rapid growth, nitrogen fixation, and water conservation of A. mangium. It produces wood suitable for industrial papermaking, furniture manufacturing, and for fuel wood [10]. A. confusa is grown in the Taiwan, Fujian, Guangdong, Guangxi, and Yunnan provinces of China. It has a rapid growth rate, is drought resistance, and can tolerate poor soil. In fact, long-term planting with A. confusa can improve soil conditions [11]. A. confusa is suitable for afforestation on barren mountain slopes and is a pioneer species for coastal-protection forests [12].
The plastid is a semi-autonomous organelle in plant cells where essential metabolic processes take place such as photosynthesis (in chloroplasts) and the synthesis and storage of lipids and other organic compounds (such as in leucoplasts) [13,14]. At present, the generally accepted theory of the origin of endosymbiosis is that plastids originated from free-living photosynthetic cyanobacteria subsumed by ancestral eukaryotes about 1.2 billion years ago, and thereafter the plastids transferred most of their genes into host genomes through ongoing gene transfers [15]. From the time of this ancient acquisition, plastids have possessed a uniquely derived genome (often referred to as, cpDNA for chloroplast DNA), but are semi-autonomous organelles due to the transfer of a large number of genes into the nucleus, making them dependent on numerous nuclear-encoded proteins for completion of their normal function [16]. Advances in high-throughput sequencing technology and reductions in sequencing costs have enabled the widespread use of phylogenetic analyses of plastid genomes (plastomes). Typically, plastomes range in size from 115 to 165 Kb and very often maintain a conserved quadripartite circular structure (as well as conserved gene content and gene order) made up of a large single-copy (LSC) region and a small single-copy (SSC) region separated by a pair of inverted repeats (IRs) [17,18,19]. Meanwhile, previous studies have extensively reported contraction or expansion of the IR region of the plant chloroplast genome [20]. Plastids are nearly always matrilineally inherited, and they are effectively non-recombinant making them ideal molecular markers for genealogical and phylogeographic studies as well as species delimitation [21]. Despite their conserved structure and gene content rapidly evolving, sequences in some parts of the plastome can be used for phylogenetic and population genomic analyses [22,23]. For instance, SSRs in plastomes can often be variable enough to resolve intraspecific lineages [24,25,26,27]. Therefore, the mining of plastomic data can facilitate the rapid identification of species in genera such as Acacia as well as the clarification of phylogenetic relationships.
In this study, we sequenced and assembled plastomes of seven Acacia species and one hybrid species A. mangium × A. auriculiformis all commonly grown in Chinese plantation forests. We conducted a phylogenetic analysis to infer the relationships among species in the genus Acacia using a dataset of coding DNA sequences (CDSs), protein sequences, and full-length plastome sequences. We compared the boundaries of different genomic regions of the eight newly assembled plastomes to quantify differences in expansion or contraction and identify marker sites at these junctions. In order to clarify their phylogenetic positions and conservation, we conducted the following analyses in 107 accessions from Acacia: codon usage preferences analysis, nucleotide substitutions in protein-coding genes, and repetitive sequences distribution and abundance patterns. Finally, we identified highly variable plastome regions of Acacia species as well as SNP and InDel sites used to distinguish these eight species. In general, this study enriched the genomic resources of Acacia spp., and for the first time analyzed the structure and sequence variation of the plastomes of Acacia at the genus level, and unearthed Acacia mutational hotspots and potential barcode sites, laying the foundation for the subsequent development of genetic markers.

2. Materials and Methods

2.1. Tissue Samples and DNA Extraction

We collected fresh leaves from eight species of Acacia (A. melanoxylon, A. mangium, A. mangium × A. auriculiformis, A. auriculiformis, A. confusa, A. aulacocarpa, A. cincinnata, A. crassicarpa) for DNA extraction. The leaf material from plants were collected at the National Acacia Seed Base, Jiangmen, Guangdong, China (113°8′34.879″ E, 22°17′56.891″ N). To obtain plastome sequences, genomic DNA were extracted using a QIAGEN DNeasy Plant Maxi Kit (Cat. NO 68163) for paired-end sequencing.

2.2. Genome Sequencing and Assembly

An MGI T7 sequencer was used to sequence the libraries generated using MGIEasy PCR-Free DNA Library Prep Set from the extracted total DNA with insert sizes of 500 bp, for 150 bp paired-end read lengths. Raw data were quality controlled and filtered using Fastp [28], which yielded 5 Gb of clean reads for each sample.
All paired-end clean reads were aligned to a published A. crassicarpa plastome (NCBI accession number: NC_067032.1) with bwa v0.7.17-r1188 [29,30] software, and then Picard v2.20.3 (https://broadinstitute.github.io/picard/, accessed on 29 January 2022) was used to select plastome reads from the whole-genome shotgun reads. The selected plastome reads were assembled using Spades v3.14.0 [31] with default parameters, and the output scaffolds (GFA file) were imported into Bandage v0.8.1 [32] to generate the final plastome for each species.

2.3. Genome Annotation

All 111 plastomes, which contained 8 newly sequenced and assembled Acacia plastomes, and an additional 99 published genomes of Acacia, and relatives (employed as outgroups) Albizia bracteata, Archidendron lucyi, Inga edulis, and Inga leiocalycina were compiled for analyses, with all NCBI accession numbers listed in Table S1. The re-annotation of all species was then executed using Plastid Genome Annotator (PGA) [33], and the visualization of genome structure was implemented using the Draw Organelle Genome Maps online software version 1.3.1 (OGDRAW) [34].

2.4. Repetitive DNA Analyses

Four repeat types in 111 plastomes, F (forward), P (palindrome), R (reverse), and C (complement) were identified using REPuter [35] with default settings. Simple sequence repeats (SSRs) were detected using the Perl script MISA [36], with 10, 6, 5, 5, 5, and 5 repeat units set for mono-, di-, tri-, tetra-, penta-, and hexa-motif microsatellites set as the minimum threshold for detection, respectively.

2.5. Nucleotide Diversity

Analyses of genome sequence diversity were performed using mVISTA [37] to compare the 8 newly assembled Acacia species using Shuffle-LAGAN [38]. All 111 plastomes were analyzed in sections based on annotation files, and the overall consistency score of each section was calculated with multiple sequence alignment tools using T-Coffee [39] in default mode. CodonW v1.4.4 [40] was employed to assess codon distribution on the basis of the relative synonymous codon usage (RSCU) ratio across the sample set of 111 plastomes.

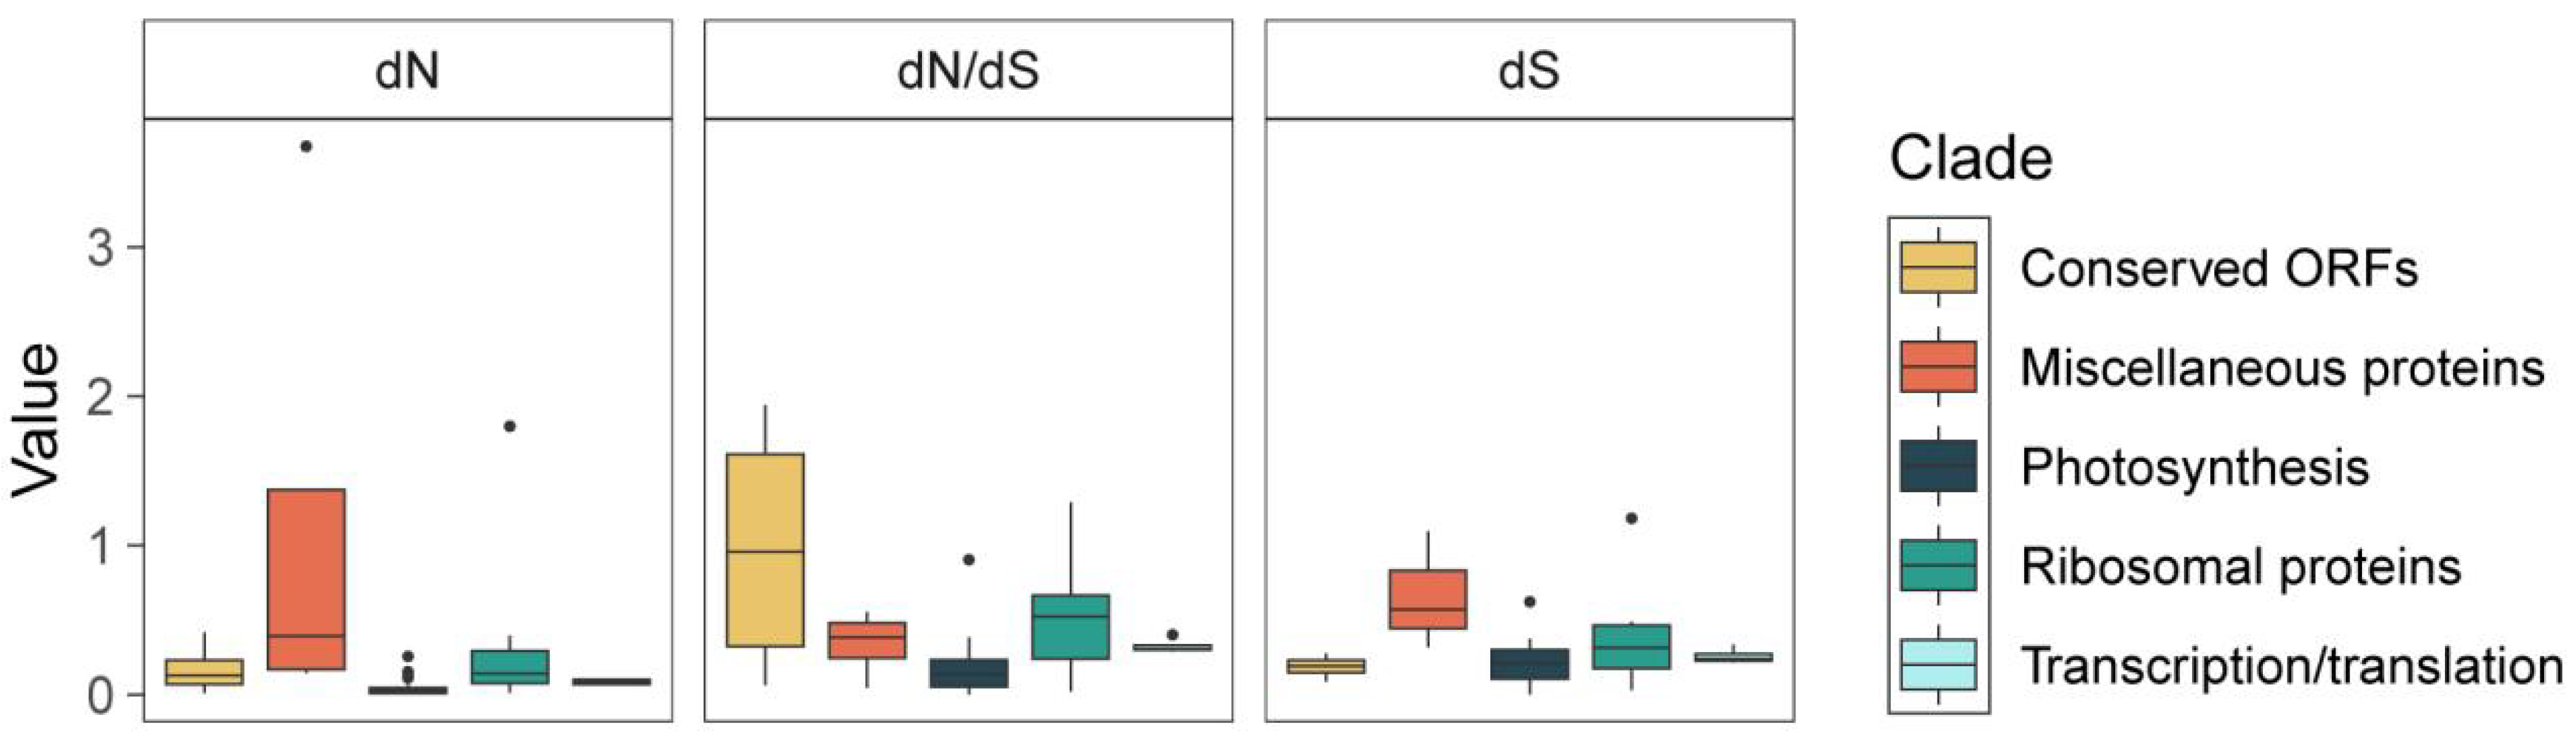
2.6. Phylogenetic Analyses and Nucleotide Substitutions

The whole-plastome sequence alignment of 111 samples was generated using MAFFT v7.464 [41,42], with TrimAL v1.4 [43] used to trim the poorly aligned positions. The longest CDSs of 77 protein-coding genes were extracted from each genome according to the annotation files and also aligned using MAFFT. The nucleotide sequence alignments of 77 protein-coding genes were concatenated and used to resolve a phylogenetic tree using IQ-TREE v2.0 [44] with 1000 ultrafast bootstrap replicates to assess branch support. FigTree v1.4.3 (http://tree.bio.ed.ac.uk/software/figtree, accessed on 15 June 2020) was used for tree visualization. This pipeline has been modified from the description in Liao et al. [45]. CODEML in PAML v4.9 [46] was used to calculate the nonsynonymous (dN), synonymous (dS), and the ratio of nonsynonymous to synonymous nucleotide substitutions (dN/dS) for each gene. Wilcoxon Signed Ranks Test was used to detect the significance of differences between different types of genes. For the identification of SNPs and InDels, the method of Hong et al. [47] was used.

3. Results and Discussion

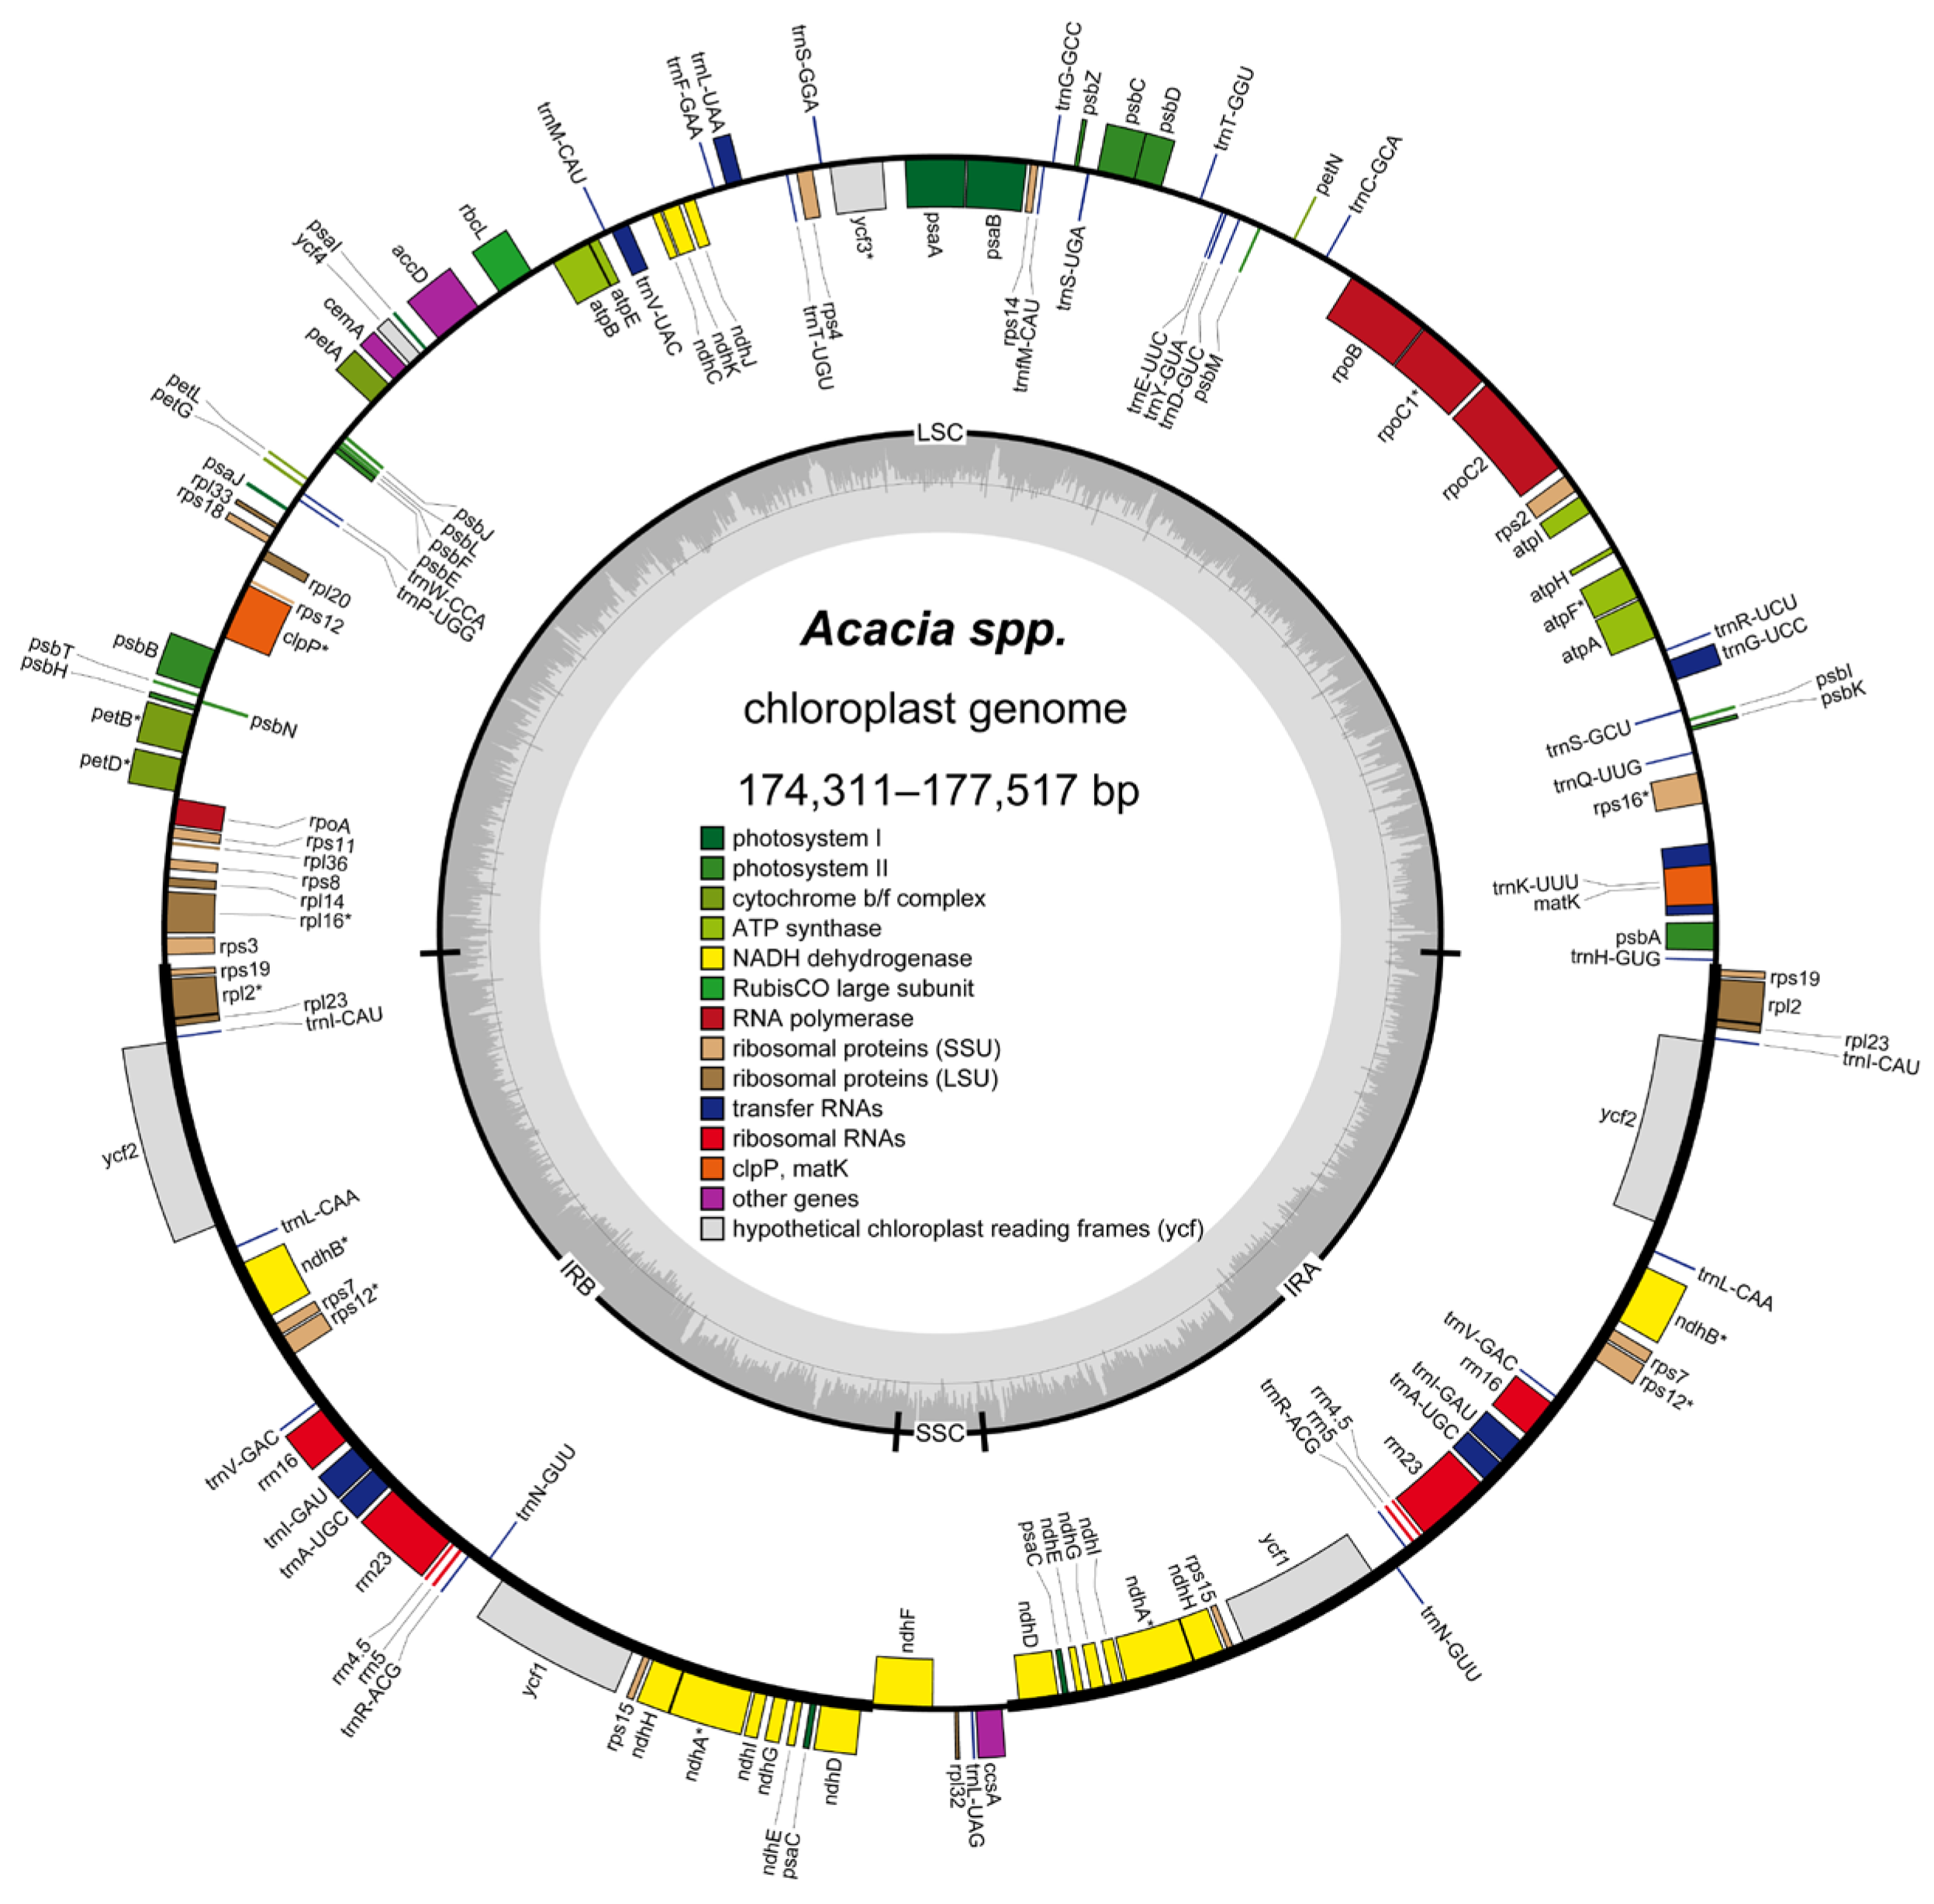
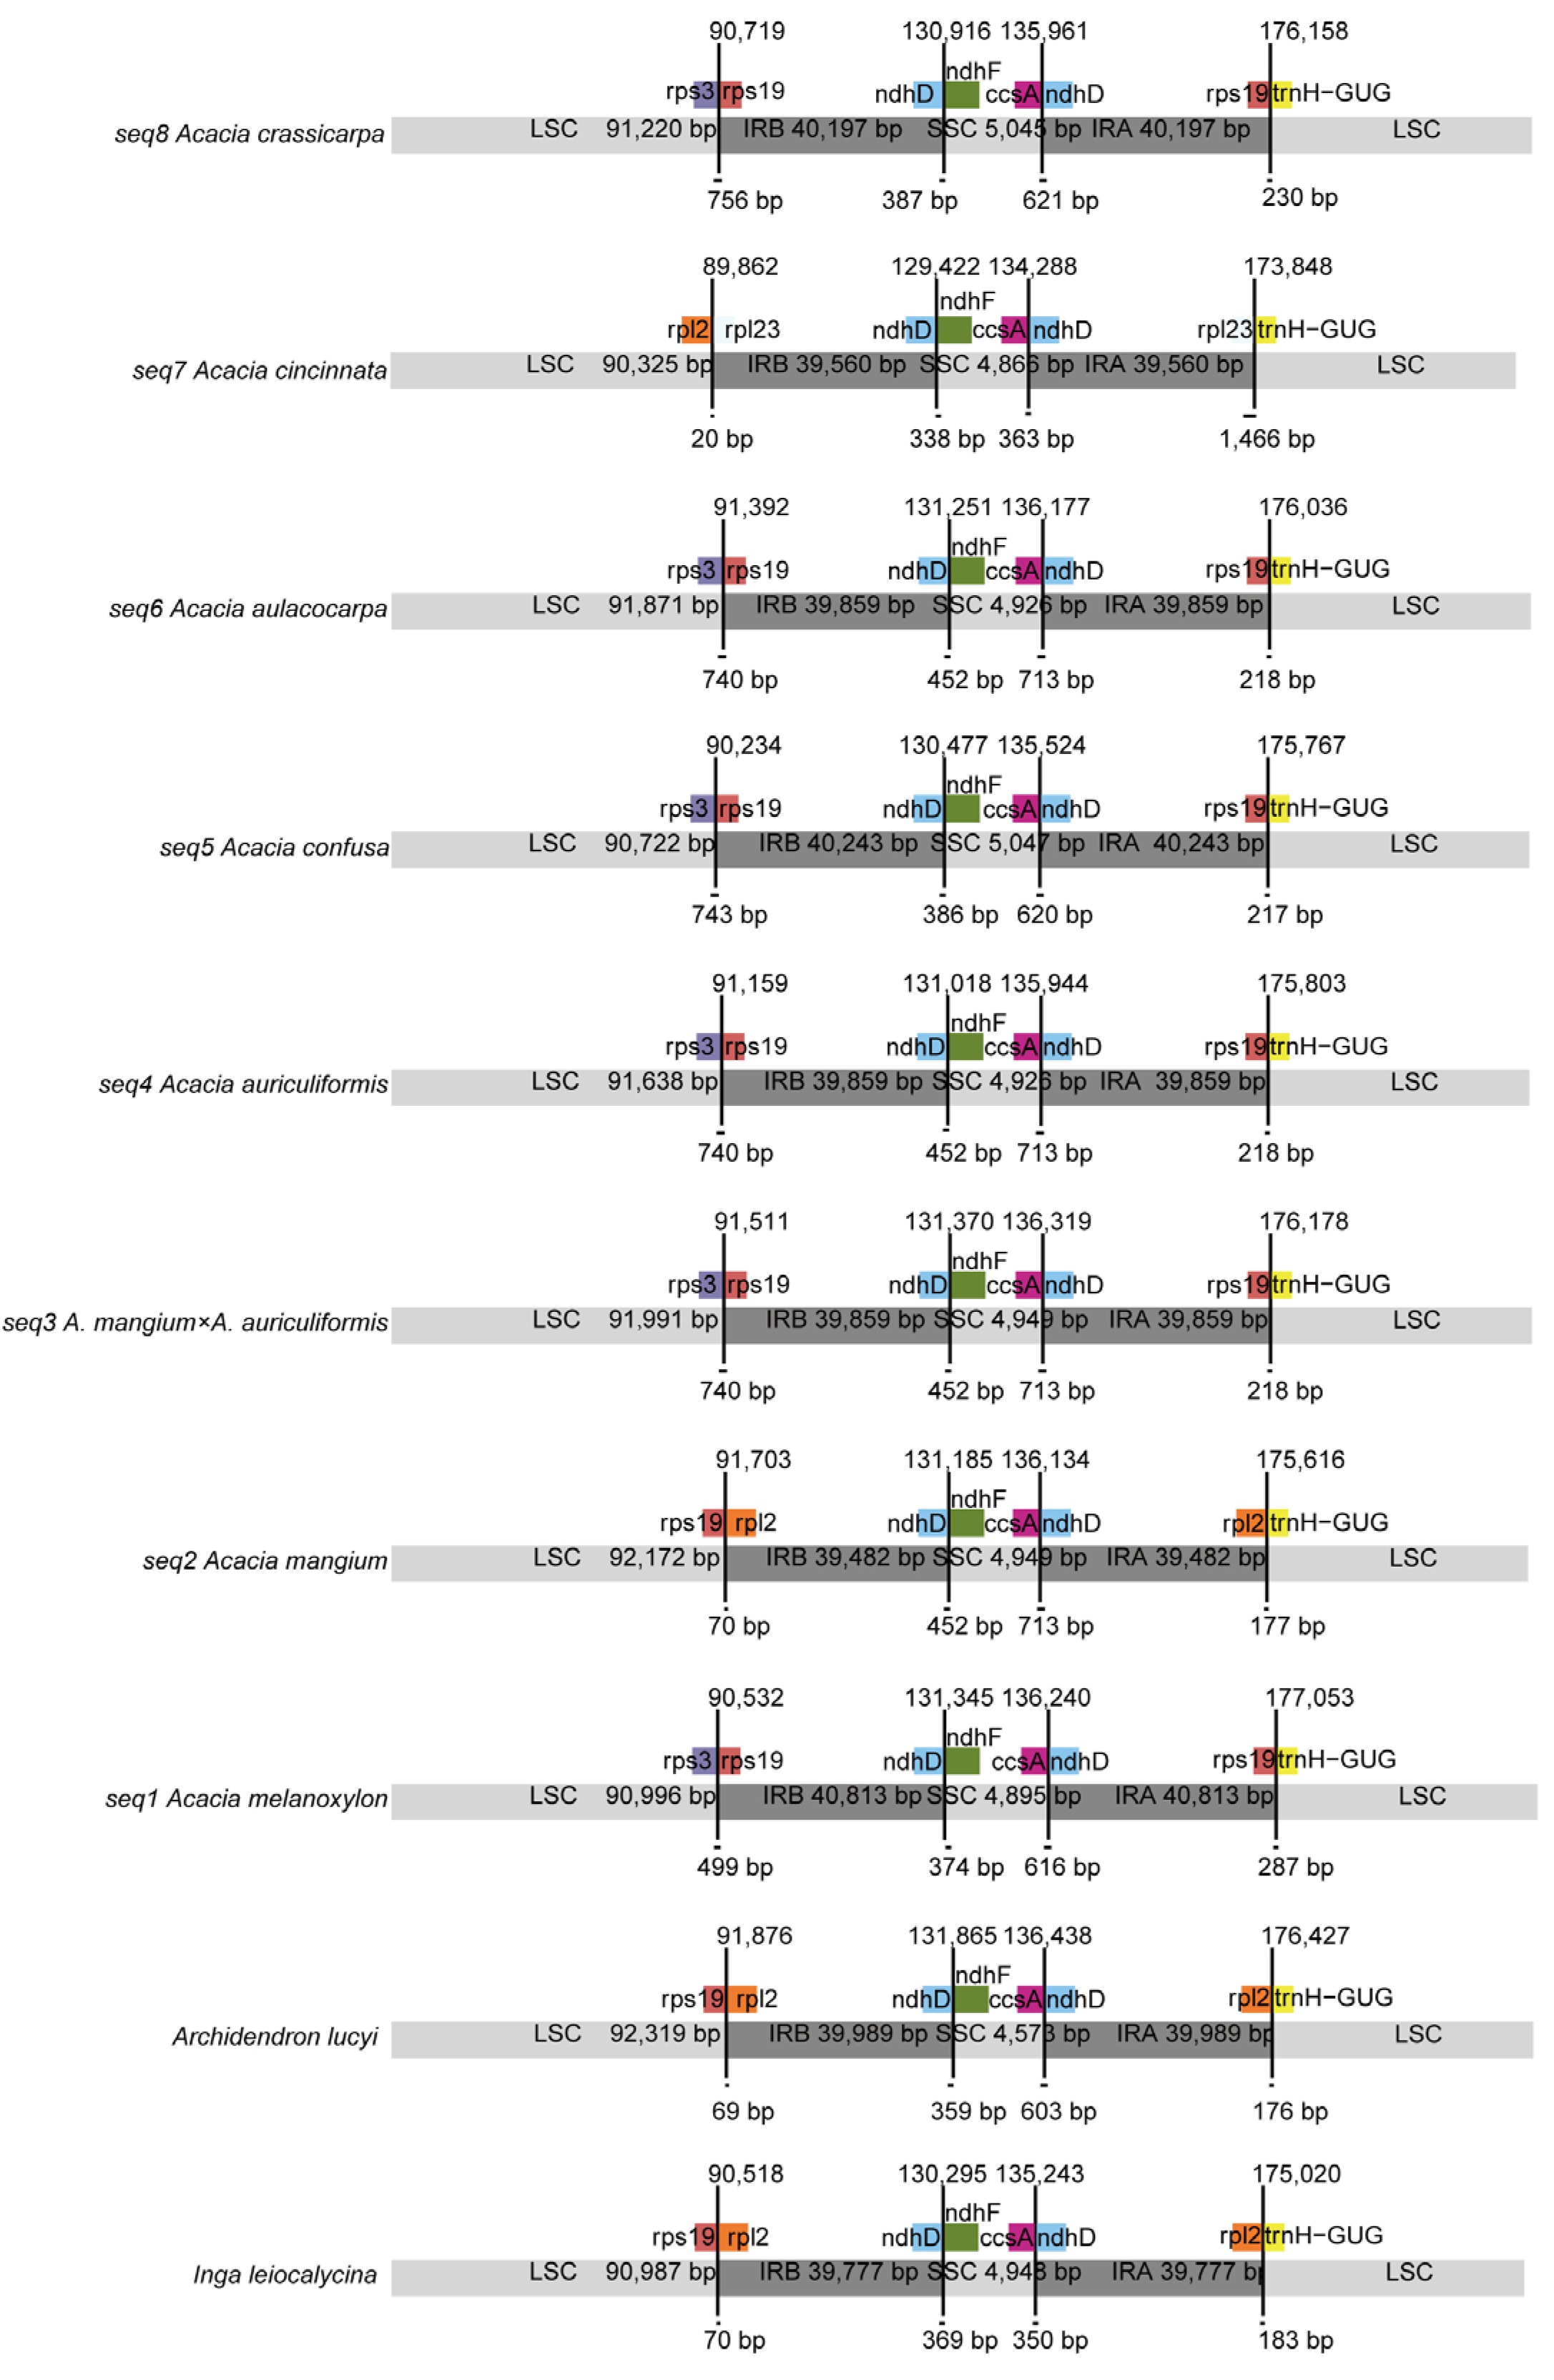
3.1. Genome Characteristics of Acacia Plastomes

By utilizing MGI short reads, the plastomes of eight Acacia species were assembled with the published A. crassicarpa plastome (NCBI accession number: NC_067032.1) used to extract sequences from whole-genome shotgun data. The eight plastomes were all typically circular in structure and ranged from 174,311 bp to 177,517 bp in length (Figure 1 and Figure S1, Table 1). The GC contents of the eight plastomes were 35.32%–35.66%. The IR regions were similar in length, ranging from 39,482 to 40,813 bp, separated with an LSC region (90,323–91,989 bp) and an SSC region (4897–5049 bp; Table 1). Contraction or expansion of the IR region has been widely proposed to be the main reason for the variation in plastome size [20]. Compared with the plastomes of other forest trees not in the Fabaceae family, the Acacia plastomes had a longer IR region (25–26 Kbp vs. 39–40 Kbp) due to the extension of the repeat region into the single-copy region [47]. Acacia plastomes exhibited conserved gene order and gene contents and showed a typical quadripartite structure (LSC, SSC, IRA, and IRB) that has been widely reported in green plants [48].
All eight of these newly assembled plastomes of Acacia contain 111 unique genes, including 77 protein-coding genes (PCGs), 30 tRNAs, and four rRNAs with the IR region containing 16 protein-coding genes (Table S2). The 12 genes with introns are atpF, clpP, ndhA, ndhB, petB, petD, rpl16, rpl2, rpoC1, rps12, rps16, and ycf3, with three of these (ycf3, clpP and rps12) containing two introns, while the other nine genes contain one intron (Figure S1, Table S2). We further examined codon preferences in these eight sequences. A common method for analyzing the frequency of codon use is relative to synonymous codon usage (RSCU), which assumes that the codon that is used more frequently has a higher value (Figure S2). Given the conservatism of codon use, if a mutation is detected, it is usually fixed, so it can be used as a useful marker site. As a result, the codon usages of Acacia, A. lucyi, and I. leiocalycina plastomes were analyzed together. There was no significant difference in RSCU between the plastids of Acacia, indicating that Acacia are conservative in codon use, and the number of loci used for branching or species identification in functional genes is limited (Figure S2).
In addition to the eight Acacia plastomes newly sequenced in this study, 99 published genomes from Acacia, and four outgroup species, including A. lucywere, A. bracteata, I. edulis, and I. leiocalycina, were used for greater comparative analyses (Table S1). When comparing the 111 plastomes, they contained 76 or 77 coding genes, 30 tRNA genes, and 8 rRNA genes. The difference in gene number among some taxa was the result of the loss of rps16 in A. karina (LN885281) and clpP in A. exocarpoides (LN885267, Table S1). We further analyzed the dN (nonsynonymous substitution rates), dS (synonymous substitution rates), and the ratio of dN/dS (to quantify the strength of selection) of all protein-coding genes to look for genes under different modes of selection (the clpP, rps16, and psbL were excluded due to outlier values, Figure 2). With the exception of ycf1 (1.50), ycf2 (1.94), rps3 (1.26), and rps7 (1.29), the dN/dS of all other genes is less than 1, indicating that most genes evolved through purification selection, especially those related to photosynthesis, such as psbL, ndhB, psaC, ndhI, ndhD, ndhG, petG, psbF, psbE, ndhA, psbN; their values are all lower than the average of the other four functional categories (Figure 2). Ribosomal protein genes usually have higher substitution rates and genetic variation in different species than those encoded in photosynthesis (Figure S3) [49]. There are significant differences in the evolutionary rates of genes encoding chloroplast proteins (Figure S3). Significance analyses of different gene types showed that the dN values of photosynthetic genes were significantly lower than those of other types of genes, except for conserved ORFs. In this result, the most significant difference with the dN value and dN/dS value of photosynthetic genes was with Ribosomal proteins. In the ribosomal protein genes, rps3 and rps7 have dN/dS greater than 1.2; the dS of genes rps11, rps14, rps16, rps18, rps19, rps20 is greater than 0.4, and the rpl32 gene dS is greater than 1.1. On the contrary, the dS values of genes related to photosynthesis are close to zero, indicating that their functions are highly conserved.
The gene content and distance between genes at the junctions of the LSC, SSC, and IRs varied across the ten plastomes we compared (Figure 3). The ndhD and ndhF genes are adjacent to the IRB SSC junction in all eight newly sequenced Acacia species, A. lucyi, and I. leiocalycina. The SSC and IRA junction is nearest to the ccsA gene in these 10 plastomes. The length of the intergenic spacer across the LSC and IRB connections varies greatly in the ten plastomes. We compared the distances between rps3 and rps19 or between rpl2 and rpl23, ranging from 20 to 756 bp (Figure 3). Similarly, the intergenic region between rps19/rpl23 and trnH-GUG ranges from 177 bp to 1466 bp across these Acacia plastomes. Although the IR regions are considered to be the most conserved units in the plastome, at the boundary of these, those with single-copy regions that expand or contract can result in changes in the copy number of the associated genes or the generation of pseudogenes that span the boundary region. Among these eight species, we found that A. confusa and A. mangium had different boundary genes and IRB lengths than the other Acacia species we assembled, and in the case of A. mangium, it had a boundary gene arrangement like that of the outgroups I. leiocalycina and A. lucyi (Figure 3). In this study, even within the Acacia genus, the boundaries between different regions were diverse among different lineages, such as in the boundary of LSC and IRB where three different arrangements of genes at the junction were found including rps3 and rps19, rpl2 and rpl23, rps19 and rpl2. This diversity of junctions can be utilized in the identification of different lineages.

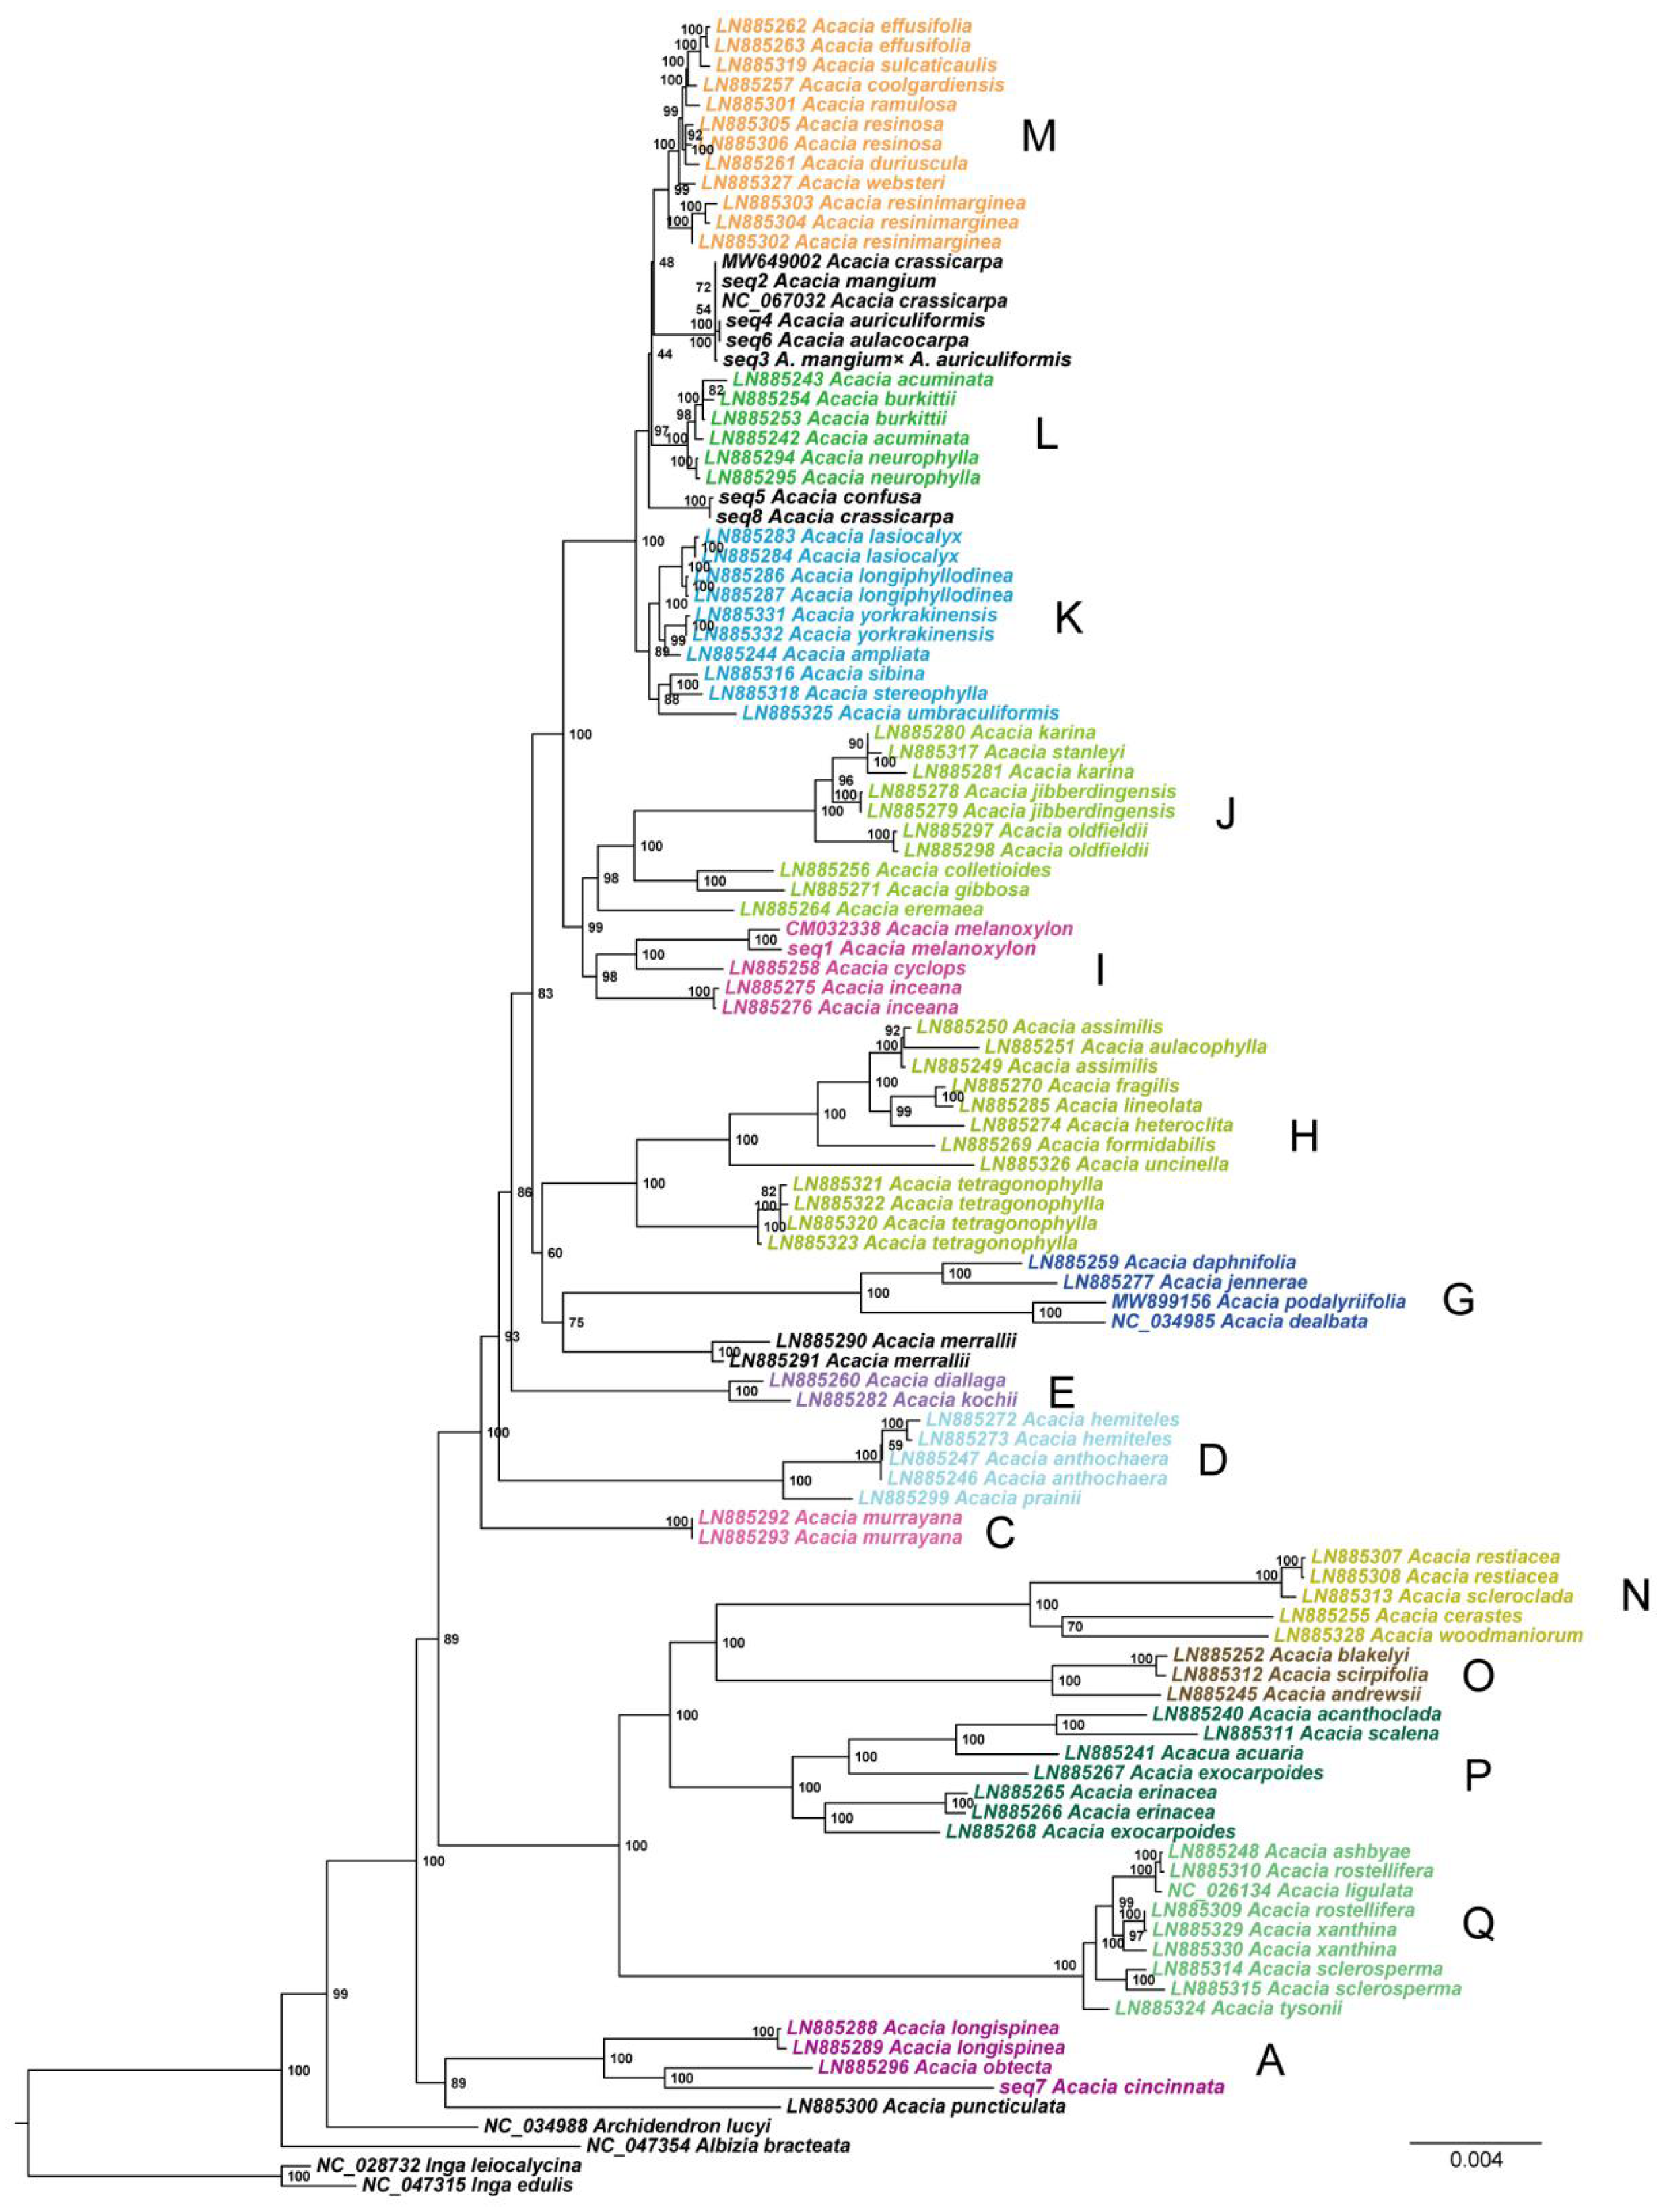
3.2. Phylogenetic Analyses

In order to resolve the plastome phylogeny of Acacia, we combined data from our eight newly sequenced plastomes with 99 publicly available Acacia plastomes and four outgroup plastomes to better understand the maternal diversity of common timber Acacia grown in Asia (Figure 4). Trees were resolved from concatenated CDSs, protein sequences, and full-length plastome sequences and were compared. The protein dataset contained a total of 22,869 informative sites, the CDS dataset contained 62,952 informative sites, and the full-length plastome alignment contained 145,595 informative sites (Figure 4 and Figure S4). The results for the three datasets are generally consistent with each other and clade membership and relationships in our trees are in line with previous studies [50,51]. Our results resolved a clade L + M that is sister to clade K. However, early diverging to clade M is a well-supported clade of two A. crassicarpa from GenBank (MW649002, NC_067032) as well as plastomes sequenced in this study and identified as A. mangium (seq2), A. auriculiformis (seq4), A. aulacocarpa (seq6), and A. mangium × A. auriculiformis (seq3). Early diverging to the clade of L + M + the clade with seqs 2, 3, 4 and 6 (as well as two A. crassicarpa from GenBank) is a well-supported clade containing A. confusa (seq5) and A. crassicarpa (seq8). This pattern of polyphyly with A. crassicarpa is indicative of past introgression with an A. crassicarpa mother to an A. confusa father or possibly the misidentification of samples. However, the positions of A. confusa and A. crassicarpa are still problematic because the three datasets are not entirely consistent (Figure 4 and Figure S4). Additionally, the near-complete sequence identity between A. auriculiformis (seq4) and A. aulacocarpa (seq6) and resolution in a well-support clade also suggest possible past introgression or misidentification. For clades N, O, and P, the result from the protein dataset and full-length dataset support clades N + O sister to clade P, whereas there is a conflict in the sequences of the CDSs, which may be due to long-branch attraction affects. The newly assembled A. cincinnata (seq 7) was resolved in clade A, while A. melanoxylon (seq 1) was resolved in clade I sister to a previously published A. melanoxylon. In our phylogenetic results, most of the Acacia species resolved in a position that was predicted based on previous plastome phylogenies. The polyphyly of A. crassicarpa in our tree suggests that the introduction of Acacia into China may have been less diverse than previously thought, or that introgression has been more widespread than previously noted. To better understand Acacia germplasm in China, more comprehensive sampling of individuals and genomes is required. Such efforts will refine the association of wood attributes with genomic patterns, ultimately improving marker-assisted breeding in the future.

3.3. Repeat Analysis

To further understand the differences between plastomes of Acacia repeat sequences were annotated and compared among 107 Acacia accessions and four outgroup species. The 111 plastomes contained repeat types Complement (C), Forward (F), Palindromic (P), and Reverse (R). According to the length of the sequence to classify, count the number of each type; the most common is the repeat sequence whose length is less than 50 bp (Figure 5). Almost all the repetitive sequences are in the range of 20–29 bases, then 50 + bases, then 30–39 bases, and the least is in the range of 40–49 bases (Figure 5). No C type repeat sequence was detected above 40 bp, even in a small size range (Figure 5). In all accessions, the number of F and P repeat sequences is the most common repeat type and is more evenly distributed in shorter repeat sequences (Figure 5). There are also some exceptions to this general trend such as in A. assimilis, A. jennerae, A. oldfieldii and A. podalyriifolia where the F type is far more common than P type. In the range of 40–49 and 50+ bp, the R type was absent in most plastomes of these accessions (Figure 5). In view of the differences in the type and abundance of repetitive sequences, markers to identify different lineages can be designed according to different repetitive sequences. In previous studies, the differences in repetitive position, abundance, and type in the mass group provided ideal characteristics for the identification of species or lineages [52,53]. Based on the findings in the results, especially for repetitive sequences greater than 50 bp in length, their abundance can be used for species identification of the genus Acacia due to differences between species.
To better understand the dynamics of simple sequence repeats (SSRs) in the plastomes of Acacia, 107 Acacia accessions and four outgroup species were analyzed (Figure S5). Among all 111 plastomes, 94.1% (8197/8713) of the SSRs were single nucleotide A/T motifs. Most plastomes in Acacia have fewer A/T SSRs than the four outgroup taxa (Figure S5). There were four accessions (A. acuminata, A. burkittii (2) and A. lasiocalyx) that contained A/T motifs only. The species A. cerastes possessed a unique AAAAAG/CTTTTT SSR; A. scleroclada possessed a unique AACAAT/ATTGTT SSR, and only three accessions (A. restiacea (2) and A. scleroclada) contained a AAAGAG/CTCTTT SSR. The number of AT/AT type SSRs in Acacia plastomes varied widely, ranging from 0 to 12. In our SSR analyses, as expected, hybrid A. mangium × A. auriculiformis and its parents A. mangium, and A. auriculiformis exhibited the same SSR type and abundance of distributions. Based on the results of SSR analyses, by integrating data from different SSR motif types and length differences and performing nested analyses, we found that these genomic regions may be important for identifying different populations, species, and branches of Acacia.

3.4. Genome Sequence Divergence and Barcode Selection

In order to identify the differences between plastid sequences, we used mVISTA to find significant differences between conserved regions in eight newly assembled Acacia plastomes and the two outgroups I. leiocalycina and A. lucyi (Figure S6). Sequences within most genes remained highly conserved, except for ycf1, ycf2, rps3, and accD which contained differences from the outgroups, but remain highly conserved among the eight Acacia plastomes. The sequences between genes (IGSs) have low similarity in some regions, especially the LSC (for instance psaA to psbB and matK to atpI) (Figure S6). From these results it is clear that although most of the regions in the plastome are conserved, there are still numerous regions between and within genes that can be developed as markers to distinguish different Acacia species.
In addition, we further compared divergent regions among all 111 plastomes (Figure 6). The results showed that the CDSs of the tested materials had high sequence similarity, while those of accD-psaI (score 622; length 1811 bp), matKrps16 (score 671; length 3134 bp), rps16-trnQ-UUG (score 687; length 1567 bp), psbZ-trnG-GCC (score 687; length 1352 bp), psbI-trnS-GCU (score 717; length 933 bp), rps8-rpl14 (score 745; length 517 bp), trnT-UGU-trnL-UAA (score 769; length 2716 bp), rpl14-rpl16 (score 794; length 215 bp), trnI-CAU-rpl23 (score 823; length 1792 bp), and ndhA-intron 1(score 792; length 1843 bp) had lower sequence similarity (Figure 6). The identification of these highly variable intergenic regions provides a list of candidate regions from which genetic markers such as barcodes could be generated. These markers can provide important genetic resources for studying the evolution and diversity of Acacia in the future. Although most of the intergenic regions were more variable, psaB-psaA (score 1000; length 105 bp), rps15-ndhH (score 1000; length 104 bp), ndhA-ndhI (score 1000; length 79 bp), psbL-psbF (score 1000; length 22 bp) are very similar (Figure 6). Because these photosynthetic genes are clustered in a single operon, even the spacer regions are strongly selected for function which has resulted in nucleotide conservation [47].
We further identified the key SNPs and InDels used to differentiate between the common Acacia species grown in China for timber production (Table S3). Among these eight species, A. melanoxylon contained a total of 24 SNPs and 51 InDel loci unique to the species; A. mangium contained 3 SNPs and 10 InDel loci; A. auriculiformis contains 2 InDel loci; A. confusa contained 4 SNPs and 6 InDel loci; A. cincinnata contained 189 SNPs and 61 InDel loci; A. crassicarpa contained 3 SNPs and 6 InDel loci; and A. aulacocarpa and A. mangium × A. auriculiformis did not contain any such SNPs or InDels because they were the reference set for comparison (Table S3). It was also possible to separate A. mangium, A. mangium × A. auriculiformis, A. auriculiformis, and A. aulacocarpa from the other species using the six InDel loci. The loci used to separate A. confusa, A. crassicarpa from the other species were even greater, with a total of 56 SNPs and 35 InDels (Table S3). The plastome is characterized by a small genome and a low sequence mutation rate, so the identification of species-specific InDels is an effective method for developing molecular markers [54]. In this study, unique InDels were identified among the newly assembled eight species. Overall, we have identified sufficient nucleotide differences for the development of genetic markers in the genus Acacia, as well as in closely related species that produce similar-appearing wood. The production of the initial precise map of genomic variation (InDels and SNPs) has extensively revealed the concentration of variation across plastomes in the Rosaceae family. The majority of the genomic alterations were situated in non-coding and intronic regions, a pattern that aligns with previous reports in rice [48].

4. Conclusions

Although the plastomics of forest trees are progressing slower than those of crops and other economically important plants, it is clear that improved sequencing technologies are driving genomic research in forest trees. In this paper, we assembled eight Acacia high-quality plastomes and performed a comprehensive comparison in terms of gene content, ratio of dN/dS, the junctions between different genomic regions, type and abundance of repeats, and genome sequence divergence to provide detailed plastomic analyses of Acacias grown in China. Despite gene content being quite conserved, the dN/dS of genes from different functional categories are indeed diverse, especially between ribosomal protein genes and photosynthetic genes. The junctions between LSC and IRB have the most variable adjacent gene content and length. Repetitive sequences exhibit certain interspecies differences in type and abundance, which can be used to develop molecular markers for the identification of different species or populations within Acacia. Phylogenetic relationships were resolved by combining the plastomes of 8 newly assembled and 99 published Acacia plastomes. From this phylogeny, the identification of the timber species A. cincinnata (seq7) and A. melanoxylon (seq1) grown in China were confirmed. The polyphyletic resolution of A. crassicarpa suggests that either these samples were misidentified or introgression between A. crassicarpa and A. confusa occurred after their introduction. Additionally, the near-complete sequence identity between A. auriculiformis (seq4) and A. aulacocarpa (seq6) also suggests possible past introgression or misidentification. More work is needed to better understand the diversity and population dynamics of Acacia in plantation forests worldwide and how such diversity can be utilized in cultivar improvement.

Supplementary Materials

The following supporting information can be downloaded at https://www.mdpi.com/article/10.3390/f15020306/s1, Figure S1: Plastome structure of 8 newly assembled Acacia species; Figure S2: Codon content of 21 amino acids and a stop codon of 77 coding genes from 8 newly assembled Acacia plastomes; Figure S3: Nucleotide substitution rates among 74 chloroplast protein-coding genes in Acacia by functional category. Asterisks indicate statistically significant differences: *, p < 0.05, **, p < 0.01, ***, p < 0.001, ****, p < 0.0001; Figure S4: Phylogenetic tree of Acacia based on the CDS alignments of 77 chloroplast genes with branch lengths; Figure S5: The number of simple sequence repeats (SSRs) of different types from 111 plastomes; Figure S6: Global alignment of eight newly assembled Acacia plastomes using mVISTA with Inga leiocalycina as reference; Table S1: Summary of the complete plastomes sequenced for this study; Table S2: Gene composition of Acacia chloroplast genomes; Table S3: Summary of the SNP and INDEL identified in the 8 plastomes.

Author Contributions

X.L., Z.W., S.Z. and W.L. conceived and designed the study. W.L., Y.L., S.Z. and X.L. performed the experiments and data analysis. W.L. and Y.L. contributed the material samplings. W.L., L.R.T., S.Z. and X.L. wrote the drafted paper. L.R.T., Z.W., X.L. and W.L. revised the paper. All authors have read and agreed to the published version of the manuscript.

Funding

This study was supported by the Central Finance Forestry Science and Technology Promotion Demonstration Project (Demonstration and Promotion of Excellent Acacia Clones, NO. as 2020-GDTK–03). It was also funded by the Science Technology and Innovation Commission of Shenzhen Municipality (grants RCYX20200714114538196) and the Shenzhen Fundamental Research Program (grants JCYJ20220818103212025). This work was also funded by the Guangdong Pearl River Talent Program (grants 2021QN02N792) and the Innovation Program of Chinese Academy of Agricultural Sciences.

Institutional Review Board Statement

Not applicable.

Informed Consent Statement

Not applicable.

Data Availability Statement

The plastome sequences are available in the NCBI database, under accession numbers OR784304-OR784311.

Conflicts of Interest

The authors declare no conflicts of interest.

References

  1. Boland, D.J.; Brooker, M.I.H.; Chippendale, G.M.; Hall, N.; Hyland, B.P.M.; Johnston, R.D.; Kleinig, D.A.; McDonald, M.W.; Turner, J.D. Forest Trees of Australia, 4th ed.; CSIRO Agriculture & Food: Perth, Australia, 1984; pp. 147–167. [Google Scholar]
  2. Thiele, K.R.; Funk, V.A.; Iwatsuki, K.; Morat, P.; Peng, C.-I.; Raven, P.H.; Sarukhán, J.; Seberg, O. The controversy over the retypification of Acacia Mill. with an Australian type: A pragmatic view. Taxon 2011, 60, 194–198. [Google Scholar] [CrossRef]
  3. Chou, C.-H.; Fu, C.-Y.; Li, S.-Y.; Wang, Y.-F. Allelopathic Potential of Acacia confusa and Related Species in Taiwan. J. Chem. Ecol. 1998, 24, 2131–2150. [Google Scholar] [CrossRef]
  4. Luo, Y.; Li, D. Flora of China. J. Plant Classif. Resour. 2013, 6, 742810. [Google Scholar]
  5. Zhang, N. General review on the research development of Acacia spp. in China. Trop. For. 2015, 43, 41–45. [Google Scholar]
  6. Yang, M.Q. The Study on the Growth and Adaptability of Major Tropical Acacia in South China. For. Res. 1990, 3, 155–166. [Google Scholar]
  7. Cai, J.B.; Sun, Z.B.; Lu, R.X. Study on Drying Characteristic and Drying Technology for Rich Acaica Wood. China Wood Ind. 2002, 16, 25–30. [Google Scholar]
  8. Bradbury, G.; Potts, B.; Beadle, C. Genetic and environmental variation in wood properties of Acacia melanoxylon. Ann. For. Sci. 2011, 68, 1363–1373. [Google Scholar] [CrossRef]
  9. Nanjing, C. Kraft Pulping Properties Of Acacia Spp. Introduced From Australia. Chem. Ind. For. Prod. 1995, 15, 50–56. [Google Scholar]
  10. Kha L, D. The role of Acacia hybrids in the reforestation program in Vietnam. NFT News 2000, 3, 2. [Google Scholar]
  11. Huang, B.L. Primary Studies on Ndophytic Bacteria Isolated from Root Nodules of Acacia Confuse in Limestone Area. Master’s Thesis, Guangxi University, Nanning, China, 2009. [Google Scholar]
  12. Pregitzer, K.; Kubiske, M.; Yu, C.; Hendrick, R. Relationships among root branch order, carbon, and nitrogen in four temperate species. Oecologia 1997, 111, 302–308. [Google Scholar] [CrossRef] [PubMed]
  13. Timmis, J.N.; Ayliffe, M.A.; Huang, C.Y.; Martin, W. Endosymbiotic gene transfer: Organelle genomes forge eukaryotic chromosomes. Nat. Rev. Genet. 2004, 5, 123–135. [Google Scholar] [CrossRef] [PubMed]
  14. Wang, J.; Kan, S.; Liao, X.; Zhou, J.; Tembrock, L.R.; Daniell, H.; Jin, S.; Wu, Z. Plant organellar genomes: Much done, much more to do. Trends Plant Sci. 2024. [Google Scholar] [CrossRef] [PubMed]
  15. Archibald, J.M. Endosymbiosis and Eukaryotic Cell Evolution. Curr. Biol. 2015, 25, R911–R921. [Google Scholar] [CrossRef]
  16. Wicke, S.; Schneeweiss, G.M.; de Pamphilis, C.W.; Müller, K.F.; Quandt, D. The evolution of the plastid chromosome in land plants: Gene content, gene order, gene function. Plant Mol. Biol. 2011, 76, 273–297. [Google Scholar] [CrossRef] [PubMed]
  17. Palmer, J. Chloroplast DNA exists in two orientations. Nature 1983, 301, 92–93. [Google Scholar] [CrossRef]
  18. Jansen, R.K.; Raubeson, L.A.; Boore, J.L.; de Pamphilis, C.W.; Chumley, T.W.; Haberle, R.C.; Wyman, S.K.; Alverson, A.J.; Peery, R.; Herman, S.J.; et al. Methods for obtaining and analyzing whole chloroplast genome sequences. Methods Enzymol. 2005, 395, 348–384. [Google Scholar] [CrossRef]
  19. Wu, Z.; Tembrock, L.R.; Ge, S. Are differences in genomic data sets due to true biological variants or errors in genome assembly: An example from two chloroplast genomes. PLoS ONE 2015, 10, e0118019. [Google Scholar] [CrossRef]
  20. Xue, S.; Shi, T.; Luo, W.; Ni, X.; Iqbal, S.; Ni, Z.; Huang, X.; Yao, D.; Shen, Z.; Gao, Z. Comparative analysis of the complete chloroplast genome among Prunus mume, P. armeniaca, and P. salicina. Hortic. Res. 2019, 6, 89. [Google Scholar] [CrossRef]
  21. Abreu, N.; Alves, R.; Cardoso, S.; Yann, B.; Sousa, F.; Hall, C.; Pfeil, B.; Antonelli, A. The use of chloroplast genome sequences to solve phylogenetic incongruences in Polystachya Hook (Orchidaceae Juss). PeerJ 2018, 6, e4916. [Google Scholar] [CrossRef]
  22. Li, H.T.; Yi, T.S.; Gao, L.M.; Ma, P.F.; Zhang, T.; Yang, J.B.; Gitzendanner, M.A.; Fritsch, P.W.; Cai, J.; Luo, Y.; et al. Origin of angiosperms and the puzzle of the Jurassic gap. Nat. Plants 2019, 5, 461–470. [Google Scholar] [CrossRef]
  23. Jansen, R.K.; Cai, Z.; Raubeson, L.A.; Daniell, H.; Depamphilis, C.W.; Leebens-Mack, J.; Müller, K.F.; Guisinger-Bellian, M.; Haberle, R.C.; Hansen, A.K.; et al. Analysis of 81 genes from 64 plastid genomes resolves relationships in angiosperms and identifies genome-scale evolutionary patterns. Proc. Natl. Acad. Sci. USA 2007, 104, 19369–19374. [Google Scholar] [CrossRef] [PubMed]
  24. Xie, D.-F.; Yu, Y.; Deng, Y.-Q.; Li, J.; Liu, H.-Y.; Zhou, S.-D.; He, X.-J. Comparative Analysis of the Chloroplast Genomes of the Chinese Endemic Genus Urophysa and Their Contribution to Chloroplast Phylogeny and Adaptive Evolution. Int. J. Mol. Sci. 2018, 19, 1847. [Google Scholar] [CrossRef] [PubMed]
  25. Suo, Z.; Li, W.; Jin, X.; Hj, Z. A New Nuclear DNA Marker Revealing Both Microsatellite Variations and Single Nucleotide Polymorphic Loci: A Case Study on Classification of Cultivars in Lagerstroemia indica L. J. Microb. Biochem. Technol. 2016, 8, 266–271. [Google Scholar] [CrossRef]
  26. Wang, J.; Liao, X.; Gu, C.; Xiang, K.; Li, S.; Tembrock, L.R.; Wu, Z.; He, W. The Asian lotus (Nelumbo nucifera) pan-plastome: Diversity and divergence in a living fossil grown for seed, rhizome, and aesthetics. Ornam. Plant Res. 2022, 2, 1–10. [Google Scholar] [CrossRef]
  27. Wang, J.; Liao, X.; Li, Y.; Ye, Y.; Xing, G.; Kan, S.; Nie, L.; Li, S.; Tembrock, L.R.; Wu, Z. Comparative Plastomes of Curcuma alismatifolia (Zingiberaceae) Reveal Diversified Patterns among 56 Different Cut-Flower Cultivars. Genes 2023, 14, 1743. [Google Scholar] [CrossRef]
  28. Chen, S.; Zhou, Y.; Chen, Y.; Gu, J. fastp: An ultra-fast all-in-one FASTQ preprocessor. Bioinformatics 2018, 34, i884–i890. [Google Scholar] [CrossRef]
  29. Li, H. Aligning sequence reads, clone sequences and assembly contigs with BWA-MEM. arXiv 2013, arXiv:1303.3997. [Google Scholar]
  30. Li, H.; Durbin, R. Fast and accurate short read alignment with Burrows-Wheeler transform. Bioinformatics 2009, 25, 1754–1760. [Google Scholar] [CrossRef]
  31. Prjibelski, A.; Antipov, D.; Meleshko, D.; Lapidus, A.; Korobeynikov, A. Using SPAdes De Novo Assembler. Curr. Protoc. Bioinform. 2020, 70, e102. [Google Scholar] [CrossRef]
  32. Wick, R.R.; Schultz, M.B.; Zobel, J.; Holt, K.E. Bandage: Interactive visualization of de novo genome assemblies. Bioinformatics 2015, 31, 3350–3352. [Google Scholar] [CrossRef]
  33. Qu, X.-J.; Moore, M.J.; Li, D.-Z.; Yi, T.-S. PGA: A software package for rapid, accurate, and flexible batch annotation of plastomes. Plant Methods 2019, 15, 50. [Google Scholar] [CrossRef]
  34. Greiner, S.; Lehwark, P.; Bock, R. OrganellarGenomeDRAW (OGDRAW) version 1.3.1: Expanded toolkit for the graphical visualization of organellar genomes. Nucleic Acids Res. 2019, 47, W59–W64. [Google Scholar] [CrossRef]
  35. Kurtz, S.; Choudhuri, J.V.; Ohlebusch, E.; Schleiermacher, C.; Stoye, J.; Giegerich, R. REPuter: The manifold applications of repeat analysis on a genomic scale. Nucleic Acids Res. 2001, 29, 4633–4642. [Google Scholar] [CrossRef] [PubMed]
  36. Beier, S.; Thiel, T.; Münch, T.; Scholz, U.; Mascher, M. MISA-web: A web server for microsatellite prediction. Bioinformatics 2017, 33, 2583–2585. [Google Scholar] [CrossRef] [PubMed]
  37. Frazer, K.A.; Pachter, L.; Poliakov, A.; Rubin, E.M.; Dubchak, I. VISTA: Computational tools for comparative genomics. Nucleic Acids Res. 2004, 32, W273–W279. [Google Scholar] [CrossRef] [PubMed]
  38. Brudno, M.; Do, C.B.; Cooper, G.M.; Kim, M.F.; Davydov, E.; Green, E.D.; Sidow, A.; Batzoglou, S. LAGAN and Multi-LAGAN: Efficient tools for large-scale multiple alignment of genomic DNA. Genome Res. 2003, 13, 721–731. [Google Scholar] [CrossRef] [PubMed]
  39. Notredame, C.; Higgins, D.G.; Heringa, J. T-Coffee: A novel method for fast and accurate multiple sequence alignment. J. Mol. Biol. 2000, 302, 205–217. [Google Scholar] [CrossRef] [PubMed]
  40. Sharp, P.M.; Li, W.-H. The codon adaptation index-a measure of directional synonymous codon usage bias, and its potential applications. Nucleic Acids Res. 1987, 15, 1281–1295. [Google Scholar] [CrossRef] [PubMed]
  41. Katoh, K.; Misawa, K.; Kuma, K.; Miyata, T. MAFFT: A novel method for rapid multiple sequence alignment based on fast Fourier transform. Nucleic Acids Res. 2002, 30, 3059–3066. [Google Scholar] [CrossRef]
  42. Katoh, K.; Standley, D.M. MAFFT multiple sequence alignment software version 7: Improvements in performance and usability. Mol. Biol. Evol. 2013, 30, 772–780. [Google Scholar] [CrossRef]
  43. Capella-Gutiérrez, S.; Silla-Martínez, J.M.; Gabaldón, T. trimAl: A tool for automated alignment trimming in large-scale phylogenetic analyses. Bioinformatics 2009, 25, 1972–1973. [Google Scholar] [CrossRef]
  44. Minh, B.Q.; Schmidt, H.A.; Chernomor, O.; Schrempf, D.; Woodhams, M.D.; von Haeseler, A.; Lanfear, R. IQ-TREE 2: New Models and Efficient Methods for Phylogenetic Inference in the Genomic Era. Mol. Biol. Evol. 2020, 37, 1530–1534. [Google Scholar] [CrossRef]
  45. Liao, X.; Ye, Y.; Zhang, X.; Peng, D.; Hou, M.; Fu, G.; Tan, J.; Zhao, J.; Jiang, R.; Xu, Y.; et al. The genomic and bulked segregant analysis of Curcuma alismatifolia revealed its diverse bract pigmentation. aBIOTECH 2022, 3, 178–196. [Google Scholar] [CrossRef]
  46. Yang, Z. PAML 4: Phylogenetic Analysis by Maximum Likelihood. Mol. Biol. Evol. 2007, 24, 1586–1591. [Google Scholar] [CrossRef] [PubMed]
  47. Hong, Z.; Liao, X.; Ye, Y.; Zhang, N.; Yang, Z.; Zhu, W.; Gao, W.; Sharbrough, J.; Tembrock, L.R.; Xu, D.; et al. A complete mitochondrial genome for fragrant Chinese rosewood (Dalbergia odorifera, Fabaceae) with comparative analyses of genome structure and intergenomic sequence transfers. BMC Genom. 2021, 22, 672. [Google Scholar] [CrossRef] [PubMed]
  48. Gao, L.Z.; Liu, Y.L.; Zhang, D.; Li, W.; Gao, J.; Liu, Y.; Li, K.; Shi, C.; Zhao, Y.; Zhao, Y.J.; et al. Evolution of Oryza chloroplast genomes promoted adaptation to diverse ecological habitats. Commun. Biol. 2019, 2, 278. [Google Scholar] [CrossRef]
  49. Zhang, X.; Sun, Y.; Landis, J.B.; Lv, Z.; Shen, J.; Zhang, H.; Lin, N.; Li, L.; Sun, J.; Deng, T.; et al. Plastome phylogenomic study of Gentianeae (Gentianaceae): Widespread gene tree discordance and its association with evolutionary rate heterogeneity of plastid genes. BMC Plant Biol. 2020, 20, 340. [Google Scholar] [CrossRef] [PubMed]
  50. Mishler, B.D.; Knerr, N.; Gonzalez-Orozco, C.E.; Thornhill, A.H.; Laffan, S.W.; Miller, J.T. Phylogenetic measures of biodiversity and neo- and paleo-endemism in Australian Acacia. Nat. Commun. 2014, 5, 4473. [Google Scholar] [CrossRef] [PubMed]
  51. Williams, A.V.; Miller, J.T.; Small, I.; Nevill, P.G.; Boykin, L.M. Integration of complete chloroplast genome sequences with small amplicon datasets improves phylogenetic resolution in Acacia. Mol. Phylogenet. Evol. 2016, 96, 1–8. [Google Scholar] [CrossRef] [PubMed]
  52. Brázda, V.; Lýsek, J.; Bartas, M.; Fojta, M. Complex Analyses of Short Inverted Repeats in All Sequenced Chloroplast DNAs. Biomed Res. Int. 2018, 2018, 1097018. [Google Scholar] [CrossRef] [PubMed]
  53. Saltonstall, K.; Lambertini, C. The value of repetitive sequences in chloroplast DNA for phylogeographic inference: A comment on Vachon & Freeland 2011. Mol. Ecol. Resour. 2012, 12, 581–585, discussion 586–589. [Google Scholar] [CrossRef] [PubMed]
  54. Zhang, Z.R.; Yang, X.; Li, W.Y.; Peng, Y.Q.; Gao, J. Comparative chloroplast genome analysis of Ficus (Moraceae): Insight into adaptive evolution and mutational hotspot regions. Front. Plant Sci. 2022, 13, 965335. [Google Scholar] [CrossRef] [PubMed]
Figure 1. The plastome structure of A. melanoxylon. Genes mapped outside the outer circle are transcribed counterclockwise, and those insides are transcribed clockwise. Genes are color coded by functional group. The LSC (large single-copy region), SSC (small single-copy region), and the IRA and IRB (inverted repeats) are indicated on the inner circle along with GC content in dark gray and AT content in lighter gray. * indicates gene-containing intron (s).
Forests 15 00306 g001
Figure 2. Nucleotide substitution rates among 74 chloroplast protein-coding genes in Acacia by functional category.
Forests 15 00306 g002
Figure 3. Comparison of junctions between the LSC, SSC, and IR regions among eight newly assembled Acacia species and two outgroup species. Figure is not to scale. (LSC: large single-copy, SSC: small single-copy, IR: inverted repeat). The numbers above the vertical lines at the junctions indicate the distance in bp from the start of the plastome and the numbers below indicate the length of the IGS between genes at each junction.
Forests 15 00306 g003
Figure 4. Phylogenetic tree of Acacia plastomes based on the protein sequence alignment of 77 genes. Numbers at nodes indicate the ultrafast bootstrap values generated using IQ-TREE. Capital letters indicate grouping information, referenced in Williams et al., 2016 [51].
Forests 15 00306 g004
Figure 5. Plastome repeats identified with REPuter include C (Complement), F (forward repeats), R (reversed repeats), and P (palindromic repeats) from 111 plastomes.
Forests 15 00306 g005
Figure 6. Sequence identity among coding and non-coding regions based on the alignment of 111 plastomes. Lower scores equate to greater divergence and the y axis relates to genomic position.
Forests 15 00306 g006
Table 1. Summary of the plastomes sequenced for this study.
GB IDSpecies TLGenestRNArRNAGCLSCIRBSSCIRA
seq1Acacia melanoxylon177,5177730435.33%90,99640,813489540,813
seq2Acacia mangium176,0857730435.37%92,17239,482494939,482
seq3A. mangium × A. auriculiformis176,6587730435.32%91,99139,859494939,859
seq4Acacia auriculiformis176,2827730435.38%91,63839,859492639,859
seq5Acacia confusa176,2557730435.45%90,72240,243504740,243
seq6Acacia aulacocarpa176,5157730435.34%91,87139,859492639,859
seq7Acacia cincinnata174,3117730435.66%90,32539,560486639,560
seq8Acacia crassicarpa176,6597730435.38%91,22040,197504540,197
Disclaimer/Publisher’s Note: The statements, opinions and data contained in all publications are solely those of the individual author(s) and contributor(s) and not of MDPI and/or the editor(s). MDPI and/or the editor(s) disclaim responsibility for any injury to people or property resulting from any ideas, methods, instructions or products referred to in the content.

