
Kinshasa Province (Democratic Republic of Congo): Typology of Peri-Urban Ecosystems Providing Edible Insects
 , , ,
, , ,
Abstract
:1. Introduction
2. Material and Methods
2.1. Presentation of the Study Framework
2.2. Site Sampling and Data Collection
Data Analysis
3. Results
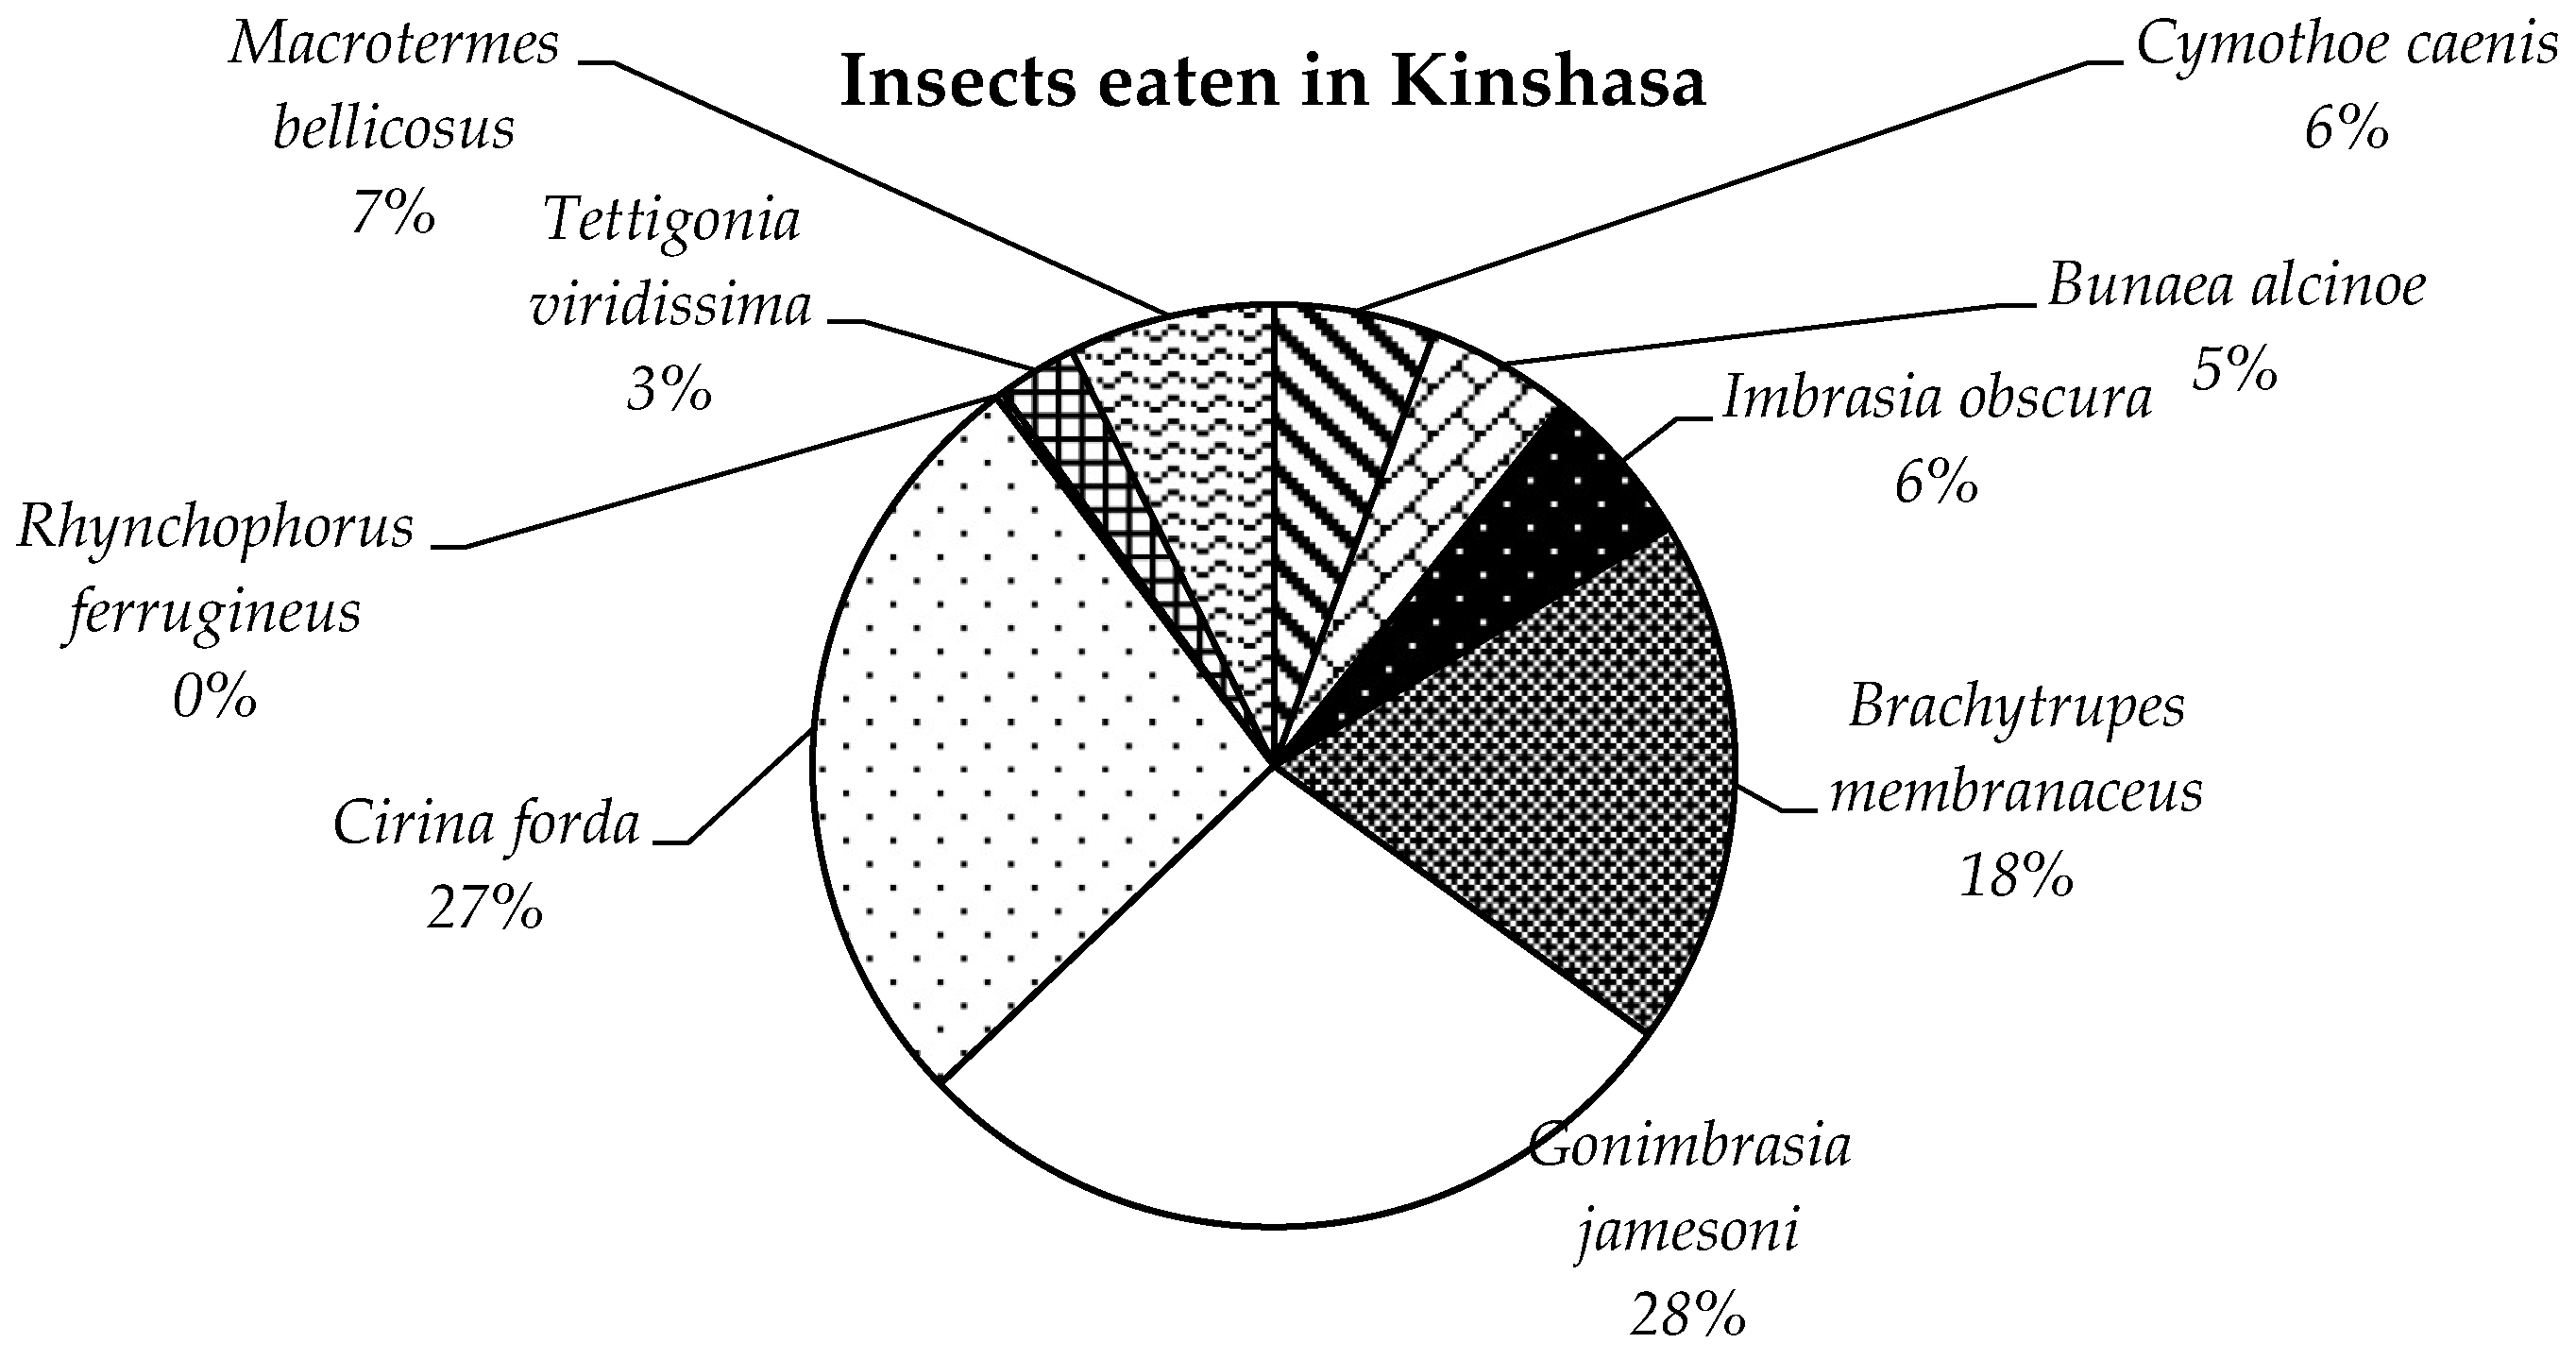
3.1. Entomophagic Assessment in Kinshasa
3.2. Structure of Forest Stands
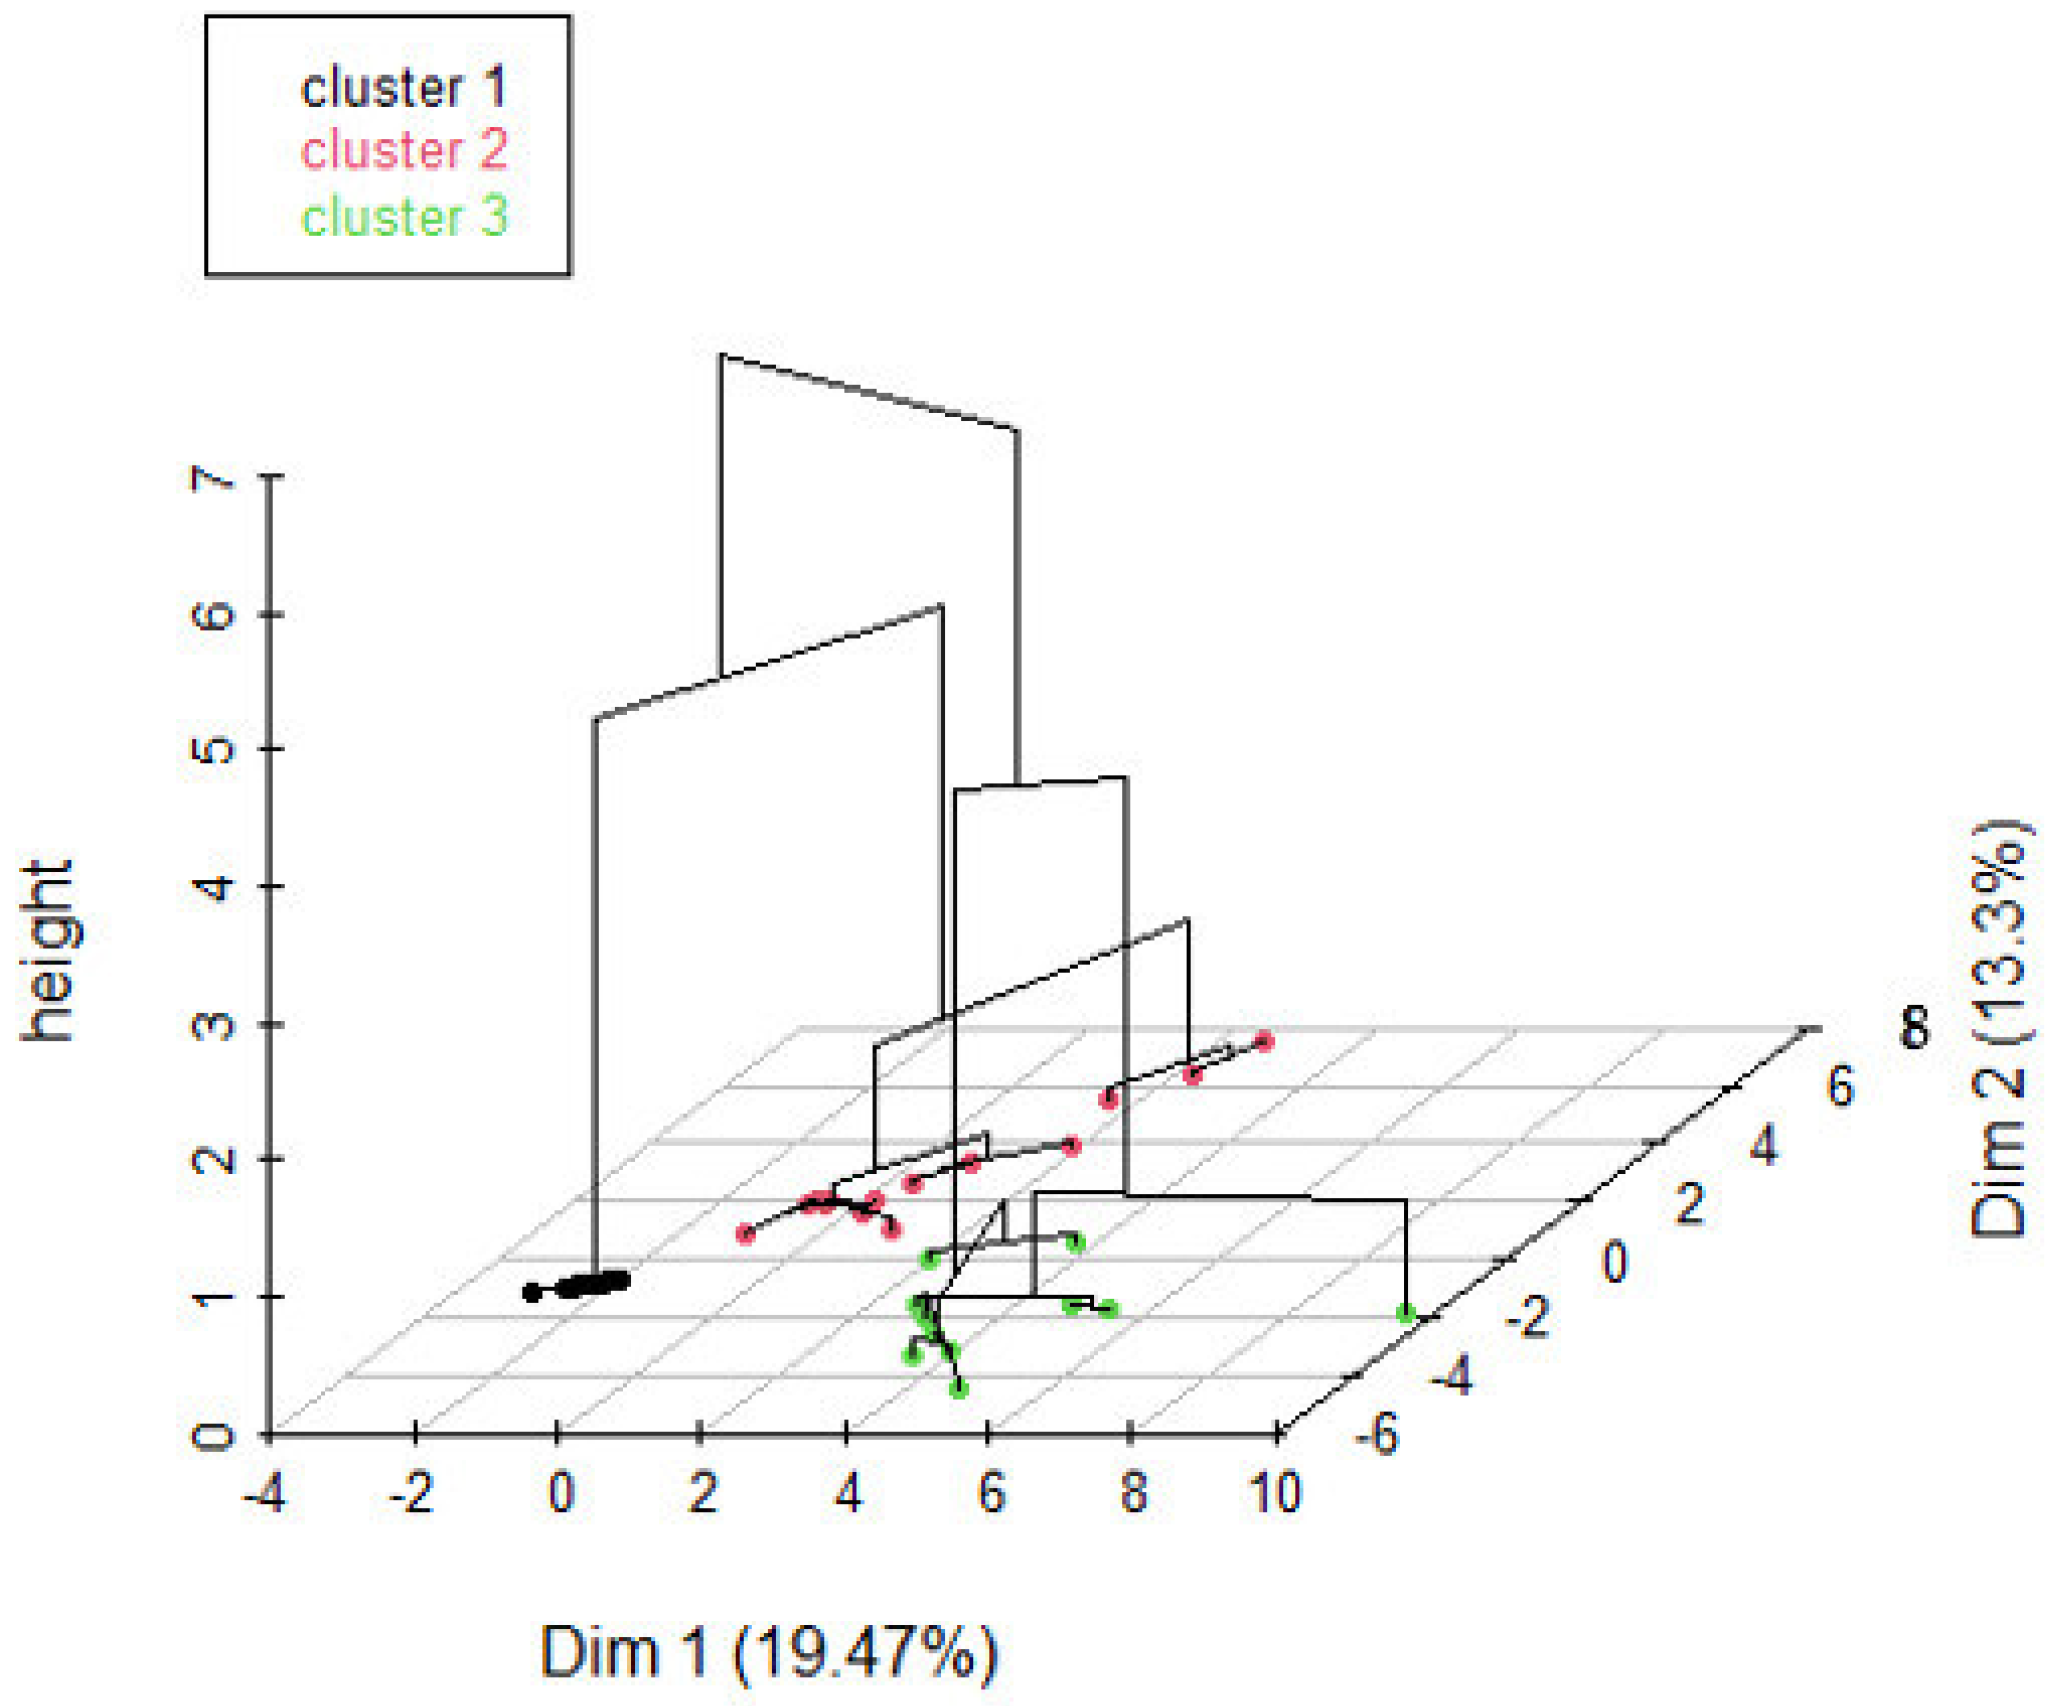
3.2.1. Typology of Identified Forest Stands
- -
- high values for the variables A. auriculiformis and A. mangium (from the most extreme to the least extreme);
- -
- low values for variables such as M. laurentii, Oncoba welwitschii, Lannea welwitschii, Cassia spectabilis, Dracaena mannii, Markhamia tomentosa, Strychnos variabilis, Voacanga africana, M. eetveldeana, and Bosqueopsis gilettii (from the most extreme to least extreme).
- -
- high values for variables such as M. laurentii, C. spectabilis, O. welwitschii, Vitex welwitschii, Mangifera indica, V. congolensis, L. welwitschii, Persea americana, Lagerstroemia speciosa, and Delonix regia (from the most extreme to the least extreme).
- -
- low values for the variables A. auriculiformis and A. mangium (from the most extreme to least extreme).
- -
- high values for variables such as V. africana, Bosqueopsis gilettii, Trichilia gilletii, M. eetveldeana, Hymenocardia ulmoides, Dracaena mannii, Psydrax palma, M. drastica, Macaranga monandra, and Gaertnera paniculata (from the most extreme to least extreme).
- -
- low values for the variables A. auriculiformis and A. mangium (from the most extreme to least extreme).
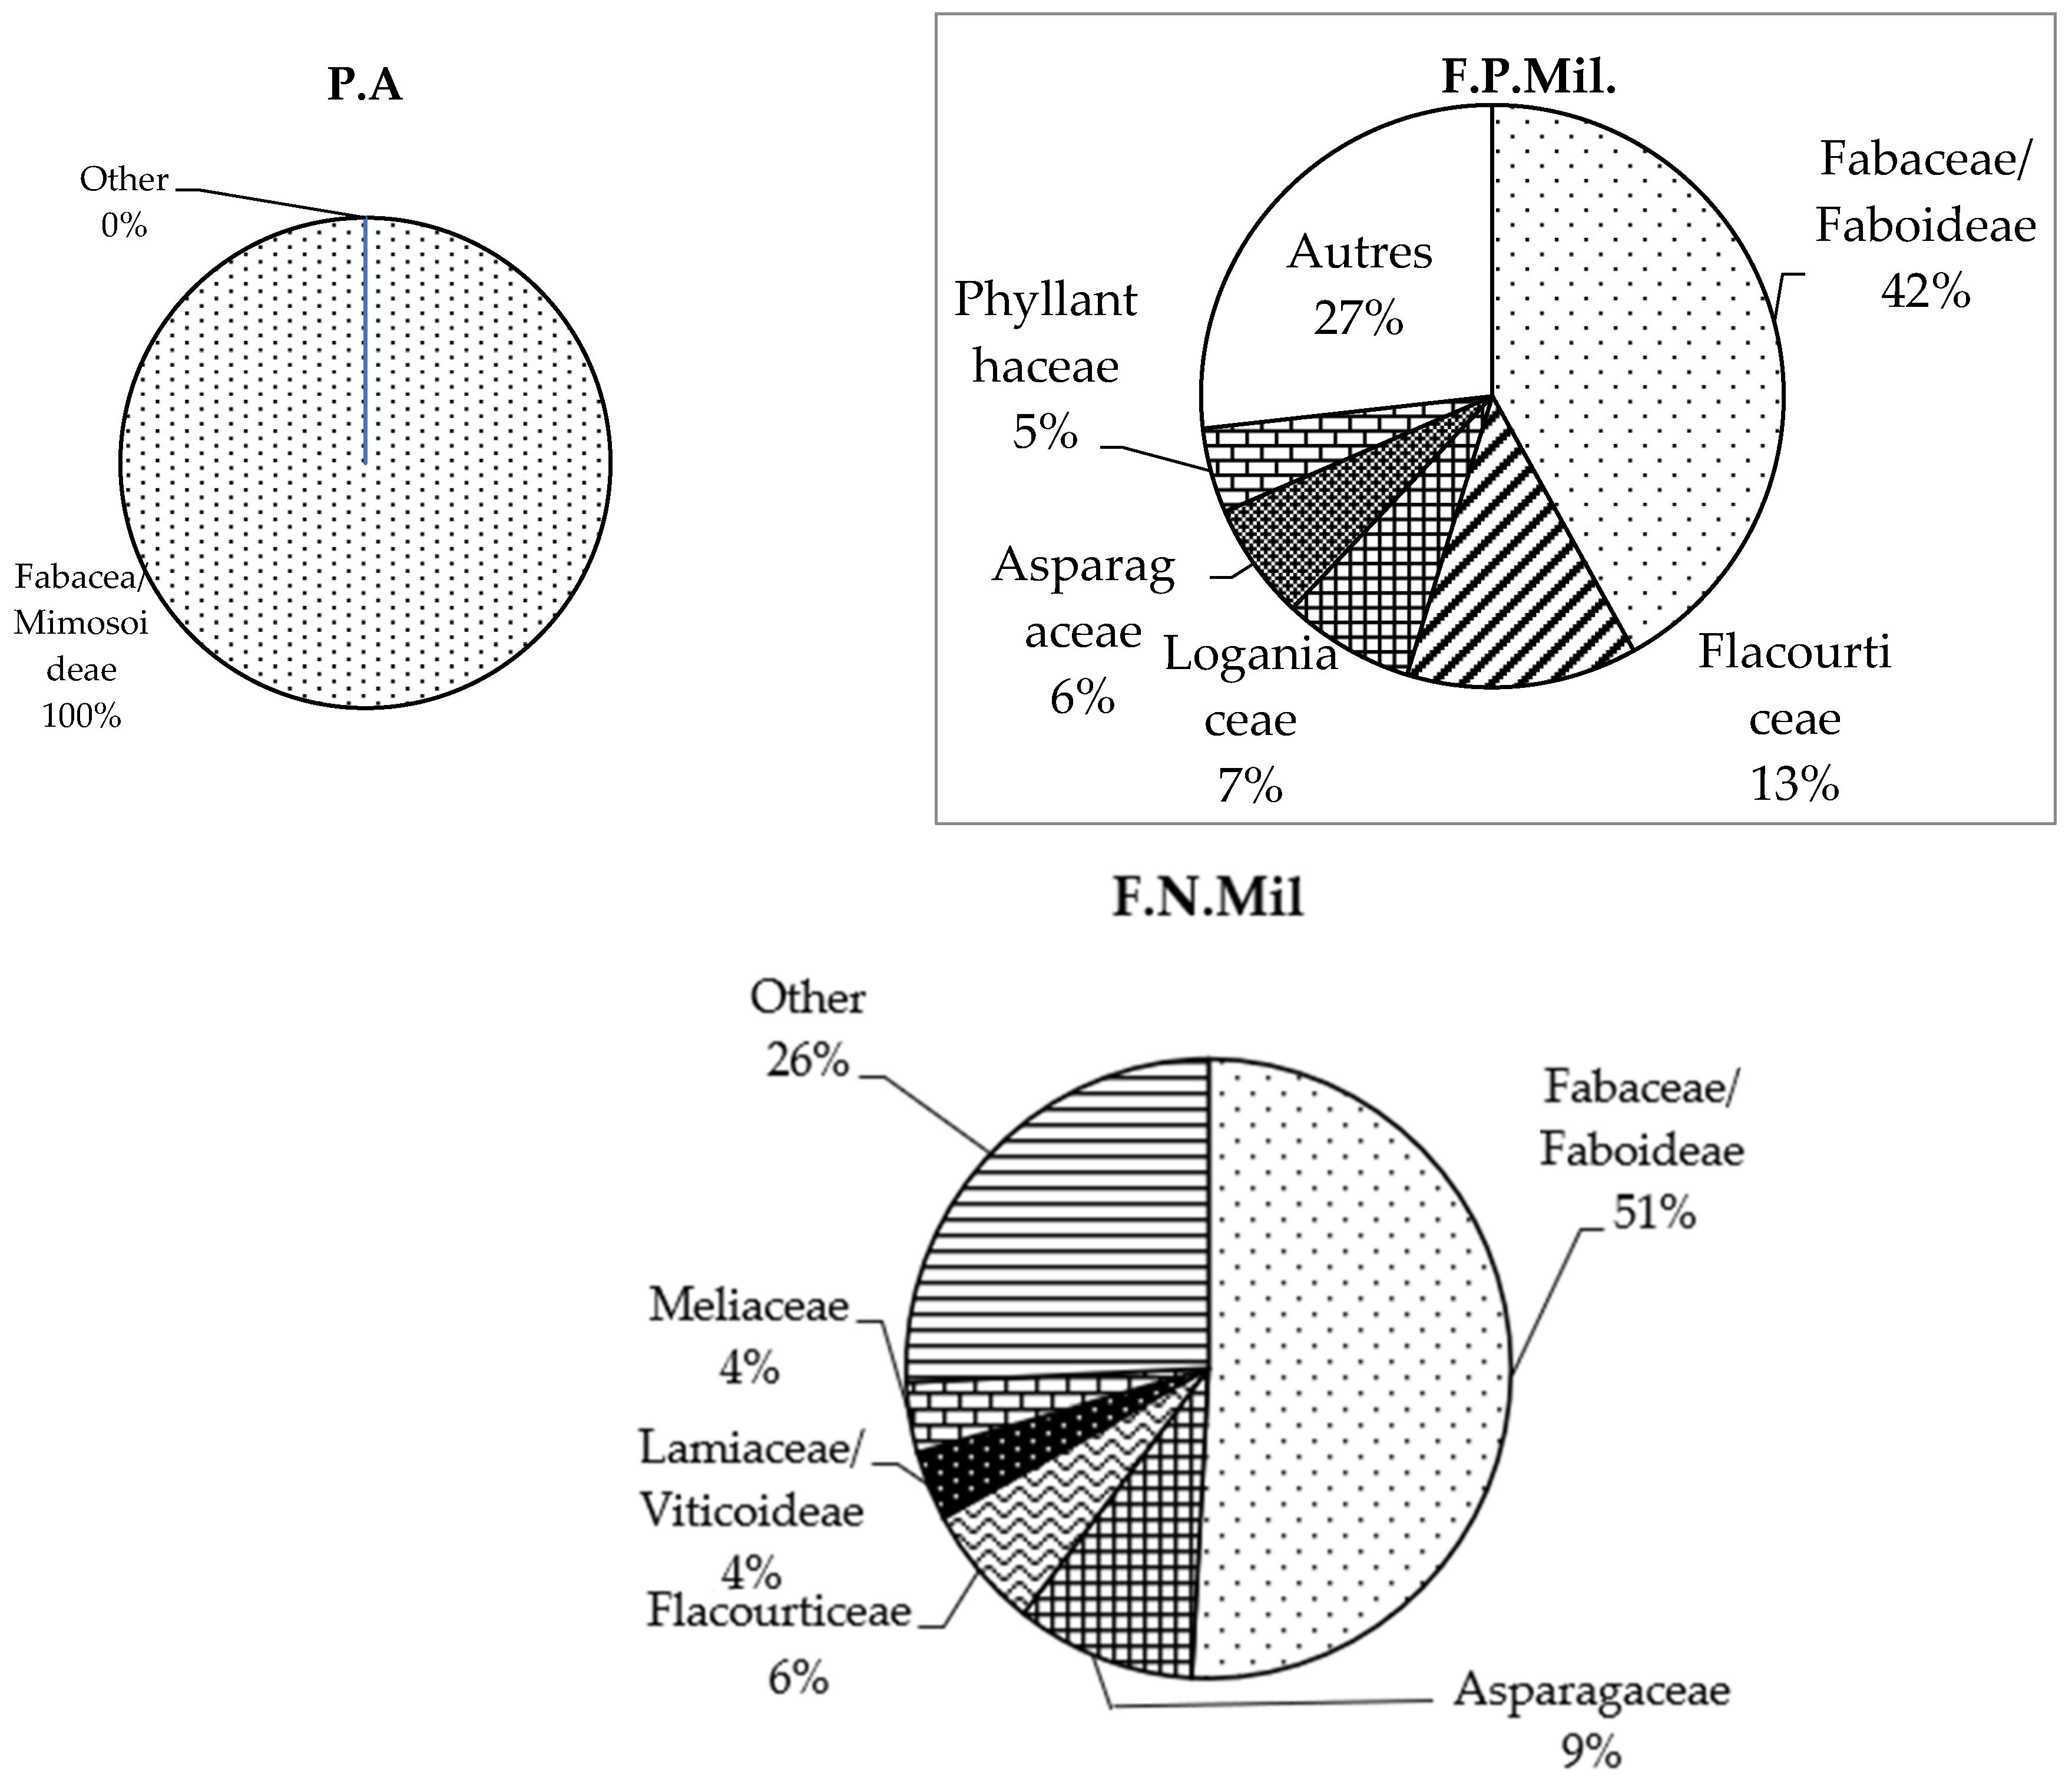
3.2.2. Floristic Report
3.2.3. Structural Characteristics of Forest Stands Identified
- Density and basal area
- b.
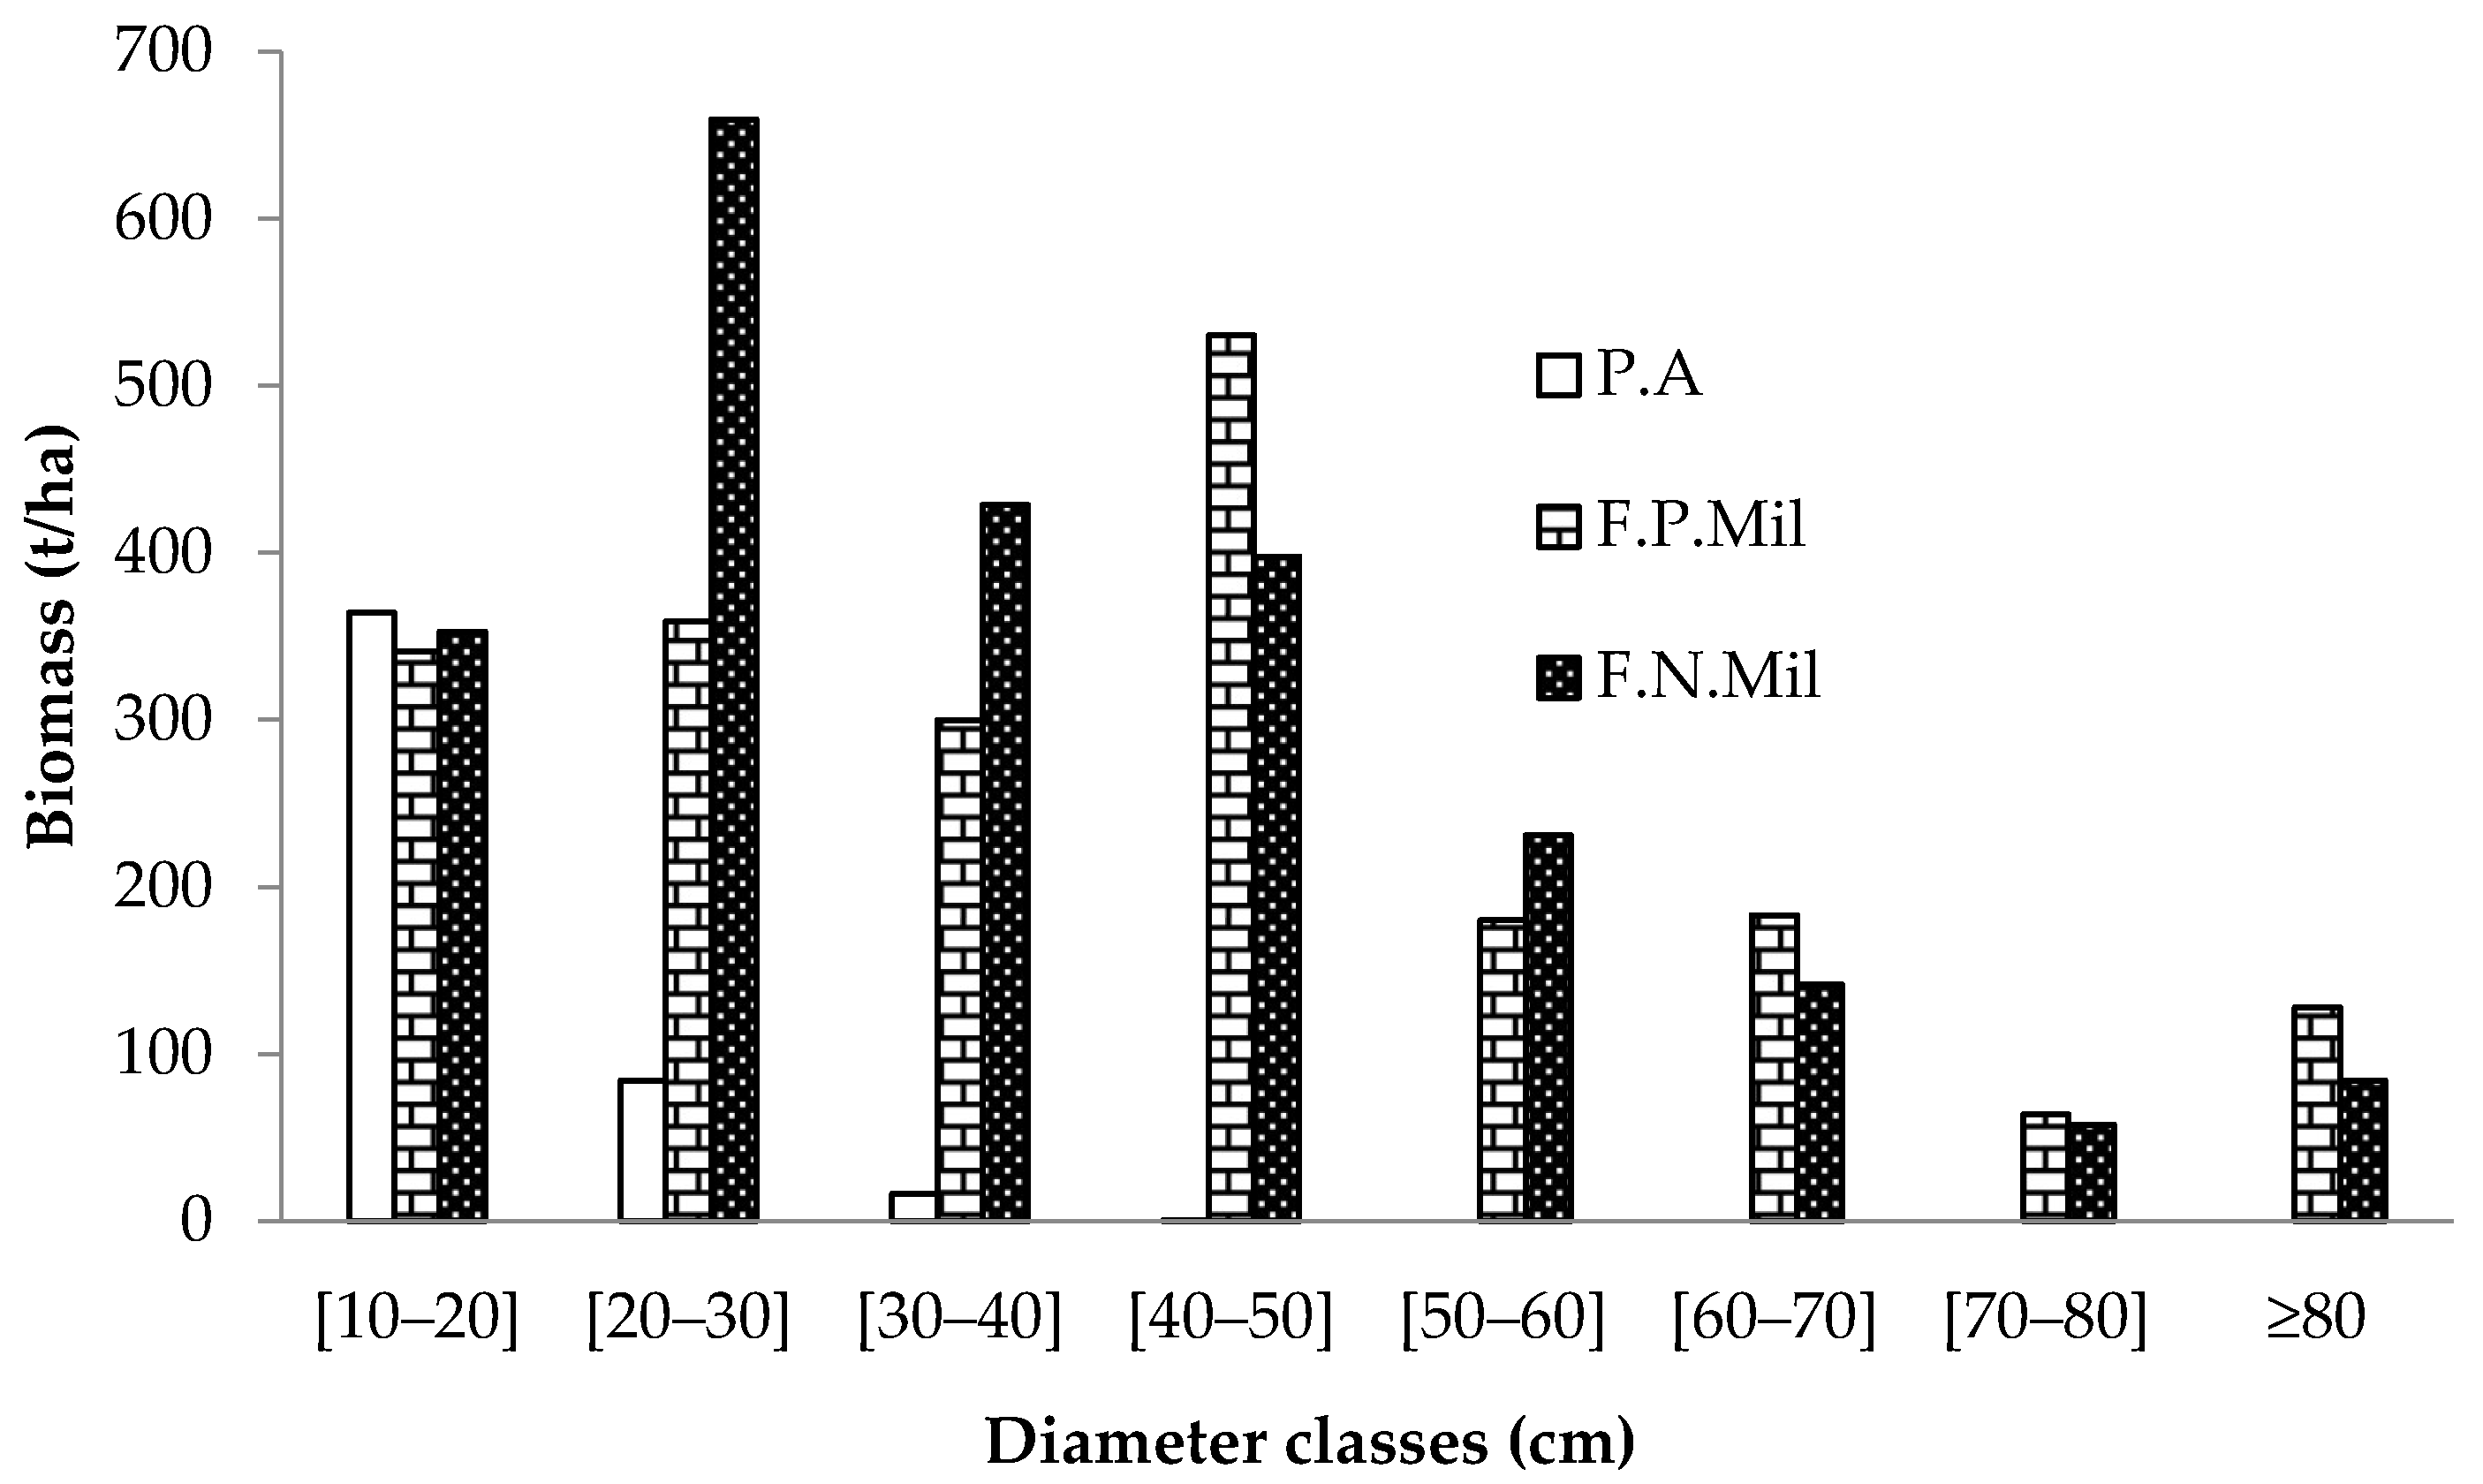
- Diametric structure
- c.
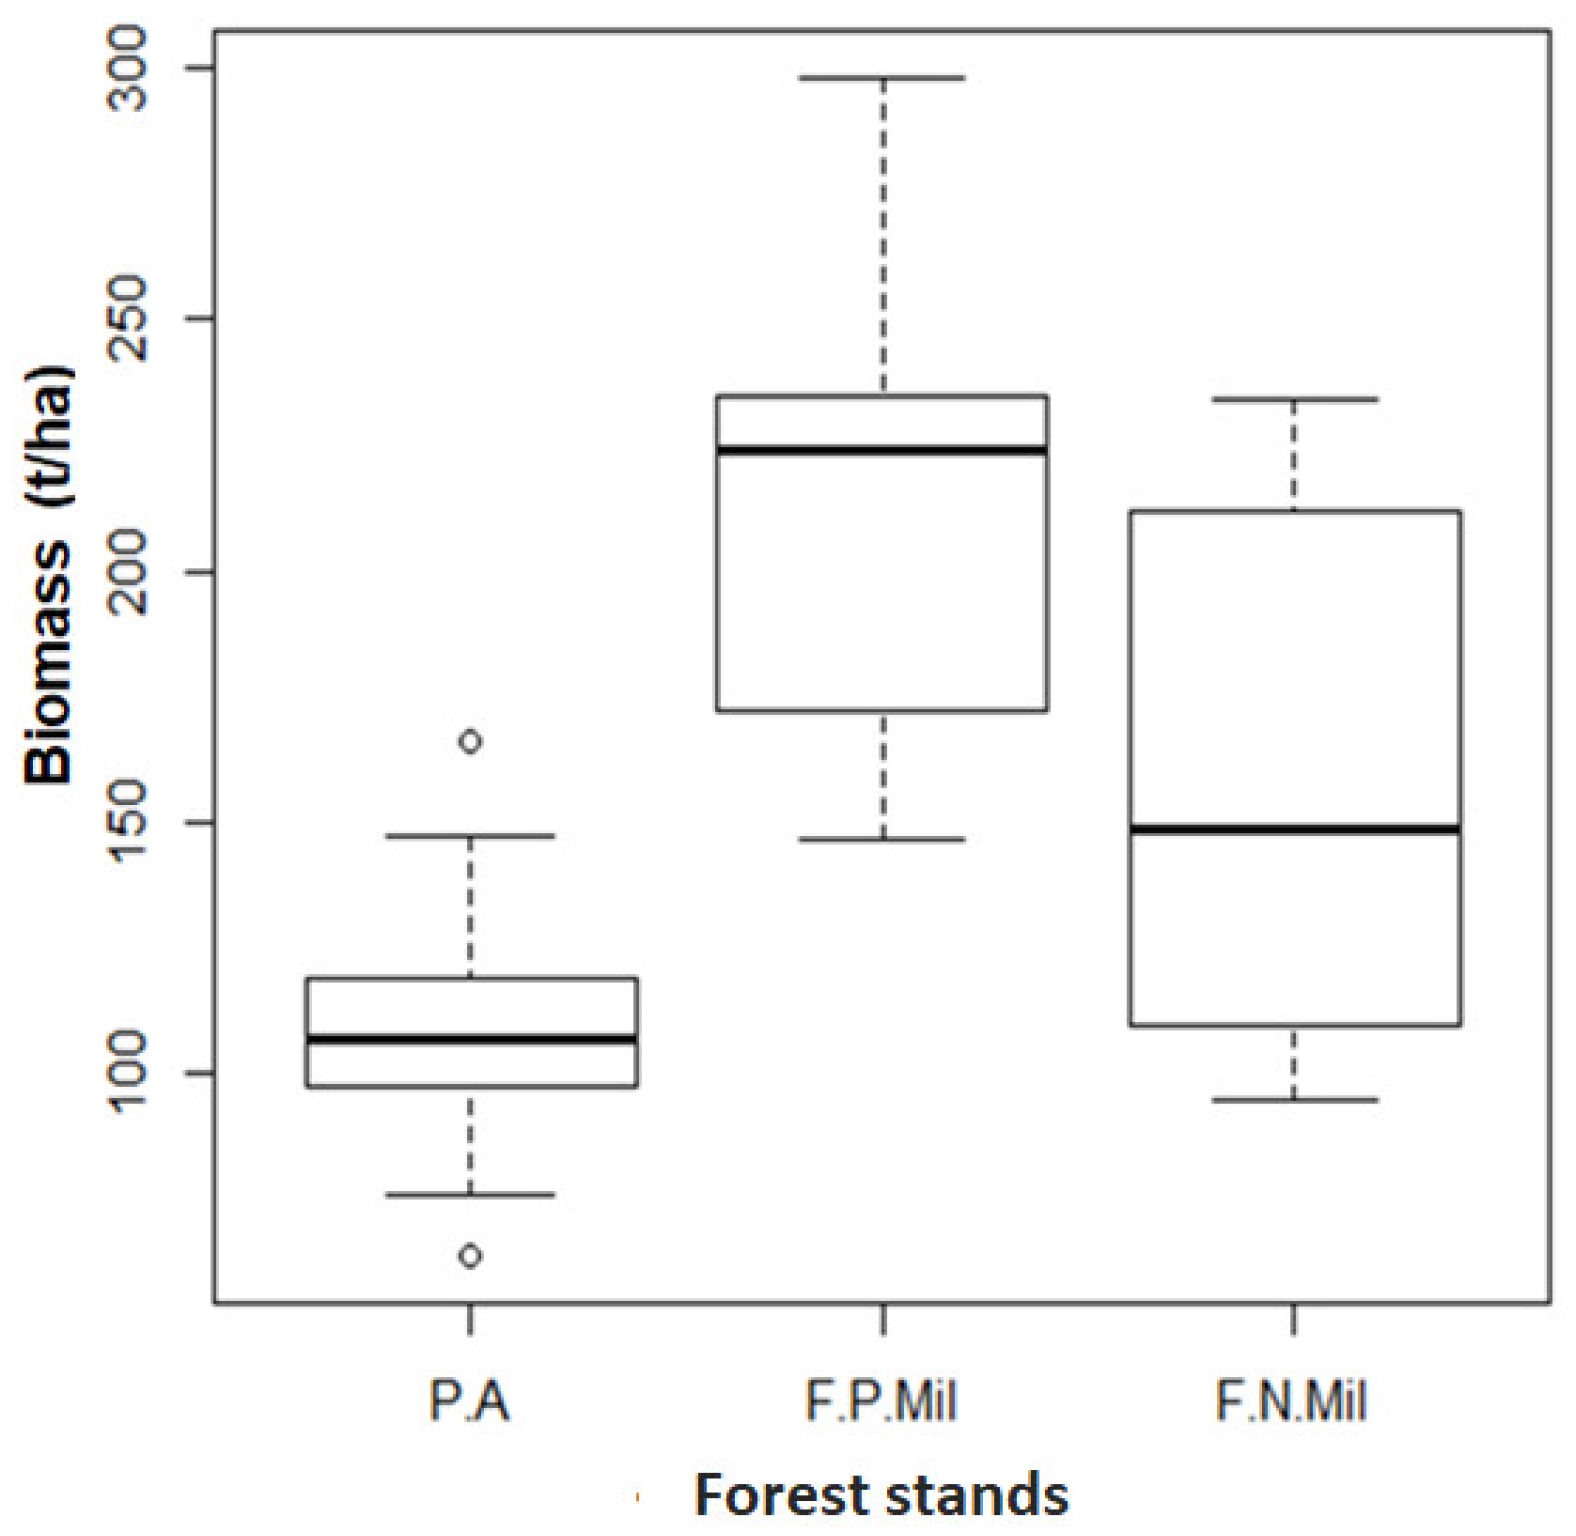
- Biomass estimation
- ✓
- Biomass distribution in the different plant strata of forest formations
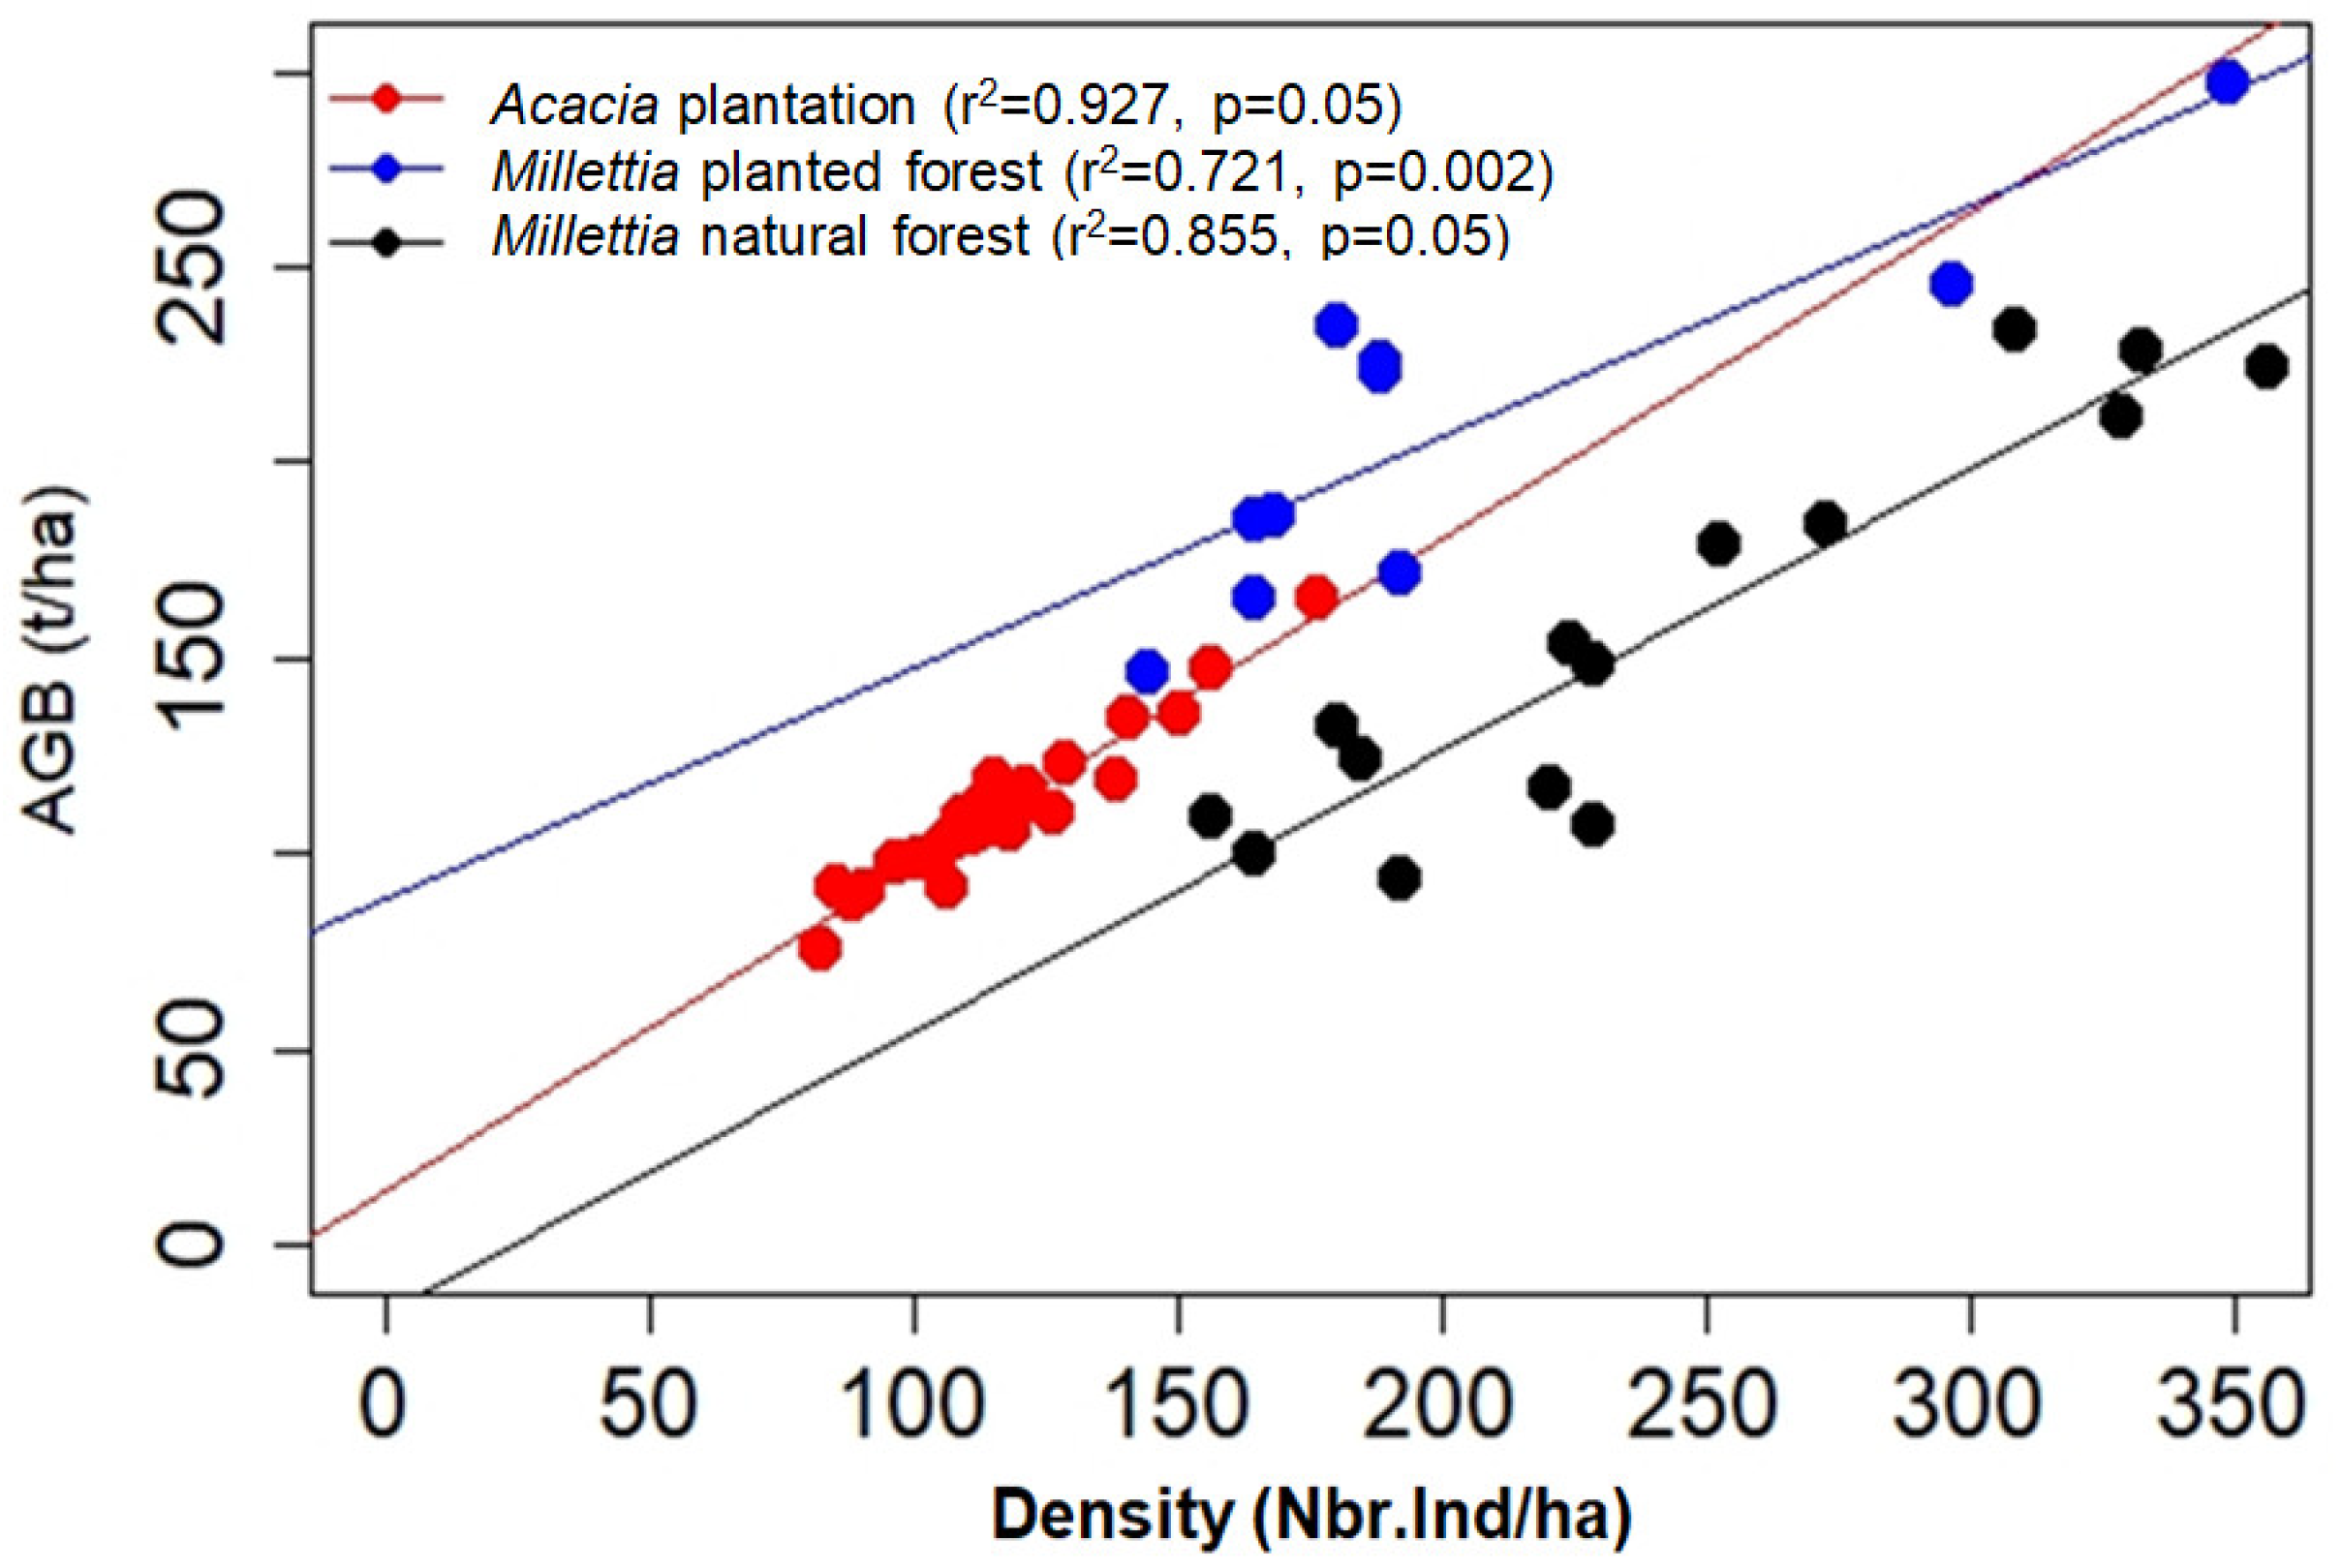
3.3. Correlation Studies
4. Discussions
4.1. Supply of Consumed Insects to the Province of Kinshasa and Hyper-Entomophagy in Kinshasa
4.2. Floristic and Structural Variability in Forest Stands
4.3. Basal Area-Specific Richness, Biomass-Specific Richness, Biomass Density, Biomass and Basal Area
5. Conclusions
Author Contributions
Funding
Institutional Review Board Statement
Informed Consent Statement
Data Availability Statement
Acknowledgments
Conflicts of Interest
References
- Newman, P.; Jennings, I. Cities as Sustainable Ecosystems: Principles and Practices; Island Press: Washington, DC, USA, 2012. [Google Scholar]
- Rakotondrasoa, O.L.; Ayral, A.; Stein, J.; Rajoelison, G.L.; Ponette, Q.; Malaisse, F.; Ramamonjisoa, B.S.; Raminosoa, N.; Verheggen, F.J.; Poncelet, M.; et al. Analysis of Anthropogenic Factors of Degradation of Tapia Woods (Uapaca Bojeri) of Arivonimamo. In Les Vers à Soie Malgaches. Enjeux Écologiques et Socio-Économiques; Presses Agronomiques de Gembloux: Gembloux, Belgium, 2013. [Google Scholar]
- Lambin, E.F.; Geist, H.J.; Lepers, E. Dynamics of land-use and land-cover change in tropical regions. Annu. Rev. Environ. Resour. 2003, 28, 205–241. [Google Scholar] [CrossRef] [Green Version]
- Millenniuma Ssessment. 2005. Available online: http://www.millenniumassessment.org/en (accessed on 15 October 2021).
- Mehdi, L.; Weber, C.; Di Pietro, F.; Selmi, W. Evolution of the place of plants in the city, from green space to green fabric. VertigO 2012, 12, 12670. [Google Scholar]
- Frédéric, F.; Sasson, A. (Eds.) Ecosystèmes Forestiers Tropicaux d’Afrique; Recherches sur les Ressources Naturelles; ORSTOM: Paris, France, 1983; Volume 19, p. 475. ISBN 92-3-202041-6. [Google Scholar]
- Torti, S.D.; Coley, P.D.; Kursar, T.A. Causes and consequences of monodominance in tropical lowland forests. Am. Nat. 2001, 157, 141–153. [Google Scholar] [CrossRef]
- Mavunda, C.A.; Kanda, M.; Folega, F.; Egbelou, V.; Bosela, F.B.; Drazo, N.A.; Yoka, J.; Dourma, M.; Akpagana, K. Spatio-temporal dynamics of land cover changes under anthropogenic impact in the city of Kinshasa (DRC) from 2001 to 2021. Geo. Eco. Trop. 2022, 46, 137–148. [Google Scholar]
- Bolund, P.; Hunhammar, S. Ecosystem services in urban areas. Ecol. Econ. 1999, 29, 293–301. [Google Scholar] [CrossRef]
- Nagendra, H.; Gopal, D. Street trees in Bangalore: Density, diversity, composition and distribution. Urban For. Urban Greening 2010, 9, 129–137. [Google Scholar] [CrossRef]
- Ortega-Álvarez, R.; MacGregor-Fors, I. What matters most? Relative effect of urban habitat traits and hazards on urban park birds. Ornitol. Neotrop. 2010, 21, 519–533. [Google Scholar]
- Shackleton, S.; Chinyimba, A.; Hebinck, P.; Shackleton, C.; Kaoma, H. Multiple benefits and values of trees in urban landscapes in two towns in northern South Africa. Landsc. Urban Plan. 2015, 136, 76–86. [Google Scholar] [CrossRef]
- Mavunda, C.A.; Bosela, F.B.; Djomo, A.; Mukiranya, J.K. Biodiversity and carbon stocks in the different forest stands of Isangi, DR Congo. Int. J. Innov. Appl. Stud. 2019, 26, 1180–1192. [Google Scholar]
- Mensah, J.T. Modelling demand for liquefied petroleum gas (LPG) in G hana: Current dynamics and forecast. OPEC Energy Rev. 2014, 38, 398–423. [Google Scholar] [CrossRef]
- Etshekape, P.G.; Atangana, A.R.; Khasa, D.P. Tree planting in urban and peri-urban of Kinshasa: Survey of factors facilitating agroforestry adoption. Urban For. Urban Green. 2018, 30, 12–23. [Google Scholar] [CrossRef]
- Toit, M.J.D.; Cilliers, S.S.; Dallimer, M.; Goddard, M.; Guenat, S.; Cornelius, S.F. Urban green infrastructure and ecosystem services in sub-Saharan Africa. Landsc. Urban Plan. 2018, 180, 249–261. [Google Scholar] [CrossRef]
- Sikuzani, Y.; Cabala, K.; Halleux, J.M.; Bogaert, J.; Munyemba, K. Characterization of the urban spatial growth of the city of Lubumbashi (Haut-Katanga, DR Congo) between 1989 and 2014. Tropicultura 2018, 38, 98–108. [Google Scholar]
- De Saint Moulin, L.; Kalombo, T. Atlas of the Administrative Organization of the Democratic Republic of Congo; Cepas: Tampa, FL, USA, 2005. [Google Scholar]
- Pourtier, R. Democratic Republic of Congo Facing the Demographic Challenge; Ifri: Paris, France, 2018. [Google Scholar]
- Kinyamba, S.S.; Nsenda, F.M.; Nonga, D.O.; Kaminar, T.M.; Mbalanda, W. Monograph of the City of Kinshasa; ICREDES: Kinshasa, Congo, 2015. [Google Scholar]
- Habari, M. Floristic, Phytogeographical and Phytosociological Study of the Vegetation of Kinshasa and the Middle Basins of the N’djili and N’sele Rivers in DR Congo. Ph.D. Thesis, University of Kinshasa, Kinshasa, Democratic Republic of Congo, 2009. [Google Scholar]
- Lebrun, J.-P.; Stork, A.L. Enumeration of Flowering Plants of Tropical Africa. 4 Gamopetals: Ericaceae to Lamiaceae; Conservatoire et Jardin Botaniques de la Ville de Genève: Geneva, Switzerland, 1997. [Google Scholar]
- Letouzey, R. Phytogeographic Study of Cameroon; CSAI: Wallingford, UK, 1968. [Google Scholar]
- Husson, F.; Lê, S.; Pagès, J. Analyse de Données Avec R; Presses Universitaires de Rennes: Rennes, France, 2016. [Google Scholar]
- Legendre, P.; Legendre, L. Numerical Ecology; Elsevier: Amsterdam, The Netherlands, 2012. [Google Scholar]
- Curtis, J.T.; Mcintosh, R.P. The interrelations of certain analytic and synthetic phytosociological characters. Ecology 1950, 31, 434–455. [Google Scholar] [CrossRef]
- Shannon, C.E. A mathematical theory of communication. Bell Syst. Tech. J. 1948, 27, 379–423. [Google Scholar] [CrossRef] [Green Version]
- Simpson, E. Measuring diversity. Nature 1949, 163, 688. [Google Scholar] [CrossRef]
- Leigh, E.G.; de Lao, S.L. Fisher’s Alpha: Measuring Tree Diversity; Center for Tropical Forest Science: Copenhagen, Denmark, 2000; pp. 7–12. [Google Scholar]
- Magurran, A.E. Why Diversity? Ecological Diversity and Its Measurement; Springer: Dordrecht, The Netherlands, 1988. [Google Scholar]
- Dourma, M.; Batawila, K.; Guelly, K.A.; Bellefontaine, R.; de Foucault, B.; Akpagana, K. The flora of open forests with Isoberlinia spp. in the Sudanian zone in Togo Running title: Flora of open forests with Isoberlinia. Acta Bot. Gallica 2012, 159, 395–409. [Google Scholar] [CrossRef]
- Troupin, G. Methods for the Quantitative Study of Vegetation; JSTOR: New York, NY, USA, 1971. [Google Scholar]
- Fayolle, A.; Ngomanda, A.; Mbasi, M.; Barbier, N.; Bocko, Y.; Boyemba, F.; Couteron, P.; Fonton, N.; Kamdem, N.; Katembo, J.; et al. A regional allometry for the Congo basin forests based on the largest ever destructive sampling. For. Ecol. Manag. 2018, 430, 228–240. [Google Scholar] [CrossRef]
- Chave, J.; Andalo, C.; Brown, S.; Cairns, M.A.; Chambers, J.Q.; Eamus, D.; Fölster, H.; Fromard, F.; Higuchi, N.; Kira, T.; et al. Tree allometry and improved estimation of carbon stocks and balance in tropical forests. Oecologia 2005, 145, 87–99. [Google Scholar] [CrossRef]
- Slik, J.F.; Arroyo-Rodríguez, V.; Aiba, S.I.; Alvarez-Loayza, P.; Alves, L.F.; Ashton, P.; Balvanera, P.; Bastian, M.L.; Bellingham, P.J.; Van Den Berg, E.; et al. An estimate of the number of tropical tree species. Proc. Natl. Acad. Sci. USA 2015, 112, 7472–7477. [Google Scholar] [CrossRef]
- Malaisse, F. Human consumption of Lepidoptera, termites, Orthoptera, and ants in Africa. In Ecological Implications of Minilivestock: Potential of Insects, Rodents, Frogs and Snails; Routledge: London, UK, 2005; pp. 175–230. [Google Scholar]
- Nsevolo, P.M. Contribution to the Study of Entomophagy in Kinshasa. Master’s Thesis, Académie Universitaire Louvain, Louvain, Belgium, 2012. [Google Scholar]
- Kelemu, S.; Niassy, S.; Torto, B.; Fiaboe, K.; Affognon, H.; Tonnang, H.; Maniania, N.K.; Ekesi, S. African edible insects for food and feed: Inventory, diversity, commonalities and contribution to food security. J. Insects Food Feed 2015, 1, 103–119. [Google Scholar] [CrossRef] [Green Version]
- Nshimba, S. Floristic, Ecological and Phytosociological Study of the Forests of Mbiyé Island in Kisangani, RD Congo. Ph.D. Thesis, Faculty of Sciences Free University of Brussels, Brussels, Belgium, 2008. [Google Scholar]
- Kouka, L.A. Research on the flora, structure and dynamics of forests in Odzala National Park. Acta Bot. Gallica 2002, 149, 225–235. [Google Scholar] [CrossRef] [Green Version]
- Sikuzani, Y.U.; Boisson, S.; Cabala Kaleba, S.; Nkuku Khonde, C.; Malaisse, F.; Halleux, J.M.; Bogaert, J.; Munyemba Kankumbi, F. Dynamique de l’occupation du sol autour des sites miniers le long du gradient urbain-rural de la ville de Lubumbashi, RD Congo, Biotechnol. Agron. Société Environ. Biotechnol. Agron. Société Environ. 2020, 24, 14–27. [Google Scholar]
- Condit, R.; Ashton, P.S.; Baker, P.; Bunyavejchewin, S.; Gunatilleke, S.; Gunatilleke, N.; Hubbell, S.P.; Foster, R.B.; Itoh, A.; LaFrankie, J.V.; et al. Spatial patterns in the distribution of tropical tree species. Science 2000, 288, 1414–1418. [Google Scholar] [CrossRef] [PubMed]
- Nkura, X.M.; Ayingweu, C.L.; Katula, H.B. Floristic and phytogeographical analysis of the ecosystems of Kimpolo I and its surroundings in Kinshasa (Democratic Republic of Congo). Int. J. Innov. Appl. Stud. 2018, 23, 355–364. [Google Scholar]
- Dede, Y.N. Inventory of the Urban Flora of Kisangani (PO/DR Congo); Universite de Kisangani: Kisangani, Democratic Republic of Congo, 2014. [Google Scholar]
- Folega, F. Urban forestry and atmospheric carbon sequestration potential in the urban and peri-urban area of Kpalimé (Togo). Rev. Sci. Environ. Univ. Lomé Togo. 2017, 14, 7–28. [Google Scholar]
- Lewis, S.L.; Sonké, B.; Sunderland, T.; Begne, S.K.; Lopez-Gonzalez, G.; Van Der Heijden, G.M.; Phillips, O.L.; Affum-Baffoe, K.; Baker, T.R.; Banin, L.; et al. Above-ground biomass and structure of 260 African tropical forests. Philos. Trans. R. Soc. B Biol. Sci. 2013, 368, 20120295. [Google Scholar] [CrossRef] [Green Version]
- Katembo, J.M.; Libalah, M.B.; Boyemba, F.B.; Dauby, G.; Barbier, N. Multiple stable dominance states in the Congo Basin forests. Forests 2020, 11, 553. [Google Scholar] [CrossRef]
- Bastin, J.-F.; Barbier, N.; Réjou-Méchain, M.; Fayolle, A.; Gourlet-Fleury, S.; Maniatis, D.; De Haulleville, T.; Baya, F.; Beeckman, H.; Beina, D.; et al. Seeing Central African forests through their largest trees. Sci. Rep. 2015, 5, 13156. [Google Scholar] [CrossRef] [Green Version]


| P.A | ||||
|---|---|---|---|---|
| Species Name | AbRel (N/ha) | DoRel (m2/ha) | FR (%) | IVI |
| Acacia auriculiformis | 73.63 | 64.66 | 50 | 188.30 |
| Acacia mangium | 26.37 | 35.34 | 50 | 111.70 |
| F.P.Mil | ||||
| Millettia laurentii | 35.43 | 48.09 | 9.52 | 93.04 |
| Oncoba welwitschii | 12.80 | 3.50 | 8.57 | 24.86 |
| Dracaena mannii | 6.50 | 12.79 | 4.76 | 24.05 |
| Millettia eetveldeana | 5.71 | 4.87 | 3.81 | 14.38 |
| Anthocleista schweinfurthii | 6.50 | 1.38 | 5.71 | 13.59 |
| F.N.Mil | ||||
| Millettia laurentii | 41.50 | 41.97 | 9.49 | 92.96 |
| Dracaena mannii | 9.60 | 13.98 | 6.33 | 29.91 |
| Oncoba welwitschii | 7.06 | 2.44 | 7.59 | 17.10 |
| Trichilia gilletii | 3.86 | 6.24 | 5.06 | 15.16 |
| Millettia drastica | 4.64 | 6.18 | 3.80 | 14.61 |
| F.F | Ha | N.Ind. | N.S | N.Genera | N.Family | H′ | D | S | Eq |
|---|---|---|---|---|---|---|---|---|---|
| P.A | 6.25 | 2905 | 2.0 | 1.0 | 1.0 | 0.54 | 0.37 | 0.35 | 0.79 |
| F.P.Mil | 6.0 | 507 | 31.0 | 31.0 | 20.0 | 1.82 | 0.76 | 4.27 | 0.78 |
| F.N.Mil | 2.5 | 905 | 37.0 | 39.0 | 23.0 | 1.72 | 0.69 | 4.04 | 0.74 |
Disclaimer/Publisher’s Note: The statements, opinions and data contained in all publications are solely those of the individual author(s) and contributor(s) and not of MDPI and/or the editor(s). MDPI and/or the editor(s) disclaim responsibility for any injury to people or property resulting from any ideas, methods, instructions or products referred to in the content. |
© 2023 by the authors. Licensee MDPI, Basel, Switzerland. This article is an open access article distributed under the terms and conditions of the Creative Commons Attribution (CC BY) license (https://creativecommons.org/licenses/by/4.0/).
Share and Cite
Adeito Mavunda, C.; Kanda, M.; Folega, F.; Bawa, D.M.-e.; Badjare, B.; Katembo Mukirania, J.; Dourma, M.; Akpagana, K. Kinshasa Province (Democratic Republic of Congo): Typology of Peri-Urban Ecosystems Providing Edible Insects. Sustainability 2023, 15, 11823. https://doi.org/10.3390/su151511823
Adeito Mavunda C, Kanda M, Folega F, Bawa DM-e, Badjare B, Katembo Mukirania J, Dourma M, Akpagana K. Kinshasa Province (Democratic Republic of Congo): Typology of Peri-Urban Ecosystems Providing Edible Insects. Sustainability. 2023; 15(15):11823. https://doi.org/10.3390/su151511823
Chicago/Turabian StyleAdeito Mavunda, Célestin, Madjouma Kanda, Fousséni Folega, Demirel Maza-esso Bawa, Bilouktime Badjare, John Katembo Mukirania, Marra Dourma, and Koffi Akpagana. 2023. "Kinshasa Province (Democratic Republic of Congo): Typology of Peri-Urban Ecosystems Providing Edible Insects" Sustainability 15, no. 15: 11823. https://doi.org/10.3390/su151511823