Article

Silver Nanoparticles’ Biogenic Synthesis Using Caralluma subulata Aqueous Extract and Application for Dye Degradation and Antimicrobials Activities

1
Department of Chemistry, Faculty of Science, Jazan University, P.O. Box 2097, Jazan 45142, Saudi Arabia
2
Department of Biology, Faculty of Science, Jazan University, P.O. Box 2097, Jazan 45142, Saudi Arabia
3
Central Research Laboratory, K S Hegde Medical Academy, NITTE (Deemed to be University), Deralakatte, Mangaluru 575018, Karnataka, India
4
Department of Animal Science & Technology, BET Research Institute, Chung-Ang University, Anseong 17546, Republic of Korea
5
Department of Chemistry, College of Natural Science, Wollo University, Dessie P.O. Box 1145, Ethiopia
*
Authors to whom correspondence should be addressed.
Catalysts 2023, 13(9), 1290; https://doi.org/10.3390/catal13091290
Submission received: 6 August 2023 / Revised: 3 September 2023 / Accepted: 5 September 2023 / Published: 10 September 2023
(This article belongs to the Section Nanostructured Catalysts)

Abstract

:
The issue of organic contaminants in water resulting from industrial, agricultural, and home activities makes it necessary to effectively address the problems of water scarcity. Using modern technologies that can effectively remove pollutants from wastewater is the way to address this key problem. The use of nanoparticles (NPs) has been advocated due to their unique physical and chemical characteristics and advantageous applications. NPs’ surface stability and synthesis routes are core concerns for environmental remediation and biological applications. In this work, we demonstrated the biogenic synthesis of silver NPs (Ag-CS NPs) by using Caralluma subulata (CS) aqueous extract as a reducing and capping/template agent. The synthesized Ag-CS NPs were characterized by UV-visible absorbance spectroscopy, Fourier-transform infrared spectroscopy (FTIR), Raman spectroscopy, powdered X-ray diffractometer (XRD), X-ray photoelectron spectroscopy (XPS), scanning electron microscopy (SEM), thermogravimetric analysis (TGA), transmission electron microscopy (TEM), and Zeta potential. The performance of Ag-CS NPs was evaluated on methylene blue (MB) dye degradation and antibacterial activity tests against bacterial and fungal isolates. The results showed that Ag-CS NPs (0.05%, 20.0 μL) reduced MB by 95.52% within 28 min in the presence of NaBH4 (10.0 mM, 0.980 μL). The degradation of MB followed pseudo zero-order chemical kinetics (R2 = 0.9380), with the reaction rate constant 0.0508 mol L−1 min−1. In addition, Ag-CS NPs were applied as antibacterial agents against 19 bacterial isolates. Ag-CS NPs showed inhibition in both Gram-positive and Gram-negative bacterial, as well as fungal isolates. As a greener ecofriendly approach, multifunctional Ag-CS NPs make a promising candidate for the remediation of contaminated water, as well as for important bioapplications.

Graphical Abstract

1. Introduction

Infectious and chemical contaminants threaten aquatic life and human health worldwide [1,2,3]. Water quality in the environment is deteriorating rapidly due to numerous factors, including the introduction of pathogenic microorganisms and the release of toxic waste containing dyes [4]. Water contamination by bacteria and organic pollutants such as dyes has been identified by the World Health Organization (WHO) as a foremost threat to human health [5]. There are many different types of pathogenic microorganisms present in the environment, each with the potential to cause serious illness. Humans with disorders such as pneumonia, sepsis, and gastritis face a significant risk of infection due to microbial invasion [6]. The development of antibiotics, including penicillin, amoxicillin, ciprofloxacin, levofloxacin, azithromycin, etc., has made significant strides in the war against infectious diseases [6,7]. However, the overuse of antibiotics has caused bacteria to develop resistance, resulting in many drug-resistant strains and drastically reducing antibiotic efficacy [8,9]. Thus, it is crucially important to investigate new antibacterial techniques for combating bacterial illness. On the other hand, organic dye (methyl orange, rhodamine B, malachite green, and methylene blue) contamination threatens aquatic ecosystems and humans at low levels [10,11]. Dyes are a major source of environmental pollutants because they are chemical and non-biodegradable waste materials. Therefore, new antibacterial methods and dye-degradation technologies are urgently needed.
Modern material science relies on nanotechnology for unique applications in biomedical sciences, wastewater treatment, pharmaceutical sciences, medicine, nutrition, energy, and more [12,13,14,15]. Nanoscale materials have many advantages over bulk materials, including greater optical and electrical conductivity, enhanced catalytic activity, and a higher surface-area-to-volume ratio. Among the many types of nanomaterials, silver nanoparticles (Ag NPs) have garnered a lot of interest because of their wide range of potential uses in fields such as catalysis, biosensors, electronics, adsorption, and biomedical engineering [16,17]. The synthesis of Ag NPs is typically accomplished by electrochemical procedures, physical radiation, and chemical reduction [18,19,20]. However, most of these technologies use hazardous chemicals, organic solvents, high temperatures, and environmentally destructive operations. Therefore, it is important to create a straightforward, eco-friendly method for synthesizing Ag NPs.
Green nanotechnology’s nontoxic and environmentally acceptable solutions for industrial-scale manufacturing of metal nanoparticles utilizing plant extracts provide a fresh window for this field [21,22,23]. Plant extracts have been used to create NPs of varying sizes and shapes for use in different in vivo biological applications and water purification efforts so far [24,25]. Zingiber officinale and Curcuma longa rhizome extracts were used to manufacture Ag NPs, and these Ag NPs exhibited potent antibacterial activity [26]. Size-controlled Ag NPs were produced by Wei et al. by utilizing sea buckthorn berry extract, and the resulting particles exhibited potent antioxidant, anticancer, and antibacterial properties [27]. Caralluma subulata (Forssk.) Decne. belongs to the flowering-plant family Apocynaceae [28]. It is a succulent shrub and grows primarily in the border lines of deserts and of slopes of mountains. The native range of distribution is located in the Southeastern Arabian Peninsula. Extensive studies have confirmed the presence of several bioactive components, including phenolics, flavonoids, polysaccharides, etc., in the extract of Caralluma subulata [29,30]. These compounds can be utilized as the reductant, protective, and stabilizing agent in the production of Ag NPs, in addition to their many other pharmacological actions, such as antimicrobial, antioxidant, anti-osteoporosis, anti-inflammatory, and antiparasitic effects [31,32,33]. Numerous studies have shown that plant-extract reductant molecules play a crucial role in determining Ag NPs’ size and dispersion. The extract contains powerful reductant molecules, and they are responsible for the formation of nanosize particles. There have been reports of the biological activity of Ag NPs generated using plant extracts, but not nearly as many investigations have focused on the production of Ag NPs by utilizing Caralluma subulata.
In this study, the aqueous extract of Caralluma subulata (CS) was used to establish a straightforward, easy, environmentally friendly, sustainable, and green method for the synthesis of Ag-CS NPs. Importantly, synthesis factors such as the AgNO3 concentration, extract pH, and reaction time were first examined on as-prepared Ag NPs. The prepared Ag NPs have a stable water suspension, nanosize, crystalline nature, considerable zeta potential, and monodispersing nanosize. Additionally, these Ag-CS NPs had a notable impact on the removal of methylene blue dye from water. The produced Ag NPs’ antimicrobial activities were tested against 19 Gram-positive, Gram-negative bacterial, and fungal species. According to these results, the aqueous extract of CS can be used to produce Ag-CS NPs, which have the potential to be used as an effective antimicrobial agent and catalytic reduction for MB dye for environmental protection.

2. Results and Discussion

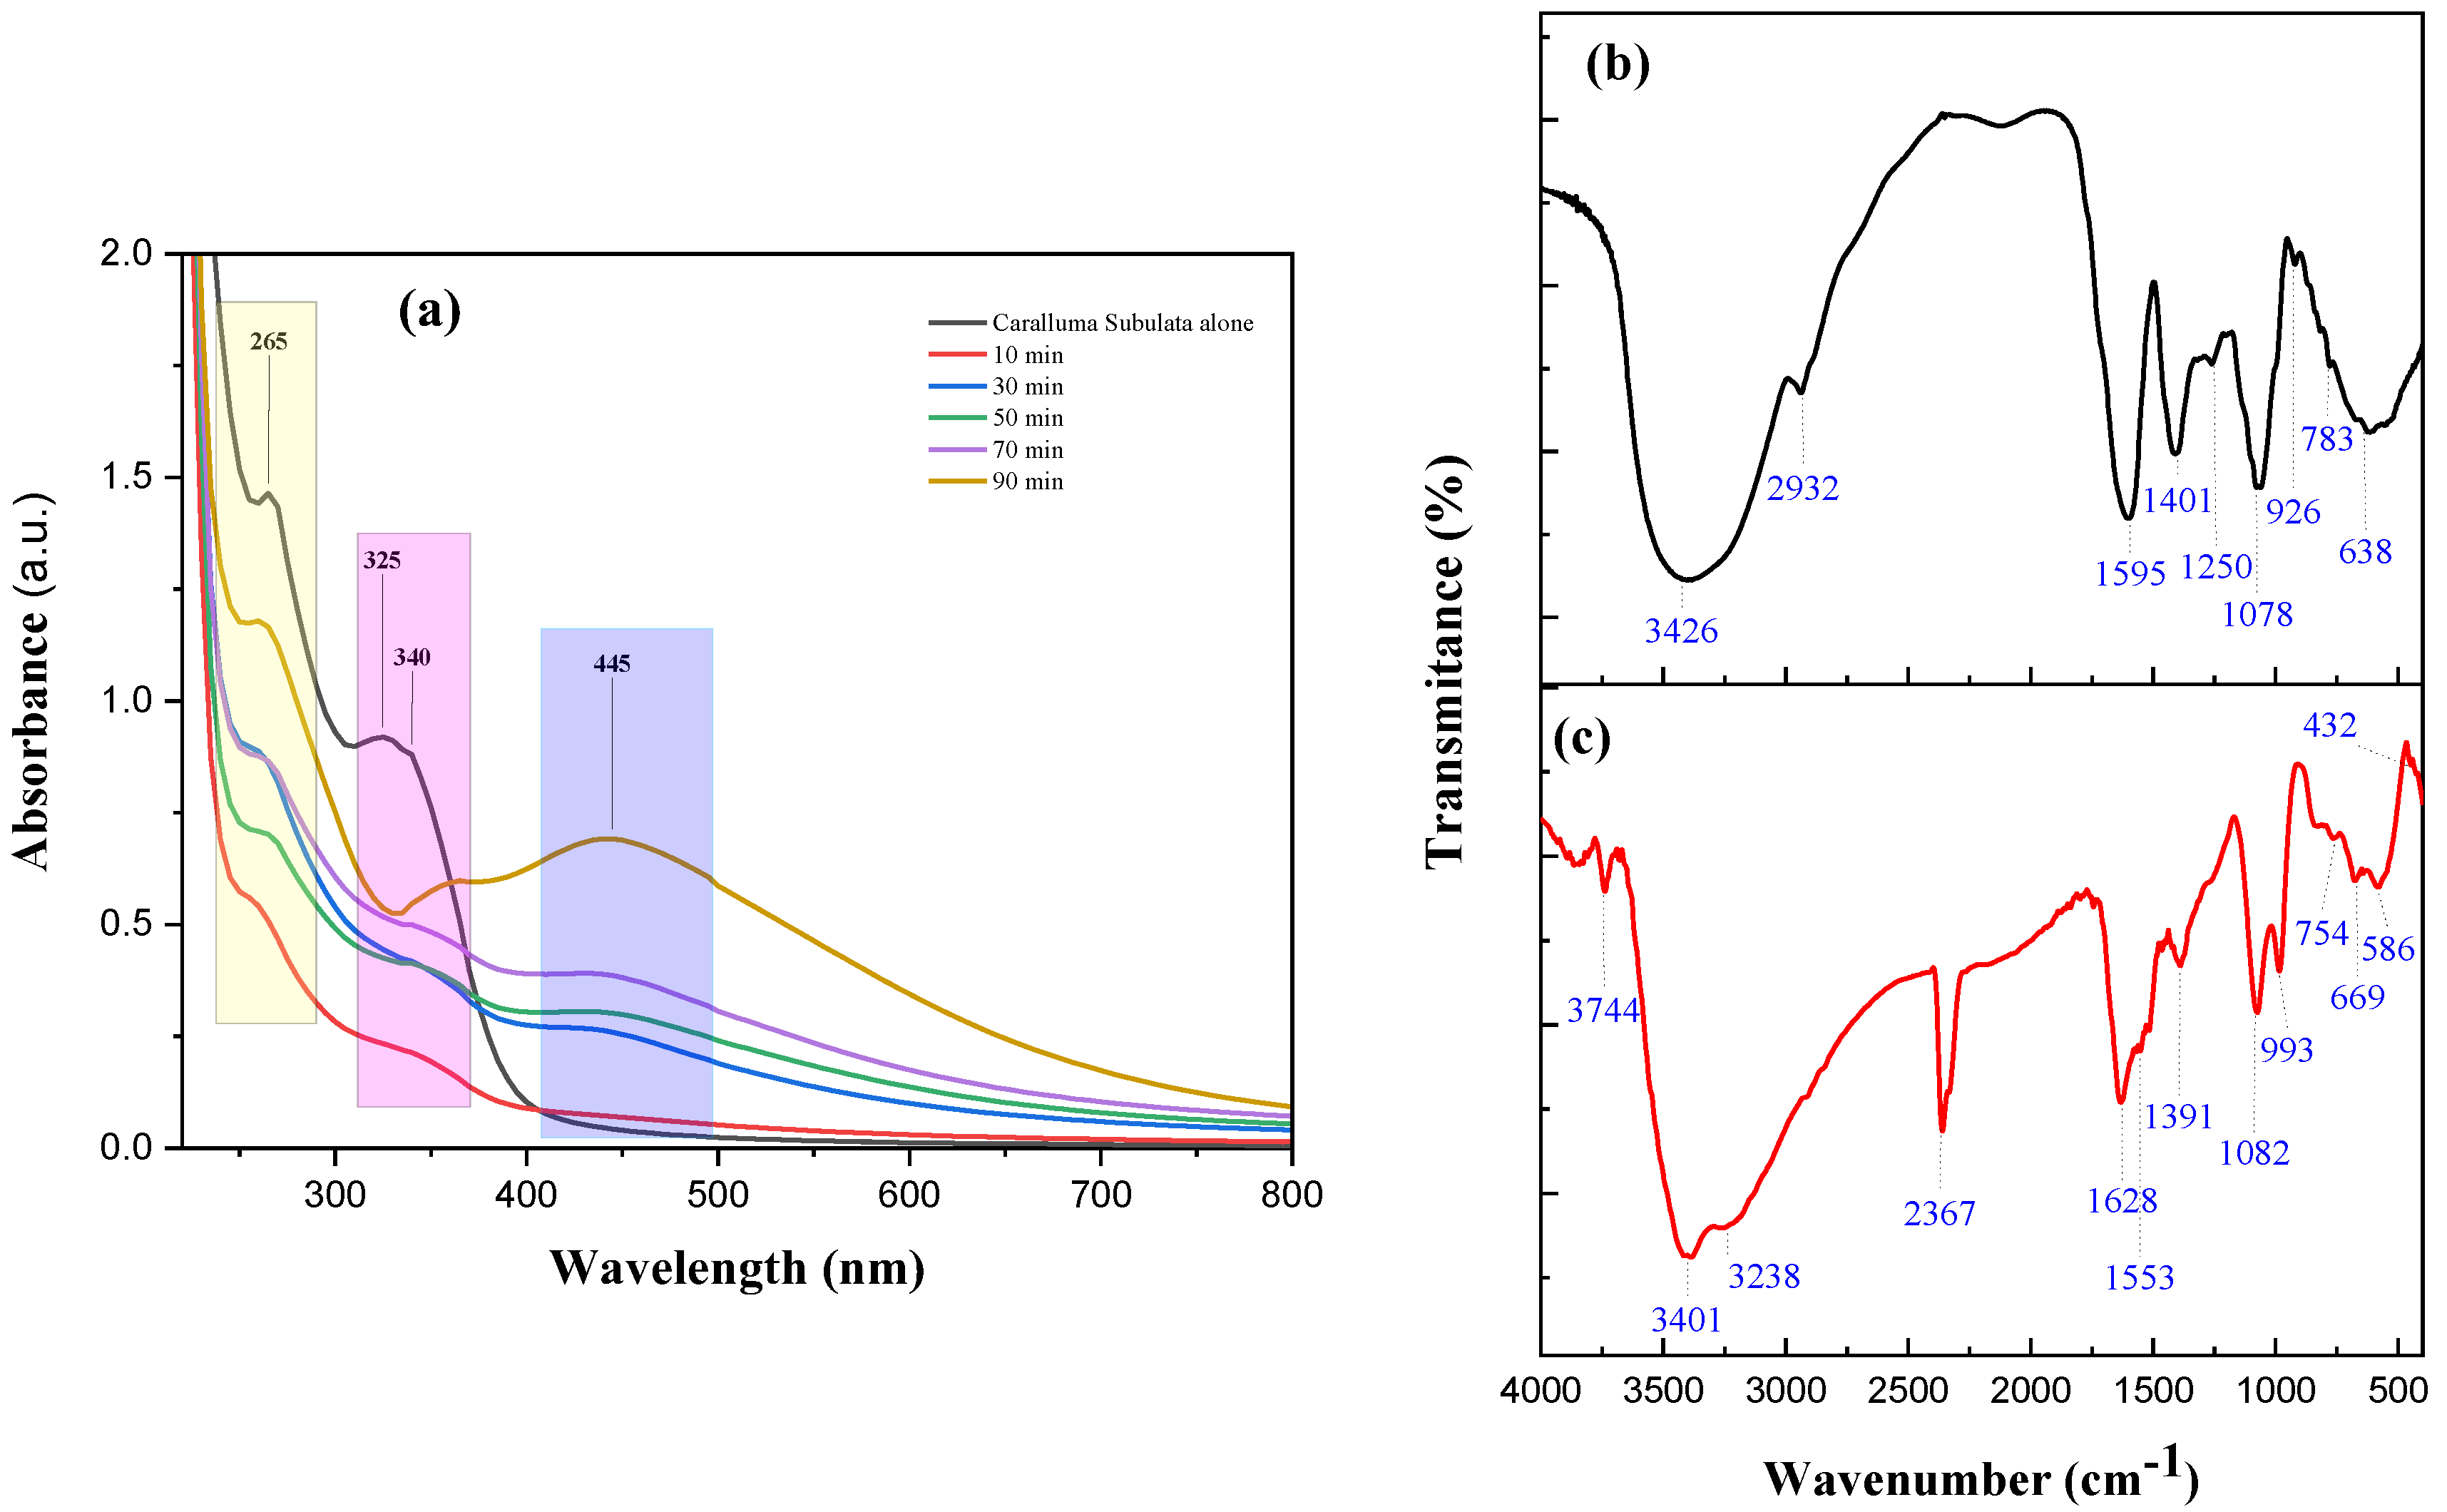
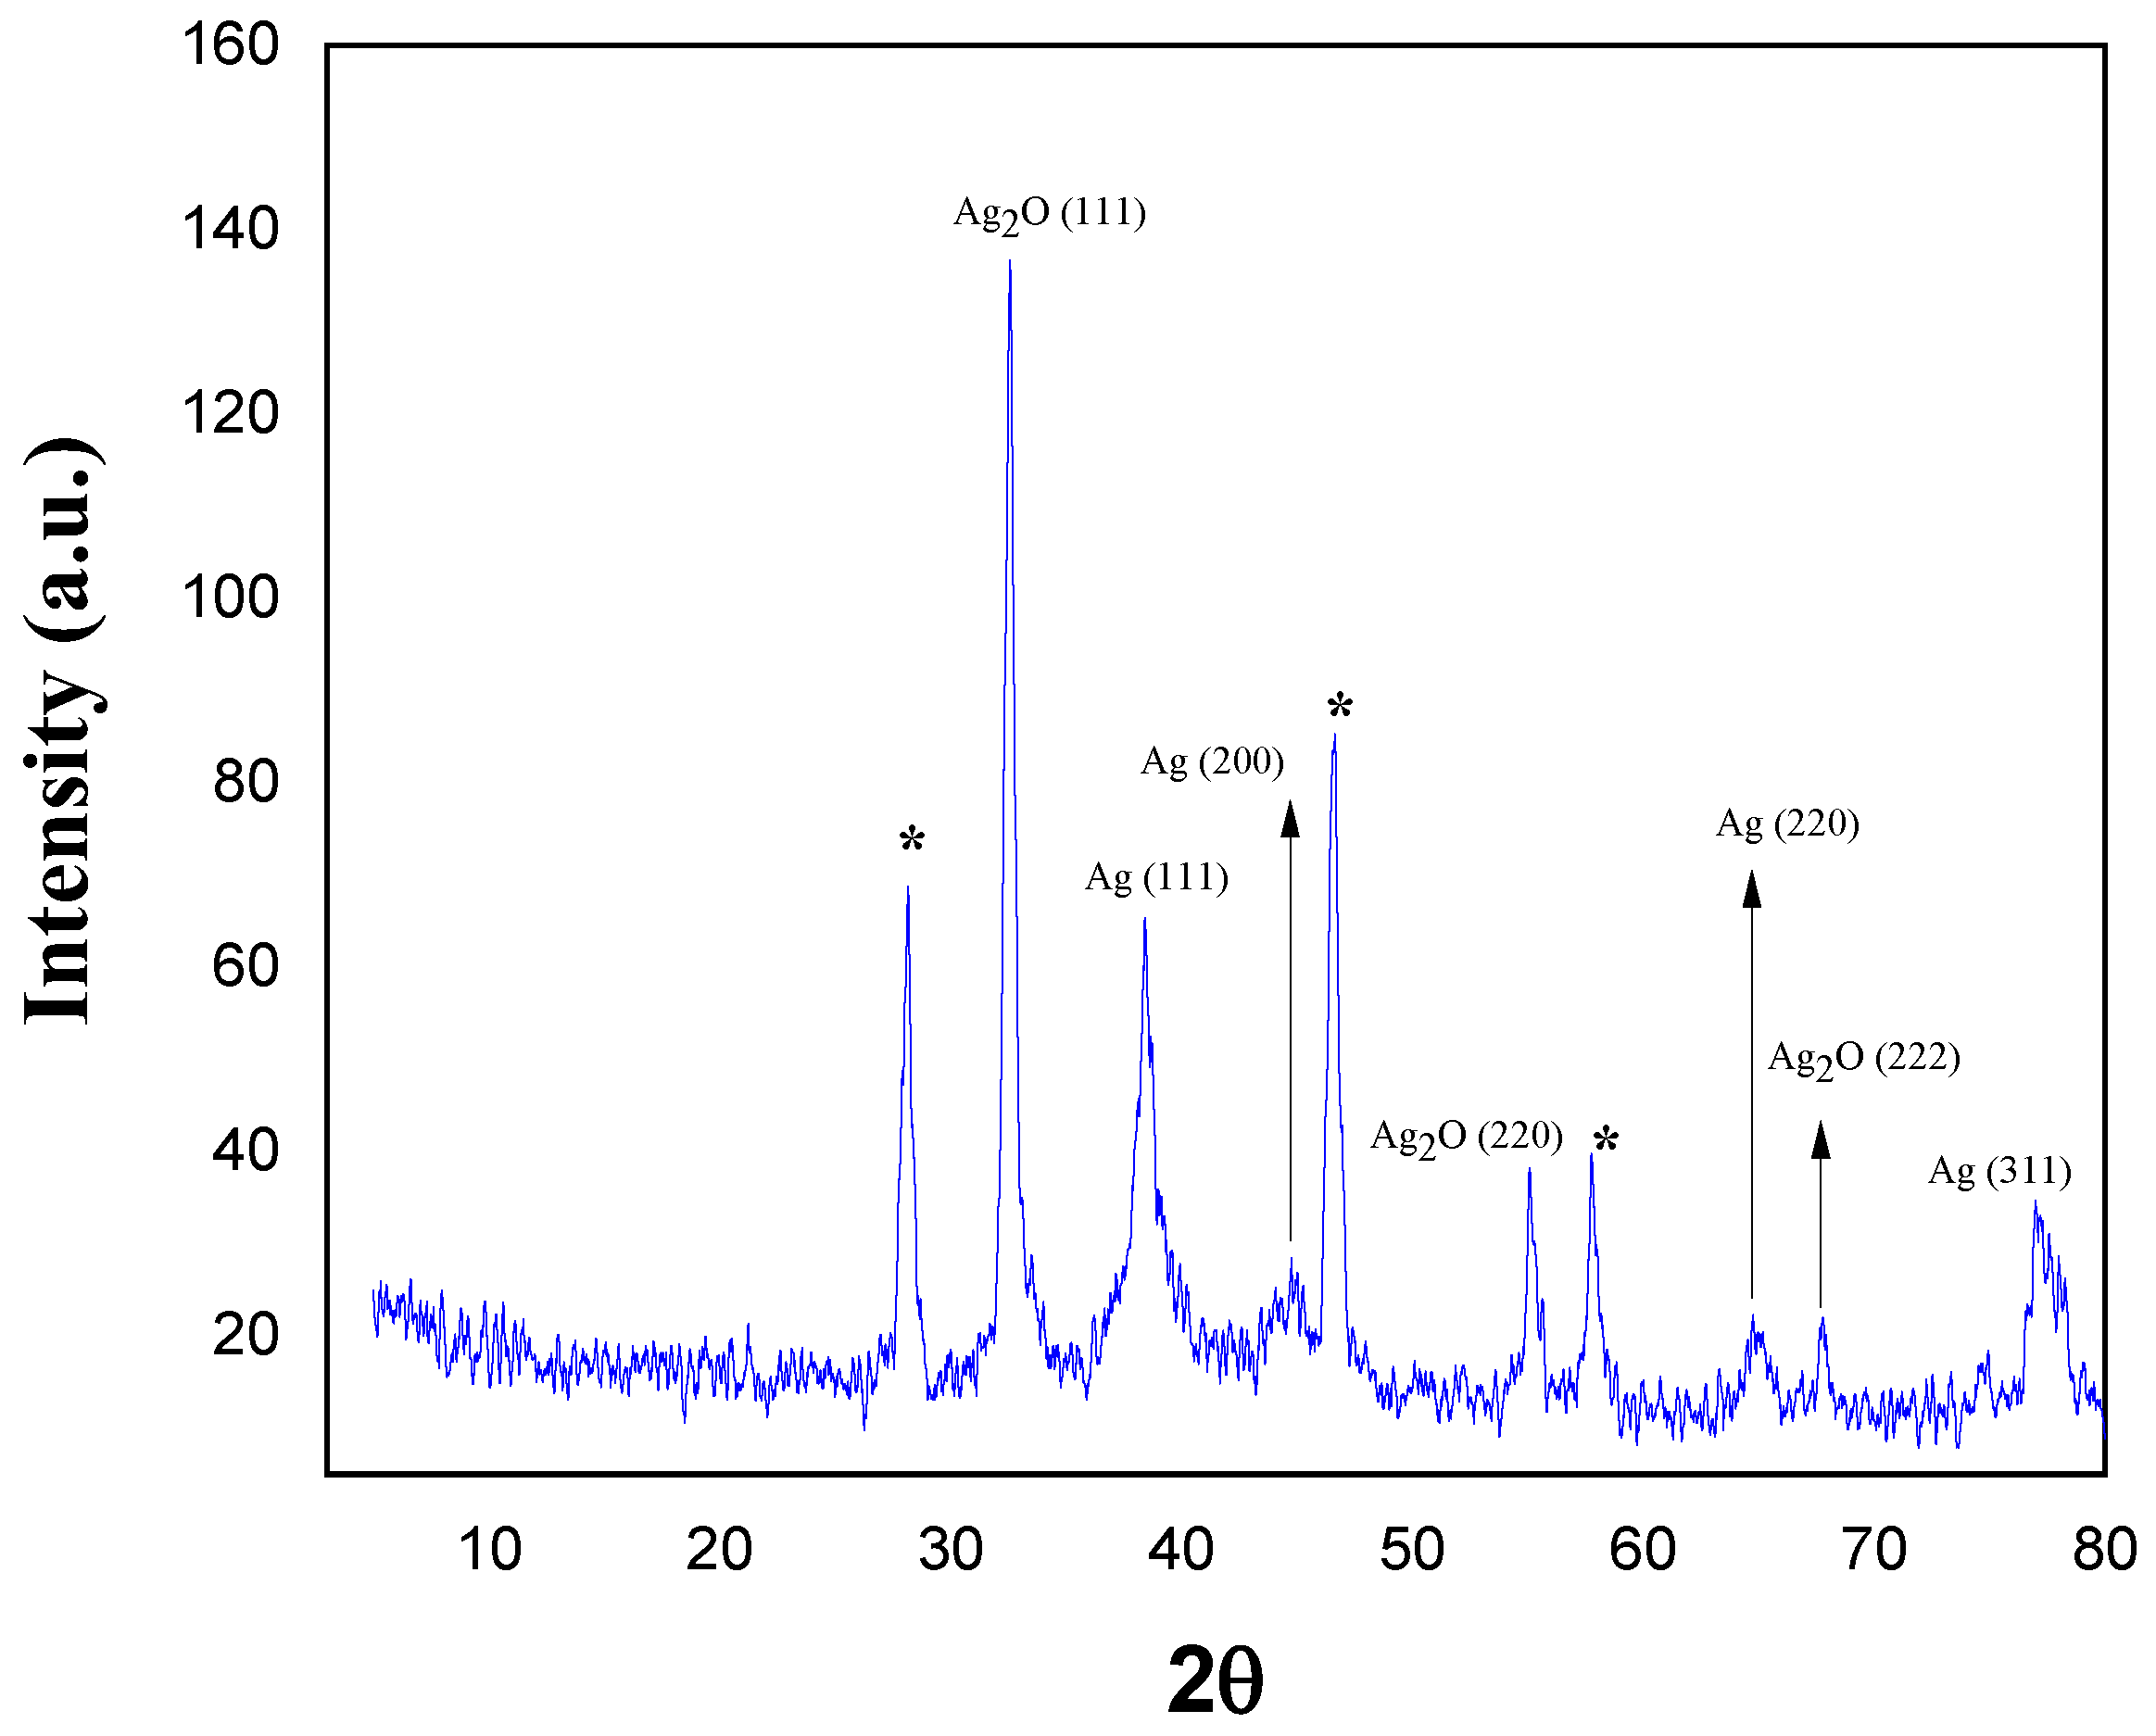
2.1. Characterization and applications of Ag-CS NPs

Caralluma subulata (CS) plants are mostly succulent perennial herbs and have core therapeutic properties to cure as traditional treatment. Traditionally, the Caralluma boiled in water and aqueous extract are usually used to treat the diabetics [34]. Its aqueous extract may contain a number of biological and organic moieties, such as polyphenols, tannins, flavonoids, and saponins, which may reduce Ag cations and stabilize Ag-CS NPs’ surface. In Figure 1a, CS shows three absorption peaks at 265, 325, and 340 nm; this alludes to the fact that the aqueous extract contains a wide range of phytochemicals. Figure 1a shows the UV-Vis spectroscopy for the reaction progression during the Ag-CS NPs’ synthesis. As the Ag+ reduction started, a significant NP colloidal suspension formed and with respect to the time of the NPs’ color change. At different times, i.e., 10, 30, 50, 70, and 90 min, UV-Vis spectra were obtained. The maximum absorption at 445 nm was reached within 90 min. The color change and UV-Vis absorption are due to excitation of surface plasmon resonance (SPR).
Supplementary Figure S1 shows the Ag-CS NPs’ zeta potential, which was observed at −39.4 mV. The phytochemicals obtained from the CS were characterized by the GC-MS; they were responsible for facilitating the reduction, as well as the stabilization, of Ag+ ions to Ag-CS NPs. Sharawy et al. performed a systematic characterization of 13 different species of the genus Caralluma from the flora of Saudi Arabia [30]. Caralluma retrospiciens (Ehrenb) flower extract-based phytochemicals were analyzed and characterized by GC-MS and FTIR, and then bioactive compounds were applied for antibacterial activities [35]. Recently, we performed a Caraluma acutangula aqueous extract-based phytochemicals analysis, using GC-MS, and studied its application for silver NPs’ synthesis [36]. CS-based aqueous extract phytochemicals were analyzed for the first time by GC-MS. GC-MS chromatogram of Caralluma subulata aqueous extract is depicted in Supplementary Figure S2, and a quantitative analysis of 14 phytochemicals, along with their relative abundance, is shown in Supplementary Table S1. In terms of peak area %, the following compounds were enriched in the GC-MS chromatogram: 2-furancarboxaldehyde, 5-(hydroxymethyl) (42.10%), 4H-pyran-4-one, 2,3-dihydro-3,5-dihydroxy-6-methyl (16.47%), 2,4,6-cycloheptatriene-1-carbonitrile (11.40%), 5-hexen-3-ol, 2,2,4-trimethyl (3.68%), 5-hydroxy-2,2-dimethylhexan-3-one (3.43%), 2,4-dihydroxy-2,5-dimethyl-3(2H)-furan-3-one (3.05%), 3-furaldehyde (1.18%), methyl format (1.62%), 17-octadecynoic acid (1.15%), [1,1′-bicyclopropyl]-2-octanoic acid, 2′-hexyl-, methyl ester (1.64%), and 2,2′-bioxirane (1.03%). Hetero atoms such as oxygen, nitrogen, sulfur, and chlorine can be found in a variety of phytochemicals’ functional groups, and they are responsible for the reduction of Ag+ to Ag0 NPs. The 2-Furancarboxaldehyde 5-(hydroxymethyl) compound is in a high percentage (42.10%) in the aqueous extract of CS, which reduced the Ag+ to metal and formed Ag NPs that were stabilized by the other phytochemicals, respectively [37,38].
Ag-CS NPs’ surface stability by the phytochemicals-based functional group moieties was characterized by FTIR. Figure 1b represents the plant aqueous extract of CS, which is attributed to the broad peaks at 3426 cm−1 corresponding to the hydroxyl (–OH) group in alcohol, carboxylic acid, and amine (–NH2) groups; meanwhile, in this region, a small band at 2932 cm−1 is stretching the –C–H bond in phytochemicals. The CS aqueous extract fingerprint zone is attributed to the 1595, 1401, 1250, 1078, 926, 783, and 638 cm−1 peaks. The peak at 1595 cm−1 corresponds to the asymmetric stretching vibration of –C=C or –N–C=O. The 1401 cm−1 bending is due to C–H in alkane chain [39,40]. The peak at 1250 and 1078 cm−1 could be attributed to the O–H deformation and C–O stretching of phenolic –OH groups in phytochemicals [39]. The peak at 926 cm−1 corresponds to the =C–H banding in the alkene monosubstituted group, while 783 and 669 cm−1 belong to the disubstituted meta benzene ring for the –C–H bending vibration (outside the plan) and C–Cl stretching bond. The GC-MS data in Supplementary Table S1 also confirmed the presence of various phytochemicals, such as 2-Furancarboxaldehyde, 4H-Pyran-4-one, 5-(hydroxymethyl), 2,3-dihydro-3,5-dihydroxy-6-methyl, 2,4,6-Cycloheptatriene-1-carbonitrile, etc., with a high percent of peak areas in the GC-MS chromatogram.
The FTIR spectra of Ag-CS NPs are shown in Figure 1c. Three sharp broadband peaks were detected at 3744, 3401, and 3238 cm−1; these confirmed the free-stretching –OH from alcohol and stretch –OH in a carboxylic acid and amine (–NH2) groups in organic moieties that are available on the surface of nanoparticles. A sharp band peak was observed at 2367 cm−1 which is belongs to N–H stretching, as well as C–O stretching, vibrations from proteins [39]. In the range of fingerprints for Ag-CS NPs, peaks at 1628, 1553, 1391, 1082, 993, 754, 669, and 586 cm−1 were observed. A sharp peak at 1628 cm−1 corresponding to the stretch band of the C=O group can be assigned to conjugated acid and conjugated aldehyde, while peak 1553 cm−1 corresponds to the amide bond (–N–C=O) linkage possibly present in proteins. The peaks obtained at 1391 and 1082 cm−1 could be assigned to C–O stretching and the deformation of the phenolic O–H group. The peaks at the 993 cm−1 =C–H bending vibration in the alkene monosubstituted group. A disubstituted benzene ring for the –C–H bending vibration was observed, as shown in two bands at 754 and 669 cm−1. A small band at 589 cm−1 was attributed to the silver/silver oxide nanoparticles lattice vibration due to the surface stabilization by carboxylic acid functional groups of phytochemicals [41,42]. Supplementary Figure S3 attributed the thermal decomposition of Ag-CS NPs by using TGA techniques. Three different weight-loss % ranges were observed: 0.816% at 100–155 °C, 17.30% at 155–531 °C, and 2.27% at 535–960 °C. These weight-loss % values were conducive to water, volatile organic molecule, biological molecule, and thermal-resistant aromatic molecule loss from the surface of Ag-CS NPs. These TGA-obtained results are in good agreement with the UV-Vis spectroscopy, FTIR, and XRD data [36,43,44,45].
Phytochemical-stabilized Ag-CS NPs were characterized by SEM and TEM to analyze the morphology and size of nanoparticles. Figure 2a presents the SEM images of Ag-CS NPs, showing the spherical nanoparticles’ morphology. Figure 2b shows the TEM image of Ag-CS NPs that represent the nanoparticles’ agglomeration, which might be due to different phytochemicals from the Caralluma subulata interaction. A selected area electron diffraction (SAED) pattern with different lattice rings represents the crystalline nature of the nanoparticle, as shown in the inserted image of Figure 2b. Different TEM images were used for particles size distribution to calculate the particle sizes in the range of 8–26 nm. A high distribution of Ag-CS NPs was observed at 20 nm, as shown in Figure 2c.
CS phytochemicals reduced the Ag+ to Ag and Ag2O crystalline NPs; therefore, the crystallinity nature was characterized by using the XRD crystallography technique. Figure 3 shows the XRD data which represent the various peaks at 2θ diffraction angles of 38.40°, 44.76°, 64.74°, and 77.02°. These intense assigned peaks can be referred to as the Planes of the Miller Indices (111), (200), (220), and (311), respectively, which stand for the Ag-CS NPs’ cubic crystalline face center structure [46]. X-ray powder diffraction analyses of the obtained crystalline Ag-CS NPs’ peak positions from Bragg’s diffraction patterns were cross-referenced with the Joint Committee on Powder Diffraction Standard (JCPDS card No. 00-004-0783) for Ag NPs, which confirmed the crystalline nature of the obtained nanomaterials. Diffractions peaks are broad in nature, and this is attributed to the smaller size and high stability of Ag-CS NPs. Bragg’s diffraction peaks for the Ag2O crystalline nature were also observed at 32.58°, 55.10°, and 67.84° and refer to the Planes of Miller Indices (111), (220) and (222) respectively. These respective Bragg’s diffractions peaks for Ag2O crystalline were found to be identical with those at JCPDS card No. 01-076-1489. During the biosynthesis of Ag NPs, it is high possibility that silver oxide also formed beside the Ag nanoparticles. Nevertheless, the initial reduction of Ag+ ions generated the nascent Ag NPs containing a high surface-to-volume ratio and highly reactive surface stabilized by phytochemicals; at this stage, Ag2O nanoparticles also formed, as observed in the XRD Bragg’s diffraction peaks. Three high and broad unassigned peaks (*) at 28.18°, 46.64°, and 57.76° were also observed during the XRD analysis which could be the crystallization of biomolecules on the Ag-CS NPs’ surface, as also mentioned in previous studies [36,47,48]. Ag-CS NPs’ crystalline size was calculated using the Debye–Scherer Equation (1).
D = 0.94 λ β c o s θ  
where D is average particle diameter size (nm), β = full width at half maximum (FWHM) of the peaks, and λ = X-ray radiation wavelength (0.15405 nm) and belongs to the planes. Ag-CS NPs’ average crystalline size using all intense peaks was calculated and is shown in Supplementary Table S2, and the average crystallinity was found 22.93 nm, which was also observed very near to TEM images particles’ size distributions in Figure 2c.
The chemical state of the elements on the surface of Ag-CS NPs was characterized by the well-known XPS technique. Figure 4a shows the overall survey spectrum of Ag-CS NPs. Figure 4b represents the deconvoluted spectra for the Ag 3D elemental analysis, which exhibits peaks for Ag 3d5/2 and Ag 3d3/2 components. These two attributions fitted to independent contributions belong to Ag° and Ag+ species in the green synthesized Ag-CS NPs. The peaks at 373.68 eV and 367.78 eV binding energy can attribute the presence of Ag° as nanoparticles, whereas the peaks at 372.58 eV and 366.78 eV confirm the existence of Ag+ ions due to the formation of Ag2O on the Ag-CS NPs’ surface [49]. These obtained data confirm that the silver nanoparticles’ formation was stabilized by phytochemicals from CS. However, a phytochemical environment promotes the oxidation of Ag NPs and forms an oxide layer on Ag-CS NPs’ surface due to initial active surface of Ag NPs. Phytochemical-based stabilized Ag-CS NPs may be further confirmed by the XPS spectra of O (1s), C (1s) and N (1s) shown in Figure 4c–e. Figure 4c shows the O (1s) high-resolution deconvoluted spectra with two binding energy peaks at 532.38 eV corresponding to the Ag-O bond in Ag2O which formed due the strong interaction of d-orbital and Phyto molecules from the aqueous extract of CA. The second peaks 530.48 eV binding energy indicate the presence of the C=O functional group on the surface of Ag-CS NPs. High-resolution deconvolution into three peaks at 287.08, 285.68, and 284.38 eV for electron-binding energies is shown in Figure 4d due to C=O and C–O, C–N, C–C, and C–H bonds obtained from the organic-based phytochemicals from the CS extract that are majorly responsible for the stabilization of Ag-CS NPs [50,51]. The N 1s (Figure 4e) peak at 399.59 eV can be attributed to the neutral amino group –NH2 or N–H bond from amide existing in the phytochemicals attached to the protein moieties.
The catalytic activity of Ag-CS NPs can promote, through the tailoring of the particles, a greater surface area and better functionality. The high surface area of NPs may lead to an increase in adsorption towards the reaction site and can be attributed to the high catalytic activity process. Therefore, it is imperative to analyze the surface area of NPs before applying them in respective applications. In this regard, the N2 adsorption–desorption isotherm measurement was applied to a multipoint analysis using the BET method. Figure 5 attributes the nitrogen sorption isotherms of Ag-CS NPs to multipoint measurements. Figure 5a shows the obtained data-points graph after the adsorption–desorption process of Ag-CS NPs, which represent the typical IV adsorption, in the low-pressure region (P/P0 < 0.6). In this region of the graph, the data points indicate that the isotherms are relative flat, showing that the adsorption and desorption isotherm processes are at the superposition; as a result, the adsorption of the samples usually happens in the micropores. Figure 5b shows the BET linearity equation, which represents the slope value of 0.313 and surface area, using the multipoint BET equation (as-BET), which was calculated to be 15.198 m2/g, as shown in Table 1. Figure 5c shows the plot of Barrett–Joyner–Halenda (BJH), which represents the pore size distribution curve of Ag-CS NPs. The pore size probability, which was estimated from the graph, was 18.2 nm, thus indicating a narrow pore size distribution. Ag-CS NPs are grain clusters with a polycrystal shape due to the presence of phytochemical moieties on the particles’ surface. Using the BJH academic model, Ag-CS NPs’ surface property was measured as the cumulative pore specific surface area, and the average pore diameter and cumulative pore volume were estimated, as shown in Table 2.

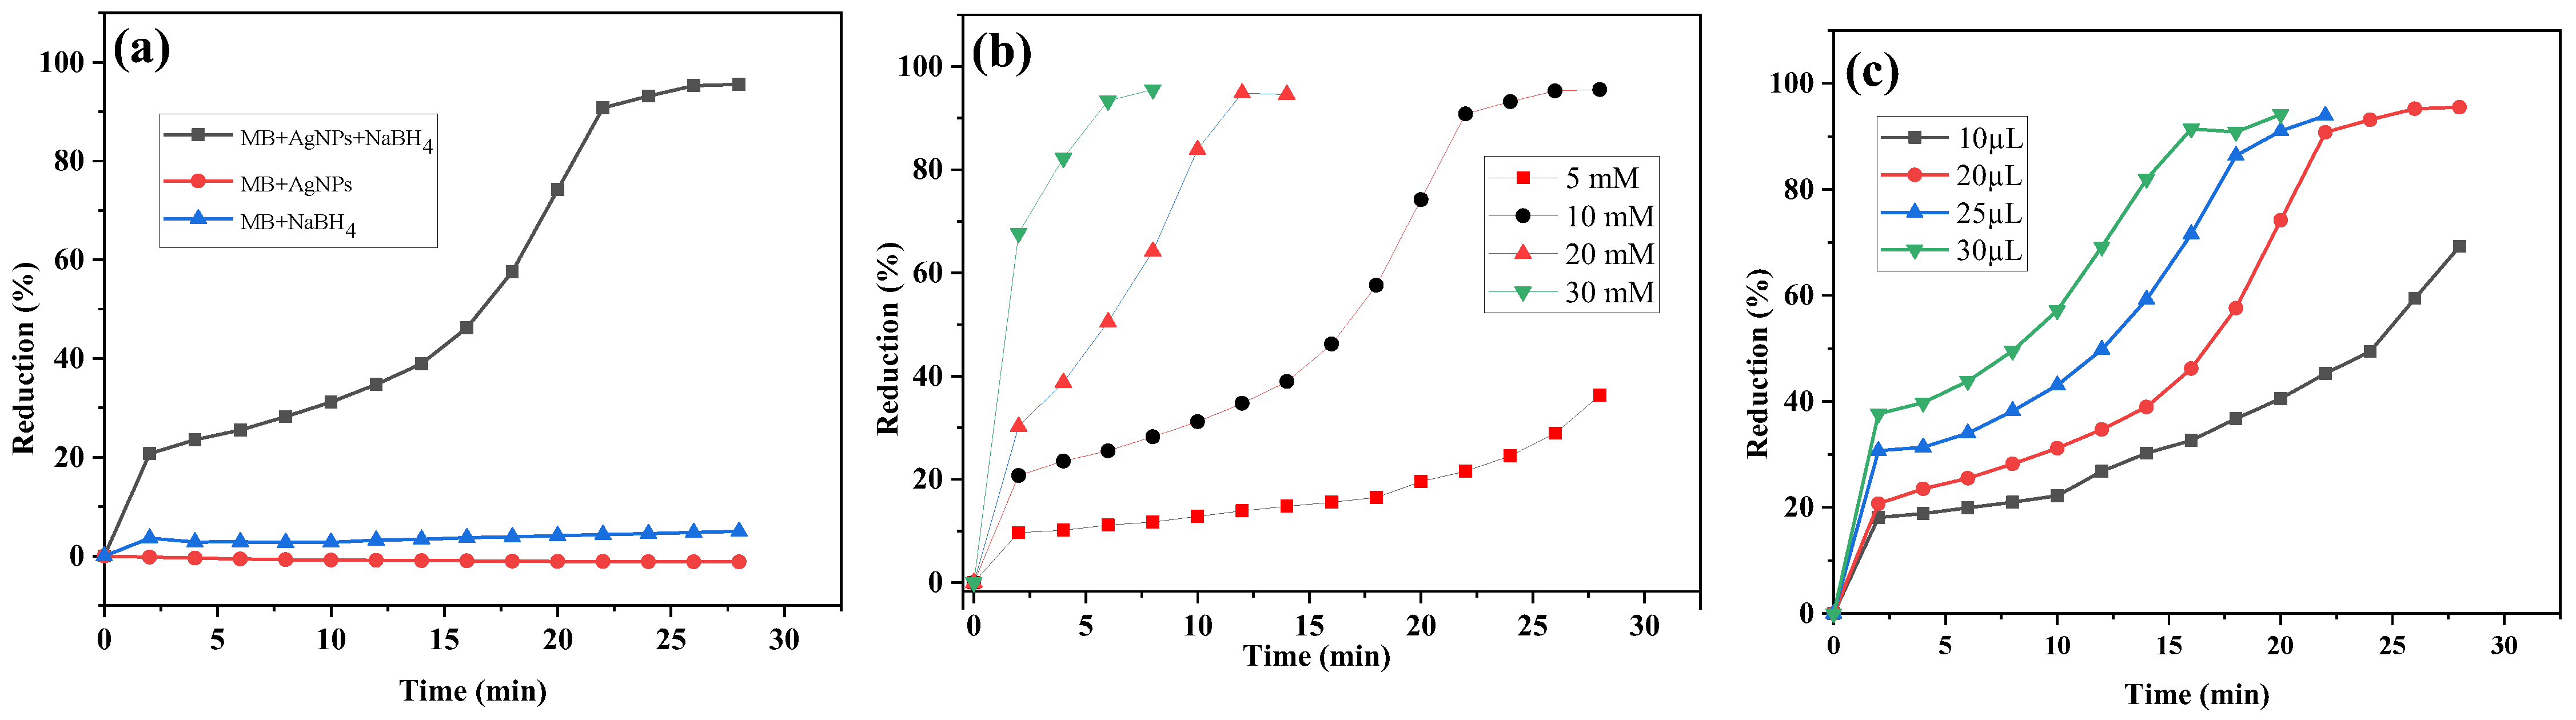
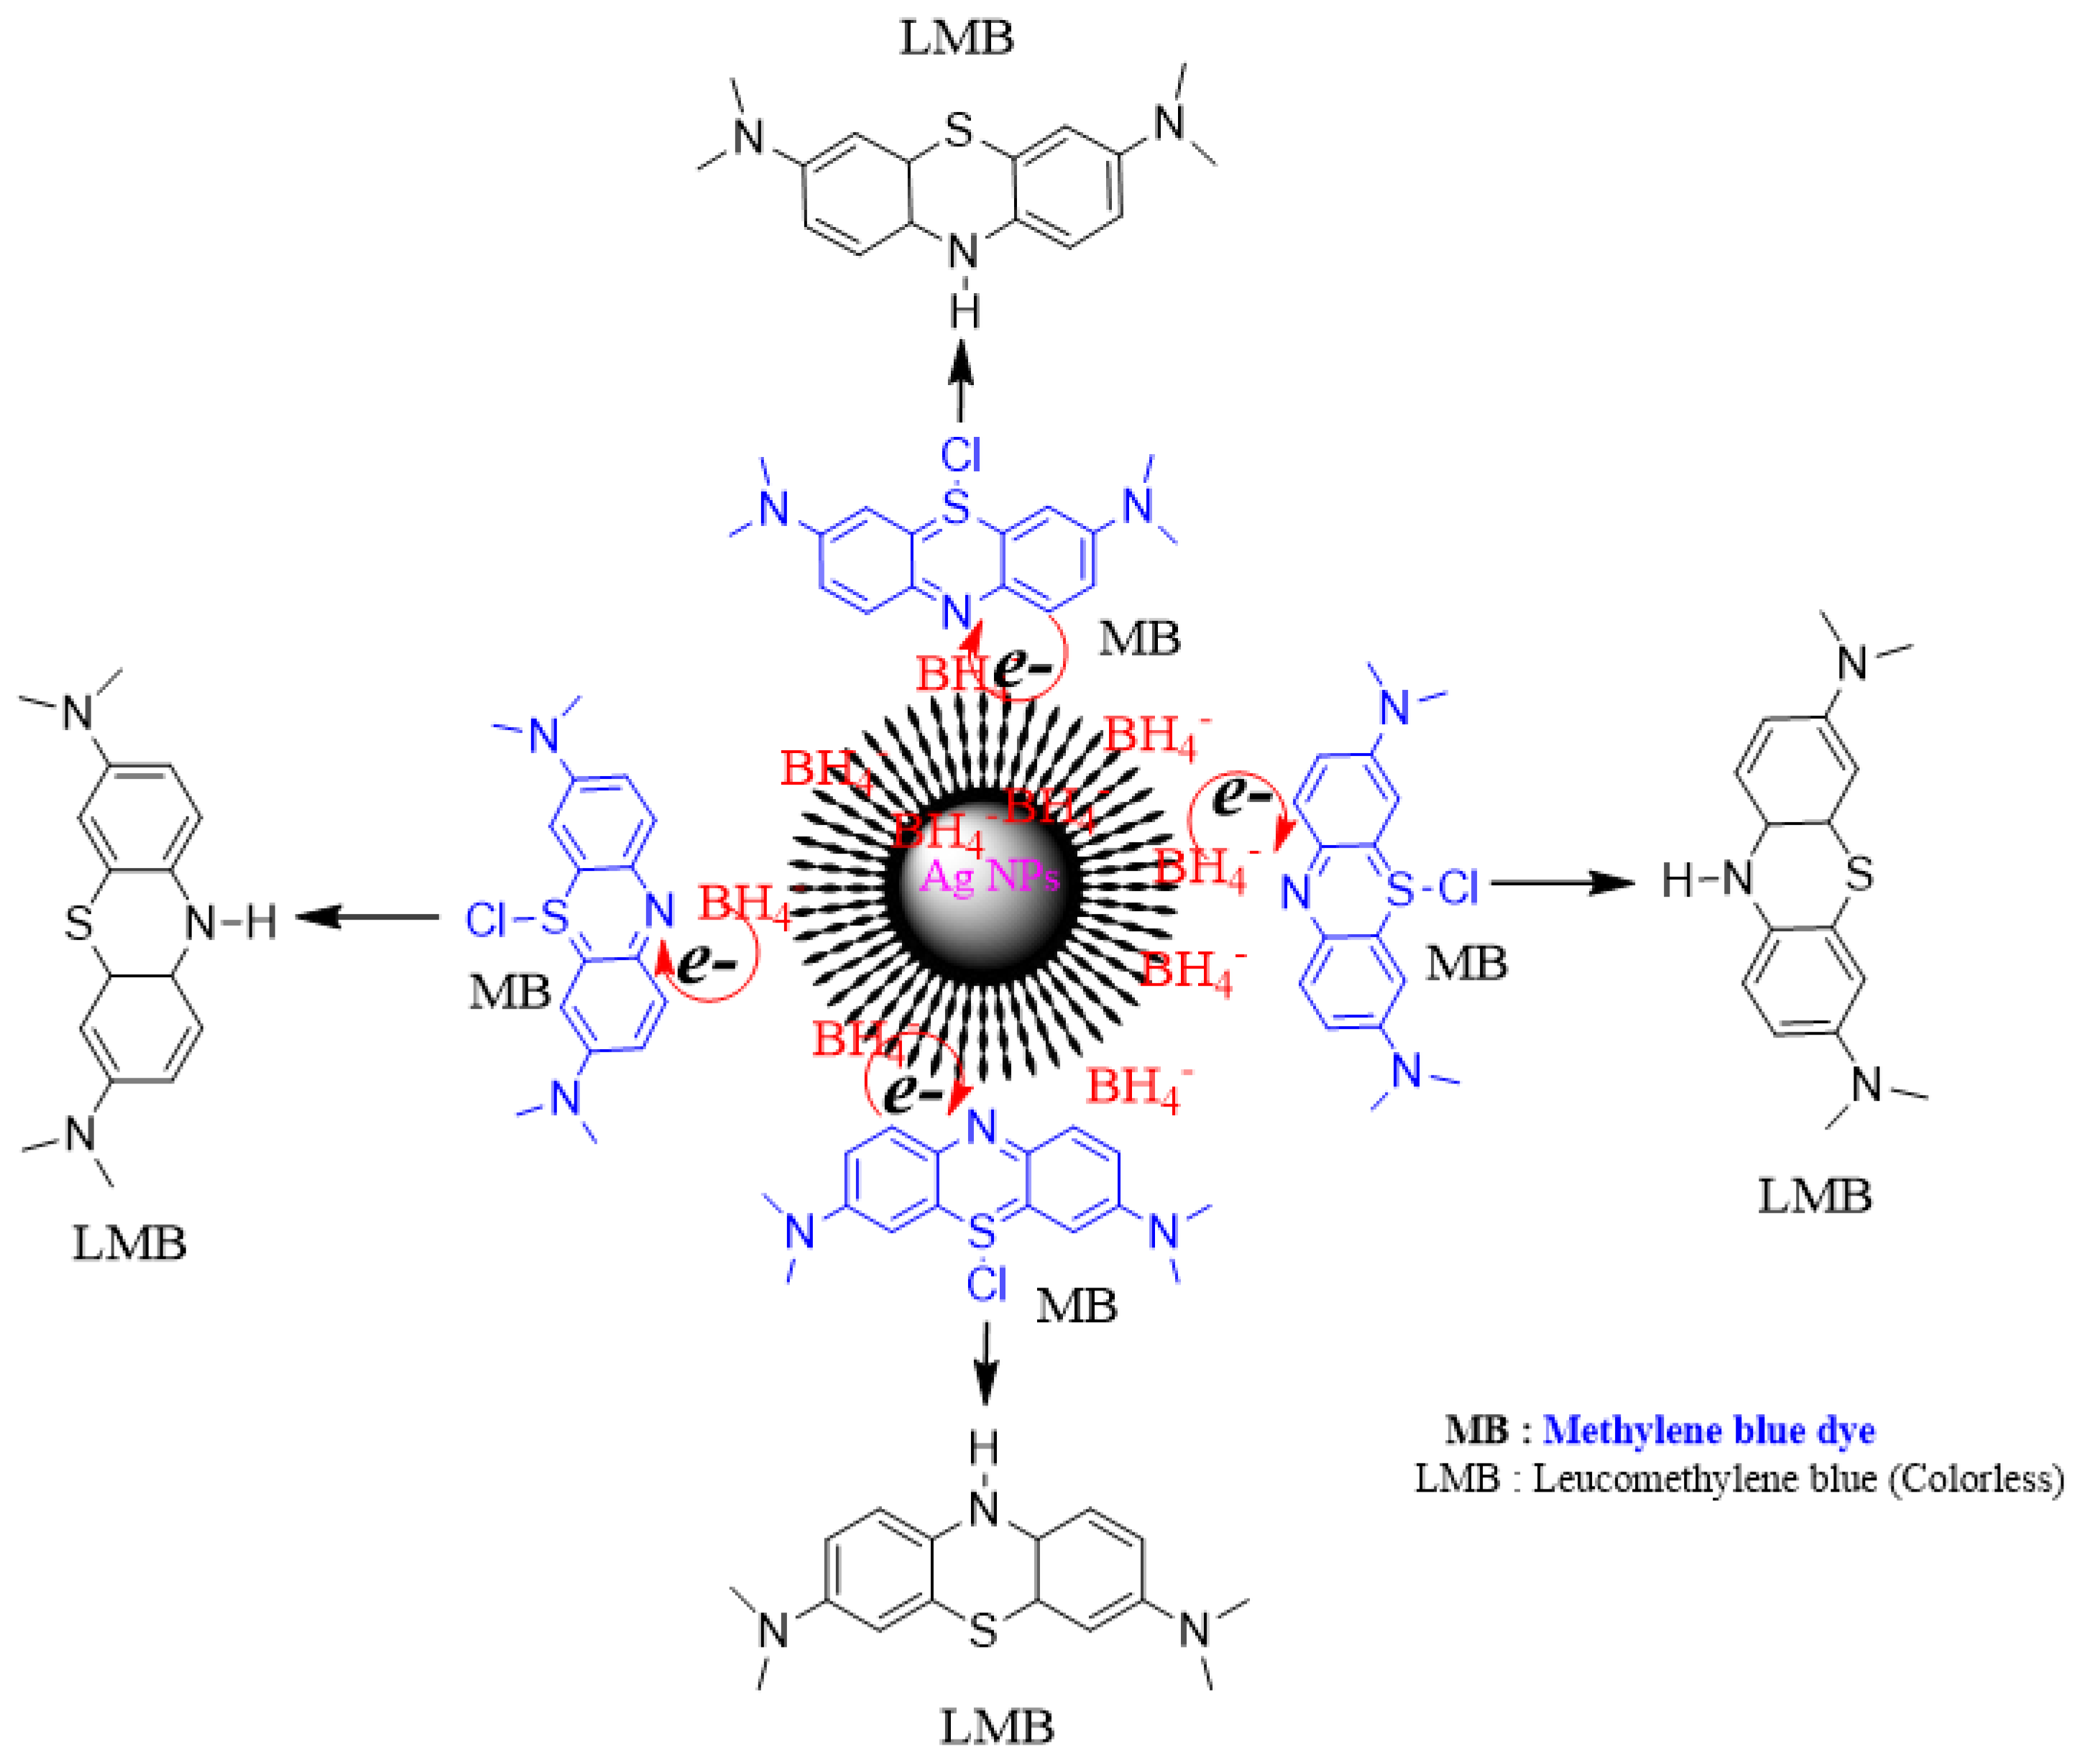
2.2. Methylene Blue (MB) Dye Reduction Using Ag-CS NPs and NaBH4

Methylene blue (MB) is a cationic dye with a heterocyclic aromatic azo group and is a major industrial pollutant for the aquatic ramification system and environment. However, MB salts have the chemotherapeutic and antimalarial properties for biomedical applications. MB aqueous solution is blue in color and possesses maximum UV-Vis absorption at 664 nm. Ag-CS NPs were applied as a catalyst for the reduction of MB dye in NaBH4 agents.
Figure 6a shows the efficient synergistic effect of Ag-CS NPs (0.05%, 20.0 μL) with NaBH4 (10.0 mM, 0.980 μL) to decolorize the MB (10 PPM) solution. Figure 6b represents the % decolorization (reduction) of MB dye, using Ag-CS NPs, which was calculated to be 95.52% (within 28 min) by using the Equation (2) at optimized conditions. Figure 6c refers to the plot graph between the C t / C o (%) and time (min) attribute, showing that the MB dye reduction erratically increases with time.
The chemical kinetics of MB reduction in the presence of Ag-CS NPs and NaBH4 were studied using the three kinetic models, i.e., zero, first, and second order, as mentioned in the integrated law of linearity equation in Table 3. Figure 6d–f show the chemical kinetic model for zero, first, and second order respectively. Figure 6d represents the highest regression coefficient (R2; 0.9380) values at a rate constant of 0.0508 mol L−1 min−1 for pseudo-zero-order chemical kinetics, while Figure 6e shows a lower regression coefficient (R2; 0.8145) for the first-order chemical kinetics, with a reaction rate constant (k) of 0.1131 min−1. However, Figure 6f represents the second-order chemical kinetics with a regression coefficient that is much lower (R2; 0.6542), with a reaction rate constant of 0.4051 L mol−1 min−1.
The MB-reduction efficiency, using different parameters, was evaluated by applying Ag-CS NPs and NaBH4. Figure 7a illustrates the synergistic effect of NaBH4 with Ag-CS NPs and represents the MB dye reduction within 28 min with 0.0508 mol L−1 s−1. However, NaBH4 and Ag-CS NPs alone do not represent any significant reduction in MB dye. Figure 7b shows the different concentrations of NaBH4 (5, 10, 20, and 30 mM) at a constant dose of Ag-CS NPs (0.05%, 20 μL); the reduction of MB dye became faster as the concentration of NaBH4 increased. At a high concentration, NaBH4 showed an ambiguous reduction of MB dye due to the H2 production, which was instantly converted to the reduced form of Leucomethylene blue (LMB) [43,48]. When Ag-CS NPs are used as a catalyst alone, they do not show any reduction of MB dye. The obtained data show that the synergistic effect of Ag-CS NPs with NaBH4 is highly efficient for reducing various dyes or drugs within a short amount of time. The catalytic activity of Ag-CS NPs is determined by the NaBH4′s electron donation and the dye molecule’s electron uptake capability. Initially, NaBH4 and dye molecules are absorbed into the surface of Ag-CS NPs. The Ag-CS NPs perform as a relay system in the aqueous solution, delivering an electron from the NaBH4 to the dye molecule throughout the degradation process [36,48,52].
The catalytic reduction of MB dye was optimized by using different pH (2, 4, 5, 6, 8, and 10) environments to evaluate the system for real-world sample applications, as shown in Figure 8a. At pH 5, the system was evaluated and optimized as a catalytic reduction of MB dye; the synergistic effect of NaBH4 with Ag-CS NPs was observed to be the highest. Nevertheless, at a lower pH, catalytic reduction was deprived due to the hampering of the Ag-CS NPs’ zeta potential charge (ZPC) and MB dye attraction. The negative ZPC of phytochemical-stabilized Ag-CS NPs was observed as −39.4 mV at pH 5.12, as shown in Supplementary Figure S1. After the application of Ag-CS NPs for MB reduction, using NaBH4, the physicochemical surface was further characterized by SEM and TEM, as shown in Supplementary Figures S4 and S5, respectively. These obtained images show that Ag-CS NPs are stable and that the presence of a lower dose of a strong reducing agent, such as NaBH4, has less of an effect on their surface and morphology. It might be due to the presence of CS phytochemicals on the surface of Ag NPs; those stabilized the particles efficiently.

2.3. Antimicrobial Sensitivity Testing (AST)

AST was carried out using agar well-diffusion testing. All the tested isolates showed inhibition by Ag-CS NPs. As seen in Table 4, various bacteria showed different MICs. The MICs varied from 25 to 5 mg/mL. Seven isolates showed an MIC of 10 mg/mL (Md2, Md7, Md8, Md14, Md15, Md16, and Md17), followed by 5 mg/mL for six isolates (Md1, Md9, Md10, Md11, Md18, and Md19). Three isolates showed an MIC of 15 mg/mL (Md5, Md6, and Md13), followed by two isolates with an MIC of 20 mg/mL (Md4 and Md12) and one isolate with an MIC of 25 mg/mL (Md3). Four Gram-positive (Md2, Md7 Md8, and Md15), two Gram-negative (Md14 and Md16), and one fungal isolate (Md18) showed an MIC of 10 mg/mL, while four Gram-positive (Md1, Md9, Md12, and Md18) and two Gram-negative (Md11 and Md19) isolates showed an MIC of 5 mg/mL. Two Gram-positive (Md5 and Md6) and one Gram-negative (Md13) isolate showed an MIC of 15 mg/mL. Two Gram-positive isolates (Md4 and Md12) showed an MIC of 20 mg/mL, and one Gram-positive isolate (Md3) showed an MIC of 25 mg/mL.
The minimum inhibitory concentrations of MRSA varied from 25 mg/mL to 5 mg/mL. Out of the eight MRSA isolates (Md2 to Md9), MRSA nos. 1, 6, and 7 showed an MIC of 10 mg/mL. MRSA 8 showed an MIC of 5 mg/mL; MRSAs 4 and 5 showed an MIC of 15 mg/mL; and MRSAs 3 and 2 showed an MIC of 20 mg/mL and 25 mg/mL, respectively. For other Gram-positive isolates, Md1 (Staphylococcus aureus), Md10 (S. epidermidis), and Md18 (S. aureus ATCC) showed an MIC of 5 mg/mL. Md12 (S. xylosus) showed an MIC of 20 mg/mL, and Md15 (S. saprophyticus) showed an MIC of 10 mg/mL. For Gram-negative isolates, Md11 and Md19 (Alcaligenes faecalis and Morganella morganii) showed an MIC of 5 mg/mL. Md 14 and Md16 (Escherichia coli and Pseudomonas aeruginosa) showed an MIC of 10 mg/mL each, and Md 13 (Klebsiella pneumoniae) showed an MIC of 15 mg/mL. Md17 (Candida ablicans) showed an MIC of 10 mg/mL. Two different controls were used, plant extract control and antibiotic control discs (vancomycin (Va), 30 μg; and gatifloxacin (Gat), 5 μg) for comparison in the MIC analysis. The plant extract showed inhibitory activity against 12 isolates. Seven isolates did not show any zone of inhibition. Out of the 12 isolates showing inhibitions by plant extract, 6 were Gram-positive (Md1 and 5 MRSA isolates—MRSA1, MRSA3, MRSA4, MRSA5, and MRSA8) and 5 Gram-negative isolates (Md 11, Md13, Md14, Md16, and Md19). Candida albicans (Md17) was also inhibited by the plant extract control.

2.4. Discussion

Ag-CS NPs’ application in MB dye reduction in the presence of a more complex system such as the common ions Na+, K+, and Ca2+ in water was studied, as shown in Figure 8b. The obtained data revealed that Ag-CS NPs are effective and efficient at reducing the MB dye even in the presence of a complex system of common ions. However, the reduction capability of MB dye in a complex mixture was slightly compromised due to the salt formation of phytochemicals at the Ag-CS NPs’ surface. Scheme 1 represents the plausible mechanism of MB dye reduction in the presence of synergistic effects of Ag-CS NPs and NaBH4 doses. The efficient catalytic reduction of MB dye using Ag-CS NPs with NaBH4 can be explored on the basis of electron relay generation due to the different redox potentials. Borohydride ( B H 4 ) ions act as an electron donor, while MB dye molecules serve as the electron acceptor; however, at elevated points, a high redox potential difference hampers the dye reduction. Phytochemical-stabilized Ag-CS NPs provide the surface to enrich the MB dye, and B H 4 originate the process, which tends to thermodynamically and kinetically reduce the dye in colorless Leuco form [43,53]. Ag-CS NPs and sodium borohydride create a synergistic effect that efficiently reduces organic pollutants and drugs.
Antibacterial and antifungal activities were carried out on 19 isolates using Ag-CS NPs. All the isolates studied were inhibited by the Ag NPs. They showed activity against both Gram-positive (including 8 MRSA multi drug resistant isolates), Gram-negative isolates and 1 fungal isolate. The neat plant extract showed a very minimal zone of inhibition, indicating various active antimicrobial agents, as seen in the Supplementary Table S1, which identified the 14 phytochemical compounds found by GC-MS in the water extract of CS. The results demonstrate the very strong antibacterial and antifungal activities of the Ag-CS NPs, as shown in Figure 9A–H for MRSA and other microorganisms, including fungal ones. Ag-CS NPs have small particle sizes and a very large surface area. These attributes help them attach themselves to the cell-wall surfaces of the microorganisms. The phytochemicals found in the CS also directly interact with the bacterial and fungal cell-wall proteins, thereby rupturing the cells and inhibiting growth.

3. Materials and Methods

3.1. Materials

Sodium borohydride (NaBH4, 99.9%), silver nitrate (AgNO3, 99.9%), methylene blue (C16H18ClN3S, 99.9%), calcium chloride (CaCl2), methanol (99.5%), potassium chloride (KCl), and sodium chloride (NaCl) were procured from Sigma-Aldrich (Taufkirchen, Germany) and used without additional purification. All of the tests were conducted with deionized water produced by a Milli-Q system. Caralluma subulata (CS) slenders were obtained from a healthy plant, which was naturally raised in a wooded area of Jazan’s northern region, Saudi Arabia. Antimicrobial testing was carried out against 19 different microorganisms (n = 19), performed at Jazan University’s Faculty of Science, Division of Biology, Microbiology Laboratory. Specifically, five Gram-negative bacteria, thirteen Gram-positive bacteria, and one fungal strain were employed. Gram-positive bacteria consisted of Md 1 Staphylococcus aureus, multiple-drug-resistant Staphylococcus aureus (MRSA) types Md2 through Md9 (8 strains of MRSA–1 to MRSA–8), Md10 Staphylococcus epidermidis, Md12 Staphylococcus xylosus, Md15 Staphylococcus saprophyticus, and Md18 Staphylococcus aureus ATCC. Five Gram-negative strains included Md11 Alcaligenes faecalis, Md13 Klebsiella pneumoniae, Md14 Escherichia coli, Md16 Pseudomonas aeruginosa, and Md19 Morganella morganii. Md17 Candida albicans was the fungi used in this study to determine the antifungal activity of the Ag-CS NPs. All the microbes were maintained on sterile nutrient agar plates till further use. All of the above strains, except for Md18 Staphylococcus aureus ATCC, were locally isolated and identified by biochemical tests, and some by 16sDNA gene sequencing [54].

3.2. The Botany of Caralluma subulate (CS) Slender and Preparation of Aqueous Extract

The plant material selected for this study was the stem of Caralluma subulata (Forssk.) Decne., belonging to the flowering-plant family Apocynaceae. It is a succulent shrub and grows primarily in the borderlines of deserts and of slopes of mountains. The native range of distribution is located in Southeastern Arabian Peninsula. For the present study, the fresh succulent stems were collected from Wadi Jizan, Southwestern Saudi Arabia, and authenticated by Dr. Remesh Moochikkal, Curator Jazan University Herbarium. The voucher specimens were also deposited in Jazan University Herbarium for further reference, with the voucher number JAZUH 1321.
Naturally and healthy grown fresh CS green slenders were collected and cleaned with running water and then washed again in double-distilled water. The CS slenders were sliced thin, cleaned twice in distilled water, and dried in the shade for 10 days. The dried small slenders were crushed into a fine powder through grinding (Blender, Model 24CB10C, Waring Commercial, Stamford, CT, USA). In addition, 25 g of CS powder was added to 600 mL of double-distilled water and heated at 90 °C for 4 h to obtain an aqueous extract of CS. Light-orange-colored CS extract was attained and filtered using Whatman filter paper. CS slender extract was characterized by GC-MS and used for green synthesis of stabilized AgNPs. The workflow is shown as a schematic representation in Figure 10a,b.

3.3. GC-MS Analysis of CS Slender Extract

A solvent evaporator (Hei-VAP, Hei-dolph, Schwabach, Germany) was used to dehydrate CS aqueous extract and dissolved in methanol to be applied in the GC-MS analysis (model; QP2010 Ultra, Shimadzu Corporation, Kyoto, Japan) in order to explore the presence of phytochemicals. CS slender phytochemicals were separated by using a TG-5MS SIL column of fused silica capillaries (30 m length × 0.25 mm internal diameter) which was coated with a thin coating of stationary phase material (0.25 μm in thickness) (Restek Corporation, Centre County, PA, USA). Helium gas was used as the carrier, with a constant linear velocity of 36.3 cm/s. The AOC-20i+s autoinjector was used to inject a 1.0 μL volume of CS slender samples, and the injector port temperature was set at 230 °C; meanwhile, the oven temperature was maintained at 50 °C for 2.0 min, with the heating rate 8 °C/min to 280 °C and sustained for 20 min per each. Total Ion Chromatogram (TIC) was obtained for the range of m/z 50–500, with the MS ion source temperature set at 230 °C, and the interface temperature was 280 °C. The National Institute of Standards and Technology (NIST, Ver. 11) library was used for the comparison and identification of mass spectra obtained from the GC-MS. The CS-slender-based phytochemicals’ relative amount was estimated by using the peak area comparison with respect to the sum of chromatogram peak areas.

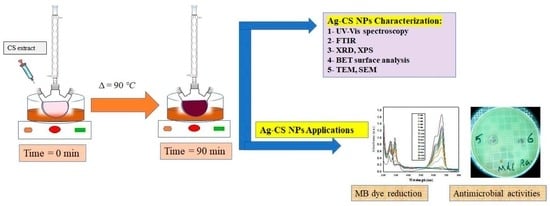
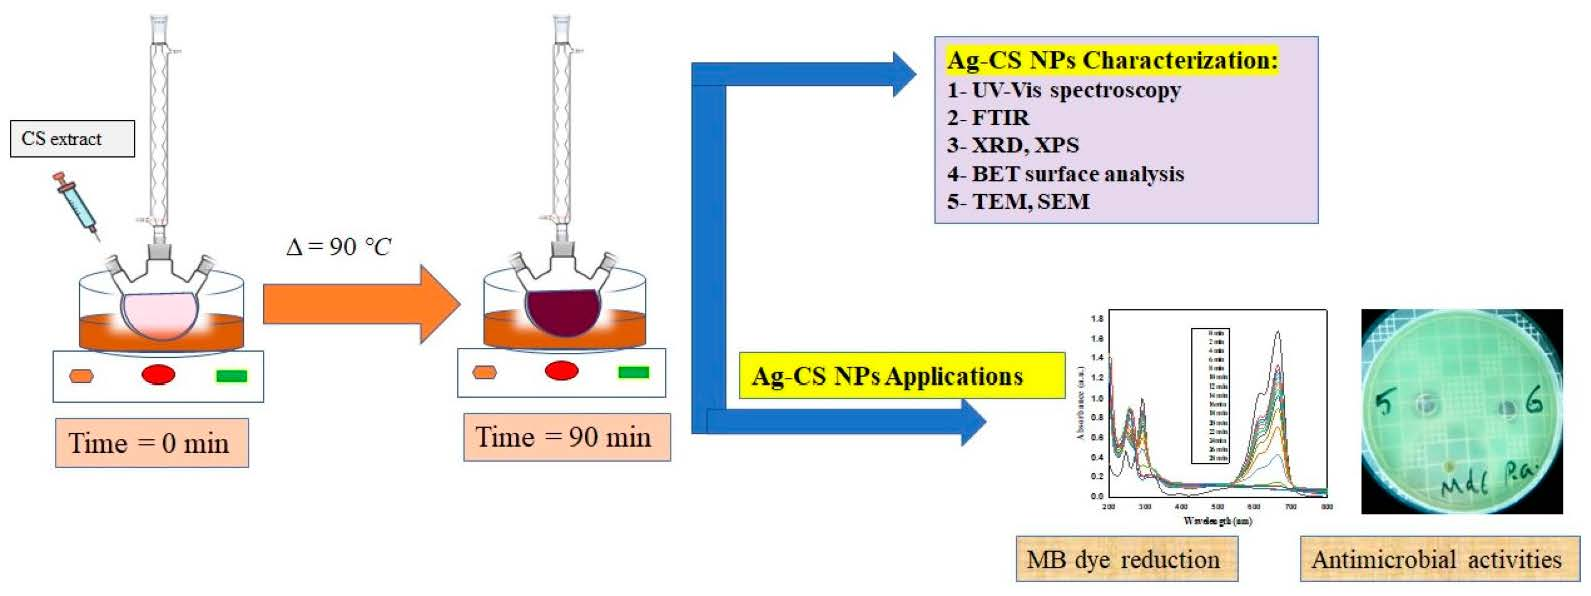
3.4. Synthesis of CS-Slender Based Ag-CS NPs

Silver nanoparticles were synthesized using AgNO3 (2.0 mM) by adding CS-slender aqueous extract, which was preheated at 90 °C, in a dark environment. The reaction mixture solution started to change the color of the reaction solution from orange to slight red, and finally the suspension was converted to a deep brown color. Therefore, color conversion refers to the formation and stabilization of Ag-CS NPs. A schematic representation is shown in Figure 10a,b. The silver-ion reduction by phytochemicals was monitored by UV-Vis spectroscopy. Ag-CS NPs were further obtained by centrifugation (Model No. 5452, Eppendorf AG, Hamburg, Germany) at 13,000 rpm from the resultant reaction mixture. Then, the obtained Ag-CS NPs were washed with water and methanol and dried in an oven at 80 °C, overnight.

3.5. Characterization of Ag-CS NPs

Ag-CS NPs’ formation and MB dye reduction were characterized by UV-Vis spectrophotometer (SCO TECH, SPUV-26, Dingelstädt, Germany) in the range of 200 to 800 nm. The size, crystallinity, and phase structure of Ag-CS NPs were verified by XRD, using LabX-XRD-6000-Shimadzu, Kyoto, Japan. The size and surface morphology with elemental analysis were studied using high-resolution scanning electron microscopy (HRSEM) and analyzed with an FEG 250 with a field emission gun, FEI−Netherlands. A sample suspension of Ag-CS NPs (10 μL) was dried at 80 °C, under vacuum, overnight, before being exposed to HRSEM. The shape and surface morphology of Ag-CS NPs were characterized by using a Transmission Electron Microscope (TEM), JEOL HRTEM, JEM-2100F (Tokyo, Japan) instrument at 120 kV. The Ag-CS NPs suspension was prepared in methanol, spotted onto a Cu grid, and dried under vacuum at 80 °C, overnight. The X-ray photoelectron spectroscopy (XPS) examination of the surface bonding of Ag-CS NPs to the phytochemicals was carried out using a surface science instrument X-probe, X-Ray000 400 m-FG ON (400 m). The CS-slender aqueous extract and Ag-CS NPs surface functional group were characterized by FTIR (Prestige-21, Shimadzu, Japan, IR spectrometer). Thermogravimetric analysis (TGA) (DTG-60H simultaneous DTA-TG Apparatus, Shimadzu, Kyoto, Japan) was used to determine the thermal stability of Ag-CS NPs in a nitrogen atmosphere, at a heating rate of 5.0 °C min−1.

3.6. MB Dye Reduction Using Ag-CS NPs

Ag-CS NPs were applied and used as a catalyst in the presence of freshly prepared NaBH4 to reduce the water-based pollutant MB dye. Different doses of sonicated Ag-CS NPs were applied in 4 mL quartz cuvette, using 1.0 mM MB dye and different doses of NaBH4 (5.0 mM) at a constant overall volume of 3 mL. The reduction reaction of MB dye was monitored by UV-Vis spectroscopy at a 2 min time interval, and % reduction was calculated using Equation (2).
R e d u c t i o n   % = A o A t A o × 100
where A o represents the initial absorbance of MB dye, while A t refers to the absorption after t (time reduction).

3.7. Antimicrobial Sensitivity Testing

Antimicrobial sensitivity testing was carried out against the abovementioned 19 Gram-positive, Gram-negative, and fungal isolates. The agar well-diffusion method was used. Microorganisms were cultured on sterile Muller and Hinton agar (MHA) petri plates, using sterile cotton swabs. A sterile 8.0 mm metallic cork borer was used to dig wells into MHA plates. A 24 h fresh culture of microbial isolates was used. The concentration of microorganisms corresponded to 0.5 McFarlands turbidity standard tubes (1.5 × 10⁸ colony forming unites/mL). Six different Ag-CS NPs concentrations were used, namely 30, 25, 20, 15, 10, and 5 mg. A total of 100 μL of each concentration was inoculated in its representative well in the sterile Hinton–Muller and plates. Then, 100 μL of undiluted plant extract was used as plant control, and vancomycin antibiotic (Va 30 μg) was selected as control for Gram-positive bacteria, and gatifloxacin antibiotic (Gat 5 μg) was used as control for Gram-negative bacteria. The plates were kept for 24 h at 37 °C. Zones of inhibition were observed for each concentration and were estimated in millimeters (mm), using a scale for measuring zones (Himedia, Mumbai, India). Minimum inhibition concentrations were measured as the lowest concentration of Ag-CS NPs showing zone-of-inhibition of growth. All the tests were carried out in triplicates, and the procedures complied with the standards of the Clinical and Laboratory Standards Institute (CLSI, 2000).

4. Conclusions

In this study, Ag-CS NPs were synthesized via a green biogenic synthesis protocol, using Caralluma subulata (CS) as reducing and capping/protecting agent. The results showed that a crystalline, negative surface is passivated with different phytochemicals from CS extract. The elemental analysis result obtained from the XPS analysis confirmed the presence of Ag, C, O, and N, as is consistent with other results. The performance of Ag-CS NPs was evaluated on methylene blue (MB) dye degradation and antibacterial activity tests against 19 Gram-positive and Gram-negative bacterial isolates. The results displayed a synergistic effect, with a 95.52% efficient catalytic reduction of MB being attained within 28 min, using Ag-CS NPs (0.05%, 20.0 μL) with NaBH4 (10.0 mM, 0.980 μL) in 10 mg/mL MB solution. The catalytic reduction of MB was best fitted with Zero-order chemical kinetics (R2 = 0.9380), with a reaction rate constant of 0.0508 mol L−1 min−1. Moreover, the as-prepared Ag-CS NPs were tested as antimicrobial agents against Gram-positive and Gram-negative bacterial and fungal isolates, and the results revealed higher inhibition activity. Therefore, Ag-CS NPs that are synthesized using CS aqueous extracts could be a potential candidate for the effective reduction of organic pollutants; they can also be used as antibacterial and antifungal agents and in other biological applications.

Supplementary Materials

The following supporting information can be downloaded at https://www.mdpi.com/article/10.3390/catal13091290/s1, Table S1: List of phytochemicals identified in aqueous extract of Caralluma subulata by gas chromatography–mass spectrometry (GC-MS), along with their retention times, peak area %, similarity index, and molecular weight. Figure S1: Zeta potential of Ag-CS NPs. Bioactive compounds in the extract are shown in Table S1. Table S2: XRD different peaks-based crystallinity calculation. Figure S2: Gas chromatography–mass spectrometry (GC-MS) chromatogram of aqueous extract of Caralluma subulata. Figure S3: Thermogravimetric analysis (TGA) of Ag-CS NPs. Figure S4: SEM images of Ag-CS NPs after application MB dye reduction using NaBH4. Figure S5: TEM images of Ag-CS NPs after MB dye reduction using NaBH4.

Author Contributions

Conceptualization, N.H. and W.M.A.; methodology, W.M.A.; N.H.; software, N.H. and W.M.A.; validation, N.H., A.M.B. and K.S.I.; formal analysis, I.S.S.; investigation, N.H., and W.M.A.; resources, W.M.A.; data curation, G.G.; W.M.G.; writing—original draft preparation, N.H.; writing—review and editing, N.H. and W.M.A.; visualization, A.M.B. and K.S.I.; supervision, N.H.; project administration, W.M.A.; funding acquisition, N.H. and W.M.A. All authors have read and agreed to the published version of the manuscript.

Funding

Deanship of Scientific Research, Jazan University funded this research work through the Research Units Support Program, Support Number: RUP2-02.

Data Availability Statement

The data presented in this study are available on request from the corresponding author.

Acknowledgments

The authors extend their appreciation to Deanship of Scientific Research, Jazan University, for supporting this research work through the Research Units Support Program, Support Number: RUP2-02.

Conflicts of Interest

The authors declare no conflict of interest.

References

  1. Haseena, M.; Malik, M.F.; Javed, A.; Arshad, S.; Asif, N.; Zulfiqar, S.; Hanif, J. Water pollution and human health. Environ. Risk Assess. Remediat. 2017, 1, 16–19. [Google Scholar] [CrossRef]
  2. Dayalan, S.; Gedda, G.; Li, R.N.; Zulfajri, M.; Huang, G.G. Vancomycin functionalization of gold nanostars for sensitive detection of foodborne pathogens through surface-enhanced Raman scattering. J. Chin. Chem. Soc. 2022, 69, 2049–2060. [Google Scholar] [CrossRef]
  3. Khan, M.S.; Gedda, G.; Gopal, J.; Wu, H.-F. Probing the cytotoxicity of CdS–MPA and CdSe–MUA QDs on the bacterial pathogen Staphylococcus aureus using MALDI-MS. Anal. Methods 2014, 6, 5304–5313. [Google Scholar] [CrossRef]
  4. Mandal, S.; Alankar, T.; Hughes, R.; Marpu, S.B.; Omary, M.A.; Shi, S.Q. Removal of hazardous dyes and waterborne pathogens using a nanoengineered bioadsorbent from hemp—Fabrication, characterization and performance investigation. Surf. Interfaces 2022, 29, 101797. [Google Scholar] [CrossRef]
  5. WHO. Guidelines for Drinking-Water Quality; World Health Organization: Geneva, Switzerland, 2002.
  6. Guo, Z.; Chen, Y.; Wang, Y.; Jiang, H.; Wang, X. Advances and challenges in metallic nanomaterial synthesis and antibacterial applications. J. Mater. Chem. B 2020, 8, 4764–4777. [Google Scholar] [CrossRef]
  7. Hutchings, M.I.; Truman, A.W.; Wilkinson, B. Antibiotics: Past, present and future. Curr. Opin. Microbiol. 2019, 51, 72–80. [Google Scholar] [CrossRef] [PubMed]
  8. Alaoui Mdarhri, H.; Benmessaoud, R.; Yacoubi, H.; Seffar, L.; Guennouni Assimi, H.; Hamam, M.; Boussettine, R.; Filali-Ansari, N.; Lahlou, F.A.; Diawara, I. Alternatives therapeutic approaches to conventional antibiotics: Advantages, limitations and potential application in medicine. Antibiotics 2022, 11, 1826. [Google Scholar] [CrossRef]
  9. Hasan, N.; Guo, Z.; Wu, H.-F. Large protein analysis of Staphylococcus aureus and Escherichia coli by MALDI TOF mass spectrometry using amoxicillin functionalized magnetic nanoparticles. Anal. Bioanal. Chem. 2016, 408, 6269–6281. [Google Scholar] [CrossRef]
  10. Lellis, B.; Fávaro-Polonio, C.Z.; Pamphile, J.A.; Polonio, J.C. Effects of textile dyes on health and the environment and bioremediation potential of living organisms. Biotechnol. Res. Innov. 2019, 3, 275–290. [Google Scholar] [CrossRef]
  11. Gandi, S.S.; Gandi, S.; Parne, S.R.; Lakavat, M.; Lakkimsetty, N.R.; Gedda, G. Bio-Inspired C/N/TiO2 Hybrid Composite Heterostructure: Enhanced Photocatalytic Activity under Visible Light. J. Nanotechnol. 2022, 2022, 5816063. [Google Scholar] [CrossRef]
  12. Manoharan, M. Research on the frontiers of materials science: The impact of nanotechnology on new material development. Technol. Soc. 2008, 30, 401–404. [Google Scholar] [CrossRef]
  13. Talebian, S.; Rodrigues, T.; Das Neves, J.; Sarmento, B.; Langer, R.; Conde, J. Facts and figures on materials science and nanotechnology progress and investment. ACS Nano 2021, 15, 15940–15952. [Google Scholar] [CrossRef] [PubMed]
  14. Gopal, J.; Wu, H.-F.; Gangaraju, G. Quantifying the degradation of extracellular polysaccharides of Escherichia coli by CdS quantum dots. J. Mater. Chem. 2011, 21, 13445–13451. [Google Scholar] [CrossRef]
  15. Gedda, G.; Chen, G.-R.; Yao, Y.-Y.; Girma, W.M.; Li, J.-D.; Yen, C.-L.; Ling, Y.-C.; Chang, J.-Y. Aqueous synthesis of dual-targeting Gd-doped CuInS2/ZnS quantum dots for cancer-specific bi-modal imaging. New J. Chem. 2017, 41, 14161–14170. [Google Scholar] [CrossRef]
  16. Garg, R.; Rani, P.; Garg, R.; Khan, M.A.; Khan, N.A.; Khan, A.H.; Américo-Pinheiro, J.H.P. Biomedical and catalytic applications of agri-based biosynthesized silver nanoparticles. Environ. Pollut. 2022, 310, 119830. [Google Scholar] [CrossRef] [PubMed]
  17. Sharma, D.; Kanchi, S.; Bisetty, K. Biogenic synthesis of nanoparticles: A review. Arab. J. Chem. 2019, 12, 3576–3600. [Google Scholar] [CrossRef]
  18. Iravani, S.; Korbekandi, H.; Mirmohammadi, S.V.; Zolfaghari, B. Synthesis of silver nanoparticles: Chemical, physical and biological methods. Res. Pharm. Sci. 2014, 9, 385. [Google Scholar]
  19. Ghorbani, H.R.; Safekordi, A.A.; Attar, H.; Sorkhabadi, S. Biological and non-biological methods for silver nanoparticles synthesis. Chem. Biochem. Eng. Q. 2011, 25, 317–326. [Google Scholar]
  20. Alaqad, K.; Saleh, T.A. Gold and silver nanoparticles: Synthesis methods, characterization routes and applications towards drugs. J. Environ. Anal. Toxicol. 2016, 6, 525–2161. [Google Scholar] [CrossRef]
  21. Khan, S.H. Green nanotechnology for the environment and sustainable development. In Green Materials for Wastewater Treatment; Springer: Cham, Germany, 2020; pp. 13–46. [Google Scholar]
  22. Khan, F.; Shariq, M.; Asif, M.; Siddiqui, M.A.; Malan, P.; Ahmad, F. Green nanotechnology: Plant-mediated nanoparticle synthesis and application. Nanomaterials 2022, 12, 673. [Google Scholar] [CrossRef]
  23. Talib, A.; Khan, M.S.; Gedda, G.; Wu, H.-F. Stabilization of gold nanoparticles using natural plant gel: A greener step towards biological applications. J. Mol. Liq. 2016, 220, 463–467. [Google Scholar] [CrossRef]
  24. Cuong, H.N.; Pansambal, S.; Ghotekar, S.; Oza, R.; Hai, N.T.T.; Viet, N.M.; Nguyen, V.-H. New frontiers in the plant extract mediated biosynthesis of copper oxide (CuO) nanoparticles and their potential applications: A review. Environ. Res. 2022, 203, 111858. [Google Scholar] [CrossRef] [PubMed]
  25. Sharma, V.K.; Yngard, R.A.; Lin, Y. Silver nanoparticles: Green synthesis and their antimicrobial activities. Adv. Colloid Interface Sci. 2009, 145, 83–96. [Google Scholar] [CrossRef]
  26. Venkatadri, B.; Shanparvish, E.; Rameshkumar, M.; Arasu, M.V.; Al-Dhabi, N.A.; Ponnusamy, V.K.; Agastian, P. Green synthesis of silver nanoparticles using aqueous rhizome extract of Zingiber officinale and Curcuma longa: In-vitro anti-cancer potential on human colon carcinoma HT-29 cells. Saudi J. Biol. Sci. 2020, 27, 2980–2986. [Google Scholar] [CrossRef] [PubMed]
  27. Wei, S.; Wang, Y.; Tang, Z.; Hu, J.; Su, R.; Lin, J.; Zhou, T.; Guo, H.; Wang, N.; Xu, R. A size-controlled green synthesis of silver nanoparticles by using the berry extract of Sea Buckthorn and their biological activities. New J. Chem. 2020, 44, 9304–9312. [Google Scholar] [CrossRef]
  28. Gilbert, M. A review of Pehr Forsskål’s stapeliads and the typification of Caralluma quadrangula and C. subulata (Asclepiadaceae). Bradleya 1989, 1989, 79–83. [Google Scholar] [CrossRef]
  29. Masrahi, Y.S.; Al-Turki, T.A.; Sayed, O.H. Crassulacean Acid Metabolism Permutation and Survival of Caralluma Species (Apocynaceae) in Arid Habitats. Ecol. Balk. 2012, 4, 63–71. [Google Scholar]
  30. Sharawy, S.; Kamel, E.; Karakish, E.; Loutfy, M. A systematic revision on Caralluma species of Saudi Arabia based on karyological and molecular data. Pak. J. Bot 2015, 47, 937–950. [Google Scholar]
  31. Ramesh, M.; Rao, Y.N.; Kumar, M.R.; Rao, A.V.N.A.; Prabhakar, M.; Reddy, B.M. Antinociceptive and anti-inflammatory activity of carumbelloside-I isolated from Caralluma umbellata. J. Ethnopharmacol. 1999, 68, 349–352. [Google Scholar] [CrossRef]
  32. Zakaria, M.; Islam, M.; Radhakrishnan, R.; Chen, H.; Kamil, M.; Al-Gifri, A.; Chan, K.; Al-Attas, A. Anti-nociceptive and anti-inflammatory properties of Caralluma arabica. J. Ethnopharmacol. 2001, 76, 155–158. [Google Scholar] [CrossRef]
  33. Albers, F.; Meve, U. Illustrated Handbook of Succulent Plants: Asclepiadaceae: Asclepiadaceae; Springer Science & Business Media: Berlin/Heidelberg, Germany, 2002. [Google Scholar]
  34. Ansari, B.; Behl, T.; Pirzada, A.S.; Khan, H. Caralluma edulis (Apocynaceae): A comprehensive review on its traditional uses, phytochemical profile and pharmacological effects. Curr. Top. Med. Chem. 2022, 22, 1501–1514. [Google Scholar] [CrossRef]
  35. Alqahtani, S.S.; Makeen, H.A.; Menachery, S.J.; Moni, S.S. Documentation of bioactive principles of the flower from Caralluma retrospiciens (Ehrenb) and in vitro antibacterial activity—Part B. Arab. J. Chem. 2020, 13, 7370–7377. [Google Scholar] [CrossRef]
  36. Alamier, W.M.; Hasan, N.; Ali, S.K.; Oteef, M.D.Y. Biosynthesis of Ag nanoparticles using Caralluma acutangula extract and its catalytic functionality towards degradation of hazardous dye pollutants. Crystals 2022, 12, 1069. [Google Scholar] [CrossRef]
  37. Naseem, K.; Zia Ur Rehman, M.; Ahmad, A.; Dubal, D.; AlGarni, T.S. Plant extract induced biogenic preparation of silver nanoparticles and their potential as catalyst for degradation of toxic dyes. Coatings 2020, 10, 1235. [Google Scholar] [CrossRef]
  38. Kim, B.; Song, W.C.; Park, S.Y.; Park, G. Green synthesis of silver and gold nanoparticles via Sargassum serratifolium extract for catalytic reduction of organic dyes. Catalysts 2021, 11, 347. [Google Scholar] [CrossRef]
  39. Litvin, V.A.; Minaev, B.F. Spectroscopy study of silver nanoparticles fabrication using synthetic humic substances and their antimicrobial activity. Spectrochim. Acta Part A Mol. Biomol. Spectrosc. 2013, 108, 115–122. [Google Scholar] [CrossRef]
  40. Kora, A.J.; Sashidhar, R.; Arunachalam, J. Aqueous extract of gum olibanum (Boswellia serrata): A reductant and stabilizer for the biosynthesis of antibacterial silver nanoparticles. Process Biochem. 2012, 47, 1516–1520. [Google Scholar] [CrossRef]
  41. Siddiqui, M.R.H.; Adil, S.; Assal, M.; Ali, R.; Al-Warthan, A. Synthesis and characterization of silver oxide and silver chloride nanoparticles with high thermal stability. Asian J. Chem. 2013, 25, 3405–3409. [Google Scholar] [CrossRef]
  42. Ostovar, F.; Ansari, R.; Moafi, H. Preparation and application of silver oxide/sawdust nanocomposite for Chromium (VI) ion removal from aqueous solutions using column system. Glob. Nest J. 2017, 19, 412–422. [Google Scholar]
  43. Alamier, W.M.; Oteef, D.Y.M.; Bakry, A.M.; Hasan, N.; Ismail, K.S.; Awad, F.S. Green Synthesis of Silver Nanoparticles Using Acacia ehrenbergiana Plant Cortex Extract for Efficient Removal of Rhodamine B Cationic Dye from Wastewater and the Evaluation of Antimicrobial Activity. ACS Omega 2023, 8, 18901–18914. [Google Scholar] [CrossRef]
  44. Adebayo-Tayo, B.; Salaam, A.; Ajibade, A. Green synthesis of silver nanoparticle using Oscillatoria sp. extract, its antibacterial, antibiofilm potential and cytotoxicity activity. Heliyon 2019, 5, e02502. [Google Scholar] [CrossRef] [PubMed]
  45. Alamier, W.M.; Hasan, N.; Nawaz, M.D.S.; Ismail, K.S.; Shkir, M.; Malik, M.A.; Oteef, M.D.Y. Biosynthesis of NiFe2O4 nanoparticles using Murayya koenigii for photocatalytic dye degradation and antibacterial application. J. Mater. Res. Technol. 2023, 22, 1331–1348. [Google Scholar] [CrossRef]
  46. David, L.; Moldovan, B. Green synthesis of biogenic silver nanoparticles for efficient catalytic removal of harmful organic dyes. Nanomaterials 2020, 10, 202. [Google Scholar] [CrossRef] [PubMed]
  47. Manikandan, V.; Velmurugan, P.; Park, J.-H.; Chang, W.-S.; Park, Y.-J.; Jayanthi, P.; Cho, M.; Oh, B.-T. Green synthesis of silver oxide nanoparticles and its antibacterial activity against dental pathogens. 3 Biotech 2017, 7, 72. [Google Scholar] [CrossRef] [PubMed]
  48. Raj, S.; Singh, H.; Trivedi, R.; Soni, V. Biogenic synthesis of AgNPs employing Terminalia arjuna leaf extract and its efficacy towards catalytic degradation of organic dyes. Sci. Rep. 2020, 10, 9616. [Google Scholar] [CrossRef] [PubMed]
  49. Jawhari, A.H.; Hasan, N.; Radini, I.A.; Malik, M.A.; Narasimharao, K. Pt-Ag/Ag3PO4-WO3 nanocomposites for photocatalytic H2 production from bioethanol. Fuel 2023, 344, 127998. [Google Scholar] [CrossRef]
  50. Vadlapudi, V.; Amanchy, R. Phytofabrication of silver nanoparticles using Myriostachya wightiana as a novel bioresource, and evaluation of their biological activities. Braz. Arch. Biol. Technol. 2017, 60. [Google Scholar] [CrossRef]
  51. Premanand, G.; Shanmugam, N.; Kannadasan, N.; Sathishkumar, K.; Viruthagiri, G. Nelumbo nucifera leaf extract mediated synthesis of silver nanoparticles and their antimicrobial properties against some human pathogens. Appl. Nanosci. 2016, 6, 409–415. [Google Scholar] [CrossRef]
  52. Gola, D.; Kriti, A.; Bhatt, N.; Bajpai, M.; Singh, A.; Arya, A.; Chauhan, N.; Srivastava, S.K.; Tyagi, P.K.; Agrawal, Y. Silver nanoparticles for enhanced dye degradation. Curr. Res. Green Sustain. Chem. 2021, 4, 100132. [Google Scholar] [CrossRef]
  53. Saha, P.; Mahiuddin, M.; Islam, A.N.; Ochiai, B. Biogenic synthesis and catalytic efficacy of silver nanoparticles based on peel extracts of citrus macroptera fruit. ACS Omega 2021, 6, 18260–18268. [Google Scholar] [CrossRef]
  54. Essa, A.M.M.; Al Abboud, M.A.; Khatib, S.I. Metal transformation as a strategy for bacterial detoxification of heavy metals. J. Basic Microbiol. 2018, 58, 17–29. [Google Scholar] [CrossRef]
Figure 1. (a) UV-visible spectra of CS extract and Ag-CS NPs’ synthesis; FTIR of (b) CS extract and (c) Ag-CS NPs.
Catalysts 13 01290 g001
Figure 2. SEM (a), TEM (b), and particle distribution (c) of Ag-CS NPs.
Catalysts 13 01290 g002
Figure 3. XRD analysis of CA-Ag NPs. * Unassigned peaks.
Catalysts 13 01290 g003
Figure 4. XPS spectra of green synthesized Ag-CS NPs: (a) survey spectrum, (b) Ag 3d, (c) O 1s, (d) C1s, and (e) N1s.
Catalysts 13 01290 g004
Figure 5. BET surface area nitrogen adsorption–desorption isotherms of Ag-CS NPs (a), BET linearity graph (b), and pore diameter of bio-fabricated Ag-CS NPs (c).
Catalysts 13 01290 g005
Figure 6. MB-dye-reduction studies using AgNPs-CS NPs and NaBH4. (a) UV-visible spectra. (b) MB reduction %. (c) Ct/Co (%) vis time graph. Chemical kinetic with linear equation model for MB reduction: zero order (d), first order (e), and second order (f).
Catalysts 13 01290 g006
Figure 7. MB dye reduction at different conditions: (a) with and without Ag-CS NPs (0.05%, 10 μL dose) or NaBH4 (10 mM); (b) different NaBH4 concentrations (5 to 30 mM), with constant dose of Ag-CS NPs (0.05%, 20 μL); and (c) different Ag-CS NP doses (10, 20, 25, and 30 μL), with constant concentration of NaBH4 (10 mM).
Catalysts 13 01290 g007
Figure 8. MB dye catalytic reduction using Ag-CS NPs and NaBH4 after application of different (a) pH values and (b) common ion effects.
Catalysts 13 01290 g008
Scheme 1. Schematic representation of plausible speculated mechanism for MB reduction to colorless Leucomethylene blue (LMB) form after application of synergistic effect of Ag-CS NPs and NaBH4.
Catalysts 13 01290 sch001
Figure 9. Antibacterial activity of silver nanoparticles derived from Caralluma subulata extract against Gram-positive methicillin-resistant Staphylococcus aureus (MRSA) isolate no. Md9 (A,B), Gram-positive Staphylococcus epidremidis isolate no. Md 11 (C,D), Gram-negative Pseudomonas aeruginosa isolate no. Md 16 (E,F), and Gram-negative Morganella morganii isolate no Md19 (G,H) on Muller and Hinton agar (MHA). Concentrations in wells are 30 mg/mL, 25 mg/mL, 20 mg/mL, 15 mg/mL, 10 mg/mL, and 5 mg/mL. Controls used: plant extract control (PC) and antibiotic control (AC).
Catalysts 13 01290 g009
Figure 10. Schematic workflow: (a) preparation of CS aqueous extract and (b) Ag-CS NPs’ synthesis.
Catalysts 13 01290 g010
Table 1. BET experimental results of Ag-CS NPs.
Monolayer Adsorption Volume, Vm (cm3 (STP) g−1)Constant, CBET Surface Area
(m2g−1)
3.491737.48415.198
Table 2. Pore-structure parameters of Ag-CS NPs, using BJH model.
Cumulative Surface Area of Pore, SBJH (m2 g−1)Cumulative Pore Volume of Pore, VBJH (cm3·g−1)Average Pore Diameter, dBJH (nm)
27.1050.12318.15
Table 3. Integrated different leaner equation models, regression coefficient (R2), and indigenous rate constant (k), using Ag-CS NPs (0.05%, 20 μL) and NaBH4 (10.0 mM, 0.980 μL).
S. No.Chemical Kinetic ModelLinear Equations
Model
Regression Coefficient (R2) ValueRate Constant (k)
1Zero order C o   C t = k t 0.93800.0508
(mol L−1 min−1)
2First order ln C t C o = k t 0.81450.1131 (min−1)
3Second order 1 C t 1 C o = k t 0.65410.4051
(L mol−1 min−1)
Table 4. Zone of inhibition and minimum inhibitory concentration of Ag-CS NPs against different microbial isolates.
Sr. NoName of MicroorganismGram CharacterConcentrations of Ag-CS NPs Used (mg/mL)Controls Used
30252015105Plant Extract (PC)Antibiotic Control (AC)
Va (30 μg)/Gat (5 μg)
Zone of Inhibition (mm)
Md 1Staphylococcus aureus+ve2926201818 14 1012
Md 2MRSA–1+ve21201917 160 912
Md 3MRSA–2+ve16 140000012
Md 4MRSA–3+ve1514 12000 910
Md 5MRSA–4+ve171514 1300 1011
Md 6MRSA–5+ve171612 1100 910
Md 7MRSA–6+ve16141413 110012
Md 8MRSA–7+ve18171514 120012
Md 9MRSA–8+ve1817141212 11 109
Md 10Staphylococcus epidermidis+ve2422201917 1100
Md 11Alcaligenes faecalis−ve 221814011 10 918
Md 12Staphylococcus xylosus+ve1614 12000011
Md 13Klebsiella pneumoniae−ve 181715 1200 914
Md 14Escherichia coli−ve 18161413 120 928
Md 15Staphylococcus saprophyticus+ve14131211 120011
Md 16Pseudomonas aeruginosa−ve 20181715 130 919
Md 17Candida albicans (Fungi)+ve12111110 100 927
Md 18Staphylococcus aureus ATCC+ve2017151412 11012
Md 19Morganella morganii−ve 2521201720 16 912
Key: +ve = Gram-positive; −ve = Gram-negative. Ag-CS NPs = silver nanoparticles derived from plant extract of Caralluma subulata. Values in bold and underlined indicate zone of inhibitions showing minimum inhibitory concentrations. Va (30 μg) = vancomycin antibiotic used as control for Gram-positive bacteria. Gat (5 μg) = gatifloxacin antibiotic used as control for Gram-negative bacteria. MRSA = methicillin-resistant Staphylococcus aureus.
Disclaimer/Publisher’s Note: The statements, opinions and data contained in all publications are solely those of the individual author(s) and contributor(s) and not of MDPI and/or the editor(s). MDPI and/or the editor(s) disclaim responsibility for any injury to people or property resulting from any ideas, methods, instructions or products referred to in the content.

