
Transform and Deep Learning Algorithms for the Early Detection and Recognition of Tomato Leaf Disease

College of Computer Science and Information Technology, King Faisal University, Al-Ahsa P.O. Box 4000, Saudi Arabia
*
Author to whom correspondence should be addressed.
Agronomy 2023, 13(5), 1184; https://doi.org/10.3390/agronomy13051184
Submission received: 7 March 2023
/
Revised: 14 April 2023
/
Accepted: 18 April 2023
/
Published: 22 April 2023
(This article belongs to the Section Precision and Digital Agriculture)
Abstract
:Plant diseases pose the greatest threat to food supply integrity, and it is a significant challenge to identify plant diseases in their earliest stages to reduce the potential for associated economic damage. Through the use of computer vision, a cutting-edge artificial intelligence is offered as a solution to this problem so that tomato leaf diseases may be classified. The proposed network is expected to provide excellent results. Transfer learning is also used to make the model efficient and cost effective. Since tomato diseases may significantly influence crop output and quality, early identification and diagnosis of these diseases are essential for successful treatment. Deep learning has shown a great deal of promise in plant disease identification, providing excellent accuracy and efficiency. In this investigation, we compared the performance of three different deep learning models—DenseNet169, ResNet50V2, and a transform model, namely ViT, with regard to diagnosing diseases affecting tomatoes. Both diseased and healthy tomato samples were included in the dataset of photos of tomato diseases used for training and testing the models. The DenseNet121 model had the best results, with a training accuracy of (99.88%) and a testing accuracy of (99.00%). This gave it the greatest overall accuracy. Both the ResNet50V2 and VIT models attained high levels of accuracy, with testing accuracies of (95.60% and 98.00%), respectively. Our results demonstrate deep learning’s potential for accurate and efficient tomato disease detection, which could aid in early disease management and ultimately improve crop yield and quality. The experimental findings show that the suggested ensemble models stand out due to the short amount of time required for training and testing as well as their exceptional classification performances. Because of this study, professionals will be able to facilitate the early diagnosis of plant diseases in a straightforward and expedient way, thereby preventing the emergence of new infections.
1. Introduction
Plants are crucial to our survival because they give us sustenance and shield us from radiation. Without plants, it is difficult to imagine there ever being life on Earth; they not only supply food for all terrestrial creatures but also shield the ozone layer, which blocks harmful ultraviolet light. Tomatoes are globally grown vegetables because they are nutrient rich and safe for human consumption [1]. Around 160,000,000 metric tons of tomatoes are consumed annually across the globe [2]. Many people believe that tomato sales could help rural communities earn much-needed income, which would significantly impact poverty levels [3]. Tomatoes have a high concentration of nutrients and are grown all over the world; as a result, they have a major impact on the agricultural economy when cultivated and harvested. Tomatoes are beneficial in preventing diseases, such as gingival bleeding, hypertension, and hepatitis, due to their pharmacological properties [1], and their anti-cancer properties are well documented. Tomatoes are increasingly in demand because of their growing popularity. Statistically, almost 80.00% of agricultural output [2] is attributed to small farmers. However, diseases and pests wipe out approximately half of these farmers’ harvests every year. Research into field crop disease detection is crucial because the diseases and insects that parasitize tomatoes have a profound impact on their growth. According to a 2020 study compiled by the Food and Agricultural Organization Corporate Statistical Database (FAOSTAT), 186,821 million tons of tomatoes were produced globally [1]. Agriculture is the fundamental contributor to economic expansion as well as the foundation upon which human civilization was built. The many different kinds of plant diseases that farmers have to protect their crops against have proven to be a significant obstacle for agricultural production. Understanding how to prevent plant diseases and implementing preventative measures are the two most important factors in crop yield optimization. Early detection of plant diseases is essential if one wants to achieve maximum agricultural output while at the same time preserving financial resources and reducing the amount of crop loss. The fact that everything is handled by computers also makes it simple to put into action. On the one hand, accurate diagnosis and categorization of diseases within a reasonable amount of time is highly important for preserving both the quality and quantity of tomatoes.
Environmental conditions may play a role in the development of a wide range of plant diseases. The disease triangle is a conceptual model that represents the relationship between three crucial factors: the environment, the host, and the infectious agent. The disease triangle was developed to explain how diseases spread. This type was created in the 1950s and has been widely used since its introduction. It follows that disease cannot occur, since it is impossible for it to take place if any one of these three requirements is absent from the triangle. Many abiotic factors, including air movement, temperature, humidity, pH, and watering, could potentially have significant effects on plants. Fungus, bacteria, and viruses are some organisms that may attack a plant. The infectious agent is an organism that causes the plant to become diseased. The term “host” refers to a plant that is infected with a disease. Disease development is the consequence of all the risk factors converging simultaneously [3]. In general, infections are defined by symptoms that manifest by working their way up through the plant, and as a result, the majority of diseases have rapid transmission rates once they have infected a plant.
Pathogenic fungi, bacteria, and viruses, as well as poor climatic conditions, are some of the many potential causes of plant diseases. Because of the presence of these diseases, a plant’s fundamental functions, such as photosynthesis, pollination, fertilization, and germination, may be disrupted. This emphasizes the critical need to accurately diagnose diseases as early as medical science currently allows.
Technology has advanced to the point that it is possible to use tools to diagnose whether a plant is diseased, and if so, what kind of disease it has, rather than relying only on the judgment of a human expert. Results from procedures such as object recognition and classification, as well as image processing and artificial intelligence algorithms, are becoming increasingly high quality as the quality of photos obtained by technological equipment continues to improve. Machine learning (ML) and deep learning (DL) have proved much more effective than traditional methods of optimization and prediction. First, unlike traditional techniques that require humans to extract characteristics and are limited by the amount of data, new systems may learn automatically from large quantities of data. Second, ML and DL models may generalize well to data that have not yet been seen, which is a significant improvement on prior methods. In contrast to more traditional methods, machine learning and deep learning models may pick up on nonlinear and intricate connections in the data. Hence, ML excels at handling situations with many moving parts, especially those with complex interactions. Nowadays, AI (Artificial intelligence) is extensively used in many fields, including communication, building, magnetism, physics, and biology [4,5,6,7,8]. It is crucial to accurately identify plant diseases and classify them in a timely manner in this approach [9]. AI has progressed to the point that it can now automatically identify plant diseases from raw images [10,11].
To date, there has been much research on determining the causes of plant diseases. Most studies used preexisting datasets, models, and libraries to conduct their experiments. To automate the processes of identifying and classifying plant leaf diseases, Singh and Misra [12] devised an algorithm for the picture segmentation technique. Using a genetic algorithm, they achieved an overall success rate of 97.60% across five different diseases while trying to identify them. Zhang et al. [13] analyzed a database of cucumber leaf samples to identify diseases. In this study, the researchers segmented diseased leaves using k-means clustering to obtain shape and color information that could be utilized for disease diagnosis. When classifying these damaged leaves using the sparse representation method, an 86.00% accuracy rate was attained. Convolutional neural network (CNN) models, a kind of AI, can be used for disease detection and diagnosis in plants [14]. Model training was performed using a dataset that included a total of 87,848 images. The collection also includes 58 unique plant–disease combinations, which are applied to 25 different plant species. A 99.53% success rate was calculated from the data.
Image processing [15,16], pattern recognition [17,18], and computer vision [19,20] have all seen rapid development and use in agriculture in recent years, with a particular emphasis on automating disease- and pest-detection processes. These tasks often cause problems due to the complexity and time commitment involved in preprocessing and constructing picture features for traditional computer vision models. The accuracy with which the feature extraction processes and with which the learning algorithm have been built also affects the efficacy of these systems [21,22,23]. Deep learning is gaining momentum in sickness detection as a result of increased processing power, increased storage capacity, and the availability of large datasets. This method has recently been applied to the detection of plant diseases; a problem that has proven difficult to solve. As a subset of machine learning, deep learning is a term with a specific meaning. CNNs are among the most popular algorithms used in deep learning for tasks, including picture classification, object recognition, and semantic segmentation [24,25]. CNNs are helpful for discovering patterns in images, objects, and sceneries because they learn to classify based on data from the image, so the user is no longer required to laboriously isolate the desired features within the image [26,27].
This article will assess and explain a selection of the many different approaches to deep learning that are currently in use. Although a number of studies have been conducted to investigate the impact of disease detection on tomato crops, the existing model still requires improvement. Consequently, we proposed a CNN model with two convolution layers, two max pooling layers, a disease in tomato plants by analyzing data from the hidden layer, and a flattening layer for tomato plants. Farmers can now solve problems independently without seeking advice from agriculture industry specialists. This entails identifying the many diseases that might affect crops. Our model was developed to assist in early-stage diagnoses of plant diseases. This will increase the overall productivity of agricultural activities, and as a result, food availability.
The need for an automated technique for diagnosing diseases that might impact tomato plants is the key driver of this project. The following are some of this study’s contributions that fill some of the gaps in existing research:
- Evaluating a wide variety of characteristics, including a crop’s production, yield capacity, grain quality, and nutrient retention, leads to an accurate plant disease diagnosis.
- Providing advice on constructing new CNN models and creating new ensemble structures using the proposed CNNs.
- Using an advanced transform learning lie to detect tomato leaf disease is critical to saving food security.
- Increasing the accuracy percentage of the proposed model in comparison to earlier studies in the field that were reported in academic journals.
- Increasing categorization reliability and reducing the amount of time required for training and examinations.
This paper presents an architecture for early disease identification and classification in tomato leaves that is based on three different deep learning models—DenseNet169, ResNet50V2, and transform ViT model and data augmentation. To properly forecast the kind of diseases that will impact the tomato leaves, this study aims to build a trustworthy framework for screening photographs of tomato leaves for indicators of disease.
2. Study Background
Researchers from a wide variety of institutions have developed automated diseases detection systems using cutting-edge technologies, such as machine learning and neural network designs like Inception V3 net, VGG 16 net, and Squeeze Net. They use highly accurate procedures to diagnose plant diseases in tomato leaf tissues.
In order to detect and categorize tomato diseases, a pretrained network model has an accuracy of 94.00% to 95.00% [28,29]. Using a dataset of 300 images and the Tree Classification Model and Segmentation, six types of tomato leaf disease were identified and classified [30]. It has been proposed [31] that we can classify leaf-affecting plant diseases with 93.75% accuracy using a specific approach. Plant leaf diseases may be accurately identified and categorized using image processing software and a classification scheme [32]. A smartphone with an 8-megapixel camera was used to photograph a variety of conditions and then divide the resulting data into two groups: healthy and sick. The image processing procedure was composed of three distinct actions: boosting contrast, image segmentation, and distinctive feature locating. An artificial neural network with several layers and a feed-forward neural net was used to conduct classification tasks, and the results of these networks are compared. Compared to the findings obtained by the multilayer perceptron (MLP) network and the radial basis function (RBF) network, they are much more favorable. Over the course of the study, the image of the plant blade was dissected into healthy and sick sections. However, this did not allow pinpointing the cause of the problem. In order to diagnose leaf diseases, researchers used color space analysis, color time, a histogram, and color coherence as a classifier, which achieved 87.2% in terms of accuracy.
Researchers have used AlexNet and VGG 19 models with a frame size of 13,262 to detect diseases that are hurting tomato harvests. The model was utilized to achieve 97.49% accuracy [33]. To obtain a 95.00% detection rate for viruses that damage dairy crops [34], we used transfer learning and a CNN model. With the goal of identifying and categorizing the conditions of tomato plants’ leaf surfaces, an AlexNet-based deep learning mechanism using neural network-trained transfer learning achieved an accuracy of 95.75% [35,36]. Resnet-50 was created to identify 1000 unique diseases that may harm tomato leaves by presenting 3000 images, each of which was tagged with a disease name, such as “lesion blight”, “late blight”, or “yellow curl leaf”. The first convolution layer’s kernel size was increased to 11 × 11, and the comparing network activation function was switched to Leaky-ReLU. The model has been refined over many iterations, and its performance in classifying diseases has improved to an accuracy of 98.30% and a precision of 98.00% [37]. Simplified eight-layer CNN models have been proposed for disease detection and classification in tomato leaves [38]. This research used the PlantVillage dataset [39], a compilation of data on various agricultural products. By applying deep learning to the tomato leaf dataset, the author focused on disease diagnoses to improve performance.
In recent years, CNNs have emerged as a reliable tool for diagnosing plant diseases [40,41]. Some research [42,43] has concentrated on improving feature detection quality by removing obstacles caused by inconsistencies in illumination and background homogeneity in high-stakes scenarios. Feature detection improvements have been the subject of other investigations that have sought to implement them by detecting complicated contexts. Few authors have developed real-time models to hasten plant disease detection [44,45]. Other authors’ work has also led to the early identification of plant diseases via model development [46,47]. In Ref. [48], the authors investigate digital photos of tomato leaves to determine the presence of various diseases. The authors implement a classification model based on CNN and AI-derived algorithms that is 96.55% accurate in recognizing five different diseases. In several studies, deep neural network models have been used to identify diseases in tomato leaves. In Ref. [49], for example, the authors compare four alternative models (LeNet, VGG16, ResNet, and Xception) and conclude that the VGG16 model achieves the greatest performance (99.25% accuracy) when used to categorize nine distinct disorders. The effectiveness of deep neural network models for diagnosing diseases in tomato leaves has been studied in other research. According to Ref. [50], an identical issue was solved with 95.00% or higher accuracy using the AlexNet, GoogleNet, and LeNet models. Agarwal et al. [51] built CNN architecture and compared it to other ML models (such as random forest and decision trees) and DL models for classifying data into 10 groups (VGG16, Incep-tionv3, and MobileNet). The result was a 99.20% accuracy boost.
Many research efforts have focused on improving classification accuracy by combining random forests, support vector machines, and multinomial logistic regression, which are just a few examples of the classification networks that may be employed with the obtained leaf characteristics [52]. With the help of MobileNetv2 and NASNetMobile, we were able to successfully extract leaf features. Researchers have shown that classification accuracy may be greatly improved by combining these two techniques. Many studies have successfully diagnosed plant diseases using algorithms such as Mask R-CNN [53]. Computing costs and model sizes have been decreased via the use of several techniques namely K-nearest neighbors and Gabor filters and K-nearest neighbors (KNN). Both methods have been used to attempt to reduce the time and resources needed to run deep learning calculations. To reduce computational costs, the authors of Ref. [54] used a SqueezeNet architecture with only 33 filters. YOLO-Tomato, which is based on YOLOv3 and was utilized by the authors of Refs. [55,56,57] to improve tomato identification, has been presented as a solution for dealing with these issues. YOLOv3 has been designed with a thick architecture in order to make the reuse of features easier and to assist in learning a model that is both more accurate and more compact.
3. Materials and Methods
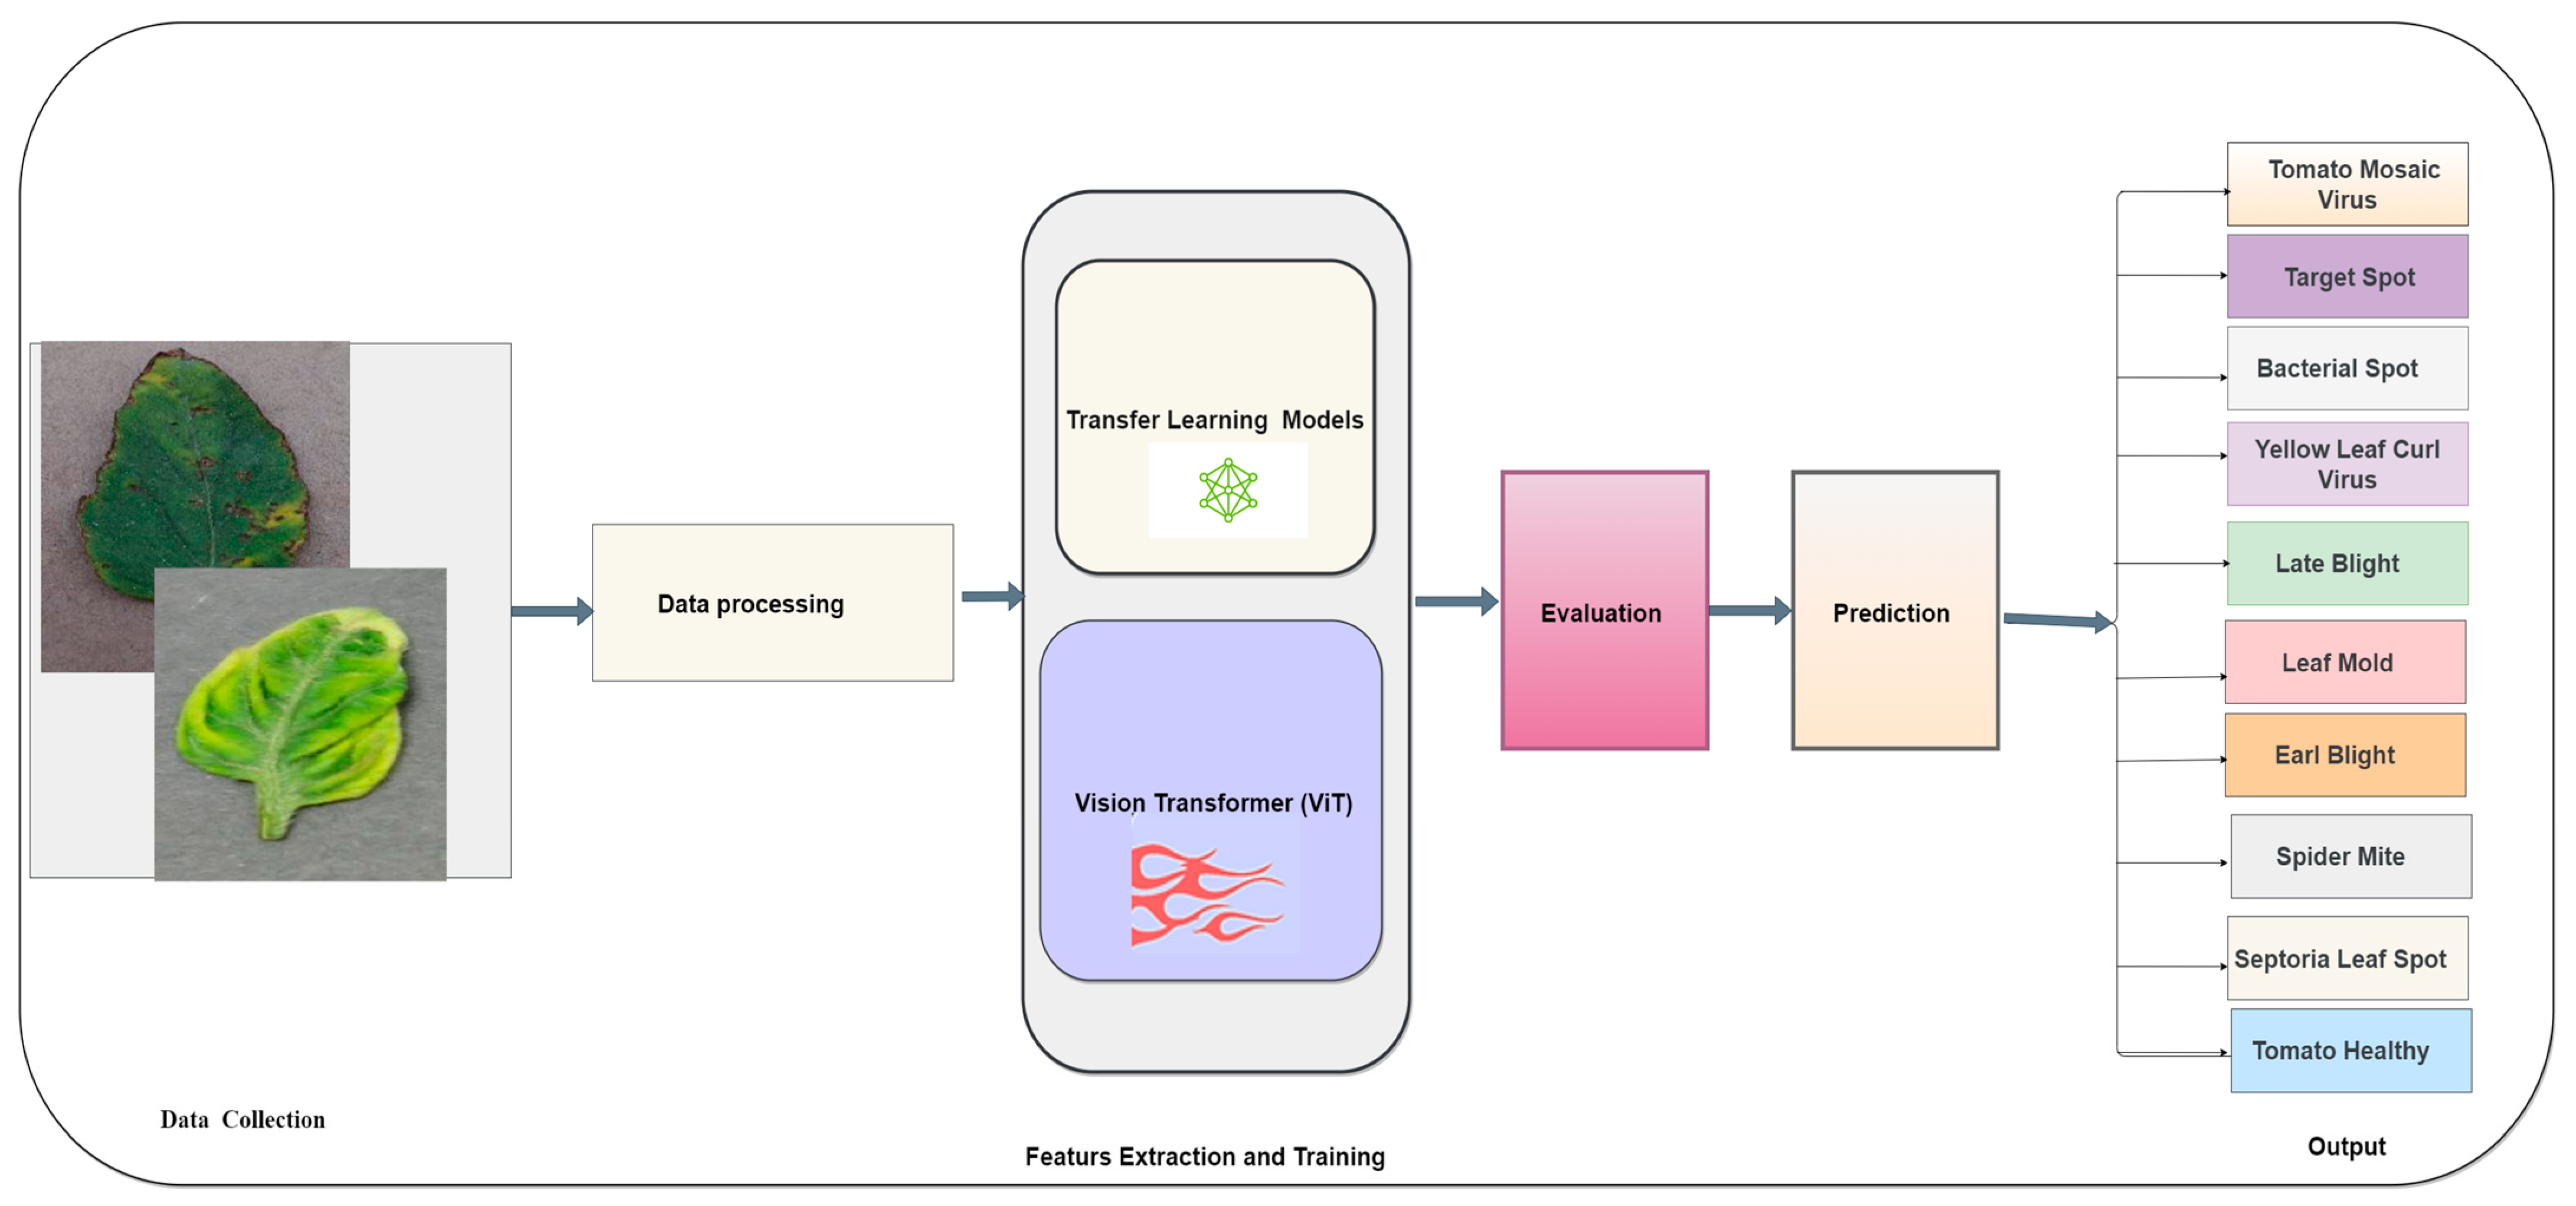
Due to tomato leaves’ complicated designs and the wide variety of diseases that affect tomatoes, the disease identification process can be difficult. Deep learning has emerged as a strong technology in recent years as support for the computer-assisted detection of diseases affecting tomatoes. This technique uses deep neural networks, which can learn complicated patterns from extensive volumes of picture data. The recommended approach for detecting tomato diseases via deep learning includes several essential stages. To begin, a tomato leaf picture dataset is gathered. This dataset will comprise examples of various diseased and healthy leaves. After preprocessing, the photos are utilized to teach a deep neural network, such as a CNN, to recognize intricate patterns within images. After the model has been trained, it can categorize newly acquired pictures as belonging to either the healthy class or one of the disease classes. Adjustments to the model’s parameters and the inclusion of new data may both enhance the model’s performance and make it more accurate. In conclusion, model performance may be tested using a test set of pictures to determine its accuracy and generalization capacity. The fundamental architecture of the suggested system for the classification and detection of tomato plant leaf diseases is presented in Figure 1.
3.1. Dataset
This study used the Tomato Leaf Diseases Dataset, consisting of 11,000 images of tomato leaves affected by 10 distinct diseases. Each class, including tomato mosaic virus, target spot, bacterial spot, tomato yellow leaf curl virus, late blight, leaf mold, early blight, spider mites (two-spotted spider mite), tomato healthy, and Septoria leaf spot, contains 1100 images. The dataset is publicly accessible on Kaggle. Table 1 displays the tomato leaf features, and the sample numbers of each class, and a sample of the tomato leaf diseases is presented in Figure 2. The dataset is available here https://www.kaggle.com/datasets/kaustubhb999/tomatoleaf (accessed on 20 January 2023).
3.2. Data Preprocessing
The data preprocessing step is essential because it improves both the data quality and overall performance of the classification methods used for the picture categorization process. The primary goal of data preprocessing is to prepare images for the deep learning model by removing any discrepancies, noise, or outliers that could negatively impact the model’s accuracy. This is accomplished by organizing data in a way that makes it easier for the model to analyze. In deep learning models for image classification, several common data preprocessing approaches are applied, such as image resizing and normalization. Image resizing involves adjusting the size of the images to ensure that they are of a standard size for the model’s training. This helps reduce model complexity and ensures that it is trained on images of the same size. Images normalization entails adjusting the brightness and contrast levels of each picture so that they are uniform across all of them. This is done to guarantee that the model is trained on photos that have comparable qualities. Applying data preprocessing techniques results in a more consistent and high-quality dataset, which can improve the model’s accuracy. These techniques can be implemented using various image-processing libraries, such as PIL and OpenCV.
3.3. Transfer Learning Algorithms
Transfer learning approaches allow a model to be trained on one task and then applied to a different but related task. This is particularly useful when there is a lack of labeled data for a specific task or when the task is similar to one that has already been solved. It can save a lot of time and resources by leveraging the knowledge and features learned from a pretrained model. Additionally, transfer learning can improve model performance by reducing the risk of overfitting and allowing the model to be better generalized to a new dataset. Both the quantity of labeled data available for the new task and the degree of similarity between the pretrained model and the new task should be taken into account before deciding to use transfer learning. It may be preferable to retrain the model from scratch if the new job is quite different from the one the pretrained model was built for, or if there is a huge quantity of labeled data available. Model performance may be enhanced via transfer learning, and the need for labeled data can be reduced. It is applicable to many different models, including CNNs, and may be implemented using either feature-based or fine-tuning approaches.
3.3.1. DenseNet121 Model
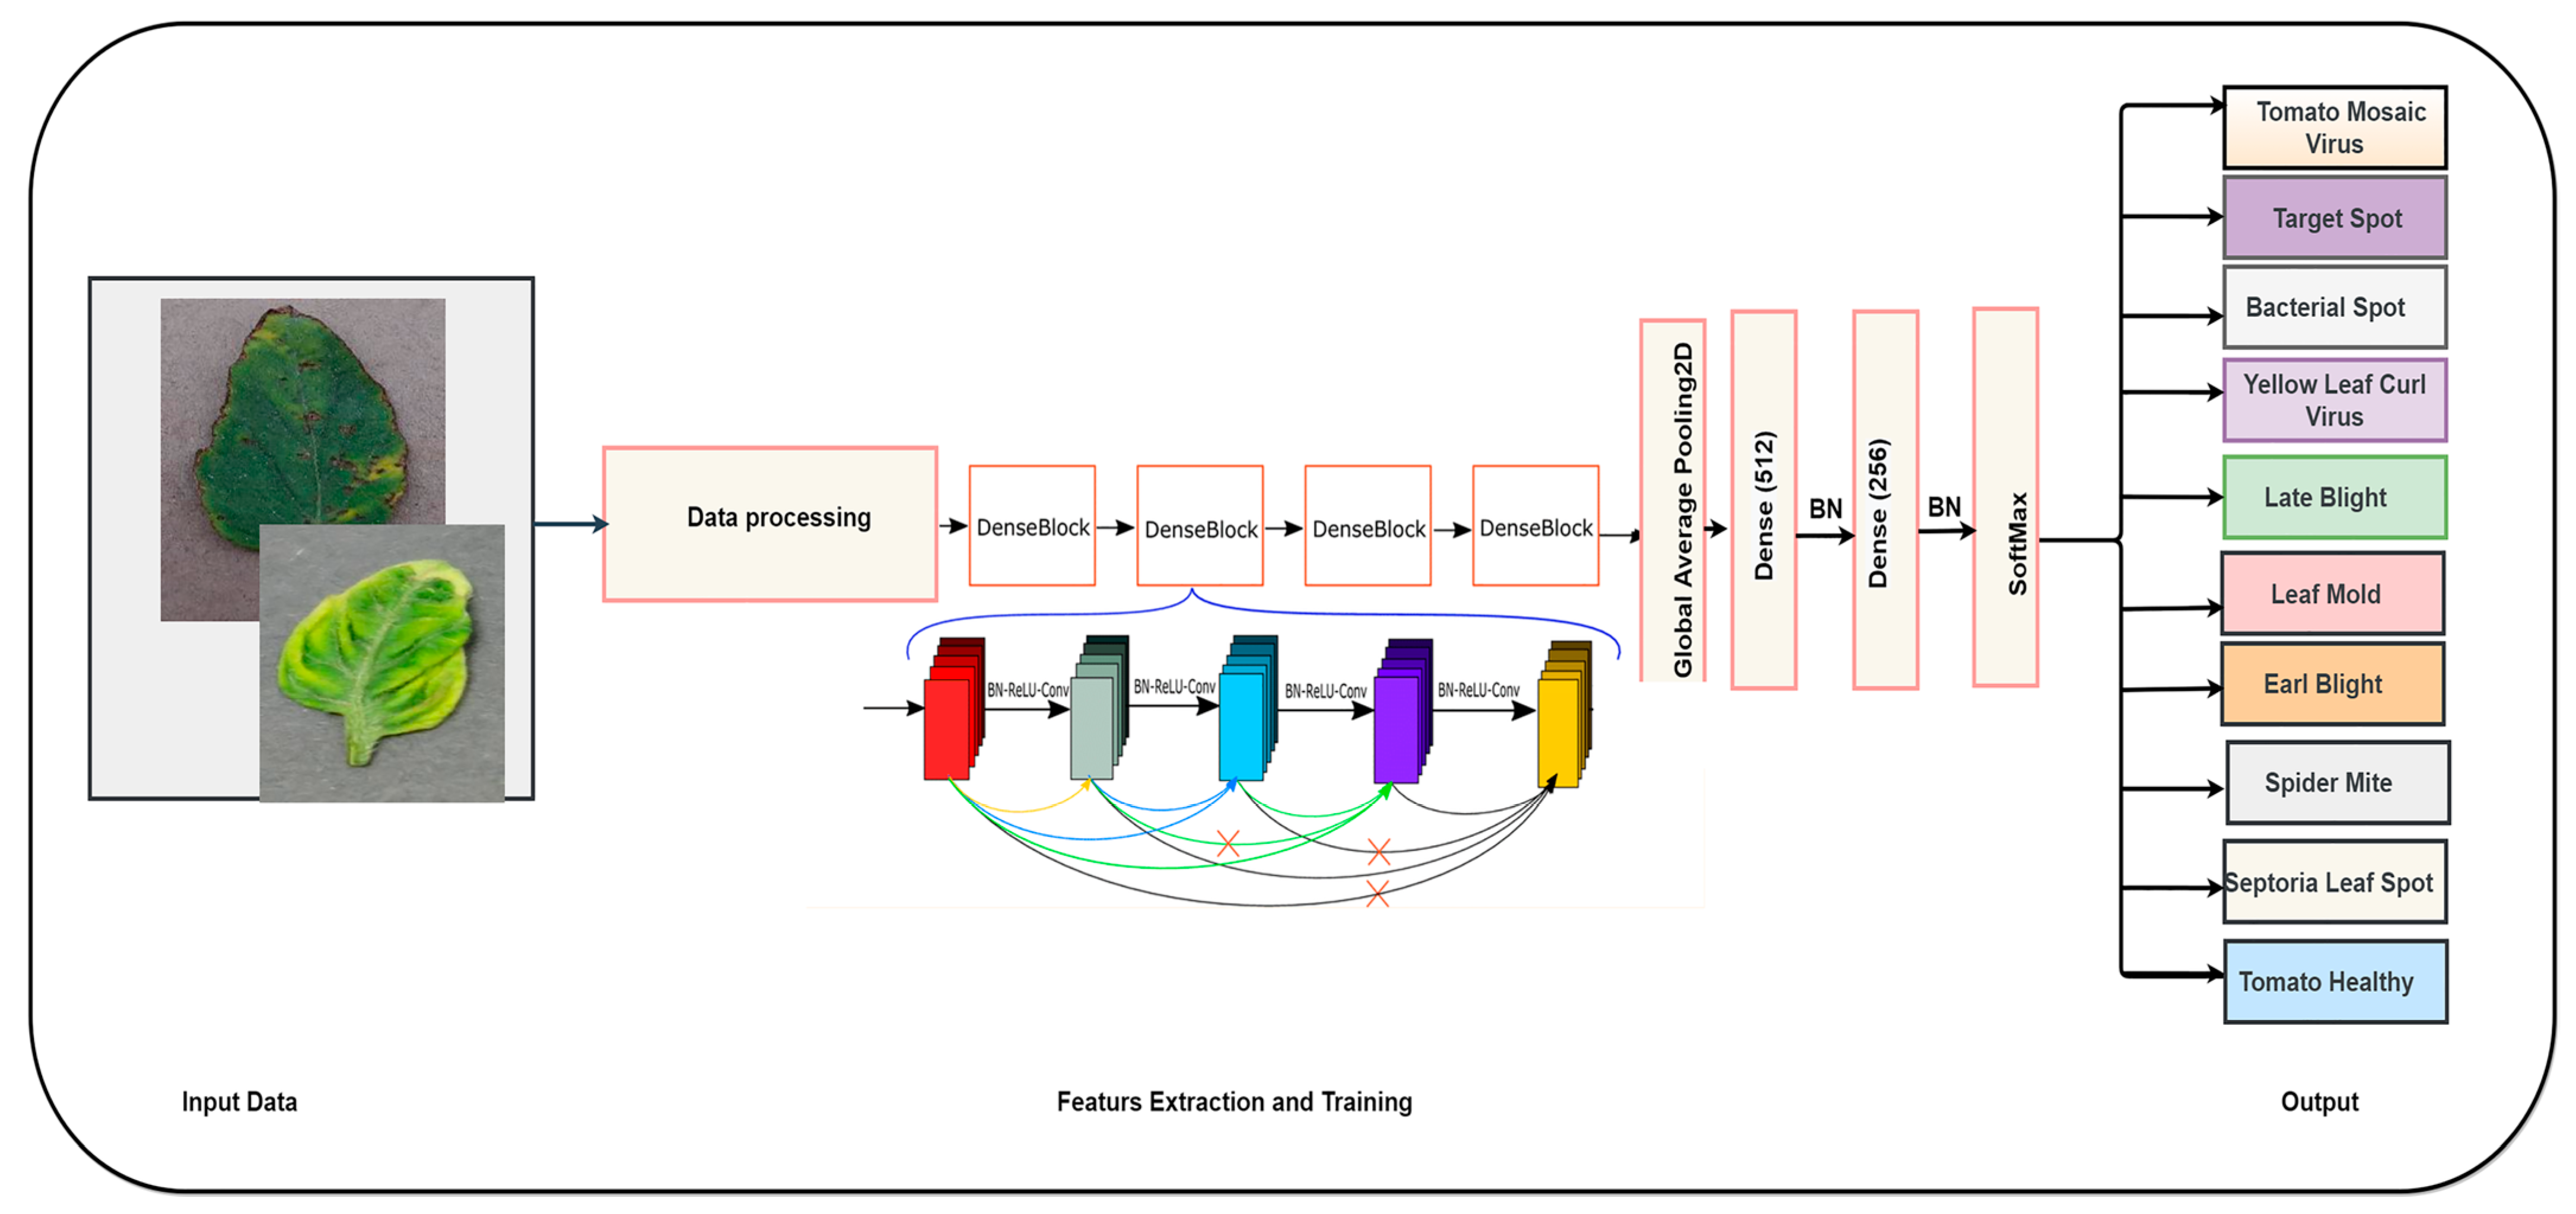
DenseNet121 is a popular CNN architecture that Huang et al. introduced in 2017 as part of the DenseNet family. The network is based on the concept of dense connections between layers, which allow information to flow more efficiently through the network and improve its accuracy. The DenseNet121 architecture consists of multiple dense blocks, each containing a set of convolutional layers that are densely connected to all subsequent layers [58,59,60,61].
In this research, we employ a pretrained DenseNet121 model for disease identification in tomatoes. It is common practice to apply transfer learning, and this was done to initialize the pretrained model using weights learned from the huge ImageNet dataset. A new set of layers, consisting of a global average pooling layer, two fully connected layers with 512 and 256 neurons, and two batch normalization layers, was added after the top layer of the pretrained model was eliminated and replaced. Once the second layer was completely linked, the ReLU activation function was applied to a new layer that served as an activation layer. Finally, a softmax activation layer was added to the output layer, which comprised of 10 neurons that corresponded to the 10 different types of tomato diseases. Figure 3 illustrates this point.
This architecture was chosen because DenseNet models have shown strong performance in various image classification tasks and have a compact architecture suitable for transfer learning. The global average pooling layer was used to reduce the number of parameters in the model, and batch normalization layers were added to improve the stability and convergence of the training process. The important parameters of DenseNet121 model are presented in Table 2.
3.3.2. ResNet50V2 Model
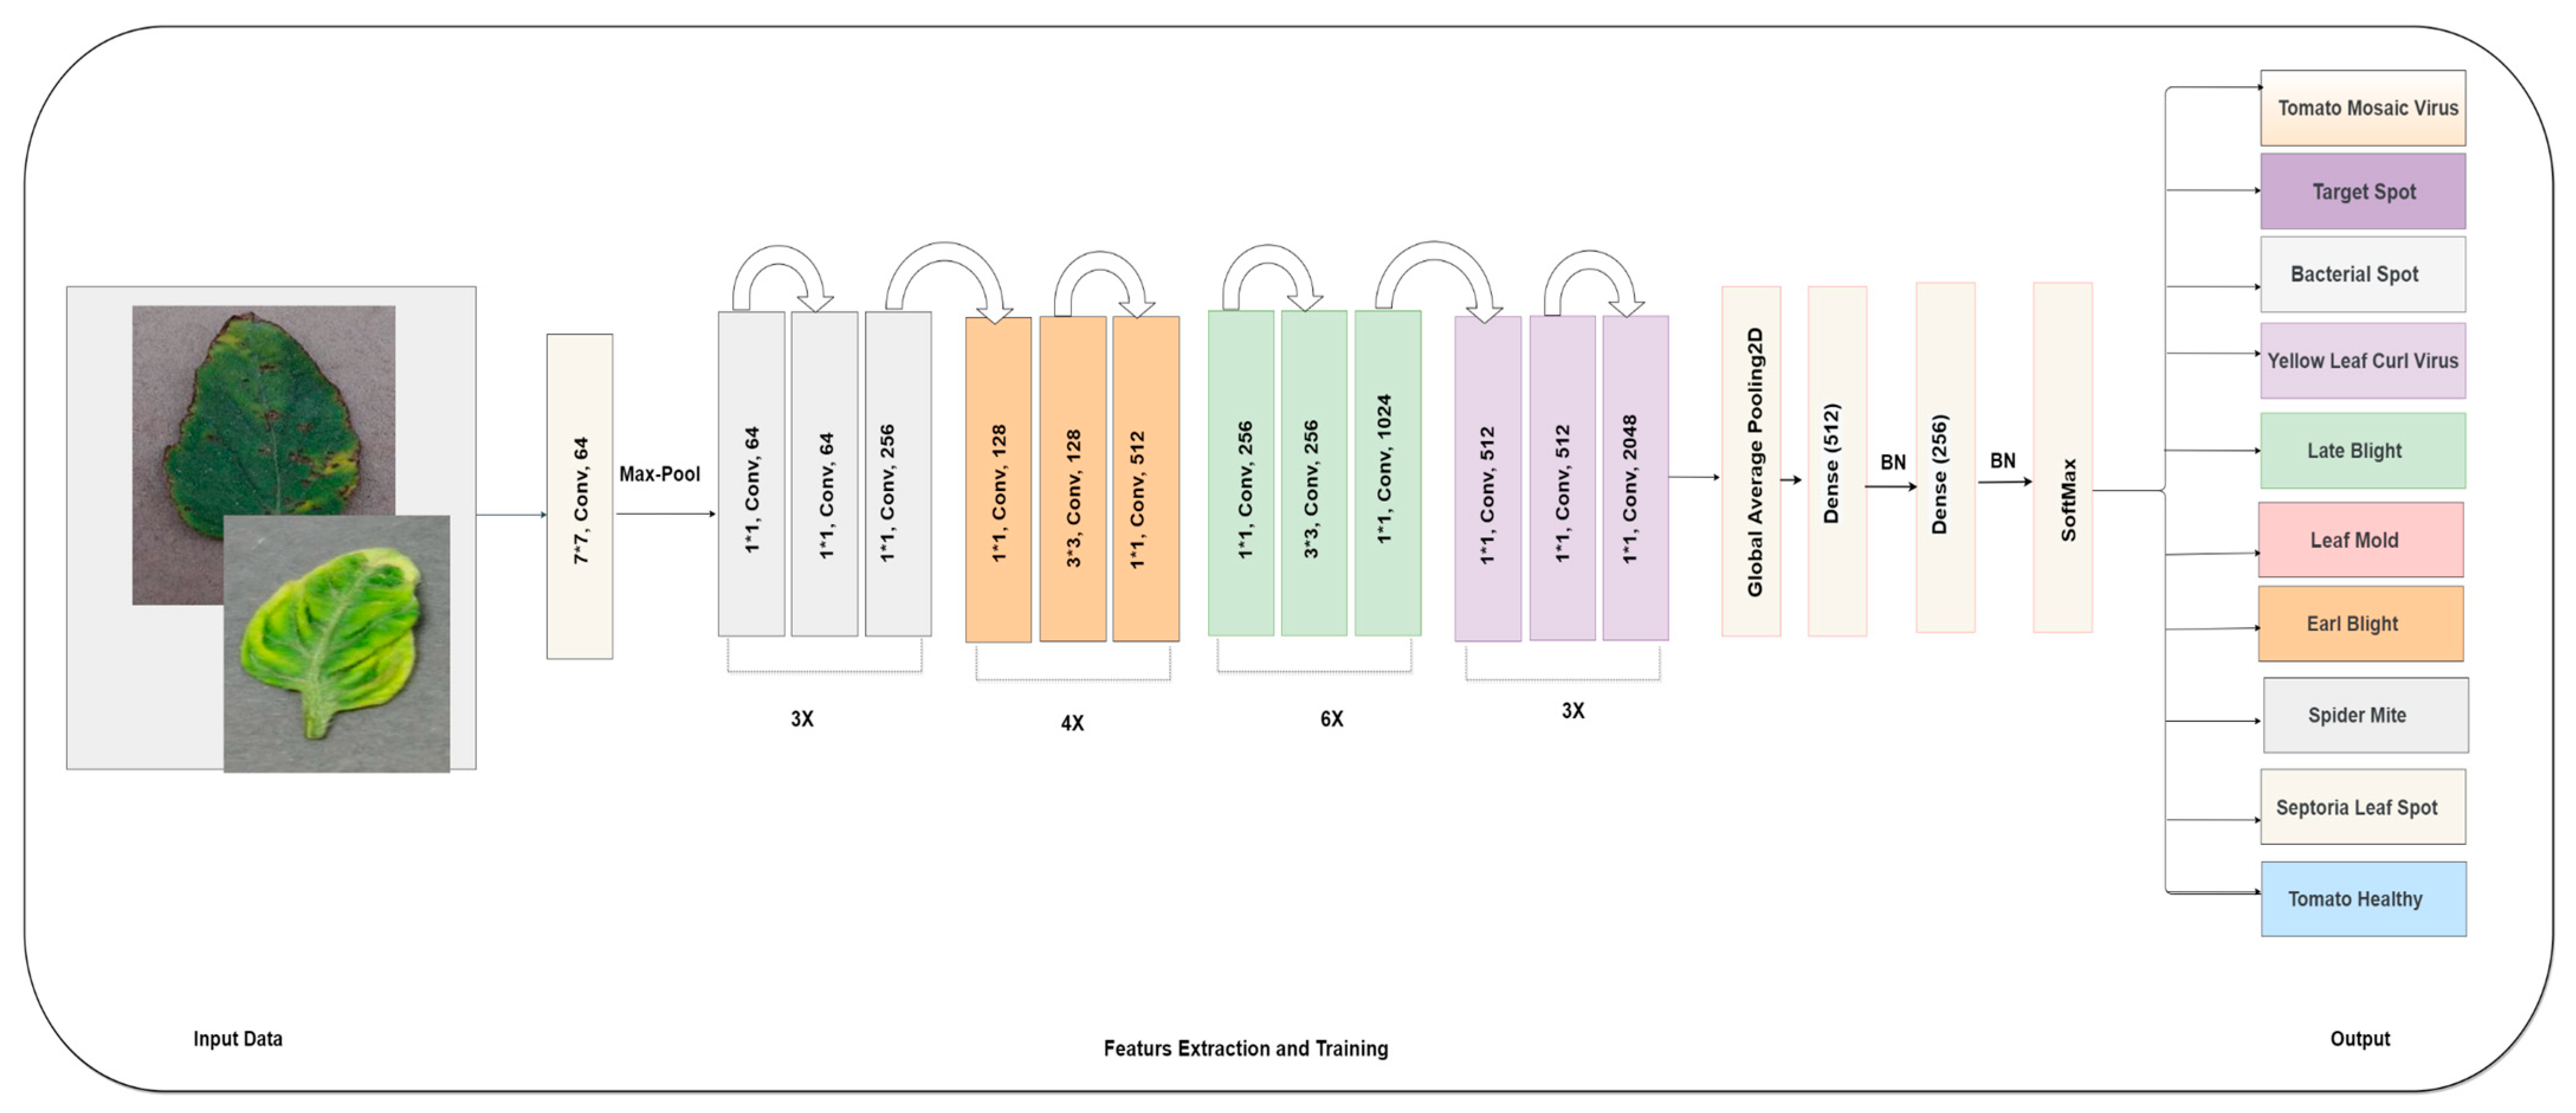
ResNet50V2 is a convolutional neural network architecture that has been used for computer vision for analysis and classification images, including disease classification in plants. The pretrained model was initialized with weights learned from the large image processing dataset, which is a common practice in transfer learning. The top layer of the pretrained model was removed and replaced with a new set of layers. The classifier that we added on top of the pretrained ResNet50V2 model is designed to adapt the network to a new image classification task. The pretrained model output is passed through a GlobalAveragePooling2D layer that reduces feature maps’ spatial dimensions by averaging them along the height and width axes. This results in a fixed-length feature vector that encodes the most important features of the input image.
The feature vector is processed by two fully connected layers with 512 and 256 neurons, respectively, which learn to map the feature vector to a high-level representation that captures the discriminative information for the new image classification task. Batch normalization layers are added after each fully connected layer to stabilize the training process and accelerate convergence. After the second fully connected layer, nonlinearity is introduced into the network by adding an activation layer using the ReLU activation function. This allows the network to acquire more nuanced representations.
Finally, the second fully connected layer’s output is passed through a fully connected layer with 10 neurons and a softmax activation function, which outputs a probability distribution over the 10 classes in the dataset. This layer learns to map the high-level representation to the final output of the network, which is the predicted class label for the input image. The structure of ResNet50V2 model to detect tomato diseases is presented in Figure 4. The parameters of developing the ResNet50V2 model for detecting tomato disease are presented in Table 3.
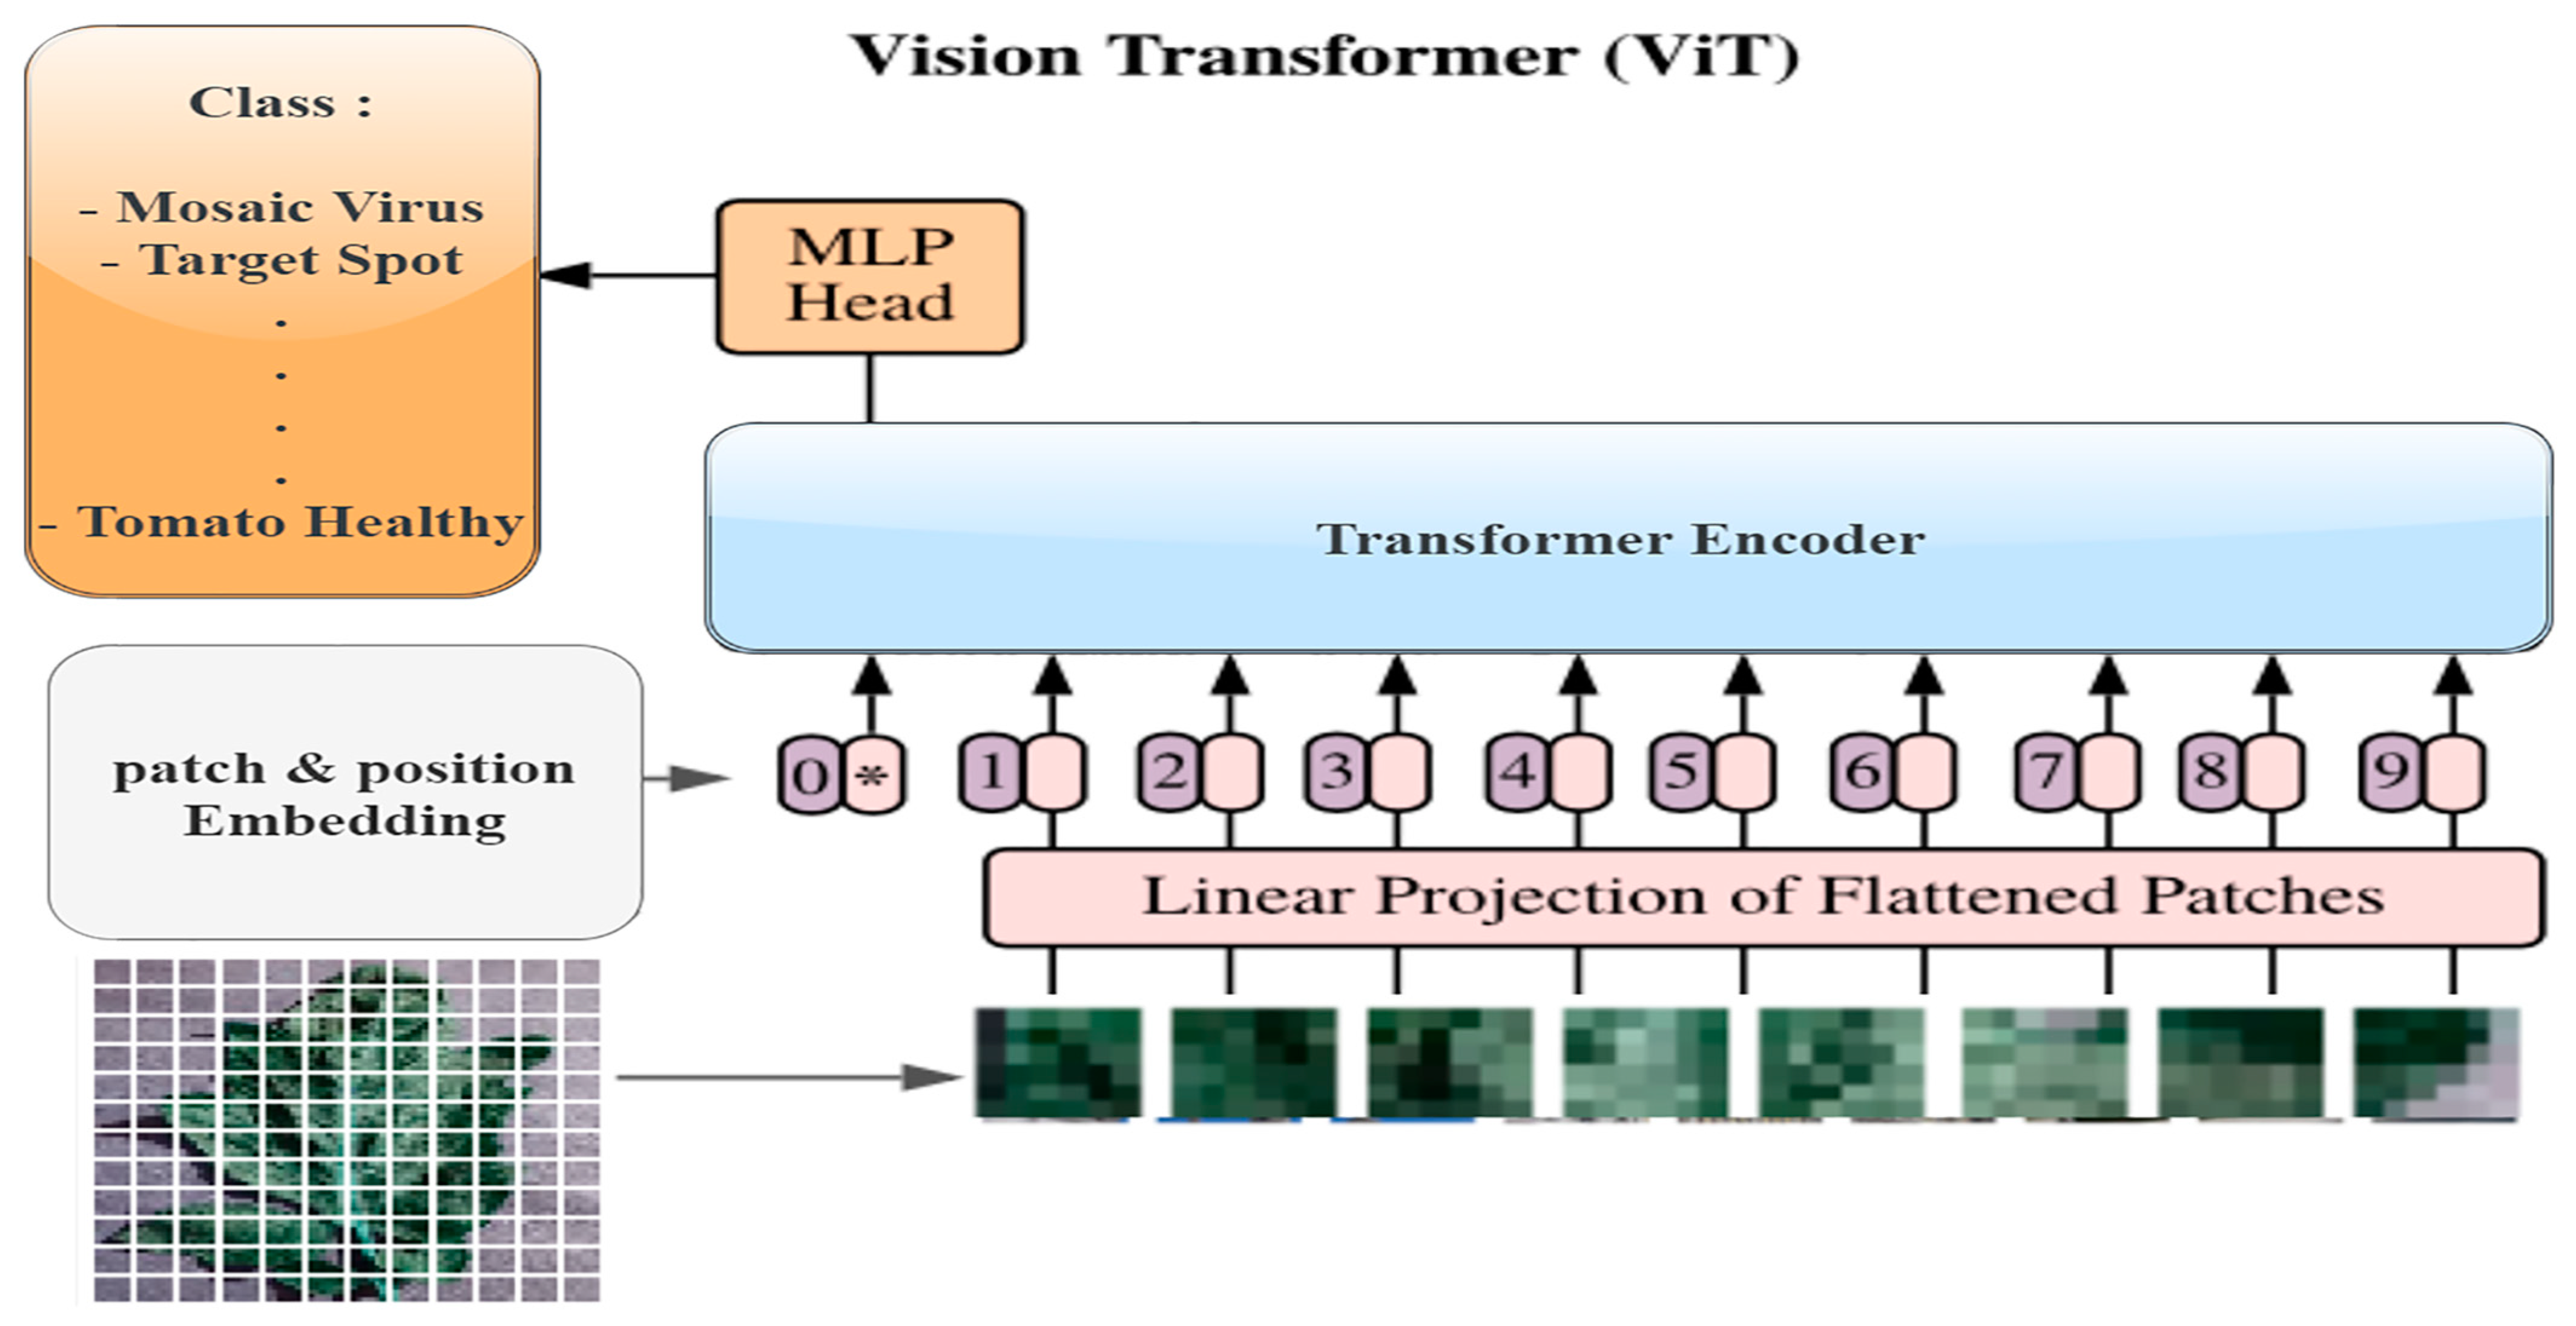
3.3.3. Vision Transformer
Vision transformer (VIT) is a new architecture for image classification that has gained significant attention in the deep learning community. Unlike traditional CNNs, VITs use transformer-based architecture, which has been highly successful in natural language processing tasks.
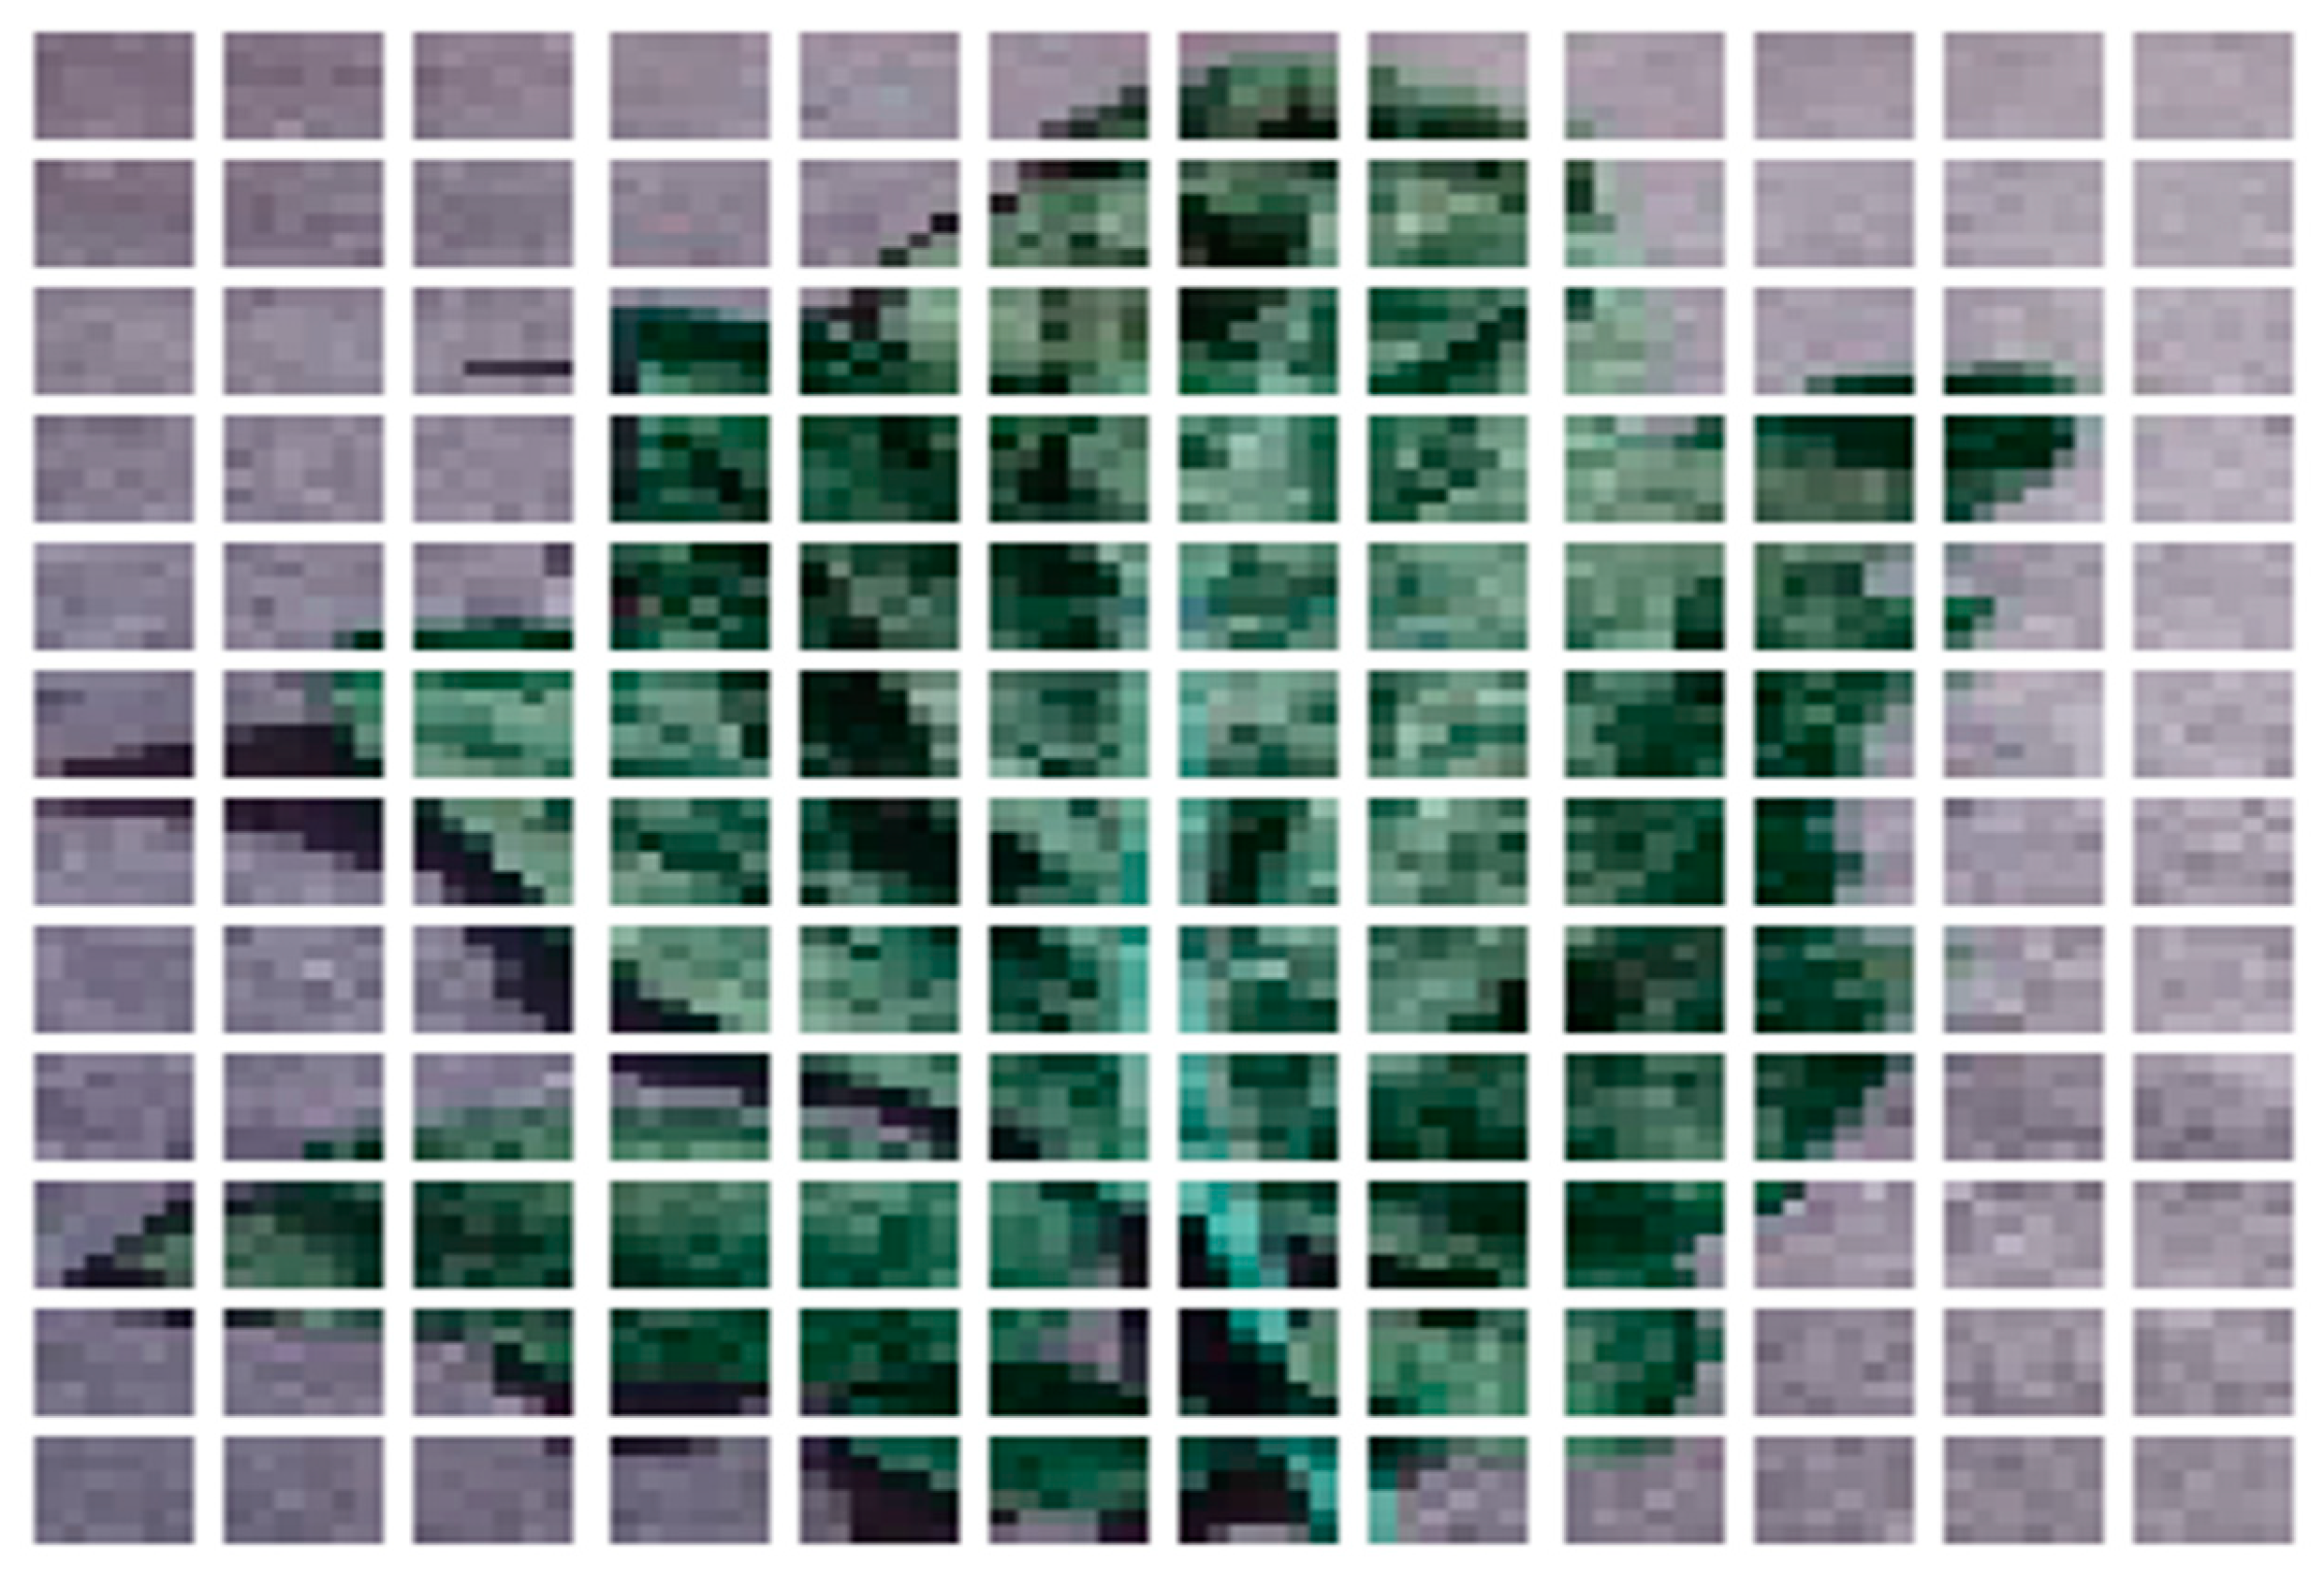
VIT architecture consists of several key components. First, the input image is divided into a sequence of fixed-sized patches. Each patch is then flattened into a 1D vector and passed through an embedding layer, which maps the patch to a higher-dimensional feature space. These patch embeddings are then fed into a transformer encoder, which applies a series of self-attention mechanisms to learn the contextual relationships between the patches, as shown in Figure 5.
The following steps outline the process we used to train our data and input it into the VIT model for classification. The input image is passed through a “patches” layer, which divides the image into a grid of non-overlapping 6 × 6 patches. This turns the 2D image into a 3D tensor of shape (batch size, patch size × patch size × number of channels) and the number of color channels (typically 3 for RGB images). The patch tensor is then fed through a “patch encoder” layer, which applies a learned linear transformation (via a dense layer) to each patch and adds a learnable position embedding to each patch. This step helps the model capture spatial relationships between patches and makes it aware of their relative positions within the image.
This layer produces the model’s predictions for each input image. During training, the model is optimized using the AdamW optimizer, a variant of the Adam optimizer that includes weight decay regularization. The loss function used is sparse categorical cross-entropy, which is a common choice for multiclass classification problems. Figure 6 shows the structure of ViT transform model used to detect tomato disease. The significant parameters of ViT model are shown in Table 4.
4. Experiment
The effectiveness of DenseNet121, ResNet50V2, and VIT, three deep learning classification algorithms, was assessed within the context of this research as they relate to the diagnosis of tomato diseases. The models were trained, tested, and validated using a dataset that included photographs of both healthy and sick tomatoes. The configuration for training a model was done on a laptop equipped with an 8th generation Core i7 CPU and a GPU 1070 utilized and 8GBs RAM. The TensorFlow and transformer architecture library was used for developing the models. Both the training and testing sets were created from the dataset utilized for this investigation. These two sets were then compared. This division’s mission was to verify that the deep learning models generated for this research could correctly categorize new photographs. To do this, every category in the dataset was broken up into 1000 photographs that would be used for training, and 100 images that would be used for testing. The primary goal of this division was to supply the deep learning models with a diverse set of photographs from which they could learn, with the end goal of evaluating the models’ capacity to generalize their findings to images that they had not seen before.
4.1. Performance Measurement
To measure the success of a deep learning model, its accuracy is often measured against a gold standard. It is a measure of the model’s predictive efficacy that may be calculated by dividing the number of accurate forecasts by the total number of predictions.
It is standard practice to utilize precision as a measure of a deep learning model’s success, particularly when the job at hand is one of categorization. This metric assesses the reliability of the model’s positive predictions by dividing the number of correct forecasts by the total number of correct predictions. It can be collated by Formula (2).
Deep learning models make extensive use of the assessment statistic known as recall, particularly when dealing with categorization issues. It provides a numerical representation of the fraction of the dataset’s positive instances that correspond to accurate positive predictions generated by the model. In plainer language, it calculates the number of true positive predictions as a fraction of the total number of positive cases included in the dataset.
The F1 score is a commonly used evaluation metric in deep learning models, especially for classification problems. It is a way to balance the trade-off between precision and recall by taking the harmonic mean of the two metrics. This makes it a useful metric when dealing with imbalanced datasets or when trying to identify rare classes.
where:
FP: false positive
TP: True positive
FN: false negative
TN: true negative.
4.2. Results
4.2.1. Results of the DenseNet121 Model
Table 5 shows the DenseNet121 model’s high performance in 90% training and 10 testing. The DenseNet121 model was trained using eight batch sizes and the SGD optimizer for 100 epochs. To prevent overfitting and minimize training time, the early-stop method was employed, which ended the training after 34 epochs. DenseNet121 scored high in accuracy (99.88%) in the training phase, whereas its testing accuracy was 0.99%. Table S1 shows the result of DenseNet121 with 90% training and 10 testing; it is observed that the accuracy of the DenseNet121model is (98%).
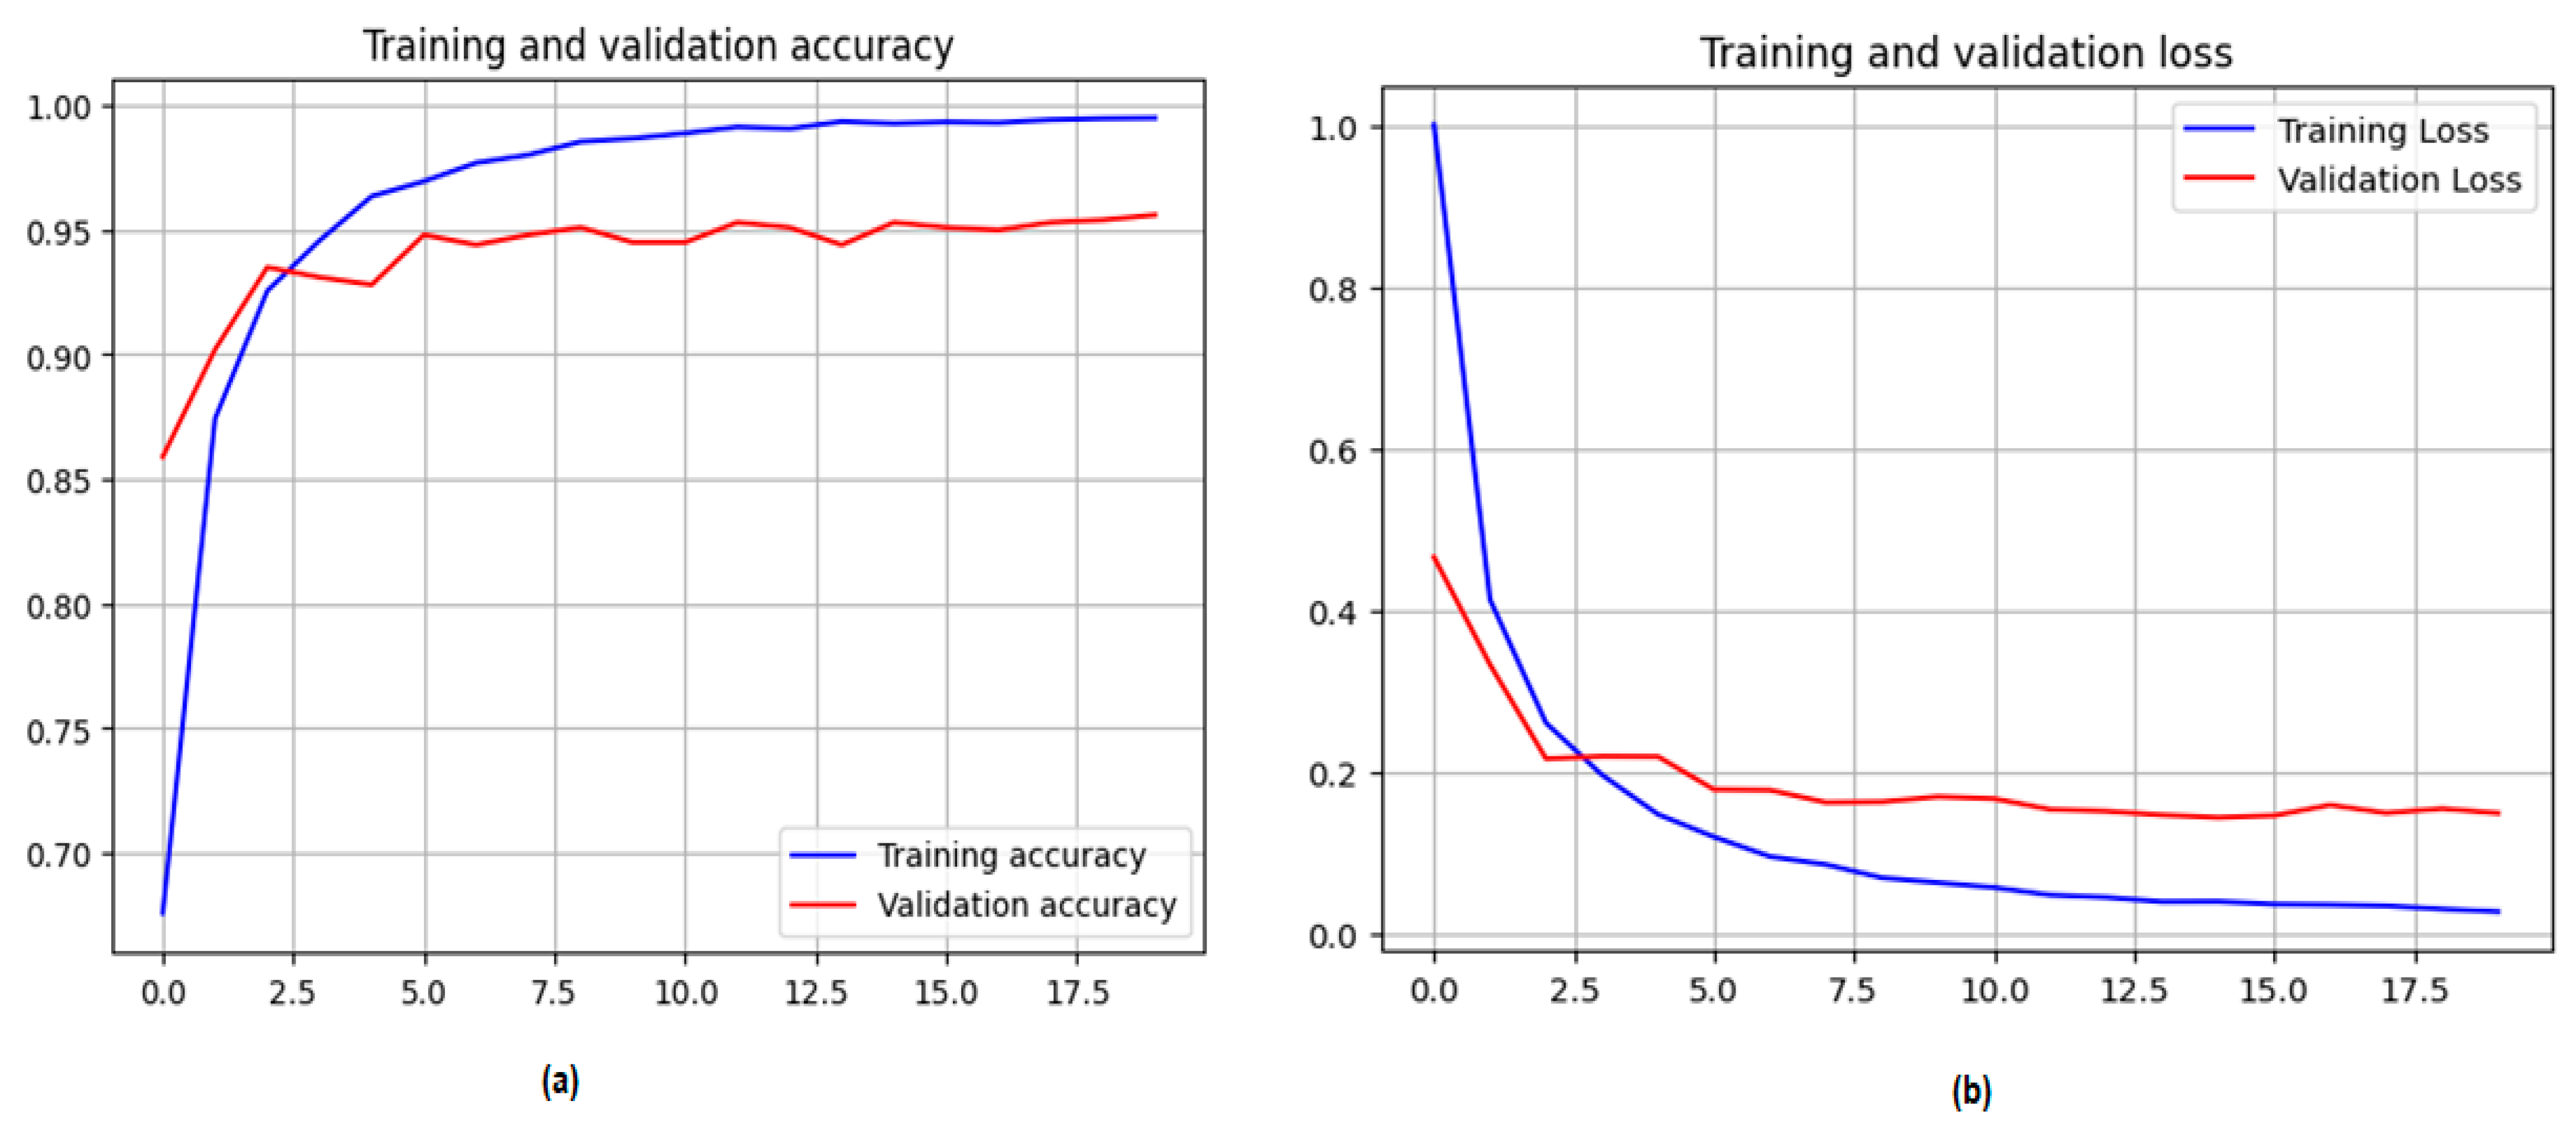
Figure 7 illustrates how well DenseNet121 model performed throughout the 90% training and 10% validation phases for the purpose of recognizing and categorizing diseases that may affect tomato leaf tissue. A training accuracy beginning at 72.00% and increasing to 99.98% was attained as a consequence of these findings. According to the graphic representation, the accuracy at the validation phase started at 86.00% and reached 99.00%. The accuracy loss of the DenseNet121 model was 0.2 in validation. The performance of the DenseNet121 model with 80% training and 20% validation phases is presented in Figure S1; it is noted that the mode achieved accuracy 98.45% and validation loss was decreased from 0.8 to 0.1.
The proposed Dense-Net121 model and its evaluation yielded a confusion matrix, as shown in Figure 8 and Figure S2. The evaluation parameters were (90%, 80% as training and 10%, 20% as testing). The confusion matrix displays the tTP), TN, FP, and FN values that were gathered for each class. The target_spot class has high environment misclassification based on the multiple-graphics processing unit (MGPU) architecture. In terms of leaf disease categorization, the suggested model attained a validation accuracy of 99.64% with 90% training and 10% testing whereas the Dense-Net121 model was attained accuracy 98.45% with 80% training and 20% testing.
4.2.2. Results of the ResNet50V2 Model
The results of the ResNet50V2 model with 90% training and 10% testing are presented in Table 6. The ResNet50V2 model was trained using eight batch sizes and the SGD optimizer for 100 epochs. To prevent overfitting and minimize training time, the early-stop method was employed, which ended the training after 20 epochs. The ResNet50V2 model achieved accuracies of 99.49% in training and 95.60% in testing. The results of ResNet50V2 with 80% training and 20% testing is shown Table S2; the ResNet50V2 successfully achieved 94.31%.
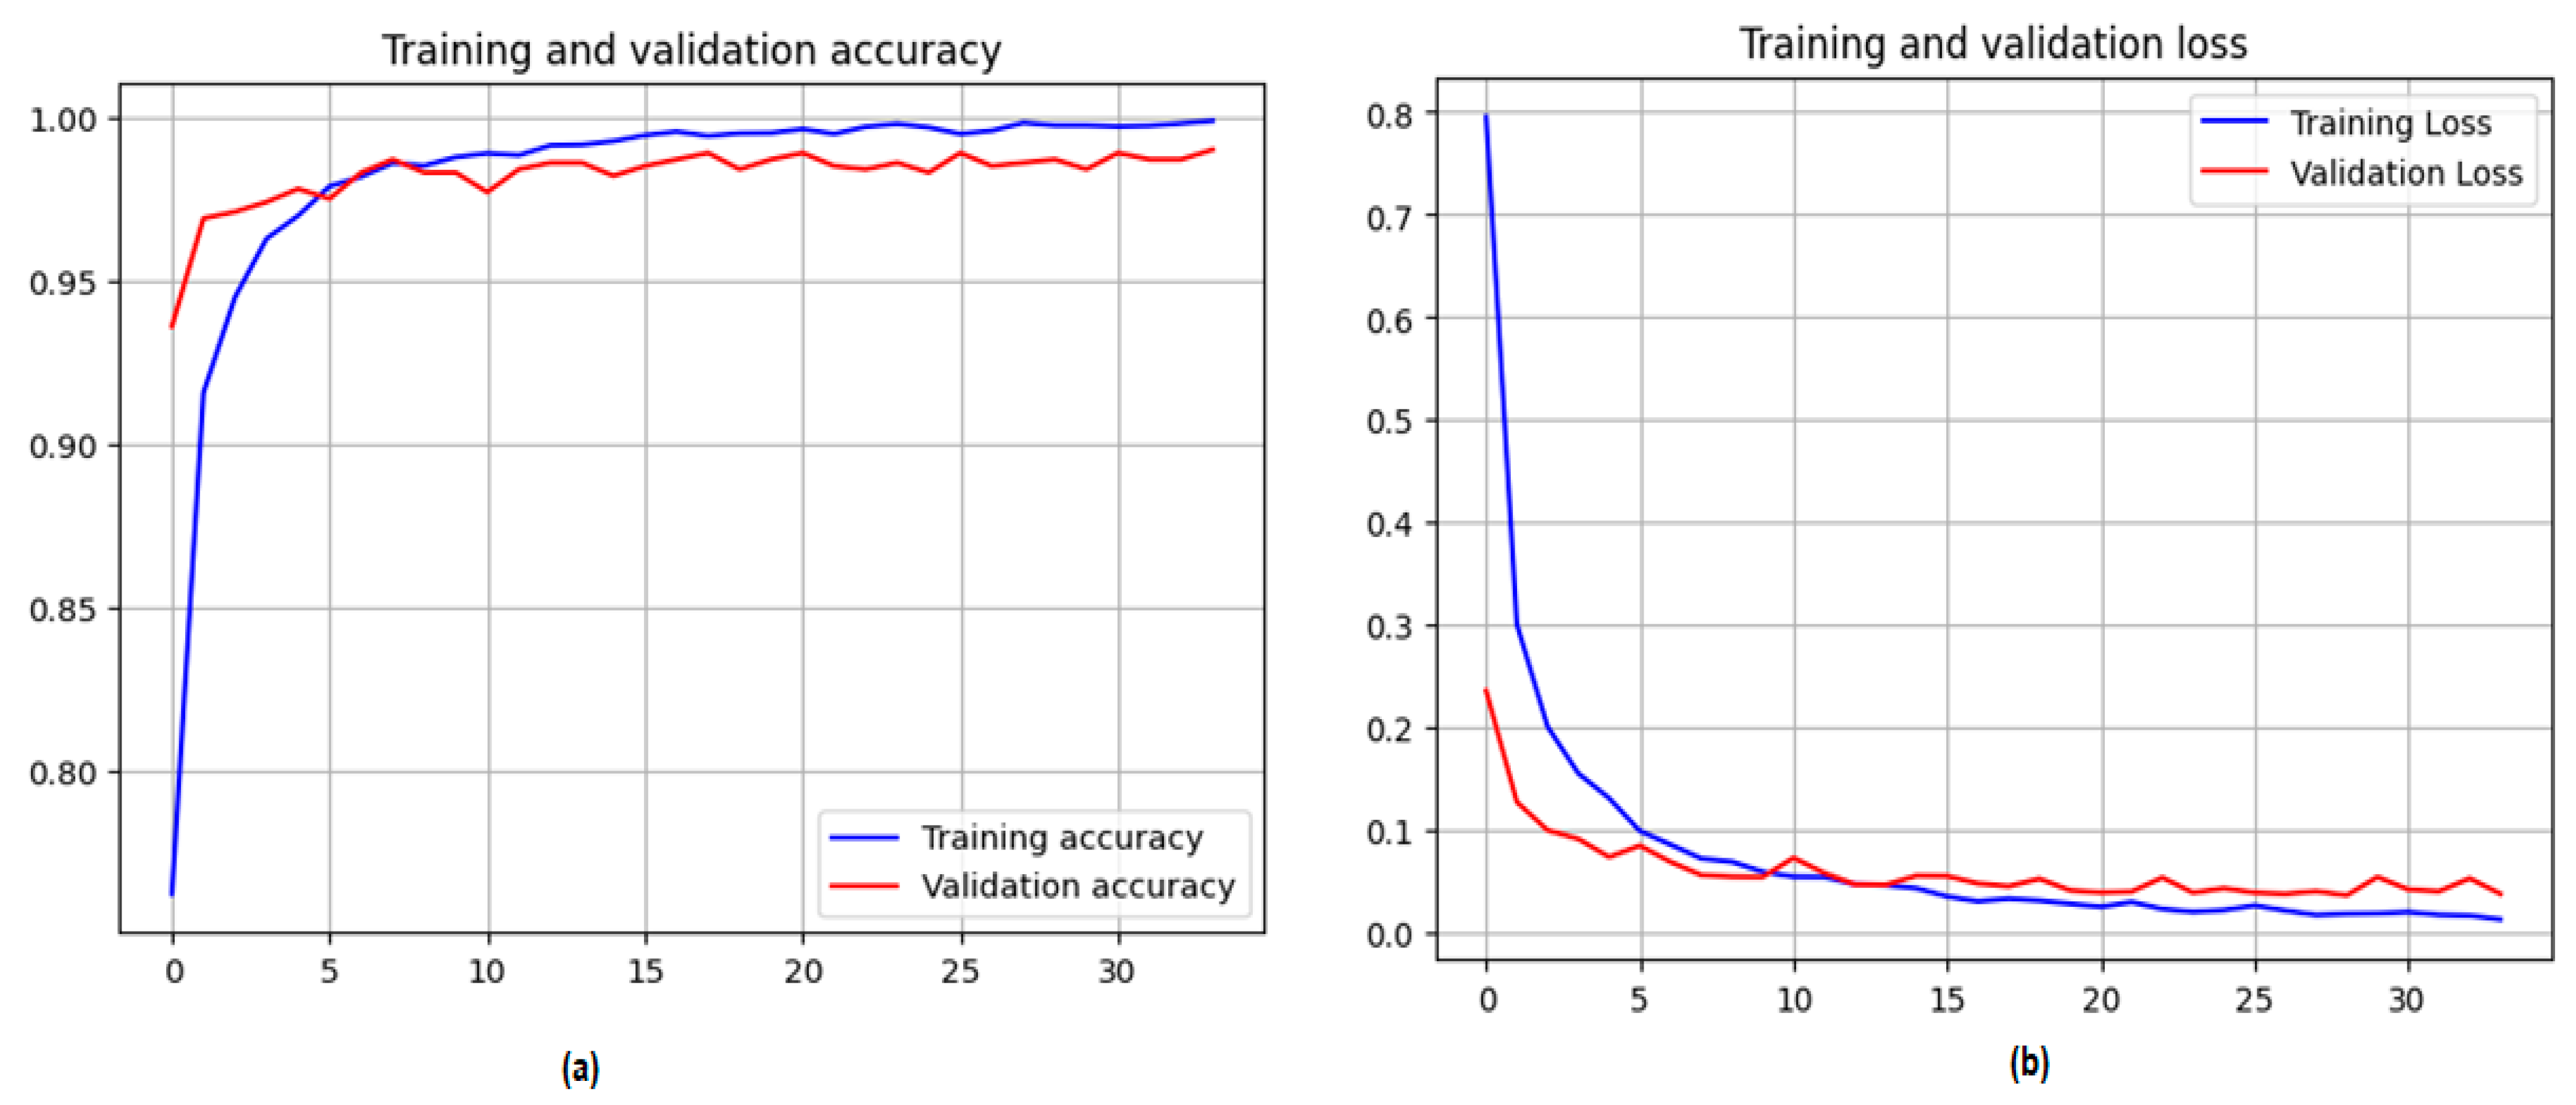
Figure 9 illustrates the effectiveness of the ResNet50V2 model in identifying tomato leaf diseases by dividing the dataset into 90% training and 10% testing. ResNet50V2′s validation accuracy is 96.00%, whereas its training accuracy was initially 78.00% and reached a maximum of 99.49%. At this point in the validation process, the ResNet50V2 model’s accuracy loss is less than 0.1.
The efficiency of the ResNet50V2 model in determining the presence of tomato leaf diseases with 80% training and 20% testing is seen in Figure S3. The accuracy of ResNet50V2 model in validation test is 94.30%. At this stage in the validation process, the accuracy loss associated with the ResNet50V2 model is less than 0.2.
The ResNet50V2 model’s confusion matrix is shown in Figure 10 and Figure S4 by dividing the dataset in 90%, 80% as training and 10%, 20% as testing. This matrix demonstrates that the model has a strong positive impact on tomato disease detection and that it misclassifies 42 out of every 1000 samples. The suggested ResNet50V2 model can predict the tested classes using the training dataset with 99.49% accuracy, as shown by the results represented in the confusion matrix, 90% as training and 10% testing, whereas the misclassification of ResNet50V2 model with 80% training and 20% testing is 54 simples for all the classes.
This is the case because the results show that the model was able to predict the classes correctly. Examining the findings enables us to make this observation for ourselves. The confusion matrix that DenseNet121 produces demonstrates that the model has a strong positive impact on tomato disease detection, with only 10 misclassified samples out of a total of 1000 samples.
4.2.3. VIT Model Results
The results achieved by the VIT model’s classification performance for each class described with 9% training and 210% testing within the experimental dataset are shown in Table 7. Because of this, we are able to deduce the performance of the suggested model, which has the ability to categorize diseases with an accuracy that is more than 98.00%. Based on the data that are reflected in the table, it can be seen that the resulting recall metric value is high for each category that is specified in the dataset. The VIT model was trained using eight batch sizes and the SGD optimizer for 100 epochs. The model achieved 98.00% accuracy on the training and testing data. The results of the VIT model, by splitting the dataset into 80% training and 20% testing, are shown in Table S3.
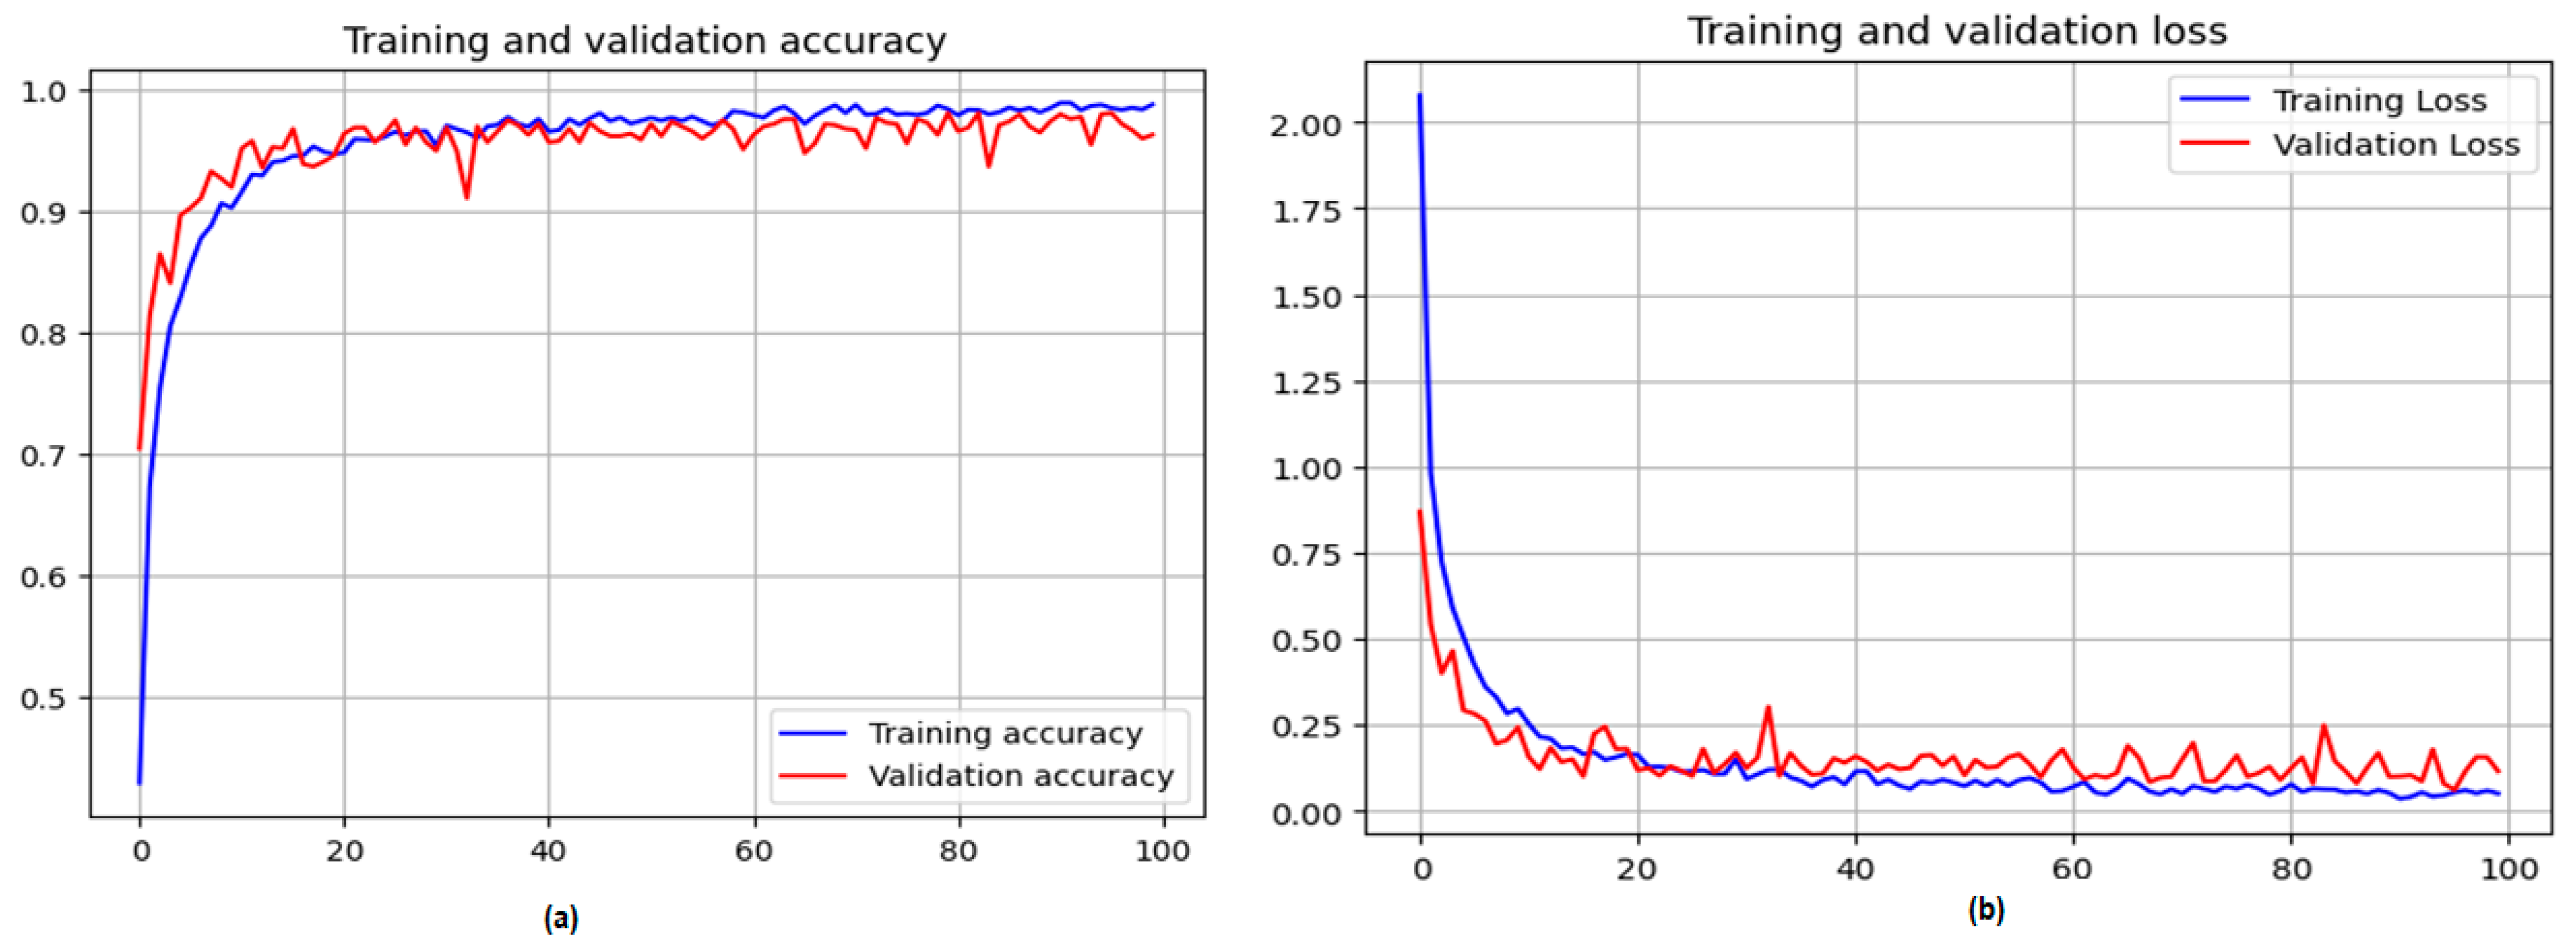
Figure 11 shows a comparison of the training and validation accuracies by dividing the dataset in 90% training and 10% testing. Figure 11a demonstrates that an accuracy rate of 98.00% may be obtained by setting the training stop at 100 epochs and keeping the rate of learning at 0.0001. Figure 11b compares validation and training losses. Consequently, given the study’s methodology, it is reasonable to predict that increasing the number of iterations would lead to an increase in data accuracy. Conversely, if the training phase duration increases, so will the total number of epochs. Figure S5 shows the accuracy and loss performance of the VIT model using 80% training and 20% testing.
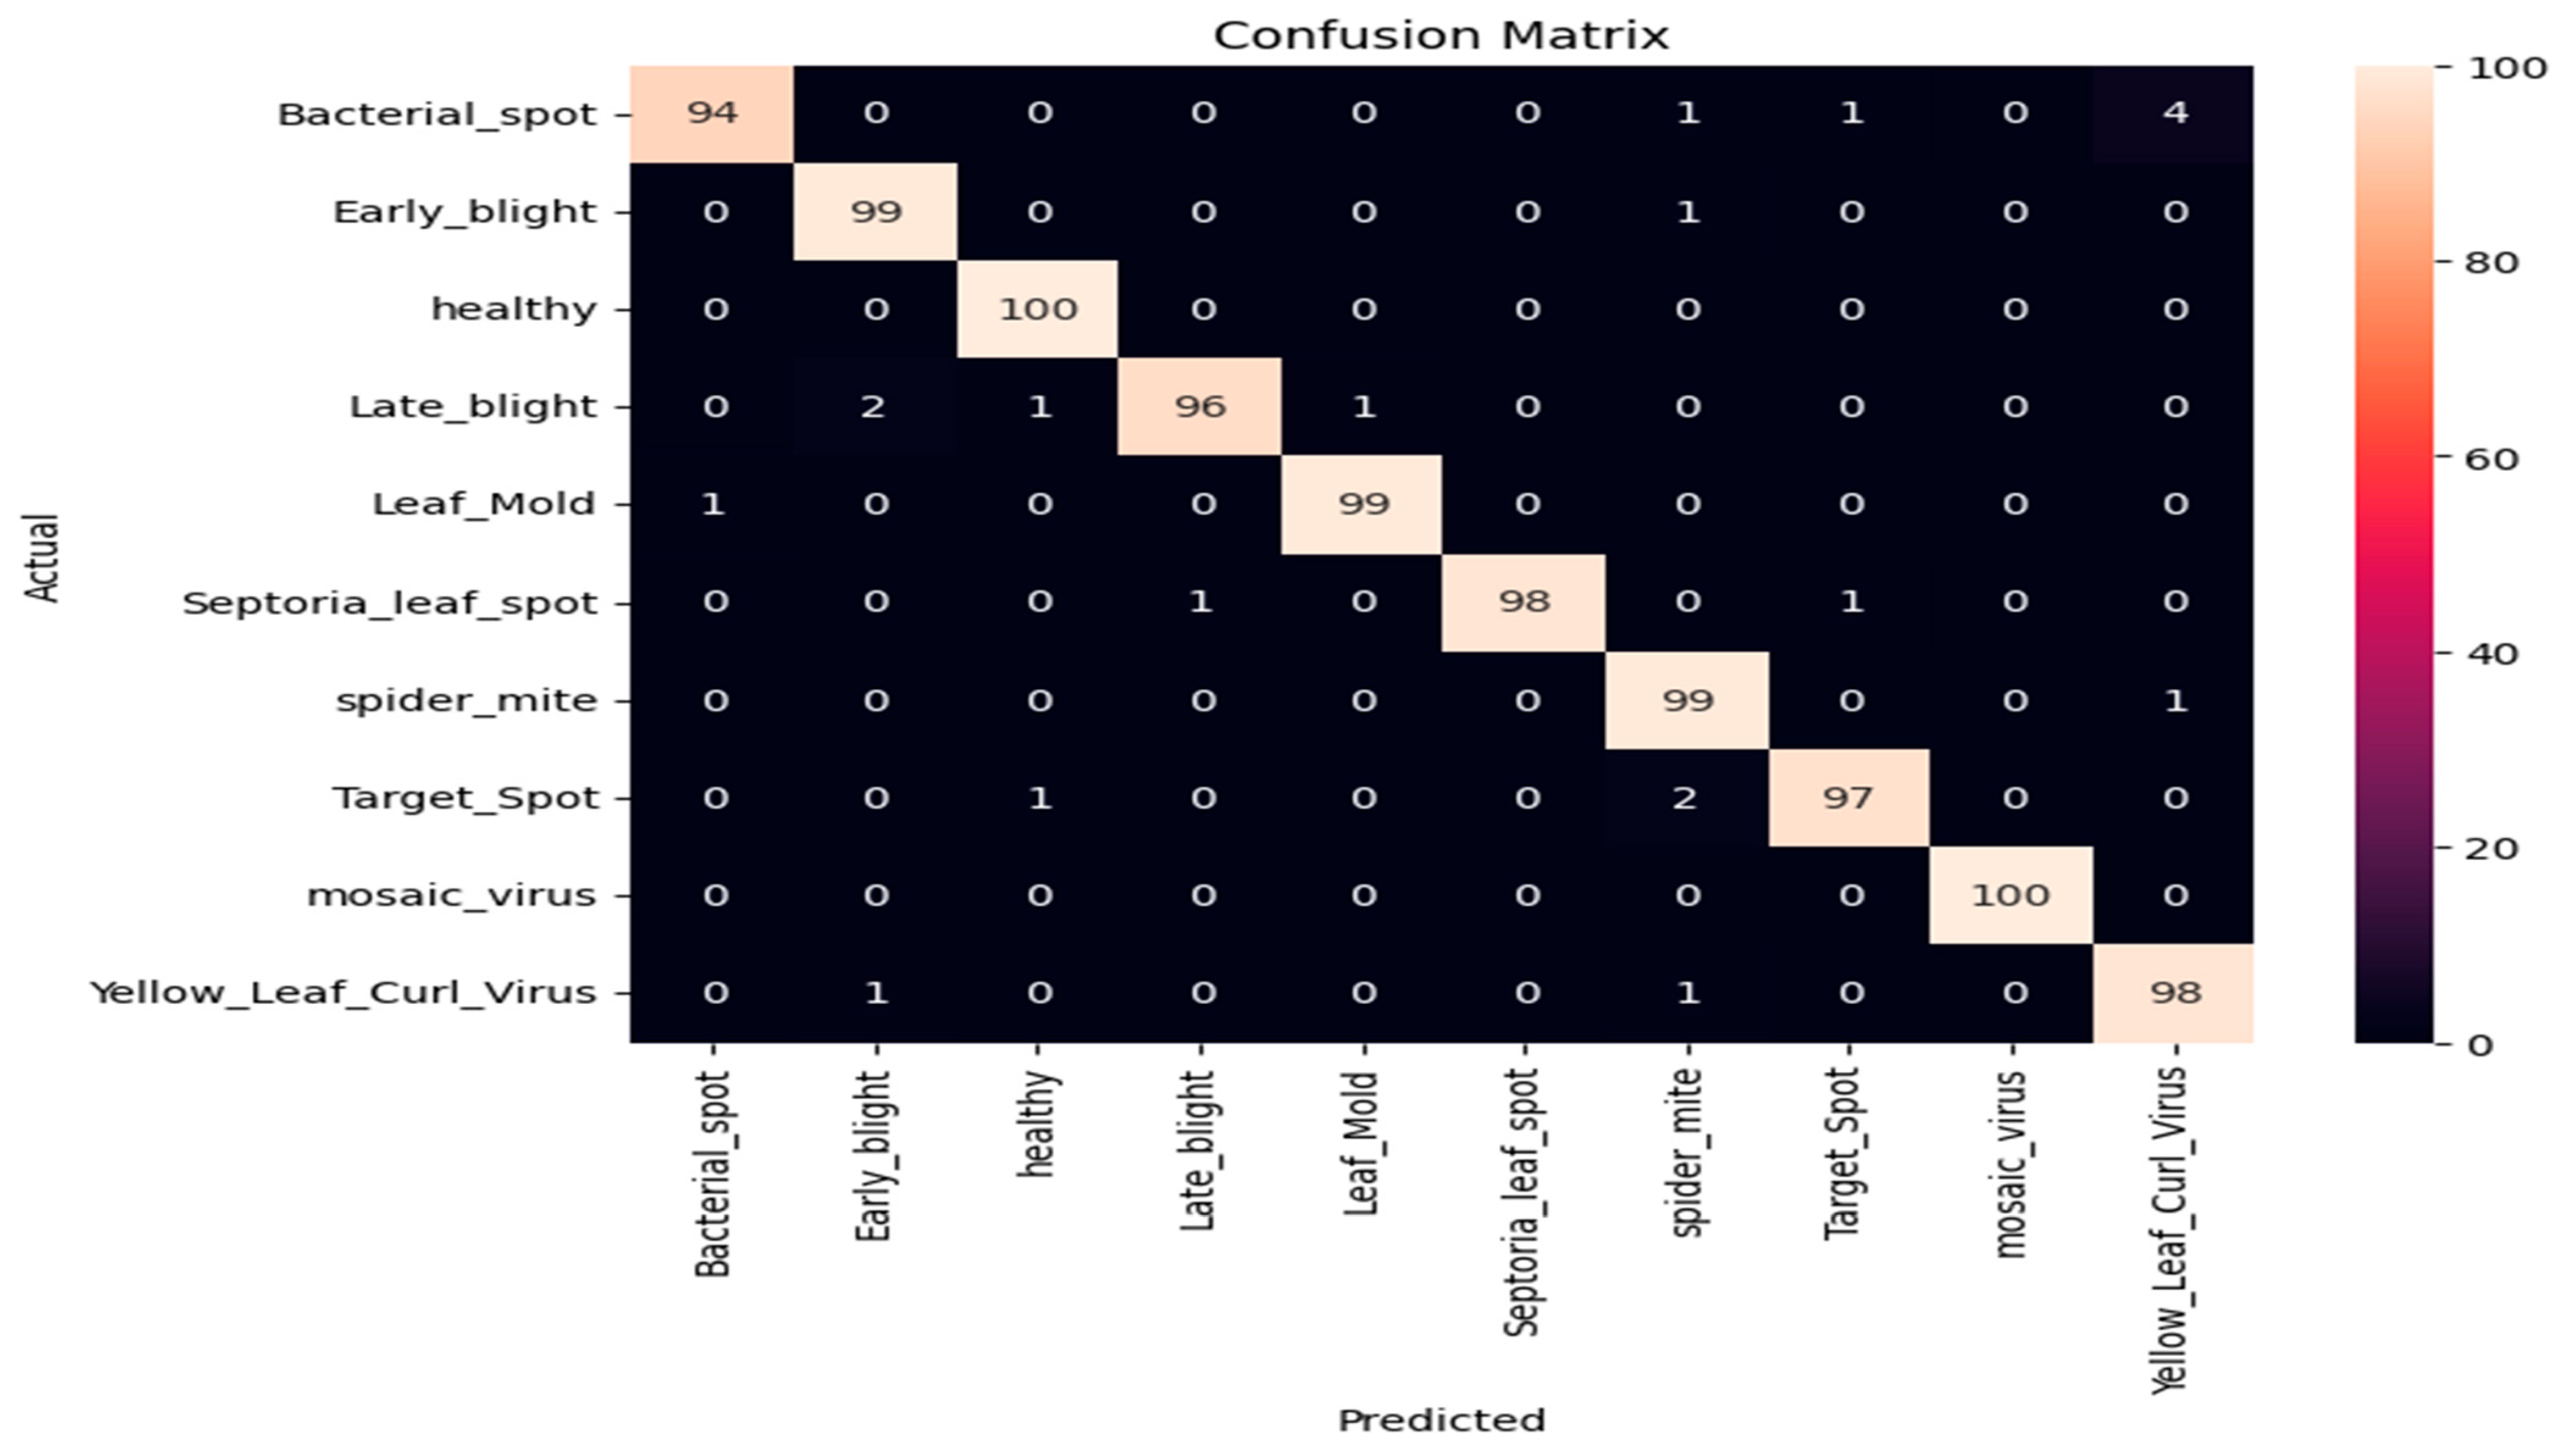
As seen in Figure 12, the confusion matrix was devised to provide a visual representation of the classification performance of the tomato leaf dataset obtained from the VIT model, or the number of images that were correctly categorized in a given number of iterations during validation and training, respectively. According to the VIT model’s confusion matrix, the model has a strong positive impact on tomato disease detection, with only 20 misclassified samples out of 1000 samples. Figure S6 shows the confusion matrix of VIT model in 80% training and 20% testing.
5. Discussion
Tomato is one of the most important crops worldwide and has high economic and nutritional value. However, it is often affected by various diseases, which can reduce both yield and quality. Early detection and accurate diagnosis of tomato diseases are crucial for effective disease management and prevention.
This research further confirms the effectiveness of proposed approaches to tomato disease detection and provides valuable insight into different models’ performance. The results of this study have shown significant accuracy for developing of automated systems that can detect and manage tomato plant diseases in the early stages, ultimately improving the efficiency and sustainability of tomato production.
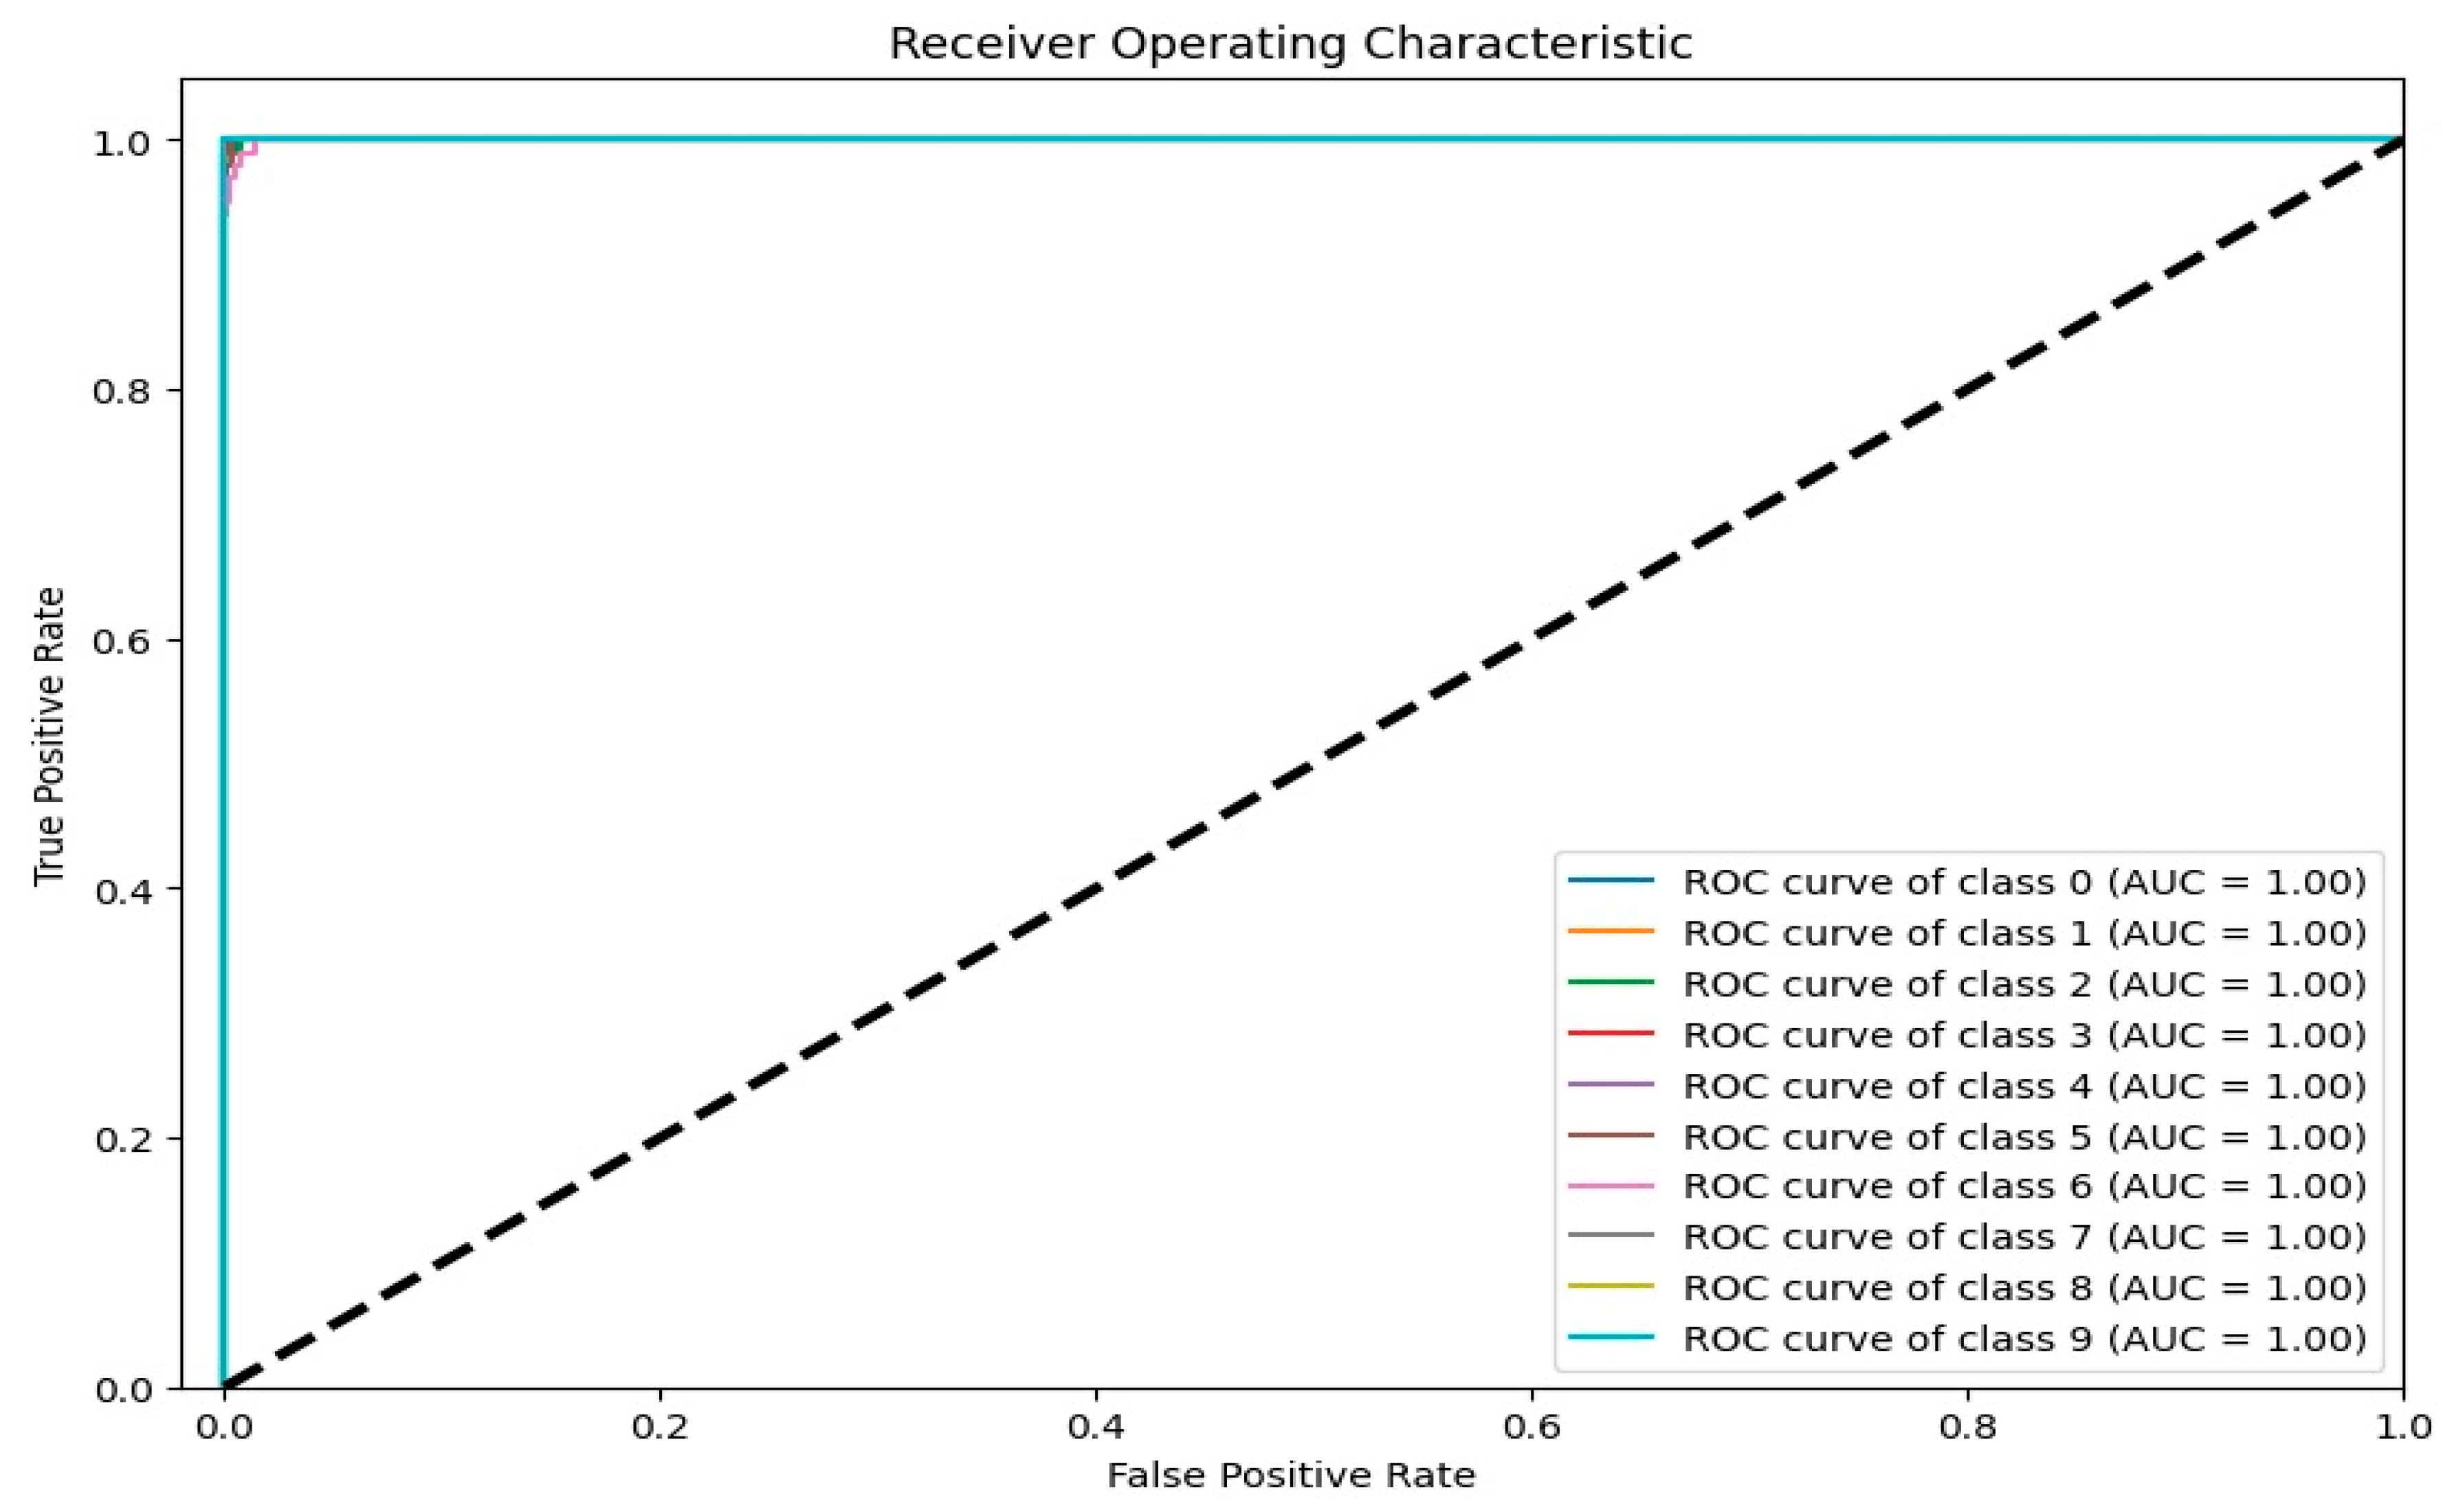
To diagnose tomato leaf diseases, this research examined multiple CNN models that had been pretrained on the ImageNet dataset and then compared those models to the dataset. Three alternative CNN models—DenseNet121, ResNet50V2, and VIT—were trained via transfer learning. Each model was educated and validated using the same collection of tomato disease images, which included both infected and healthy examples. Table 8 shows the final result of the proposed deep leaning model at training and testing phase for detecting tomato disease. According to the findings, DenseNet121 successfully attained the highest possible training (99.88%) and test (99.00%) accuracies. In addition, its recall, accuracy, and F1 score were all above average, reaching 99.00%, 99.00%, and 98.99%, respectively. ResNet50V2 obtained a training accuracy of 99.49% and a test accuracy of 95.60%, both of which were lower than its predecessor. Its recall, accuracy, and F1 score were all lower than those of DenseNet121, reaching 95.60%, 94.80%, and 95.59%, respectively. The accuracy of the VIT’s training and tests was also 98.00%. It had a recall of 98.00%, a precision score of 98.00%, and an F1 score of 98.00%. The findings indicate that DenseNet121 performed the best overall in identifying tomato diseases, followed by VIT and then ResNet50V2. The ROC plot of DenseNet121 is presented in Figure 13.
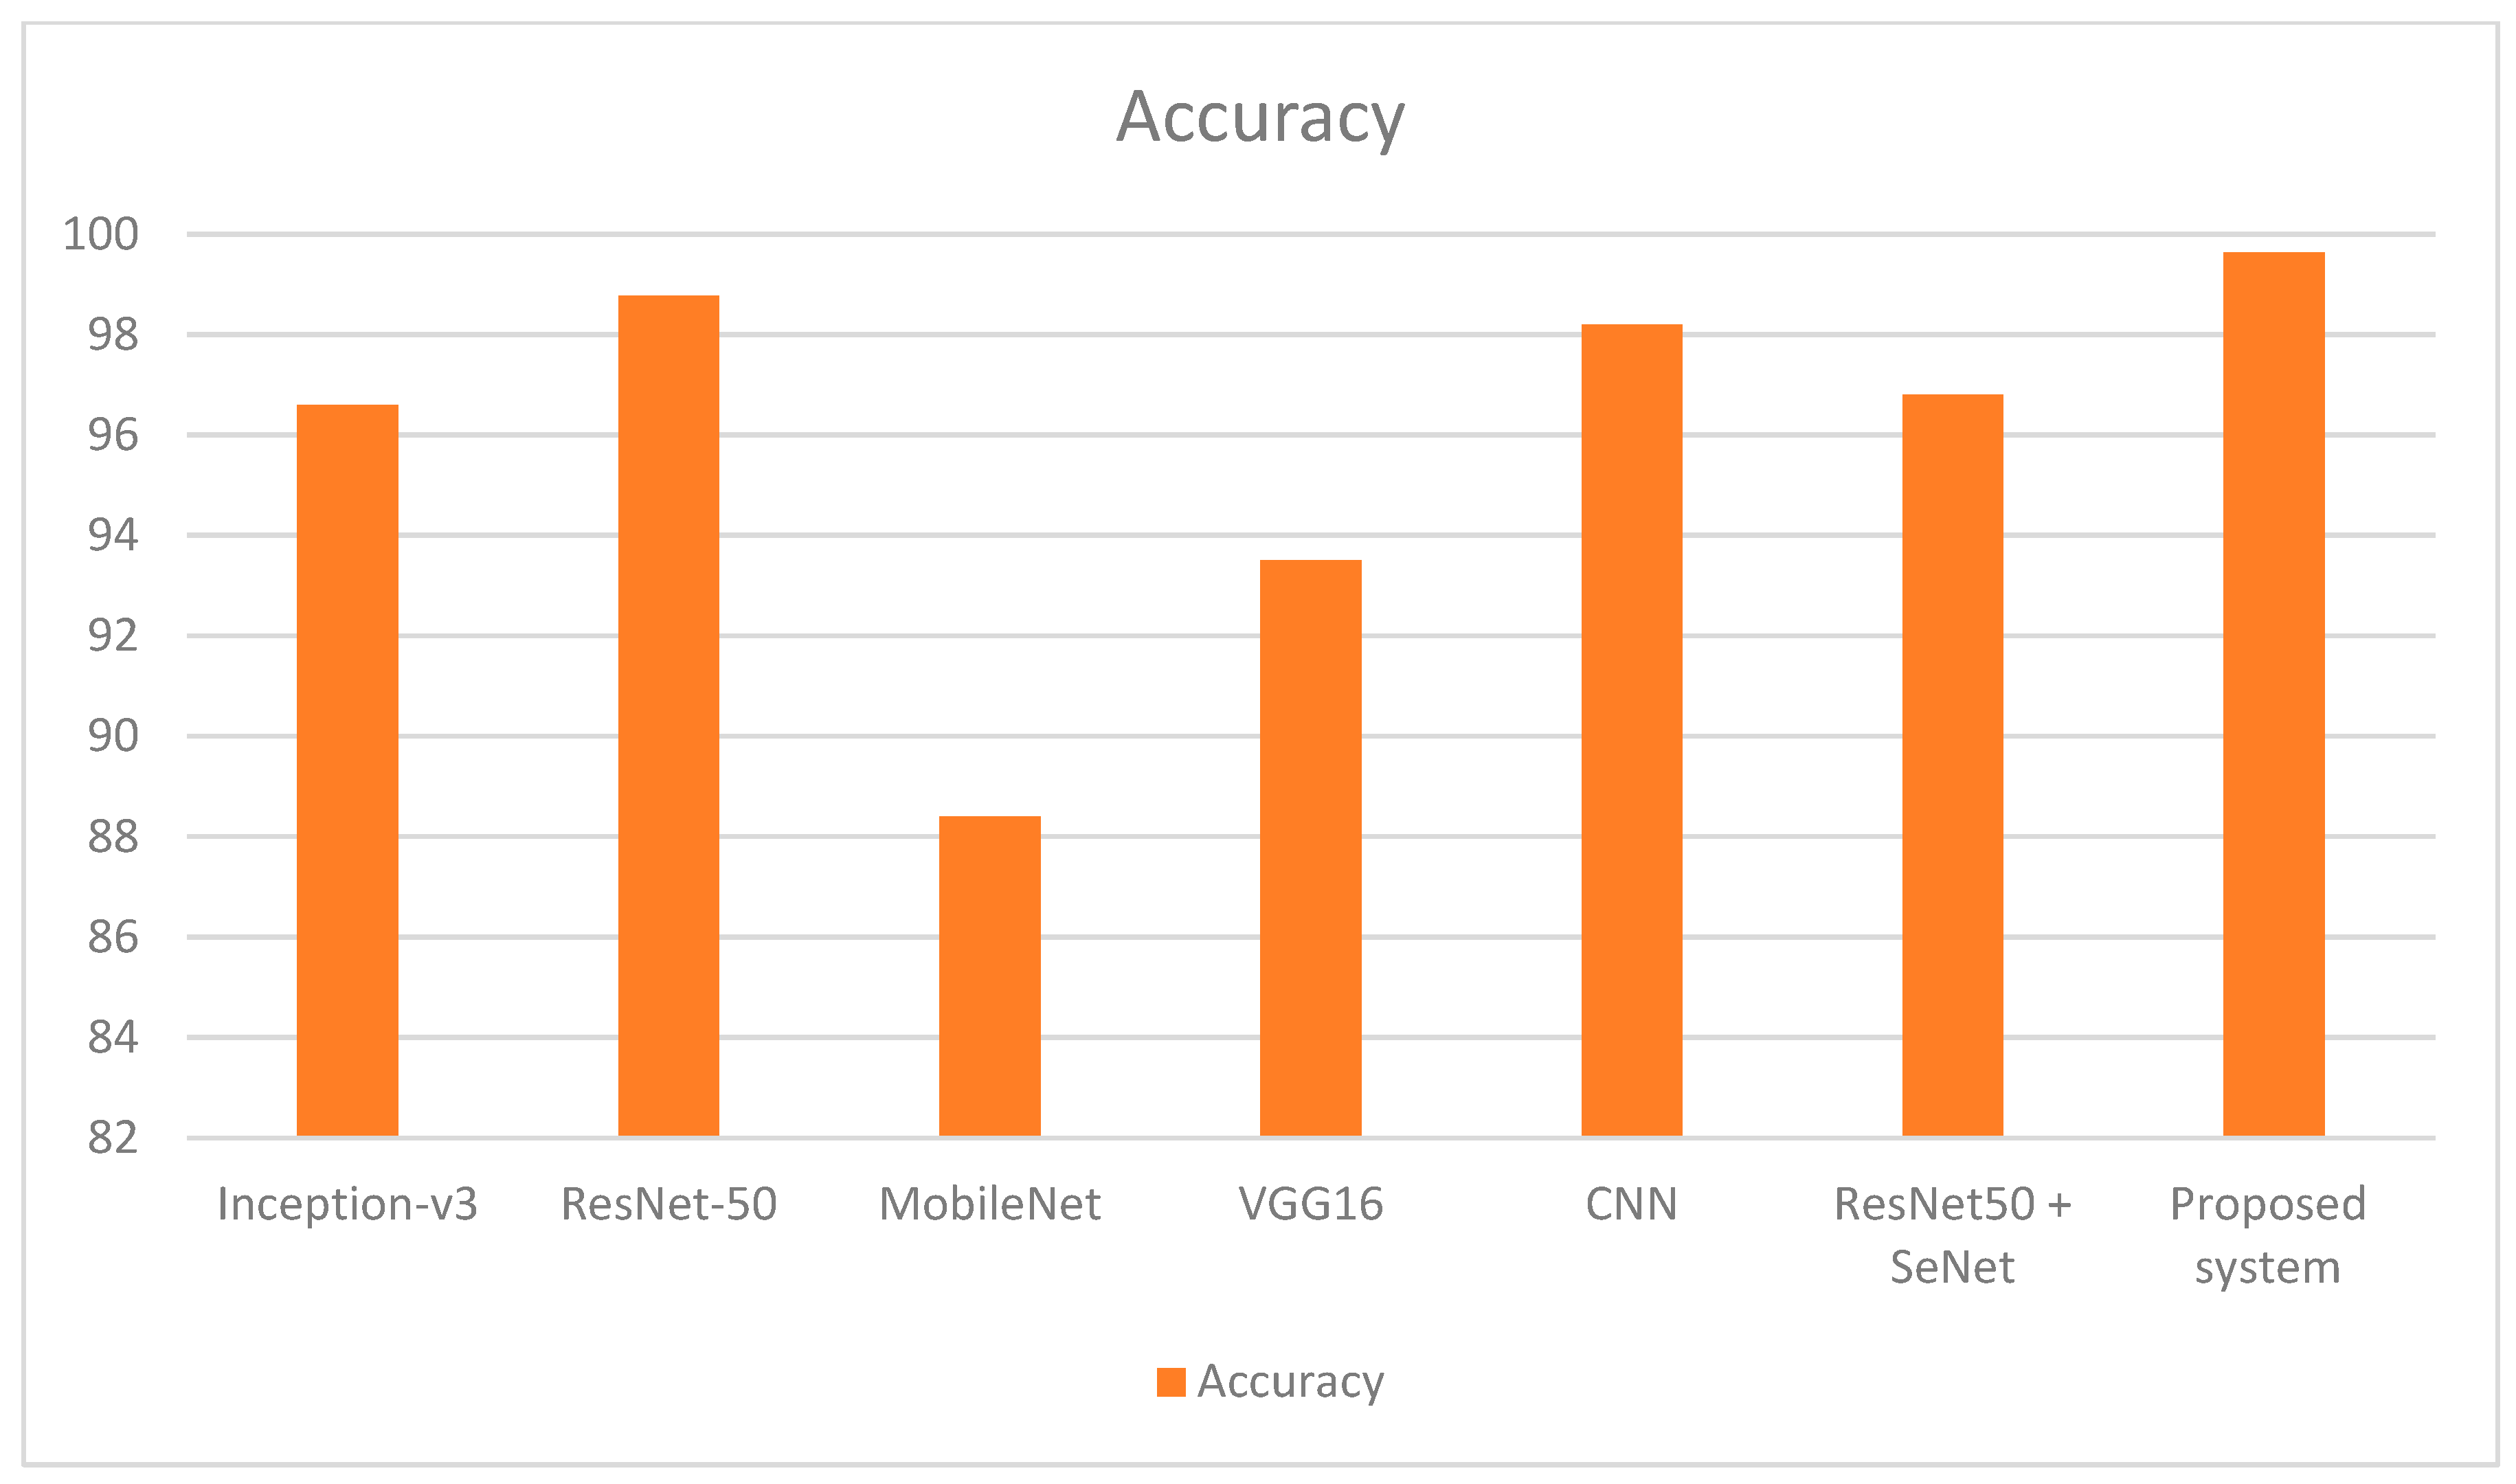
Additionally, a contrast was drawn between the level of difficulty provided by the suggested model and that of a number of other models. The section devoted to accuracy rates shows the individual successes of tomato leaf diseases in the datasets found in the literature. The results of the proposed DenseNet121 model, which had the best rate of accuracy (99.88%) in studies using a variety of methods other than the research recommended, are shown in Table 9 and Figure 14.
6. Conclusions
The purpose of this research was to analyze and apply many different deep-learning models to the task of diagnosing diseases that affect tomato plants. The dataset from Kaggle, which is readily accessible, was selected since it contains information on ten different diseases that might affect tomato plant leaves. Three novel CNN architectures were proposed for disease prediction and classification in tomato plants using this dataset, alongside the specialized deep learning architectures DenseNet121, ResNet50V2, and ViT models.
Deep learning has emerged as a powerful tool for detecting diseases in plants, including tomatoes. Using neural networks to analyze large datasets of plant images, deep learning models can learn to identify patterns and features that are characteristic of specific diseases. This can help farmers and researchers quickly and accurately diagnose plant diseases, allowing for more targeted treatment and prevention strategies. Based on the results of this study, it can be concluded that deep learning models, including DenseNet121, ResNet50V2, and ViT, are effective for tomato disease detection. Among these models, DenseNet121 showed the highest accuracy, with 99.88% on training data and 99% on testing data. The ResNet50V2 and ViT models also showed high accuracy, but their performance was lower than DenseNet121. These findings suggest that deep learning models can provide accurate and efficient solutions for tomato disease detection, which can ultimately benefit the agriculture industry. The obtained results of the analysis showed that the suggested model performed better than alternative models. The method that has been presented for recognizing the diseases that affects tomatoes is an innovative one. One of the limitations of this research is that the system has not been incorporated into a mobile application. However, it does provide a simple and low-cost method for diagnosing tomato leaf diseases by only requiring the user to take an image of the affected plant’s leaf. In the future, we want to enhance the model by using more advanced forms of artificial intelligence that are supported by internet of things (IoT) technology.
Supplementary Materials
The following supporting information can be downloaded at: https://www.mdpi.com/article/10.3390/agronomy13051184/s1, Figure S1: Performance of DenseNet121 model; (a) DenseNet121 model accuracy, (b) DenseNet121 mode loss with (80% training and 20% testing; Figure S2: Confusion matrix of DenseNet121 with (80% training and 20 testing); Figure S3: Performance of the ResNet50V2 model; (a) ResNet50V2model accuracy and (b) ResNet50V21 mode loss with (80% training and 20% testing); Figure S4: The ResNet50V2 model’s confusion matrix with (80% training and 20% testing); Figure S5: VIT model performance; (a) VIT model accuracy and (b) VIT mode loss with (80% training and 20% testing); Figure S6: Confusion matrix of ViT model with (80% training and 20% testing); Table S1. Results of DenseNet121 model in (80% training and 20% testing); Table S2: Results of ResNet50V2 model with (80% training and 20% testing); Table S3: Results of ViT model with (80% training and 20% testing).
Author Contributions
Conceptualization, M.S.A. and F.W.A.; methodology, M.S.A. and F.W.A.; software, M.S.A. and F.W.A.; validation, M.S.A. and F.W.A. formal analysis, M.S.A. and F.W.A. investigation, M.S.A. and F.W.A. resources, M.S.A. and F.W.A. data curation, M.S.A. and F.W.A. writing—original draft preparation, M.S.A. and F.W.A. writing—review and editing, M.S.A. and F.W.A.; visualization, M.S.A. and F.W.A. supervision, M.S.A. and F.W.A.; project administration, M.S.A. and F.W.A. funding acquisition, M.S.A. and F.W.A. All authors have read and agreed to the published version of the manuscript.
Funding
The authors extend their appreciation to the Deputyship for Research & Innovation, Ministry of Education in Saudi Arabia for funding this research work through the project number INST048.
Data Availability Statement
https://www.kaggle.com/datasets/kaustubhb999/tomatoleaf (accessed on 20 January 2023).
Conflicts of Interest
The authors declare no conflict of interest.
References
- Schreinemachers, P.; Simmons, E.B.; Wopereis, M.C. Tapping the economic and nutritional power of vegetables. Glob. Food Secur. 2018, 16, 36–45. [Google Scholar] [CrossRef]
- Stilwell, M. The Global Tomato Online News Processing in 2018. Available online: https://www.tomatonews.com/ (accessed on 15 February 2023).
- Wang, R.; Lammers, M.; Tikunov, Y.; Bovy, A.G.; Angenent, G.C.; de Maagd, R.A. The rin, nor and Cnr spontaneous mutations inhibit tomato fruit ripening in additive and epistatic manners. Plant Sci. 2020, 294, 110436–110447. [Google Scholar] [CrossRef] [PubMed]
- Ahmad, A.; Saraswat, D.; El Gamal, A. A survey on using deep learning techniques for plant disease diagnosis and recommendations for development of appropriate tools. Smart Agric. Technol. 2023, 3, 100083. [Google Scholar] [CrossRef]
- Yu, Y.; Samali, B.; Rashidi, M.; Mohammadi, M.; Nguyen, T.N.; Zhang, G. Vision-based concrete crack detection using a hybrid framework considering noise effect. J. Build. Eng. 2022, 61, 105246. [Google Scholar] [CrossRef]
- Şahin, M.E.; Ulutaş, H.; Yuce, E. A deep learning approach for detecting pneumonia in chest X-rays. Avrupa Bilim Teknol. Derg. 2021, 28, 562–567. [Google Scholar] [CrossRef]
- Bock, C.H.; Parker, P.E.; Cook, A.Z.; Gottwald, T.R. Visual Rating and the Use of Image Analysis for Assessing Different Symptoms of Citrus Canker on Grapefruit Leaves. Plant Dis. 2008, 92, 530–541. [Google Scholar] [CrossRef]
- Yu, Y.; Liang, S.; Samali, B.; Nguyen, T.N.; Zhai, C.; Li, J.; Xie, X. Torsional capacity evaluation of RC beams using an improved bird swarm algorithm optimised 2D convolutional neural network. Eng. Struct. 2022, 273, 115066. [Google Scholar] [CrossRef]
- Spantideas, S.T.; Giannopoulos, A.E.; Kapsalis, N.C.; Capsalis, C.N. A deep learning method for modeling the magnetic signature of spacecraft equipment using multiple magnetic dipoles. IEEE Magn. Lett. 2021, 12, 1–5. [Google Scholar] [CrossRef]
- Park, H.; Eun, J.S.; Kim, S.H. Image-based disease diagnosing and predicting of the crops through the deep learning mechanism. In Proceedings of the 2017 International Conference on Information and Communication Technology Convergence (ICTC), Jeju Island, Republic of Korea, 18–20 October 2017; pp. 129–131. [Google Scholar]
- Sardogan, M.; Tuncer, A.; Ozen, Y. Plant leaf disease detection and classification based on CNN with LVQ algorithm. In Proceedings of the 2018 3rd International Conference on Computer Science and Engineering (UBMK), Sarajevo, Bosnia and Herzegovina, 20–23 September 2018; pp. 382–385. [Google Scholar]
- Singh, V.; Misra, A.K. Detection of plant leaf diseases using image segmentation and soft computing techniques. Inf. Process. Agric. 2017, 4, 41–49. [Google Scholar] [CrossRef]
- Zhang, S.; Wu, X.; You, Z.; Zhang, L. Leaf image based cucumber disease recognition using sparse representation classification. Comput. Electron. Agric. 2017, 134, 135–141. [Google Scholar] [CrossRef]
- Ferentinos, K.P. Deep learning models for plant disease detection and diagnosis. Comput. Electron. Agric. 2018, 145, 311–318. [Google Scholar] [CrossRef]
- Devaraj, A.; Rathan, K.; Jaahnavi, S.; Indira, K. Identification of Plant Disease using Image Processing Technique. In Proceedings of the 2019 International Conference on Communication and Signal Processing (ICCSP), Chennai, India, 4–6 April 2019; pp. 749–753. [Google Scholar]
- Mugithe, P.K.; Mudunuri, R.V.; Rajasekar, B.; Karthikeyan, S. Image Processing Technique for Automatic Detection of Plant Diseases and Alerting System in Agricultural Farms. In Proceedings of the 2020 International Conference on Communication and Signal Processing (ICCSP), Chennai, India, 28–30 July 2020; pp. 1603–1607. [Google Scholar]
- Phadikar, S.; Sil, J. Rice disease identification using pattern recognition techniques. In Proceedings of the 2008 11th International Conference on Computer and Information Technology, Khulna, Bangladesh, 24–27 December 2008; pp. 420–423. [Google Scholar]
- Sarayloo, Z.; Asemani, D. Designing a classifier for automatic detection of fungal diseases in wheat plant: By pattern recognition techniques. In Proceedings of the 2015 23rd Iranian Conference on Electrical Engineering, Tehran, Iran, 10–14 May 2015; pp. 1193–1197. [Google Scholar]
- Thangadurai, K.; Padmavathi, K. Computer Visionimage Enhancement for Plant Leaves Disease Detection. In Proceedings of the 2014 World Congress on Computing and Communication Technologies, Trichirappalli, India, 27 February–1 March 2014; pp. 173–175. [Google Scholar]
- Yong, Z.; Tonghui, R.; Changming, L.; Chao, W.; Jiya, T. Research on Recognition Method of Common Corn Diseases Based on Computer Vision. In Proceedings of the 2019 11th International Conference on Intelligent Human-Machine Systems and Cybernetics (IHMSC), Hangzhou, China, 24–25 August 2019; Volume 1, pp. 328–331. [Google Scholar]
- Khirade, S.D.; Patil, A.B. Plant Disease Detection Using Image Processing. In Proceedings of the 2015 International Conference on Computing Communication Control and Automation, Pune, India, 26–27 February 2015; pp. 768–771. [Google Scholar]
- Kamilaris, A.; Prenafeta-Boldú, F.X. Deep learning in agriculture: A survey. Comput. Electron. Agric. 2018, 147, 70–90. [Google Scholar] [CrossRef]
- Li, L.; Zhang, S.; Wang, B. Plant Disease Detection and Classification by Deep Learning—A Review. IEEE Access 2021, 9, 56683–56698. [Google Scholar] [CrossRef]
- Lee, S.H.; Chan, C.S.; Wilkin, P.; Remagnino, P. Deep-plant: Plant identification with convolutional neural networks. In Proceedings of the 2015 IEEE International Conference on Image Processing (ICIP), Quebec City, QC, Canada, 27–30 September 2015; pp. 452–456. [Google Scholar]
- Zhang, Y.; Song, C.; Zhang, D. Deep Learning-Based Object Detection Improvement for Tomato Disease. IEEE Access 2020, 8, 56607–56614. [Google Scholar] [CrossRef]
- Sabrol, H.; Satish, K. Tomato plant disease classification in digital images using classification tree. In Proceedings of the International Conference on Communication and Signal Processing (ICCSP), Melmaruvathur, India, 6–8 April 2016; pp. 1242–1246. [Google Scholar]
- Hasan, M.; Tanawala, B.; Patel, K.J. Deep learning precision farming: Tomato leaf disease detection by transfer learning. In Proceedings of the 2nd International Conference on Advanced Computing and Software Engineering (ICACSE), Sultanpur, Inida, 8–9 February 2019. [Google Scholar]
- Adhikari, S.; Shrestha, B.; Baiju, B.; Kumar, S. Tomato plant diseases detection system using image processing. In Proceedings of the 1st KEC Conference on Engineering and Technology, Laliitpur, Nepal, 27 September 2018; Volume 1, pp. 81–86. [Google Scholar]
- Salih, T.A. Deep Learning Convolution Neural Network to Detect and Classify Tomato Plant Leaf Diseases. Open Access Libr. J. 2020, 7, 12. [Google Scholar] [CrossRef]
- Ishak, S.; Rahiman, M.H.; Kanafiah, S.N.; Saad, H. Leaf disease classification using artificial neural network. J. Teknol. 2015, 77, 109–114. [Google Scholar] [CrossRef]
- Sabrol, H.; Kumar, S. Fuzzy and neural network-based tomato plant disease classification using natural outdoor images. Indian J. Sci. Technol. 2016, 9, 1–8. [Google Scholar] [CrossRef]
- Rangarajan, A.K.; Purushothaman, R.; Ramesh, A. Tomato crop disease classification using pre-trained deep learning algorithm. Procedia Comput. Sci. 2018, 133, 1040–1047. [Google Scholar] [CrossRef]
- Coulibaly, S.; Kamsu-Foguem, B.; Kamissoko, D.; Traore, D. Deep neural networks with transfer learning in millet crop images. Comput. Ind. 2019, 108, 115–120. [Google Scholar] [CrossRef]
- Sangeetha, R.; Rani, M. Tomato Leaf Disease Prediction Using Transfer Learning. In Proceedings of the International Advanced Computing Conference 2020, Panaji, India, 5–6 December 2020. [Google Scholar]
- Mortazi, A.; Bagci, U. Automatically designing CNN architectures for medical image segmentation. In Proceedings of the International Workshop on Machine Learning in Medical Imaging, Granada, Spain, 16 September 2018; pp. 98–106. [Google Scholar]
- Jiang, D.; Li, F.; Yang, Y.; Yu, S. A tomato leaf diseases classification method based on deep learning. In Proceedings of the Chinese Control and Decision Conference (CCDC), Hefei, China, 22–24 August 2020; pp. 1446–1450. [Google Scholar]
- Rashid, J.; Khan, I.; Ali, G.; Almotiri, S.H.; AlGhamdi, M.A.; Masood, K. Multi-Level Deep Learning Model for Potato Leaf Disease Recognition. Electronics 2021, 10, 2064. [Google Scholar] [CrossRef]
- PlantVillege. Available online: https://www.kaggle.com/emmarex/plantdisease (accessed on 3 February 2023).
- Lakshmanarao, A.; Babu, M.R.; Kiran, T.S.R. Plant Disease Prediction and classification using Deep Learning ConvNets. In Proceedings of the 2021 International Conference on Artificial Intelligence and Machine Vision (AIMV), Gandhinagar, India, 24–26 September 2021; pp. 1–6. [Google Scholar]
- Militante, S.V.; Gerardo, B.D.; Dionisio, N.V. Plant Leaf Detection and Disease Recognition using Deep Learning. In Proceedings of the 2019 IEEE Eurasia Conference on IOT, Communication and Engineering (ECICE), Yunlin, Taiwan, 3–6 October 2019; pp. 579–582. [Google Scholar]
- Marzougui, F.; Elleuch, M.; Kherallah, M. A Deep CNN Approach for Plant Disease Detection. In Proceedings of the 2020 21st International Arab Conference on Information Technology (ACIT), Giza, Egypt, 28–30 November 2020; pp. 1–6. [Google Scholar]
- Ngugi, L.C.; Abdelwahab, M.; Abo-Zahhad, M. Tomato leaf segmentation algorithms for mobile phone applications using deep learning. Comput. Electron. Agric. 2020, 178, 105788. [Google Scholar] [CrossRef]
- Rozaqi, A.J.; Sunyoto, A. Identification of Disease in Potato Leaves Using Convolutional Neural Network (CNN) Algorithm. In Proceedings of the 2020 3rd International Conference on Information and Communications Technology (ICOIACT), Yogyakarta, Indonesia, 24–25 November 2020; pp. 72–76. [Google Scholar]
- Mattihalli, C.; Gedefaye, E.; Endalamaw, F.; Necho, A. Real Time Automation of Agriculture Land, by automatically Detecting Plant Leaf Diseases and Auto Medicine. In Proceedings of the 2018 32nd International Conference on Advanced Information Networking and Applications Workshops (WAINA), Krakow, Poland, 16–18 May 2018; pp. 325–330. [Google Scholar]
- Divyashri., P.; Pinto, L.A.; Mary, L.; Manasa., P.; Dass, S. The Real-Time Mobile Application for Identification of Diseases in Coffee Leaves using the CNN Model. In Proceedings of the 2021 Second International Conference on Electronics and Sustainable Communication Systems (ICESC), Coimbatore, India, 4–6 August 2021; pp. 1694–1700. [Google Scholar]
- Liu, J.; Wang, X. Early recognition of tomato gray leaf spot disease based on MobileNetv2-YOLOv3 model. Plant Methods 2020, 16, 83. [Google Scholar] [CrossRef] [PubMed]
- Khasawneh, N.; Faouri, E.; Fraiwan, M. Automatic Detection of Tomato Diseases Using Deep Transfer Learning. Appl. Sci. 2022, 12, 8467. [Google Scholar] [CrossRef]
- Mim, T.T.; Sheikh, M.H.; Shampa, R.A.; Reza, M.S.; Islam, M.S. Leaves Diseases Detection of Tomato Using Image Processing. In Proceedings of the 2019 8th International Conference System Modeling and Advancement in Research Trends (SMART), Moradabad, India, 22–23 November 2019; pp. 244–249. [Google Scholar]
- Kumar, A.; Vani, M. Image Based Tomato Leaf Disease Detection. In Proceedings of the 2019 10th International Conference on Computing, Communication and Networking Technologies (ICCCNT), Kanpur, India, 6–8 July 2019; pp. 1–6. [Google Scholar]
- Tm, P.; Pranathi, A.; SaiAshritha, K.; Chittaragi, N.B.; Koolagudi, S.G. Tomato Leaf Disease Detection Using Convolutional Neural Networks. In Proceedings of the 2018 Eleventh International Conference on Contemporary Computing (IC3), Noida, India, 2–4 August 2018; pp. 1–5. [Google Scholar]
- Kang, F.; Li, J.; Wang, C.; Wang, F. A Lightweight Neural Network-Based Method for Identifying Early-Blight and Late-Blight Leaves of Potato. Appl. Sci. 2023, 13, 1487. [Google Scholar] [CrossRef]
- Al-Gaashani, M.S.A.M.; Shang, F.; Muthanna, M.S.A.; Khayyat, M.; El-Latif, A.A.A. Tomato leaf disease classification by exploiting transfer learning and feature concatenation. IET Image Process. 2022, 16, 913–925. [Google Scholar] [CrossRef]
- Pathan, S.M.K.; Ali, M.F. Implementation of Faster R-CNN in Paddy Plant Disease Recognition System. In Proceedings of the 2019 3rd International Conference on Electrical, Computer & Telecommunication Engineering (ICECTE), Rajshahi, Bangladesh, 26–28 December 2019; pp. 189–192. [Google Scholar]
- Zhou, G.; Zhang, W.; Chen, A.; He, M.; Ma, X. Rapid Detection of Rice Disease Based on FCM-KM and Faster R-CNN Fusion. IEEE Access 2019, 7, 143190–143206. [Google Scholar] [CrossRef]
- Cardellicchio, A.; Solimani, F.; Dimauro, G.; Petrozza, A.; Summerer, S.; Cellini, F.; Renò, V. Detection of tomato plant phenotyping traits using YOLOv5-based single stage detectors. Comput. Electron. Agric. 2023, 207, 107757. [Google Scholar] [CrossRef]
- Liu, G.; Nouaze, J.C.; Touko Mbouembe, P.L.; Kim, J.H. YOLO-Tomato: A Robust Algorithm for Tomato Detection Based on YOLOv3. Sensors 2020, 20, 2145. [Google Scholar] [CrossRef]
- Liu, J.; Wang, X. Tomato Diseases and Pests Detection Based on Improved Yolo V3 Convolutional Neural Network. Front. Plant Sci. 2020, 11, 898. [Google Scholar] [CrossRef]
- Aldhyani, T.H.H.; Nair, R.; Alzain, E.; Alkahtani, H.; Koundal, D. Deep Learning Model for the Detection of Real Time Breast Cancer Images Using Improved Dilation-Based Method. Diagnostics 2022, 12, 2505. [Google Scholar] [CrossRef]
- Aldhyani, T.H.; Alshebami, A.S.A.; Alzahrani, M.Y. Soft Computing Model to Predict Chronic Diseases. J. Inf. Sci. Eng. 2020, 36, 365–376. [Google Scholar]
- Al-Adhaileh, M.H.; Aldhyani, T.H.H. Artificial intelligence framework for modeling and predicting crop yield to enhance food security in Saudi Arabia. PeerJ Comput. Sci. 2022, 2022, e1104. [Google Scholar] [CrossRef] [PubMed]
- Al-Adhaileh, M.H.; Verma, A.; Aldhyani, T.H.H.; Koundal, D. Potato Blight Detection Using Fine-Tuned CNN Architecture. Mathematics 2023, 11, 1516. [Google Scholar] [CrossRef]
- Widiyanto, S.; Fitrianto, R.; Wardani, D.T. Implementation of Convolutional Neural Network Method for Classification of Diseases in Tomato Leaves. In Proceedings of the 2019 Fourth International Conference on Informatics and Computing (ICIC), Semarang, Indonesia, 16–17 October 2019; pp. 1–5. [Google Scholar]
- Mamun, M.A.A.; Karim, D.Z.; Pinku, S.N.; Bushra, T.A. TLNet: A Deep CNN model for Prediction of tomato Leaf Diseases. In Proceedings of the 2020 23rd International Conference on Computer and Information Technology (ICCIT), Dhaka, Bangladesh, 19–21 December 2020; pp. 1–6. [Google Scholar]
- Elhassouny, A.; Smarandache, F. Smart mobile application to recognize tomato leaf diseases using Convolutional Neural Networks. In Proceedings of the 2019 International Conference of Computer Science and Renewable Energies (ICCSRE), Agadir, Morocco, 22–24 July 2019; pp. 1–4. [Google Scholar]
- Agarwal, M.; Gupta, S.K.; Biswas, K.K. Development of Efficient CNN model for Tomato crop disease identification. Sustain. Comput. Inform. Syst. 2020, 28, 100407. [Google Scholar] [CrossRef]
- Lamba, M.; Gigras, Y.; Dhull, A. Classification of plant diseases using machine and deep learning. Open Comput. Sci. 2021, 11, 491–508. [Google Scholar] [CrossRef]
- Zhao, S.; Peng, Y.; Liu, J.; Wu, S. Tomato leaf disease diagnosis based on improved convolution neural network by attention module. Agriculture 2021, 11, 651. [Google Scholar] [CrossRef]
Figure 1.
The structure of the suggested approach.

Figure 2.
Demonstrated dataset samples.

Figure 3.
DenseNet121 model for tomato disease detection.

Figure 4.
DenseNet121 model for tomato disease detection.

Figure 5.
Image after transformer encoder.

Figure 6.
ViT model for tomato disease detection.

Figure 7.
Performance of DenseNet121 model; (a) DenseNet121 model accuracy and (b) DenseNet121 mode loss (90% training and 10% testing).
Figure 7.
Performance of DenseNet121 model; (a) DenseNet121 model accuracy and (b) DenseNet121 mode loss (90% training and 10% testing).

Figure 8.
Confusion matrix of DenseNet121 (90% training and 10% testing).

Figure 9.
Performance of the ResNet50V2 model; (a) ResNet50V2model accuracy and (b) ResNet50V21 mode loss (90% training and 10% testing).
Figure 9.
Performance of the ResNet50V2 model; (a) ResNet50V2model accuracy and (b) ResNet50V21 mode loss (90% training and 10% testing).

Figure 10.
The ResNet50V2 model’s confusion matrix (90% training and 10% testing).

Figure 11.
VIT model performance; (a) VIT model accuracy and (b) VIT mode loss (90% training and 10% testing).
Figure 11.
VIT model performance; (a) VIT model accuracy and (b) VIT mode loss (90% training and 10% testing).

Figure 12.
Confusion matrix of ViT model (90% training and 10% testing).

Figure 13.
ROC curve DenseNet121 model.

Figure 14.
Comparison of results of DenseNet121 against different CNN models in terms of accuracy.


Table 1.
Tomato leaf features.
| Class | Number of Samples | Description |
|---|---|---|
| Mosaic virus | 1100 | This is a viral disease that can cause significant damage to tomato plants, leading to reduced growth and yield. Symptoms include mosaic-like patterns of light and dark green on leaves, stunted growth, and deformed fruit. The disease is transmitted by contact with infected plant material and can be managed using resistant tomato varieties and cultural practices, such as sanitation. |
| Target spot | 1100 | This disease is caused by the fungus Corynespora cassiicola and can cause circular, sunken lesions with concentric rings on leaves and stems. It can lead to defoliation and reduced fruit yield, but it can be managed using fungicides and cultural practices, such as crop rotation and sanitation. |
| Bacterial spot | 1100 | This is a common disease that can cause severe damage to tomato plants, leading to reduced yields and poor fruit quality. Symptoms include brown, sunken lesions on leaves and fruit, which eventually turn black and crusty. The disease is caused by the bacterium Xanthomonas campestris pv. vesicatoria and can be controlled using copper-based fungicides and cultural practices, such as crop rotation and sanitation. |
| Yellow leaf curl virus | 1100 | This is a viral disease that can cause significant damage to tomato plants, leading to stunted growth and reduced fruit yield. Symptoms include leaf yellowing and curling as well as distorted fruit. The disease is transmitted by the whitefly Bemisia tabaci, and it can be managed using insecticides, resistant tomato varieties, and cultural practices, such as crop rotation and sanitation. |
| Late blight | 1100 | This disease is caused by the fungus Phytophthora infestans and can cause rapid and devastating damage to tomato plants. Symptoms include water-soaked lesions on leaves and stems, which quickly turn brown and necrotic. The disease can be managed using fungicides and cultural practices, such as crop rotation, sanitation, and removal of infected plant material. |
| Leaf mold | 1100 | This disease is caused by the fungus Passalora fulva and can cause significant damage to tomato leaves, reducing plant growth and yield. Symptoms include yellowing and brown lesions on the plant’s lower leaves. The disease can be managed using fungicides and cultural practices, such as crop rotation and sanitation. |
| Early blight | 1100 | This disease is caused by the fungus Alternaria solani and is characterized by concentric rings of dark brown spots on the plant’s lower leaves. It can cause defoliation and reduced fruit yield but can be managed using fungicides and cultural practices, such as crop rotation and pruning. |
| Spider mites | 1100 | These are tiny arachnids that can cause significant damage to tomato plants by feeding on the undersides of leaves, causing yellowing and stunted growth. They can be managed using predatory mites, insecticidal soaps, and cultural practices, such as crop rotation and sanitation. |
| Tomato healthy | 1100 | This class contains images of healthy tomato leaves, which can be used as references for comparison with diseased leaves. |
| Septoria leaf spot | 1100 | This disease is caused by the fungus Septoria lycopersici and is characterized by small, circular lesions with dark brown centers and yellow halos on the lower leaves of the plant. It can cause significant defoliation and yield loss, but can be managed using fungicides and cultural practices, such as crop rotation and sanitation. |
Table 2.
Describe DenseNet121 model parameters.
| DenseNet121 Parameters | Value |
|---|---|
| Batch_Size | 8 |
| Optimizer | SGD |
| Learning Rate (lr) | 0.0001 |
| Momentum | 0.9 |
| Early Stopping (es) | Yes |
| Model Checkpoint (mc) | Yes |
| Number of Epochs | 100 |
Table 3.
Describe ResNet50V2 model parameters.
| Parameters | Values |
|---|---|
| #Optimizer | SGD |
| #Learning Rate (lr) | 0.0001 |
| #Momentum | 0.9 |
| #Early Stopping (es) | Yes |
| #Model Checkpoint (mc) | Yes |
| #Number of Epochs | 100 |
Table 4.
Describe ViT model parameters.
| Parameter | Value |
|---|---|
| Learning_Rate | 0.001 |
| Weight_Decay | 0.0001 |
| Batch_Size | 128 |
| Number_Epochs | 50 |
| Image_Size | 72 |
| Patch_Size | 6 |
| Number_Patches | 144 |
| Projection_Dimension | 64 |
| Number_Heads | 4 |
| Transformer_Units | (128, 64) |
Table 5.
Results of DenseNet121 model (90% training and 10% testing).
| Class Name | Precision% | Recall% | F1-Score% | Support |
|---|---|---|---|---|
| Bacterial_Spot | 96 | 100 | 98 | 100 |
| Early_Blight | 99 | 100 | 00 | 100 |
| Late_Blight | 100 | 100 | 100 | 100 |
| Leaf_Mold | 100 | 100 | 100 | 100 |
| Septoria_Leaf_Spot | 97 | 100 | 99 | 100 |
| Spider_Mites_Two-Spotted_Spider_Mite | 99 | 99 | 99 | 100 |
| Target_Spot | 100 | 93 | 96 | 100 |
| Yellow_Leaf_Curl Virus | 100 | 98 | 99 | 100 |
| Mosaic_Virus | 99 | 100 | 100 | 100 |
| Healthy | 00 | 100 | 100 | 100 |
| Accuracy of DenseNet121 | 99 | 1000 | ||
| DenseNet121_Macro Avg | 99 | 99 | 99 | 1000 |
| DenseNet121_Weighted Avg | 99 | 99 | 99 | 1000 |
Table 6.
Results of ResNet50V2 model (90% training and 10% testing).
| Class Name | Precision (%) | Recall (%) | F1-Score (%) | Support |
|---|---|---|---|---|
| Bacterial_Spot | 99 | 100 | 100 | 100 |
| Early_Blight | 97 | 93 | 95 | 100 |
| Late_Blight | 88 | 100 | 93 | 100 |
| Leaf_Mold | 96 | 95 | 95 | 100 |
| Septoria_Leaf_Spot | 96 | 96 | 96 | 100 |
| Spider_Mites_Two-Spotted_Spider_Mite | 96 | 90 | 93 | 100 |
| Target_Spot | 98 | 87 | 92 | 100 |
| Yellow_Leaf_Curl Virus | 100 | 98 | 99 | 100 |
| Mosaic_Virus | 89 | 100 | 94 | 100 |
| Healthy | 00 | 97 | 98 | 100 |
| Accuracy | 96 | 1000 | ||
| DenseNet121_Macro Avg | 0.96 | 96 | 96 | 1000 |
| DenseNet121_Weighted Avg | 0.96 | 96 | 96 | 1000 |
Table 7.
Results of ViT model (90% training and 10% testing).
| Class Name | Precision (%) | Recall (%) | F1-Score (%) | Support |
|---|---|---|---|---|
| Bacterial_Spot | 99 | 94 | 96 | 100 |
| Early_Blight | 97 | 99 | 98 | 100 |
| Late_Blight | 98 | 100 | 99 | 100 |
| Leaf_Mold | 99 | 96 | 97 | 100 |
| Septoria_Leaf_Spot | 99 | 99 | 99 | 100 |
| Spider_Mites_Two-Spotted_Spider_Mite | 00 | 98 | 99 | 100 |
| Target_Spot | 95 | 99 | 97 | 100 |
| Yellow_Leaf_Curl Virus | 98 | 97 | 97 | 100 |
| Mosaic_Virus | 100 | 100 | 100 | 100 |
| Healthy | 95 | 98 | 97 | 100 |
| Accuracy | ||||
| DenseNet121_Macro Avg | 98 | 1000 | ||
| DenseNet121_Weighted Avg | 98 | 98 | 98 | 1000 |
| Bacterial_Spot | 98 | 98 | 98 | 1000 |
Table 8.
Summarized results of proposed deep learning in training and testing phases.
| Performance of Model Using 90% Training and 10% Testing of Dataset | |||||
|---|---|---|---|---|---|
| Model Name | Training Accuracy% | Test Accuracy% | Recall% | Precision% | F1 Score% |
| DenseNet121 | 99.88 | 99 | 99 | 99 | 98.99 |
| ResNet50V2 | 99.49 | 95.60 | 95.60 | 95.8 | 95.59 |
| ViT | 98 | 98 | 98 | 98 | 97 |
| Performance of Model Using 80% Training and 20% Testing of Dataset | |||||
| Model Name | Training Accuracy% | Test Accuracy% | Recall% | Precision% | F1 Score% |
| DenseNet121 | 99.99 | 98.45 | 98.45 | 94.32 | 98.45 |
| ResNet50V2 | 99.99 | 94.43 | 94.31 | 98.46 | 94.31 |
| ViT | 99.27 | 94.90 | 94.90 | 94.97 | 94.89 |
Table 9.
Comparison of results of DenseNet121 against different CNN models.
| References | Model | Dataset | Accuracy% |
|---|---|---|---|
| Ref. [62] | Inception-v3 | Same dataset | 96.60 |
| Ref. [63] | ResNet-50 | 98.77 | |
| Ref. [64] | MobileNet | 88.4 | |
| Ref. [65] | VGG16 | 93.5 | |
| Ref. [66] | CNN | 98.2 | |
| Ref. [67] | ResNet50 + SeNet | 96.81 | |
| Propose system | Proposed DenseNet121 model | 99.64 |
Disclaimer/Publisher’s Note: The statements, opinions and data contained in all publications are solely those of the individual author(s) and contributor(s) and not of MDPI and/or the editor(s). MDPI and/or the editor(s) disclaim responsibility for any injury to people or property resulting from any ideas, methods, instructions or products referred to in the content. |
© 2023 by the authors. Licensee MDPI, Basel, Switzerland. This article is an open access article distributed under the terms and conditions of the Creative Commons Attribution (CC BY) license (https://creativecommons.org/licenses/by/4.0/).
Share and Cite
MDPI and ACS Style
Alzahrani, M.S.; Alsaade, F.W. Transform and Deep Learning Algorithms for the Early Detection and Recognition of Tomato Leaf Disease. Agronomy 2023, 13, 1184. https://doi.org/10.3390/agronomy13051184
AMA Style
Alzahrani MS, Alsaade FW. Transform and Deep Learning Algorithms for the Early Detection and Recognition of Tomato Leaf Disease. Agronomy. 2023; 13(5):1184. https://doi.org/10.3390/agronomy13051184
Chicago/Turabian StyleAlzahrani, Mohammed Saeed, and Fawaz Waselallah Alsaade. 2023. "Transform and Deep Learning Algorithms for the Early Detection and Recognition of Tomato Leaf Disease" Agronomy 13, no. 5: 1184. https://doi.org/10.3390/agronomy13051184
Note that from the first issue of 2016, this journal uses article numbers instead of page numbers. See further details here.