
Deciphering Chitosan–Host Plant Interaction in Esca Disease

1
Centro de Investigaciones Científicas y Tecnológicas de Extremadura (CICYTEX), Plant Protection Area, Instituto de Investigaciones Agrarias Finca La Orden-Valdesequera, Autovía A-5, Km 372, 06187 Guadajira, Spain
2
Bodega Huerto de la Condesa, C/ Genal 1, 29400 Ronda, Spain
3
Research Unit Induce Resistance and Plant Bioprotection (RIBP), USC INRAE 1488, University of Reims Champagne-Ardenne, 51687 Reims, France
*
Author to whom correspondence should be addressed.
Agronomy 2023, 13(5), 1290; https://doi.org/10.3390/agronomy13051290
Submission received: 24 March 2023
/
Revised: 25 April 2023
/
Accepted: 28 April 2023
/
Published: 30 April 2023
(This article belongs to the Special Issue Research on Fungal and Oomycete Crop Diseases)
Abstract
:The production of wine and table grapes is hampered by Phaeomoniella chlamydospora, a fungus related to Petri diseases and Esca, two of the major grapevine trunk diseases causing the death of vines all over the world. This study analyses the effect of a commercial-based substance (chitosan hydrochloride 2.5%) on grapevine–P. chlamydospore interaction. Two experimental scenarios were evaluated: (i) root application in a greenhouse-plant model system and (ii) foliar application in an open-field environment (Tempranillo grape cultivar). Vascular necrosis and pathogen recovery were reduced after chitosan application. The treatment increased root development and the flavonoid index. On open-field application, the treatment did not significantly help decrease the expression of the foliar symptoms of Esca. In symptomatic leaves, the results revealed a lower overexpression of defence-related genes (Chit 1b, CHV5, STS and PR6) in plants treated with chitosan than in nontreated vines. Altogether, this study attempts to provide a first insight into the potential role of chitosan hydrochloride in the treatment of P. chlamydospora and the interaction on the control of the Esca–pathosystem complex. Differences were found between the root and foliar spraying modes of action.
1. Introduction
Esca is a complex fungal disease within the group of grapevine trunk diseases (GTDs). GTDs are considered to be the most destructive grapevine diseases worldwide and are currently the major threat to grape production and crop sustainability [1,2]. The annual economic cost of grapevine (Vitis vinifera) replacement due to GTDs is in excess of EUR 1.132 billion [3]. Many fungal species are involved in the cause of GTDs. Among them, Phaeomoniella chlamydospora has been described as responsible for Esca and Petri diseases [2]. The wood experiences gradual degradation (from black spots—Petri disease—to white rot—in Esca Proper) and loss of functionality. The canopy can reveal two forms of external Esca symptoms: the chronic form and apoplexy [2,4]. Both are especially visible at the veraison stage. With the chronic form, leaves show interveinal necrosis that follows a pattern known as “tiger stripes”, which is not constant from year to year in a vine. Apoplexy results in the death of the entire plant within a few days. Sodium arsenite (highly toxic and carcinogenic) was used for Esca control until 2003 when it was banned in Europe. Today no alternative is known to be as effective as sodium arsenite, and there are no cultivars that are resistant to GTDs.
Chitosan is a linear polysaccharide, composed of randomly distributed chains of D-glucosamine, linked by ß-(1-4) bonds and N-acetyl-D-glucosamine (acetylated unit). It is obtained from the deacetylation of chitin, which is a component of the exoskeletons of crustaceans, insects, molluscs (endoskeleton of cephalopods), fungi, and algae [5]. Currently, commercial chitosan is mainly obtained from waste derived from marine sources or byproducts of the seafood industry, such as shrimps and crab shells from crustacean-processing industries. More than 10,000 tons of chitosan are estimated to be available every year from shellfish waste [5,6].
For the last few decades, various favourable properties have been discovered and attributed to chitosan such as bactericide and fungicide activity [7]. In the agricultural industry, chitosan has been used to control postharvest [8] and preharvest plant diseases, including some grapevine fungal diseases, such as downy mildew [9,10]; grey mould [6,10,11] and powdery mildew [12]. In plants, chitosan has eliciting activities such as defence induction, elicitation of antioxidant response or natural rhizobacteria growth promotion, accumulation of phytoalexins, and pathogen-related proteins [13,14,15,16]. On 7th of May 2016, the application of chitosan hydrochloride was approved by the EU (Commission Implementing EU Regulation No. Report: 563/2014) in accordance with EU (Regulation No. 1107/2009) as a “Basic substance (BSs) stimulating natural defence mechanisms” in berries and other crops, being suitable for use in organic farming [17,18]. In 2022, chitosan was approved as a BS against Plasmopara viticola [9].
Altogether, chitosan is a natural nontoxic, biodegradable, and environmentally friendly basic substance which is becoming more and more important as a bio-product in agriculture. It is considered to be an excellent biomaterial for the development of future grapevine protection strategies [13] and to improve wine quality [17]. The antimicrobial properties of chitosan are well-known, and such properties seem to be highly influenced by molecular weight (MW), the degree of acetylation (DA), and the preparation and derivatisation methods used [7,11,14,15]. The degree of deacetylation can be measured by established methods and ranges from 60% to 100% in commercial preparations. In addition to this, chitosan is insoluble in water (EFSA/EC) and needs to be dissolved in acid [11], which makes it difficult to apply in open-field environments.
In the same way, regarding GTDs, only a few studies have been carried out to ascertain the effects of chitosan on Esca disease, and most of them are focused on the research into in vitro fungicidal activity and an in-plant model system. Chitosan oligosaccharin 0.5% a.i. (Grofar Agro) (MW ≤3 kDa and pH 4–5) was found to be effective at an EC50 lower than 1.5 mg a.i./l against P. chlamydospora but >1.50 mg a.i./l for the pathogens Fomitiporia sp., Botryosphaeria sp., Eutypa lata, Phomopsis sp., and Neonectria macrodidyma [5]. Cobos and colleagues [19] studied the efficacy of high, medium, and low MW (chitosan (Sigma-Aldrich, St. Louis, MO, USA) and chitosan oligosaccharide (MW, <3000) (Nicechem Co., Ltd., Shangai, China) dissolving in hot (50 °C) MilliQ. They reported 100% mycelial growth inhibition for P. hlamydospore, Phaeoacremonium minimum, B. dothidea, Diplodia seriata, Eutypa lata, Phomopsis viticola, and Ilyonectria macrodidyma [19] and demonstrated the efficacy of chitosan oligosaccharide as a pruning wound protectant (25 mg/L). More recently, similar EC50 value ranges have been reported for chitosan oligomers (COS) against three fungal species belonging to the Botryosphaeriaceae family (Neofusicoccum parvum, D. seriata, and B. dothidea [20]. The results were improved by (COS)–amino acid (cysteine and tyrosine) conjugate complexes. Despite these promising results, there are no reports in established vineyards to ascertain the suppression of Esca symptoms by chitosan [2,20] and the host–plant interaction in the complexity of the Esca pathosystem.
This study evaluates the effectiveness of root and foliar application of chitosan hydrochloride with the purpose of controlling GTDs caused by P. chlamydospora, such as Esca and Petri diseases. Additionally, the impact of chitosan on vegetative growth, flavonoid and chlorophyll content, as well as physiological activity, productivity, and gene expression are also assessed.
2. Materials and Methods
2.1. In Vitro Antifungal Testing
2.1.1. Chitosan
The chitosan-based product that is the object of this study is Azamin Yescolp® (Pheromon). It is a biostimulant of organic origin with chitosan hydrochloride 2.5% (w/w) plus organic carbon, without synthetic chemical additives. Chitosan hydrochloride (CAS No. 9012-76-3), which is subject to the current application, was included as a basic substance by Reg. (EC) No. 1107/2009 in 2014, while chitosan has only recently been included (2022) [18]. Chitosan hydrochloride is produced by the deacetylation of chitin (crustacean cells) and salinisation using hydrochloric acid to result in the form of hydrochloride to enhance its solubility in water. The molecular weight, in this form, ranges from 47,000 to 65,000 Da (SANCO/12388/2013-rev.3, 25 January 2021) [18]. Even though it was requested, the exact MW and DA of chitosan in Azamin Yescolp® were not provided by the supplier. Only uses as basic substances that act as elicitors of the crop’s self-defence mechanisms are approved. Its function in plant protection is as an elicitor, having a fungicide and bactericide effect through the stimulation of natural defence mechanisms [18].
2.1.2. Fungal Species/Strains
The GTD-related and phytopathogenic fungi used were P. chlamydospora BV-287, Pm. minimum BV-50, N. parvum BV-56, and E. lata BV-57. All of them were isolated from symptomatic vines and subsequently accurately identified based on their morphological characteristics and a number of molecular analyses previously described in detail [21,22]. Total genomic DNA was isolated and amplified from fresh mycelium using the REDExtract-N-Amp Kit (XNAP) (Sigma, St. Louis, MO, USA), following the manufacturer’s instructions. PCR amplifications were performed using a T100™ thermal cycler (BioRad Laboratories, Inc. Hercules, CA, USA) and primer sets were supplied by Metabion International AG (Planegg, Germany).
The BV-287 strain of P. chlamydospora was found to be virulent in a previous test carried out in CICYTEX, where ten different isolates were compared. For that reason, P. chlamydospora BV-287 was selected to infect cuttings of cv. Tempranillo in the greenhouse experiments.
2.1.3. Inhibition of the Mycelial Growth
In vitro, antifungal tests were performed on a 90-mm Petri plate amended with malt extract medium (MEA, Condalab, Madrid, Spain). In order to avoid bacteria proliferation, 0.25 mg/mL of chloramphenicol were added. The efficacy of five different concentrations of the chitosan product were evaluated, i.e., 0% (control), 1%, 2.5%, 5% and 10% (v/v concentrations). When the medium solidified, a 4 mm square of fresh mycelium (7-day-old) was placed in the centre of each plate. On successive days, the radial growth of the fungus was measured using two orthogonal axes. Plates were incubated in dark conditions at 25 °C. At the end of the experiment (maximum 21 days) the inhibition of mycelial radial growth (IMRG) was calculated following the formula (1). There were three plates (replicates) per experiment. The experiment was repeated three times.
2.2. Greenhouse Plant Model System
2.2.1. Experimental Design: Chitosan Treatment and Infection
The study was carried out on rooted vine cuttings (cv. Tempranillo). Thirty-six cuttings were placed in independent 2.8 L pots with an optimal mixture of vermiculite and organic substrate. There were four treatments: T1: control plants which were untreated and uninfected; T2: plants treated with chitosan but not infected; T3: infected and untreated plants; and T4: plants infected and treated with chitosan. The chitosan product (Azamin Yescolp®, Pheromon) was applied in T2 and T4 according to the supplier’s recommendations. A dilution of 2.5 mL in 10 mL of H2O was added to each plant directly on the substrate of the pot. Two treatments were carried out: the first one, at the beginning of the cycle (sprouted plants) and the second one, 15 days after inoculation and one month after the first treatment. Inoculation was performed between the two upper internodes. Infected plants (T3 and T4) were inoculated with the pathogenic fungus P. chlamydospora 15 days after the first treatment. A conidial suspension was incubated using MEA in dark conditions at 25 °C for 14 days before inoculation. Afterwards, fresh P. chlamydospora mycelium plugs were inserted in a hole made with a 5 mm cork borer between the two upper internodes. For the uninfected treatments (T1 and T2), sterile MEA plugs were used. After infection, each wound was covered with moist cotton and sealed with a strip of Parafilm. Nine plants per treatment were used. Plants were arranged in a completely randomised design. The maintained greenhouse conditions were 25 °C during the day/15 °C at night, with natural light, for three months. Plants were irrigated three times per week with water supplemented with Hoagland’s nutrient solution [23]. The experiment was performed twice.
2.2.2. Vegetative Response
On the leaves, the content of chlorophyll and flavonoid was measured using a Dualex® leaf clip sensor. Five record points were taken on the adaxial side of each leaf. Measures were performed on two leaves per plant. There were three grapevines per treatment/date (n = 30). Measurements were performed at intervals of 48 h, 7 days, and 15 days post-treatment or postinfection.
The effect of the chitosan and fungal infection on the vegetative development of the grapevine was determined. Three months after inoculation, at the end of the vegetative cycle, the plants were uprooted. Aerial fresh weight (g) (leaves plus stem); the weight of the fresh roots (g); and the length to the 7th internode (cm) were measured.
2.2.3. Fungal Infection
In order to test the effect of the chitosan treatment on the infection capacity of P. chlamydospora, the wood of the rooted plant was analysed when the plants were collected (after 3 months). On the one hand, the length of vascular necrosis was measured (cm). On the other hand, the severity was calculated based on the recovery rates of P. chlamydospora. In total, 18 wood chips (3 mm × 3 mm × 3 mm per plant were placed on three MEA plates. Severity was calculated as the percentage of chips from which the pathogen was obtained out of the total number. Plates were incubated at 25 °C in dark conditions. Two weeks later, cultures were identified as P. chlamydospora based on both colony morphology and molecular analysis by species-specific PCR amplification using the conditions and primers Pch1 and Pch2 described by Tegli et al. [24] following the conditions described above [22].
2.3. Field Trial
2.3.1. Vineyard Plot
Two treatments were compared in an open-field environment: control (not treated) and chitosan. The field application was conducted on Vitis vinifera L. cv. Tempranillo grafted onto 110-Richter rootstock and was 20 years old when experimentation started. The vineyard was managed under a goblet training system and drought with a vine spacing of 2.2 m × 1.0 m. It was located in the Extremadura region (Spain). The area under study has a warm climate with dry and hot summers, classified as Csa according to the Köppen–Geiger climate classification [25].
2.3.2. Chitosan Treatment and Experimental Design
Each experimental plot consisted of 120 grapevines distributed in three rows with 40 vines per row and the experimental design was a randomised block with four replicates per treatment. Chitosan hydrochloride was applied twice a year: first, after pruning (end of February–early March) and second, after green pruning (end of May–early June), for two consecutive years. The applied doses were 1500 cm3/Ha. The volume prepared per treatment (480 vines) was 30 L. It was applied with a treatment backpack to ensure that the aerial part of the plant was completely wet.
2.3.3. Esca Disease and Productivity
Esca symptoms were monitored at BBCH 83 (berries developing colour) [26] for four years. One year prior to treatment (year 1), two years applying chitosan hydrochloride (year 2 and year 3) and one year after treatment (year 4). In the first year, the wood samples from the Esca symptomatic vines (n = 14) were taken and the pathogens P. chlamydospora, Fomitiporia mediterranea, Phaeoacremonium spp., and Botryosphaeriaceae (D. seriata, Dothiorella viticola, and N. parvum), were isolated and identified with a relative frequency of 18.8%, 13.3%, 17.7%, and 15.5%, respectively [22].
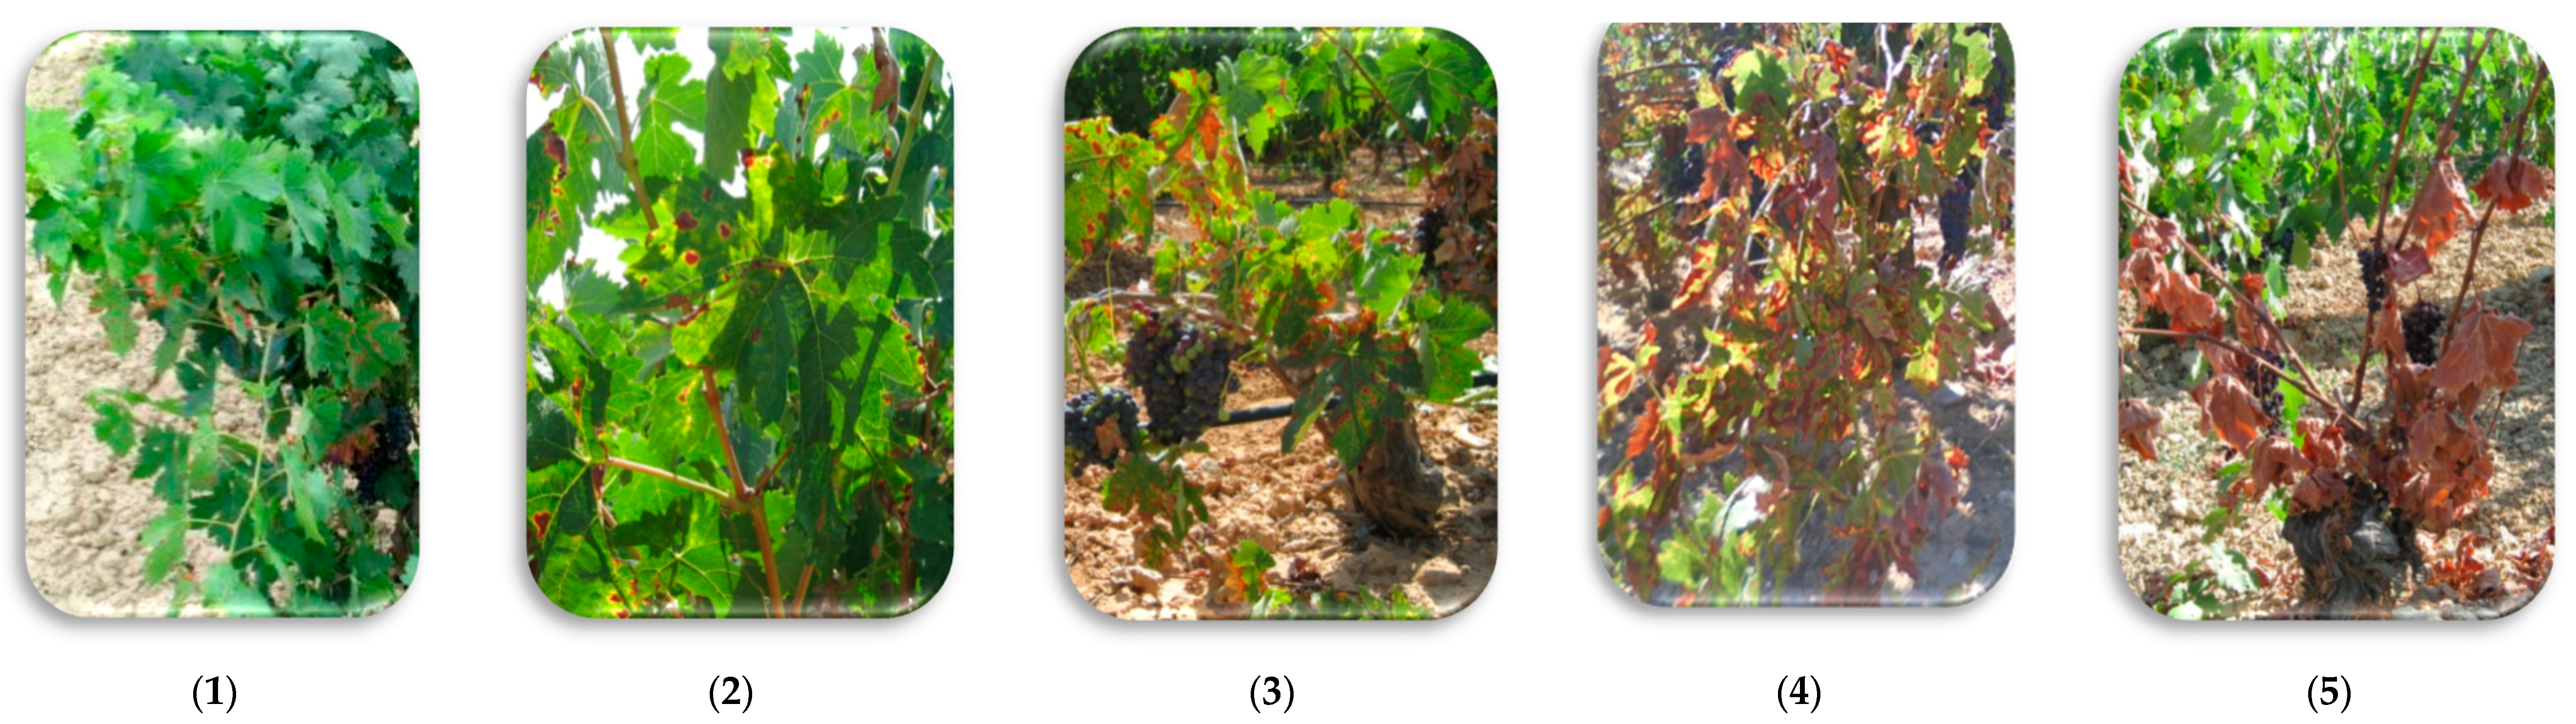
Every year, the incidence of Esca was calculated as a percentage of the number of grapevines showing the typical tiger stripes over the total (n = 120 per block). The McKinney’s index [27], which expresses the percentage of the maximum severity of disease with the formula MI = [Σ (R × N)] × 100/H × T, where R = disease rating, N = number of plants with this rating, H = the highest rating, and T = total number of plants counted (120), was applied to calculate the Esca severity. The disease rate R was collected on the field using a numerical scale where 0 = complete green canopy and 5 = full Esca symptoms according to Figure 1.
At harvest time, plant productivity (kg/vine; number of bunches/vine; and weight of bunches) were determined over 5 grapevines per block (n = 20) for each treatment (control and chitosan). In order to determine vine vigour, the pruning weight was removed (kg) and the Ravaz Index (the ratio of fruit yield to pruning weight removed) was used. Productivity was determined in two consecutive years after chitosan application (in year 2 and year 3).
2.3.4. Effect of Chitosan on Gas Exchange
The effect of chitosan on the physiological activity was followed up at the time of Esca symptoms expression in the same two consecutive years after chitosan application. Measurements of gas exchange were performed on Esca asymptomatic (As) and symptomatic (Sy) (showing leaf-stripe scale number 3) leaves. In order to better understand the effect of chitosan on plant physiology, four conditions according to the types of leaves were evaluated separately: (i) Control-As i.e., green leaves, (ii) Control-Sy, (iii) Chitosan-As, and (iv) Chitosan-Sy. Gas exchange was characterised by the simultaneous determination of transpiration rates (E; mmol/m2/s), net leaf photosynthesis (AN; µmol/m2/s), and stomatal conductance (gs; mol/m2/s) using a portable infrared-gas analysis system (IRGA) (LCI Portable Photosynthesis System, ADC BioScientific Ltd., Hoddesdon, England). The intrinsic water-use efficiency (WUEi) was determined by the ratio of AN/gs that provides the cost of water for CO2 assimilation [28]. Gas exchange measurements were taken in two sun-exposed adult leaves located in the middle part of the cane and performed from 9.00 to 11.00 a.m., just before the midday depression [21]. There were four grapevines per condition/treatment/date (n = 8).
2.3.5. Effect of Chitosan on Gene Expression
In year 2, after the two first applications, the same leaves which were measured nondestructively in the field with the IRGA, were then collected and immediately frozen in liquid nitrogen to study the gene expression. Leaves were stored at −80 °C until total RNA extraction. RNA was isolated from 50 mg of ground powder obtained from two leaves per plant. There were four biological replicates (grapevines) per treatment. RNA extraction was made using a plant RNA Purification Reagent Kit (Invitrogen, Cergy Pontoise, France), resuspended in 20 µL of RNase-free water, and treated with RQ1 DNase enzyme (Promega, Madison, WL, USA). Subsequently, the RNA was quantified by measuring the absorbance at 260 nm. A Verso cDNA synthesis kit (Thermo Fisher Scientific, Surrey, UK) was used for the reverse transcription of 150 ng of total RNA. The expression of a total of ten genes was determined by qRT-PCR using the primers indicated in Table 1.
Quantitative reverse transcription–PCR (qRT-PCR) was performed using a CFX96 system thermocycler (BioRad). PCR reactions were carried out in duplicates in 96-well plates in a 15 μL final volume containing Absolute Blue SYBR Green ROX mix (including Taq polymerase, dNTPs, and SYBR Green dye), DNase/RNase free milliQ water, 300 nM forward and reverse primers, and 10-fold diluted cDNA. Cycling parameters were 3 min of Taq polymerase activation at 95 °C, followed by 40 cycles composed of 5 s of denaturation at 95 °C and 30 s of annealing and elongation at 60 °C. Following the final cycle of the PCR, the specificity of each amplification was checked using a heat dissociation curve from 65 to 95 °C. Melting peaks were visualised to check the specificity of each amplification. For each experiment, PCR reactions were performed in duplicate and two independent experiments were analysed. The relative levels of gene expression were determined, following the methods of Hellemans et al. (2007), with the EF1-α and 60SRP genes as internal reference genes [29]. The results represent the relative expression of genes in leaves from the Chitosan-Sy plants, Chitosan-As plants, and Control-Sy plants versus leaves collected from the Control-As plants (considered as control). Gene expression was considered as significantly up- or downregulated, relative to the 1×controls, when changes in relative expression were >2× or <0.5×, respectively.
2.4. Statistical Analyses
Levene’s test for homogeneity of variance was applied to all data before the analysis of variance. Data from the four treatments compared under the greenhouse plant model were analysed by means of a one-way ANOVA analysis. A comparison of the two treatments was made using the nonparametric Mann–Whitney–Wilcoxon test. In the open-field scenario, the effects of the chitosan treatment, the year, and their interactions on Esca disease, physiology, and productivity were tested by means of a two-way ANOVA test. The LSD (least-significance difference) procedure was used for discriminating among the means of the variables. Differences at p < 0.05 were considered significant (p < 0.01 for gene expression). The statistical procedure was performed with a StatGraphics Centurion XVI (Manugistics Inc., Rockville, MD, USA) piece of software.
3. Results
3.1. Inhibition of Mycelial Radial Growth
The results obtained from the in vitro test are summarised in Table 2. Total effectiveness was found for pathogen Pm. minimum. P. chlamydospora was completely inhibited at 2.5% (v/v). Much more inconstant results were found for the pathogens N. parvum and E. lata. The effect was fungicide for Pm. minimum and P. chlamydospora, but fungistatic for E. lata and N. parvum.
3.2. Plant Model Results: Effect of Chitosan Application on the Roots
3.2.1. Vegetative Response to Chitosan Treatment
No differences were found between the data of the two repetitions (p > 0.05), so the data were combined for statistical analysis. After the first application of chitosan, the flavonoid index was significantly higher in the leaves of treated plants compared to the untreated control plants (Table 3).
The chlorophyll index was significantly higher in the leaves of treated plants compared to the untreated control plants at 48 hpt (hours post-treatment) and 7 dpt (days post-treatment), too. However, the treatment did not affect the chlorophyll content after 15 dpt (Table 4).
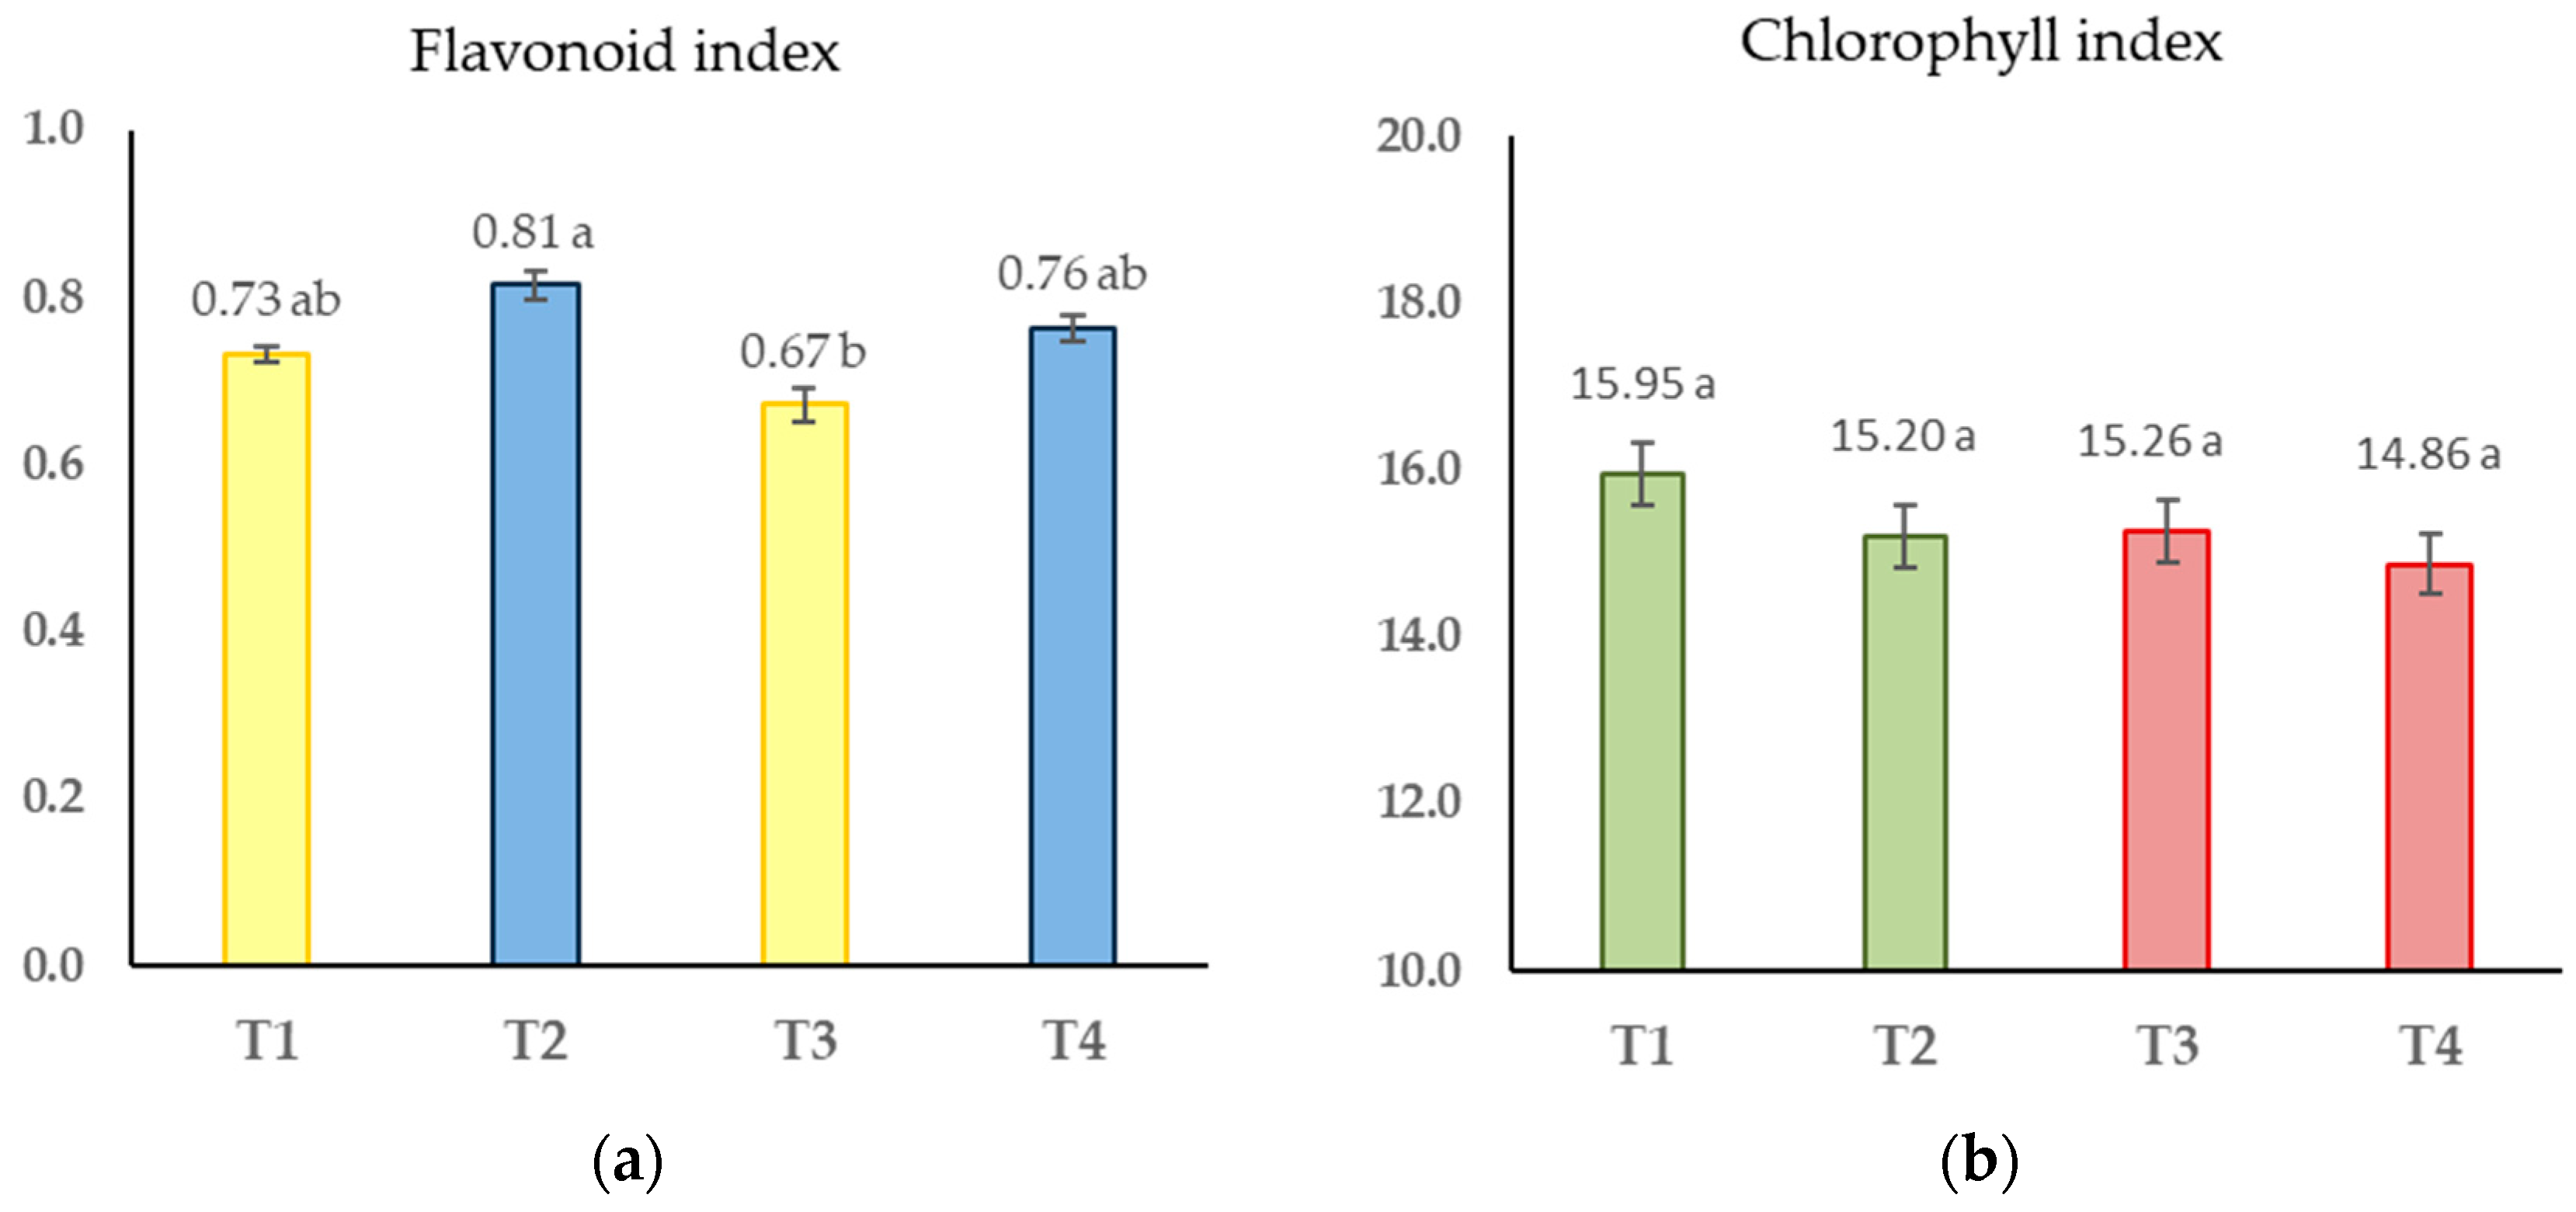
The results after infection were ummarized in Figure 2, representing the one-way ANOVA analysis of the mean flavonoid and chlorophyll indexes (calculated with data from 48 hpi, 7 dpi, and 15 dpi). The effect of chitosan increasing the flavonoid index was confirmed (Figure 2a). The statistical analysis did not show a significant effect of the wood infection with P. chlamydospora in the chlorophyll index (F = 1.43, p = 0.235) (Figure 2b).
For vegetative growth, the one-way ANOVA analysis indicated that treatment had an effect on the weight of roots (p = 0.001) (Table 5). The highest root weight was found in T2 plants (treated with chitosan but not infected) (147.78 ± 12.13). Intermediate values were obtained from the T4 (117.91 ± 9.50) and T1 (113.31 ± 6.81) treatments. Infected but untreated plants (T3) had a significantly lower root weight (78.40 ± 6.18) than the plants in the remaining treatments, also suggesting an effect of P. chlamydospora infection (Table 5). By contrast, the ANOVA test revealed no significant differences between the length and the aerial weight among treatments (p = 0.064 and p = 0.066, respectively).
3.2.2. Effect of Chitosan Treatment on Fungal Infection
Against P. chlamydospora, the chitosan treatment (T4) reduced fungal severity (percentage of recovery) and vascular necrosis. Differences were not statistically significant compared to the untreated infected control group (T3) (Table 5).
3.3. Results in an Open-Field Scenario
3.3.1. Effect of Chitosan on Leaf Esca Disease Expression
The two-way ANOVA analysis performed to identify Esca-symptom expression in an open-field environment did not show a significant effect of the chitosan treatment neither on the number of vines showing leave Esca symptoms (incidence) nor on the severity of the disease (Table 6). However, the year of monitorisation may have had a significant effect on the incidence (p = 0.025).
In general, the lowest values of Esca disease, both in terms of incidence and severity, were found in years 3 and 4 following the chitosan treatments (Table 6).
3.3.2. Effect of Chitosan on Productivity and Grapevine Physiology
In terms of productivity, the two-way ANOVA analysis indicates that there were no significant differences between the chitosan treatment and the year of application except for the number of bunches, which was higher after the first year of chitosan hydrochloride application (7.10 ± 0.17). The productivity results of the treated and control vines are shown by way of Supplementary Materials (Table S1).
The results of the two-way ANOVA test show that, in an open-field scenario, the year had a significant effect on all physiological parameters measured with the IRGA instrument: Net leaf photosynthesis (AN) (p = 0.0069), stomatal conductance (gs) (p = 0.0001), transpiration (E) (p = 0.0395), and WUEi (intrinsic water use efficiency) determined by the ratio of AN/gs (p = 0.001). The two-way ANOVA test did not show an interaction between factors (year × type of leaf) at any of the physiological parameters (p > 0.05).
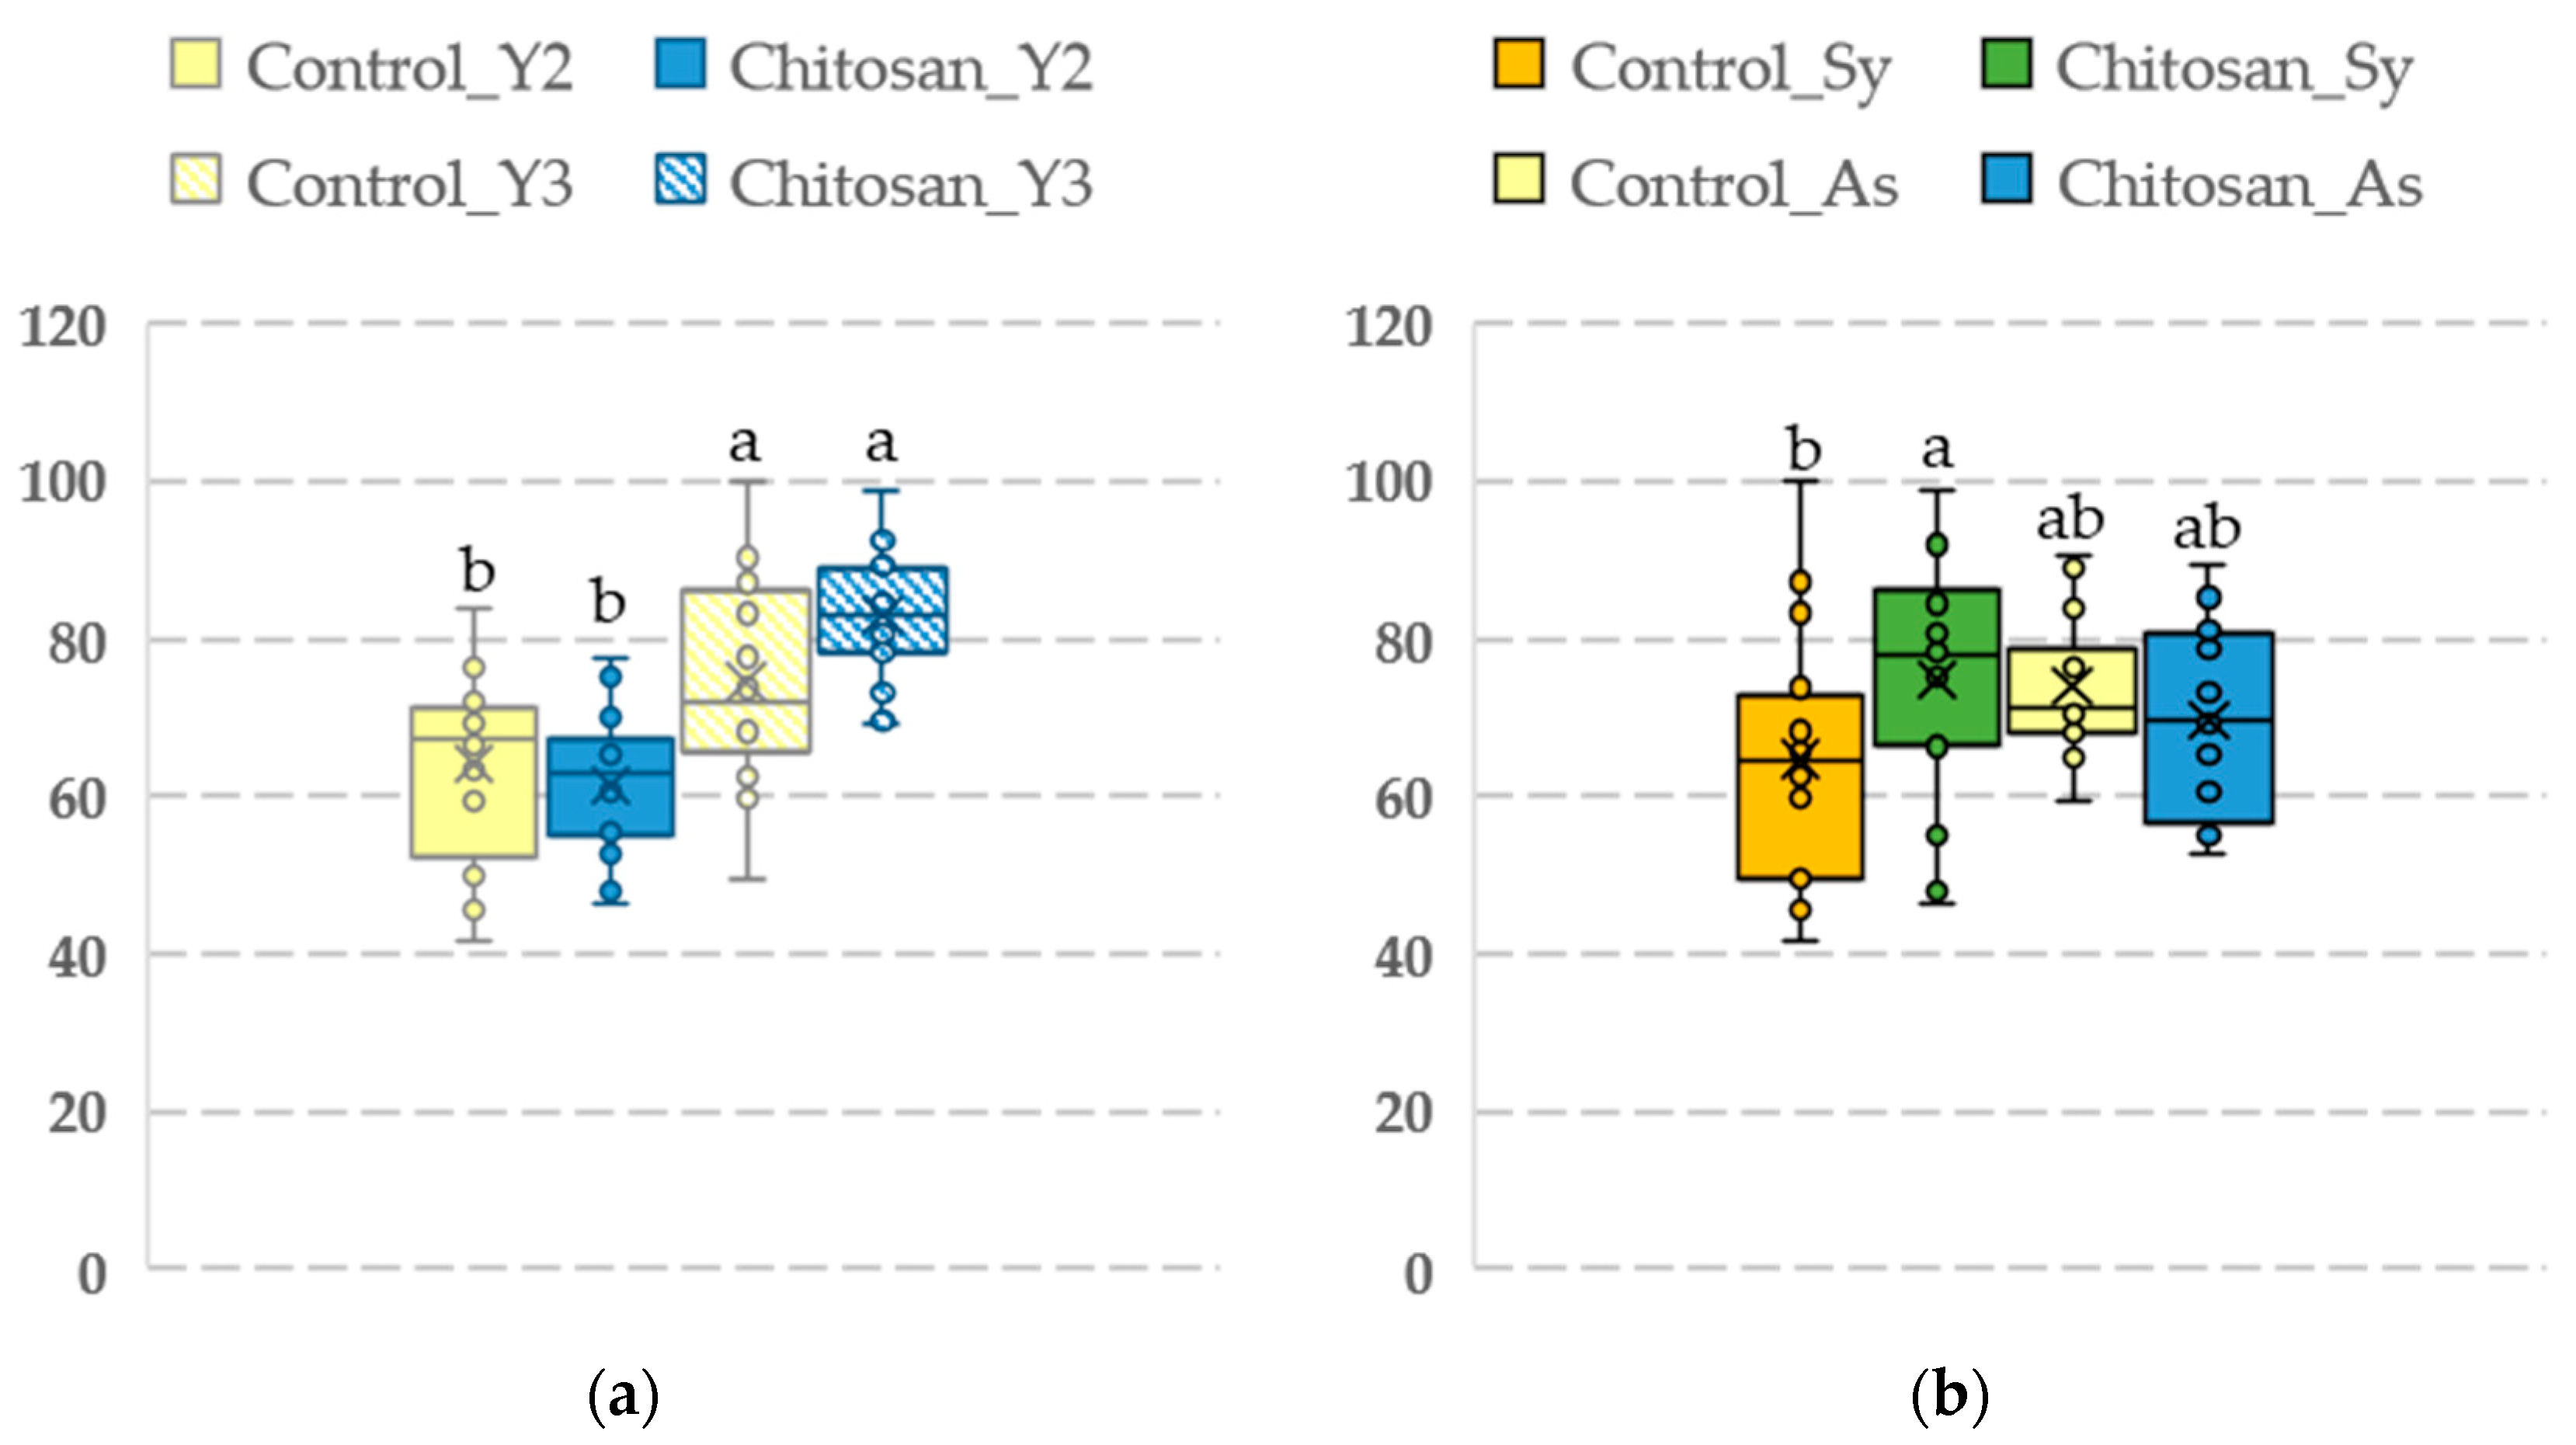
The type of leaf had a significant effect on WUEi (p = 0.0266), but not on the other parameters. WUEi values were significantly higher in year 3 (after two years of consecutive treatment with chitosan) (Figure 3a). Among Esca-symptomatic leaves, the mean WUEi was significantly higher in vines treated with chitosan (74.73 ± 3.89) than in the control vines (64.61 ± 4.04) (Figure 3b).
3.3.3. Effects of Chitosan on Gene Expression
An RT-qPCR was performed to further characterise the mechanisms affected in Esca asymptomatic and symptomatic vines when they are treated with chitosan and when they are not. Table 7 and Figure 4 show the results obtained. The treatment did not reveal any effects on the expression of five genes related to photosynthesis (RbcL and SBP), water stress (PIP2.2 gene), and those involved in the detoxification process (EpoxHF and SOD) since they were not considered to be significantly up- or downregulated in any case when compared to the control (Table 7).
Comparing asymptomatic vines, minor changes were identified in the expression of Chitosan_As leaves (2.0 < CHV5, STS and PR6 > 2.1), suggesting that foliar chitosan application had no effects in the open-field scenario (Figure 4 and Table 7).
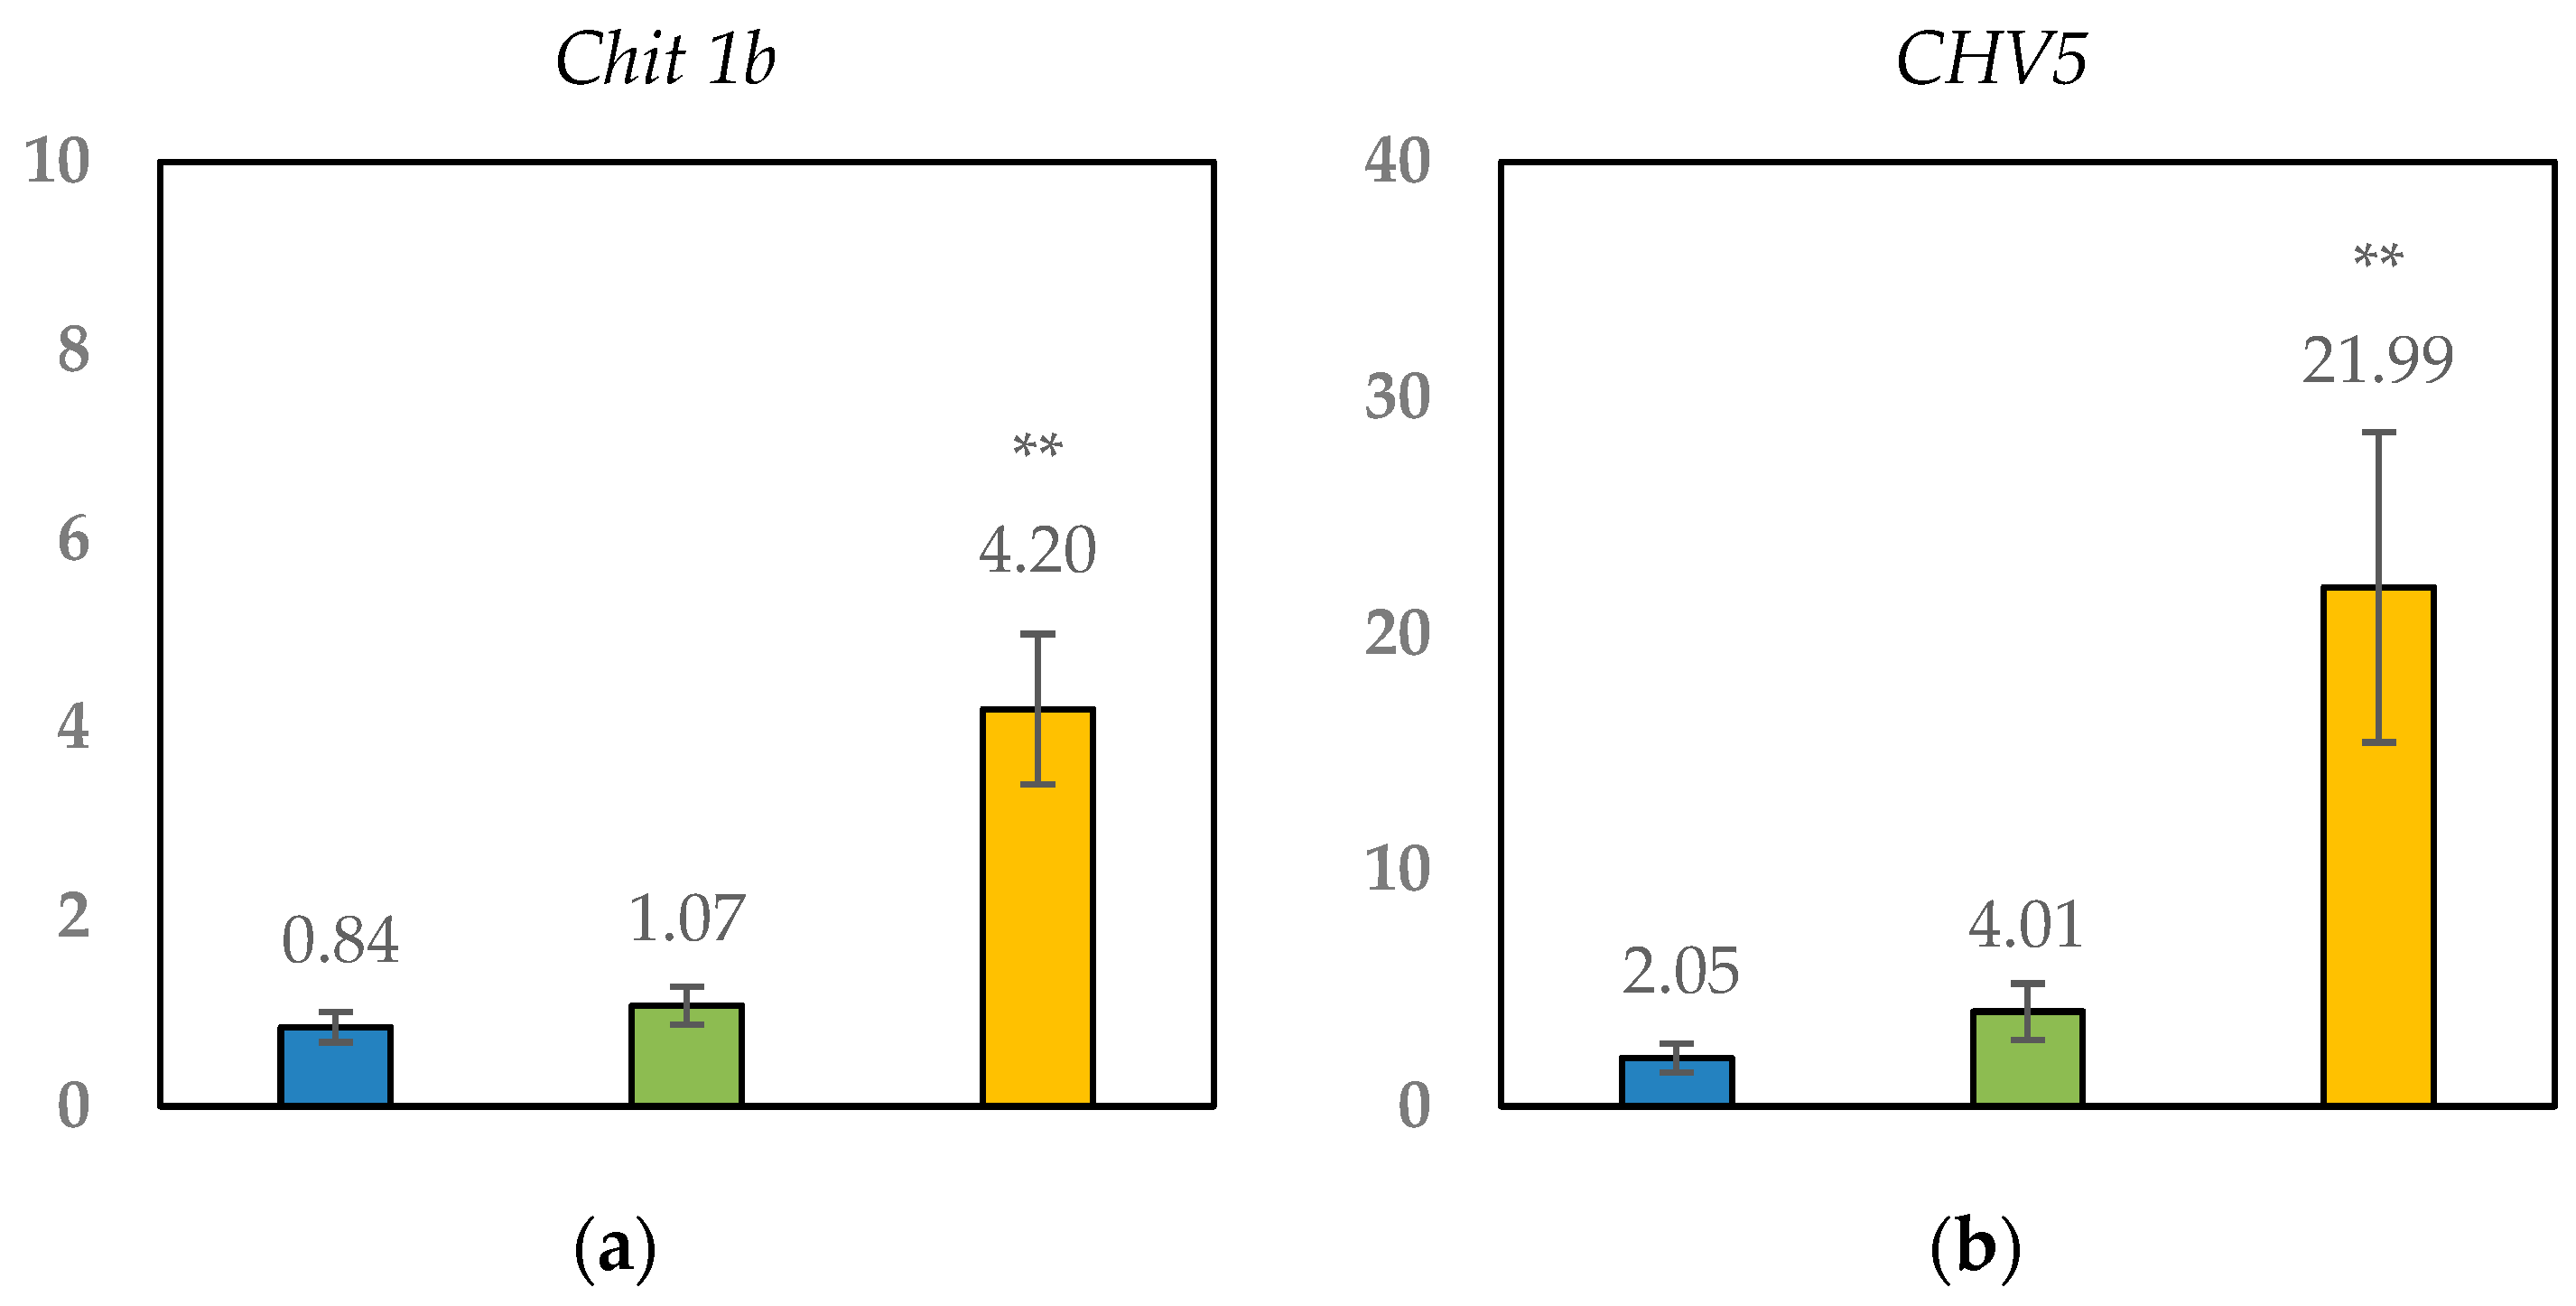
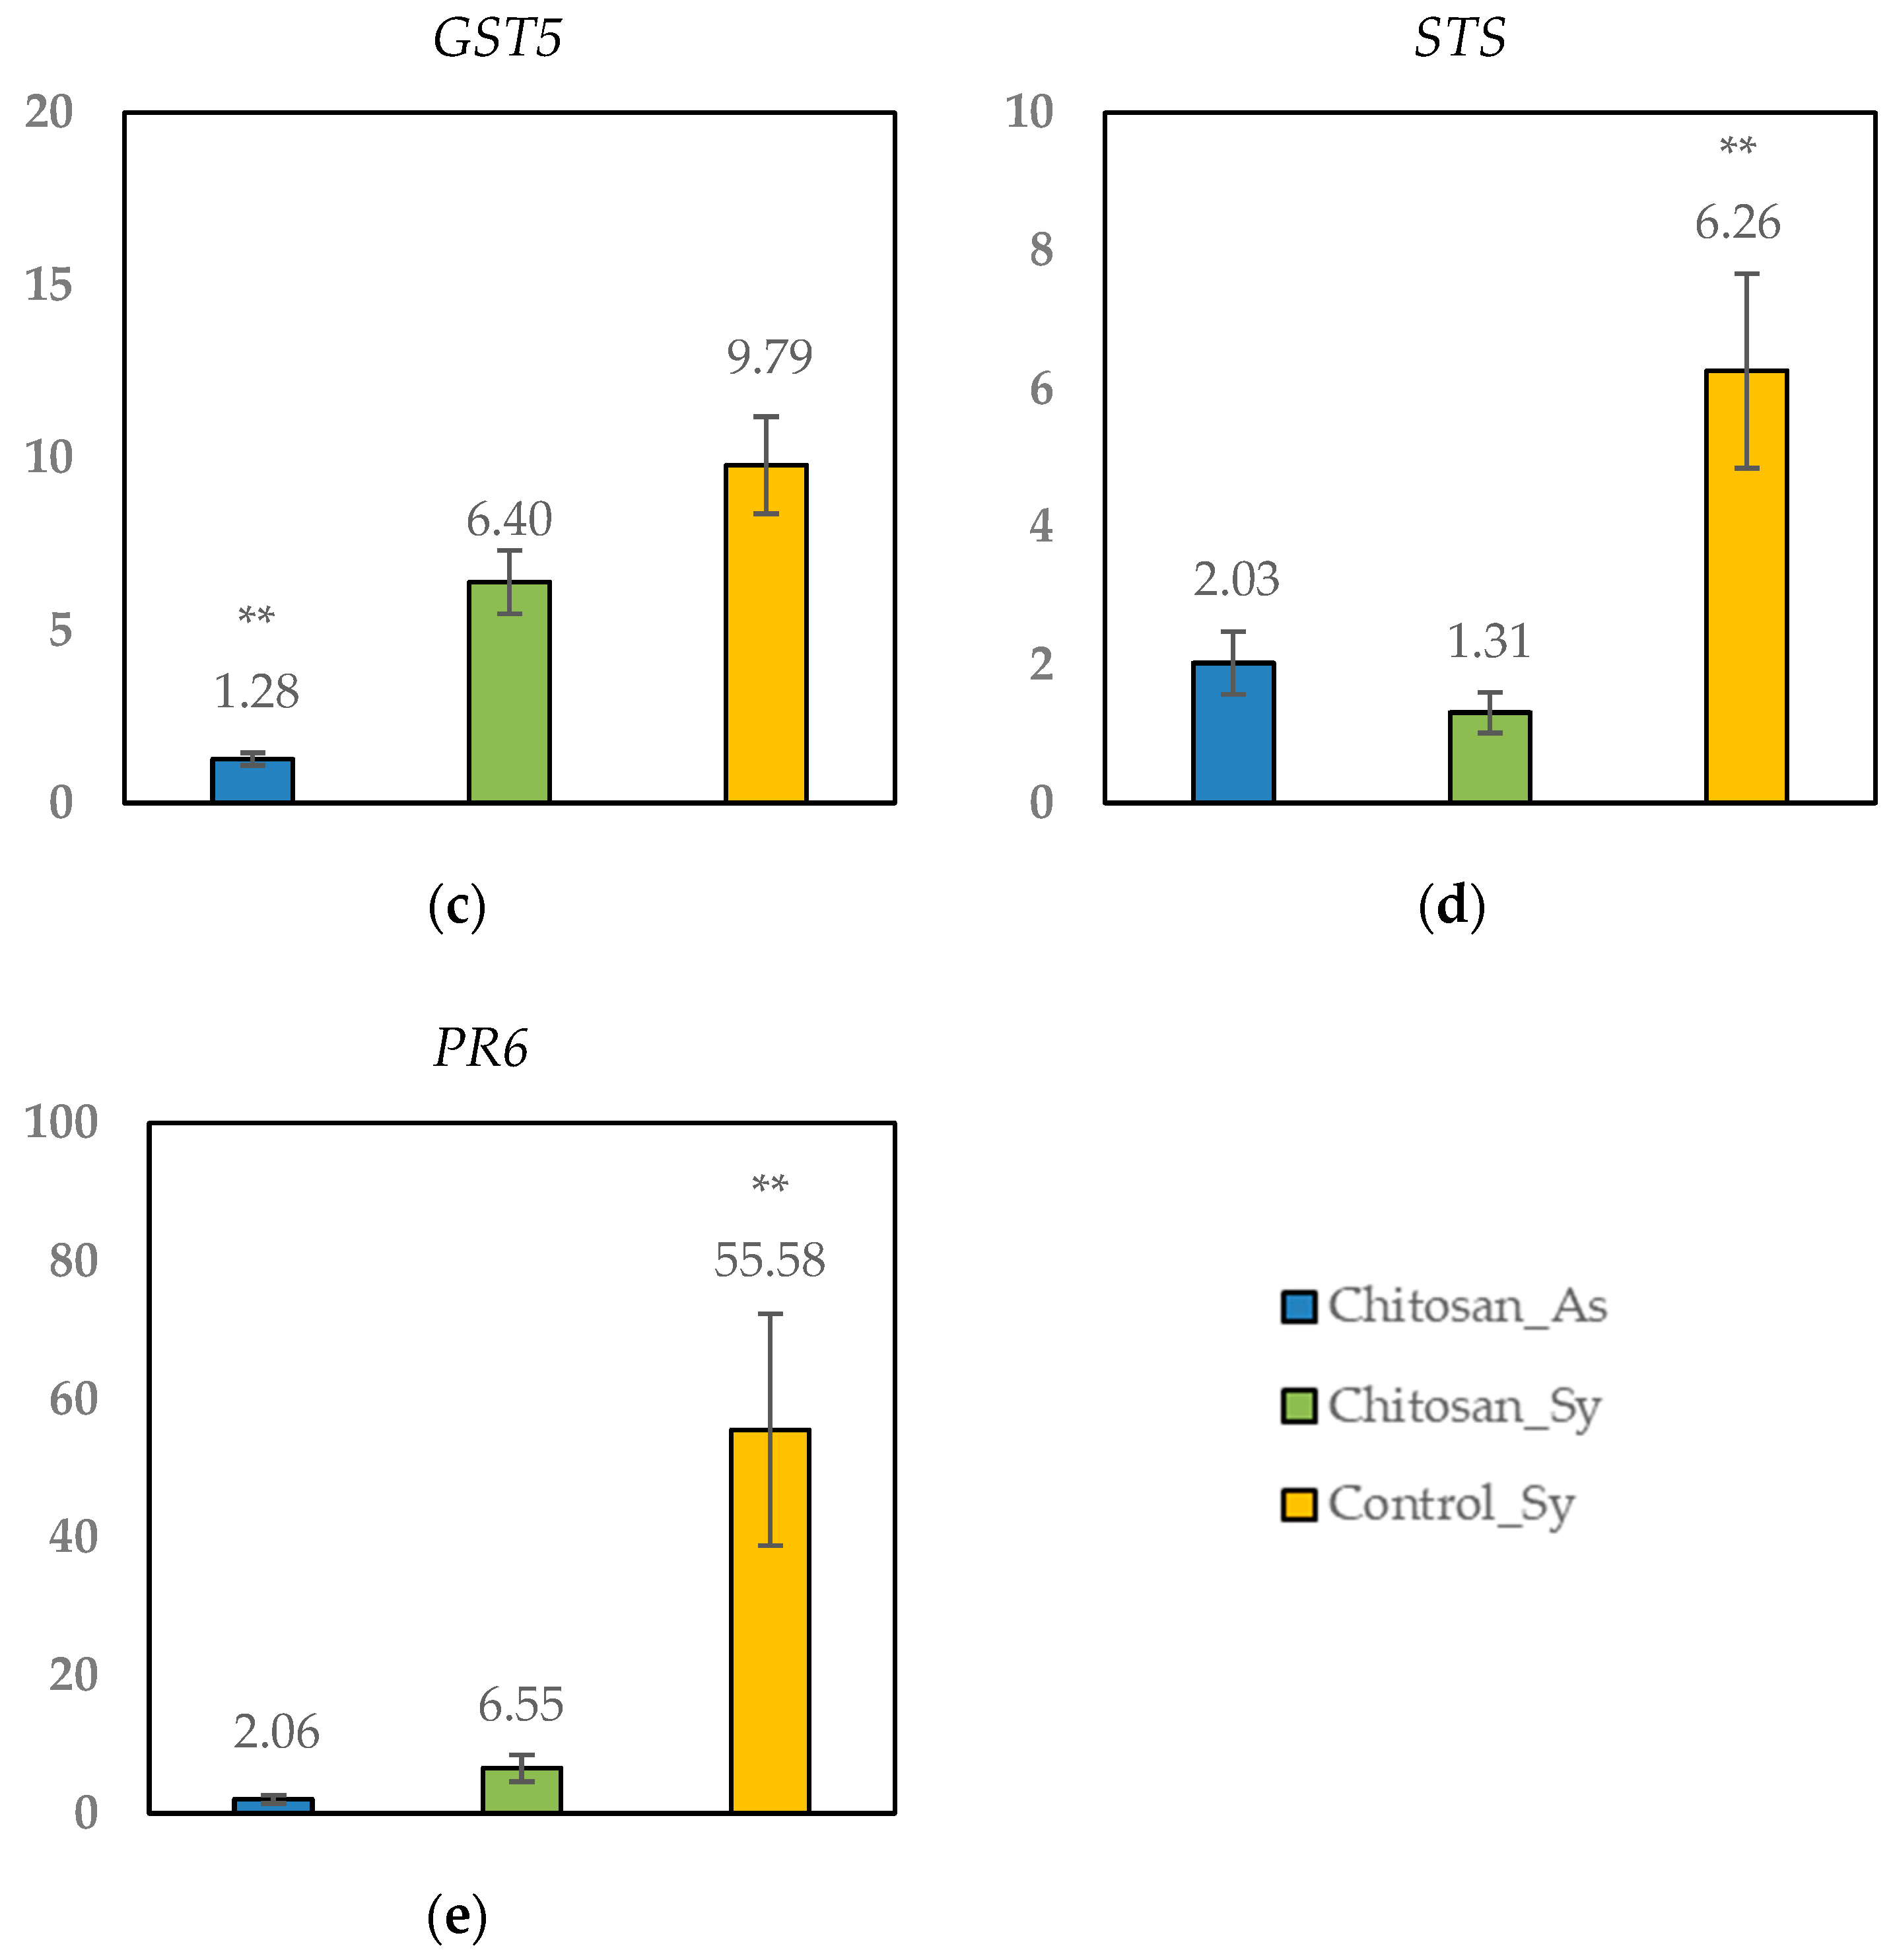
When focusing on plants with Esca disease, genes CHV5, GST5, and PR6 resulted in significant upregulation (relative expression > 4.0-fold) compared with the control group. No significant differences were found between the Chitosan_Sy and Control_Sy groups for gene GST5 (glutathione-S-transferase) related to stress tolerance (Figure 4c). Nevertheless, for CHV5 (Figure 4b) and PR6 (Figure 4e) genes encoding chitinases and pathogenesis-related proteins, respectively, the overexpression was significantly higher in the nontreated plants (Control_Sy) than in the Chitosan_Sy plants. These results suggested that chitosan may modulate the response of grapevines to Esca disease when following some of these pathways. In the same way, genes Chit1b (Figure 4a) and STS (Figure 4d) were only overexpressed in the nontreated plants (Control_Sy), while Chitosan_Sy reveals no change in comparison with the control group (relative expression < 2.0).
4. Discussion
Currently, GTDs, which are associated with a large range of nontaxonomically related fungi inhabiting wood, are a major challenge for grapevine sustainability all around the world. Many attempts to look for an efficient preventive and control management of GTDs have been made, including chemicals and biocontrol agents (BCAs) among others [2]. The development of resistance to chemicals such as carbendazim within the group of benzimidazols was demonstrated in some GTD pathogens [30]. No cultivar or species in the genus Vitis has been found to express complete resistance to GTDs; and the application of BCAs only provides a certain degree of protection [2,31]. In summary, there are currently no products with the same proven efficacy in reducing Esca foliar symptoms as sodium arsenite. In accordance with the implementation of integrated pest management (European Directive 2009/128/EC) and the green deal [32] programmes, there is an urgency for consideration of alternative plant-protection products (PPP) other than chemical pesticides. In this context, chitosan is considered a promising PPP in grapevine crops [13].
According to Younes and colleagues, the results provided in the literature are conflictive when considering the relationship between antimicrobial activity and chitosan characteristics. Antifungal activity depends on the specific type of fungus [7]. This is of particular interest for GTD management since several different fungal species are involved. Nascimento and colleagues first compared foliar sprays of chitosan oligosaccharin (<3 KDa) with chemicals. The results were similar to tebuconazole, cyprodinil + fludioxonil, and carbendazim + flusilazole for the pathogen N. liriodendri, though they were more promising for the reduction of the incidence of P. chlamydospora [5]. Fungal growth inhibition may not always be dependent on the MW (molecular weight) or the DA (degree of acetylation) of chitosan (as it is for bacteria) [7]; however, significantly higher effectiveness of chitosan oligosaccharide (100% of mycelial growth inhibition) than HMW, MMW, and LMW-chitosan against seven fungal pathogens causing GTDs has been reported [19]. This is the first research study to test a commercial formulation of chitosan hydrochloride (MW 47–65 KDa) that is approved (since 2014) as a basic substance being an elicitor of the crop’s self-defence mechanisms [18]. In our experimental project, the application of in vitro chitosan hydrochloride had fungicidal results and totally inhibited the growth of Pm. minimum at the lowest concentration (0.5% v/v) and of P. chlamydospora at a concentration of 2.5% (v/v) (that is 0.625 mg/mL). These values are below 1 mg/mL as reported for chitosan oligosaccharide [19]. However, for the pathogens N. parvum and E. lata, it was necessary to increase the concentration up to 10% (v/v) (that is 2.5 mg/mL) to obtain an inhibition percentage of 100% and 81%, respectively. Moreover, in the last two cases, the result was fungistatic. Regarding Botryosphaeriaceae species, EC90 values ranged from 448.5 to 1498.5 μg/mL, with the most effective formulation based on a chitosan oligomers–tyrosine conjugate being recently reported [20]. Pruning wounds have been described as a critical point to grapevine-wood infection by GTD pathogens [2,19,33]. In accordance with this, one practical application of these results is the use of chitosan as a wound protector after pruning. Cobos and colleagues demonstrated that chitosan oligosaccharide, at a concentration of 25 mg/mL (and in a mix of natural antifungal compounds), reduced the wound infection rate of D. seriata and P. chlamydospora [19]. The effectiveness of the same product evaluated in this paper as pruning-wound protection was reported to completely inhibit recovery of P. chlamydospora and Pm. minimum in a detached cane assay at 0.5% v/v [33]. The results suggested similar protection as was achieved with BCA (Trichoderma spp.) products [33]. In this project, when chitosan hydrochloride was applied to the roots, a significant increase in root development was revealed. Our results are consistent with those reported for the foliar spray of chitosan oligosaccharin [5] and may open the opportunity to use this natural product in the nursery propagation process or at the time of vineyard planting. Regarding P. chlamydospora infection, the treatment with chitosan hydrochloride slightly reduced both vascular necrosis and severity, though not at a significant level. The differences with previous works may be attributed to methodology as Nascimento and colleagues infested the substrate [5] and Cobos and colleagues infected pruning wounds with a concentrate spore solution [19]. Our methodology seems to better replicate what might happen in established vineyards that are naturally infected by GTDs.
Polyphenols, including flavonoids and stilbenes, are secondary plant metabolites, and their level is inducible by biotic and abiotic stress as well as elicitors [34,35,36]. In this sense, the chitosan hydrocholoride is believed to work as a plant protection elicitor, having a fungicide and bactericide effect via the stimulation of natural defence mechanisms (far away from a chemical pesticide) [17,18]. In this research study, a significant increase in the flavonoid index was identified in leaves after root treatment. The same effect has been extensively reported in Vitis vinifera cell-suspension cultures. For example, a high increase in total flavonoids and total phenolics content [34], and changes in the protein profile and stilbene distribution [35] were described after the application of oligochitosan and a chitosan (76–139 kD) solution, respectively. There are very important phytoalexins in grapevines such as transresveratrol and viniferin, which belong to the stilbene family. The highest phytoalexin production was achieved within 48 h of incubation with chitosan at 200 µg/mL (CHN1.5/20) in leaves of cv. Chardonnay [10].
In contrast with previous research studies, we studied the impact of chitosan hydrocholoride in the open-field environment of a 20-year-old vineyard affected by Esca (cv. Tempranillo). Although chitosan showed a positive effect on the vascular necrosis and severity caused by P. chlamydospora, as well as root development and the flavonoid index in the greenhouse scenario, a different effect of the treatment was observed in the open-field scenario. Unfortunately, the expression of leaf Esca symptoms did not significantly decrease with the treatment. A higher impact from the year factor was identified over the treatment factor. This point has been well documented in Esca epidemiology studies [2] and means a strong limitation to testing new solutions for GTD control in the open field. The application method (root vs. foliar) may partly explain the different effects identified in these two scenarios. For example, changes in the accumulation pattern of cadmium in Talinum patens (Talinaceae) have been recently described after a comparison of foliar and root chitosan application [36]. In grapevines, chitosan-based bioactive formulations for the control of powdery mildew (Erysiphe necator) were tested both in foliar and root application in open-field conditions. Root-applied COS (chitosan oligomers), in combination with the secondary metabolites of Streptomyces spp. metabolites treatment and hydrolysed gluten treatments, were the most effective, while phytotoxicity symptoms were detected in grapevines upon foliar application of the COS-only treatment [12].
To better understand chitosan–host plant interaction in Esca disease, we evaluated grapevine physiology through gas exchange measures and gene expression of the same leaves. In terms of photosynthesis activity, the treatment was found to have no effect on AN or RbcL and SBP gene expression. These results concurred with no changes being identified on the chlorophyll index of the plant-model system. On the other hand, Romanazzi and colleagues showed that chitosan at 0.8% lowered net photosynthesis in relation to the reduced stomatal conductance, leaf area, and dry weight [37]. Our study was conducted on the black cv. Tempranillo, one of the most cultivated varieties in Spain which is known to be highly affected by Esca disease [21]. Such variation may be due to differences in the chitosan compound and the Vitis vinifera cultivar. In Tempranillo, lower intrinsic water-use efficiency (WUEi) was measured, particularly for low water availability, when compared with cv. Manto Negro [28]. The same authors discussed that WUEi shows quite a different dependency from stomatal conductance for the two cultivars [28]. This research study is consistent in terms of the description of the cv. Tempranillo, as the field study was conducted without irrigation and the WUEi values obtained remained below 100. Interestingly, when symptomatic Esca leaves were compared, we identified higher values of WUEi in the plants treated with chitosan hydrochloride. This finding suggested that chitosan may improve the intrinsic water-use efficiency in GTD infected vines. However, the major efficiency in the use of water in chitosan-treated and infected vines was not related to a PIP2.2 (plasma membrane intrinsic aquaporin) gene expression. Regarding productivity, no negative effects were identified in the quantity (number and weight of bunches) or Ravaz index. This fact agrees with the previously reported results [37].
Application of natural antifungals such as chitosan on pruning wounds prior to infection had a protective effect on grapevines. This was demonstrated by a significant decrease in lipid peroxidation of chitosan-treated plants compared to untreated infected plants [19]. Regarding enzyme activity, untreated infected plants also showed significantly higher levels of antioxidant defensive systems, such as GST (glutathione S-transferase) than chitosan uninfected vines. In general, intermediate values were obtained for chitosan-infected vines [19]. This study did not evaluate enzyme activity but gene expression. Despite these methodological differences, the same pattern was reported. In terms of GST5, our results showed a higher overexpression in untreated Esca-diseased plants than in chitosan-treated Esca-diseased plants. Therefore, the protective effect of chitosan treatment against Esca disease is confirmed in the glutathione-S-transferase metabolic pathway. Minor changes were found in the expression of the genes involved in the detoxification process (EpoxHF, SOD overexpressed 2.14-fold in Control_Sy) indicating a lower impact of both the chitosan treatment and Esca on this process. These results are consistent with a previous study in which the specific profile of cv. Tempranillo, with different climate conditions and Esca leaf symptoms, were studied [21].
Regarding some targeted defence-related genes, including STS (encoding for stilbene synthase involved in the synthesis of phytoalexins) and chitinases (Chit 1b class I basic chitinase and CHV5 class V chitinase), a significant overexpression was reported in untreated Esca-symptomatic leaves (Control_Sy). Apparently, the chitosan treatment did not have a significant effect on STS and Chit 1b since the expression values ranged from 0.5–2.03 in both the chitosan_As and chitosan_Sy leaves. These data were a clear indication that the treatment with hydrochloride chitosan may help the infected plant throughout a nonoverexpression of this defence-related pathway. Recently, the highest basal expression of salicylic acid (SA)-dependent defences has been demonstrated to explain the highest susceptibility of cv. Tempranillo to the GTD pathogen N. parvum in comparison to Chardonnay [38]. In the past, the induction of the expression of STS and Chit 1b has also been stated as an indicator of leaf-stripe symptoms in Tempranillo in an open-field scenario [21]. Leal and colleagues reported that salicylic acid (SA)-dependent defences were strongly reduced in plants protected by BCAs [38]. The results obtained in this research study further suggest that the chitosan hydrochloride treatment may decrease SA-dependent defences too. Future basic research may be performed to argue this hypothesis in Vitis vinifera.
In grapevines, the most thoroughly characterised inducible defence reactions to pathogenic fungi (apart from the accumulation of phytoalexins discussed above) are the synthesis of PR (pathogenesis-related) proteins [10]. It is well known that plant immunity also involves the overexpression of PR proteins. Some of them include chitinases responsible for chitin degradation [14] and have been described to be regulated by SA (like PR1) [38]. In this research study, we analysed the expression of the PR6 pathogenesis protein-related gene. Despite genes PR6 and CHV5 being proven to be overexpressed in both symptomatic leaves, the values were significantly stronger in untreated plants than in chitosan-treated plants. An enhancement of PR1 and PR5 gene expressions induced by the chitosan treatment was identified in other pathosystems such as kiwifruit plants inoculated with Pseudomonas syringae pv. Actinidiae [39]. In contrast to our results, the authors found that the combination of a chitosan treatment and the bacterial inoculum had the greatest effect on PR protein synthesis [39]. With regards to the GTD pathosystem, few studies have also reported upregulation of PR6 in symptomatic leaves after inoculation with D. seriata and N. parvum [40] as well as in open-field Esca-symptoms expression [21] in a Tempranillo cultivar.
A positive effect of chitosan hydrochloride has been reported in this research study. New knowledge about the impact of chitosan on the complex of host-GTD pathogens in grapevines has been described. Very recently, new formulations based on encapsulation, nanoparticles, and nanocarriers of chitosan, but also other bioactive natural products or BCAs, have been developed [12,20,40,41]. Application limitations have been reported, for example: (i) the need for multiyear and multilocation tests in an open-field scenario or (ii) the optimisation of the endotherapy procedure for application, as it is time consuming and may damage the plant [41]. Another interesting aspect, especially to help regulation of new PPPs based on chitosan for grapevines, is to adequately determine the most appropriate chitosan product in terms of MW or DA, as well as its origin. Future research may also consider the control impact of several pests and diseases affecting grapevines, i.e., at least for the downy mildew disease, in a more holistic and realistic scenario. For example, a recent study presented a differing commercial formulation from chitosan hydrochloride (1%) (CHIT) among the four products with a clear preventive protection role against downy mildew, which resulted from a toxic component against the oomycete Plasmopara viticola, though the author recommended field experiments for its validation as PPP [9]. Moreover, a very recent review presented multiple possibilities for chitosan application on grapevines, not only to prevent and combat the main diseases but also to improve wine quality [17].
5. Conclusions
Chitosan and chitosan-based formulated products have been the object of study for several years in the context of the protection of crops against diseases affecting grapevines. In grapevines, the most prevalent diseases are downy and powdery mildew, and also GTDs. GTDs are complex diseases relating to a complex of woody pathogens. In this study, the trials carried out in greenhouse and open-field scenarios showed interesting results for the management of GTDs by the application of chitosan hypochloride, either on the soil or on the leaves. The main findings showed various potential effects, both on pathogens by fungistatic action and on the plants by changing leaf–vine physiology and inducing some plant defence responses. The next step would ideally be to carry out a more indepth study that is notably focused on other GTD pathogens, with vineyard trials at a minimum of three years related to the sporadic expression of foliar symptoms over the years, and finally to evaluate the potential use of chitosan combined with other available treatments for the managing of GTDs such as trunk cleaning or the Trichoderma spp. application.
Supplementary Materials
The following supporting information can be downloaded at: https://www.mdpi.com/article/10.3390/agronomy13051290/s1. Table S1: Grapevine productivity, including the number of bunches, bunch weight, and Ravaz index, after chitosan application in an open-field scenario.
Author Contributions
Conceptualisation L.M.; Methodology, validation, formal analysis, research, and data curation L.M., F.J.C., A.M., and F.F.; resources and writing—original draft preparation L.M.; writing—review and editing. F.F.; supervision. L.M.; funding acquisition. L.M. and F.F. All authors have read and agreed to the published version of the manuscript.
Funding
This research was funded by the Regional Council of Extremadura (Junta de Extremadura), through MIPEX, IB18102 and GR21196 (Research Group AGA001) projects at CICYTEX with European Regional Development Fund (ERDF) co-funding. L. Martín was supported by the DOC-INIA 2015 Program (Agencia Estatal de Investigación e Instituto Nacional de Investigación y Tecnología Agraria y Alimentaria. Spain). A part of this research is based upon work from Cost Action FA1303 (Sustainable control of grapevine trunk diseases) supported by COST (European Cooperation in Science and Technology).
Data Availability Statement
The data presented in this study are available on request from the corresponding author.
Acknowledgments
We would like to express our gratitude to David Gramaje (Instituto de Ciencias de la Vid y del Vino. Rioja) for the provision of phytopathogenic fungi strains. We acknowledge the help of Cooperativa Montevirgen for its research in the open-field scenario and support of F.J.C. contract.
Conflicts of Interest
The authors declare there are no conflicts of interest. The founders had no role in the design of the study; the collection, analysis, or interpretation of the data; the writing of the manuscript; or in the decision to publish the results.
References
- Bertsch, C.; Ramírez-Suero, M.; Magnin-Robert, M.; Larignon, P.; Chong, J.; Abou-Mansour, E.; Spagnolo, A.; Clément, C.; Fontaine, F. Grapevine trunk diseases: Complex and still poorly understood. Plant Pathol. 2013, 62, 243–265. [Google Scholar] [CrossRef]
- Mondello, V.; Songy, A.; Battiston, E.; Pinto, C.; Coppin, C.; Trotel-Aziz, P.; Clément, C.; Mugnai, L.; Fontaine, F. Grapevine Trunk Diseases: A Review of Fifteen Years of Trials for Their Control with Chemicals and Biocontrol Agents. Plant Dis. 2018, 102, 1189–1217. [Google Scholar] [CrossRef] [PubMed]
- Hofstetter, V.; Buyck, B.; Croll, D.; Viret, O.; Couloux, A.; Gindro, K. What if esca disease of grapevine were not a fungal disease? Fungal Divers. 2012, 54, 51–67. [Google Scholar] [CrossRef]
- Mugnai, L.; Graniti, A.; Surico, G. Esca (black measles) and brown wood-streaking: Two old and elusive diseases of grapevines. Plant Dis. 1999, 83, 404–418. [Google Scholar] [CrossRef]
- Nascimento, T.; Rego, C.; Oliveira, H. Potential use of chitosan in the control of grapevine trunk diseases. Phytopathol. Mediterr. 2007, 46, 218–224. [Google Scholar] [CrossRef]
- De Bona, G.S.; Vincenzi, S.; De Marchi, F.; Angelini, E.; Bertazzon, N. Chitosan induces delayed grapevine defense mechanisms and protects grapevine against Botrytis cinerea. J. Plant Dis. Prot. 2021, 128, 715–724. [Google Scholar] [CrossRef]
- Younes, I.; Sellimi, S.; Rinaudo, M.; Jellouli, K.; Nasri, M. Influence of acetylation degree and molecular weight of homogeneous chitosans on antibacterial and antifungal activities. Int. J. Food Microbiol. 2014, 185, 57–63. [Google Scholar] [CrossRef]
- Romanazzi, G.; Feliziani, E.; Bautista-Baños, S.; Sivakumar, D. Shelf Life Extension of Fresh Fruit and Vegetables by Chitosan Treatment. Crit. Rev. Food Sci. Nutr. 2017, 57, 579–601. [Google Scholar] [CrossRef]
- Llamazares De Miguel, D.; Mena-Petite, A.; Díez-Navajas, A.M. Toxicity and Preventive Activity of Chitosan, Equisetum arvense, Lecithin and Salix Cortex against Plasmopara viticola, the Causal Agent of Downy Mildew in Grapevine. Agronomy 2022, 12, 3139. [Google Scholar] [CrossRef]
- Aziz, A.; Trotel-Aziz, P.; Dhuicq, L.; Jeandet, P.; Couderchet, M.; Vernet, G. Chitosan Oligomers and Copper Sulfate Induce Grapevine Defense Reactions and Resistance to Gray Mold and Downy Mildew. Phytopathology 2006, 96, 1188–1194. [Google Scholar] [CrossRef]
- Romanazzi, G.; Gabler, F.M.; Margosan, D.; Mackey, B.E.; Smilanick, J.L. Effect of Chitosan Dissolved in Different Acids on Its Ability to Control Postharvest Gray Mold of Table Grape. Phythopathology 2009, 99, 1028–1036. [Google Scholar] [CrossRef] [PubMed]
- Ruano-Rosa, D.; Sánchez-Hernández, E.; Baquero-Foz, R.; Martín-Ramos, P.; Martín-Gil, J.; Torres-Sánchez, S.; Casanova-Gascón, J. Chitosan-Based Bioactive Formulations for the Control of Powdery Mildew in Viticulture. Agronomy 2022, 12, 495. [Google Scholar] [CrossRef]
- Singh, R.K.; Ruiz-May, E.; Rajput, V.D.; Minkina, T.; Gómez-Peraza, R.L.; Verma, K.K.; Shekhawat, M.S.; Pinto, C.; Falco, V.; Quiroz-Figueroa, F.R. Viewpoint of Chitosan Application in Grapevine for Abiotic Stress/Disease Management towards More Resilient Viticulture Practices. Agriculture 2022, 12, 1369. [Google Scholar] [CrossRef]
- Lopez-Moya, F.; Suarez-Fernandez, M.; Vicente Lopez-Llorca, L. Molecular Mechanisms of Chitosan Interactions with Fungi and Plants. Int. J. Mol. Sci. 2019, 20, 332. [Google Scholar] [CrossRef] [PubMed]
- Kumari, S.; Kishor, R. Chitin and Chitosan: Origin, Properties, and Applications. In Handbook of Chitin and Chitosan; Elsevier: Amsterdam, The Netherlands, 2020; pp. 1–33. ISBN 978-0-12-817970-3. [Google Scholar]
- El Hadrami, A.; Adam, L.R.; El Hadrami, I.; Daayf, F. Chitosan in Plant Protection. Mar. Drugs 2010, 8, 968. [Google Scholar] [CrossRef]
- Soares, B.; Barbosa, C.; Oliveira, M.J. Chitosan application towards the improvement of grapevine performance and wine quality. Ciencia Téc. Vitivi. 2023, 38, 43–59. [Google Scholar] [CrossRef]
- EU Pesticides Database—Active Substances. Available online: https://ec.europa.eu/food/plant/pesticides/eu-pesticidesdatabase/ start/screen/active-substances (accessed on 7 March 2023).
- Cobos, R.; Mateos, R.M.; Álvarez-Pérez, J.M.; Olego, M.A.; Sevillano, S.; González-García, S.; Garzón-Jimeno, E.; Coque, J.J.R. Effectiveness of natural antifungal compounds in controlling infection by grapevine trunk disease pathogens through pruning wounds. Appl. Environ. Microbiol. 2015, 81, 6474–6483. [Google Scholar] [CrossRef] [PubMed]
- Buzón-Durán, L.; Langa-Lomba, N.; González-García, V.; Casanova-Gascón, J.; Martín-Gil, J.; Pérez-Lebeña, E.; Martín-Ramos, P. On the Applicability of Chitosan Oligomers-Amino Acid Conjugate Complexes as Eco-Friendly Fungicides against Grapevine Trunk Pathogens. Agronomy 2021, 11, 324. [Google Scholar] [CrossRef]
- Martín, L.; Fontaine, F.; Castaño, F.J.; Songy, A.; Roda, R.; Vallet, J.; Ferrer-Gallego, R. Specific profile of Tempranillo grapevines related to esca-leaf symptoms and climate conditions. Plant Physiol. Biochem. 2019, 135, 575–587. [Google Scholar] [CrossRef]
- Martín, L.; García-García, B.; Alguacil, M.M. Interactions of the Fungal Community in the Complex Patho-System of Esca, a Grapevine Trunk Disease. Int. J. Mol. Sci. 2022, 23, 14726. [Google Scholar] [CrossRef]
- Hoagland, D.R.; Arnon, D.I. The Water-Culture Method for Growing Plants without Soil; University of California, College of Agriculture, Agricultural Experiment Station: Berkeley, CA, USA, 1938. [Google Scholar]
- Tegli, S.; Surico, G.; Bertelli, E. Sequence Analysis of ITS Ribosomal DNA in Five “Phaeoacremonium” Species and Development of a PCR-Based Assay for the Detection of “P. chlamydosporum” and “P. aleophilum” in Grapevine Tissue. Phytopathol. Mediterr. 2000, 39, 1000–1016. [Google Scholar]
- Kottek, M.; Grieser, J.; Beck, C.; Rudolf, B.; Rubel, F. World map of the Koppen-Geiger climate classification updated. Meteorol. Z. 2006, 15, 259–263. [Google Scholar] [CrossRef] [PubMed]
- Meier, U. BBCH-Monograph: Growth Stages of Mono-and Dicotyledonous Plants, 2nd ed.; Technical Report; Federal Biological Research Centre for Agriculture and Forestry: Berlin, Germany, 2001; p. 158. [Google Scholar]
- McKinney, H.H. Influence of soil temperature and moisture on infection of wheat seedlings by helmin. J. Agric. Res. 1923, 26, 195. [Google Scholar]
- Escalona, J.M.; Flexas, J.; Medrano, H. Stomatal and non-stomatal limitations of photosynthesis under water stress in field-grown grapevines. Aust. J. Plant Physiol. 1999, 26, 421–433. [Google Scholar] [CrossRef]
- Hellemans, J.; Mortier, G.; De Paepe, A.; Speleman, F.; Vandesompele, J. qBase relative quantification framework and software for management and automated analysis of real-time quantitative PCR data. Genome Biol. 2007, 8, R19. [Google Scholar] [CrossRef]
- Martin, L.; Martin, M.T. Characterization of fungicide resistant isolates of Phaeoacremonium aleophilum infecting grapevines in Spain. Crop Prot. 2013, 52, 141–150. [Google Scholar] [CrossRef]
- Green Deal: Halving Pesticide Use by 2030. Available online: https://ec.europa.eu/eip/agriculture/en/news/green-dealhalvingpesticide-use-2030 (accessed on 7 March 2023).
- Martín, L.; Castaño, F.J.; Aluja, P. Pruning wound protection for control of esca causal agents. Phytopathol. Mediterr. 2017, 56, 577. [Google Scholar] [CrossRef]
- Xu, A.; Zhan, J.C.; Huang, W.D. Oligochitosan and sodium alginate enhance stilbene production and induce defense responses in Vitis vinifera cell suspension cultures. Acta Physiol Plant 2015, 37, 144. [Google Scholar] [CrossRef]
- Ferri, M.; Tassoni, A.; Franceschetti, M.; Righetti, L.; Naldrett, M.J.; Bagni, N. Chitosan treatment induces changes of protein expression profile and stilbene distribution in Vitis vinifera cell suspensions. Proteomics 2009, 9, 610–624. [Google Scholar] [CrossRef]
- de Lima, S.V.A.M.; Marques, D.M.; Silva, M.F.S.; Bressanin, L.A.; Magalhães, P.C.; de Souza, T.C. Applications of chitosan to the roots and shoots change the accumulation pattern of cadmium in Talinum patens (Talinaceae) cuttings. Environ. Sci. Pollut. Res. Int. 2022, 29, 67787–67800. [Google Scholar] [CrossRef]
- Reis, P.; Magnin-Robert, M.; Nascimento, T.; Spagnolo, A.; Abou-Mansour, E.; Fioretti, C.; Clément, C.; Rego, C.; Fontaine, F. Reproducing Botryosphaeria Dieback Foliar Symptoms in a Simple Model System. Plant Dis. 2016, 100, 1071–1079. [Google Scholar] [CrossRef] [PubMed]
- Romanazzi, G.; Mancini, V.; Feliziani, E.; Servili, A.; Endeshaw, S.; Neri, D. Impact of Alternative Fungicides on Grape Downy Mildew Control and Vine Growth and Development. Plant Dis. 2016, 100, 739–748. [Google Scholar] [CrossRef] [PubMed]
- Leal, C.; Richet, N.; Guise, J.F.; Gramaje, D.; Armengol, J.; Fontaine, F.; Trotel-Aziz, P. Cultivar Contributes to the Beneficial Effects of Bacillus subtilis PTA-271 and Trichoderma atroviride SC1 to Protect Grapevine Against Neofusicoccum parvum. Front. Microbiol. 2021, 12, 726132. [Google Scholar] [CrossRef] [PubMed]
- Beatrice, C.; Linthorst, J.M.H.; Cinzia, F.; Luca, R. Enhancement of PR1 and PR5 gene expressions by chitosan treatment in kiwifruit plants inoculated with Pseudomonas syringae pv. actinidiae. Eur. J. Plant Pathol. 2017, 148, 163–179. [Google Scholar] [CrossRef]
- Sánchez-Hernández, E.; Langa-Lomba, N.; González-García, V.; Casanova-Gascón, J.; Martín-Gil, J.; Santiago-Aliste, A.; Torres-Sánchez, S.; Martín-Ramos, P. Lignin–Chitosan Nanocarriers for the Delivery of Bioactive Natural Products against Wood-Decay Phytopathogens. Agronomy 2022, 12, 461. [Google Scholar] [CrossRef]
- Peil, S.; Beckers, S.J.; Fischer, J.; Wurm, F.R. Biodegradable, lignin-based encapsulation enables delivery of Trichoderma reesei with programmed enzymatic release against grapevine trunk diseases. Mater. Today Bio 2020, 7, 100061. [Google Scholar] [CrossRef]
Figure 1.
Numerical scale used for disease rate and subsequent calculation of Esca severity on the field following McKinney’s index based on leaves with tiger-stripe symptoms as followed: 1 = 1 to 10%, 2 = 10 to 25%, 3 = 26 to 50%, 4 = 51 to 100%, and 5 = apoplexy.
Figure 1.
Numerical scale used for disease rate and subsequent calculation of Esca severity on the field following McKinney’s index based on leaves with tiger-stripe symptoms as followed: 1 = 1 to 10%, 2 = 10 to 25%, 3 = 26 to 50%, 4 = 51 to 100%, and 5 = apoplexy.

Figure 2.
(a) Flavonoid index in greenhouse conditions (untreated plants in yellow colour; plants treated with chitosan in blue colour). (b) Chlorophyll index in greenhouse conditions (uninfected plants in green colour; plants infected with P. chlamydospora in red colour). T1: Control plants which were untreated and uninfected; T2: Plants treated with chitosan but not infected; T3: Infected and untreated plants; and T4: Plants infected and treated with chitosan. The vertical bars represent the mean value ± standard error (n = 90). Values in bars sharing the same letter do not differ significantly (p > 0.05) as determined by the LSD test.

Figure 3.
Intrinsic water use efficiency (WUEi) in an open-field scenario (n = 16). (a) Effect of the year (untreated plants in yellow colour; plants treated with chitosan in blue colour). Y2: year 2. Y3·: year 3. (b) Effect of the type of leaf. Sy: Esca-symptomatic leaves showing tiger stripe. As: Green leaves from Esca nonsymptomatic vines. Values in the boxplot sharing the same letter do not differ significantly (p > 0.05) as determined by the LSD test.

Figure 4.
Relative expression of genes in leaves showing Esca symptoms (Sy) from plants treated with chitosan or not (control) versus leaves collected from green nontreated asymptomatic plants. (a): Chit 1b gene; (b): CHV5 gene; (c): GST5 gene; (d): STS gene; (e): PR6 gene. The data are represented as means ± standard error (n = 4). The genes were considered significantly up- or downregulated when changes in their expression were >2× or <0.5×, respectively, compared to the control asymptomatic vines. ** Significant differences at p < 0.01 between types of leaves as determined by the LSD test.


Table 1.
Primers of genes analysed by real-time reverse-transcription polymerase chain reaction.
| Category | Genes | Primer Sequences | Genbank or TC TIGR Accession Number |
|---|---|---|---|
| Constitutive gene | EF1-α (elongation factor 1-α) | 5′-GAACTGGGTGCTTGATAGGC-3′ 5′-AACCAAAATATCCGGAGTAAAAGA-3′ | GU585871 |
| SRP60 (60S ribosomal protein L18) | 5′-ATCTACCTCAAGCTCCTAGTC-3′ 5′-CAATCTTGTCCTCCTTTCCT-3′ | XM_002270599 | |
| Photosynthesis-related genes | RbcL (large subunit of Rubisco) | 5′-AATTTTTCCTCCACGGCGATA-3′ 5′-ATCTGCGCCCGCCTTTATA-3′ | TC57584 |
| SBP (sedoheptulose-7-biphosphatase, Calvin Cycle) | 5′-TGCCAACCAGCTCCTATTTGA-3′ 5′-TCAACTGGGCCTCCCATGT-3′ | XM_002263013 | |
| Water stress | PIP2.2 (plasma membrane intrinsic aquaporin) | 5′-GGTTCAGTCTCCATTGCACATG-3′ 5′-TTGGCAGCACAGCAGATGTAT-3′ | XM_002271336 |
| Stress tolerance | GST5 (Glutation-S-Transferase 5) | 5′-GCAGAAGCTGCCAGTGAAATT-3′ 5′-GGCAAGCCATGAAAGTGACA-3′ | XM_002277883 |
| Detoxification-process gene | EpoxHF (epoxide hydrolase) | 5′-TGCTCGTCTTGGCACTGAGA-3′ 5′-TGAGCGCACCACTGTACCAT-3′ | XM_003632333 |
| SOD (superoxide dismutase) | 5′-GTGGACCTAATGCAGTGATTGGA-3′ 5′-TGCCAGTGGTAAGGCTAAGTTCA-3′ | AF056622 | |
| Defence-related gene | Chit 1b (class I basic chitinase) | 5′-ATGCTGCAGCAAGTTTGGTT-3′ 5′-CATCCTCCTGTGATGACATT-3′ | Z54234 |
| CHV5 (class V chitinase) | 5′-CTACAACTATGGCGCTGCTG-3′ 5′-CCAAAACCATAATGCGGTCT-3′ | AF532966 | |
| STS (stilbene synthase) | 5′-AGGAAGCAGCATTGAAGGCTC-3′ 5′-TGCACCAGGCATTTCTACACC-3′ | X76892 | |
| Pathogenesis proteins | PR6 (serine proteinase inhibitor) | 5′-AGGGAACAATCGTTACCCAAG-3′ 5′-CCGATGGTAGGGACACTGAT-3′ | AY156047 |
Table 2.
Results of the inhibition of mycelial radial growth in the in vitro test.
| Concentration (v/v) | 0% | 0.50% | 1% | 2.50% | 5% | 10% |
|---|---|---|---|---|---|---|
| P. chlamydospora | 0 | 72.48 | 90.57 | 100 | 100 | 100 |
| Pm. minimum | 0 | 100 | 100 | 100 | 100 | 100 |
| N. parvum | 0 | nd | 82.05 | 56.03 | 41.88 | 100 |
| E. lata | 0 | nd | 40.13 | 93.43 | 76.54 | 81.11 |
nd: Nondetermined.
Table 3.
Flavonoid index measured with Dualex® in leaves after chitosan application.
| Treatment | bt | 48 hpt | 7 dpt | 15 dpt |
|---|---|---|---|---|
| Control | 0.45 ± 0.02 | 0.66 ± 0.02 | 0.64 ± 0.02 | 0.69 ± 0.02 |
| Chitosan | 0.49 ± 0.02 | 0.73 ± 0.02 | 0.73 ± 0.02 | 0.77 ± 0.02 |
| W (p-value) | 1424.5 (0.049) | 1340.5 (0.016) | 1107.5 (0.000) | 1253.0 (0.004) |
bt: before treatment; hpt: hours post-treatment; dpt: days post-treatment. Mean ± standard error (n = 60). The significance of the effect of the chitosan treatment is shown using the nonparametric Mann–Whitney–Wilcoxon test (W, p-value).
Table 4.
Chlorophyll index measured with Dualex® in leaves after chitosan application.
| Treatment | bt | 48 hpt | 7 dpt | 15 dpt |
|---|---|---|---|---|
| Control | 15.23 ± 0.46 | 15.49 ± 0.27 | 14.76 ± 0.31 | 15.41 ± 0.53 |
| Chitosan | 16.13 ± 0.29 | 16.55 ± 0.28 | 15.87 ± 0.27 | 15.50 ± 0.38 |
| W (p-value) | 1566.0 (0.220) | 1302.0 (0.009) | 1365.5 (0.023) | 1792.5 (0.971) |
bt: before treatment; hpt: hours post-treatment; dpt: days post-treatment. Mean ± standard error (n = 60). The significance of the effect of the chitosan treatment is shown using the nonparametric Mann–Whitney–Wilcoxon test (W, p-value).
Table 5.
Root weights, vascular necrosis, and severity in greenhouse conditions. T1: Control plants which were untreated and uninfected; T2: Plants treated with chitosan but not infected; T3: Infected and untreated plants; and T4: Plants infected and treated with chitosan.
Table 5.
Root weights, vascular necrosis, and severity in greenhouse conditions. T1: Control plants which were untreated and uninfected; T2: Plants treated with chitosan but not infected; T3: Infected and untreated plants; and T4: Plants infected and treated with chitosan.
| Treatment | Root Weights (g) | Vascular Necrosis (cm) | Severity (%) |
|---|---|---|---|
| T1 | 113.31 ± 6.81 b | 1.2 ± 0.1 b | 0.00 ± 0.00 b |
| T2 | 147.78 ± 12.13 a | 1.37 ± 0.3 b | 0.00 ± 0.00 b |
| T3 | 78.40 ± 6.18 c | 2.33 ± 0.27 a | 19.14 ± 8.02 a |
| T4 | 117.91 ± 9.50 ab | 2.08 ± 0.32 ab | 13.58 ± 6.64 ab |
| ANOVA (p-value) | 10.027 (0.001) | 4.438 (0.010) | 3.922 (0.017) |
Mean value ± standard error (n = 18). Values in columns followed by a different letter are significantly different according to the LSD test.
Table 6.
Incidence of Esca symptomatic vines (%) and severity of Esca symptoms in an open-field scenario.
Table 6.
Incidence of Esca symptomatic vines (%) and severity of Esca symptoms in an open-field scenario.
| Treatment | Year | Incidence | Severity |
|---|---|---|---|
| Control | Year 1 | 6.88 ± 2.58 | 6.72 ± 2.44 |
| Chitosan | 3.13 ± 1.57 | 3.45 ± 1.76 | |
| Control | Year 2 | 14.73 ± 5.67 | 7.55 ± 2.84 |
| Chitosan | 11.17 ± 2.77 | 6.12 ± 1.83 | |
| Control | Year 3 | 4.32 ± 0.87 | 1.98 ± 0.62 |
| Chitosan | 7.85 ± 3.08 | 3.19 ± 0.87 | |
| Control | Year 4 | 5.46 ± 1.24 | 3.41 ± 0.91 |
| Chitosan | 4.04 ± 1.34 | 2.81 ± 0.87 | |
| ANOVA (p-value) | |||
| Treatment (T) | 0.39 (0.538) | 0.71 (0.407) | |
| Year (Y) | 3.72 (0.025) | 2.61 (0.074) | |
| T × Y | 0.71 (0.554) | 0.59 (0.625) |
Mean ± standard error (n = 4, each value calculated over 120 vines/block). The significance of the effects of the chitosan treatment, the year, and their interaction with the measured variables are also shown (F-values (p-values)).
Table 7.
Relative expression of 5 targeted genes resulting in no changes under the experimental conditions.
Table 7.
Relative expression of 5 targeted genes resulting in no changes under the experimental conditions.
| Gene | Category | Chitosan_As | Chitosan_Sy | Control_Sy |
|---|---|---|---|---|
| RbcL | Photosynthesis-related gene | 0.93 ± 0.15 | 0.69 ± 0.11 | 0.60 ± 0.09 |
| SBP | 0.74 ± 0.03 | 1.25 ± 0.05 | 0.72 ± 0.03 | |
| PIP2.2 | Water-stress-related gene | 0.87 ± 0.07 | 0.78 ± 0.08 | 0.69 ± 0.06 |
| EpoxHF | Detoxification process | 1.02 ± 0.05 | 1.30 ± 0.07 | 1.18 ± 0.06 |
| SOD | 0.72 ± 0.12 | 1.45 ± 0.24 | 2.14 ± 0.35 |
The results represent the relative expression [Means (n = 4) ± standard error] of genes in leaves showing Esca symptoms (Sy) from plants treated with chitosan or not (control), and no symptomatic vines treated with chitosan versus leaves collected from green nontreated asymptomatic plants.
Disclaimer/Publisher’s Note: The statements, opinions and data contained in all publications are solely those of the individual author(s) and contributor(s) and not of MDPI and/or the editor(s). MDPI and/or the editor(s) disclaim responsibility for any injury to people or property resulting from any ideas, methods, instructions or products referred to in the content. |
© 2023 by the authors. Licensee MDPI, Basel, Switzerland. This article is an open access article distributed under the terms and conditions of the Creative Commons Attribution (CC BY) license (https://creativecommons.org/licenses/by/4.0/).
Share and Cite
MDPI and ACS Style
Martín, L.; Millán, A.; Castaño, F.J.; Fontaine, F. Deciphering Chitosan–Host Plant Interaction in Esca Disease. Agronomy 2023, 13, 1290. https://doi.org/10.3390/agronomy13051290
AMA Style
Martín L, Millán A, Castaño FJ, Fontaine F. Deciphering Chitosan–Host Plant Interaction in Esca Disease. Agronomy. 2023; 13(5):1290. https://doi.org/10.3390/agronomy13051290
Chicago/Turabian StyleMartín, Laura, Agustín Millán, Francisco Javier Castaño, and Florence Fontaine. 2023. "Deciphering Chitosan–Host Plant Interaction in Esca Disease" Agronomy 13, no. 5: 1290. https://doi.org/10.3390/agronomy13051290
Note that from the first issue of 2016, this journal uses article numbers instead of page numbers. See further details here.