
Phylogeny and Biogeography of Morus (Moraceae)
by
 , , ,
, , ,
Chen-Xuan Yang
1,2,3,
Shui-Yin Liu
2,3,
Nyree J. C. Zerega
4,5,
Gregory W. Stull
2,6,
Elliot M. Gardner
7,8,9,
Qin Tian
2,3,
Wei Gu
2,3,
Qing Lu
2,3,
Ryan A. Folk
10,11,
Heather R. Kates
10,
Robert P. Guralnick
10,
Douglas E. Soltis
10,12,
Pamela S. Soltis
10,
Yue-Hua Wang
1 and
Ting-Shuang Yi
2,3,6,* 1
School of Life Sciences, Yunnan University, Kunming 650500, China
2
Germplasm Bank of Wild Species, Yunnan Key Laboratory of Crop Wild Relatives Omics, Kunming Institute of Botany, Chinese Academy of Sciences, Kunming 650201, China
3
University of Chinese Academy of Sciences, Beijing 100049, China
4
Negaunee Institute for Plant Conservation and Action, Chicago Botanic Garden, Glencoe, IL 60022, USA
5
Plant Biology and Conservation Program, Northwestern University, Evanston, IL 60208, USA
6
CAS Key Laboratory for Plant Diversity and Biogeography of East Asia, Kunming Institute of Botany, Chinese Academy of Sciences, Kunming 650201, China
7
International Center for Tropical Botany, Institute of Environment, Florida International University, Miami, FL 33199, USA
8
National Tropical Botanical Garden, Kalāheo, HI 96741, USA
9
Department of Biology, Case Western Reserve University, Cleveland, OH 44106, USA
10
Florida Museum of Natural History, University of Florida, Gainesville, FL 32611, USA
11
Department of Biological Sciences, Mississippi State University, Starkville, MS 39762, USA
12
Department of Biology, University of Florida, Gainesville, FL 32611, USA
*
Author to whom correspondence should be addressed.
Agronomy 2023, 13(8), 2021; https://doi.org/10.3390/agronomy13082021
Submission received: 8 July 2023
/
Revised: 28 July 2023
/
Accepted: 29 July 2023
/
Published: 30 July 2023
Abstract
:The mulberry genus, Morus L. (Moraceae), has long been taxonomically difficult, and its species circumscription has only been defined recently. This genus comprises ca. 16 species distributed across Asia and the Americas, yet its biogeographic history remains poorly understood. In this study, we reconstructed the phylogeny and explored the biogeographic history of Morus using a combination of newly generated and previously published Hyb-Seq data. Our nuclear phylogeny recovered three well-supported geographic clades of Morus and showed that M. notabilis (China) is sister to the American clade plus the Asian clade. Multiple reticulation events among species of Morus and extensive incomplete lineage sorting (ILS) likely explain the difficulties in inferring phylogenetic relationships within the genus. Divergence time estimation indicated that Morus originated at the Eocene–Oligocene boundary, and current lineages started to diverge during the early Miocene, there is ambiguity surrounding the ancestral area with the two most likely regions being Sino-Himalaya or the Americas. Biogeographic inference and the fossil record suggest that Morus might have experienced extensive local extinction events during the Tertiary. Morus has expanded its distributional range through two dispersals from the Sino-Himalayan and Sino-Japanese regions to Southeast Asia. In summary, our new phylogenetic scheme and the biogeographic history presented here provide an essential foundation for understanding species relationships and the evolutionary history of Morus.
Keywords:
ancestral area reconstruction; biogeography; dispersal; divergence times; Morus; phylogeny1. Introduction
Mulberries (Morus L., Moraceae) are widely known and have great economic value in that the leaves of several species are the primary food source for silkworms (Bombyx mori L.). Additionally, members of this genus provide edible fruits, fibers, medicine, and raw material for papermaking [1]. Species of Morus exhibit considerable morphological diversity (Figure 1; Table S1). More specifically, the breeding systems of Morus are monoecious or dioecious and the length of styles and syncarps (fruits) vary among species. These three characteristics are critical for species classification of Morus [1,2,3,4]. However, the evolution of these traits has not been extensively addressed and the value of these characters in Morus classification are largely unknown.
Since Linnaeus [6] first established the genus Morus and described seven species, the circumscription and taxonomy of the genus have been challenging. Over the last 200-plus years, the number of recognized species, varieties, and subvarieties has proliferated. For example, Bureau [7] recognized six species, 20 varieties (16 under M. alba L.), and 12 subvarieties (11 under M. alba). Koidzumi [2] elevated many of these varieties to species and reduced others to synonymy, resulting in 24 species that were divided into two sections based on the length of the style: sect. Macromorus Koidz. (=sect. Morus) and sect. Dolichostylae Koidz. Leroy [8] classified 18 Morus species into three subgenera: subg. Eumorus J.F.Leroy (= subg. Morus) distributed in Asia and North America; subg. Gomphomorus J.F.Leroy distributed in South America; and subg. Afromorus A.Chevalier distributed in tropical Africa. Subsequently, Hotta [9] recognized 35 Morus species., and Chang et al. [3] recognized 16 Morus species, 11 of which are distributed in China.
Some of the explanations for species circumscription in Morus has been difficult include variable and continuous morphological traits, the recent global expansions of several species due to human transportation, and widespread interspecific hybridization facilitated by their wind-pollination breeding system and sympatry in several species [10,11,12].
Nepal and Purintun [4] and Nepal and Ferguson [13] reconstructed the phylogeny of Morus based on ITS and trnL-trnF sequences and found that the African M. mesozygia Stapf and the South American M. insignis Bureau formed a clade separate from the other species of Morus. A phylogenetic study by Gardner et al. [5] on the entire tribe Moreae using 686 loci recovered a monophyletic Morus s.s. and transferred M. mesozygia to Afromorus mesozygia (Stapf.) E.M.Gardner and M. insignis to Paratrophis insignis (Bureau) E.M.Gardner. This study recognized 16 Morus species but suggested that further work was needed to better understand species circumscription within the genus.
Most Morus species are distributed in temperate forests or mid-elevation tropical forests and are adapted to cooler climates, in contrast to most other members of Moraceae, which are largely distributed in subtropical and tropical regions (exceptions include Broussonetia L’Hér. ex Vent. and some Maclura Nutt.). The disjunct distribution of Morus in the Northern Hemisphere (ca. 13 Asian and 3 American species) makes the genus interesting biogeographically. Most of the Asian species are found in East and Southeast Asia, while western Asia has an endemic species, M. nigra L.
The disjunct distribution between eastern Asia and eastern North America is a major biogeographic pattern in the Northern Hemisphere and has been studied in many taxa (e.g., Xiang et al. [14]; Wen [15]; Jin et al. [16]; Gaynor et al. [17]). This disjunction is considered to comprise the remnants of once-widely distributed temperate forests during the Tertiary [15,18]. Tribe Artocarpeae (Moraceae) also has an Asian and American disjunction, and biogeographic reconstruction indicates that Artocarpeae likely originated in the Americas, and the Asian clade (Artocarpus J.R.Forst. and G.Forst.) split from the American clade (Batocarpus H.Karst. and Clarisia Ruiz and Pav.) during the Paleocene (55.24–65.03 million years ago (Mya)), when the North Atlantic Land Bridge was available for migration [19]. Previous studies have estimated divergence times for Morus. Zerega et al. [20] inferred the crown age of Morus at 23.3–43.3 Mya; however, only two species of Morus were included in the study (M. alba and M. nigra), and the phylogeny was based on just two loci. Subsequently, Gardner et al. [5] examined a much larger dataset (with 10 Morus species and 686 genes) and suggested that the genus originated during the Eocene. However, the biogeography of the entire genus has not been investigated. Morus is therefore a good taxon for examining the origins of disjunct distributions in the Northern Hemisphere.
We use a combination of published [5] and newly generated sequence data representing 686 and 100 nuclear loci from 11 of the 16 recognized Morus species, to resolve phylogenetic relationships and infer the biogeographic history of this genus. In addition, we reconstruct ancestral states of characters that have been historically used to differentiate species: style length, syncarp length, and breeding system. Our study provides a foundation for further evolutionary investigations and ultimately a taxonomic revision of Morus.
2. Materials and Methods
2.1. Taxon Sampling
The final dataset contained 17 samples of Morus, consisting of eight newly sequenced samples from the current study and nine samples from Gardner et al. [5] (Table 1). Four additional Morus samples used in Gardner et al. [5] were not included in this study after they were determined to be M. alba based upon a reexamination of the specimens (see details in Section 4.1). Seventeen samples were included in analyses representing 11 of 16 Morus species recognized by Gardner et al. [5], with M. wittiorum Hand.-Mazz being sampled for the first time in a molecular phylogenetic analysis. Each sampled species was represented by one or two individuals. Our sampling covered nearly the entire geographical distribution of the genus, including Asia and the Americas, but we were unable to sample M. nigra, whose native distributions is in Iran. Four other unsampled species (M. boninensis Koidz., M. liboensis S.S.Chang, M. koordersiana J.-F.Leroy, and M. trilobata (S.S.Chang) Z.Y.Cao) are endemic species to certain east Asian regions and would likely not affect our phylogenetic and biogeographic inferences.
The outgroup included 11 newly sequenced samples and 11 samples from Gardner et al. [5], representing a total of 12 species from 10 other genera of Moraceae (Table 1): 1 species each from Trophis P.Browne, Afromorus E.M.Gardner, Paratrophis Blume, Taxotrophis Blume, Batocarpus, Maclura, Parartocarpus Baill., and Olmedia Ruiz and Pav., and two species each from Artocarpus and Ficus L. Each outgroup species was represented by two individuals except for two species of Ficus.
2.2. DNA Extraction, Library Preparation, and Sequencing
Total genomic DNA of the new samples was extracted from leaf fragments taken from herbarium specimens (Table 1) using a CTAB protocol [21]. Sample quantification, library preparation, hybridization, and sequencing (150-bp paired-end reads) were conducted by RAPiD Genomics (Gainesville, FL, USA). For Hyb-Seq of 19 new samples, we used a set of 100 low-copy nuclear genes (hereafter, HybSeq100) that were designed for the phylogenomic analyses of the nitrogen-fixing clade (including Moraceae) and discussed in detail by Folk et al. [22], Kates et al. [23], Fu et al. [24], and Liu et al. [25].
2.3. Sequence Assembly and Dataset Processing
For the newly generated data, we removed adapters and low-quality bases of raw reads using Trimmomatic [26] with the parameters fa:2:30:10:8:TRUE. Cleaned reads were assembled using HybPiper v1.3.1 [27] using 100 protein sequences (corresponding to the 100 targeted genes) of Arabidopsis thaliana (L.) Heynh. as references. Exon contigs extracted from assemblies were aligned for each locus using MAFFT v7.305b [28]. We used the pipeline of KewHybSeqWorkshop [29] to remove the samples with long branches in each gene using ETE3 [30] with the parameters of inlen = 0.50, outlen = 0.90, and leaflen = 0.40. Columns with more than 50% gaps in each alignment were removed using trimAl [31].
To incorporate the sequence data of Gardner et al. [5] that were generated based on two probe sets, the Moraceae333 loci [27,32] and the Angiosperms353 loci [33], we assembled the HybSeq100 loci from the Hyb-Seq data of Gardner et al. [5] and recovered data for 43 genes. We also assembled the Moraceae333 and Angiosperms353 loci from the new Hyb-Seq data of this study and recovered 159 genes. We removed 45 loci for which data were obtained for fewer than three Morus samples or overlapped among three probe sets and generated a dataset of 157 nuclear genes shared among all 39 samples (17 Morus + 22 outgroup samples; hereafter, C157). For subsequent conflict and biogeographic analyses, a simplified C157 dataset was built by retaining one individual per species with the least missing data. In addition, a comprehensive dataset of 430 nuclear genes (hereafter, C430) was generated by combining the 157 genes from the C157 dataset, 51 genes only represented by newly sequenced samples, and 222 genes only represented by the samples of Gardner et al. [5].
2.4. Phylogenetic Analysis
We conducted maximum likelihood analyses on three concatenated matrices (C157, simplified C157, and C430) using RAxML v8.2.11 [34] with the GTRGAMMA model and 200 bootstrap replicates. Individual ML gene trees for the three datasets were reconstructed with the same parameters as above using RAxML. A species tree for each dataset was then inferred by ASTRAL v5.6.3 [35] using gene trees, with support values measured using local posterior probabilities (LPP).
2.5. Topologies Tests
To compare alternative topologies, we carried out the approximately unbiased (AU) test [36] based on the simplified C157 dataset. The log-likelihood value per site was calculated using RAxML with the GTRGAMMA model. The implementation of the AU test and calculation of p-values were performed using CONSEL v1.6 [37]. We also performed a polytomy test [38] to evaluate whether a given branch in the ASTRAL tree could reject the null hypothesis using the option “-t 10” of ASTRAL based on the simplified C157 dataset. If the null hypothesis cannot be rejected (p > 0.05), the bifurcating topology can be replaced by a polytomy [38].
2.6. Coalescent Simulations and Network Analyses
To explore the causes of discordance among phylogenetic trees, we first used coalescent simulations to examine whether ILS alone is sufficient to explain the observed discordance based on the C157 dataset, following Garcia et al. [39] and Wang et al. [40]. We simulated 1000 trees under the coalescent using the script generateCoalescentTrees.py [41] and mapped these simulated trees on the ASTRAL tree and the concatenated ML tree inferred from the C157 dataset using PhyParts [42] and the script phypartspiecharts.py (https://github.com/mossmatters/MJPythonNotebooks/blob/master/phypartspiecharts.py, accessed on 1 September 2022). In addition, we inferred phylogenetic networks using the “InferNetwork_MPL” command in PhyloNet v3.8.2 [43] and allowed a maximum number of reticulations from 0 to 5 and 10 runs for each search. The gene trees from the simplified C157 dataset (with branches of bootstrap support (BS) < 50% collapsed) were utilized for network analysis. To reduce the computational burden, we only included the closest outgroup, T. mexicana. We calculated the Akaike Information Criterion (AIC) values for the six networks to choose the optimal model. The number of parameters for AIC calculation was set to the number of estimated branch lengths and inheritance probabilities (γ). The proportion of genetic contributions of parental populations at a given reticulated node was indicated by the inheritance probabilities (γ). The log-likelihood scores of bifurcating trees were calculated using the command “CalGTProb” [44].
2.7. Divergence Time Estimation
We used one secondary and three fossil calibrations for divergence-time estimation following Zhang et al. [45]: (1) one secondary calibration to constrain the crown age of Moraceae with a minimum age of 73.2 Mya and a maximum age of 84.7 Mya; (2) a wood fossil of Artocarpoxylon deccanensis Mehrotra, Prakash, and Bande from the early Tertiary [46] to constrain the minimum stem age of Artocarpus to 64 Mya; (3) an achene fossil of Ficus lucidus Chandler from the Paleocene-Eocene boundary [47] to constrain the minimum stem age of Ficus to 56 Mya; and (4) an achene fossil of M. tymensis Dorofeev from the Eocene–Oligocene boundary [48] to constrain the minimum stem age of Morus to 33.9 Mya.
The divergence times were estimated in treePL v1.0 [49,50] using the best concatenated ML tree from the simplified C157 dataset, with a smoothing parameter of 0.0001 that was determined by cross-validation tests. Following the method of Maurin [50], we also generated 1000 bootstrap trees using RAxML with the topology fixed by the best concatenated ML tree from the simplified C157 dataset and its concatenated matrix as the input alignment. To estimate uncertainty in divergence times, treePL analyses were conducted across 1000 bootstrap trees. We used TreeAnnotator v2.6.7 [51] to summarize the 1000 bootstrap dated trees into a consensus tree, including 95% confidence intervals (CI) for each node. The configuration files of all treePL analyses are provided in the Dryad Digital Repository (https://doi.org/10.5061/dryad.bzkh189g1, accessed on 8 June 2023).
2.8. Ancestral Area Reconstruction
We compiled the distribution information for each Morus species based on Zhou and Gilbert [1], Wunderlin [52], and Plants of the World Online (https://powo.science.kew.org/, accessed on 1 September 2022). Given the extant distribution of Morus and the floristic delineations proposed for Asia [53,54], we delimited four biogeographic regions: (A) Sino-Japan, including most of China, Mongolia, Japan, and Korea; (B) Sino-Himalaya, including the Hengduan Mountains and the Qinghai–Tibet Plateau (i.e., Yunnan, Tibet, and western Sichuan) of China, Bhutan, Nepal, and the Himalayan area of India; (C) Southeast Asia, including Southeast China (i.e., Guangdong, Hainan, and Taiwan), India, Indonesia, Malaysia, Myanmar, Sikkim, and Thailand; and (D) the Americas.
Ancestral area reconstruction was conducted using BioGeoBEARS [55] with unconstrained dispersal routes. The consensus dated tree from the simplified C157 dataset from treePL was used for biogeographic analysis. We tested three biogeographic models (i.e., DEC, DIVALIKE, and BAYAREA) provided by BioGeoBEARS and selected the best-fit model using the log-likelihood (LnL) and AIC values. The probabilities of ancestral range and the number and type of biogeographic events were estimate using the BSM implemented in BioGeoBEARS with 100 replicates under the best model inferred by the LnL and AIC values.
2.9. Ancestral Character State Reconstruction
To explore morphological evolution in Morus, we conducted ancestral reconstruction for three reproductive characters: breeding system, syncarp length, and style length. The morphological characters were collected from Zhou and Gilbert [1], Wunderlin [52], and Berg [56] (Table 1; Table S1). Following Zhou and Gilbert [1] and Koidzumi [2], we scored (1) the breeding system as either monoecy, dioecy, or dioecy and monoecy; (2) the syncarp length as short (equal and less than 2.5 cm) or long (more than 2.5 cm); and (3) the style length as short (equal and less than 2 mm) or long (more than 2 mm). The consensus dated tree from the simplified C157 dataset from treePL was used for ancestral sate reconstruction but was pruned to retain only the sister group of Morus, T. mexicana. Ancestral character states were estimated using the continuous-time Markov chain (Mk) model in phytools v1.0-3 [57].
3. Results
3.1. Characteristics of Datasets and Monophyly of Sampled Species
The two datasets (C157 and C430) varied by gene coverage in each species, taxon coverage, and alignment length of each gene (Supplementary Table S2). In the C157 dataset, the number of recovered genes per species ranged from 25 (B. amazonicus (Berg et al., 18524)) to 157 (M. notabilis C.K.Schneid. (SRR8138828)); the alignment length of each gene ranged from 285 bp to 3159 bp; and the concatenated matrix had 205,046 bp. In the C430 dataset, the number of recovered genes per species ranged from 41 (B. amazonicus (Berg et al., 18524)) to 425 (M. notabilis (SRR8138828)); the alignment length of each gene ranged from 159 bp to 3969 bp; and the concatenated matrix comprised 512,346 bp.
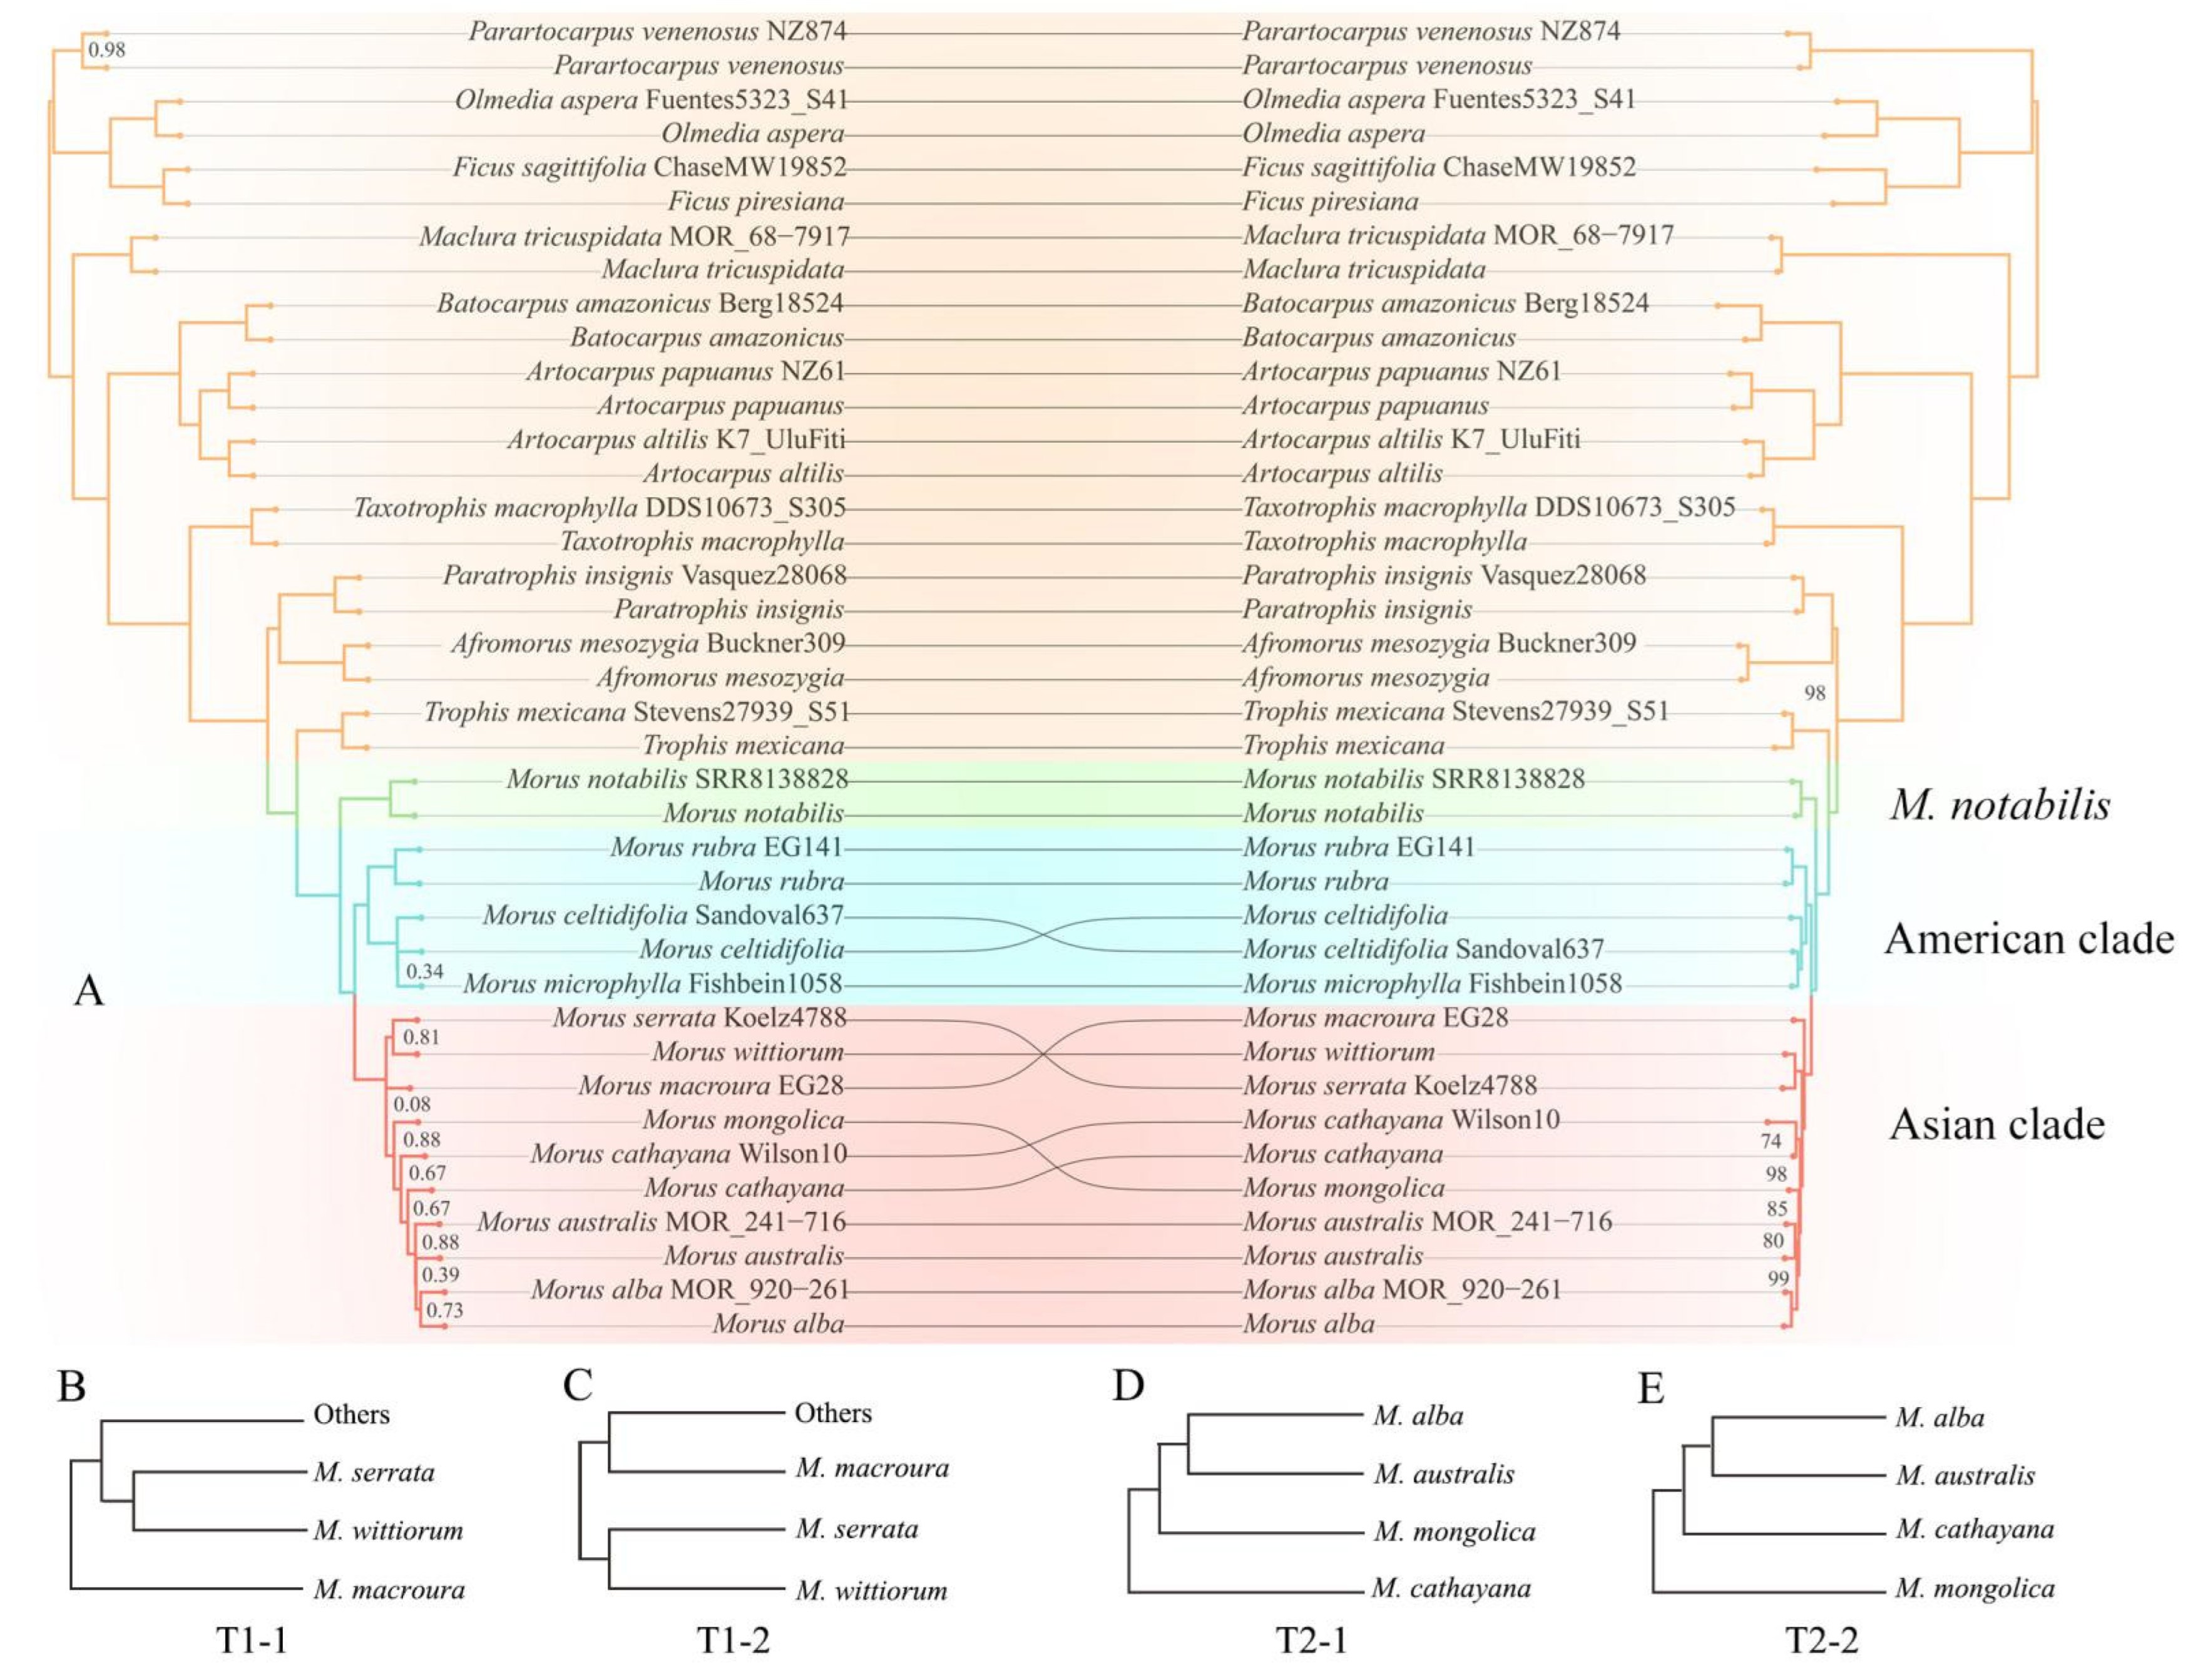
Across the 23 sampled Moraceae species, 16 species (including six species of Morus (M. alba, M. australis Poir., M. cathayana Hemsl., M. celtidifolia Kunth, M. notabilis, and M. rubra L.) and ten outgroup species) were represented by two individuals; these species were each monophyletic except for three Morus species (M. australis, M. cathayana, and M. celtidifolia) that were not monophyletic in certain analyses. The two samples of M. australis were resolved as a sister pair with moderate support in the concatenated ML trees based on the C157 (BS = 80) and C430 matrices (BS = 68; Figure 2 and Figure S2), but were resolved as a grade in both ASTRAL trees (Figure 2 and Figure S2). The two samples of M. cathayana formed a clade with moderate support (BS = 74) in the concatenated ML tree based on the C157 matrix. In contrast, they were resolved as a grade in the concatenated ML tree based on the C430 matrix and the ASTRAL trees of the two datasets (Figure 2 and Figure S2). The two samples of M. celtidifolia did not form a clade in any of the four phylogenetic trees (Figure 2 and Figure S2).
3.2. Phylogenetic Relationships and Discordance
The concatenated and ASTRAL trees based on the two datasets were largely congruent except for several nodes near the tips (Figure 2A and Figure S2). All phylogenetic trees showed a monophyletic Morus as defined by Gardner et al. [5] (BS = 100; LPP = 1), consisting of three major lineages: M. notabilis was fully supported as sister to the American clade + the Asian clade (BS = 100, LPP = 1; Figure 2A and Figure S2). The American clade with full support included three species, with the lineage of M. celtidifolia + M. microphylla Buckley sister to M. rubra (BS = 100, LPP = 1) in all phylogenetic trees of the two datasets.
The identity of the sister lineage to the rest of the Asian clade was a source of conflict among the different trees, involving three species, M. macroura Miq., M. wittiorum, and M. serrata Roxb. The concatenated ML trees based on the two datasets and the ASTRAL tree of the C430 dataset fully supported M. macroura as sister to the rest of the Asian clade (BS = 100, LPP = 1; T1-1, Figure 2B and Figure S2). This topology was supported by the AU test (p = 0.999; Table S3). The ASTRAL tree based on the C157 dataset supported a lineage of M. serrata + M. wittiorum as sister to the rest of the Asian clade (LPP = 0.81; T1-2, Figure 2C and Figure S2). However, that topology T1-2 was not supported by the AU test (p < 0.05; Table S3).
Moreover, the phylogenetic relationships among four additional species (M. cathayana, M. mongolica (Bur.) Schneid., M. australis, and M. alba) in the Asian clade were also a source of conflict among the different trees. The concatenated ML trees of the two datasets both revealed a well-supported topology of (M. cathayana, (M. mongolica, (M. australis, M. alba))) (BS = 97–98; T2-1, Figure 2D and Figure S2), while the two ASTRAL trees both supported a topology of (M. mongolica, (M. cathayana, (M. australis, M. alba))) (LPP = 0.66–1; T2-2, Figure 2E and Figure S22). The AU test failed to reject either of these two conflicting topologies (topology T2-1: p = 0.72; topology T2-2: p = 0.28; Table S3). The polytomy test for the branch connecting M. mongolica and M. cathayana failed to reject the null hypothesis (p > 0.05; Figure S3), indicating that this node can be replaced by a polytomy.
3.3. Coalescent Simulations and Phylogenetic Networks
We plotted the 1000 trees simulated under the coalescent against the ASTRAL tree based on the C157 dataset and found that all nodes within Morus were present in a set of simulated trees (76–889 trees; Figure 3), indicating all topologies were generally within ILS prediction. The observed discordances within the Asian clade of Morus can therefore be explained partly by ILS. For example, topologies T1-1 and T1-2 of M. macroura, M. wittiorum, and M. serrata were supported by 9.6% (Figure S4) and 7.6% (Figure 3) of the simulated trees, respectively. Topologies T2-1 and T2-2 of M. cathayana, M. mongolica, M. australis, and M. alba were supported by 2.6% (Figure S4) and 21.1% (Figure 3) of simulated trees, respectively.
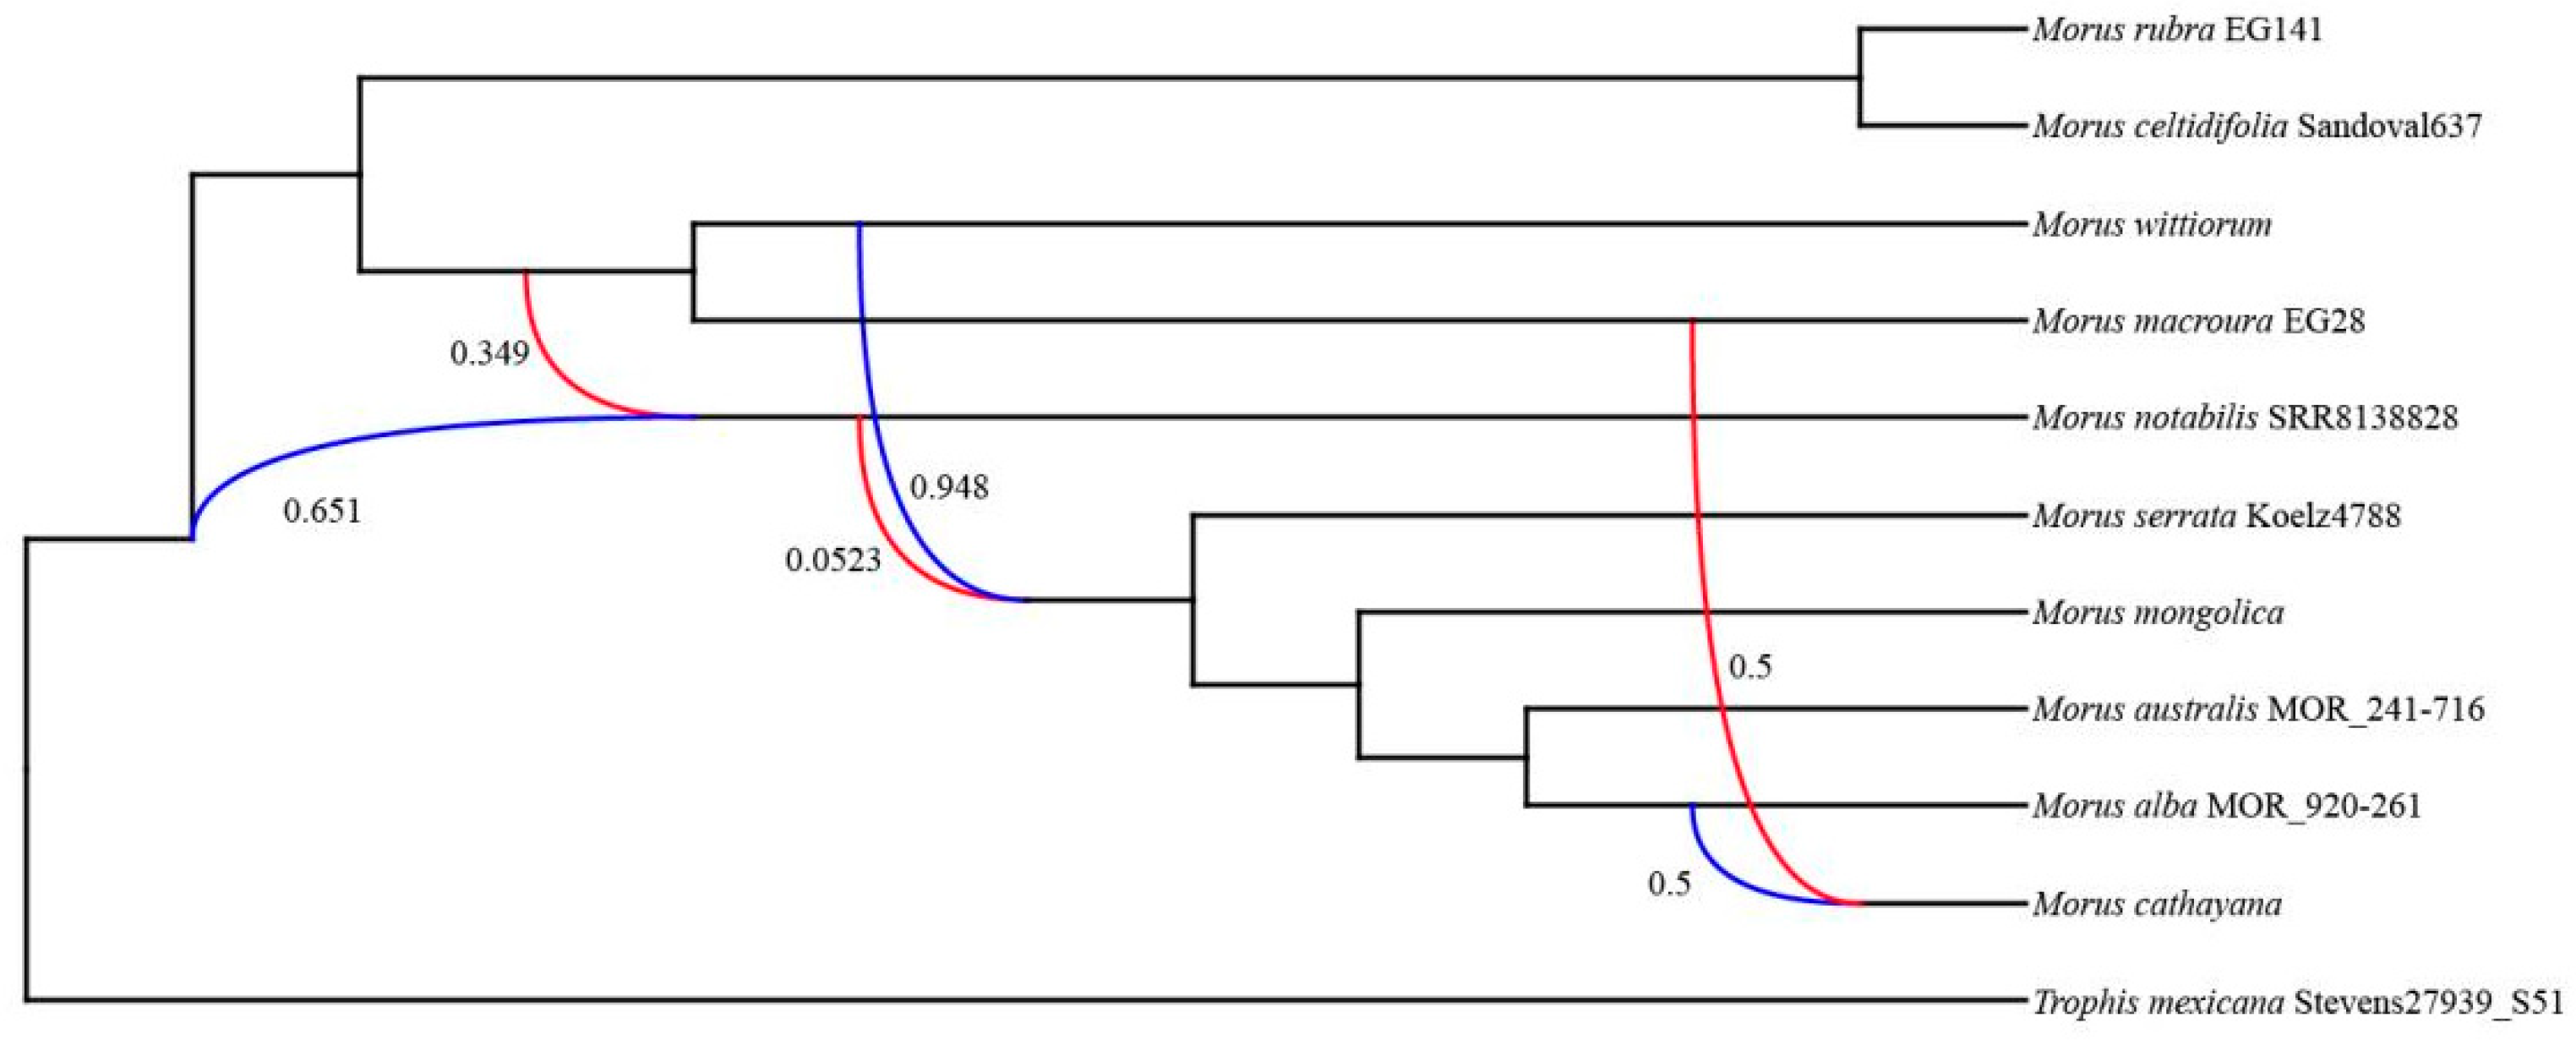
The PhyloNet analyses indicated that Morus had a complex reticulate history (Figure 4). Three hybridization events were detected in the best network of Morus (Figure 4; Table 2). Specifically, the extant M. notabilis was inferred to have gene flow from the ancestor of the Asian clade with a genetic contribution of 0.349 (Figure 4). The ancestor of the clade of M. serrata + M. cathayana + M. mongolica + M. alba + M. australis was inferred to have gene flow from the ancestor of M. notabilis with a small inheritance probability (γ = 0.0523; Figure 4). The third hybridization event was detected within the Asian clade of Morus, where the extant M. cathayana had gene flow from the ancestor of M. macroura with an inheritance probability of 0.5 (Figure 4).
3.4. Divergence Times
The result of divergence time estimation (Figure 5; Table 3) suggests the crown age of Morus is 18.94 Mya (95% CI: 15.17–23.07 Mya). Morus notabilis diverged from the remaining species of Morus at 18.94 Mya (95% CI: 15.17–23.07 Mya). The divergence time was 13.36 Mya (95% CI: 11.04–16.33 Mya) between the American clade and the Asian clade. The crown ages of the American clade and the Asian clade are 8.16 Mya (95% CI: 6.70–10.03 Mya) and 6.92 Mya (95% CI: 6.56–7.36 Mya), respectively.
3.5. Ancestral Area Reconstruction
According to the LnL and AIC values (Table S4), the BAYAREALIKE model (LnL = −25.83, AIC = 55.67) was the best-fit biogeographic model for the simplified C157 dataset (Figure 6). Under the BAYAREALIKE model, the most recent common ancestor (MRCA; i.e., crown node) of Morus was inferred to have originated in a widespread region comprising Sino-Himalaya and the Americas with a low probability (BD: 0.253, ABD: 0.233; Table 3). A local extinction event was inferred to have occurred in the lineage currently represented only by M. notabilis, sister to the rest of Morus, which is currently present only in the Sino-Himalaya region and absent from its ancestral area of the Americas during the early Miocene (Figure 6). An expanded range including Sino-Japan, Sino-Himalaya, and the Americas was reconstructed as the ancestral area for the MRCA of the American clade and the Asian clade (ABD: 0.284, BD: 0.273; Table 3). Following the divergence between the American clade and the Asian clade in the middle Miocene (Figure 6), local extinctions occurred in each of these two geographical clades. The MRCA of the American clade was most likely distributed within the Americas (D: 0.574, BD: 0.205; Table 3). While the Asian clade was most likely distributed within a contracted region including the Sino-Japanese and Sino-Himalayan areas (AB: 0.728, B: 0.115; Table 3). Within the Asian clade, two dispersal events were found to have extended the distribution of Morus to a new region, Southeast Asia, during the late Miocene to the middle Pliocene. The BMS analysis showed that sympatric speciation was the dominant biogeographic events (60.57%) in shaping the diversification of Morus, followed by the anagenetic dispersal events (39.43%).
3.6. Ancestral Character State Reconstruction
The MRCA of Morus was inferred to be dioecious (Figure 7A), with a short syncarp (less than 2.5 cm; Figure 7B), and short or long style length (Figure 7C). We found that these reproductive characters (breeding system, syncarp length, and style length) have one or multiple transition across the phylogeny of Morus. The character states of monoecy and dioecy + monoecy both evolved from a single transition. The transition from dioecious to monoecy occurred in the branch leading to M. cathayana, while the transition from dioecious to dioecy + monoecy occurred in the branch leading to M. celtidifolia. A long syncarp was inferred as a derived state and evolved three times independently, once each in the branch leading to M. notabilis, M. macroura, and M. wittiorum. Due to the similar probabilities of long and short style, the ancestral state of style length is ambiguous for the MRCA of Morus, yet only three extant species (M. australis, M. mongolica, and M. notabilis) have a long style.
4. Discussion
4.1. Further Clarification of Species Delimitation in Morus
Shifting species concepts and cryptic characters separating species can make identification of Morus specimens difficult. Determinations found on herbarium specimens must therefore be treated with caution. Upon re-examining the specimens sequenced by Gardner et al. [5], we found four of them to warrant re-determination. Specimens of M. cathayana (Nie, 92144; Figure S1E), M. kagayamae Koidz. (AA20187-A; Figure S1G), M. mongolica (Gardner, MOR 55-95*1; Figure 1V), and M. nigra (Gardner, 29; Figure S1K) were all re-identified as M. alba, although the characters of Gardner 29 are somewhat intermediate between M. alba and M. nigra. We note that the problem of misidentification extends particularly to living collections, as the latter two of these (Gardner, MOR 55-95*1 and Gardner, 29) came from trees cultivated in botanic gardens. Following these re-determinations, the sampling employed by Gardner et al. [5] did not contain any samples of M. indica L., M. kagayamae, or M. mongolica, and contained only one of M. cathayana.
While comprehensive species delimitation lies outside the scope of this study and the sampling employed here, our results, combined with morphological observations, nevertheless provide some insight into which species are likely distinct and which require further investigation with intensive sampling. Three species (M. alba, M. notabilis, and M. rubra) with two samples each were monophyletic in the current study (Figure 2A and Figure S2), and two more, M. macroura and M. serrata, were monophyletic with at least two samples each in Gardner et al. [5]. These species all have unique identifying traits (Table S1) and appear to be distinct species. Two additional species (M. australis and M. cathayana) were monophyletic in certain analyses but not in others (also in Gardner et al. [5] for M. australis); while these species certainly warrant further investigation with more intensive sampling, their clear and consistent diagnostic characters support the suggestion that they are coherent species. Morus microphylla represented by two samples did not form a clade in Gardner et al. [5] because M. celtidifolia was nested within them. Meanwhile, two samples of M. celtidifolia in the current study did not form a clade because M. microphylla was nested within them. These two species (M. celtidifolia and M. microphylla) share similar morphological traits including leaf blades sometimes 3–5-lobed and female flowers with 0–0.2 mm styles (Figure S1; Table S1). We therefore follow Berg [56] in considering M. microphylla a synonym of M. celtidifolia. We note, however, that Nepal and Purintun [4] considered them distinct, separating them on the basis of leaf size, shape, and indumentum, habit, and infructescence size—differences no less substantial than those that separate some other species. Further study with increased sampling is therefore warranted for this complex.
Only one sample each of M. mongolica, M. nigra, and M. wittiorum was included in the current study or previous studies [4,13]. Nevertheless, on the basis of their unique identifying traits (Table 1), we consider them distinct species. The leaf margins of M. mongolica are serrated and have long or short spines on their teeth [1], making this species easy to distinguish from other Morus species. Morus nigra is native to western Iran and is now cultivated globally for its delicious and valuable fruits. The diagnostic feature of M. nigra is its abaxially pubescent leaf [1] (Table S1), and this species should also be a distinct species. In addition, Morus wittiorum can be identified by its leaf margin, which is either subentire or has teeth only at the apex [1].
Five species of Morus have not been sampled in any molecular phylogenetic study. Morus boninensis is an endemic species of the Bonin (Ogasawara) Islands, Japan, which is characterized by its long styles and glabrous leaf blades [58] (Table S1). Morus liboensis is an endemic species of Libo County, China, which is distinguished from M. wittiorum by its short styles and syncarps of 2.5–3.7 cm [59] (Table S1). Morus trilobata is an endemic species of Kaili County, China, and was first published as a variety of M. australis [59]. Cao [60] recognized it as a distinct species because it has entire leaf margins, long female inflorescences (2–4 cm), and short styles (Table S1), clearly distinguishing it from M. australis. These above three species should be distinct species based on their distinct morphological traits (Table S1).
Morus kagayamae was considered indistinguishable from M. australis [61] and was even treated as a synonym of the latter [4]. The diagnostic features of M. kagayamae include its female flowers with long styles and its leaf margins with sharp acuminate teeth [58] (Table S1); based on these characters this species may be distinctive and warrants further investigation. Morus koordersiana was listed by Gardner et al. [5] with a note that it might be synonymous with M. macroura. Specimens (Plasschaert, Sept. 1913, P (P06759968, P06759969, P06759970, P06759974; https://science.mnhn.fr/institution/mnhn/collection/p/list, accessed on 1 September 2022)) initially identified as M. macroura by S. H. Koorders and T. Valeton [8] later became the basis for J.F. Leroy’s new species, M. koordersiana, which he separated with some “hesitation” based on its longer syncarp, weaker indumentum, and more orbicular leaves with a more consistent margin [8]. We examined images of the specimens and found them consistent with the expected variation found in the widespread M. macroura; we therefore provisionally consider M. koordersiana as a synonym of M. macroura.
Another controversial species, Morus indica, has been considered a variety of M. alba [7,62]. This variety (M. alba var. indica) was treated as a synonym of M. australis by Zhou and Gilbert [1] and Nepal and Purintun [4]. Morus indica can be distinguished by the fine indumentum on the abaxial leaf surface. We note, however, that the putative example of M. indica sequenced by Gardner et al. [5], which was sister to the rest of the M. alba clade and subsequently re-determined as M. cf. alba, shows some leaf characters that might be considered intermediate between the two species. It therefore warrants additional investigation.
4.2. Phylogenetic Relationships
Until recently, Morus s.l. was non-monophyletic [4,13] with the inclusion of M. mesozygia and M. insignis. A monophyletic Morus s.s. was recognized by Gardner et al. [5] by excluding M. mesozygia (= A. mesozygia) and M. insignis (= P. insignis), which is supported by our phylogenetic results. Consistent with previous molecular phylogenetic studies [5,63], our study also supported Morus as a member of tribe Moreae, and sister to Trophis.
The molecular phylogenetic study of Nepal and Ferguson [13] resolved subg. Morus into an Asian clade and a North American clade, which is largely supported in the current study. However, the Asian M. notabilis sampled in Nepal and Ferguson [13] was incorrectly identified [64]. The current study and Gardner et al. [5] sampled M. notabilis, and both found support for it as sister of the remaining species of Morus. Morus notabilis is distributed in Yunnan and Sichuan provinces of China and is distinguished from other Morus species by its orbicular leaves, female flowers with long styles, and long syncarps (Figure 1; Table S1). This species has 14 chromosomes [65,66], but haplotype of a certain individual has six chromosomes [67] (due to mitotic chromosomes 5 and 7 fused to form meiotic chromosome 5, detailed in Xuan et al. [67]), compared to other Morus species with 28 (e.g., M. alba [68], M. rubra [69]), 84 (e.g., M. serrata [70]), or even 308 (e.g., M. nigra [71]) chromosomes (Table S1). Xuan et al. [67] inferred that chromosomal fission/fusion events resulted in the different basic chromosome numbers between M. notabilis and M. alba. We speculate the chromosomal fission/fusion events triggered the divergence between the ancestor of M. notabilis and the ancestor of the other Morus species.
The American clade has been supported in previous studies (e.g., Nepal and Purintun [4]; Gardner et al. [5]; Nepal and Ferguson [13]) and comprises two species: M. rubra, which is distributed in the temperate region from Southeast Canada to Central and eastern U.S.A., and M. celtidifolia, which is found in the tropical region from Mexico to Bolivia. Morus rubra is distinguished from M. celtidifolia by its larger, abaxially pubescent leaf and its more compactly arranged fruiting perianths, while M. celtidifolia has leaves that are abaxially pubescent only along the veins and fruiting perianths arranged loosely in the syncarps.
All previous and our current molecular phylogenetic studies have included some species of the Asian clade. Phylogenetic studies using ITS and trnL-trnF [4,13] have poorly resolved the interspecific relationships among seven sampled species of the Asian clade. Our study and Gardner et al. [5] using large numbers of nuclear loci largely resolved consistent topologies despite some nodes obtaining only moderate support; however, only seven and five species were sampled in these two studies. Furthermore, the phylogenetic relationships among M. cathayana, M. mongolica, and a lineage comprising M. alba and M. australis remained unresolved in the current study, with two different topologies inferred in the concatenated ML tree and the ASTRAL tree.
Our analyses suggested that both reticulation events and to some extant ILS may have been involved in the diversification of the two Asian clades. Hybridization between Morus species has been frequently reported (e.g., Das and Krishaaswami [10]; Burgess et al. [11]; Muhonja et al. [12]). Our phylogenetic network analysis reveals three reticulation events in Morus. In particular, the possible hybrid origin of M. cathayana may be responsible for the difficulty in resolving the phylogenetic position of this species. Furthermore, extensive ILS in the Asian clade may be another main reason for the poorly resolved relationships of this clade. All putative species should be included to fully resolve the phylogenetic relationships of this clade and explore the hybridization events within Morus.
Life history and morphological characters including breeding system, syncarp length, and style length have been commonly used to identify Morus species (e.g., Zhou and Gilbert [1]; Koidzumi [2]; Chang et al. [3]). We reconstructed the ancestral states of these three morphological characters, and the results indicated that the common ancestor of Morus was dioecious (Figure 7A), had short syncarps (Figure 7B), and had short or long styles (Figure 7C). The transition from dioecy to monoecy and dioecy + monoecy occurred one time, respectively. The transitions from short syncarp to long syncarp occurred three times. The two sections (sect. Macromorus and sect. Dolichostylae) established by Koidzumi [2] based on the length of styles are non-monophyletic. None of these characters is synapomorphic for either the American clade or the Asian Clade.
4.3. Biogeographic History
Our biogeographic analysis indicated that Morus had split from its sister group, Trophis, at the Oligocene-Eocene boundary in one of three regions of the Sino-Himalayan region, the Sino-Japanese region, and the Americas (Figure 6). The crown ancestor of Morus was inferred to be in the Sino-Himalayan region or the Americas, which then diversified into three distinct lineages with range expansion further into the Sino-Japanese region and Southeast Asia since the middle Miocene (Figure 6).
The Asian-North American disjunction of Morus could be the remnant of once widely developed temperate forests during the Tertiary (e.g., Xiang et al. [14]; Wen [15]; Boufford and Spongberg [18]). In the early Tertiary, a “boreotropical” flora was suggested to be widespread in the Northern Hemisphere [72,73]. The “boreotropical” flora could exchange floristic elements between Asia and North America via the Bering Land Bridge (BLB) and between Europe and North America via the North Atlantic Land Bridge (NALB) beginning in the late Eocene [74]. After the mid-Tertiary, the “boreotropical” flora gradually developed into a “mixed mesophytic forest” [18,75]. Many taxa in the forest became extinct in western North America and western Europe during the late Tertiary and Quaternary [14,15,76]. Morus might have originated as part of the “boreotropical” flora and diversified during the rise in the “mixed mesophytic forest” and formed a wide distribution in the Northern Hemisphere. The extensive local extinction events (Figure 6) that took place since the early Miocene—including those occurring following the divergence of M. notabilis and the rest of Morus, the split of the Asian and American clades, as well as the separation of eastern Asia and western Asia—may have resulted from the fragmentation of the “mixed mesophytic forest”. Multiple Morus fossil fruits and leaves from the late Eocene to the late Neogene (Table S5) have been found in high latitude regions of Eurasia, indicating a great reduction in the distribution of Morus species toward the present.
The Sino-Japanese Floristic Region has received wide attention due to its extremely high temperate species diversity [75,77,78]. It was a significant glacial refuge for temperate plants during the Quaternary Ice Age [78]. The extensive climate and physiographical heterogeneity, combined with the lack of major Quaternary glaciations, may lead to the exceptional species diversity in this region [77,78]. It is the center of diversity for Morus, and hosts nine of the 16 recognized species.
Morus experienced two southward dispersals to Southeast Asia from the Sino-Himalayan and Sino-Japanese regions during the late Miocene to the middle Pliocene. The uplift of Thai-Malay peninsula, Sumatra, and Java along the Barisan Mountains supplied a potential channel for the two dispersals [79,80]. Multiple plant taxa show southward migrations during this period (e.g., Jin et al. [16]). Give that Morus species have colorful and juicy syncarps that are frequently eaten by birds [81,82], long-distance dispersals via birds may have facilitated these two migrations.
5. Conclusions
In this study, we used new and previous data to build phylogenetic trees, providing a basis for studying the biogeographic history of this genus. The phylogenetic relationships within Morus were generally well supported; however, some nodes of the Asian clade only had moderate support. We inferred that both reticulation events and ILS may have contributed to the unresolved phylogenetic position of M. cathayana. We traced the origin of the Morus crown back to the early Miocene period, and the disjunct distribution of this genus was inferred to represent remnants of the once widespread Tertiary temperate forests. This finding corresponds with the rich fossil records of Morus in the Northern Hemisphere since the late Eocene. Moreover, several dispersal events likely led to the establishment of Morus in the Sino-Japanese region and Southeast Asia.
Supplementary Materials
The following supporting information can be downloaded at: https://www.mdpi.com/article/10.3390/agronomy13082021/s1, Figure S1. Images of Morus specimens from herbaria. Collector and collection number are listed in brackets. A, M. alba (A. C. Sanders, 13809); B, M. australis (M. Ono and S. Kobayashi, 123507); C, M. cathayana (Gaoligong Shan Biodiversity Survey, 19616); D, M. cathayana (Nie Min-Xiang, 92144); E, M. cathayana (E. M. Wilson, 10); F, M. celtidifolia (Juan Calzada, 20974); G. M. celtidifolia (Sandoval and Gutierrez, 637); H, M. kagayamae Koidz. (AA20187-A); I, M. macroura (Gardner, 28); J, M. microphylla (Fishbein et al., 1058); K, M. mongolica (Liu Xin-Yuan, 5257); L, M. nigra (Gardner, 29); M, M. notabilis (Gaoligong Shan Biodiversity Survey, 29353); N, M. rubra (Steven R. Hill, 36694); O, M. serrata (Koelz, 4788); P, M. wittiorum (Zhang Wei). Figure S2. The ASTRAL tree (left) and concatenated ML tree (right) of Morus based on the C430 matrix. Figure S3. Result of the polytomy test based on the simplified C157 matrix. Figure S4. The result of coalescent simulations with 1000 trees simulated under the coalescent mapped against the concatenated ML tree of the C157 dataset. The numbers near the branches indicate the number of simulated trees that are concordant (above) and discordant (below) with a given branch. The pie chart at each node indicates the proportion of simulated trees that are concordant (blue) with a given node, support a dominant alternative topology (green), and support the remaining alternative topologies (red). Table S1. Diagnostic features, number of chromosomes, and distribution of Morus. Table S2. Characteristics of all datasets for reconstructing the phylogeny of Morus. Table S3. Results of the AU tests for two sets of discordant topologies. Table S4. LnL and AIC values of biogeographic models. Table S5. Fossil record of Morus.
Author Contributions
C.-X.Y. and T.-S.Y. designed the paper. C.-X.Y. performed the data analysis and wrote the manuscript with the support of T.-S.Y. R.A.F. designed the HybSeq100 probes. D.E.S., G.W.S., H.R.K., Q.T., R.A.F., R.P.G., S.-Y.L., T.-S.Y. and P.S.S. collected the plant material and extracted the total DNA. D.E.S., H.R.K., R.A.F., R.P.G. and P.S.S. contributed to the sequencing. D.E.S., E.M.G., G.W.S., N.J.C.Z., P.S.S., Q.L., R.A.F., R.P.G., S.-Y.L., T.-S.Y., W.G. and Y.-H.W. revised the manuscript. All authors have read and agreed to the published version of the manuscript.
Funding
This research was supported by the National Natural Science Foundation of China, key international (regional) cooperative research project (No. 31720103903), the Strategic Priority Research Program of Chinese Academy of Sciences (No. XDB31000000), the Science and Technology Basic Resources Investigation Program of China (No. 2019FY100900), the National Natural Science Foundation of China (No. 31270274), the Yunling International High-end Experts Program of Yunnan Province, China (No. YNQR-GDWG-2017-002 and No. YNQR-GDWG-2018-012), the CAS President’s International Fellowship Initiative (No. 2020PB0009), the China Postdoctoral Science Foundation (CPSF) International Postdoctoral Exchange Program, and the CAS Special Research Assistant Project. This work was also supported in part by USA Department of Energy grant DE-SC0018247.
Data Availability Statement
Raw sequence data are available at the NCBI Sequence Read Archive (BioProject: PRJNA980892). The configuration file aligned DNA sequences and trees are available on Dryad Digital Repository: https://doi.org/10.5061/dryad.bzkh189g1.
Acknowledgments
We are grateful to the following institutes for providing specimens or silica-dried materials: Herbarium of Kunming Institute of Botany, Chinese Academy of Sciences (KUN); the Germplasm Bank of Wild Species and Molecular Biology Experiment Center, Kunming Institute of Botany, Chinese Academy of Sciences; the herbarium of the California Academy of Sciences (CAS); the Chicago Botanic Garden (CHIC); the Field Museum (F); the Royal Botanic Gardens, Kew (K); the Missouri Botanical Garden (MO); the Morton Arboretum (MOR); the US National Tropical Botanical Garden (PTBG); the New York Botanical Garden (NY); the Ohio State University Herbarium (OS); the Sandakan Herbarium, Forest Research Centre (SAN); and the University of Texas Herbarium (TEX). We are also grateful to Jia-Jin Wu for help with sampling; to Hua-Feng Wang, Diego F. Morales-Briones, Nelson Zamora Villalobos, Rong Zhang, Hui Liu, Si-Yun Chen, Xiao-Gang Fu, Ying-Ying Yang, and Henrique Borges Zamengo for their generous technical support and necessary assistance; to Gretta Buttelmann for assistance in identifying specimens; and to the iFlora High Performance Computing Center of the Germplasm Bank of Wild Species (iFlora HPC Center of GBOWS, KIB, CAS) for computing. We appreciate the photos provided by Jie Cai of the Germplasm Bank of Wild Species, Kunming Institute of Botany, Chinese Academy of Sciences, Qin Tian (SFU) of the Southwest Forestry University, Qin-Wen Lin of the Institute of Botany, Chinese Academy of Sciences, Si-Yu Zhang of the Anhui Normal University, and Xin-Xin Zhu of Xinyang Normal University.
Conflicts of Interest
The authors declare no conflict of interest.
References
- Zhou, Z.K.; Gilbert, M.G. Moraceae. In Flora of China; Wu, Z.Y., Raven, P.H., Hong, D.Y., Eds.; Missouri Botanical Garden Press: St. Louis, MO, USA; Science Press: Beijing, China, 2003; Volume 5, pp. 22–26. [Google Scholar]
- Koidzumi, G. Taxonomy and phytogeography of the genus Morus. Bull. Sericultural Exp. Stn. 1917, 3, 1–61. [Google Scholar]
- Chang, S.S.; Wu, C.Y.; Cao, Z.Y. Moraceae. In Flora Reipublicae Popularis Sinicae; Chang, S.S., Wu, C.Y., Eds.; Science Press: Beijing, China, 1998; Volume 23, pp. 6–23. [Google Scholar]
- Nepal, M.P.; Purintun, J.M. Systematics of the genus Morus L. (Moraceae) taxonomy, phylogeny and potential responses to climate change. In Mulberry: Genetic Improvement in Context of Climate Change; Razdan, M.K., Thomas, D.T., Eds.; The CRC Press: Boca Raton, FL, USA, 2021; pp. 2–20. [Google Scholar]
- Gardner, E.M.; Garner, M.; Cowan, R.; Dodsworth, S.; Epitawalage, N.; Arifiani, D.; Sahromi; Baker, W.J.; Forest, F.; Maurin, O.; et al. Repeated parallel losses of inflexed stamens in Moraceae: Phylogenomics and generic revision of the tribe Moreae and the reinstatement of the tribe Olmedieae (Moraceae). Taxon 2021, 70, 946–988. [Google Scholar] [CrossRef]
- Linnaeus, C. Morus. Species Plant. 1753, 2, 968. [Google Scholar]
- Bureau, E. Moraceae. Prodromus Syst. Nat. Regni Veg. 1873, 17, 211–279. [Google Scholar]
- Leroy, J.F. Contribution a l’étude des Monochlamydees: Documents nouveaus sur des plantes de Madagascar, de Sumatra et de Colombie. Bull. Mus. Hist. Nat. Paris 1949, 21, 725–732. [Google Scholar]
- Hotta, T. Fundamentals of Morus plants classification. Kinugasa Sanpo 1954, 390, 13–21. [Google Scholar]
- Das, B.C.; Krishaaswami, S. Some observations on interspecific hybridization in mulberry. Indian J. Seric. 1965, 4, 1–4. [Google Scholar]
- Burgess, K.S.; Morgan, M.; Husband, B.C. Interspecific seed discounting and the fertility cost of hybridization in an endangered species. New Phytol. 2008, 177, 276–284. [Google Scholar] [CrossRef]
- Muhonja, L.; Yamanouchi, H.; Yang, C.C.; Kuwazaki, S.; Yokoi, K.; Kameda, T.; Sezutsu, H.; Jouraku, A. Genome-wide SNP marker discovery and phylogenetic analysis of mulberry varieties using double-digest restriction site-associated DNA sequencing. Gene 2020, 726, 144162. [Google Scholar] [CrossRef]
- Nepal, M.P.; Ferguson, C.J. Phylogenetics of Morus (Moraceae) inferred from ITS and trnL-trnF sequence data. Syst. Bot. 2012, 37, 442–450. [Google Scholar] [CrossRef]
- Xiang, Q.-Y.; Soltis, D.E.; Soltis, P.S. The Eastern Asian and Eastern and Western North American Floristic Disjunction: Congruent Phylogenetic Patterns in Seven Diverse Genera. Mol. Phylogenet. Evol. 1998, 10, 178–190. [Google Scholar] [CrossRef] [PubMed]
- Wen, J. Evolution of Eastern Asian and Eastern North American Disjunct Distributions in Flowering Plants. Annu. Rev. Ecol. Syst. 1999, 30, 421–455. [Google Scholar] [CrossRef]
- Jin, J.J.; Yang, M.Q.; Fritsch, P.W.; Velzen, R.; Li, D.Z.; Yi, T.S. Born migrators: Historical biogeography of the cosmopolitan family Cannabaceae. J. Syst. Evol. 2019, 58, 461–473. [Google Scholar] [CrossRef]
- Gaynor, M.L.; Fu, C.N.; Gao, L.M.; Lu, L.M.; Soltis, D.E.; Soltis, P.S. Biogeography and ecological niche evolution in Diapensiaceae inferred from phylogenetic analysis. J. Syst. Evol. 2020, 58, 646–662. [Google Scholar] [CrossRef]
- Boufford, D.E.; Spongberg, S.A. Eastern Asian-Eastern North American Phytogeographical Relationships—A History from the Time of Linnaeus to the Twentieth Century. Ann. Mo. Bot. Gard. 1983, 70, 423. [Google Scholar] [CrossRef]
- Williams, E.W.; Gardner, E.M.; Harris, R.; Chaveerach, A.; Pereira, J.; Zerega, N.J.C. Out of Borneo: Biogeography, phylogeny and divergence date estimates of Artocarpus (Moraceae). Ann. Bot. 2017, 119, 611–627. [Google Scholar] [CrossRef] [PubMed]
- Zerega, N.J.; Clement, W.L.; Datwyler, S.L.; Weiblen, G.D. Biogeography and divergence times in the mulberry family (Moraceae). Mol. Phylogenet. Evol. 2005, 37, 402–416. [Google Scholar] [CrossRef]
- Doyle, J.; Doyle, J. Genomic plant DNA preparation from fresh tissue-CTAB method. Phytochem. Bull. 1987, 19, 11–15. [Google Scholar]
- Folk, R.A.; Kates, H.R.; LaFrance, R.; Soltis, D.E.; Soltis, P.S.; Guralnick, R.P. High-throughput methods for efficiently building massive phylogenies from natural history collections. Appl. Plant Sci. 2021, 9, e11410. [Google Scholar] [CrossRef]
- Kates, H.R.; O’Meara, B.C.; LaFrance, R.; Stull, G.W.; James, E.K.; Conde, D.; Liu, S.Y.; Tian, Q.; Yi, T.S.; Kirst, M.; et al. Two shifts in evolutionary lability underlie independent gains and losses of root-nodule symbiosis in a single clade of plants. bioRxiv 2022. [Google Scholar] [CrossRef]
- Fu, X.G.; Liu, S.Y.; van Velzen, R.; Stull, G.W.; Tian, Q.; Li, Y.X.; Folk, R.A.; Guralnick, R.P.; Kates, H.R.; Jin, J.J.; et al. Phylogenomic analysis of the hemp family (Cannabaceae) reveals deep cyto-nuclear discordance and provides new insights into generic relationships. J. Syst. Evol. 2022. [Google Scholar] [CrossRef]
- Liu, S.Y.; Yang, Y.Y.; Tian, Q.; Yang, Z.Y.; Li, S.F.; Valdes, P.J.; Farnsworth, A.; Kates, H.R.; Siniscalchi, C.M.; Guralnick, R.P.; et al. Phylogenomic analyses reveal widespread gene flow during the early radiation of oaks and relatives (Fagaceae: Quercoideae). bioRxiv 2023. [CrossRef]
- Bolger, A.M.; Lohse, M.; Usadel, B. Trimmomatic: A flexible trimmer for Illumina sequence data. Bioinformatics 2014, 30, 2114–2120. [Google Scholar] [CrossRef] [PubMed]
- Johnson, M.G.; Gardner, E.M.; Liu, Y.; Medina, R.; Goffinet, B.; Shaw, A.J.; Zerega, N.J.C.; Wickett, N.J. HybPiper: Extracting coding sequence and introns for phylogenetics from high-throughput sequencing reads using target enrichment. Appl. Plant Sci. 2016, 4, 1600016. [Google Scholar] [CrossRef] [PubMed]
- Katoh, K.; Standley, D.M. MAFFT Multiple Sequence Alignment Software Version 7: Improvements in Performance and Usability. Mol. Biol. Evol. 2013, 30, 772–780. [Google Scholar] [CrossRef]
- Baker, W.J.; Bailey, P.; Barber, V.; Barker, A.; Bellot, S.; Bishop, D.; Botigué, L.R.; Brewer, G.; Carruthers, T.; Clarkson, J.J.; et al. A Comprehensive Phylogenomic Platform for Exploring the Angiosperm Tree of Life. Syst. Biol. 2022, 71, 301–319. [Google Scholar] [CrossRef]
- Huerta-Cepas, J.; Serra, F.; Bork, P. ETE 3: Reconstruction, Analysis, and Visualization of Phylogenomic Data. Mol. Biol. Evol. 2016, 33, 1635–1638. [Google Scholar] [CrossRef]
- Capella-Gutierrez, S.; Silla-Martinez, J.M.; Gabaldon, T. trimAl: A tool for automated alignment trimming in large-scale phylogenetic analyses. Bioinformatics 2009, 25, 1972–1973. [Google Scholar] [CrossRef]
- Zerega, N.J.; Gardner, E.M. Delimitation of the new tribe Parartocarpeae (Moraceae) is supported by a 333-gene phylogeny and resolves tribal level Moraceae taxonomy. Phytotaxa 2019, 388, 253–265. [Google Scholar] [CrossRef]
- Johnson, M.G.; Pokorny, L.; Dodsworth, S.; Botigué, L.R.; Cowan, R.S.; Devault, A.; Eiserhardt, W.L.; Epitawalage, N.; Forest, F.; Kim, J.T.; et al. A Universal Probe Set for Targeted Sequencing of 353 Nuclear Genes from Any Flowering Plant Designed Using k-Medoids Clustering. Syst. Biol. 2019, 68, 594–606. [Google Scholar] [CrossRef]
- Stamatakis, A. RAxML version 8: A tool for phylogenetic analysis and post-analysis of large phylogenies. Bioinformatics 2014, 30, 1312–1313. [Google Scholar] [CrossRef] [PubMed]
- Mirarab, S.; Reaz, R.; Bayzid, M.S.; Zimmermann, T.; Swenson, M.S.; Warnow, T. ASTRAL: Genome-scale coalescent-based species tree estimation. Bioinformatics 2014, 30, i541–i548. [Google Scholar] [CrossRef] [PubMed]
- Shimodaira, H. An Approximately Unbiased Test of Phylogenetic Tree Selection. Syst. Biol. 2002, 51, 492–508. [Google Scholar] [CrossRef] [PubMed]
- Shimodaira, H.; Hasegawa, M. CONSEL: For assessing the confidence of phylogenetic tree selection. Bioinformatics 2001, 17, 1246–1247. [Google Scholar] [CrossRef] [PubMed]
- Sayyari, E.; Mirarab, S. Testing for Polytomies in Phylogenetic Species Trees Using Quartet Frequencies. Genes 2018, 9, 132. [Google Scholar] [CrossRef]
- García, N.; Folk, R.A.; Meerow, A.W.; Chamala, S.; Gitzendanner, M.A.; de Oliveira, R.S.; Soltis, D.E.; Soltis, P.S. Deep reticulation and incomplete lineage sorting obscure the diploid phylogeny of rain-lilies and allies (Amaryllidaceae tribe Hippeastreae). Mol. Phylogenet. Evol. 2017, 111, 231–247. [Google Scholar] [CrossRef]
- Wang, H.X.; Morales-Briones, D.F.; Moore, M.J.; Wen, J.; Wang, H.F. A phylogenomic perspective on gene tree conflict and character evolution in Caprifoliaceae using target enrichment data, with Zabelioideae recognized as a new subfamily. J. Syst. Evol. 2021, 59, 897–914. [Google Scholar] [CrossRef]
- Mirarab, S.; Bayzid, S.; Boussau, B.; Warnow, T. Statistical binning enables an accurate coalescent-based estimation of the avian tree. Science 2014, 346, 1250463. [Google Scholar] [CrossRef]
- Smith, S.A.; Moore, M.J.; Brown, J.W.; Yang, Y. Analysis of phylogenomic datasets reveals conflict, concordance, and gene du-plications with examples from animals and plants. BMC Ecol. Evol. 2015, 15, 1–15. [Google Scholar]
- Than, C.; Ruths, D.; Nakhleh, L. PhyloNet: A software package for analyzing and reconstructing reticulate evolutionary relationships. BMC Bioinform. 2008, 9, 322. [Google Scholar] [CrossRef]
- Yu, Y.; Degnan, J.H.; Nakhleh, L. The Probability of a Gene Tree Topology within a Phylogenetic Network with Applications to Hybridization Detection. PLoS Genet. 2012, 8, e1002660. [Google Scholar] [CrossRef]
- Zhang, Q.; Onstein, R.E.; Little, S.A.; Sauquet, H. Estimating divergence times and ancestral breeding systems in Ficus and Moraceae. Ann. Bot. 2019, 123, 191–204. [Google Scholar] [CrossRef] [PubMed]
- Mehrotra, R.; Prakash, U.; Bande, M. Fossil woods of Lophopetalum and Artocarpus from the Deccan Intertrappean beds of Mandla District, Madhya Pradesh, India. J. Palaeosci. 1984, 32, 310–320. [Google Scholar] [CrossRef]
- Chandler, M.E.J. The Lower Tertiary Floras of Southern England: Flora of the Pipe-Clay 29 Series of Dorset (Lower Bagshot); British Museum: London, UK, 1962; pp. 1–169. [Google Scholar]
- Collinson, M.E. The fossil history of the Moraceae, Urticaceae (including Cecropiaceae), and Cannabaceae. In Evolution, Sys-tematics, and Fossil History of the Hamamelidae. Systematics Association Special; Crane, P.R., Blackmore, S., Eds.; Clarendon Press: Oxford, UK, 1989; Volume 40B, pp. 319–339. [Google Scholar]
- Smith, S.A.; O’Meara, B.C. TreePL: Divergence time estimation using penalized likelihood for large phylogenies. Bioinformatics 2012, 28, 2689–2690. [Google Scholar] [CrossRef]
- Maurin, K.J.L. An empirical guide for producing a dated phylogeny with treePL in a maximum likelihood framework. arXiv 2020, arXiv:2008.07054. [Google Scholar]
- Bouckaert, R.; Heled, J.; Kühnert, D.; Vaughan, T.; Wu, C.-H.; Xie, D.; Suchard, M.A.; Rambaut, A.; Drummond, A.J. BEAST 2: A Software Platform for Bayesian Evolutionary Analysis. PLoS Comput. Biol. 2014, 10, e1003537. [Google Scholar] [CrossRef]
- Wunderlin, R.P. Moraceae. In Flora of North America North of Mexico; Flora of North America Editorial Committee, Ed.; Oxford University Press: New York, NY, USA, 1997; Volume 3, pp. 390–392. [Google Scholar]
- Wu, Z.Y.; Wu, S.G. A Proposal for a new floristic kingdom (realm)—The E. Asiatic Kingdom, its delineation and characteristics. In Floristic Characteristics and Diversity of East Asian Plants; Zhang, A.L., Wu, S.G., Eds.; China Higher Education: Beijing, China, 1996; pp. 3–42. [Google Scholar]
- Wu, Z.Y.; Sun, H.; Zhou, Z.K. Floristics of Seed Plants from China; Science Press: Beijing, China, 2005; pp. 71–105. [Google Scholar]
- Matzke, N.J. BioGeoBEARS: BioGeography with Bayesian (and likelihood) evolutionary analysis with R scripts. Version 1.1.1. GitHub 2018. [Google Scholar] [CrossRef]
- Berg, C.C. Moreae, Artocarpeae, and Dorstenia (Moraceae), with introductions to the family and Ficus and with additions and corrections to Flora Neotropica Monograph 7. Flora Neotrop. 2001, 83, 1–346. [Google Scholar]
- Revell, L.J. phytools: An R package for phylogenetic comparative biology (and other things). Methods Ecol. Evol. 2011, 3, 217–223. [Google Scholar] [CrossRef]
- Iwatsuki, K.; Boufford, D.E.; Ohba, H. Flora of Japan; Kodansha Ltd.: Tokyo, Japan, 2006; Volume IIa, pp. 74–76. [Google Scholar]
- Chang, S.S. New Taxa of Moraceae from China and Vietnam. Acta Phytotaxon. Sin. 1984, 22, 64–76. [Google Scholar]
- Cao, Z.Y. New taxa of Morus (Moraceae) from China. J. Syst. Evol. 1991, 29, 264–267. [Google Scholar]
- Yulianti, W.; Katoh, S.; Sugita, N.; Kokubugata, G.; Kato, H.; Murakami, N. Microsatellite Markers Reveal Genetic Differentiation of an Invasive Mulberry, Morus australis Poir. (Moraceae), among the Island Groups in Japan and its Introduction to the Ogasawara Islands. Acta Phytotaxon. Geobot. 2022, 73, 1–18. [Google Scholar]
- Rao, C.K.; Jarvis, C.E. Lectotypification, taxonomy and nomenclature of Morus alba, M. tatarica and M. indica (Moraceae). Taxon 1986, 35, 705–708. [Google Scholar] [CrossRef]
- Clement, W.L.; Weiblen, G.D. Morphological Evolution in the Mulberry Family (Moraceae). Syst. Bot. 2009, 34, 530–552. [Google Scholar] [CrossRef]
- Zeng, Q.; Chen, H.; Zhang, C.; Han, M.; Li, T.; Qi, X.; Xiang, Z.; He, N. Definition of Eight Mulberry Species in the Genus Morus by Internal Transcribed Spacer-Based Phylogeny. PLoS ONE 2015, 10, e0135411. [Google Scholar] [CrossRef]
- Yu, M.D.; Xiang, Z.H.; Feng, L.C.; Ke, Y.F.; Zhang, X.Y.; Jing, C.J. The discovery and study on a natural haploid Morus notabilis Schneid. Acta Sericologica Sin. 1996, 22, 67–71. [Google Scholar]
- He, N.J.; Zhang, C.; Qi, X.W.; Zhao, S.C.; Tao, Y.; Yang, G.J.; Lee, T.-H.; Wang, X.Y.; Cai, Q.L.; Li, D.; et al. Draft genome sequence of the mulberry tree Morus notabilis. Nat. Commun. 2013, 4, 2445. [Google Scholar] [CrossRef]
- Xuan, Y.H.; Ma, B.; Li, D.; Tian, Y.; Zeng, Q.W.; He, N.J. Chromosome restructuring and number change during the evolution of Morus notabilis and Morus alba. Hortic. Res. 2022, 9, uhab030. [Google Scholar] [CrossRef]
- Jiao, F.; Luo, R.; Dai, X.; Liu, H.; Yu, G.; Han, S.; Lu, X.; Su, C.; Chen, Q.; Song, Q.; et al. Chromosome-Level Reference Genome and Population Genomic Analysis Provide Insights into the Evolution and Improvement of Domesticated Mulberry (Morus alba). Mol. Plant 2020, 13, 1001–1012. [Google Scholar] [CrossRef]
- Letz, R.; Uhríková, A.; Májovský, J. Chromosomes numbers of several interesting taxa of the flora of Slovakia. Biologia 1999, 54, 43–49. [Google Scholar]
- Dandia, B.S.B.; Rajan, M.V. Microsporogenesis in hexaploid Morus serrata Roxb. Cytologia 1989, 54, 747–751. [Google Scholar]
- Basavaiah; Dandia, S.B.; Dhar, A.; Sengupta, K. Meiosis in natural decosaploid(22x) Morus nigra L. Cytologia 1990, 55, 505–509. [Google Scholar] [CrossRef]
- Wolfe, J.A. Neogene floristic and vegetational history of the Pacific Northwest. Madrono 1969, 20, 83–110. [Google Scholar]
- Wolfe, J.A. Some Aspects of Plant Geography of the Northern Hemisphere During the Late Cretaceous and Tertiary. Ann. Mo. Bot. Gard. 1975, 62, 264. [Google Scholar] [CrossRef]
- Aradhya, M.K.; Potter, D.; Gao, F.Y.; Simon, C.J. Molecular phylogeny of Juglans (Juglandaceae): A biogeographic perspective. Tree Genet. Genomes 2007, 3, 363–378. [Google Scholar] [CrossRef]
- Tiffney, B.H. Perspectives on the origin of the floristic similarity between Eastern Asia and Eastern North America. J. Arnold Arbor. 1985, 66, 73–94. [Google Scholar] [CrossRef]
- Graham, A. History of the vegetation: Cretaceous (Maastrichtian)—Tertiary. In Flora of North America North of Mexico; Flora of North America Editorial Committee, Ed.; Oxford University Press: New York, NY, USA, 1993; Volume 1, pp. 57–70. [Google Scholar]
- Qian, H.; Ricklefs, R.E. Large-scale processes and the Asian bias in species diversity of temperate plants. Nature 2000, 407, 180–182. [Google Scholar] [CrossRef]
- Qiu, Y.X.; Fu, C.X.; Comes, H.P. Plant molecular phylogeography in China and adjacent regions: Tracing the genetic imprints of Quaternary climate and environmental change in the world’s most diverse temperate flora. Mol. Phylogenet. Evol. 2011, 59, 225–244. [Google Scholar] [CrossRef]
- Barber, A.J.; Crow, M.J.; Milsom, J.S. Sumatra: Geology, Resources and Tectonic Evolution; Geological Society: London, UK, 2005; p. 96. [Google Scholar]
- Hall, R. Southeast Asia’s changing palaeogeography. Blumea-Biodivers. Evol. Biogeogr. Plants 2009, 54, 148–161. [Google Scholar] [CrossRef]
- Barnea, A.; Yom-Tov, Y.; Friedman, J. Effect of frugivorous birds on seed dispersal and germination. Acta Gecologica 1992, 13, 209–219. [Google Scholar]
- Corlett, R.T. Interactions between birds, fruit bats and exotic plants in urban Hong Kong, South China. Urban Ecosyst. 2005, 8, 275–283. [Google Scholar] [CrossRef]
Figure 1.
Images of leaves, infructescences, and male inflorescences of Morus. (A–C) M. alba L.; (D–F) M. australis Poir.; (G,H) M. cathayana Hemsl.; (I–K) M. macroura Miq.; (L–N) M. mongolica (Bur.) C.K.Schneid.; (O) M. notabilis C.K.Schneid.; (P,Q) M. wittiorum Hand.-Mazz.; (R,S) M. serrata Roxb. (S, immature infructescences); (T) M. australis var. inusitata (Lévl.) C.Y.Wu; (U) M. rubra L.; (V) M. alba (M. mongolica (Mor 55-951) from Gardner et al. [5]). Photographer: (A–F,I,J,L) by Che-Xuan Yang; (G,H,M) by Xin-Xin Zhu; (K,N,P,Q) by Qin-Wen Lin; (O) by Si-Yu Zhang; (R,S) by Jie Cai; (T) by Qin Tian (SFU); and (U,V) by Elliot M. Gardner.

Figure 2.
Phylogenetic trees showing concordant and conflicting relationships in Morus. (A) Comparison of the ASTRAL tree (left) and concatenated ML tree (right) of Morus based on the C157 matrix. All nodes have a support value of LPP = 1 (left) or BS = 100% (right) unless otherwise indicated. (B,C) Two alternative topologies for the earliest diverged lineages in the Asian clade of Morus. Topology T1-1 is from the concatenated ML tree in Figure 2A and the concatenated and ASTRAL trees in Supplementary Figure S2, while topology T1-2 is from the ASTRAL tree in Figure 2A. (D,E) Two alternative topologies for the branch connecting M. mongolica and M. cathayana toward the tips of the Asian clade of Morus. Topology T2-1 is from the concatenated ML tree in Figure 2A and Figure S2, while topology T2-2 is from the ASTRAL tree in Figure 2A and Figure S2.

Figure 3.
The result of coalescent simulations with 1000 trees simulated under the coalescent mapped against the ASTRAL tree of the simplified C157 dataset. The numbers near the branches indicate the number of simulated trees that are concordant (above) and discordant (below) with a given branch. The pie chart at each node indicates the proportion of simulated trees that are concordant (blue) with a given node, support a dominant alternative topology (green), and support the remaining alternative topologies (red).

Figure 4.
The optimal phylogenetic network of Morus. The values next to the curved lines indicate the inheritance probabilities (γ). The red line indicates the minor edge of a hybridization event (i.e., with a smaller γ), while the blue line indicates the major edge of a hybridization event (i.e., with a greater γ).

Figure 5.
Time-calibrated tree of Morus estimated in treePL based on the simplified C157 dataset. The red dots indicate the positions of fossil calibrations. The red star indicates the position of secondary calibration. The value next to the node indicates the mean age summarized based on the 1000 dated bootstrap trees. The blue bar at each node indicates the 95% CI age summarized based on the 1000 dated bootstrap trees.

Figure 6.
Ancestral area reconstruction of Morus under the BAYAREALIKE model in BioGeoBEARS based on the simplified C157 dataset. A, Sino-Japan; B, Sino-Himalaya; C, Southeast Asia; D, the Americas.
Figure 6.
Ancestral area reconstruction of Morus under the BAYAREALIKE model in BioGeoBEARS based on the simplified C157 dataset. A, Sino-Japan; B, Sino-Himalaya; C, Southeast Asia; D, the Americas.

Figure 7.
Ancestral state reconstructions for three reproductive traits of Morus under the Mk model. The pie charts at the nodes indicate the probabilities of ancestral states. Panels (A–C) show the results of ancestral reconstructions for breeding system, syncarp length, and style length of Morus, respectively.


Table 1.
Taxon sampling information in this study.
| Species | Collector and Number | Locality | Herbarium | Recovered Gene Number (Moraceae333/Angiosperms353/HybSeq100) | Accsession Numbers | Tribe | Style Length | Syncarp Length | Breeding System |
|---|---|---|---|---|---|---|---|---|---|
| Afromorus mesozygia (Stapf) E.M.Gardner | ATBP 639 | Uganda | MO | (1/4/81) | SAMN35653736 (new) | Moreae | |||
| Afromorus mesozygia (Stapf) E.M.Gardner | Buckner 309 | Central African | MO | (327/15/18) | SRR12282928 | Moreae | |||
| Artocarpus altilis (Parkinson) Fosberg | Lawrence J. Eilers 652 | Honduras | OS | (NA/8/85) | SAMN35653737 (new) | Artocarpeae | |||
| Artocarpus altilis (Parkinson) Fosberg | Breadfruit Institute grid no. K7 | USA | PTBG | (319/NA/5) | SRR12282879 | Artocarpeae | |||
| Artocarpus papuanus (Becc.) Renner | E. F. de Vogel 3777 | Indonesia | MO | (1/5/79) | SAMN35653738 (new) | Artocarpeae | |||
| Artocarpus papuanus (Becc.) Renner | Zerega et al. 61 | Papua New Guinea | NY | (314/NA/5) | SRR12283061 | Artocarpeae | |||
| Batocarpus amazonicus (Ducke) Fosberg | Nee 47112 | NA | TEX | (2/20/84) | SAMN35653739 (new) | Artocarpeae | |||
| Batocarpus amazonicus (Ducke) Fosberg | Berg et al. 18524 | Brazil | K (K000946661) | (22/36/6) | ERS4414214 | Artocarpeae | |||
| Ficus piresiana Vázq.Avila and C.C. Berg | H. Medeiros 1587 | Brasil | NY | (2/6/84) | SAMN35653740 (new) | Ficeae | |||
| Ficus sagittifolia Warb. ex Mildbr. and Burret | Chase 19852 | K | 36/35/14) | ERS4414205 | Ficeae | ||||
| Maclura tricuspidata Carrière | Pozorski 9826V03 | NA | KUN | (NA/5/84) | SAMN35653741 (new) | Chlorophoreae | |||
| Maclura tricuspidata Carrière | Gardner MOR 68-7917 | USA | MOR | (287/8/15) | SRR12282950 | Chlorophoreae | |||
| Morus alba L. | A. C. Sanders 13809 | USA | CAS | (NA/5/83) | SAMN35653742 (new) | Moreae | short | short | dioecy |
| Morus alba L. | Gardner MOR 920-26*1 | USA | MOR | (321/7/12) | SRR12282946 | Moreae | short | short | dioecy |
| Morus australis Poir. | M. Ono and S. Kobayashi | Japan | OS | (NA/5/86) | SAMN35653743 (new) | Moreae | long | short | dioecy |
| Morus australis Poir. | Gardner MOR 241-71*6 | USA | MOR | (322/8/14) | SRR12282942 | Moreae | long | short | dioecy |
| Morus cathayana Hemsl. | Gaoligong Shan Biodiversity Survey 19616 | China | CAS | (0/6/80) | SAMN35653744 (new) | Moreae | short | short | monoecy |
| Morus cathayana Hemsl. | Wilson 10 | China | F | (96/1/1) | SRR12282938 | Moreae | short | short | monoecy |
| Morus celtidifolia Kunth | Juan Calzada 20974 | Mexico | TEX | (2/13/84) | SAMN35653745 (new) | Moreae | short | short | dioecy vs. monoecy |
| Morus celtidifolia Kunth | Sandoval and Gutierrez 637 | Mexico | MO | (332/19/19) | SRR12282937 | Moreae | short | short | dioecy vs. monoecy |
| Morus macroura Miq. | Gardner 28 | USA | CHIC | (329/13/18) | SRR12282930 | Moreae | short | long | dioecy |
| Morus microphylla Buckley | Fishbein et al. 1058 | Mexico | F | (325/17/19) | SRR12282927 | Moreae | short | short | dioecy |
| Morus mongolica (Bur.) C.K.Schned. | Liu Xin-Yuan 5257 | China | CAS | (1/5/72) | SAMN35653746 (new) | Moreae | long | short | dioecy |
| Morus notabilis C.K.Schneid. | Gaoligong Shan Biodiversity Survey 29353 | China | CAS | (1/6/83) | SAMN35653747 (new) | Moreae | long | long | dioecy |
| Morus notabilis C.K.Schneid. | NA | China | NA | (331/34/84) | SRR8138828 | Moreae | long | long | dioecy |
| Morus rubra L. | Steven R. Hill 36694 | USA | CAS | (NA/5/84) | SAMN35653748 (new) | Moreae | short | short | dioecy |
| Morus rubra L. | Gardner 141 | USA | CHIC | (326/9/12) | SRR12282922 | Moreae | short | short | dioecy |
| Morus serrata Roxb. | Koelz 4788 | India | F | (269/5/9) | SRR12282920 | Moreae | short | short | dioecy |
| Morus wittiorum Hand.-Mazz. | Zhang Wei | China | KUN | (1/5/85) | SAMN35653749 (new) | Moreae | short | long | dioecy |
| Olmedia aspera Ruiz and Pav. | J. A. Duke 13250(3) | Panama | OS | (NA/4/78) | SAMN35653750 (new) | Olmedieae | |||
| Olmedia aspera Ruiz and Pav. | Fuentes et al. 5323 | Bolivia | MO | (244/3/7) | SRR12282905 | Olmedieae | |||
| Parartocarpus venenosus (Zoll. ex Moritzi) Becc. | T. J. Motley et al. 21 | Papua New Guinea | NY | (NA/4/67) | SAMN35653751 (new) | Parartocarpeae | |||
| Parartocarpus venenosus (Zoll. ex Moritzi) Becc. | Zerega et al. 874 | Malaysia | F, SAN | (207/0/5) | SRR3907334 | Parartocarpeae | |||
| Paratrophis insignis (Bureau) E.M.Gardner | D. E. Breedlove 31069 | Mexico | CAS | (1/3/83) | SAMN35653752 (new) | Moreae | |||
| Paratrophis insignis (Bureau) E.M.Gardner | Vasquez and Francis 28068 | Peru | F | (332/18/18) | SRR12282932 | Moreae | |||
| Taxotrophis macrophylla (Blume) Boerl. | D. D. Soejarto et al. 10673 | Vietnam | NY | (0/4/81) | SAMN35653753 (new) | Moreae | short | short | dioecy |
| Taxotrophis macrophylla (Blume) Boerl. | Soejarto et al. 10673 | Vietnam | F | (323/NA/19) | SRR12282865 | Moreae | short | short | dioecy |
| Trophis mexicana (Liebm.) Bureau | Rafael García S. 539 | Mexico | TEX | (6/16/87) | SAMN35653754 (new) | Moreae | |||
| Trophis mexicana (Liebm.) Bureau | Stevens and Montiel 27939 | Nicaragua | MO | (322/4/14) | SRR12282883 | Moreae |
Note: “NA” represents the missing information; “new” indicates the new generated sequences.
Table 2.
Model selection among phylogenetic networks.
| Topology | LnL | Parameters | Number of Hybridizations Event Allowed | Number of Hybridizations Event Detected | AIC | AICc | BIC |
|---|---|---|---|---|---|---|---|
| Network 0 | −966.4673 | 19 | 0 | 0 | 1970.9346 | 1886.4902 | 1978.4947 |
| Network 1 | −948.2423 | 21 | 1 | 1 | 1938.4846 | 1854.4846 | 1946.8404 |
| Network 2 | −944.8661 | 23 | 2 | 2 | 1935.7322 | 1850.8091 | 1944.8838 |
| Network 3 | −910.9233 | 25 | 3 | 3 | 1871.8465 | 1785.1799 | 1881.7939 |
| Network 4 | −942.8554 | 27 | 4 | 4 | 1939.7109 | 1850.7697 | 1950.4541 |
| Network 5 | −909.6192 | 29 | 5 | 5 | 1877.2384 | 1785.6594 | 1888.7773 |
| ASTRAL tree | −1205.3261 | 25 | NA | NA | 2460.6522 | 2373.9855 | 2470.5995 |
| Concatenated ML tree | −1824.0011 | 25 | NA | NA | 3698.0022 | 3611.3355 | 3707.9496 |
Note: The optimal model is highlighted in bold.
Table 3.
The estimated divergence times and ancestral area probabilities of major lineages in Morus based on the simplified C157 matrix.
Table 3.
The estimated divergence times and ancestral area probabilities of major lineages in Morus based on the simplified C157 matrix.
| Nodes | Age (Mya) | 95% CI of Age (Mya) | Range Probabilities |
|---|---|---|---|
| SN of Morus | 33.90 * | 33.90–33.90 * | ABD: 0.203; BD: 0.167; BCD: 0.125 |
| CN of Morus | 18.94 | 15.17–23.07 | BD: 0.253; ABD: 0.233; B 0.144 |
| SN of Asian + American clade in Morus | 18.94 | 15.17–23.07 | BD: 0.253; ABD: 0.233; B: 0.144 |
| CN of Asian + American clade in Morus | 13.36 | 11.04–16.33 | ABD: 0.284; BD: 0.273; AB: 0.123 |
| SN of Asian clade in Morus | 13.36 | 11.04–16.33 | ABD: 0.284; BD: 0.273; AB: 0.123 |
| CN of Asian clade in Morus | 6.92 | 6.56–7.36 | AB: 0.728; B: 0.115 |
| SN of American clade in Morus | 13.36 | 11.04–16.33 | ABD: 0.284; BD: 0.273; AB: 0.123 |
| CN of American clade in Morus | 8.16 | 6.70–10.03 | D: 0.574; BD: 0.205; AD: 0.112 |
| SN of Moreae | 78.34 | 76.77–79.68 | |
| CN of Moreae | 56.68 | 54.20–58.98 | |
| SN of Trophis + Morus | 36.26 | 35.89–36.61 | |
| SN of Paratrophis + Afromorus | 36.26 | 35.89–36.61 | |
| CN of Paratrophis + Afromorus | 32.25 | 30.37–34.21 | |
| SN of Maclueae + (Artocarpeae + Moreae) | 84.67 | 84.63–84.69 | |
| CN of Maclueae + (Artocarpeae + Moreae) | 82.99 | 82.38–83.48 | |
| SN of Artocarpeae + Moreae | 82.99 | 82.38–83.48 | |
| CN of Artocarpeae + Moreae | 78.34 | 76.77–79.68 | |
| SN of Artocarpeae | 78.34 | 76.77–79.68 | |
| CN of Artocarpus | 42.97 | 37.69–48.01 | |
| SN of Parartocarpeae + (Olmedieae + Ficeae) | 84.67 | 84.63–84.69 | |
| CN of Parartocarpeae + (Olmedieae + Ficeae) | 80.02 | 78.81–81.11 | |
| SN of Olmedieae + Ficeae | 80.02 | 78.81–81.11 | |
| CN of Ficus | 25.02 | 21.76–28.27 |
Note: “*” denotes the age of fossil calibration. Abbreviations: SN, Stem node; and CN, crown node.
Disclaimer/Publisher’s Note: The statements, opinions and data contained in all publications are solely those of the individual author(s) and contributor(s) and not of MDPI and/or the editor(s). MDPI and/or the editor(s) disclaim responsibility for any injury to people or property resulting from any ideas, methods, instructions or products referred to in the content. |
© 2023 by the authors. Licensee MDPI, Basel, Switzerland. This article is an open access article distributed under the terms and conditions of the Creative Commons Attribution (CC BY) license (https://creativecommons.org/licenses/by/4.0/).
Share and Cite
MDPI and ACS Style
Yang, C.-X.; Liu, S.-Y.; Zerega, N.J.C.; Stull, G.W.; Gardner, E.M.; Tian, Q.; Gu, W.; Lu, Q.; Folk, R.A.; Kates, H.R.; et al. Phylogeny and Biogeography of Morus (Moraceae). Agronomy 2023, 13, 2021. https://doi.org/10.3390/agronomy13082021
AMA Style
Yang C-X, Liu S-Y, Zerega NJC, Stull GW, Gardner EM, Tian Q, Gu W, Lu Q, Folk RA, Kates HR, et al. Phylogeny and Biogeography of Morus (Moraceae). Agronomy. 2023; 13(8):2021. https://doi.org/10.3390/agronomy13082021
Chicago/Turabian StyleYang, Chen-Xuan, Shui-Yin Liu, Nyree J. C. Zerega, Gregory W. Stull, Elliot M. Gardner, Qin Tian, Wei Gu, Qing Lu, Ryan A. Folk, Heather R. Kates, and et al. 2023. "Phylogeny and Biogeography of Morus (Moraceae)" Agronomy 13, no. 8: 2021. https://doi.org/10.3390/agronomy13082021
Note that from the first issue of 2016, this journal uses article numbers instead of page numbers. See further details here.