Article

Transcriptome Arofile of Brassica rapa L. Reveals the Involvement of Jasmonic Acid, Ethylene, and Brassinosteroid Signaling Pathways in Clubroot Resistance

College of Horticulture, Shenyang Agricultural University, Shenyang 110866, China
*
Author to whom correspondence should be addressed.
These authors contributed equally to this work.
Agronomy 2019, 9(10), 589; https://doi.org/10.3390/agronomy9100589
Submission received: 21 August 2019 / Revised: 22 September 2019 / Accepted: 26 September 2019 / Published: 27 September 2019
(This article belongs to the Section Crop Breeding and Genetics)

Abstract

:
Plasmodiophora brassicae is a protozoan pathogen that causes clubroot disease in cruciferous plants, particularly Chinese cabbage (Brassica rapa). A previous study identified a clubroot resistance gene (CRd) conferring race-specific resistance to P. brassicae. However, the defense mechanisms of B. rapa against virulent vs. avirulent P. brassicae are poorly understood. In this study, we carried out a global transcriptional analysis in the clubroot-resistant Chinese cabbage inbred line “85–74” carrying the CRd gene and inoculated with avirulent (LAB-4) or virulent (SCCD-52) P. brassicae. RNA sequencing showed that “85–74” responded most rapidly to SCCD-52 infection, and the number of differentially expressed genes was much higher in SCCD-52-treated as compared to LAB-4-treated plants (5552 vs. 304). Transcriptome profiling revealed that plant hormone signal transduction and plant–pathogen interaction pathways played key roles in the late stages of P. brassicae infection. Genes relating to the salicyclic acid (SA), jasmonic acid (JA)/ethylene (ET), and brassinosteroid (BR) signaling pathways were up-regulated relative to untreated plants in response to LAB-4 infection at 8, 16, and 32 days post-inoculation (dpi) whereas JA, ET, and BR signaling-related genes were not activated in response to SCCD-52, and SA signaling-related genes were up-regulated in both LAB-4 and SCCD-52, suggesting that SA signaling is not the key factor in host resistance to avirulent P. brassicae. In addition, genes associated with phosphorylation and Ca2+ signaling pathways were down-regulated to a greater degree following LAB-4 as compared to SCCD-52 infection at 8 dpi. These results indicate that effector-triggered immunity in “85–74” is more potently activated in response to infection with avirulent P. brassicae and that JA, ET, and BR signaling are important for the host response at the late stage of infection. These findings provide insight into P. brassicae pathotype-specific defense mechanisms in cruciferous crops.

1. Introduction

Plants have evolved immune responses consisting of initial pathogen-associated molecular pattern (PAMP)-triggered immunity (PTI) and subsequent effector-triggered immunity (ETI) [1] for protection against pathogens such as bacteria, viruses, and fungi [1,2,3,4]. Most pathogens are inhibited by the recognition of PAMPs by pattern recognition receptors (PRRs) localized on the plasma membrane. However, pathogens can suppress PTI by secreting effectors into host cells. ETI is mediated by intracellular receptors encoded by plant disease resistance genes (R genes) that recognize the effector protein and subsequently activate downstream immune responses to prevent pathogen infection [5].
The plant hormones ethylene (ET), jasmonic acid (JA), and salicyclic acid (SA) play a central role in the regulation of plant immune responses [6]. JA/ET pathways are critical for systemic resistance against Chilli veinal mottle virus in tobacco, whereas the SA pathway plays a minor role at an early stage of infection [7]. Infection by Fusarium oxysporum (Fol) activates both the ET and SA pathways in tomato but have antagonistic functions, whereas JA signaling has no discernible effect on susceptibility to Fol. [8]. The ET response enhances susceptibility to Fol infection and disease development, whereas the SA response blocks colonization through constitutive activation. In general, SA signaling positively regulates plant defense against biotrophic pathogens [9,10], but ET/JA pathways target necrotrophic pathogens and herbivorous pests [11,12]. However, several exceptions have been reported. For example, the SA pathway is required for plant resistance to specific necrotrophic pathogens (Plectosphaerella cucumerina), while ET and JA signaling mediate resistance to some biotrophic pathogens (Pseudomonas syringae and Peronospora parasitica) [13,14].
Clubroot is a soil-borne disease caused by Plasmodiophora brassicae, an obligate biotrophic protist that specifically infects Brassica crops [15]. Clubroot disease jeopardizes crop cultivation and yield by causing the development of large galls on the roots that reduce the plant’s ability to absorb water and nutrients from the soil. Although clubroot resistance (CR) genes have been identified, mainly in Brassica rapa [16,17,18,19,20,21,22,23], the detailed mechanism of CR remains unclear. However, the suppression of clubroot by exogenous SA was also reported in broccoli (Brassica oleracea) [24]. The SA and JA pathways function antagonistically in the defense response to plant pathogens, whereby the accumulation of JA inhibits that of SA and vice versa [25]. It was also shown that Botrytis cinerea regulates both pathways to enable infection of tomato [26]. A novel CR gene (CRd) conferring complete resistance to a specific pathotype of P. brassicae was recently identified in B. rapa [23]. However, the mechanism of action of the CRd gene product and its association with phytohormone signaling at different developmental stages of P. brassicae has yet to be elucidated, and we suspect that the hormonal signal transduction pathway involved in clubroot disease resistance may be distinct due to the different CR genes.
RNA sequencing (RNA-seq) is a powerful tool for detecting genes related to a specific trait at the whole-genome level [27]; it has been widely employed to study plant–pathogen interactions, including that between Brassica and P. brassicae. Genes involved in the SA signaling pathway were induced in Arabidopsis thaliana [28], B. rapa (contained CRb gene) [29,30], and B. oleracea [31] following early infection by P. brassicae, whereas the JA pathway was found to be involved in the defense response of B. napus, which harbors the Rcr1 gene [32]. In contrast, JA signaling was suppressed in B. rapa [29]. A recent study showed that both the JA and SA pathways contribute to CR in Arabidopsis [33]. The observed differences could be due to variations among Brassica species or in the CR genes used in previous studies. Other plant hormones such as ET and brassinosteroid (BR) have also been implicated in the defense response to clubroot [28,30,32]. Additionally, changes in the expression of genes related to metabolism, cell wall modification, nucleotide binding site leucine-rich repeat (NBS–LRR) proteins, Ca2+ signaling, defense-related callose deposition, chitin metabolism, and the pathogenesis-related (PR) pathway have been reported upon infection of B. rapa with P. brassicae [29,32,34,35,36,37,38,39].
It has been reported that two potentially novel systemic signaling pathways: a systemic response elicited by hypersensitive response (HR)that leads to enhanced Trichoplusia ni resistance and overrides the SA-mediated increase in T. ni susceptibility, and a SA-independent systemic response induced by virulent pathogens that leads to enhanced susceptibility to T. ni [40]. Previous studies have examined the mechanism of CR by treating CR germplasm with an avirulent pathotype of P. brassicae. However, it has not been reported that virulent pathotype of P. brassicae was used in infect CR materials. P. brassicae is an obligate biotrophic pathogen, and it is unclear that the mechanism of SA, JA, and other hormone signal pathways participating in clubroot resistance was different when avirulent and virulent pathotype of P. brassicae infected CR plants at different development stages. In this study, a Chinese cabbage inbred line harboring the CRd gene [23] was inoculated with either an avirulent or virulent pathotype of P. brassicae to investigate the involvement of plant hormone signaling in CR and identify relevant genes by whole-genome transcriptional analysis.

2. Materials and Methods

2.1. Plant Material

The clubroot-resistant inbred line “85–74” harboring the CRd gene was used in this study. All plants were grown in 72-well multipots and maintained in a climate-controlled room at 20 °C–25 °C under a 16-h photoperiod.

2.2. Pathogen Inoculation and Tissue Sampling

To investigate the defense mechanism of CR Chinese cabbage inbred line “85–74” infected with avirulent or virulent strains of P. brassicae, 11 pathotypes collected from different epidemic areas in China were screened. “85–74” harboring the CRd locus was found to be resistant to the LAB-4 pathotype but susceptible to the SCCD-52 pathotype of P. brassicae, which was confirmed in more than three trials. Therefore, LAB-4 and SCCD-52 were used to infect “85–74”. The clubroot pathotypes LAB-4 and SCCD-52, defined as pathotype 4 of P. brassicae [41], were isolated from a highly susceptible Chinese cabbage plant and stored at −20 °C. For inoculation, 1 ml of LAB-4 or SCCD-52 spore suspension (1.0 × 10⁷ spores/mL) was applied to the stem base of 30-day-old Chinese cabbage plants. The inoculated and uninfected control plants were maintained in a climate-controlled room at 20 °C–25 °C under a 16-h photoperiod. The soil was kept moist during the treatment period. The roots of “85–74” were sampled at 0 h and 4 and 8 days post-inoculation (dpi) for analysis of genes that are differently expressed between plants infected with LAB-4 compared with SCCD-52. The roots of 30 plants were sampled at each time point, with three biological replicates. Ten plants for each replicate were pooled for RNA extraction. The roots were washed with distilled water and immediately frozen in liquid nitrogen and stored at −80 °C. To confirm successful infection, 36 plants were maintained in the climate chamber for 32 days after inoculation.

2.3. RNA Isolation, cDNA Library Construction, and Sequencing

Total RNA in each sample was isolated from approximately 0.1 g of fresh roots using TRIzol reagent (Invitrogen, Carlsbad, CA, USA) and treated with DNase I (Takara Bio, Dalian, China) to remove any contaminating genomic DNA. The RNA concentration of each sample was determined using a NanoDrop-2000 spectrophotometer (Thermo Fisher Scientific, Wilmington, DE, USA). Samples with a 260/280 ratio of 1.9–2.1 and a 260/230 ratio ≥ 2.0 were considered to be of high quality and were used for experiments. The integrity of the purified RNA was verified by 1.0% (w/v) agarose gel electrophoresis. The cDNA library was prepared and sequenced by Gene Denovo Technology Co. (Guangzhou, China). The mRNA was enriched from total RNA using magnetic beads with oligo(dT) and then fragmented. Using mRNA as a template, a single strand of cDNA was synthesized with a six-base random primer followed by synthesis of double-stranded cDNA, which was purified, subjected to end repair, and mixed with Solexa adapters. Suitable fragments were recovered from an agarose gel. Using the adapter sequences, the double-stranded cDNA fragments were amplified by polymerase chain reaction (PCR). The constructed libraries were sequenced on a Hiseq2000 platform (Illumina, San Diego, CA, USA).

2.4. RNA-seq Data Analysis and Differentially Expressed Genes (DEGs) Identification

To obtain high-quality clean reads for analysis, the reads were filtered in multiple steps as follows. Those containing the join were removed and the join and downstream portion were excised. If the length of the read after truncation was less than 50 bp, the read was discarded; otherwise, it was retained. Reads with only A bases, an N ratio greater than 10%, or of low quality (i.e., those in which the number of bases with a mass value of Q ≤ 20 was over 50%) were removed. Given that contaminating rRNA can affect subsequent analysis, the read alignment tool bowtie2 v.2.2.8 was used to compare high-quality clean reads to the rRNA sequence of B. rapa (mismatch number: 0). Reads of aligned rRNAs were removed and the data were retained for subsequent analysis. Reads filtered for rRNA were aligned to the reference genome of Chinese cabbage using TopHat2 v.2.1.1 software [42]. The gene expression levels of all libraries were estimated by calculating read density as reads per kilobase per million mapped reads [43]. DEG identification was performed using edgeR software (https://bioconductor.org/packages/release/bioc/html/edgeR.html); the screening conditions were false discovery rate (FDR) < 0.05 and |log2 fold change (FC)| > 1. Patterns of genes that were differentially expressed at the various time points are represented in Venn diagrams.

2.5. Functional Annotation, Gene Ontology (GO) Enrichment, and Kyoto Encyclopedia of Genes and Genomes (KEGG) Analysis of DEGs

GO analysis and KEGG pathway analysis were carried out for the identified DEGs of LAB-4 vs. control and LAB-4 vs. SCCD-52 at 4 and 8 dpi. GO annotation was performed using Blast2GO software [44]. The GO database includes three ontologies: molecular function, cellular component, and biological process. KOBAS v.2.0 software was used to identify the significantly enriched pathways corresponding to the DEGs [45]. Pathways with a corrected p value < 0.05 were considered statistically significant [46].

2.6. Real-time Quantitative Polymerase Chain Reaction (RT-qPCR)

RT-qPCR verification of DEGs was performed using the specific primers provided for Master Cyclereprealplex (Eppendorf, Hamburg, Germany) and SYBR Premix Ex Taq II (Perfect Real Time) (Takara Bio). The primers were designed using Premier 5.0 software and are listed in Supplementary Table S1. Each reaction mixture (20 µL) contained 10 µL of SYBR Premix ExTaq (2×), 0.5 µL of PCR forward/reverse gene-specific primers (10 µM), and diluted cDNA (2 µL). Three experimental replicates were prepared for each gene using different cDNAs synthesized from three biological replicates. The PCR program was as follows: 95 °C for 15 min, followed by 40 cycles of 95 °C for 10 s, 60 °C for 25 s, and 72 °C for 30 s. The specificity of amplification was confirmed by melting curve analysis after 40 cycles. Analysis of gene expression was performed for all samples at 4, 8, 16, and 32 dpi of “85–74” with LAB-4. The expression levels of genes investigated in this study were calculated with the −ΔΔCt method [47], where ΔΔCt = (CTgene − CTactin) treat − (CTgene − CTactin) control.

3. Results

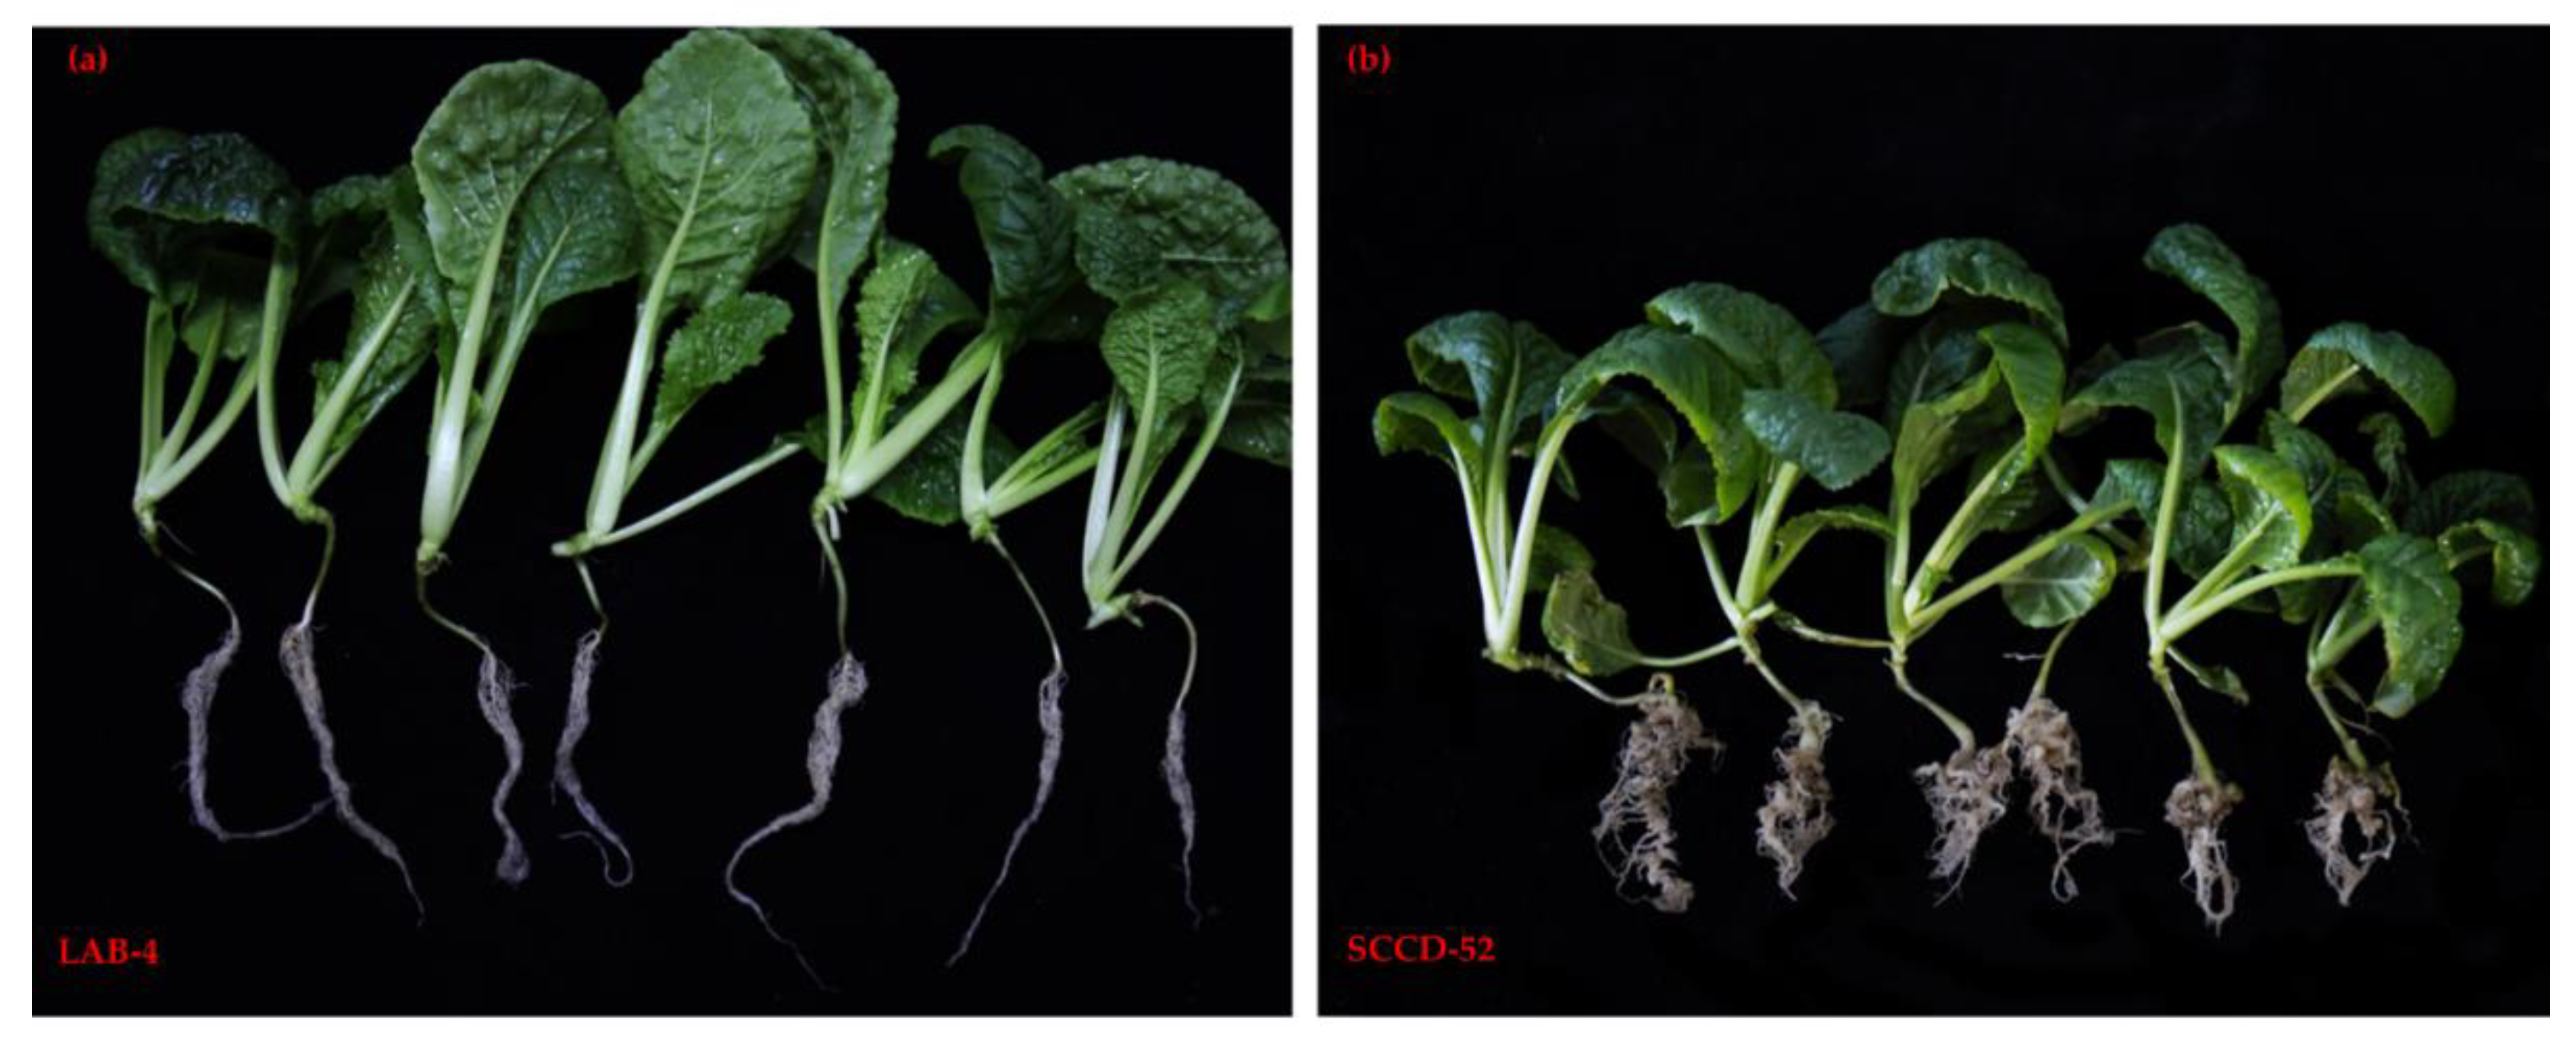
3.1. P. brassicae Physiological Race Selection and Phenotype Identification

The Chinese cabbage inbred line “85–74” harboring the CRd locus is resistant to the LAB-4 pathotype of P. brassicae (Figure 1a). To identify an antagonist of CRd, more than 10 pathotypes collected from different epidemic areas in China were screened. The SCCD-52 pathotype successfully infected “85–74”, which was confirmed in more than three trials (Figure 1b and Table 1). Therefore, LAB-4 (avirulent) and SCCD-52 (virulent) were used to inoculate “85–74”, and three replicates of each pathotype at each time point were collected for RNA-seq.

3.2. RNA-seq Alignment and Mapping to the Reference Genome

RNA-seq generated 4.0–5.4 × 10⁶ clean reads after preprocessing and quality control. The content of base GUANINE and CYTOSINE (GC) was approximately 47%, and Q30 values of all the samples were >95%, indicating that the sequencing quality met the requirements for subsequent analysis (Supplementary Table S2). Most reads were successfully aligned to the B. rapa genome (http://brassicadb.org/brad/). A high percentage (~75%–77%) of mapped reads from each inoculated sample aligned to a single position. The mapping ratio was approximately 77%–78% of the total number of sequenced reads for the virulent pathotype SCCD-52 and avirulent pathotype LAB-4. The expression levels of unigenes showed similar distribution patterns among the 17 samples, suggesting a lack of bias in the cDNA library construction (Supplementary Figures S1 and S2).

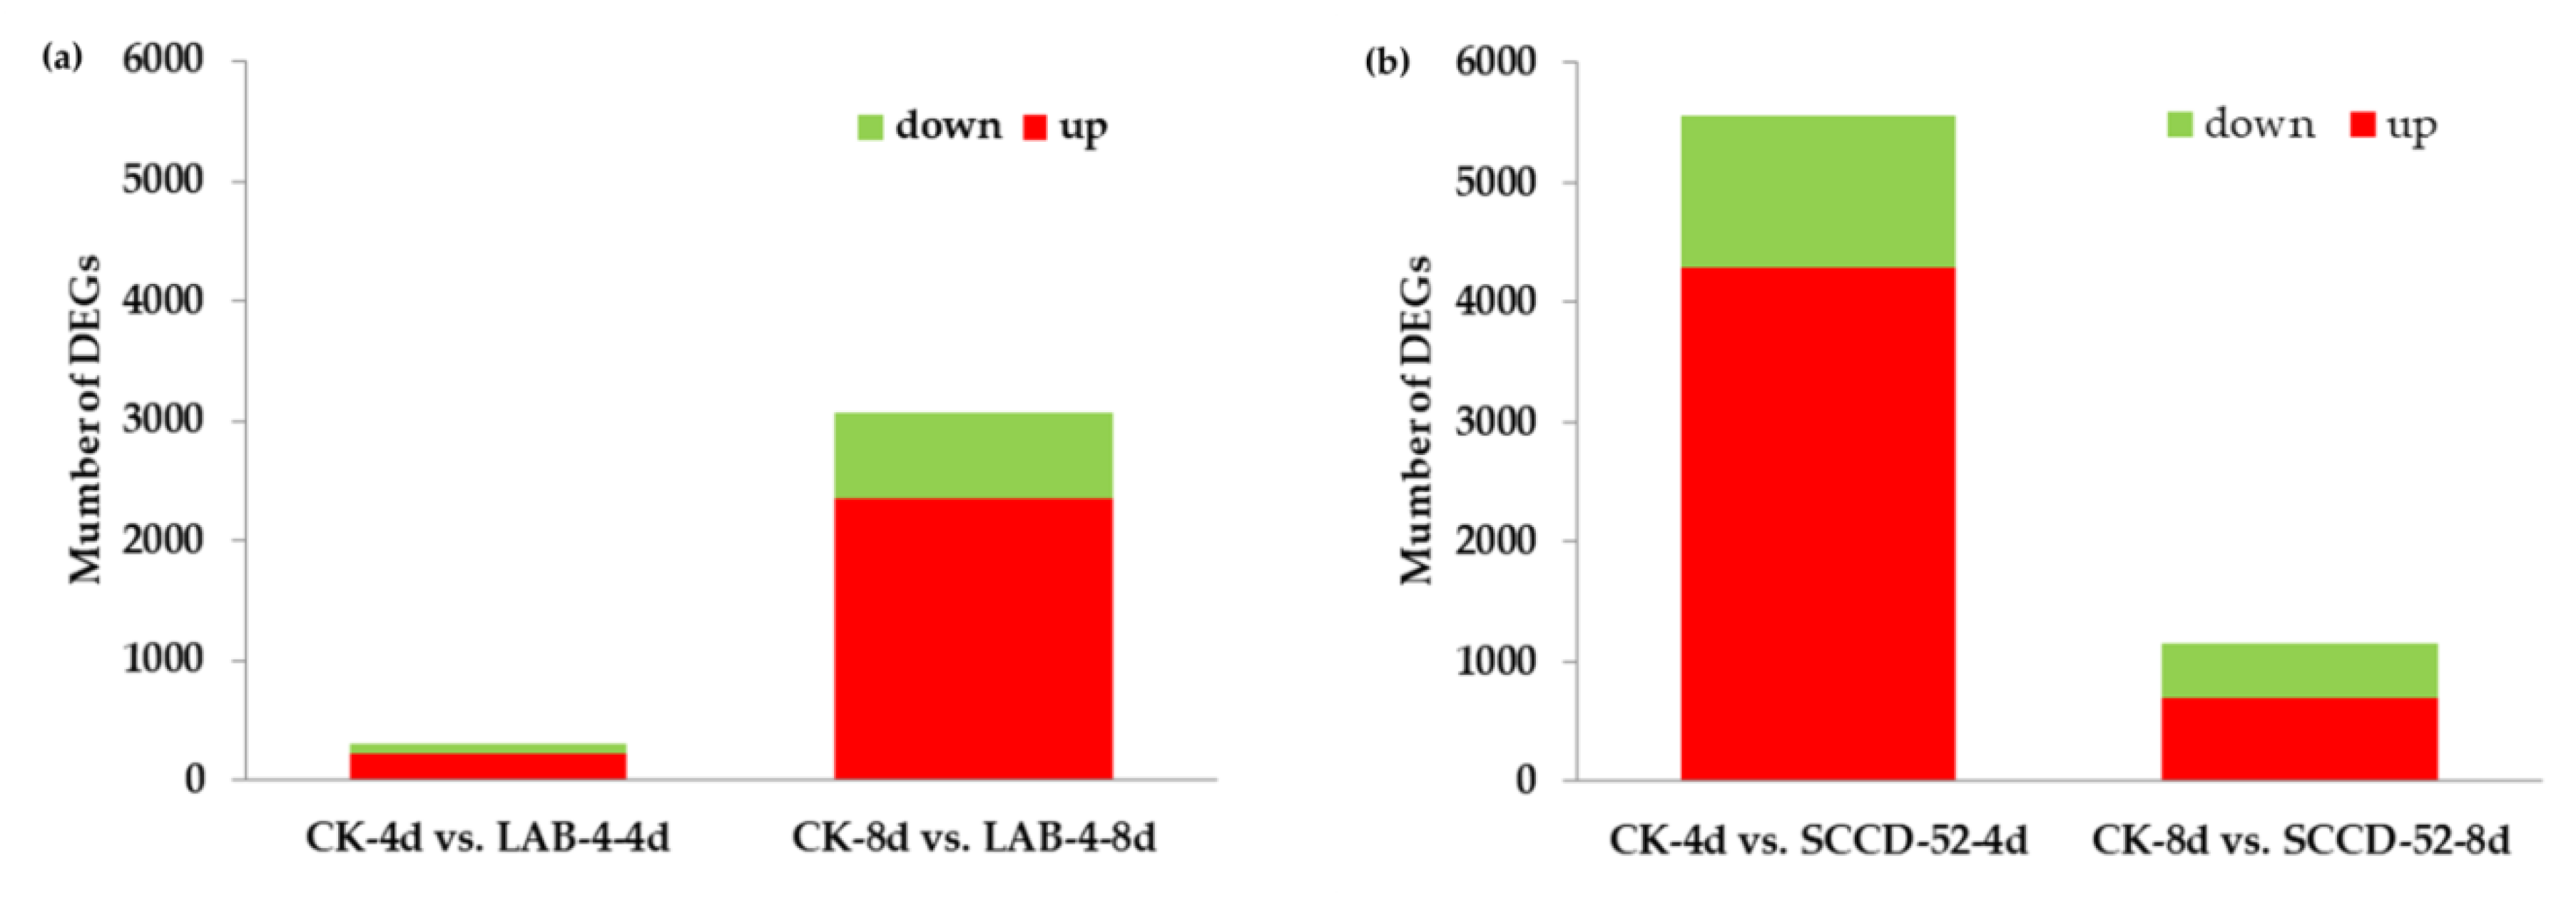
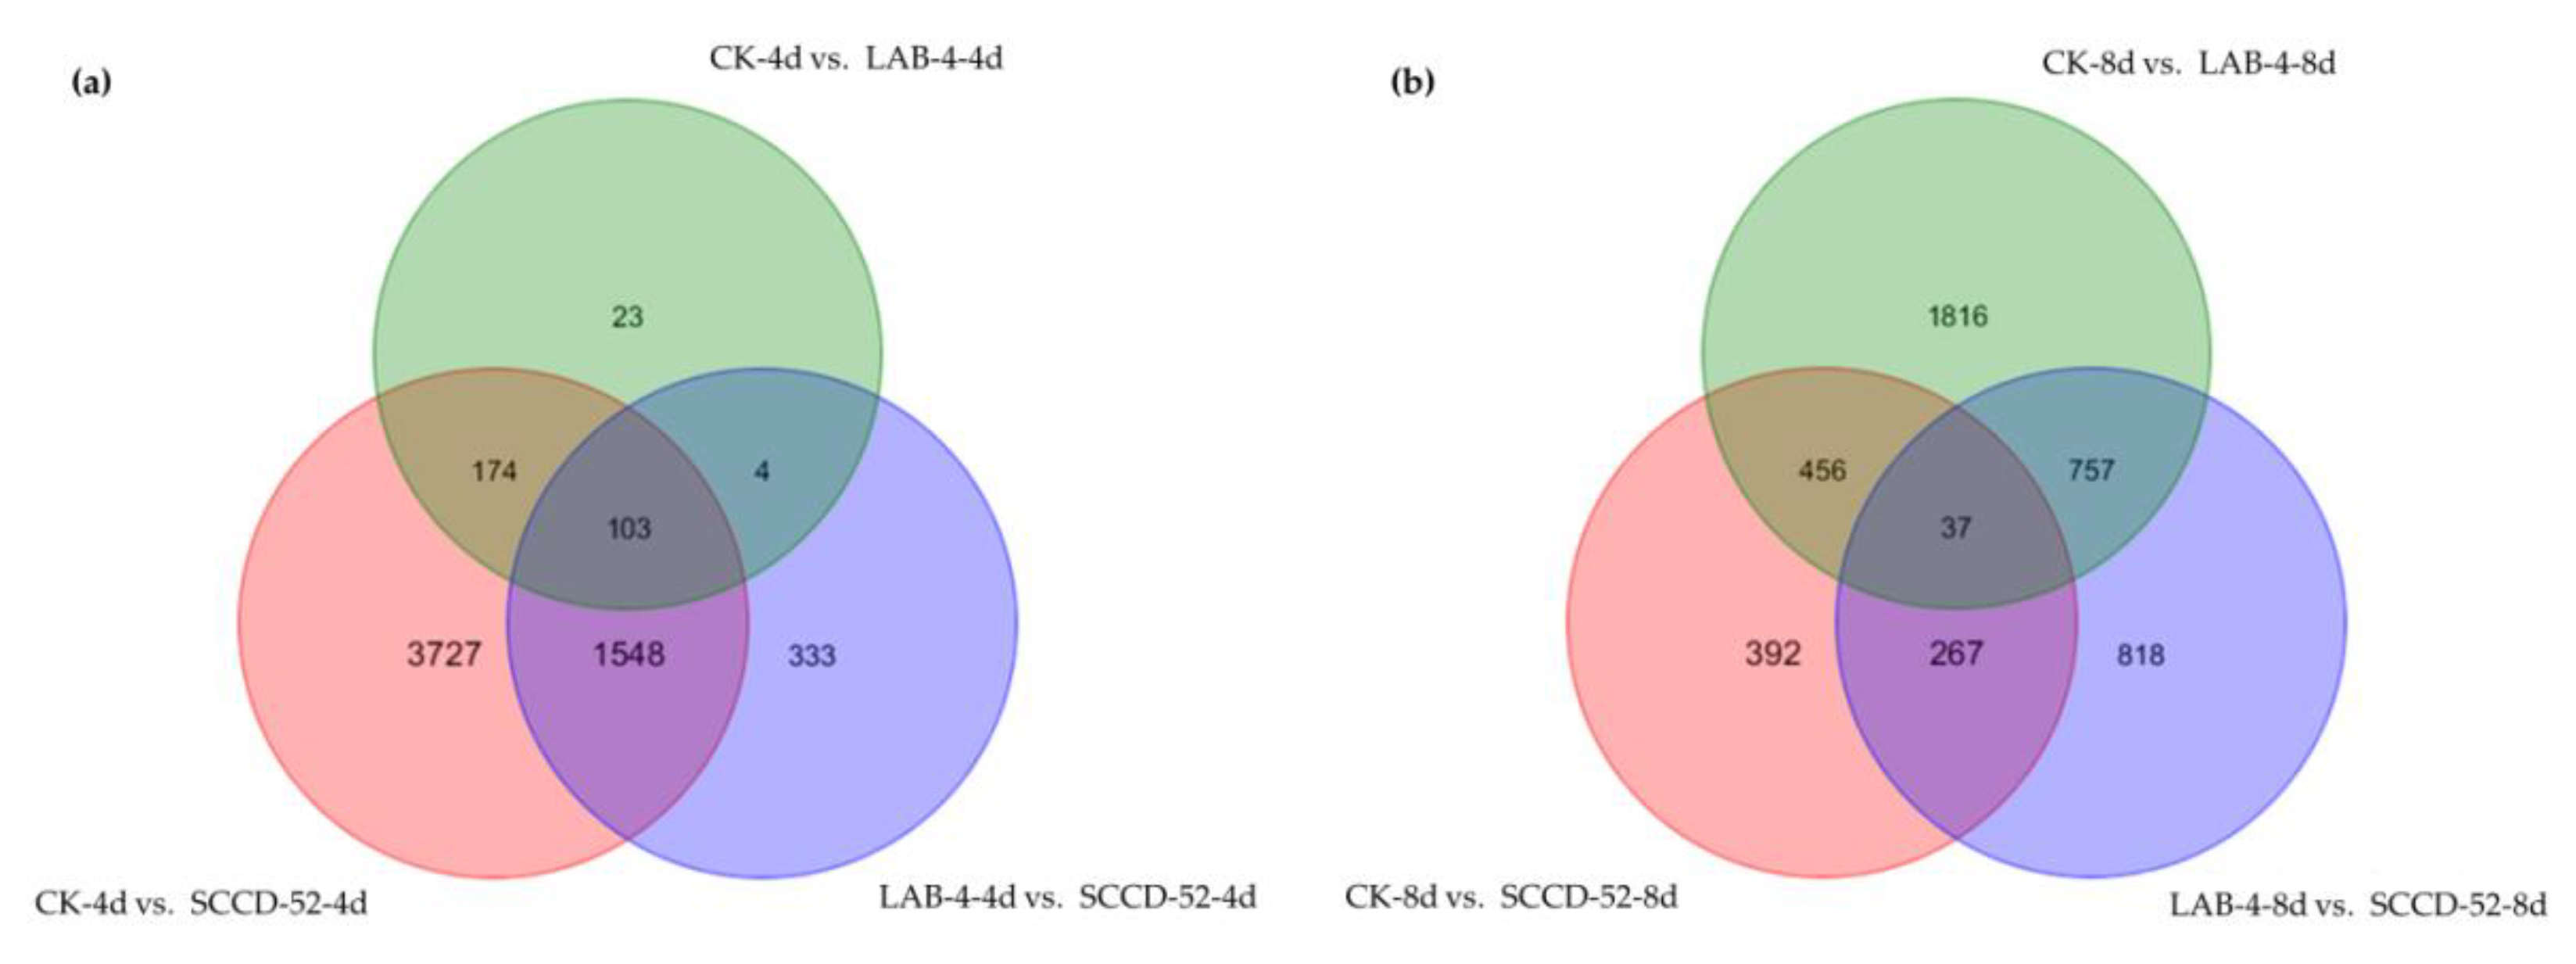
3.3. Analysis of DEGs in Response to P. brassicae

To investigate changes in the transcriptome during infection with the two types of pathogen, genes that were differentially expressed between the two P. brassicae pathotypes and control samples were analyzed at 4 and 8 dpi. The number of DEGs (FDR < 0.05 and |log2FC| > 1) was determined based on comparison with control samples (i.e., plants that were not inoculated with either P. brassicae pathotype) at the indicated time points. At 4 dpi, there were 304 DEGs in plants inoculated with LAB-4, which was significantly lower than the 5552 DEGs in those inoculated with SCCD-52 (Figure 2a,b, and Supplementary Table S3). The large difference in the number of DEGs indicated that B. rapa responds rapidly to infection with a virulent P. brassicae pathotype, even with the CRd locus. With LAB-4, the number of DEGs (3066) increased with longer post-inoculation times. However, with SCCD-52 there were fewer DEGs (1152) at 8 dpi compared with the earlier time point (Figure 2a,b, and Supplementary Table S4). In addition, the change in the proportion of up-regulated DEGs over time varied for the two pathotypes of P. brassicae, with a decrease from 77.2% to 60.7% for SCCD-52 and an increase from 74.6% to 76.6% for LAB-4. These results highlight the distinct responses of “85–74” containing CRd to pathogens exhibiting varying degrees of virulence. We examined DEGs specific to each of the two pathotypes at the two time points (4 and 8 dpi) and identified 27 and 5552 that were exclusively expressed at 4 dpi in plants inoculated with LAB-4 and SCCD-52, respectively (Figure 3a). The number of DEGs specifically expressed in samples inoculated with LAB-4 (2573) was significantly increased at 8 dpi (Figure 3b).

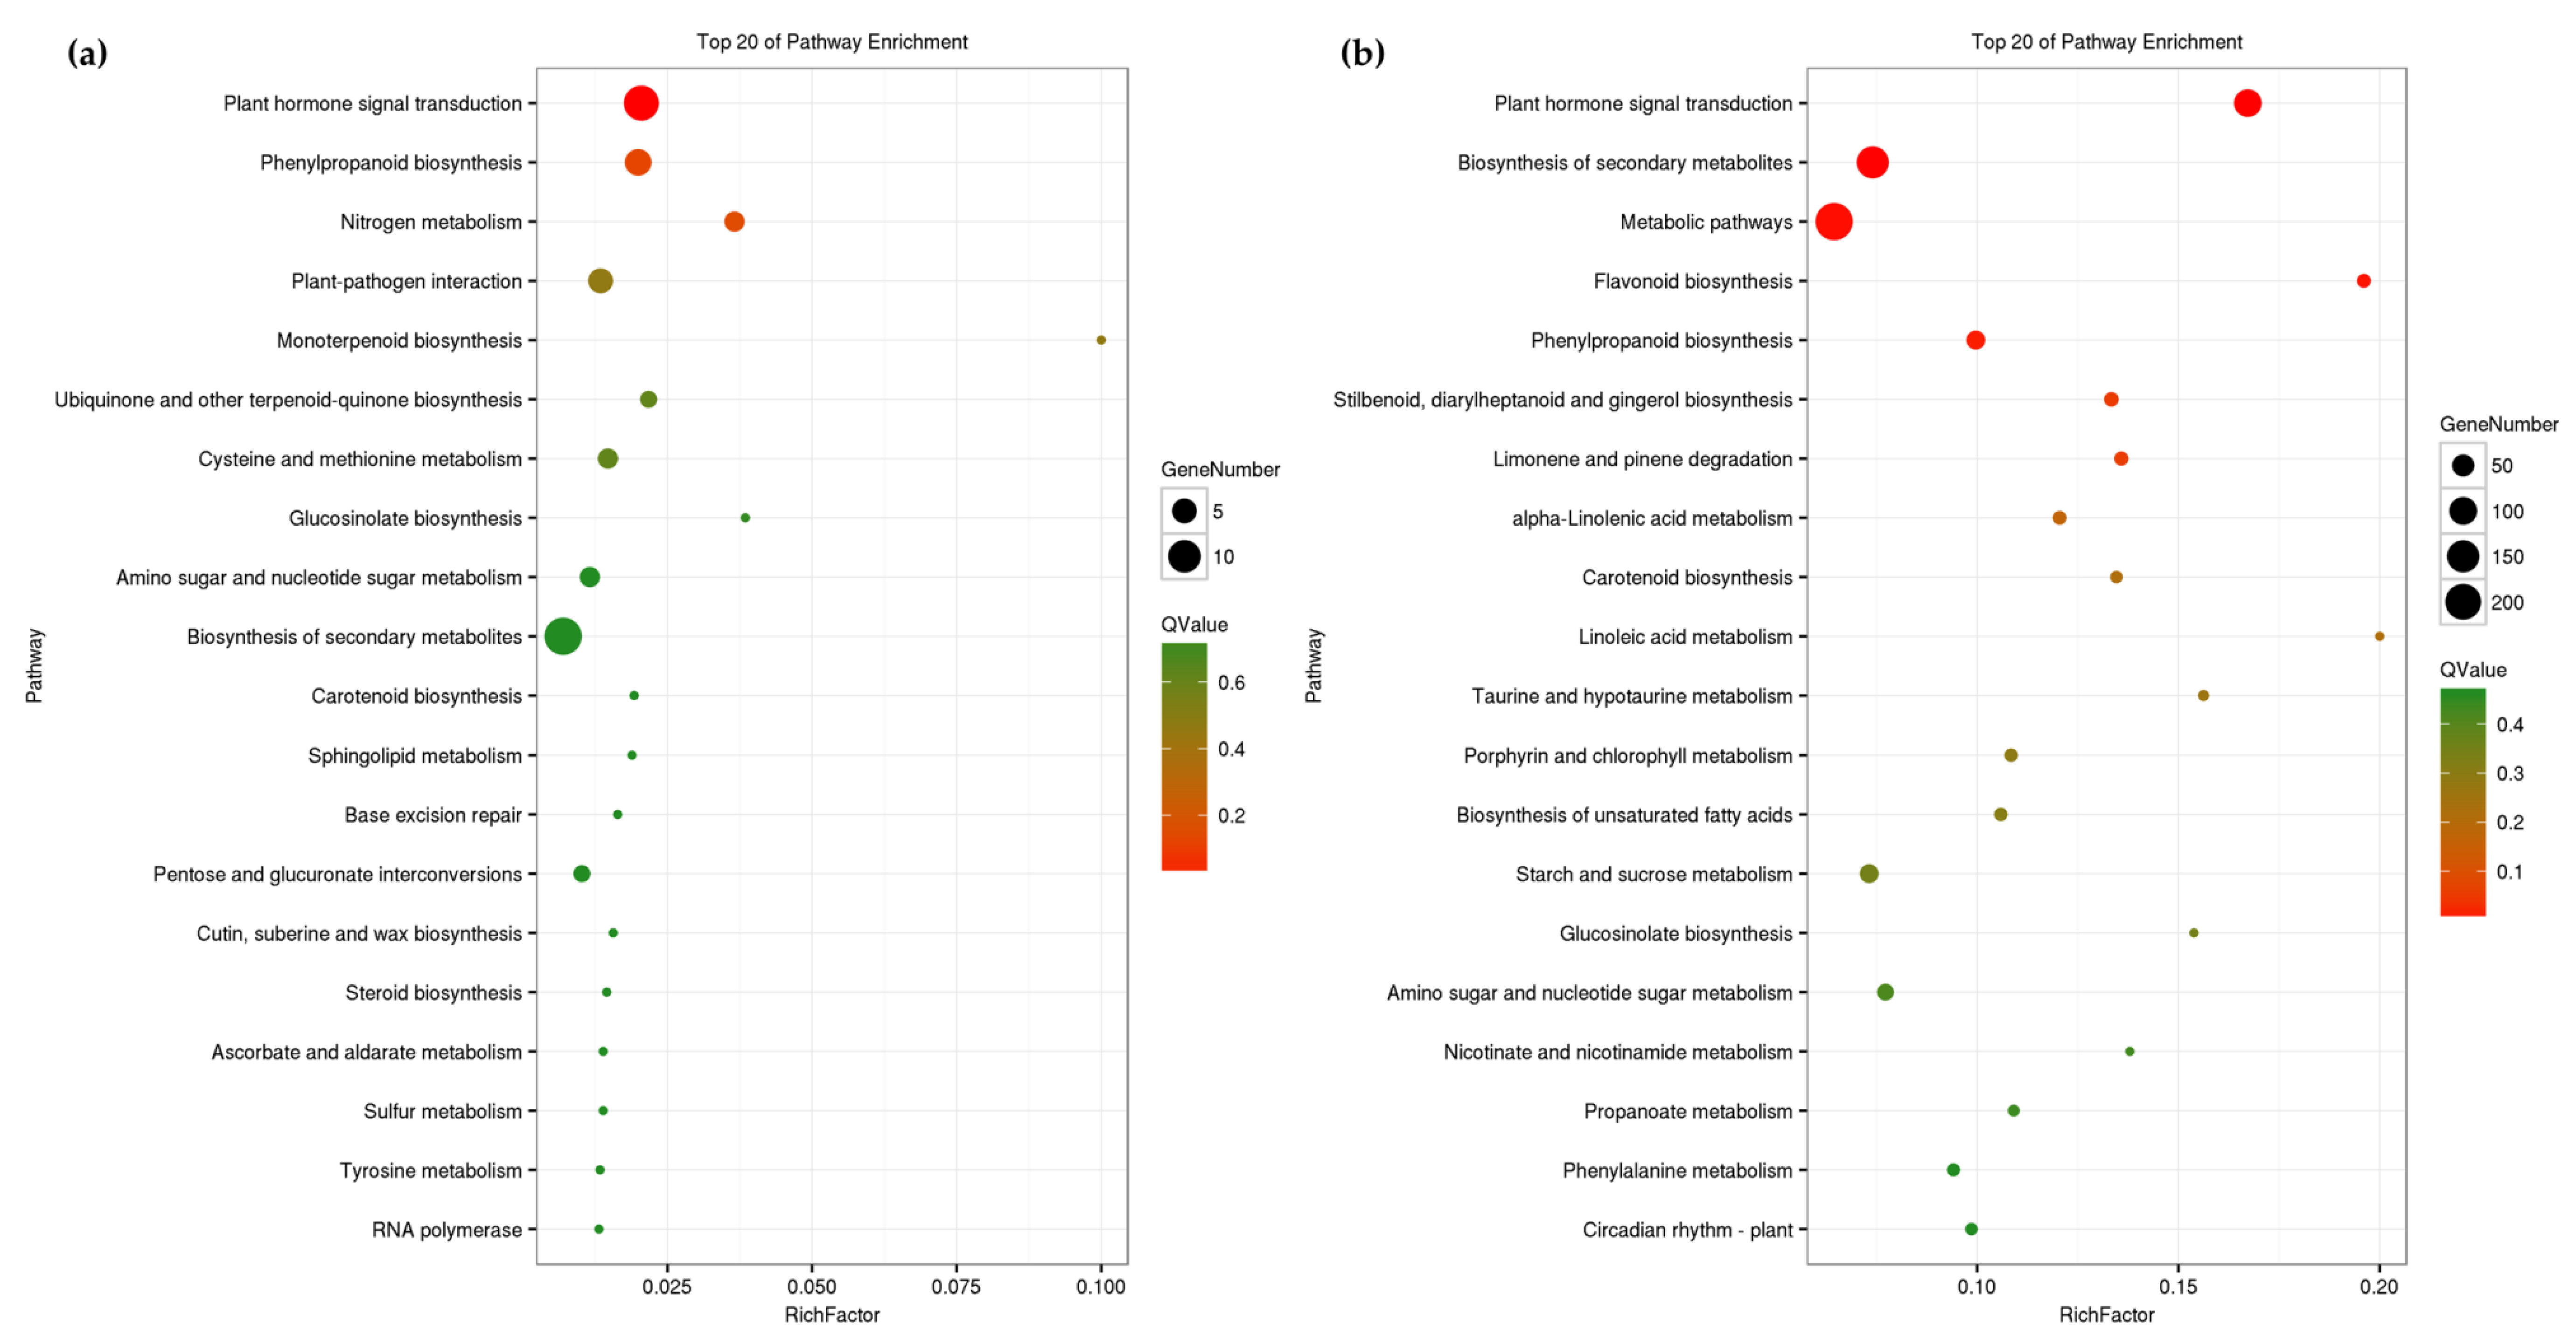
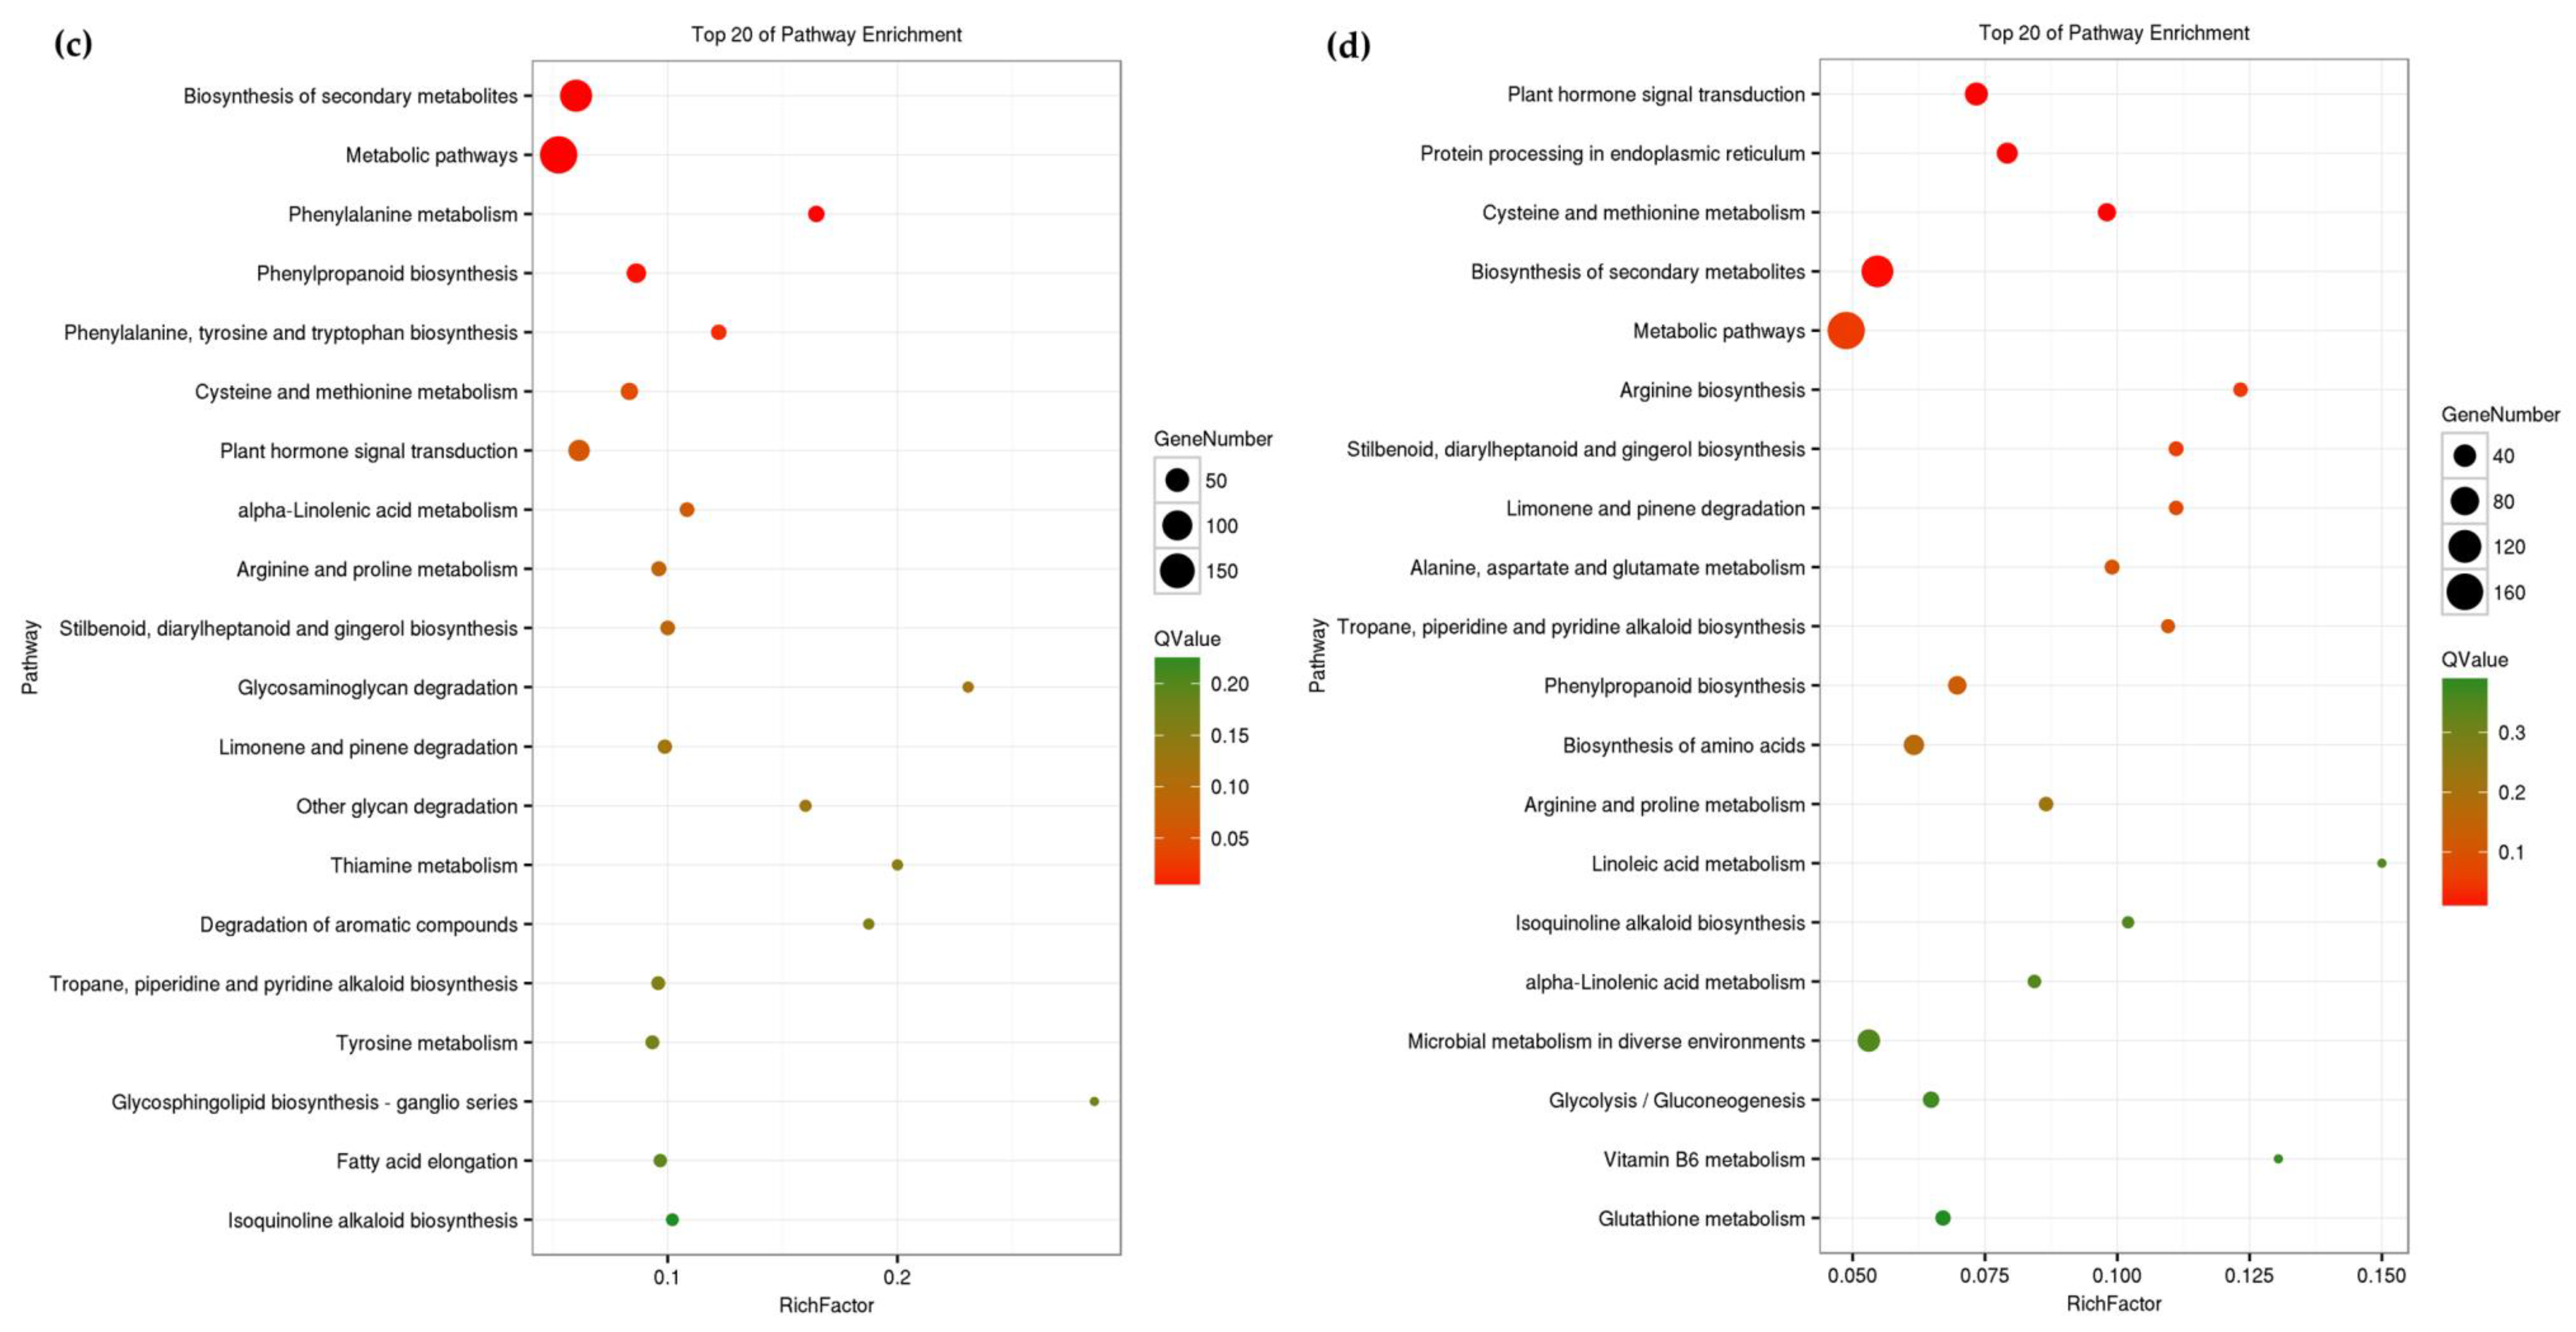
3.4. Functional Enrichment Analysis

Given the difference in the number of DEGs in response to the two P. brassicae pathotypes at 4 dpi, we examined KEGG pathway enrichment at this time point. The top 20 enriched pathways are shown in Supplementary Table S4. A comparison between LAB-4 and control samples revealed that the DEGs were enriched in “plant hormone signal transduction” (ko04075), “phenylpropanoid biosynthesis” (ko00940), “nitrogen metabolism” (ko00910), and “plant–pathogen interaction” (ko04626) pathways (p < 0.05) (Supplementary Tables S5, S6, and Figure 4a). Notably, the “plant–pathogen interaction” pathway was not identified as an enriched pathway in the comparison between SCCD-52 and LAB-4 samples at the same time point (Figure 4c), suggesting that the CR gene is an early marker for P. brassicae infection. Given that changes in DEG profiles as a function of post-inoculation time differed for the two P. brassicae pathotypes, we also performed KEGG pathway enrichment analysis at 8 dpi. The top 20 enriched pathways are shown in Supplementary Tables S7 and S8. “Plant hormone signal transduction” was significantly enriched (with the highest RichFactor) in the comparison between LAB-4 and control samples, and the number of DEGs was higher at this time point than at 4 dpi (Figure 4b). Thus, plant hormone signaling likely plays an important and sustained role in the resistance to avirulent P. brassicae. The number of DEGs in the “plant–pathogen interaction” pathway was also increased; however, this pathway was not enriched in SCCD-52-infected plants at 8 dpi. Additionally, “plant hormone signal transduction” was enriched in the comparison between avirulent LAB-4 and virulent SCCD-52 (Figure 4d). Thus, plant hormone signaling mediates the resistance of Chinese cabbage to clubroot.

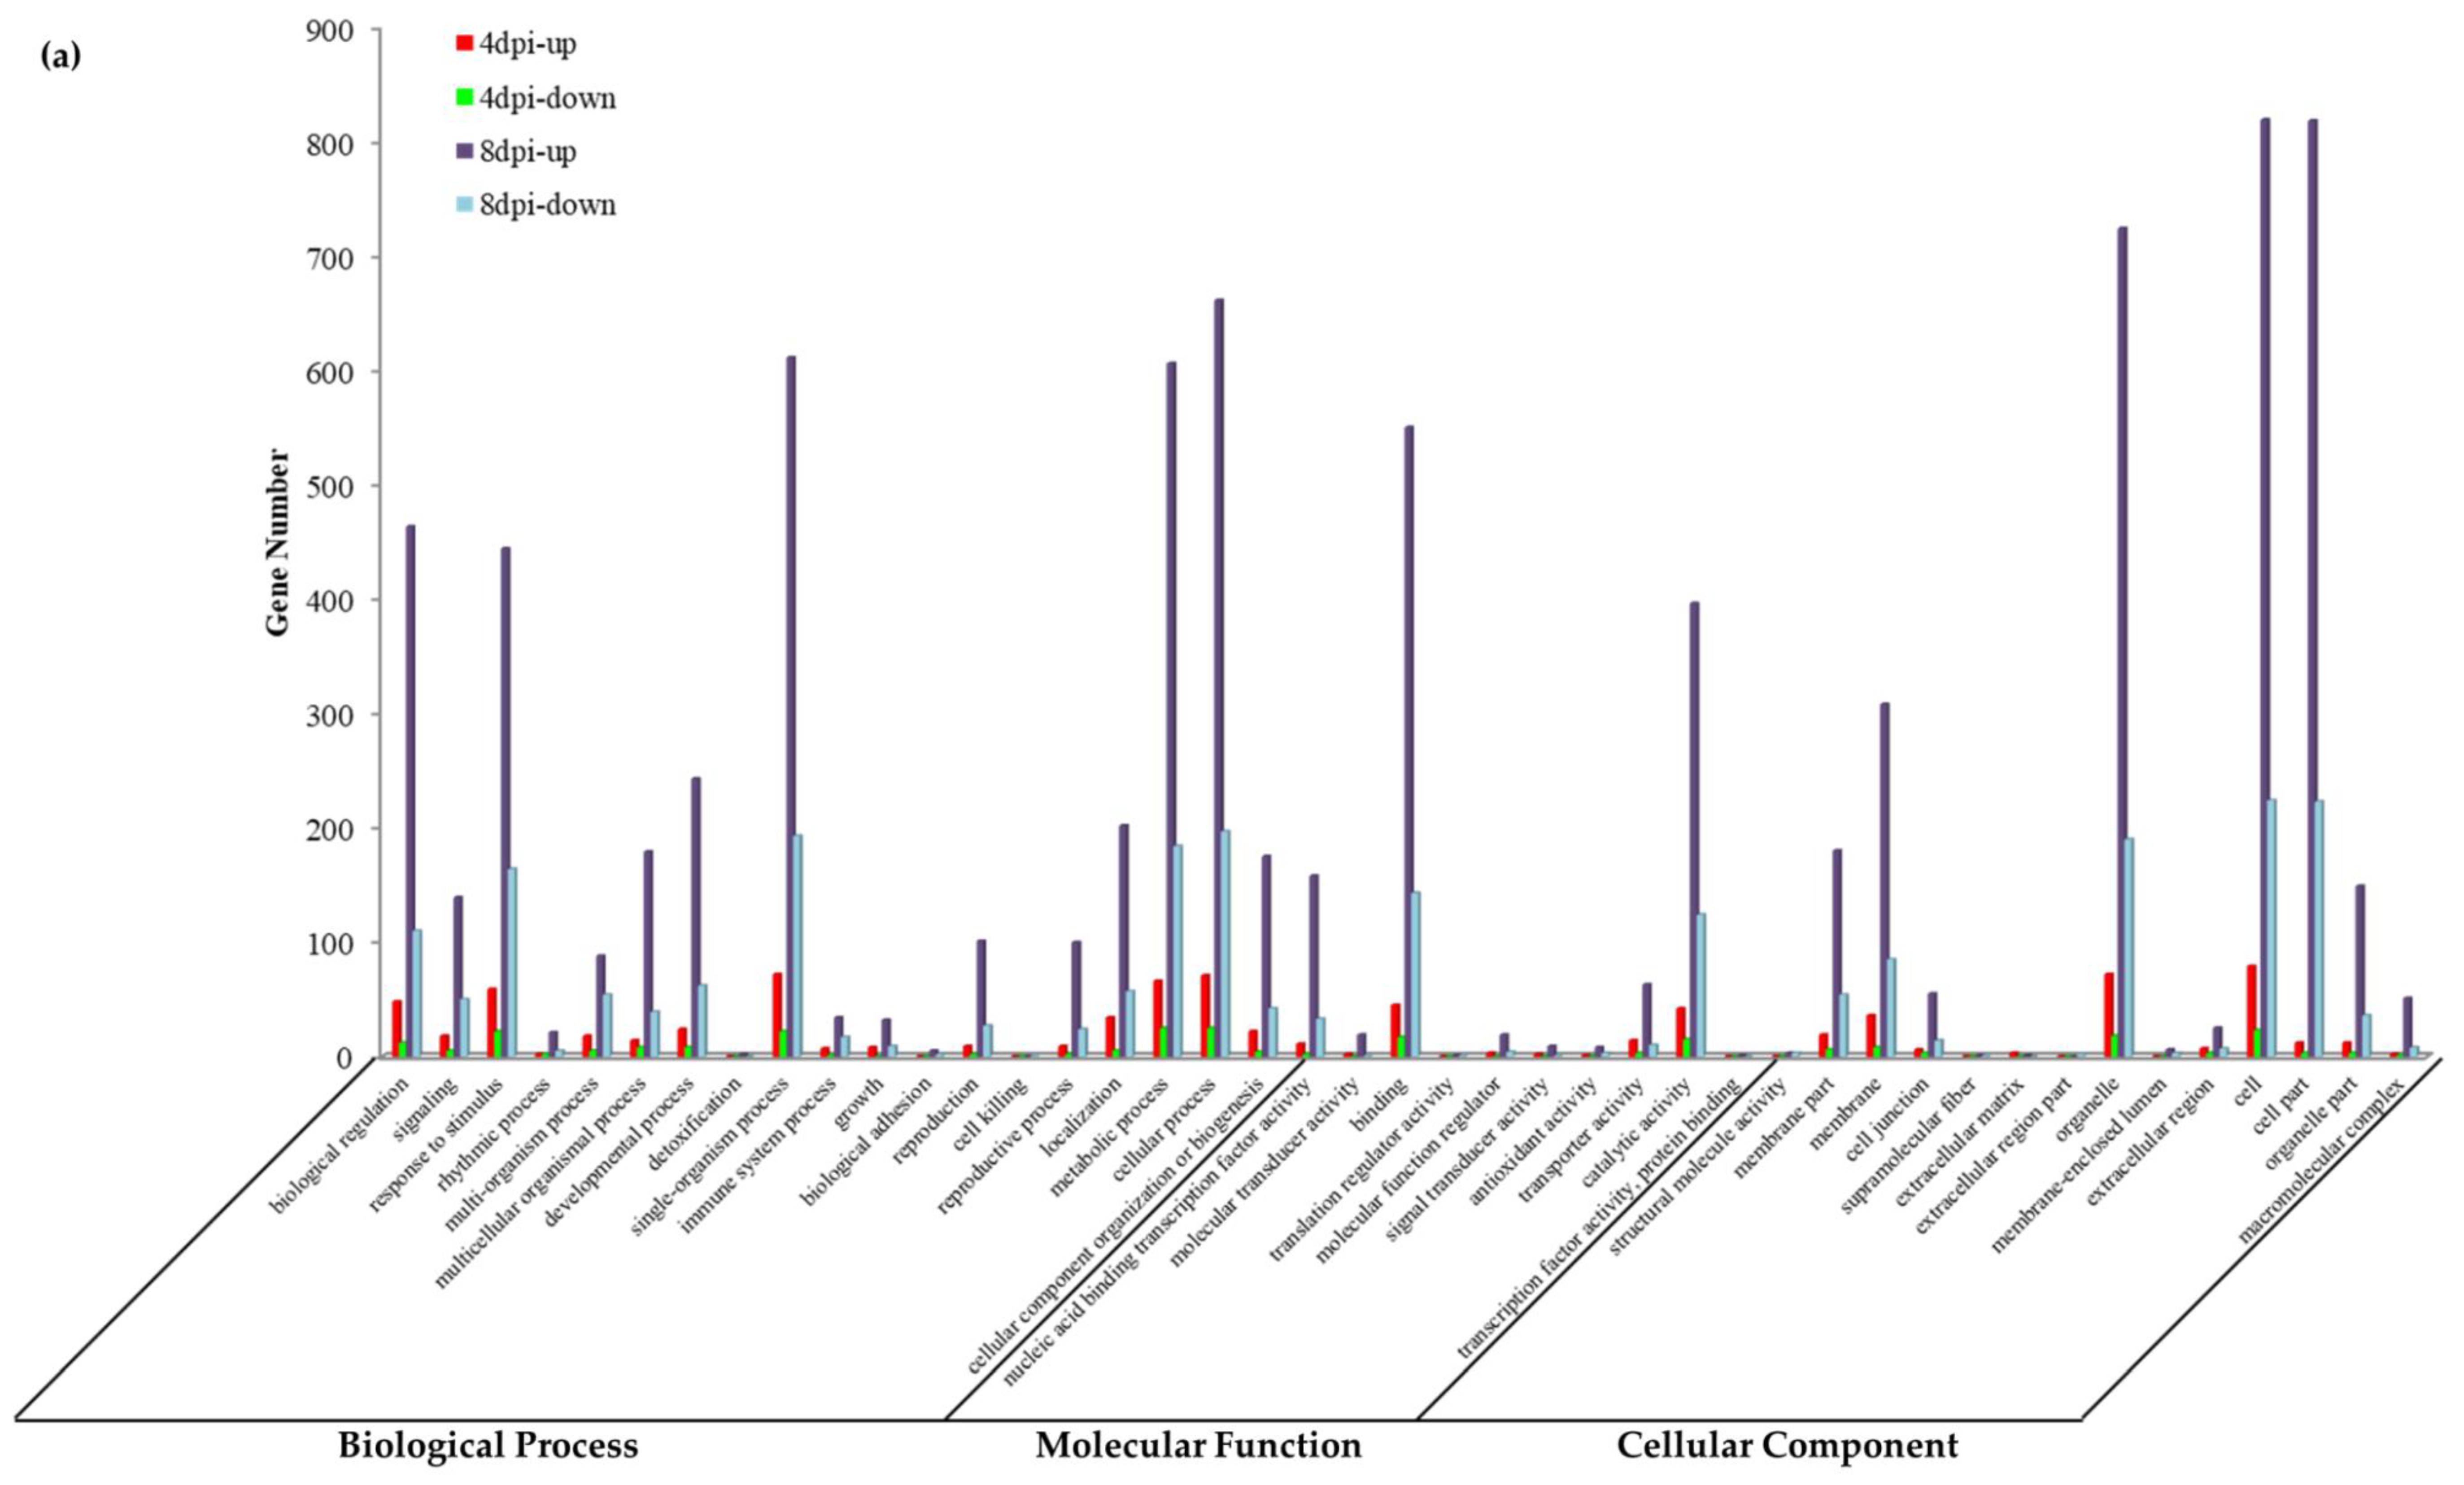
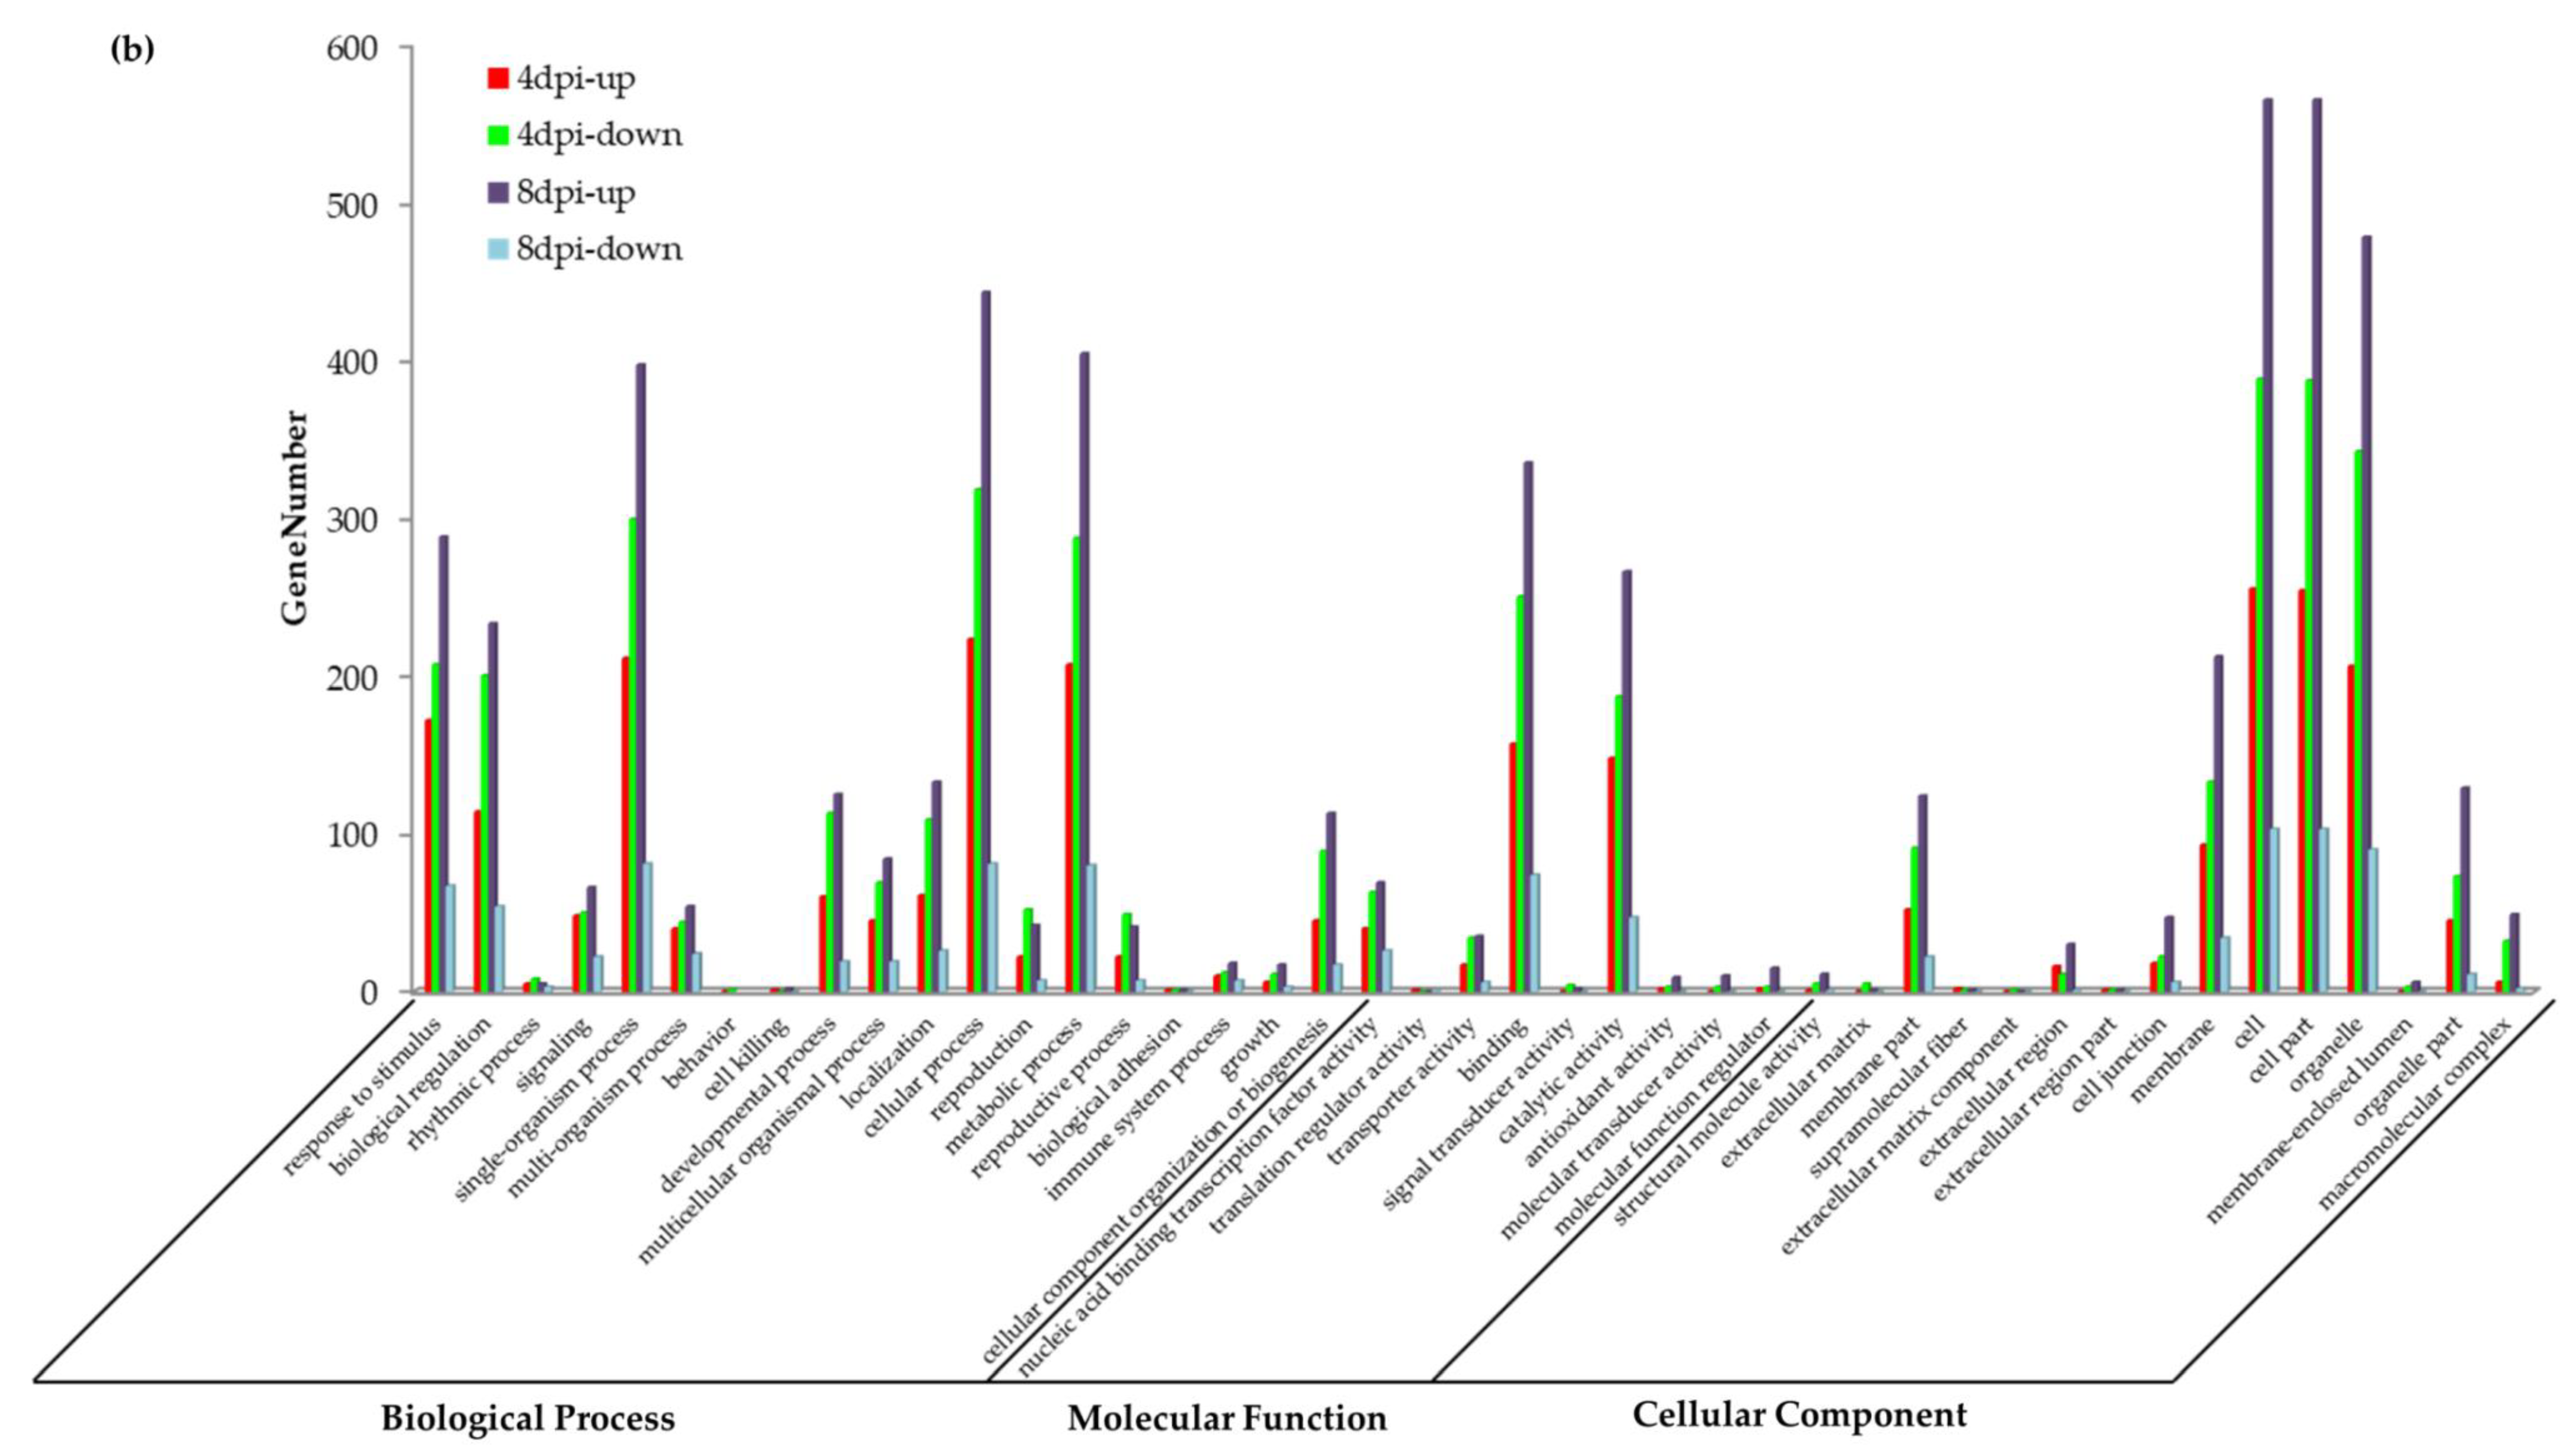
3.5. GO Analysis of DEGs during P. brassicae Infection

To further investigate the biological functions of the DEGs and verify the results of the KEGG analysis, the GO classifications of DEGs in the LAB-4 vs. control and LAB-4 vs. SCCD-52 comparisons at the two time points were examined in the context of all genes in the B. rapa genome (Figure 5a,b). The top five subcategories in the biological process class were “cellular process”, “metabolic process”, “single-organism process”, “response to stimulus”, and “biological regulation”. The most frequently represented molecular function categories were “binding”, “catalytic activity”, and “nucleic acid binding transcription factor activity”; and the most highly represented cellular component categories were “cell”, “cell part”, and “organelle”. The top 10 GO terms in the biological process category for the LAB-4 vs. control comparison are shown in Table 2 and Table 3. Similar to the results of the KEGG pathway enrichment analysis, “hormone-mediated signaling pathway”, “cellular response to hormone stimulus”, “regulation of meristem development”, and “cellular response to endogenous stimulus” were represented at both time points, and the number of DEGs was significantly higher at 8 dpi. On the other hand, “JA metabolic process”, “regulation of phosphorelay signal transduction system”, and “regulation of intracellular signal transduction” were enriched at 4 and 8 dpi in the LAB-4 vs. SCCD-52 comparison (Table 4 and Table 5). This suggests that plant hormone signal transduction plays a key role in the defense response to P. brassicae. The relative expression levels of pathway genes at the two time points are shown in Figure 6.

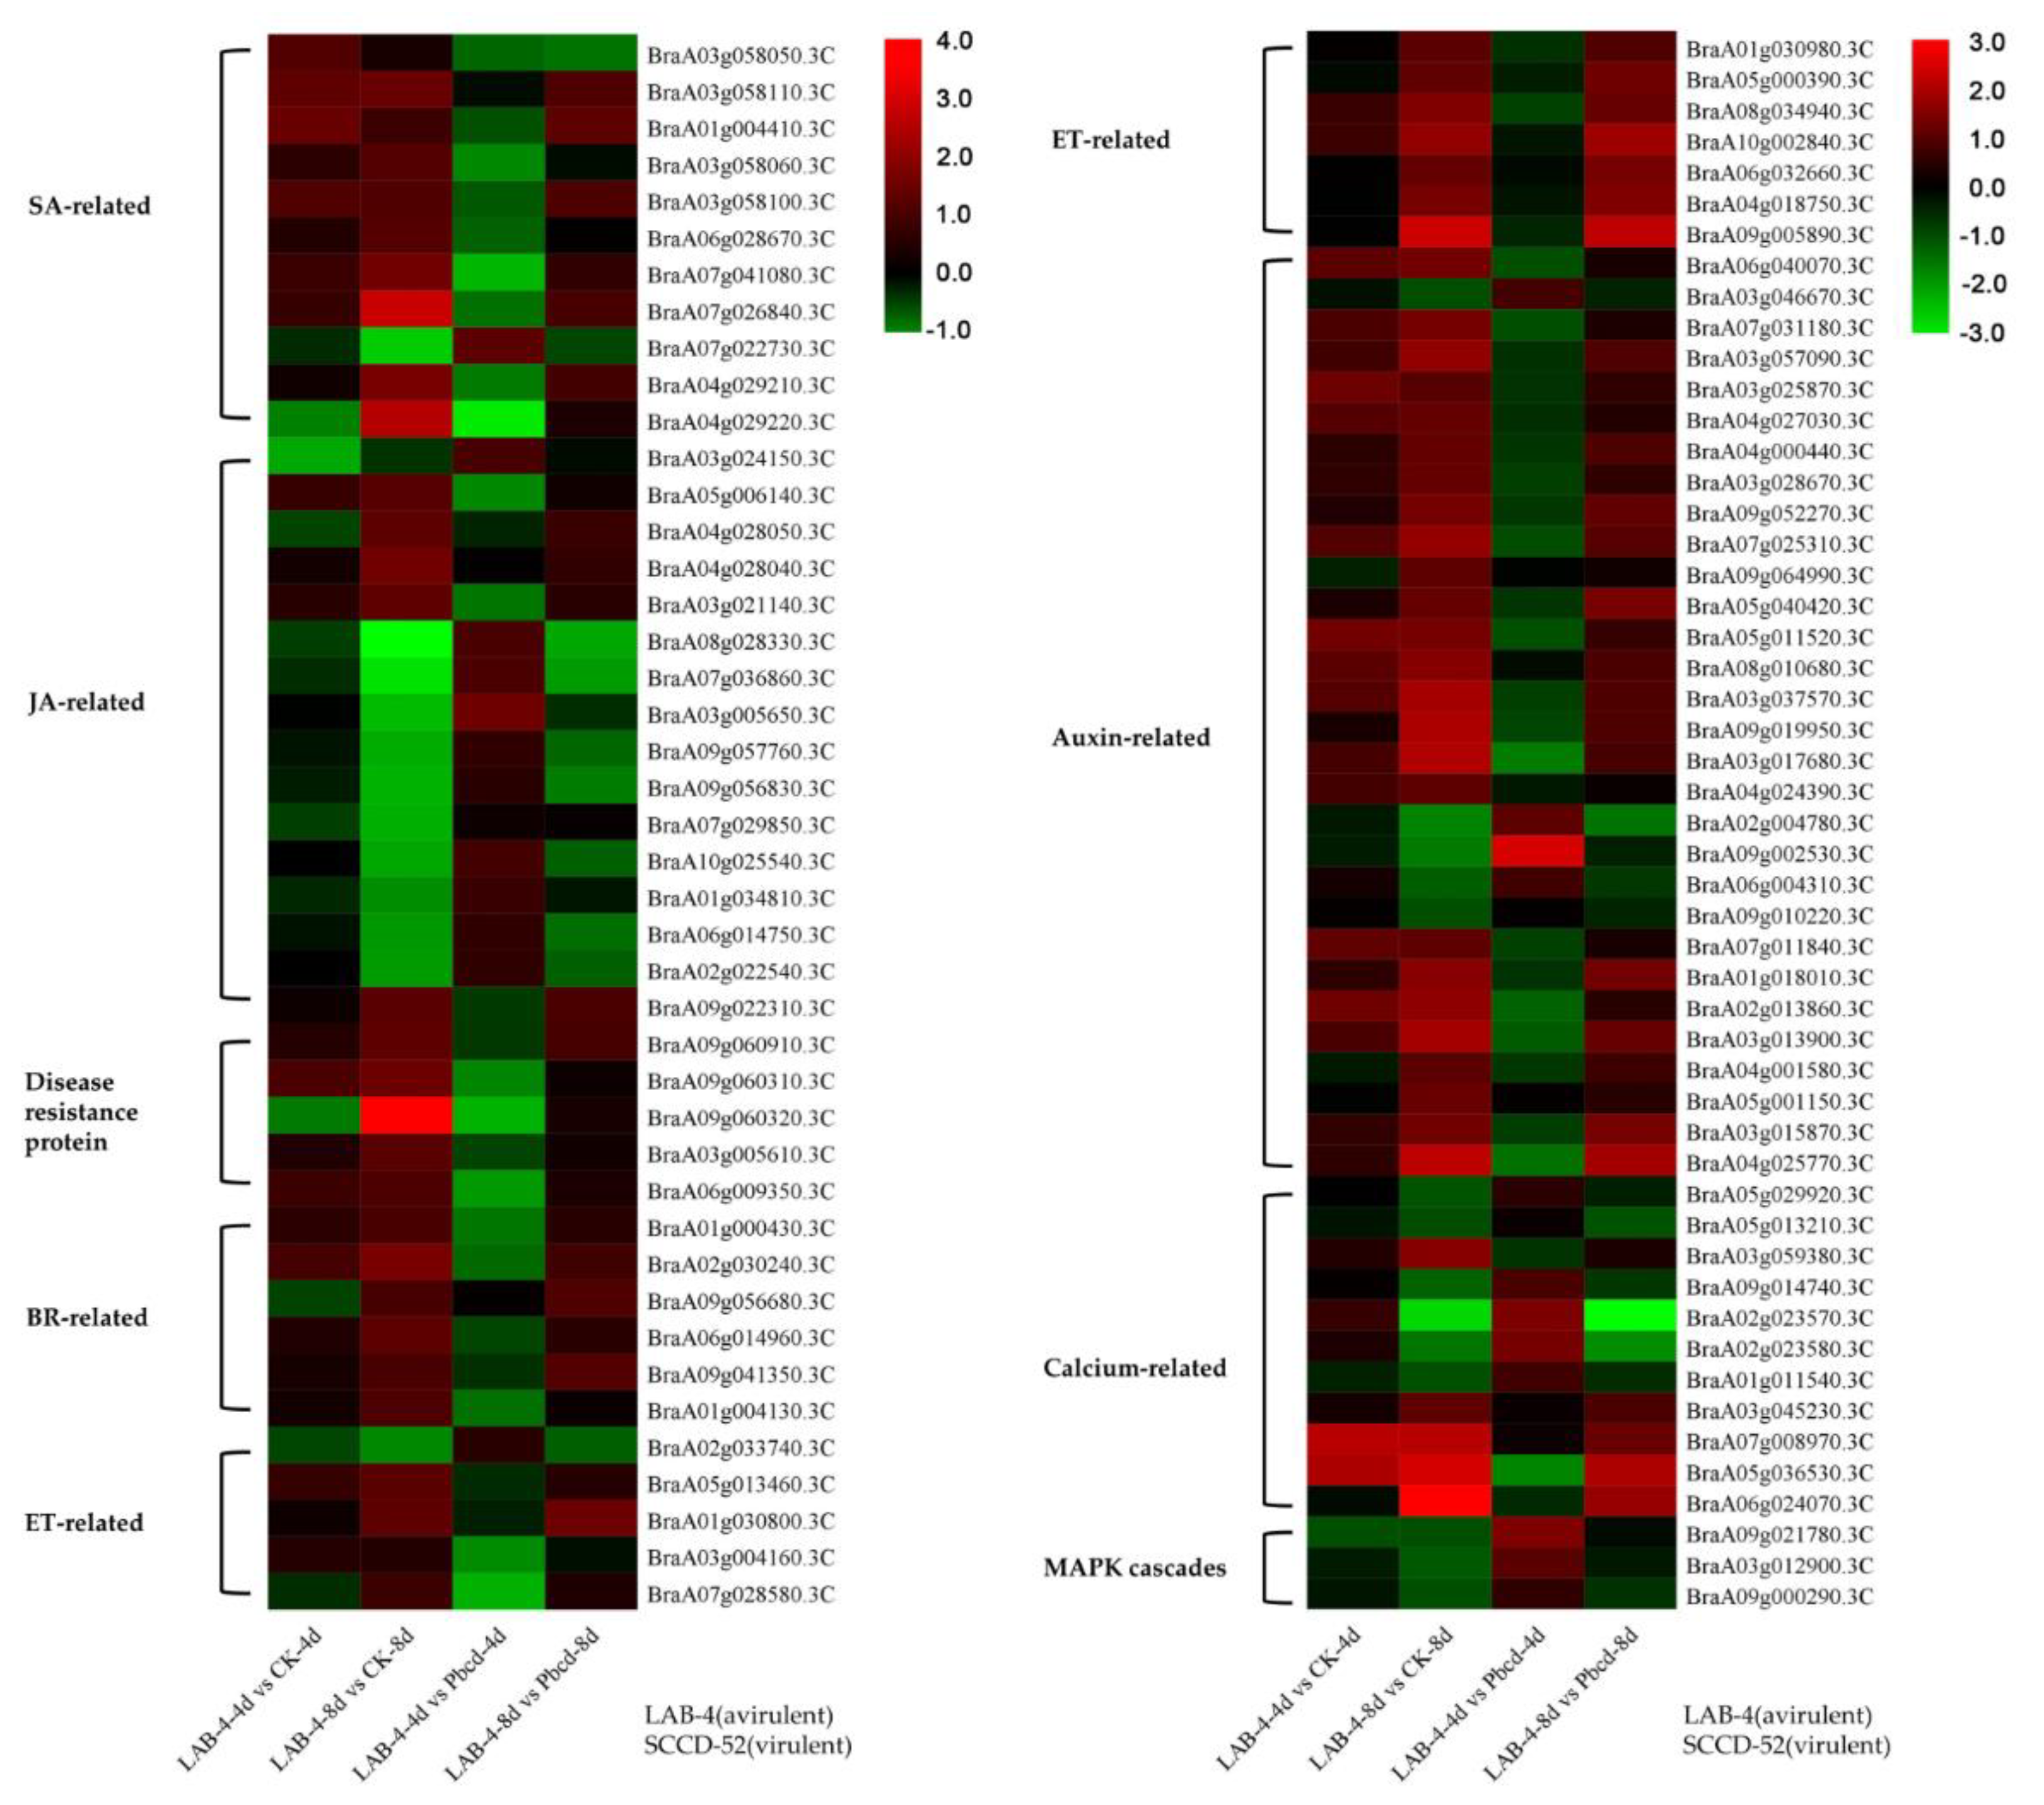
3.6. DEGs Involved in Resistance to P. brassicae

The results of the KEGG and GO analyses showed that “plant hormone signal transduction” and “plant–pathogen interaction” pathways are involved in the immune response to P. brassicae. We further examined 94 genes related to the two pathways including 30 related to auxin, 15 to JA, 12 to ET, 11 to SA, 11 to Ca2+, six to BR, and three to the phosphorylation signaling along with five related to disease resistance. A heat map generated based on the fold expression level of control plants and those infected with avirulent (LAB-4) and virulent (SCCD-52) P. brassicae showed that genes related to SA, ET, and BR and signal transduction as well as auxin-responsive genes were up-regulated at 8 dpi (Figure 6 and Supplementary Table S9). The expression of genes involved in JA regulation increased whereas that of genes encoding JA inhibitory factors decreased at the late stage of infection; meanwhile, phosphorylation signaling pathway-related genes was activated at 4 dpi in LAB-4. However, as in plants lacking the CR locus, CR B. rapa was susceptible to infection with the virulent SCCD-52 pathotype [30]. These results imply that PTI plays an important role in the resistance of B. rapa to P. brassicae at the late stage of infection, which may involve induction of plant hormone signal transduction and plant–pathogen interactions.

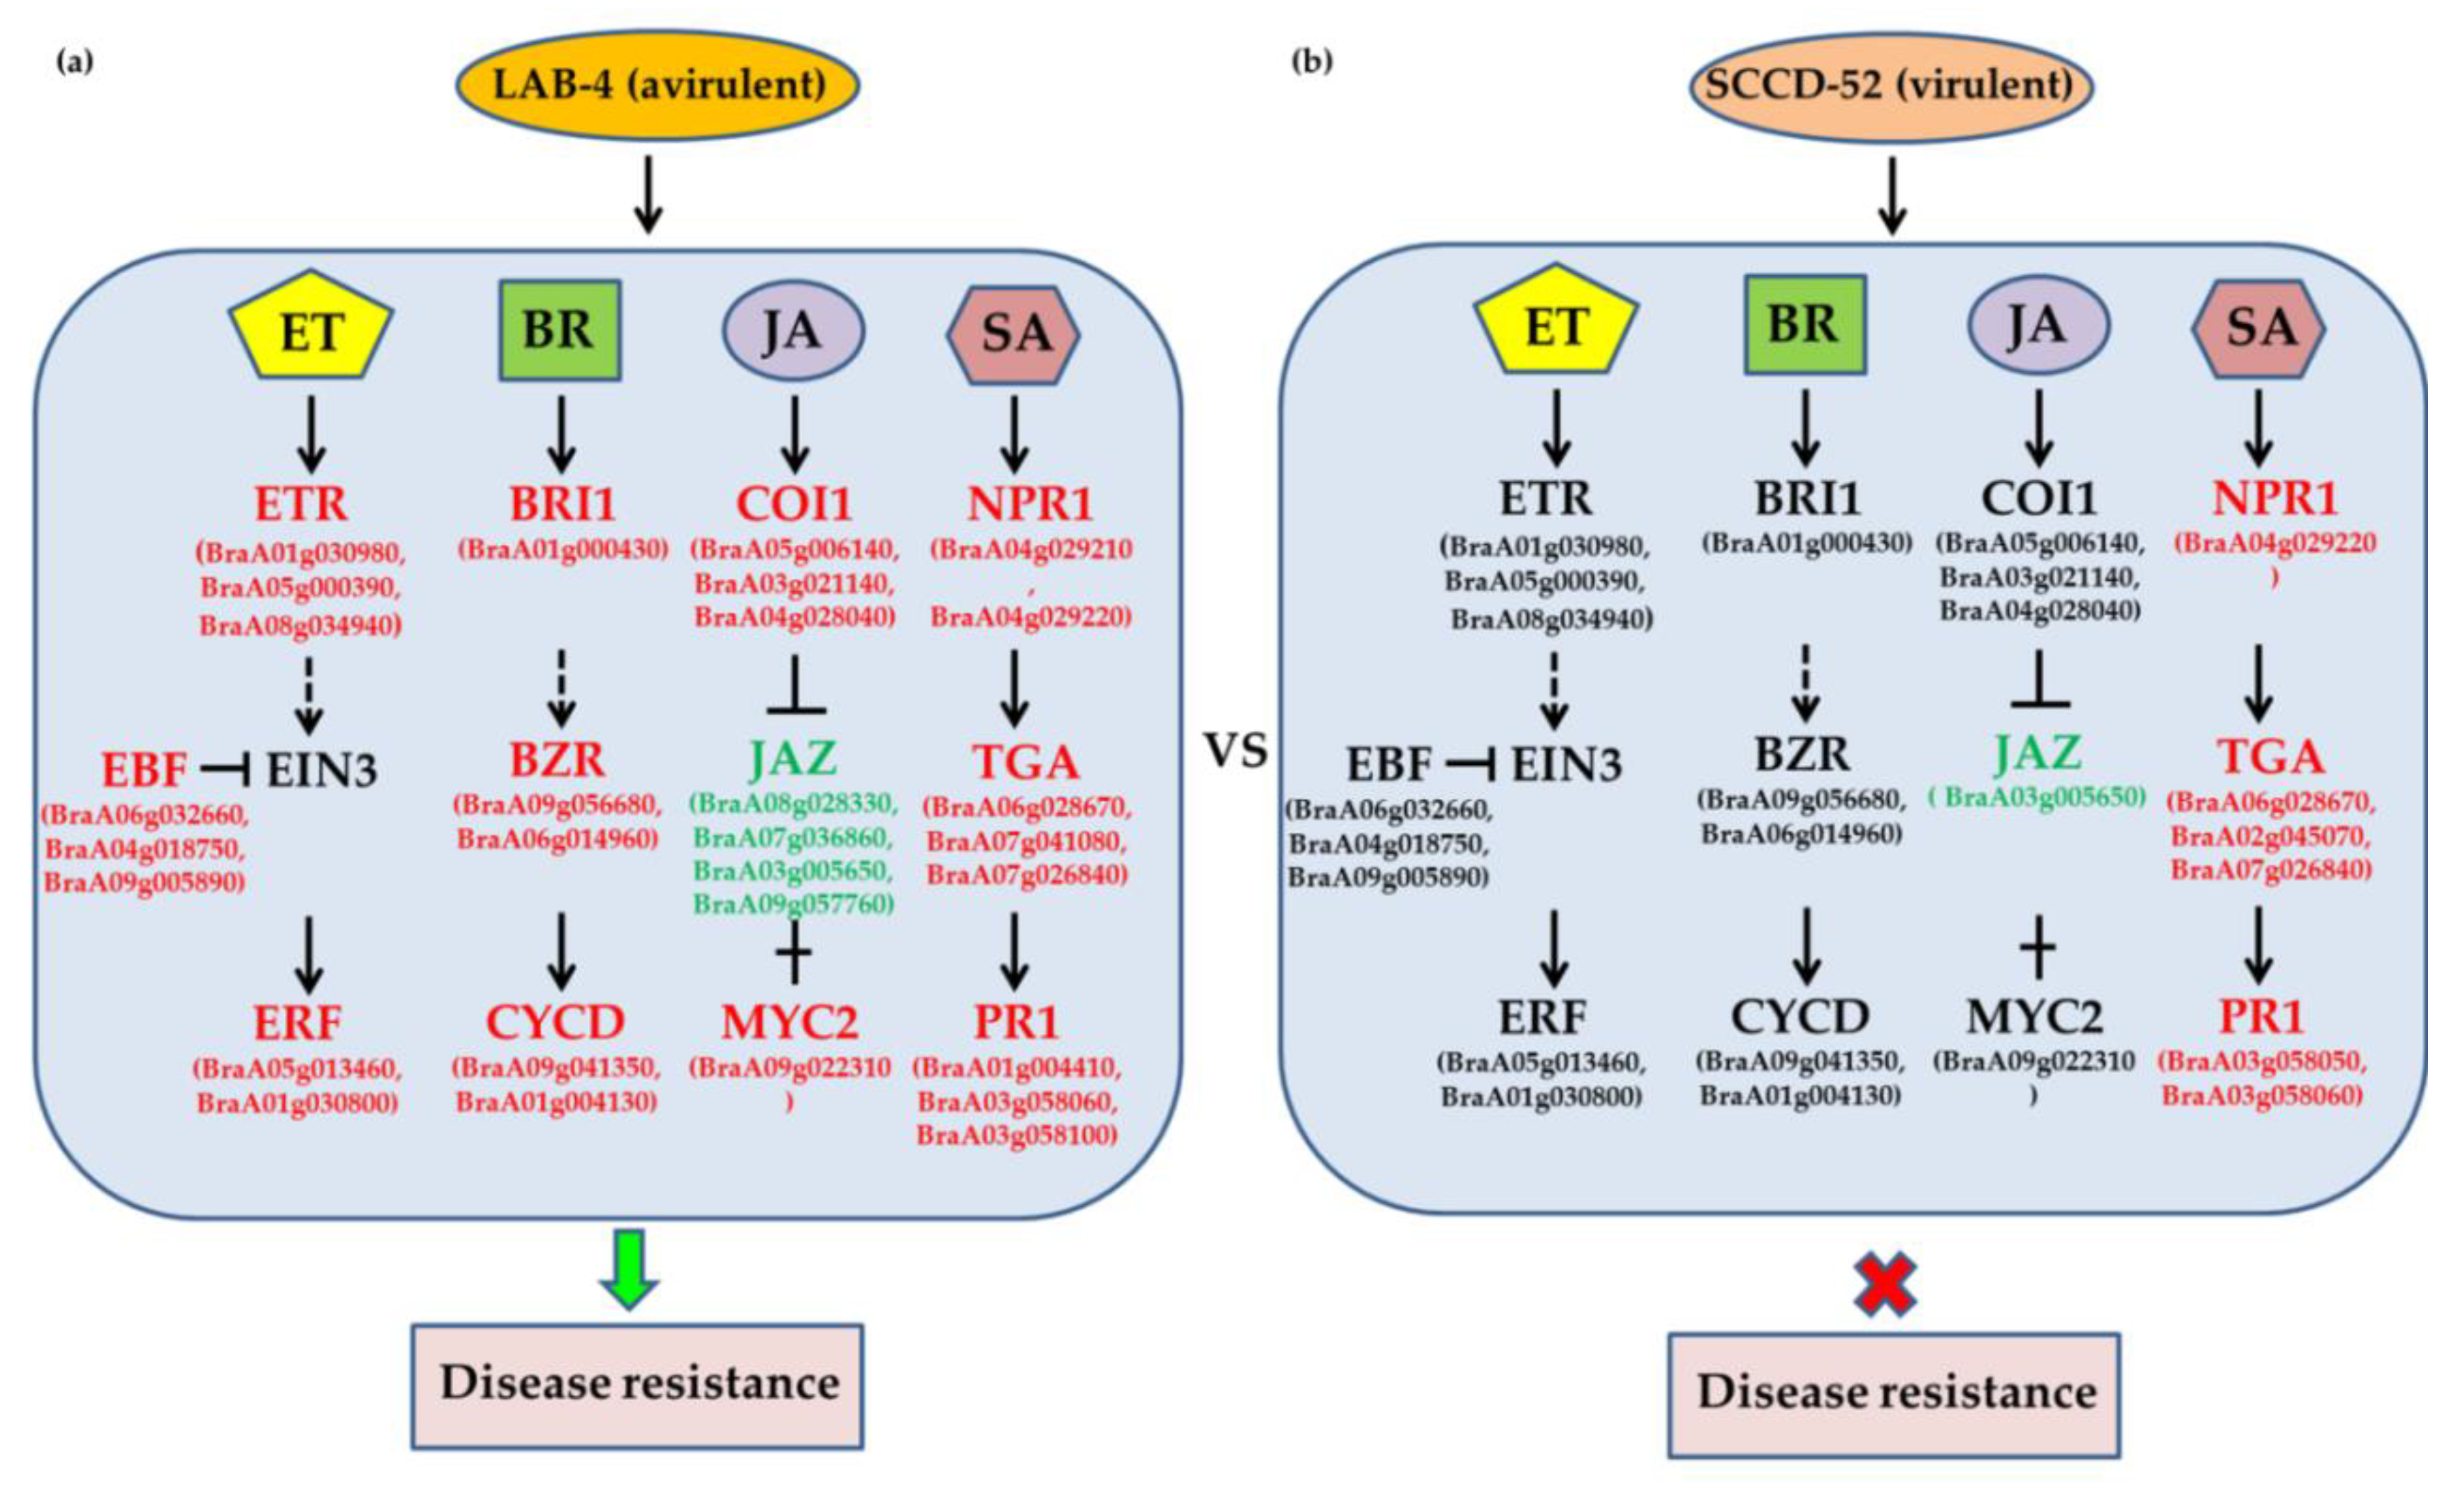
3.7. JA, ET, and BR Signaling Are Important for Host Response at the Late Stage of Infection with Avirulent LAB-4

We analyzed plant hormone signal transduction pathways that were differentially activated between LAB-4- or SCCD-52-infected plants and controls at 8 dpi. There was a clear difference in plant hormone signaling pathway activation between plants infected with avirulent LAB-4 vs. virulent SCCD-52 (Figure 7a,b). In the presence of the CRd gene, SA-, ET-, JA-, and BR-related genes were up-regulated upon LAB-4 infection with the exception of jasmonate ZIM-domain (JAZ), which is a JA inhibitory factor. In contrast, only SA-related genes were up-regulated in response to SCCD-52 infection. Although the SA signal transduction pathway is up-regulated during the infection of both P. brassicae, while the host does not show resistance when only SA is up-regulated in SCCD-52 (virulent). These results suggest that resistance to avirulent LAB-4 is not due to accumulation of SA and that JA, ET, and BR signal transduction pathways are more important for the host response to avirulent pathogen at the late stage of infection.

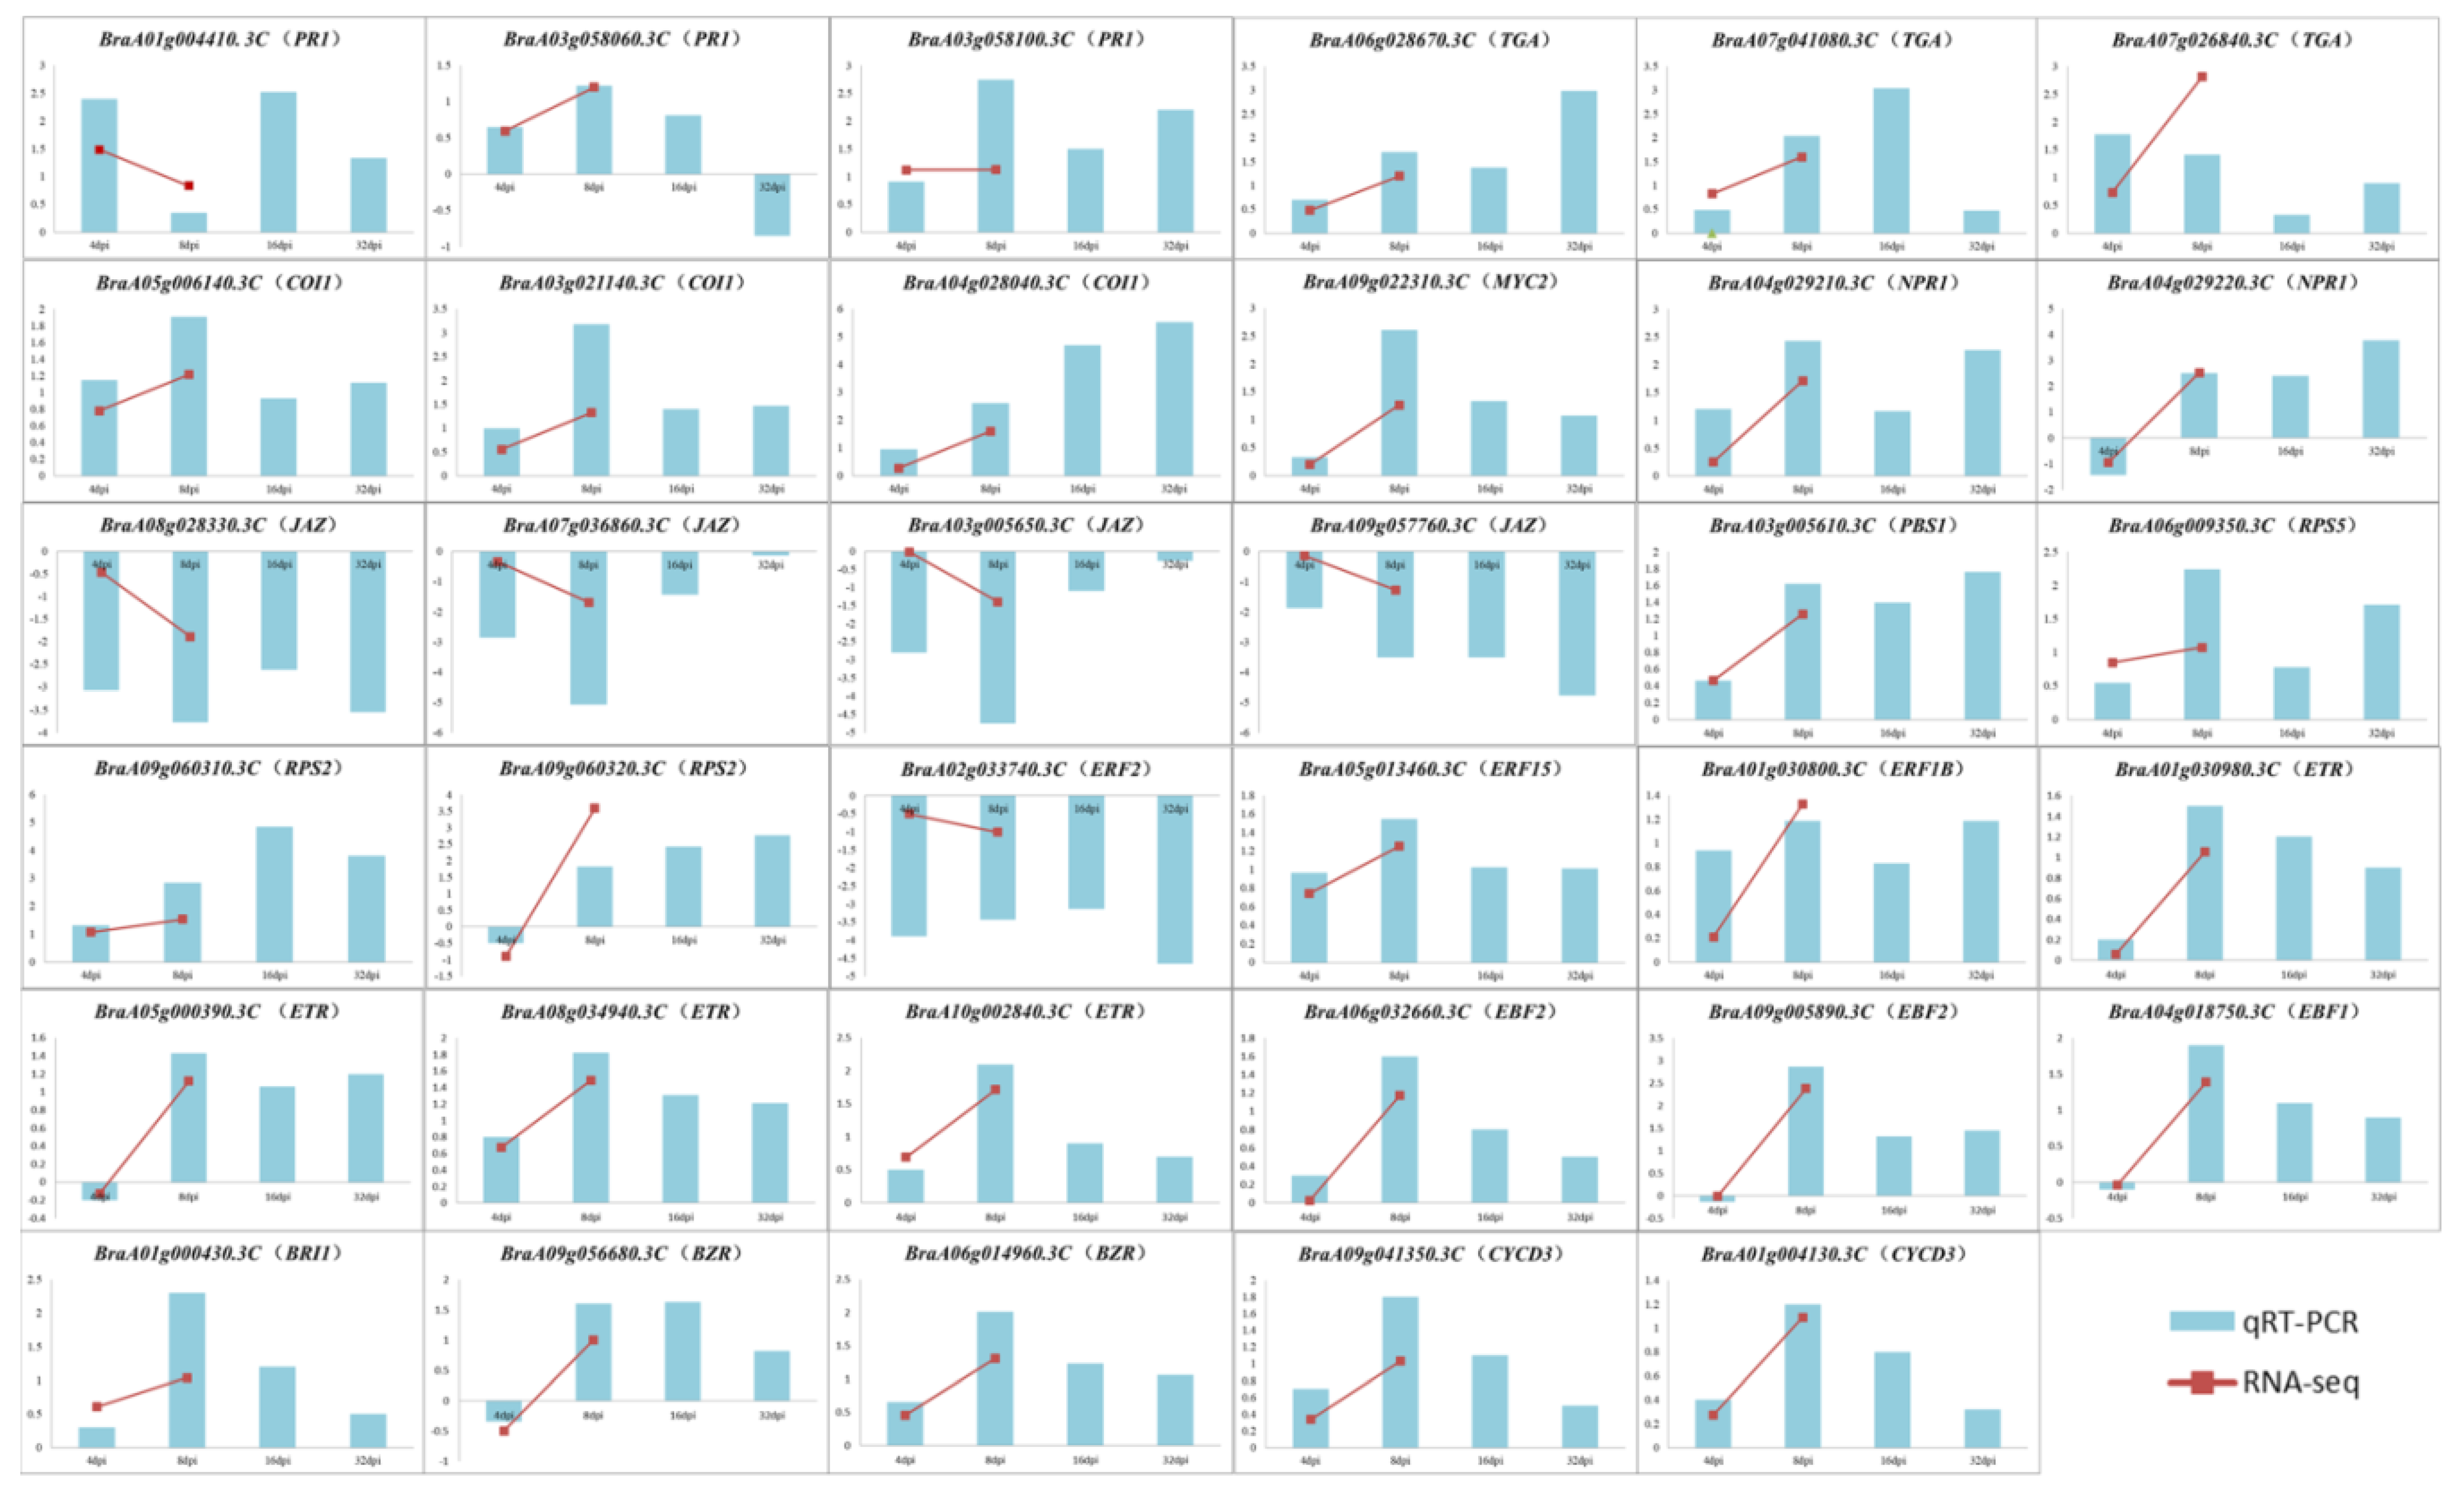
3.8. Validation of DEGs by RT-qPCR

To validate the RNA-seq results, the expression levels of DEGs related to the SA, JA, ET, and BR signaling pathways and disease resistance in LAB-4-infected and control plants were analyzed by RT-qPCR (Figure 8 and Supplementary Table S8) at 4 and 8 dpi and two additional time points (16 and 32 dpi). The BraA06g028670.3C, BraA07g041080.3C, and BraA07g026840.3C genes encoding the SA-responsive transcription factors (TGA) and BraA04g029210.3C and BraA04g029220.3C genes encoding SA regulatory proteins (NONEXPRESSOR OF PR GENES 1, NPR1) were induced while BraA01g004410.3C, BraA03g058060.3C, and BraA03g058100.3C (PR1) genes were overexpressed upon LAB4 infection [48,49]. The JA signaling-associated genes BraA05g006140.3C, BraA03g021140.3C, and BraA04g028040.3C (CORONATINE-INSENSITIVE 1, COI1)—which mediates JA signaling by promoting hormone-dependent ubiquitination and degradation of JAZ transcriptional repressor proteins [50,51]—and the BraA09g022310.3C gene (MYC2) encoding a related transcription factor [52] were up-regulated at each of the examined time points [53]. The ET receptor genes BraA01g030980.3C, BraA05g000390.3C, BraA08g034940.3C, and BraA10g002840.3C (ETR); EIN3-binding F-box protein-encoding genes BraA06g032660.3C (EBF2), BraA09g005890.3C (EBF2), and BraA04g018750.3C (EBF1); and ET response factor (ERF)-encoding genes BraA05g013460.3C (ERF15) and BraA01g030800.3C (ERF1B) were also up-regulated. The BR receptor gene BraA01g000430.3C (BR-INSENSITIVE 1, BRI1), BR-activated transcription factor-encoding genes BraA09g056680.3C and BraA06g014960.3C (BRASSINAZOLE-RESISTANT2, BZR2), and cell division-related genes BraA09g041350.3C and BraA01g004130.3C (D-TYPE CYCLIN 3, CYCD3)—which have similar expression patterns—were aberrantly expressed, as in the case of auxin-related genes. The levels of disease resistance genes BraA09g060310.3C (RESISTANT TO P. SYRINGAE 2, RPS2), BraA09g060320.3C (RPS2), BraA06g009350.3C (RESISTANT TO P. SYRINGAE 5, RPS5), and BraA03g005610.3C (PBS1) increased at 8, 16, and 32 dpi (Figure 8). The RT-qPCR results were mostly consistent with those obtained by RNA-seq and confirm the involvement of specific genes and pathways in LAB-4 infection.

4. Discussion

The host defense response to P. brassicae infection and clubroot progression has been investigated in genomic studies. More than 1000 genes were reported to be differentially expressed in clubroot-infected Arabidopsis roots compared with those of uninfected plants [38]. In the current study, the B. rapa disease-resistant variety “85–74” harboring the CRd gene [23] was inoculated with avirulent LAB-4 or virulent SCCD-52 P. brassicae; transcriptome sequencing revealed a large number of DEGs at 0 h and 4 and 8 dpi. The two major KEGG pathways represented by the DEGs were “plant hormone signal transduction” and “plant–pathogen interaction”; 94 DEGs in these pathways were identified by searching data from the literature and through a keyword search of the B. rapa genome database, and are discussed in detail below.

4.1. Expression of Phosphorylation-Related and Ca2+ Signaling Pathway Genes Is Altered by P. brassicae Infection

PRRs on the surface of plant cells recognize pathogens by sensing PAMPs, thereby inducing PTI. Key PRR genes activated by PAMPs include flagellin sensing 2 (FLS2), which transduces signals that trigger PTI [54]. Upon pathogen infection, WRKY-type transcription factors are up-regulated whereas DEGs encoding members of other transcription factor families are down-regulated [55]. WRKY-type transcription factors function in a complex defense response network as both positive and negative regulators of plant immunity [56]. Mitogen-activated protein kinase (MAPK) signaling components include three proteins activated by sequential phosphorylation—namely MAPK, MAP2K, and MAP3K [57]; MAPK activation is one of the earliest signaling events following pathogen detection [58]. In this study, the levels of BraA09g021780.3C (FLS2), BraA03g012900.3C (MKK6), and BraA09g000290.3C (WRKY22) were lower in LAB-4-infected plants than in controls (Figure 6 and Supplementary Table S7), but were higher in plants infected with avirulent (LAB-4) as compared to virulent (SCCD-52) P. brassicae at 4 dpi. This indicates that the phosphorylation signaling pathway was responding to the stress caused by the pathogen at a relatively early time point after infection. Genes associated with Ca2+ influx and Ca2+ signaling pathways are up-regulated in root tissue of resistant as compared to susceptible B. rapa [29,31]. Ca2+ is an important secondary messenger in signal transduction pathways that regulates plant responses to abiotic and biotic stresses [59]. The B. rapa CALMODULIN-LIKE 39 (CML 39) (BraA02g023570.3C and BraA02g023580.3C), CML 42-LIKE (BraA01g011540.3C), and CYCLIC NUCLEOTIDE-GATED ION CHANNEL (CNGC) (BraA05g029920.3C) genes were up-regulated upon infection with the avirulent pathogen (LAB-4) as compared to the virulent pathogen (SCCD-52) at 4 dpi, whereas the CML 41- (BraA03g045230.3C), CML 22- (BraA07g008970.3C), CML 36- (BraA05g036530.3C), and CML 47- (BraA06g024070.3C)-like genes were up-regulated at 8 dpi (Figure 6 and Supplementary Table S7), indicating that Ca2+ signaling contributes to the plant defense response.

4.2. Auxin and BR-Related Genes Involved in P. brassicae Infection

A microarray analysis of genes expressed during the primary phase of the P. brassicae life cycle in Arabidopsis root showed that the levels of several genes related to signal transduction and primary and secondary metabolism were altered [34]. A similar analysis of Arabidopsis root during different stages of P. brassicae development showed that genes related to auxin, cytokinin, and BR metabolism and signaling were up-regulated [37]. In this study, only five of 30 auxin-related genes were down-regulated whereas 25 were up-regulated in LAB-4-infected B. rapa relative to SCCD-52-infected and control plants at 8 dpi; however, all of the auxin-related genes were down-regulated at 8 dpi (Figure 6 and Supplementary Table S7). BR hormones function in disease resistance in both tobacco and rice [60], and studies in Arabidopsis have demonstrated that BR signaling antagonizes PTI [61,62,63]. Disruption of BRI1 increases disease resistance against necrotrophic and hemibiotrophic pathogens that have a short asymptomatic phase, but has no effect on biotrophic pathogens or those with a prolonged asymptomatic phase [64]. BRI1 KINASE INHIBITOR 1 (BKI1) inhibits the transphosphorylation-mediated activation of the BRI1-BAK1 receptor complex [65,66,67]. In addition, the BR-activated transcription factor BZR represses the expression of genes such as FLS2 and SUPPRESSOR OF NPR1-1, CONSTITUTIVE 1 (SNC1) that are directly involved in the defense against pathogens [61,68]. In this study, six BR-related genes were up-regulated at 8 dpi, including one BRI1 (BraA01g000430.3C), one BKI1 (BraA02g030240.3C), and two BZR1 (BraA09g056680.3C and BraA06g014960.3C) genes (Figure 6 and Supplementary Table S7), indicating that PTI is suppressed at the late stage of infection with P. brassicae.

4.3. Up-regulation of Disease Resistance Genes in the Late Stage of Infection

Plant R gene products directly or indirectly mediate the recognition of pathogen effector proteins and trigger downstream signaling cascades in innate immunity [1,69]. However, screening for R gene variants conferring resistance to a specific pathogen or new pathogen races is complicated and labor-intensive [70]. In the present study, three RPS2 (BraA09g060910.3C, BraA09g060310.3C, and BraA09g060320.3C), one PBS1 (BraA03g005610.3C), and one RPS5 (BraA06g009350.3C) gene were up-regulated at 8 dpi (Figure 6 and Supplementary Table S7). RPS2 and RPS5 belong to the leucine-rich repeat class and nucleotide binding site leucine-rich repeat class, respectively, of plant R genes [71]; and PBS1 functions in the recognition of pathogen avirulence proteins [72]. Thus, PBS1, RPS2, and RPS5 in B. rapa may be involved in the resistance to P. brassicae infection. The CRd locus was mapped to an interval of approximately 60.4 kb on chromosome A03; four TIR–NBS–LRR candidate genes have been identified in this region [23]. However, the expression levels of these genes did not differ between plants infected with avirulent (LAB-4) as compared to virulent (SCCD-52) P. brassicae. This clubroot resistance was most likely due to sequence differences between the CR regions of resistant and susceptible varieties of B. rapa.

4.4. JA, ET, and BR Signaling Pathways Play a Critical Role in the Response to Avirulent P. brassicae at the Late Stage of Infection

SA, JA, and ET mediate the three major disease resistance signaling pathways. In plants, SA is a hormone that is involved in the defense response to nutrient pathogens, whereas JA and ET are associated with the response to saprophytic pathogens [73]. In the current study, four COI1 genes and one MYC2 gene encoding JA-related transcription factors were up-regulated whereas 11 JAZ genes encoding JA-related transcriptional repressors were down-regulated at 8 dpi in plants infected with LAB-4 as compared to SCCD-52. The JA signaling pathway was inhibited at the early stage but activated at the late stage of infection. Two downstream regulatory genes of SA signaling encoding the transcription factors TGA1 and NPR1 were up-regulated at 8 dpi, whereas the PR1 gene was up-regulated at each time point examined. Meanwhile, the levels of the ET signaling-related genes ETR, EBF, and ERF increased at 8 dpi (Figure 6 and Supplementary Table S7). In contrast to other studies, we found that at the late stage of infection with LAB-4 the SA, JA, ET, and BR signaling pathways were induced; at 8 dpi, the SA signaling pathway was activated upon infection with both LAB-4 and SCCD-52, whereas the JA, ET, and BR signaling pathways were only induced in the former instance (Figure 8A,B). A previous study reported that the non-pathogenic rhizosphere-colonizing bacteria Pseudomonas spp. trigger a similar response known as rhizobacteria-induced systemic resistance that involves JA but not SA signaling [60]. The discrepancies between our results and those of other studies may be due to the different Brassica species or CR genes that were used. Based on these findings, we propose that JA, ET, and BR signaling play key roles in CR in B. rapa “85–74” infected with either avirulent (LAB-4) or virulent (SCCD-52) P. brassicae.

5. Conclusions

In this study, we analyzed the transcriptome profiles of disease-resistant B. rapa seedling roots following infection with avirulent (LAB-4) or virulent (SCCD-52) P. brassicae. We showed that the primary response of B. rapa to infection involves plant hormone signal transduction and plant–pathogen interactions. ETI was enhanced in resistant “85–74”, while ET/JA and BR signaling pathways were found to play important roles in the late stage of infection with avirulent LAB-4. These results provide insight into the mechanisms of B. rapa resistance to clubroot disease, which can improve disease management in B. rapa and other economically important crop species.

Supplementary Materials

The following are available online at https://www.mdpi.com/2073-4395/9/10/589/s1, Figure S1: Abundance distribution map of all sample genes. The x-axis is log10 FPKM, and the higher the value, the higher the gene expression level; the y-axis is the abundance of the gene, i.e., the number of genes corresponding to the expression of the horizontal axis/detecting the total number of expressed genes; Each color in the figure represents a sample; the peak of the distribution curve represents the region where the gene expression of the entire sample is most concentrated, Figure S2: Comparison of gene expression levels between groups. The y-axis is the expression level of the gene, and each box represents a sample group. The line in the middle of the box indicates the median, and the top and bottom sides of the box are the upper and lower quartiles. From the box plot, you can visually compare the expression levels of genes between different groups, Table S1: qRT-PCR primer information, Table S2: RNA-seq data evaluation statistical, Table S3: Ck-4d-vs-LAB-4-4d differentially expressed genes and Ck-4d-vs-SCCD-52-4d differentially expressed genes, Table S4: Ck-8d-vs-LAB-4-8d differentially expressed genes and Ck-8d-vs-SCCD-52-8d differentially expressed genes, Table S5: Top 20 enriched KEGG pathways about CK-vs-LAB-4 at 4 dpi, Table S6: Top 20 enriched KEGG pathways about LAB-4-vs-SCCD-52 at 4 dpi, Table S7: Top 20 enriched KEGG pathways about CK-vs-LAB-4 at 8 dpi, Table S8: Top 20 enriched KEGG pathways about LAB-4-vs-SCCD-52 at 8 dpi, Table S9: Heat map genes information.

Author Contributions

Conceptualization, Z.P.; methodology, P.F., Z.Z. and W.P.; software, P.F. and Y.Z.; validation, P.F.; formal analysis, P.F. Z.Z. and X.L.; investigation, Y.P and Y.Z..; resources, Y.P.; data curation, Z.P., P.F. and Y.P.; writing—original draft preparation, P.F.; writing—review and editing, Z.P., P.F., Z.Z., W.P. and X.L.; supervision, Z.P.; project administration, Z.P.; funding acquisition, Z.P.

Funding

This work was financially supported by the National Key Research and Development Program of China (grant no. 2016YFD0100202-19), Natural Science Foundation of China (grant no. 31471882), and The Earmarked Fund for China Agriculture Research System (CARS-12).

Acknowledgments

We acknowledge Mingliang Jiang and Hongyin Tian (Shenyang Agricultural University) for their assistance during our experiments. We gratefully acknowledge the time and expertise devoted to reviewing this manuscript by the reviewers and the members of the editorial board.

Conflicts of Interest

The authors declare that the research was conducted in the absence of any commercial or financial relationships that could be construed as a potential conflict of interest.

References

  1. Jones, J.D.; Dangl, J.L. The plant immune system. Nature 2006, 444, 323–329. [Google Scholar] [CrossRef] [PubMed] [Green Version]
  2. Henry, E.; Yadeta, K.A.; Coaker, G. Recognition of bacterial plant pathogens: Local, systemic and transgenerational immunity. New Phytol. 2013, 199, 908–915. [Google Scholar] [CrossRef]
  3. Thomma, B.P.; Nurnberger, T.; Joosten, M.H. Of PAMPs and effectors: The blurred PTI-ETI dichotomy. Plant Cell 2011, 23, 4–15. [Google Scholar] [CrossRef] [PubMed]
  4. Zhang, C.; Chen, H.; Cai, T.; Deng, Y.; Zhuang, R.; Zhang, N.; Zeng, Y.; Zheng, Y.; Tang, R.; Pan, R.; et al. Overexpression of a novel peanut NBS-LRR gene AhRRS5 enhances disease resistance to Ralstonia solanacearum in tobacco. Plant Biotechnol. J. 2017, 15, 39–55. [Google Scholar] [CrossRef] [PubMed]
  5. Sagi, M.S.; Deokar, A.A.; Tar’an, B. Genetic analysis of NBS-LRR gene family in chickpea and their expression profiles in response to ascochyta blight infection. Front. Plant Sci. 2017, 8, 838. [Google Scholar] [CrossRef] [PubMed]
  6. Denance, N.; Sanchez-Vallet, A.; Goffner, D.; Molina, A. Disease resistance or growth: The role of plant hormones in balancing immune responses and fitness costs. Front. Plant Sci. 2013, 4, 155. [Google Scholar] [CrossRef] [PubMed]
  7. Zhu, F.; Xi, D.-H.; Deng, X.; Peng, X.-J.; Tang, H.; Chen, Y.-J.; Jian, W.; Feng, H.; Lin, H.H. The Chilli Veinal Mottle Virus regulates expression of the Tobacco Mosaic Virus resistance gene N and jasmonic acid/ethylene signaling is essential for systemic resistance against Chilli Veinal Mottle Virus in tobacco. Plant Mol. Biol. Rep. 2014, 32, 382–394. [Google Scholar] [CrossRef]
  8. Di, X.; Gomila, J.; Takken, F. Involvement of salicylic acid, ethylene and jasmonate acid signaling pathways in susceptibility of tomato for Fusarium oxysporum. Mol. Plant Pathol. 2017, 18, 1024–1035. [Google Scholar] [CrossRef]
  9. Vlot, A.C.; Dempsey, D.A.; Klessig, D.F. Salicylic Acid, a multifaceted hormone to combat disease. Annu. Rev. Phytopathol. 2009, 47, 177–206. [Google Scholar] [CrossRef]
  10. Catinot, J.; Buchala, A.; Abou-Mansour, E.; Metraux, J.-P. Salicylic acid production in response to biotic and abiotic stress depends on isochorismate in Nicotiana benthamiana. FEBS Lett. 2008, 582, 473–478. [Google Scholar] [CrossRef]
  11. Glazebrook, J. Contrasting mechanisms of defense against biotrophic and necrotrophic pathogens. Annu. Rev. Phytopathol. 2005, 43, 205–227. [Google Scholar] [CrossRef] [PubMed]
  12. Bari, R.; Jones, J. Role of plant hormones in plant defence responses. Plant Mol. Biol. 2009, 69, 473–488. [Google Scholar] [CrossRef] [PubMed]
  13. Berrocal-Lobo, M.; Molina, A.; Solano, R. Constitutive expression of ETHYLENE-RESPONSE-FACTOR1 in Arabidopsis confers resistance to several necrotrophic fungi. Plant J. 2002, 29, 23–32. [Google Scholar] [CrossRef] [PubMed]
  14. Robert-Seilaniantz, A.; Grant, M.; Jones, J. Hormone crosstalk in plant disease and defense: More than just jasmonate-salicylate antagonism. Annu. Rev. Phytopathol. 2011, 49, 317–343. [Google Scholar] [CrossRef] [PubMed]
  15. Siemens, J.; González, M.; Wolf, S.; Hofmann, C.; Greiner, S.; Du, Y.; Rausch, T.; Roitsch, T.; Ludwig-Müller, J.U. Extracellular invertase is involved in the regulation of clubroot disease in Arabidopsis thaliana. Mol. Plant Pathol. 2011, 12, 247–262. [Google Scholar] [CrossRef]
  16. Matsumoto, E.; Yasui, C.; Ohi, M.; Tsukada, M. Linkage analysis of RFLP markers for clubroot resistance and pigmentation in Chinese cabbage (Brassica rapa ssp. pekinensis). Euphytica 1998, 104, 79–86. [Google Scholar] [CrossRef]
  17. Suwabe, K.; Tsukazaki, H.; Iketani, H.; Hatakeyama, K.; Fujimura, M.; Nunome, T.; Fukuoka, H.; Matsumoto, S.; Hirai, M. Identification of two loci for resistance to clubroot (Plasmodiophora brassicae Woronin) in Brassica rapa, L. Theor. Appl. Genet. 2003, 107, 997–1002. [Google Scholar] [CrossRef]
  18. Suwabe, K.; Tsukazaki, H.; Iketani, H.; Hatakeyama, K.; Kondo, M.; Fujimura, M.; Nunome, T.; Fukuoka, H.; Hirai, M.; Matsumoto, S. Simple sequence repeat-based comparative genomics between Brassica rapa and Arabidopsis thaliana: The genetic origin of clubroot resistance. Genetics 2006, 173, 309–319. [Google Scholar] [CrossRef]
  19. Hirai, M.; Harada, T.; Kubo, N.; Tsukada, M.; Suwabe, K.; Matsumoto, S. A novel locus for clubroot resistance in Brassica rapa and its linkage markers. Theor. Appl. Genet. 2004, 108, 639–643. [Google Scholar] [CrossRef]
  20. Piao, Z.Y.; Deng, Y.Q.; Choi, S.R.; Park, Y.J.; Lim, Y.P. SCAR and CAPS mapping of CRb, a gene conferring resistance to Plasmodiophora brassicae in Chinese cabbage (Brassica rapa ssp. pekinensis). Theor. Appl. Genet. 2004, 108, 1458–1465. [Google Scholar] [CrossRef]
  21. Sakamoto, K.; Saito, A.; Hayashida, N.; Taguchi, G.; Matsumoto, E. Mapping of isolate-specific QTLs for clubroot resistance in Chinese cabbage (Brassica rapa, L. ssp. pekinensis). Theor. Appl. Genet. 2008, 117, 759–767. [Google Scholar] [CrossRef] [PubMed]
  22. Chen, J.; Jing, J.; Zhan, Z.; Zhang, T.; Zhang, C.; Piao, Z. Identification of novel QTLs for isolate-specific partial resistance to Plasmodiophora brassicae in Brassica rapa. PLoS ONE 2013, 8, e85307. [Google Scholar] [CrossRef] [PubMed]
  23. Pang, W.; Fu, P.; Li, X.; Zhan, Z.; Yu, S.; Piao, Z. Identification and Mapping of the Clubroot Resistance Gene CRd in Chinese Cabbage (Brassica rapa ssp. pekinensis). Front. Plant Sci. 2018, 9, 653. [Google Scholar] [CrossRef] [PubMed]
  24. Lovelock, D.; Donald, C.E.; Conlan, X.A.; Cahill, D. Salicylic acid suppression of clubroot in broccoli (Brassicae oleracea var. italica) caused by the obligate biotroph Plasmodiophora brassicae. Australas. Plant Pathol. 2012, 42. [Google Scholar] [CrossRef]
  25. Kunkel, B.; Brooks, D.M. Cross talk between signaling pathways in pathogen defense. Curr. Opin. Plant Biol. 2002, 5, 325–331. [Google Scholar] [CrossRef]
  26. El Oirdi, M.; El Rahman, T.A.; Rigano, L.; El Hadrami, A.; Rodriguez, M.C.; Daayf, F.; Vojnov, A.; Bouarab, K. Botrytis cinerea manipulates the antagonistic effects between immune pathways to promote disease development in tomato. Plant Cell 2011, 23, 2405–2421. [Google Scholar] [CrossRef]
  27. Wang, Z.; Gerstein, M.; Snyder, M. RNA-Seq: A revolutionary tool for transcriptomics. Nat. Rev. Genet. 2008, 10, 57–63. [Google Scholar] [CrossRef] [PubMed]
  28. Divi, U.K.; Rahman, T.; Krishna, P. Brassinosteroid-mediated stress tolerance in Arabidopsis shows interactions with abscisic acid, ethylene and salicylic acid pathways. BMC Plant Biol. 2010, 10, 151. [Google Scholar] [CrossRef]
  29. Chen, J.; Pang, W.; Chen, B.; Zhang, C.; Piao, Z. Transcriptome analysis of Brassica rapa Near-Isogenic lines carrying clubroot-resistant and -susceptible alleles in response to Plasmodiophora brassicae during early infection. Front. Plant Sci. 2015, 6, 1183. [Google Scholar] [CrossRef]
  30. Jia, H.; Wei, X.; Yang, Y.; Yuan, Y.; Wei, F.; Zhao, Y.; Yang, S.; Yao, Q.; Wang, Z.; Tian, B.; et al. Root RNA-seq analysis reveals a distinct transcriptome landscape between clubroot-susceptible and clubroot-resistant Chinese cabbage lines after Plasmodiophora brassicae infection. Plant Soil. 2017, 421, 93–105. [Google Scholar] [CrossRef]
  31. Zhang, X.; Liu, Y.; Fang, Z.; Li, Z.; Yang, L.; Zhuang, M.; Zhang, Y.; Lv, H. Comparative transcriptome analysis between broccoli (Brassica oleracea var. italica) and wild cabbage (Brassica macrocarpa Guss.) in response to Plasmodiophora brassicae during different infection stages. Front. Plant Sci. 2016, 7, 1929. [Google Scholar] [CrossRef] [PubMed]
  32. Chu, M.; Song, T.; Falk, K.C.; Zhang, X.; Liu, X.; Chang, A.; Lahlali, R.; McGregor, L.; Gossen, B.D.; Yu, F.; et al. Fine mapping of Rcr1 and analyses of its effect on transcriptome patterns during infection by Plasmodiophora brassicae. BMC Genom. 2014, 15, 1166. [Google Scholar] [CrossRef] [PubMed]
  33. Lemarié, S.; Robert-Seilaniantz, A.; Lariagon, C.; Lemoine, J.; Marnet, N.; Jubault, M.; Manzanares-Dauleux, M.J.; Gravot, A. Both the jasmonic acid and the salicylic acid pathways contribute to resistance to the biotrophic clubroot agent Plasmodiophora brassicae in Arabidopsis. Plant Cell Physiol. 2015, 56. [Google Scholar] [CrossRef]
  34. Agarwal, A.; Kaul, V.; Faggian, R.; Rookes, J.; Ludwig-Müller, J.; Cahill, D. Analysis of global host gene expression during the primary phase of the Arabidopsis thalianaPlasmodiophora brassicae interaction. Funct. Plant Biol. 2011, 38, 462–478. [Google Scholar] [CrossRef]
  35. Jubault, M.; Hamon, C.; Gravot, A.; Lariagon, C.; Delourme, R.; Manzanares-Dauleux, B.M.J. Differential regulation of root arginine catabolism and polyamine metabolism in clubroot-susceptible and partially resistant Arabidopsis Genotypes. Plant Physiol. 2008, 146, 2008–2019. [Google Scholar] [CrossRef]
  36. Ludwig-Müller, J.; Prinsen, E.; Rolfe, S.A.; Scholes, J. Metabolism and plant hormone action during clubroot disease. J. Plant Growth Regul. 2009, 28, 229–244. [Google Scholar] [CrossRef]
  37. Schuller, A.; Kehr, J.; Ludwig-Müller, J. Laser Microdissection coupled to transcriptional profiling of Arabidopsis roots inoculated by Plasmodiophora brassicae indicates a role for brassinosteroids in clubroot formation. Plant Cell Physiol. 2014, 55, 392–411. [Google Scholar] [CrossRef]
  38. Siemens, J.; Keller, I.; Sarx, J.; Kunz, S.; Schuller, A.; Nagel, W.; Schmülling, T.; Parniske, M.; Ludwig-Müller, J. Transcriptome analysis of Arabidopsis clubroots indicate a key role for cytokinins in disease development. Mol. Plant-Microbe Interact. 2006, 19, 480–494. [Google Scholar] [CrossRef]
  39. Xu, L.; Ren, L.; Chen, K.; Liu, F.; Fang, X. Putative role of IAA during the early response of Brassica napus, L. to Plasmodiophora brassicae. Eur. J. Plant Pathol. 2016, 145, 601–613. [Google Scholar] [CrossRef]
  40. Cui, J.; Jander, G.; Racki, L.R.; Kim, P.D.; Pierce, N.E.; Ausubel, F.M. Signals involved in Arabidopsis resistance to Trichoplusia ni caterpillars induced by virulent and avirulent strains of the phytopathogen Pseudomonas syringae. Plant Physiol. 2002, 129, 551–564. [Google Scholar] [CrossRef]
  41. Williams, P.H. A system for the determination of races of Plasmodiophora brassicae that infect cabbage and rutabaga. Phytopathology 1966, 56, 624–626. [Google Scholar]
  42. Trapnell, C.; Pachter, L.; Salzberg, S. TopHat: Discovering splice junctions with RNA-Seq. Bioinformatics 2009, 25, 1105–1111. [Google Scholar] [CrossRef] [PubMed]
  43. Mortazavi, A.; Williams, B.A.; McCue, K.; Schaeffer, L.; Wold, B. Mapping and quantifying mammalian transcriptomes by RNA-Seq. Nat. Methods 2008, 5, 621–628. [Google Scholar] [CrossRef] [PubMed]
  44. Conesa, A.; Götz, S.; García-Gómez, J.; Terol, J.; Talon, M.; Robles, M. BLAST2GO: A universal tool for annotation, visualization and analysis in functional genomics research. Bioinformatics 2005, 21, 3674–3676. [Google Scholar] [CrossRef] [PubMed]
  45. Mao, X.; Cai, T.; Olyarchuk, J.G.; Wei, L. Automated genome annotation and pathway identification using the KEGG Orthology (KO) as a controlled vocabulary. Bioinformatics 2005, 21, 3787–3793. [Google Scholar] [CrossRef]
  46. Li, Z.; Pan, X.; Guo, X.; Fan, K.; Lin, W. Physiological and transcriptome analyses of early leaf senescence for ospls1 mutant rice (Oryza sativa L.) during the grain-filling stage. Int. J. Mol. Sci. 2019, 20. [Google Scholar] [CrossRef] [PubMed]
  47. Zeng, X.; Xu, Y.; Jiang, J.; Zhang, F.; Ma, L.; Wu, D.; Wang, Y.; Sun, W. Identification of cold stress responsive microRNAs in two winter turnip rape (Brassica rapa L.) by high throughput sequencing. BMC Plant Biol. 2018, 18, 52. [Google Scholar] [CrossRef]
  48. Shearer, H.L.; Wang, L.; DeLong, C.; Despres, C.; Fobert, P.R. NPR1 enhances the DNA binding activity of the Arabidopsis bZIP transcription factor TGA7. Botany 2009, 87, 561–570. [Google Scholar] [CrossRef]
  49. Mitsuhara, I.; Iwai, T.; Seo, S.; Yanagawa, Y.; Kawahigasi, H.; Hirose, S.; Ohkawa, Y.; Ohashi, Y. Characteristic expression of twelve rice PR1 family genes in response to pathogen infection, wounding, and defense-related signal compounds (121/180). Mol. Genet. Genom. 2008, 279, 415–427. [Google Scholar] [CrossRef]
  50. Xie, D.X.; Feys, B.F.; James, S.; Nieto-Rostro, M.; Turner, J. COI1: An Arabidopsis gene required for jasmonate-regulated defense and fertility. Science 1998, 280, 1091–1094. [Google Scholar] [CrossRef]
  51. Thomma, B.; Eggermont, K.; Penninckx, I.A.; Mauch-Mani, B.; Vogelsang, R.; Cammue, B.; Broekaert, W.F. Separate jasmonate-dependent and salicylate-dependent defense-response pathways in Arabidopsis are essential for resistance to distinct microbial pathogens. Proc. Natl. Acad. Sci. USA 1999, 95, 15107–15111. [Google Scholar] [CrossRef] [PubMed]
  52. Cui, H.; Qiu, J.; Zhou, Y.; Bhandari, D.D.; Zhao, C.; Bautor, J.; Parker, J.E. Antagonism of transcription factor MYC2 by EDS1/PAD4 complexes bolsters salicylic acid defense in Arabidopsis effector-triggered immunity. Mol. Plant 2018, 11, 1053–1066. [Google Scholar] [CrossRef] [PubMed]
  53. Sheard, L.B.; Tan, X.; Mao, H.; Withers, J.; Ben-Nissan, G.; Hinds, T.R.; Kobayashi, Y.; Hsu, F.F.; Sharon, M.; Browse, J.; et al. Jasmonate perception by inositol phosphate-potentiated COI1-JAZ co-receptor. Nature 2010, 468, 400–405. [Google Scholar] [CrossRef] [PubMed]
  54. Dodds, P.N.; Rathjen, J.P. Plant immunity: Towards an integrated view of plant-pathogen interactions. Nat. Rev. Genet. 2010, 11, 539–548. [Google Scholar] [CrossRef] [PubMed]
  55. Jubault, M.; Lariagon, C.; Taconnat, L.; Renou, J.-P.; Gravot, A.; Delourme, R.; Manzanares-Dauleux, M.J. Partial resistance to clubroot in Arabidopsis is based on changes in the host primary metabolism and targeted cell division and expansion capacity. Funct. Integr. Genom. 2013, 13, 191–205. [Google Scholar] [CrossRef] [PubMed]
  56. Pandey, S.P.; Somssich, I. The role of WRKY transcription factors in plant immunity. Plant Physiol. 2009, 150, 1648–1655. [Google Scholar] [CrossRef] [PubMed]
  57. Wang, M.; Hong, Y.; Feng, K.; Deng, P.; Weining, S.; Nie, X. Genome-wide identification, phylogeny and expressional profiles of mitogen activated protein kinase kinase kinase (MAPKKK) gene family in bread wheat (Triticum aestivum L.). BMC Genom. 2016, 17, 668. [Google Scholar] [CrossRef] [PubMed]
  58. Ichimura, K.; Shinozaki, K.; Tena, G.; Sheen, J.; Henry, Y.; Champion, A.; Kreis, M.; Zhang, S.; Hirt, H.; Wilson, C.; et al. Mitogen-activated protein kinase cascades in plants: A new nomenclature. Plant Sci. 2002, 7, 301–308. [Google Scholar] [CrossRef]
  59. Zipfel, C. Early molecular events in PAMP-triggered immunity. Curr. Opin. Plant Biol. 2009, 12, 414–420. [Google Scholar] [CrossRef]
  60. Nakashita, H.; Yasuda, M.; Nitta, T.; Asami, T.; Fujioka, S.; Arai, Y.; Sekimata, K.; Takatsuto, S.; Yamaguchi, I.; Yoshida, S. Brassinosteroid functions in a broad range of disease resistance in tobacco and rice. Plant J. 2003, 33, 887–898. [Google Scholar] [CrossRef] [Green Version]
  61. Albrecht, C.; Boutrot, F.; Segonzac, C.; Schwessinger, B.; Gimenez-Ibanez, S.; Chinchilla, D.; Rathjen, J.P.; de Vries, S.C.; Zipfel, C. Brassinosteroids inhibit pathogen-associated molecular pattern-triggered immune signaling independent of the receptor kinase BAK1. Proc. Natl. Acad. Sci. USA 2012, 109, 303–308. [Google Scholar] [CrossRef] [PubMed]
  62. Belkhadir, Y.; Jaillais, Y.; Epple, P.; Balsemão-Pires, E.; Dangl, J.L.; Chory, J. Brassinosteroids modulate the efficiency of plant immune responses to microbe-associated molecular patterns. Proc. Natl. Acad. Sci. USA 2011, 109, 297–302. [Google Scholar] [CrossRef] [PubMed] [Green Version]
  63. Lozano-Durán, R.; Macho, A.P.; Boutrot, F.; Segonzac, C.; Somssich, I.E.; Zipfel, C. The transcriptional regulator BZR1 mediates trade-off between plant innate immunity and growth. eLife 2013, 2, e00983. [Google Scholar] [CrossRef] [PubMed]
  64. Goddard, R.; Peraldi, A.; Ridout, C.; Nicholson, P. Enhanced disease resistance caused by BRI1 mutation is conserved between Brachypodium distachyon and barley (Hordeum vulgare). Mol. Plant Microbe Interact. 2014, 27, 1095–1106. [Google Scholar] [CrossRef] [PubMed]
  65. Jaillais, Y.; Belkhadir, Y.; Balsemão-Pires, E.; Dangl, J.L.; Chory, J. Extracellular leucine-rich repeats as a platform for receptor/coreceptor complex formation. Proc. Natl. Acad. Sci. USA 2011, 108, 8503–8507. [Google Scholar] [CrossRef] [PubMed] [Green Version]
  66. Bücherl, C.A.; Van Esse, G.W.; Kruis, A.; Luchtenberg, J.; Westphal, A.H.; Aker, J.; Van Hoek, A.; Albrecht, C.; Borst, J.W.; De Vries, S.C. Visualization of BRI1 and BAK1(SERK3) membrane receptor heterooligomers during brassinosteroid signaling. Plant Physiol. 2013, 162, 1911–1925. [Google Scholar] [CrossRef] [PubMed]
  67. Wang, J.; Jiang, J.; Wang, J.; Chen, L.; Fan, S.-L.; Wu, J.-W.; Wang, X.; Wang, Z.-X. Structural insights into the negative regulation of BRI1 signaling by BRI1-interacting protein BKI1. Cell Res. 2014, 24, 1328–1341. [Google Scholar] [CrossRef] [PubMed] [Green Version]
  68. Sun, Y.; Fan, X.-Y.; Cao, D.-M.; Tang, W.; He, K.; Zhu, J.-Y.; He, J.-X.; Bai, M.-Y.; Zhu, S.; Oh, E.; et al. Integration of brassinosteroid signal transduction with the transcription network for plant growth regulation in Arabidopsis. Dev. Cell 2010, 19, 765–777. [Google Scholar] [CrossRef] [PubMed]
  69. Zipfel, C. Pattern-recognition receptors in plant innate immunity. Curr. Opin. Immunol. 2008, 20, 10–16. [Google Scholar] [CrossRef] [PubMed]
  70. Kochetov, A.V.; Glagoleva, A.Y.; Strygina, K.V.; Khlestkina, E.K.; Gerasimova, S.V.; Ibragimova, S.M.; Shatskaya, N.V.; Vasilyev, G.V.; Afonnikov, D.A.; Shmakov, N.A.; et al. Differential expression of NBS-LRR-encoding genes in the root transcriptomes of two Solanum phureja genotypes with contrasting resistance to Globodera rostochiensis. BMC Plant Boil. 2017, 17, 251. [Google Scholar] [CrossRef] [PubMed]
  71. Bent, A.; Kunkel, B.; Dahlbeck, D.; Brown, K.; Schmidt, R.; Giraudat, J.; Leung, J.; Staskawicz, B. RPS2 of Arabidopsis thaliana: A leucine-rich repeat class of plant disease resistance genes. Science 1994, 265, 1856–1860. [Google Scholar] [CrossRef] [PubMed]
  72. Swiderski, M.R.; Innes, R. The Arabidopsis PBS1 resistance gene encodes a member of novel protein kinase subfamily. Plant J. 2001, 26, 101–112. [Google Scholar] [CrossRef] [PubMed]
  73. Thomma, B.P.H.J.; Eggermont, K.; Penninckx, I.A.M.A.; Mauch-Mani, B.; Vogelsang, R.; Cammue, B.P.A.; Broekaert, W.F. Separate jasmonate-dependent and salicylate-dependent defense-response pathways in Arabidopsis are essential for resistance to distinct microbial pathogens. Proc. Natl. Acad. Sci. USA 1998, 95, 15107–15111. [Google Scholar] [CrossRef] [PubMed]
Figure 1. Phenotype of roots in “85–74” plants infected with P. brassicae. Photograph of “85–74” at 30 dpi with LAB-4 (a) and SCCD-52 (b).
Agronomy 09 00589 g001
Figure 2. Comparison of the number of DEGs between control plants and plants infected with the two pathotypes of P. brassicae at 4 and 8 dpi. Number of DEGs based on the comparison between control plants and plants infected with LAB-4 (a) and SCCD-52 (b) at 4 and 8 dpi. Green and red represent up- and down-regulated DEGs, respectively.
Agronomy 09 00589 g002
Figure 3. Number of DEGs in different samples at 4 and 8 dpi. Number of DEGs at 4 dpi (a) and 8 dpi (b). Green, red, and purple represent control vs. LAB-4, control vs. SCCD-52, and LAB-4 vs. SCCD-52, respectively.
Agronomy 09 00589 g003
Figure 4. Top 20 KEGG pathways of DEGs in response to P. brassicae infection at 4 and 8 dpi. KEGG pathways are listed on the left, whereas Q values and gene numbers are shown on the right. Top 20 enriched KEGG pathways in the LAB-4 vs. control comparison at 4 dpi (a) and 8 dpi (b); and in the LAB-4 vs. SCCD-52 comparison at 4 dpi (c) and 8 dpi (d).
Agronomy 09 00589 g004aAgronomy 09 00589 g004b
Figure 5. GO categories of DEGs in LAB-4 and SCCD-52. Unigenes were mapped to three main categories: biological process, molecular function, and cellular component. (a) LAB-4 vs. control; (b) LAB-4 vs. SCCD-52. The y-axis shows the number of annotated DEGs.
Agronomy 09 00589 g005aAgronomy 09 00589 g005b
Figure 6. Heat maps of DEGs involved in the host defense response to P. brassicae infection. In the LAB-4 (avirulent) vs. control and SCCD-52 (virulent) vs. control comparisons, green and red indicate down- and up-regulated DEGs, respectively.
Agronomy 09 00589 g006
Figure 7. Changes in plant hormone signal transduction upon infection with different pathogens in the presence of the CRd gene. (a) LAB-4 compared with control at 8 dpi. (b) SCCD-52 compared with control at 8 dpi. Green and red indicate down- and up-regulated genes, respectively.
Agronomy 09 00589 g007
Figure 8. RT-qPCR validation of RNA-seq data. DEGs analyzed by RT-qPCR showed the same trend as those identified by RNA-seq. The y-axis shows the fold difference between the avirulent pathogen LAB-4 and control, with positive and negative values indicating up- and down-regulation, respectively.
Agronomy 09 00589 g008
Table 1. Resistance of Chinese cabbage to different pathotypes of P. brassicae.
Material Local Pathotype
LAB-4LAB-7LAB-16LAB-19AHXC-68LNXM-1HBLC-31AHHS-65HBSY-32SCCD-52SCCQ-61
85–74+
BJN3-1+++++++++++
+, Susceptible reactions; −, resistant reactions.
Table 2. Top 10 enriched GO terms in the LAB-4 vs. control comparison at 4 dpi.
TermGene NumberGO ID
Response to stimulus81GO:0050896
Ion transport26GO:0006811
Response to chemical54GO:0042221
Regulation of meristem development10GO:0048509
Hormone-mediated signaling pathway18GO:0009755
Cellular response to hormone stimulus18GO:0032870
Cellular response to endogenous stimulus18GO:0071495
Fluid transport8GO:0042044
Regulation of pH2GO:0006885
Cellular monovalent inorganic cation homeostasis2GO:0030004
Table 3. Top 10 enriched GO terms in the LAB-4 vs. control comparison at 8 dpi.
TermGene NumberGO ID
Biological regulation573GO:0065007
Regulation of biological process526GO:0050789
Regulation of meristem development55GO:0048509
Response to endogenous stimulus209GO:0009719
Response to hormone174GO:0009725
Regulation of cellular process345GO:0050794
Hormone-mediated signaling pathway111GO:0009755
Cellular response to hormone stimulus111GO:0032870
Cellular response to endogenous stimulus111GO:0071495
Enzyme linked receptor protein signaling pathway27GO:0007167
Table 4. Top 10 enriched GO terms in the LAB-4 vs. SCCD-52 comparison at 4 dpi.
TermGene NumberGO ID
Response to chemical acid116GO:0001101
Response to stimulus379GO:0050896
Jasmonic acid metabolic process24GO:0009694
Transition metal ion homeostasis12GO:0055076
Inorganic anion transport27GO:0015698
Transition metal ion transport19GO:0000041
Response to external stimulus127GO:0009605
Cation homeostasis16GO:0055080
Anion transport48GO:0006820
Secondary metabolic process53GO:0019748
Table 5. Top 10 enriched GO terms in the LAB-4 vs. SCCD-52 comparison at 8 dpi.
TermGene NumberGO ID
Regulation of phosphorelay signal transduction system7GO:0070297
Response to heat19GO:0009408
Response to light intensity31GO:0009642
Response to chemicals233GO:0042221
Regulation of intracellular signal transduction8GO:1902531
Response to endogenous stimulus114GO:0009719
Response to reactive oxygen species30GO:0000302
Regulation of organic acid transport4GO:0032890
Regulation of amine transport4GO:0051952
Regulation of amino acid transport4GO:0051955

