Article

Genetic Analysis Using a Multi-Parent Wheat Population Identifies Novel Sources of Septoria Tritici Blotch Resistance

1
Teagasc, Crop Science Department, Oak Park, R93 XE12 Carlow, Ireland
2
AgResearch, Invermay Agricultural Centre, Private Bag, Mosgiel 50034, New Zealand
3
Department of Mathematics and Statistics, University of Otago, Dunedin 9016, New Zealand
4
The John Bingham Laboratory, NIAB, Cambridge CB3 0LE, UK
*
Author to whom correspondence should be addressed.
Genes 2020, 11(8), 887; https://doi.org/10.3390/genes11080887
Submission received: 13 July 2020 / Revised: 31 July 2020 / Accepted: 31 July 2020 / Published: 4 August 2020
(This article belongs to the Special Issue Selection Methods in Plant Breeding: From Visual Phenotyping to NGS)

Abstract

:
Zymoseptoria tritici is the causative fungal pathogen of septoria tritici blotch (STB) disease of wheat (Triticum aestivum L.) that continuously threatens wheat crops in Ireland and throughout Europe. Under favorable conditions, STB can cause up to 50% yield losses if left untreated. STB is commonly controlled with fungicides; however, a combination of Z. tritici populations developing fungicide resistance and increased restrictions on fungicide use in the EU has led to farmers relying on fewer active substances. Consequently, this serves to drive the emergence of Z. tritici resistance against the remaining chemistries. In response, the use of resistant wheat varieties provides a more sustainable disease management strategy. However, the number of varieties offering an adequate level of resistance against STB is limited. Therefore, new sources of resistance or improved stacking of existing resistance loci are needed to develop varieties with superior agronomic performance. Here, we identified quantitative trait loci (QTL) for STB resistance in the eight-founder “NIAB Elite MAGIC” winter wheat population. The population was screened for STB response in the field under natural infection for three seasons from 2016 to 2018. Twenty-five QTL associated with STB resistance were identified in total. QTL either co-located with previously reported QTL or represent new loci underpinning STB resistance. The genomic regions identified and the linked genetic markers serve as useful resources for STB resistance breeding, supporting rapid selection of favorable alleles for the breeding of new wheat cultivars with improved STB resistance.

1. Introduction

Bread or common wheat (Triticum aestivum L.) is a primary tillage crop in Ireland and the most important cereal crop in the European Union (EU), accounting for 46% of EU-28 cereal production [1]. Annual wheat yield losses are observed due to extreme weather patterns such as heat, heavy rainfall, drought, and nutrient deficiency [2,3]. For instance, in 2018, a widespread drought was observed in central and northern Europe; consequently, wheat production dropped by 9.5%, along with a slight decline in area under cultivation of 1.6% [1]. Furthermore, frequent emergence and re-emergence of pests and diseases are a constant threat to wheat yields [4,5,6].
Septoria tritici blotch (STB), caused by the necrotrophic fungus Zymoseptoria tritici, is one of the most devastating foliar diseases of wheat in Ireland and Europe [7]. STB epidemics can cause a yield loss of up to 50% in fields when a susceptible wheat cultivar is grown [8,9]. Yield losses vary with environmental conditions, variety, and cropping system. STB severity on flag and flag-1 leaves result in a reduction of the green leaf area, limiting plant growth and reducing grain size, which ultimately impacts on yield and grain quality [10,11]. Z. tritici produces ascospores and pycnidiospores via a sexual [12] and an asexual life cycle [13], respectively. Both types of spores can serve as primary inoculum depending upon environmental conditions, cropping history, and management [14]. Ascospores survive on crop stubble and are dispersed by wind, thus commonly serving as the primary inoculum [14]. The polycyclic pycnidiospores are dispersed by rain-splash, thus helping to propagate STB epidemics through the wheat growing season [15,16]. The progress of an STB epidemic depends on the availability of optimal temperature (22 °C) [17] and relative humidity (≥85%) [18], which promotes the appearance of black asexual fruiting bodies (pycnidia) that in turn disperse pycnidiospores from infected leaves [19]. STB progression is characterized by an asymptomatic latent phase that may vary between 14–28 days under field conditions and 9–14 days under controlled environmental conditions, depending on host, isolate, and prevailing environmental conditions [20,21,22,23,24,25,26,27]. After 10–12 days post-infection, the pathogen transitions to a necrotrophic phase, which is usually characterized by brown coloured lesions on wheat leaves that typically develop into necrotic irregularly-shaped blotches (Figure 1).
At present, the two main methods to control STB are the use of fungicides and resistant cultivars. However, there is an over-dependence on fungicide application, with control of STB accounting for more than 70% of annual fungicide usage in Europe, the use of which costs the sector over €1 bn per annum [8]. Over the years, worldwide Z. tritici populations have developed fungicide resistance [28,29,30]. Additionally, within the EU, fungicide registrations are being reversed (EU Reg. No 1107/2009). The result is that fewer active substances are available to farmers, leading to challenges in efficient wheat production. The use of resistant wheat varieties provides a more economically and environmentally sustainable disease management strategy. In total, 22 resistance genes (Stb; Stb1-Stb19, StbSm3, StbWW, and TmStb1) and 89 quantitative trait loci (QTL) have been identified for STB resistance to date, mainly in wheat (for detailed review [31]). There are two types of STB resistance genes, namely qualitative and quantitative. For instance, Stb6, one of the two most commonly deployed resistance genes in European germplasm [32], encodes a wall-associated receptor kinase (WAK)-like protein [33] conferring resistance against Z. tritici isolate “IPO323”, which carry the corresponding avirulence gene AvrStb6 [34]. However, Stb6 alone is not able to confer resistance under field conditions [35]. In contrast, Stb16q confers quantitative resistance at both seedling and the adult plant stage against multiple Z. tritici isolates [36]. Z. tritici can evolve rapidly, adapting to chemical control measures and deployed wheat resistance genes due to its host adaptable genome [37,38], sexual recombination [39] and gene flow [40]. For instance, virulence to Stb16q has recently been detected in Irish [41] and French [42] Z. tritici populations. Although a large number of known STB resistance genes and QTL are available, there is a continuous drive to discover and characterise new sources of resistance against Z. tritici for use in elite wheat germplasm.
Genetic resistance to STB is underpinned by complex genetic control, thus making it challenging to dissect the underlying genetic architecture. Therefore, specialized populations using two founders that are often selected due to contrasting STB resistance are typically developed to identify and genetically map genes conferring resistance. However, traditional bi-parental populations have limited allelic diversity at a given locus (i.e., as just two parents contribute variants), and map resolution is limited by a potentially lower level of genetic recombination, typically via a single round of inter-crossing [43]. Alternatively, multi-parent populations such as nested association mapping (NAM) [44] and multi-parent advanced generation inter-cross (MAGIC) [45] overcome some of these limitations. A MAGIC population typically comprises 4, 8, or 16 founder parents selected for various desirable traits, such as disease resistance, plant height, flowering time, and yield. The founders are subjected to several generations of intercrossing (e.g., eight-founder populations require three rounds of inter-crossing to combine genomic contributions from all founders), followed by multiple generations of selfing to create recombinant inbred lines (RILs) that each carry a mosaic of the founder haplotypes [46]. MAGIC populations have been developed for numerous plant species, including arabidopsis [47], rice [48], wheat [45,49], barley [50], maize [51], and tomato [52]. Multi-parent populations can provide an improved understanding of the genetic architecture of complex traits due to increased recombination, segregation of multiple alleles, relatively high mapping resolution, and the possibility of allowing pleiotropic QTL and closely linked QTL to be distinguished [53].
The multiple rounds of founder intercrossing and RIL inbreeding combined with relatively large population sizes mean that the use of MAGIC populations have the potential to provide high genetic mapping resolution and therefore can be used for both fine and coarse mapping, particularly in inbreeding species such as rice and wheat [54]. The first wheat MAGIC population was developed from four elite Australian cultivars and generated a population of 1579 lines. Genomic regions controlling quantitative traits such as plant height and hectoliter weight were identified in the population [45]. Since then, additional wheat MAGIC populations have been generated, including the “NIAB Elite MAGIC population” [49], the “NCCR durum wheat population” [55], the “MAGIC winter wheat population” (WM-800) [56], and the “Bavarian MAGIC” wheat population (BMWpop) [57]. These MAGIC populations have been exploited to identify different genomic regions underpinning yield and other agronomic traits. For instance, the eight founder “NIAB Elite MAGIC” winter wheat population was screened in diverse environments for 18 different yield and agronomic traits [49]. A total of 376 QTL were identified, of which 20 were developed into Kompetitive allele-specific primer (KASP) genetic markers for potential use in marker-assisted selection in wheat breeding programmes [58].
Different wheat MAGIC populations have been exploited to identify QTL controlling resistance against fungal diseases such as powdery mildew (caused by Blumeria graminis), STB, tan spot (caused by Pyrenophora tritici-repentis) [59,60], and Septoria leaf and glume blotch (caused by Parastagonospora nodorum) [61]. While genetic resistance to STB has been previously identified using BMWpop [60], the phenotypic response was observed under artificial inoculation. Given that the Z. tritici pathogen population is rapidly evolving, it is important to screen the genetic resources such as MAGIC populations under natural STB infection in field conditions.
In this study, the “NIAB Elite MAGIC” eight-founder winter wheat population [49] was investigated for STB response under natural infection in the field across three years in Ireland. We identified genomic regions through QTL mapping underpinning STB resistance in the MAGIC population.

2. Materials and Methods

2.1. Plant Material

The structure and the design of the “NIAB Elite MAGIC” population has been previously described [49]. Briefly, it was developed from eight wheat cultivars, namely Alchemy, Brompton, Claire, Hereward, Rialto, Robigus, Soissons, and Xi19 [49]. The founders were intercrossed for three generations, followed by multiple rounds of selfing to produce RILs.

2.2. Field Trials

The MAGIC population was evaluated for three field seasons from 2015–2016, 2016–2017, and 2017–2018 in the field trial area at Teagasc (52°51′21.4″ N 6°54′51.3″ W), Oak Park, Carlow, Ireland (Table 1). Trials were sown in the Autumn and reached maturity the following summer. Subsequently, we refer to 2015–2106, 2016–2017, and 2017–2018 trials as the 2016, the 2017, and the 2018 trials, respectively. All field trials were managed using a standard agronomy program for the trial site location, including the use of fertilizers and chemical fungicides (Table 1). The STB susceptible variety “JB Diego” was planted at trial borders to help pathogen spread and maximise the epidemic pressure.

2.2.1. 2016 Field Trial

In 2016, a total of 1076 lines of the “NIAB Elite MAGIC” population were assessed for STB response, including the eight founders and four reference winter wheat varieties (Table S1). An α lattice design was implemented in which each line was present in each of three blocks. Within each block, 34 sub-blocks contained 32 plots (four plots wide by eight plots long); each plot was a single row of 0.95 m length × 0.2 m width. The population was screened under natural STB infection from the end of June to mid-July at two-time points (i.e., T1 and T2) separated by fourteen days. STB severity was assessed as the percentage of leaf area covered by lesions on the top three leaves (i.e., flag, flag-1, and flag-2) on the first time point, while only flag leaves were evaluated at the second time point. Plant height (cm) and flowering time (i.e., days from sowing to flowering) data were also collected. Plant height (from stem base to the tip of ear) was measured on four randomly selected tillers per plot between Zadocks growth stages GS73 (early milk) to GS85 (soft dough). Average plant height was calculated and used in the statistical analysis. Flowering time was scored when 50% of the plants in a plot reached GS69 (anthesis complete) [62] (Table 1).

2.2.2. 2017 Field Trial

In 2017, a subset of the MAGIC population (192 lines) was sown in a replicated trial with larger plots together with the founder lines and the disease standards (Table S1). Lines were selected from almost all of the 208 eight-way families in the MAGIC population (a single line from each of 192 of the eight-way families was selected). An α lattice design was used, and lines were evaluated in two blocks (two replications) where each block was further divided into 40 rows and 10 columns. Each line was sown in plots 2.5 m length × 1.2 m wide, consisting of six rows per plot. The gap between the adjacent plots was 0.4 m. STB assessment was carried out twice in the season after GS69 with a difference of 14 days between assessments. STB severity (i.e., percentage of disease area of the leaf) measurements were taken on the top three leaves (i.e., flag, flag-1, and flag-2) using four randomly selected tillers per plot. Plant height and flowering time were also recorded for the whole experiment, as described above (Table 1).

2.2.3. 2018 Field Trial

In 2018, 388 MAGIC lines were grown, as well as the eight founder lines and twelve commercially available cultivars (Table S1). As in 2017, the 388 lines were selected to represent almost all of the 208 eight-way families in the MAGIC population. The trial comprised three blocks, where each line plot contained a single row 0.95 m length × 0.2 m wide. The plants were assessed once for STB severity on the top three leaves (i.e., flag, flag-1, and flag-2) using three randomly selected tillers per plot. Plant height and flowering time data were not recorded in 2018. Therefore, plant height and flowering time data from 2016 were used in the statistical analysis; these traits are highly heritable [63].

2.3. Phenotypic Data Analysis

The phenotypic data were analysed in R [64]. Each data collection time point in a year was treated as an individual dataset and analysed separately. Phenotypic data were transformed to a normal distribution using the logit (p) function (Figure S1). In 2016, plant height and flowering time were recorded for a single replication. The phenotypic correlations were calculated to understand the concordance of STB disease scores measured on different leaves at different time points and in different years. We also calculated the correlation between STB datasets and plant height and flowering time to understand the relationship between STB disease scores and these developmental traits. The correlations were calculated using Pearson correlation coefficients in the Hmisc package [65]. The logit-transformed phenotypic values were analysed in a linear mixed model using R/lme4 [66,67].
Within each dataset, the phenotypic data were adjusted based on the following model:
y i j k = μ + g i + b j + s k j + ϵ i j k
where y i j k is the observed STB score of each line, μ is the overall mean, g i is the fixed effect of line i, b j describes the random effect of block j, s k j is the random effect of subblock k nested within the block j, and ϵ i j k is the error term. The adjusted STB means were estimated through the model and were used in subsequent QTL analysis. In the case of the founder lines, each STB dataset was logit (p) back-transformed to a 0–100 percentage scale for presentation.

2.4. QTL Mapping

A subset of 643 RILs from the “NIAB Elite MAGIC” population was previously genotyped at the F5 generation using a 90K single nucleotide polymorphism (SNP) array, resulting in 20,643 polymorphic SNPs [49,68]. A genetic map comprising 18,601 SNPs was subsequently developed [68]. Quality control was implemented, such as removing monomorphic markers, markers with minor allele frequency (MAF) ≤ 0.05, and markers with more than 5% of missing data were removed. Lines having more than 50% missing data were removed from the analysis. A subset of 4988 markers having unique map positions, and which were common between the MAGIC population genotypes used in this study and the associated genetic map, was used for QTL mapping using the R/qtl2 package [69]. Phenotypic data, genotypic data, pedigree information, covariate data (i.e., a numeric matrix of interactive covariates—plant height and flowering time data), and genetic map were read in R/qtl2 using read_cross2(). The MAGIC population used in this study has been developed to produce a population with uniform kinship relationships [49]. In this study, pedigree information is provided for each individual in the population, consisting of a matrix of integers with individual rows and with the number of columns depending on the cross type (i.e., an eight-way magic population was defined as “riself8”). Using the information provided above, genotype probabilities were calculated with the function calc_genoprob() using multipoint SNP through the hidden Markov model (HMM). In case of eight-way MAGIC, the HMM provides a probability for each possible 36-state genotype probabilities at each marker for each line. The genotype probability information is used in estimating the kinship matrix, calculated using function calc_kinship(), which was later used to account for population structure. In case of genome scan through linear mixed model using “LOCO—leave one chromosome out” method, an argument type = “loco” was added in calc_kinship() function to calculate kinship matrix. QTL analysis using these founder haplotype probabilities was carried out via function scan1(). In the scan1() function, an argument “intcovar” was provided to account for epistatic interactions of plant height and flowering time for each dataset. Genome scans were performed using three methods: (a) by Haley-Knott regression, (b) by a linear mixed model using standard kinship matrix, and (c) by a linear mixed model using LOCO kinship matrix. To establish the statistical significance of a QTL at a 5% level of significance (α = 0.05), we performed a permutation test using the function scan1perm() where the number of permutations was 1000 and an argument “intcovar” was provided. A second threshold was set to detect weak QTL at an arbitrary threshold (the logarithm of odds (LOD) = 10), where a clear differentiation of LOD score was visible. The estimated effects of permutation significant QTL were calculated using scan1blup(), where QTL were treated as random effects and used the kinship matrix estimating residual polygenic effect. QTL were named according to standard nomenclature [70].

2.5. Gene Annotation of Significant Markers

Physical map positions of selected SNPs on the wheat reference genome assembly, IWGSC RefSeq v1.0 [71], were identified using The Triticeae Toolbox (T3) database [72]. The genes underlying peak SNPs were obtained from the RefSeq v1.0 assembly annotated with the RefSeq v1.0 and v1.1 gene models using JBrowse [73].

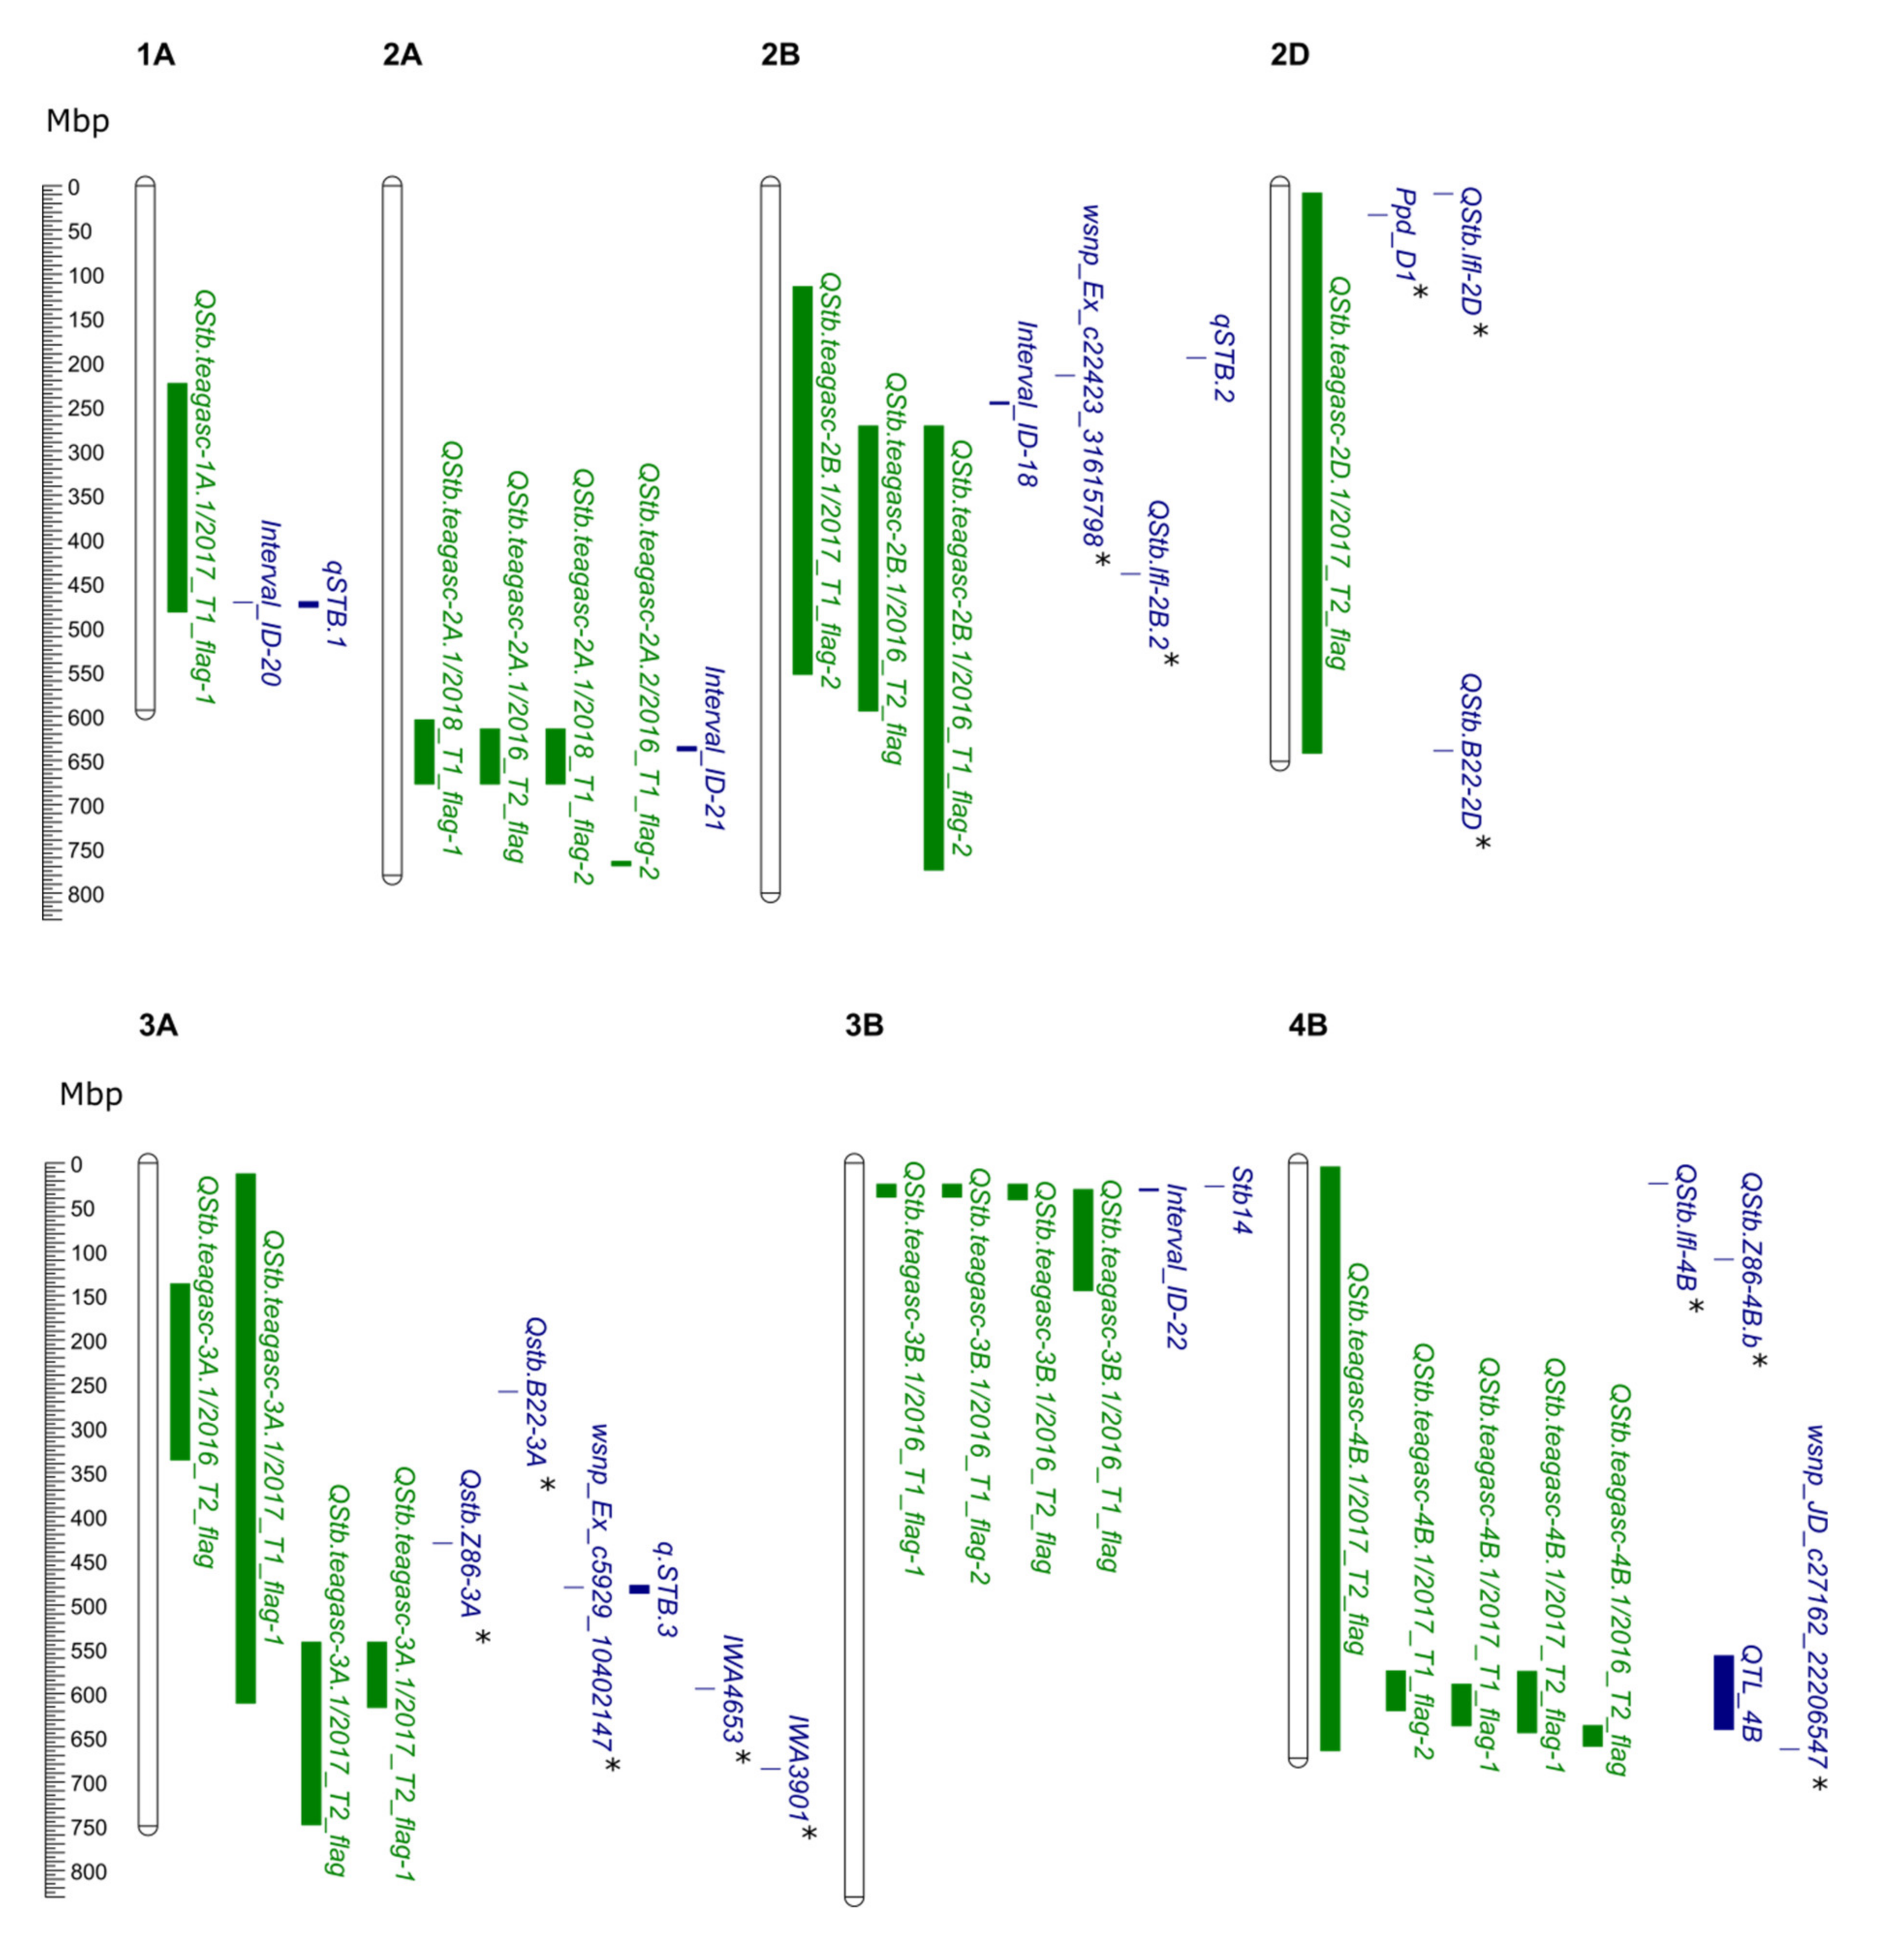
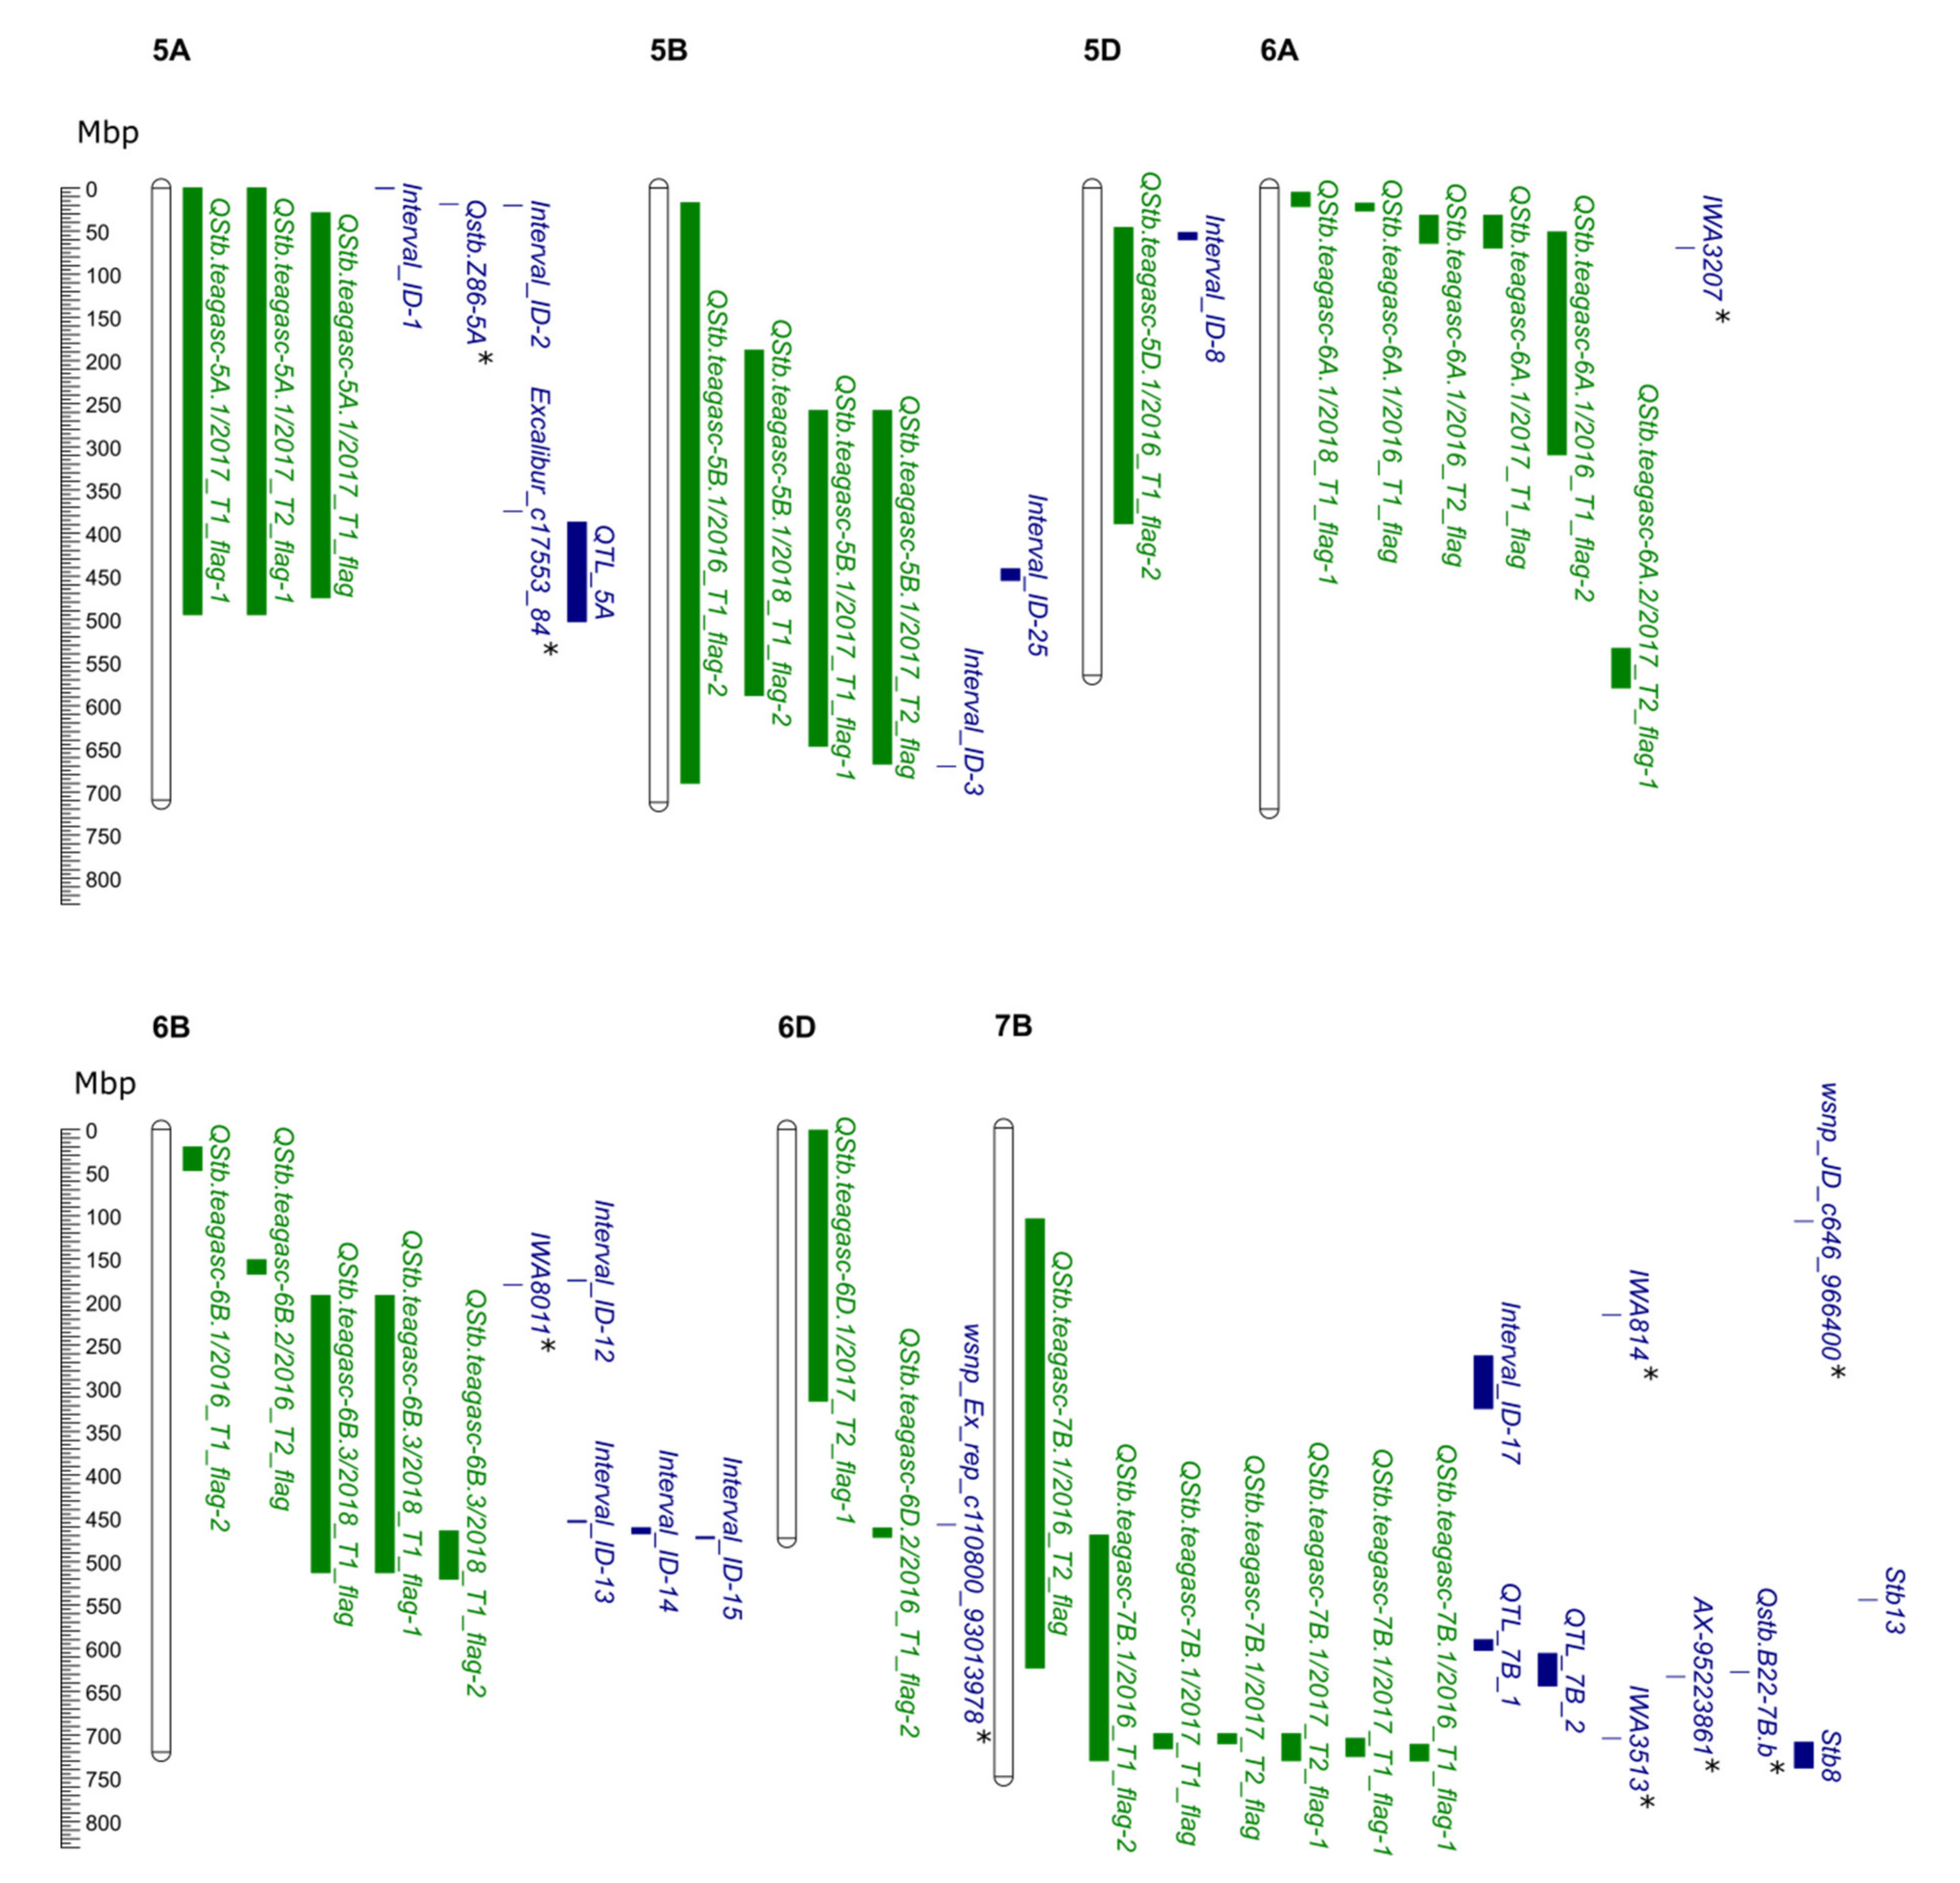
2.6. Alignment of QTL Identified in This Study with Previously Reported Stb Genes and QTL

The QTL identified were compared with previously reported Stb genes and QTL by projecting onto the physical map in The Triticeae Toolbox (T3) database to identify the co-located genes/QTL and determine the novelty of others. For our QTL co-location study, only QTL mapping and genome-wide association scan (GWAS) studies of STB using high-throughput marker platforms were considered [60,74,75,76,77,78,79,80,81,82,83]

3. Results

3.1. Field STB Response
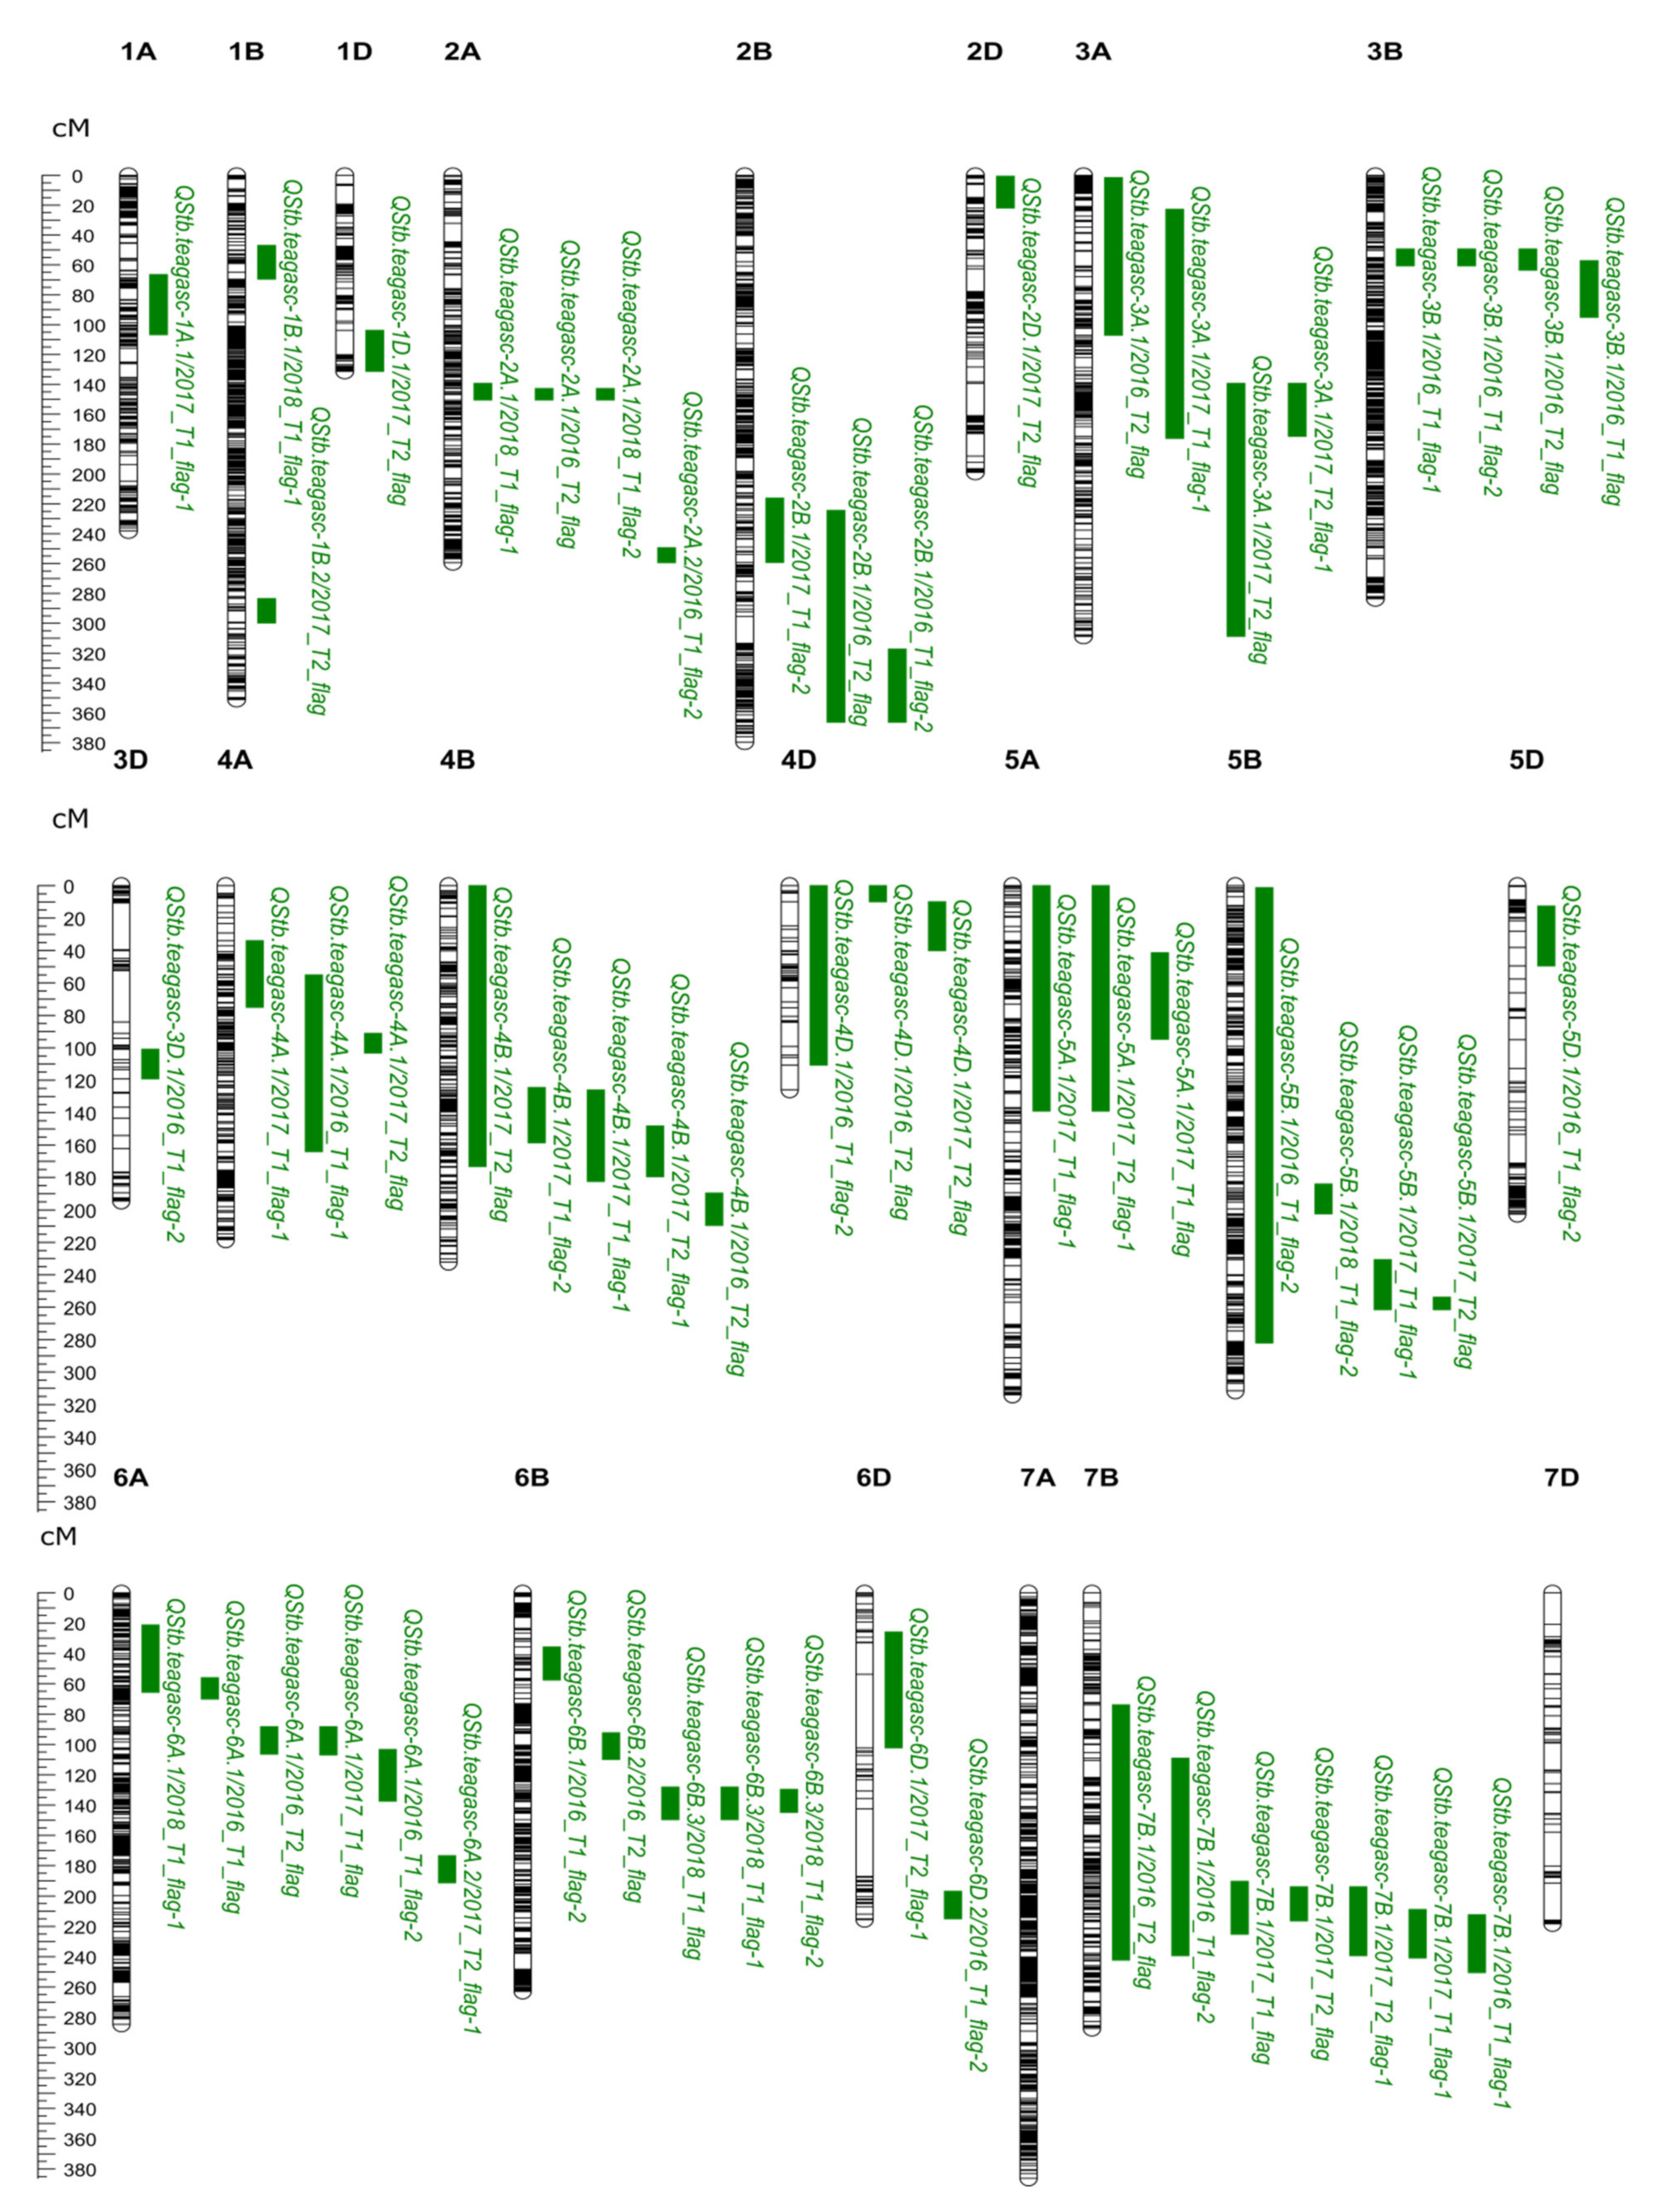
The STB severity data from all datasets were skewed (i.e., right or left) and were therefore logit (p) transformed to improve the normality and the homoscedasticity of data (Figure S1). A significant negative correlation was observed between STB severity and plant height and flowering time for the different datasets (Table 2). The negative correlation between mean STB severity and plant height within years ranged between r = −0.2 to r = −0.29 (p = 0). Similarly, a significant negative correlation was identified between STB severity and flowering time for different datasets (ranging between r = −0.09 to r = −0.29 (p = 0; Table 2). The distribution of adjusted STB scores is shown in Figure S2. A significant positive correlation was predominantly observed between STB responses in different years (Table 3).
In 2016, a total of 1072 lines were evaluated on different leaf layers and at different time points (2016_T1_flag, 2016_T1_flag-1, 2016_T1_flag-2, and 2016_T2_flag), and the population mean for STB infection ranged between 0.11 to 86.34% (Table 4). Significant positive correlations were observed between leaves at the first time point (T1), ranging between r = 0.49 to r = 0.671 (p = 0; Table 3). However, the correlation between T1 and T2 flag leaf STB scores in 2016 (datasets 2016_T1_flag and 2016_T2_flag) was r = 0.3 (p = 0; Table 3). In 2017, a total of 191 lines were analysed. The population mean at the first and the second time points ranged from 0.35 to 65.69%, and 3.42 to 92.90%, respectively (Table 4). The correlation between the first and the second time points was r = 0.55 (flag), r = 0.77 (flag-1), and r = 0.51 (flag-2) (p = 0; Table 3). In 2018, a total of 374 lines were screened in all three leaf datasets (i.e., 2018_T1_flag, 2018_T1_flag-1, and 2018_T1_flag-2), and the population mean ranged between 0.26 and 87.28% (Table 4). A significant positive correlation was observed between different datasets ranging from r = 0.62 to r = 0.83 (p = 0; Table 3). The phenotypic data from all datasets are provided in Table S1. The broad sense heritability ranged between h2 = 0.14–0.217 (2016), 0.16–0.51 (2017) and 0.27–0.36 (2018).
Among the eight MAGIC founders, variable STB responses were observed in different datasets (Table 4). Soissons showed the highest mean STB severity (38.52%), while Xi19 showed the lowest (dataset 2016_T2_flag, 12.19%; Table 4). In 2017, in dataset 2017_T1_flag-2, all founders had low mean STB severity except Rialto and Soissons (Table 4). At the second time point, higher mean STB severity at 2017_T2_flag-2 was observed for all founders. Soissons showed the highest mean STB severity in the 2017_T2_flag-1 and the 2017_T2_flag-2 datasets (Table 4). The founder’s Robigus displayed low mean disease severity in dataset 2017_T2_flag leaf at the second time point (Table 4). Xi19 and Soissons were not grown in 2018 (Table 4). In the 2018_T1_flag and the 2018_T1_flag-1 disease assessments, there were limited visible symptoms of STB; however, for dataset 2018_T1_flag-2, there were higher visible STB symptoms across the founders and the population. Rialto displayed more symptoms of STB infection, while Claire displayed the lowest mean STB severity in all datasets in 2018 (Table 4). Soissons consistently displayed higher mean STB severity in all the datasets in three years (Table 4).

3.2. QTL Mapping

After quality control, lines with both phenotypic and genotypic data were used for QTL analysis (2016: 592 lines, 2017: 168 lines, and 2018: 333 lines). The QTL identified in different datasets but located at overlapping chromosomal positions were grouped and assigned the same name using the nomenclature QStb.teagasc- followed by the chromosome designation (Table 5). A total of 25 QTL associated with STB resistance were identified across the different datasets (Table 5; Figure 2). Of these, four QTL detected in four datasets were significant at the threshold determined via permutation (Table 5), while the remaining 21 QTL were identified using an arbitrary threshold (LOD = 10.0) (Table 5). Three QTL mapping approaches were used, where all QTL detected with a Haley-Knott regression model were also identified with the LMM and the LOCO models (Figure S3). The significant LOD threshold (determined via a permutation test) for each dataset at a 5% genome-wide significance level ranged between a LOD of 12.39 and a LOD of 15.40 (Table 5).
Overall, the majority of QTL were small effects accounting for 7.49–29.52% of the phenotypic variance. No QTL were consistently identified in all 13 datasets. However, a QTL on chromosome 7B, termed here QStb.teagasc-7B.1, was detected in seven datasets and explained 8.63–29.52% of the phenotypic variation. SNP marker BobWhite_c2892_167 at QStb.teagasc-7B.1 had the highest LOD score (LOD = 13.8) in the 2016_T1_flag-1. Overall, a total of 25 QTL for STB were detected across the different datasets (Table 5; Figure 2). The predicted allelic effects for all permutation significant QTL are shown in (Figure S4).
The results of the QTL analysis of plant height and flowering time data for the three trials (2016, 2017, and 2018) are presented in Table S3. The QTL analysis identified significant QTL for plant height on chromosome 4B and 4D in 2016 and 2018. The plant height QTL on 4D was also detected in 2017; however, it was only identified as significant at the arbitrary threshold. Similarly, significant QTL for flowering time were detected on chromosomes 2D, 3A, 4A, and 7B in 2016, while only the chromosome 2D QTL was detected in 2017 and 2018. For comparative analysis, the flowering time and the plant height QTL identified in this study were also detected in QTL analysis for the MAGIC population using corresponding data from Scutari et al. [84] (Table S3).

3.3. In-Silico Gene Annotation Data and Alignment of QTL and Genes

The peak SNPs of a small number of QTL were coincidentally located with genes annotated for molecular function (Table S4). These genes were functionally annotated to identify their potential function in different process including function in modifying wall lignin-1/2, RNA 5’ end processing, cellular metabolic process, ion transmembrane transport, and defense response (Table S4).
Out of the 25 QTL identified, we found 15 to be co-located with previously reported QTL and Stb genes (i.e., Stb8 [85], Stb13 [86], and Stb14 [86]), based on the anchoring of genetic markers to the wheat reference genome assembly. The remaining ten QTL were identified as potential novel loci conferring STB resistance in the field (Table S5; Figure 3).

4. Discussion

We screened the “NIAB Elite MAGIC” population for STB resistance under natural STB infection in field conditions for multiple years to further elucidate the complex genetic architecture underlying resistance. STB is a major wheat disease around the world, and farmers are heavily reliant on the use of fungicide programmes to control yield losses [87,88]. The increased reliance on chemical-control measures has led to the development of fungicide resistance in Z. tritici populations, increasing the risk for farmers and making the crop less sustainable in the long term. Alternatively, the deployment of cultivars with increased genetic resistance would provide an economic and environmentally sustainable strategy as part of an integrated management strategy. In support of this, we evaluated the “NIAB Elite MAGIC” population in an environment with typically high STB disease pressure and identified thirteen QTL associated with STB resistance.

4.1. Field Trials and Natural Septoria Infection

In this study, the number of lines tested varied across the years. In the first year of evaluation, the whole population of 1072 lines was planted in single-row plots. In the second year of evaluation, a subset of 191 lines was selected by taking a single line from 191 of the 208 eight-way families; within eight-way families, lines were selected based on their STB response in 2016. In the second year, lines were planted in six-row plots. In the third year, we went back to single-row plots and evaluated 374 lines; again, these were selected to represent all eight-way families. Taking a subset of the MAGIC population to represent all eight-way families was successfully used in a recent study to identify QTL for leaf and glume blotch [61]. Z. tritici can evolve rapidly through a high degree of recombination within and among populations, resulting in high variability in population composition [15,89], leading to variable STB responses across and within seasons.
Testing the MAGIC population under natural infection across multiple years enabled us to identify potentially durable sources of adult-plant resistance. Our evaluation site in Carlow, Ireland routinely has a medium-to-high STB inoculum pressure [88], and multi-year testing allowed us to determine stable resistances against STB populations that may differ over the years trialed. The success of an STB epidemic depends on favourable environmental conditions [8]. We see this in our study where higher STB severity was observed in 2016 and 2017 due to in-season rainfall and humidity during the growing season, while, in 2018, low STB inoculum pressure was observed due to drought conditions. While STB responses across years were significantly correlated, relatively low correlations (typically of ~2016 and 2018, r = 0.15–0.37) were observed—likely due to differences in available moisture, prevailing temperature, pathogen population and trial design [90]. Broad sense heritability ranged between 0.14–0.22 (2016), 0.16–0.51 (2017), and 0.27–0.36 (2018). These are in line with previously estimated heritability for STB resistance [91,92,93].
Plant height and heading date can influence STB resistance as part of disease escape mechanisms [94,95,96,97]. In all datasets, plant height was negatively correlated with STB severity. This is because the lower leaves are the first to get infected at the start of the season, followed by vertical dispersal of pycnidiospores primarily due to rain splashes infecting leaves in the upper canopy. Thus, a greater internodal distance in the plants was associated with fewer STB symptoms. Similarly, flowering time impacts exposure to the STB epidemic as the uppermost leaves of later flowering varieties emerge later in the season when conditions are typically dryer, therefore acting as a disease escape mechanism. In general, late-flowering genotypes are preferred, as they can escape disease spread with plants appearing to have a resistant phenotype due to inoculum avoidance [35]. Therefore, residuals for STB were obtained after accounting for plant height and flowering time.
The selection of the founders is critical when developing MAGIC populations to ensure that the resulting population is genetically diverse and segregating for key traits. While higher yield per se is critical when selecting parents, the incorporation of other traits impacting yield such as disease resistance is also important. The founders of the “NIAB Elite MAGIC” population consist of eight genetically diverse winter wheat cultivars from UK and European wheat breeding programs, each contributing beneficial alleles for agronomic traits. STB response of the founders of the MAGIC population previously ranged between 5–7 on a scale of 1–9, where 1 = susceptible and 9 = resistant (https://ahdb.org.uk/rl; [98]). In our study, across datasets, all founders had depicted a range of STB scores that can be attributed to the vertical movement of the Z. tritici spores in the field, the extended length of exposure to the inoculum, the maximum inoculum load at the end of the season, and the plant growth stage correlating with onset of leaf senescence. In the study, two founders (Alchemy and Robigus), which were selected as MAGIC founders for various reasons, including disease resistance against multiple pathogens [49], displayed low disease scores. Additionally, Brompton and Claire displayed relatively low disease severity, suggesting other founders may also contribute to STB resistance in the population. Combinations of parental alleles at multiple loci across the genome have resulted in some of the MAGIC RILs having lower disease scores than the founders. Such transgressive segregation is a common feature of most traits segregating in MAGIC populations [53]

4.2. QTL Analysis and Comparison with Previously Reported STB QTL and Resistance Genes

We identified 25 QTL conferring resistances against STB. We also estimated the founder haplotype effects for resistance to STB for each QTL passing the permutated significance threshold (i.e., for the “strong” QTL) (Figure S4). Ten new QTL were detected in our study; however, these were identified using an arbitrary LOD threshold of 10 and are putative QTL with weak support. These ten QTL were located on chromosomes 1B (QStb.teagasc-1B.1 and QStb.teagasc-1B.2), 1D (QStb.teagasc-1D.1), 2A (QStb.teagasc-2A.2), 3D (QStb.teagasc-3D.1), 4A (QStb.teagasc-4A.1), 4D (QStb.teagasc-4D.1), 6A (QStb.teagasc-6A.2), 6B (QStb.teagasc-6B.1), and 6D (QStb.teagasc-6D.1). The characterisation of novel QTL controlling STB resistance in the MAGIC population provides the knowledge from which markers could be developed to track beneficial alleles in wheat research and development programmes and to generate new allelic combinations across loci to provide improved resistance against STB. These sources of resistance can be further tested in multiple environments. Robust QTLs could then be exploited in combination with previously reported Stb genes and QTL via gene stacking.
In addition, we detected 15 QTL whose positions overlapped with previously published QTL conferring resistance to STB (detailed in Figure 3 and Table S5). Of these, four QTL (QStb.teagasc-2D.1, QStb.teagasc-4B.1, QStb.teagasc-6D.2, and QStb.teagasc-7B.1) were co-located with published adult plant STB resistance QTL identified under German field conditions [76], while nine QTL co-located with QTL from a single previously published study of field STB resistance in Switzerland [74]. Notably, QStb.teagasc-7B.1 co-located with STB resistance QTL identified in both [74,76]. As these QTL appear to have been identified in more than one country, this suggests they may provide sources of durable resistance against different pathogen populations and prevailing conditions.
Five of the QTL detected in our study (QStb.teagasc-2D.1, QStb.teagasc-3A.1, QStb.teagasc-4B.1, QStb.teagasc-5A.1, and QStb.teagasc-7B.1) were found to co-locate with QTL (Qstb.B22-2D, Qstb.Z86-3A, Qstb.B22-3A, Qstb.Z86-4B.b, Qstb.Z86-5A, and Qstb.B22-7B.b) detected in a mapping study in two back backcross primary synthetic hexaploid wheat populations, in which they conferred resistance against natural STB infection at multiple locations in Germany [79]. Thus, the genomic region was considered to be potentially durable against STB. New and durable sources of genetic resistance against STB have previously been identified from synthetic hexaploid wheat, for instance, Stb5 on chromosome 7D [99], Stb8 on 7B [85], Stb16q on 3D [36], and Stb17 on 5A [36]. Although synthetic hexaploid wheat is a good source of diverse resistances against fungal diseases, breeders are reluctant to exploit these diverse sources of resistance due to the risk of linkage drag. However, diverse germplasm such as synthetic hexaploid wheat, landraces, and wild relatives can be backcrossed with elite cultivar and molecular markers used to address these difficulties and develop introgression lines. Introgression lines from wild relatives of wheat can also be used to deploy exotic alleles into elite genetic backgrounds. For instance, the variety Robigus, a commonly used parent in the European wheat pedigree [100] and also one of the eight founders of the “NIAB Elite MAGIC” population, contains putative Triticum dicoccoides introgressions and provides a durable source of STB resistance [49,68,101].
As Stb.teagasc-7B.1 was the most significant locus identified in the MAGIC population, having been identified in seven of our 13 datasets, we consider this QTL in more detail here. QStb.teagasc-7B.1 co-located with eight previously reported STB QTL (IWA814 [77], IWA3513 [77], AX-95223861 [76], QTL_7B_1, and QTL_7B_2 [81], QStb.B22-7B.b [79], wsnp_JD_c646_966400 [80] and Interval_ID-17 [74]) and three Stb genes (Stb8 [85], Stb13 and Stb14 [86]). We found resistance alleles at QStb.teagasc-7B.1 to be conferred by the founders Alchemy, while alleles from the remaining five parents were associated with susceptibility (Figure S4). We also found flowering time QTL QFt.teagasc-7B.1 in our study. The known vernalization response VRN-B3 gene is located at 9.7 Mbp on chromosome 7B, which is far from the QTL (QStb.teagasc-7B.1) detected in our study. Furthermore, we used plant height and flowering time as covariates in the STB QTL analysis.
QTL conferring robust STB resistance under different field conditions has always been of particular interest for breeders. Here, we performed QTL analysis to identify genomic regions underpinning STB resistance in a MAGIC population using different mapping approaches. In our study, although trials were held over multiple years, the phenotypic data were from one location. Therefore, the data are likely insufficient to deduce the durability of these QTL and do not dissect line by location interaction. Testing in multiple locations will further increase understanding of the durability and underlying mechanisms of resistance. QTL detected by each single STB phenotype (i.e., time point and/or leaf combination) only explained relatively low proportions of the phenotypic variation in STB response (8.63–29.52%). This may also explain why only 12 of the QTL were detected across datasets, and the QTL have much larger intervals. The projection of QTL detected in this study on the physical map enabled us to determine if QTL had been identified previously. QTL detected across multiple studies could be the potential targets for durable STB resistance in breeding programs.

4.3. Breeding for Durable STB Resistance

The results presented here describe QTL for STB identified in the “NIAB Elite MAGIC” population under natural infection in a high-disease pressure environment. A single QTL can be introgressed using marker-assisted selection in breeding programs. However, combining a large number of QTL from multiple lines in a breeding program is challenging in terms of resources, epispastic interactions, and residual effects such as linkage drag and yield penalty. Therefore, resistance QTL may require prioritising for selection through successive cycles of breeding. Approaches such as genomic selection could be useful for quantitative resistance by estimating a line’s breeding value using genome-wide markers, and QTL identified here and in other studies can be used as fixed effects during genomic selection [75,102]. For instance, the prediction accuracy for STB resistance in wheat has been previously reported to have improved from 0.47 (without using QTL as fixed effects) to 0.62 (with using QTL as fixed effects) [75]. Ultimately, a pyramiding of qualitative and quantitative resistance has been highlighted as a strategy to extend the life of resistant cultivars [103], thereby providing multiple barriers against STB and reducing the number of asexual cycles in the field during the cropping season.

4.4. Conclusions

STB is one of the most devastating wheat diseases in north-western Europe as well as other wheat growing regions around the world with similar climatic conditions. In this study, we detected twenty-five genomic regions associated with STB resistance. While most of these QTL were in genomic regions previously linked with STB resistance, we identified new loci associated with resistance for potential use in the breeding of novel cultivars with increased resilience to STB.

Supplementary Materials

The following are available online at https://www.mdpi.com/2073-4425/11/8/887/s1. The genotypic information including genotypic data, genetic map, and pedigree of the MAGIC population used in this study are publicly available at https://www.niab.com/research/research-projects/resources. The raw phenotypic data for the MAGIC population used in this study are publicly available at https://figshare.com/account/home#/projects/78765. The following are available online at https://www.mdpi.com/2073-4425/11/8/887/s1. Figure S1. Density distribution (blue dotted line) and normal fit (red dotted line) plot of each dataset. The title of each graph such as “2016_T1_flag” represents year (2016, 2017, and 2018), time points (T1 and T2), and different leaves (flag, flag-1, and flag-2). The prefix “logit” is added to logit-transformed phenotypic data. In 2018, plant height and days to flowering data were used as surrogate from 2016 dataset. Figure S2. Density distribution (blue dotted line) and normal fit (red dotted line) plot of each dataset after correcting for plant height and flowering time. The title of each graph such as “2016_T1_flag” represents year (2016, 2017, and 2018), time points (T1 and T2), and different leaves (flag, flag-1, and flag-2). Figure S3. LOD scores from QTL mapping for septoria tritici blotch (STB) resistance in the NIAB Elite MAGIC population displayed for each dataset. Each of the individual datasets contains the LOD scores of the genome scan using the Haley-Knott regression, linear mixed model (LMM), and leave one chromosome out (LOCO) model. The “red” line indicates 5% level of genome-wide significance threshold based on permutation test, while “blue dotted line” represents arbitrary threshold for all the datasets (LOD = 10.0), determining weak QTL. Figure S4. Estimated allele effects at different QTL for STB resistance in the NIAB Elite MAGIC population across the dataset. In each of the individual dataset, the upper panel represents BLUPs of the eight haplotype founder effects in the additive model, along with the LOD curve on the respective chromosomes. The title of each figure represents QTL and the dataset in which it was detected. The LOD scores of the genome scans represented here were determined by Haley-Knott regression. Table S1. Phenotypic data for STB, flowering time and plant height for the NIAB Elite MAGIC population collected from different datasets. Table S2. Summary of LOD scores for QTL mapping of NIAB Elite MAGIC population across different datasets. LOD scores were obtained from three different methods by Haley-Knott (hk) regression, a linear mixed model (lm) using standard kinship matrix, and a linear mixed model using leave one chromosome out (LOCO) kinship matrix. Table S3. Summary of the flowering time and plant height QTL identified using the Haley-Knott regression method in the NIAB Elite MAGIC population grown in the field under natural STB infection. QTL were compared with flowering time and plant height data for NIAB Elite MAGIC population from the previously published study by Scutari et al. [84]. Table S4. Functional annotation of peak marker of the septoria tritici blotch (STB) resistance QTL identified in this study. Table S5. Comparison of physical positions of the QTL identified in the present study with those reported previously.

Author Contributions

Conceptualization, J.S., D.M., E.M., S.B., A.R.; resources and project support, J.C.; methodology, A.R., S.B.; data curation, P.K., A.R.; formal analysis, A.R., J.K., F.M.; investigation, P.K., J.G.H.; writing—original draft preparation, A.R.; writing—review and editing; A.R., S.B., E.M., J.C., D.M., J.S., J.G.H., F.M., P.K., J.K.; project administration, P.K., D.M., J.S.; funding acquisition, D.M., J.S., E.M. All authors have read and agreed to the published version of the manuscript.

Funding

“This research was funded by the Department of Agriculture, Food and the Marine (DAFM) Research Stimulus Fund, Ireland, grant number 14/S/819 (VICCI—The Virtual Irish Centre for Crop Improvement)”. AR “This project has received funding from the European Union’s Horizon 2020 research and innovation programme under the Marie Sklodowska-Curie grant agreement No 794040”. J.C was funded by Biotechnology and Biological Sciences Research Council (BBSRC) grant BB/N00518X/1.

Acknowledgments

The authors acknowledge all the technical staff at Teagasc, who helped in conducting and data collection from field trials.

Conflicts of Interest

The authors declare no conflict of interest. The funders had no role in the design of the study; in the collection, analyses, or interpretation of data; in the writing of the manuscript, or in the decision to publish the results.

References

  1. Cook, E. Agriculture, Forestry and Fishery Statistics, 2018 Edition; Publications Office of the European Union: Luxembourg, 2018. [Google Scholar]
  2. Trnka, M.; Rötter, R.P.; Ruiz-Ramos, M.; Kersebaum, K.C.; Olesen, J.E.; Žalud, Z.; Semenov, M.A. Adverse weather conditions for European wheat production will become more frequent with climate change. Nat. Clim. Chang. 2014, 4, 637–643. [Google Scholar] [CrossRef]
  3. Van der Bom, F.; Magid, J.; Jensen, L.S. Long-term P and K fertilisation strategies and balances affect soil availability indices, crop yield depression risk and N use. Eur. J. Agron. 2017, 86, 12–23. [Google Scholar] [CrossRef]
  4. Singh, R.P.; Singh, P.K.; Rutkoski, J.; Hodson, D.P.; He, X.; Jørgensen, L.N.; Hovmøller, M.S.; Huerta-Espino, J. Disease impact on wheat yield potential and prospects of genetic control. Annu. Rev. Phytopathol. 2016, 54, 303–322. [Google Scholar] [CrossRef] [PubMed] [Green Version]
  5. Deutsch, C.A.; Tewksbury, J.J.; Tigchelaar, M.; Battisti, D.S.; Merrill, S.C.; Huey, R.B.; Naylor, R.L. Increase in crop losses to insect pests in a warming climate. Science 2018, 361, 916–919. [Google Scholar] [CrossRef] [Green Version]
  6. Savary, S.; Willocquet, L.; Pethybridge, S.J.; Esker, P.; McRoberts, N.; Nelson, A. The global burden of pathogens and pests on major food crops. Nat. Ecol. Evol. 2019, 3, 430–439. [Google Scholar] [CrossRef]
  7. Eyal, Z. The Septoria Diseases of Wheat: Concepts and Methods of Disease Management; CIMMYT: El Batán, Mexico, 1987. [Google Scholar]
  8. Fones, H.; Gurr, S. The impact of Septoria tritici Blotch disease on wheat: An EU perspective. Fungal Genet. Biol. 2015, 79, 3–7. [Google Scholar] [CrossRef] [Green Version]
  9. Eyal, Z.; Amiri, Z.; Wahl, I. Physiologic specialization of Septoria tritici. Phytopathology 1973, 63, 1087–1091. [Google Scholar] [CrossRef]
  10. Hardwick, N.; Jones, D.; Slough, J. Factors affecting diseases of winter wheat in England and Wales, 1989–98. Plant Pathol. 2001, 50, 453–462. [Google Scholar] [CrossRef]
  11. McKendry, A.; Henke, G.; Finney, P. Effects of Septoria leaf blotch on soft red winter wheat milling and baking quality. Cereal Chem. 1995, 72, 142–146. [Google Scholar]
  12. Quaedvlieg, W.; Kema, G.; Groenewald, J.; Verkley, G.; Seifbarghi, S.; Razavi, M.; Gohari, A.M.; Mehrabi, R.; Crous, P. Zymoseptoria gen. nov.: A new genus to accommodate Septoria-like species occurring on graminicolous hosts. Pers. Mol. Phylogeny Evol. Fungi 2011, 26, 57. [Google Scholar] [CrossRef] [Green Version]
  13. Kema, G.H.; Verstappen, E.C.; Todorova, M.; Waalwijk, C. Successful crosses and molecular tetrad and progeny analyses demonstrate heterothallism in Mycosphaerella graminicola. Curr. Genet. 1996, 30, 251–258. [Google Scholar] [CrossRef] [PubMed]
  14. Suffert, F.; Sache, I.; Lannou, C. Early stages of septoria tritici blotch epidemics of winter wheat: Build-up, overseasoning, and release of primary inoculum. Plant Pathol. 2011, 60, 166–177. [Google Scholar] [CrossRef]
  15. Linde, C.C.; Zhan, J.; McDonald, B.A. Population structure of Mycosphaerella graminicola: From lesions to continents. Phytopathology 2002, 92, 946–955. [Google Scholar] [CrossRef] [PubMed] [Green Version]
  16. Ponomarenko, A.; Goodwin, S.B.; Kema, G.H. Septoria tritici blotch (STB) of wheat. Plant Health Instr. 2011. [Google Scholar] [CrossRef]
  17. Kema, G.; Annone, J.; Sayoud, R.; Van Silfhout, C. Genetic variation for virulence and resistance in the wheat-Mycosphaerella graminicola pathosystem. I. Interactions between pathogen isolates and host cultivars. Phytopathology 1996. [Google Scholar] [CrossRef]
  18. Gough, F.; Lee, T. Moisture effects on the discharge and survival of conidia of Septoria tritici. Phytopathology 1985, 75, 180–182. [Google Scholar] [CrossRef]
  19. Steinberg, G. Cell biology of Zymoseptoria tritici: Pathogen cell organization and wheat infection. Fungal Genet. Biol. 2015, 79, 17–23. [Google Scholar] [CrossRef] [Green Version]
  20. Hehir, J.; Connolly, C.; O’driscoll, A.; Lynch, J.; Spink, J.; Brown, J.; Doohan, F.; Mullins, E. Temporal and spatial field evaluations highlight the importance of the presymptomatic phase in supporting strong partial resistance in Triticum aestivum against Zymoseptoria tritici. Plant Pathol. 2018, 67, 573–583. [Google Scholar] [CrossRef]
  21. Shaw, M. Effects of temperature, leaf wetness and cultivar on the latent period of Mycosphaerella graminicola on winter wheat. Plant Pathol. 1990, 39, 255–268. [Google Scholar] [CrossRef]
  22. Armour, T.; Viljanen-Rollinson, S.; Chng, S.; Butler, R.; Jamieson, P.; Zyskowski, R. Examining the latent period of Septoria tritici blotch in a field trial of winter wheat. N. Z. Plant Prot. 2004, 57, 116–120. [Google Scholar] [CrossRef]
  23. Lovell, D.; Hunter, T.; Powers, S.; Parker, S.; Van den Bosch, F. Effect of temperature on latent period of septoria leaf blotch on winter wheat under outdoor conditions. Plant Pathol. 2004, 53, 170–181. [Google Scholar] [CrossRef]
  24. Hess, D.E.; Shaner, G. Effect of moisture and temperature on development of Septoria tritici blotch in wheat. Phytopathology 1987, 77, 215–219. [Google Scholar] [CrossRef]
  25. Thomas, M.; Cook, R.; King, J. Factors affecting development of Septoria tritici in winter wheat and its effect on yield. Plant Pathol. 1989, 38, 246–257. [Google Scholar] [CrossRef]
  26. Viljanen-Rollinson, S.; Marroni, M.; Butler, R.; Deng, Y.; Armour, T. Latent periods of Septoria tritici blotch on ten cultivars of wheat. N. Z. Plant Prot. 2005, 58, 256–260. [Google Scholar] [CrossRef]
  27. Henze, M.; Beyer, M.; Klink, H.; Verreet, J.-A. Characterizing meteorological scenarios favorable for Septoria tritici infections in wheat and estimation of latent periods. Plant Dis. 2007, 91, 1445–1449. [Google Scholar] [CrossRef] [PubMed] [Green Version]
  28. Rehfus, A.; Strobel, D.; Bryson, R.; Stammler, G. Mutations in sdh genes in field isolates of Zymoseptoria tritici and impact on the sensitivity to various succinate dehydrogenase inhibitors. Plant Pathol. 2018, 67, 175–180. [Google Scholar] [CrossRef]
  29. McDonald, M.C.; Renkin, M.; Spackman, M.; Orchard, B.; Croll, D.; Solomon, P.S.; Milgate, A. Rapid parallel evolution of azole fungicide resistance in Australian populations of the wheat pathogen Zymoseptoria tritici. Appl. Environ. Microbiol. 2019, 85, e01908–e01918. [Google Scholar] [CrossRef] [PubMed] [Green Version]
  30. Fraaije, B.; Cools, H.; Fountaine, J.; Lovell, D.; Motteram, J.; West, J.; Lucas, J. Role of ascospores in further spread of QoI-resistant cytochrome b alleles (G143A) in field populations of Mycosphaerella graminicola. Phytopathology 2005, 95, 933–941. [Google Scholar] [CrossRef] [Green Version]
  31. Brown, J.K.; Chartrain, L.; Lasserre-Zuber, P.; Saintenac, C. Genetics of resistance to Zymoseptoria tritici and applications to wheat breeding. Fungal Genet. Biol 2015, 79, 33–41. [Google Scholar] [CrossRef] [Green Version]
  32. Arraiano, L.; Brown, J. Identification of isolate-specific and partial resistance to septoria tritici blotch in 238 European wheat cultivars and breeding lines. Plant Pathol. 2006, 55, 726–738. [Google Scholar] [CrossRef]
  33. Saintenac, C.; Lee, W.-S.; Cambon, F.; Rudd, J.J.; King, R.C.; Marande, W.; Powers, S.J.; Bergès, H.; Phillips, A.L.; Uauy, C. Wheat receptor-kinase-like protein Stb6 controls gene-for-gene resistance to fungal pathogen Zymoseptoria tritici. Nat. Genet. 2018, 50, 368. [Google Scholar] [CrossRef] [PubMed]
  34. Zhong, Z.; Marcel, T.C.; Hartmann, F.E.; Ma, X.; Plissonneau, C.; Zala, M.; Ducasse, A.; Confais, J.; Compain, J.; Lapalu, N. A small secreted protein in Zymoseptoria tritici is responsible for avirulence on wheat cultivars carrying the Stb6 resistance gene. New Phytol. 2017, 214, 619–631. [Google Scholar] [CrossRef] [PubMed] [Green Version]
  35. Arraiano, L.; Balaam, N.; Fenwick, P.; Chapman, C.; Feuerhelm, D.; Howell, P.; Smith, S.; Widdowson, J.; Brown, J. Contributions of disease resistance and escape to the control of Septoria tritici blotch of wheat. Plant Pathol. 2009, 58, 910–922. [Google Scholar] [CrossRef]
  36. Ghaffary, S.M.T.; Faris, J.D.; Friesen, T.L.; Visser, R.G.; van der Lee, T.A.; Robert, O.; Kema, G.H. New broad-spectrum resistance to septoria tritici blotch derived from synthetic hexaploid wheat. Theor. Appl. Genet. 2012, 124, 125–142. [Google Scholar] [CrossRef] [Green Version]
  37. Stukenbrock, E.H.; Jørgensen, F.G.; Zala, M.; Hansen, T.T.; McDonald, B.A.; Schierup, M.H. Whole-genome and chromosome evolution associated with host adaptation and speciation of the wheat pathogen Mycosphaerella graminicola. PLoS Genet. 2010, 6, e1001189. [Google Scholar] [CrossRef] [Green Version]
  38. Goodwin, S.B.; M’Barek, S.B.; Dhillon, B.; Wittenberg, A.H.; Crane, C.F.; Hane, J.K.; Foster, A.J.; Van der Lee, T.A.; Grimwood, J.; Aerts, A. Finished genome of the fungal wheat pathogen Mycosphaerella graminicola reveals dispensome structure, chromosome plasticity, and stealth pathogenesis. PLoS Genet. 2011, 7, e1002070. [Google Scholar] [CrossRef] [Green Version]
  39. Eriksen, L.; Borum, F.; Jahoor, A. Inheritance and localisation of resistance to Mycosphaerella graminicola causing septoria tritici blotch and plant height in the wheat (Triticum aestivum L.) genome with DNA markers. Theor. Appl. Genet. 2003, 107, 515–527. [Google Scholar] [CrossRef]
  40. Zhan, J.; McDonald, B.A. The interaction among evolutionary forces in the pathogenic fungus Mycosphaerella graminicola. Fungal Genet. Biol. 2004, 41, 590–599. [Google Scholar] [CrossRef]
  41. Kildea, S.; Byrne, J.; Cucak, M.; Hutton, F. First report of virulence to the septoria tritici blotch resistance gene Stb16q in the Irish Zymoseptoria tritici population. New Dis. Rep. 2020, 41, 13. [Google Scholar] [CrossRef] [Green Version]
  42. Morais, D.; Duplaix, C.; Sache, I.; Laval, V.; Suffert, F.; Walker, A.-S. Overall stability in the genetic structure of a Zymoseptoria tritici population from epidemic to interepidemic stages at a small spatial scale. Eur. J. Plant Pathol. 2019, 154, 423–436. [Google Scholar] [CrossRef]
  43. Ladejobi, O.; Elderfield, J.; Gardner, K.A.; Gaynor, R.C.; Hickey, J.; Hibberd, J.M.; Mackay, I.J.; Bentley, A.R. Maximizing the potential of multi-parental crop populations. Appl. Transl. Genom. 2016, 11, 9–17. [Google Scholar] [CrossRef] [PubMed] [Green Version]
  44. McMullen, M.D.; Kresovich, S.; Villeda, H.S.; Bradbury, P.; Li, H.; Sun, Q.; Flint-Garcia, S.; Thornsberry, J.; Acharya, C.; Bottoms, C. Genetic properties of the maize nested association mapping population. Science 2009, 325, 737–740. [Google Scholar] [CrossRef] [Green Version]
  45. Huang, B.E.; George, A.W.; Forrest, K.L.; Kilian, A.; Hayden, M.J.; Morell, M.K.; Cavanagh, C.R. A multiparent advanced generation inter-cross population for genetic analysis in wheat. Plant Biotechnol. J. 2012, 10, 826–839. [Google Scholar] [CrossRef] [PubMed]
  46. Rakshit, S.; Rakshit, A.; Patil, J. Multiparent intercross populations in analysis of quantitative traits. J. Genet. 2012, 91, 111–117. [Google Scholar] [CrossRef] [PubMed]
  47. Kover, P.X.; Valdar, W.; Trakalo, J.; Scarcelli, N.; Ehrenreich, I.M.; Purugganan, M.D.; Durrant, C.; Mott, R. A multiparent advanced generation inter-cross to fine-map quantitative traits in Arabidopsis thaliana. PLoS Genet. 2009, 5, e1000551. [Google Scholar] [CrossRef] [PubMed] [Green Version]
  48. Bandillo, N.; Raghavan, C.; Muyco, P.A.; Sevilla, M.A.L.; Lobina, I.T.; Dilla-Ermita, C.J.; Tung, C.-W.; McCouch, S.; Thomson, M.; Mauleon, R. Multi-parent advanced generation inter-cross (MAGIC) populations in rice: Progress and potential for genetics research and breeding. Rice 2013, 6, 11. [Google Scholar] [CrossRef] [PubMed] [Green Version]
  49. Mackay, I.J.; Bansept-Basler, P.; Barber, T.; Bentley, A.R.; Cockram, J.; Gosman, N.; Greenland, A.J.; Horsnell, R.; Howells, R.; O’Sullivan, D.M. An eight-parent multiparent advanced generation inter-cross population for winter-sown wheat: Creation, properties, and validation. G3 Genes Genomes Genet. 2014, 4, 1603–1610. [Google Scholar] [CrossRef] [Green Version]
  50. Sannemann, W.; Huang, B.E.; Mathew, B.; Léon, J. Multi-parent advanced generation inter-cross in barley: High-resolution quantitative trait locus mapping for flowering time as a proof of concept. Mol. Breed. 2015, 35, 86. [Google Scholar] [CrossRef]
  51. Jiménez-Galindo, J.C.; Malvar, R.A.; Butrón, A.; Santiago, R.; Samayoa, L.F.; Caicedo, M.; Ordás, B. Mapping of resistance to corn borers in a MAGIC population of maize. BMC Plant Biol. 2019, 19, 431. [Google Scholar] [CrossRef] [Green Version]
  52. Pascual, L.; Desplat, N.; Huang, B.E.; Desgroux, A.; Bruguier, L.; Bouchet, J.P.; Le, Q.H.; Chauchard, B.; Verschave, P.; Causse, M. Potential of a tomato MAGIC population to decipher the genetic control of quantitative traits and detect causal variants in the resequencing era. Plant Biotechnol. J. 2015, 13, 565–577. [Google Scholar] [CrossRef]
  53. Scott, M.F.; Ladejobi, O.; Amer, S.; Bentley, A.R.; Biernaskie, J.; Boden, S.A.; Clark, M.; Dell’Acqua, M.; Dixon, L.E.; Filippi, C.V. Multi-parent populations in crops: A toolbox integrating genomics and genetic mapping with breeding. Heredity 2020. [Google Scholar] [CrossRef] [PubMed]
  54. Cockram, J.; Mackay, I. Genetic mapping populations for conducting high-resolution trait mapping in plants. In Plant Genetics and Molecular Biology; Springer: Berlin/Heidelberg, Germany, 2018; pp. 109–138. [Google Scholar]
  55. Milner, S.G.; Maccaferri, M.; Huang, B.E.; Mantovani, P.; Massi, A.; Frascaroli, E.; Tuberosa, R.; Salvi, S. A multiparental cross population for mapping QTL for agronomic traits in durum wheat (Triticum turgidum ssp. durum). Plant Biotechnol. J. 2016, 14, 735–748. [Google Scholar] [CrossRef] [PubMed] [Green Version]
  56. Sannemann, W.; Lisker, A.; Maurer, A.; Léon, J.; Kazman, E.; Cöster, H.; Holzapfel, J.; Kempf, H.; Korzun, V.; Ebmeyer, E. Adaptive selection of founder segments and epistatic control of plant height in the MAGIC winter wheat population WM-800. BMC Genom. 2018, 19, 559. [Google Scholar] [CrossRef] [PubMed]
  57. Stadlmeier, M.; Hartl, L.; Mohler, V. Usefulness of a Multiparent Advanced Generation Intercross Population With a Greatly Reduced Mating Design for Genetic Studies in Winter Wheat. Front. Plant Sci. 2018, 9. [Google Scholar] [CrossRef] [Green Version]
  58. Cockram, J. MAGIC Map and Go: Deploying MAGIC Populations for Rapid Development and Dissemination of Genetic Markers for Yield Improvement in Elite UK Winter Wheat; AHDB: Kenilworth, UK, 2020; p. 2. [Google Scholar]
  59. Corsi, B.; Percival-Alwyn, L.; Downie, R.C.; Venturini, L.; Iagallo, E.M.; Mantello, C.C.; McCormick-Barnes, C.; See, P.T.; Oliver, R.P.; Moffat, C.S. Genetic analysis of wheat sensitivity to the ToxB fungal effector from Pyrenophora tritici-repentis, the causal agent of tan spot. Theor. Appl. Genet. 2020, 133, 935–950. [Google Scholar] [CrossRef] [PubMed] [Green Version]
  60. Stadlmeier, M.; Jørgensen, L.N.; Corsi, B.; Cockram, J.; Hartl, L.; Mohler, V. Genetic dissection of resistance to the three fungal plant pathogens Blumeria graminis, Zymoseptoria tritici, and Pyrenophora tritici-repentis using a multiparental winter wheat population. G3 Genes Genomes Genet. 2019, 9, 1745–1757. [Google Scholar] [CrossRef] [Green Version]
  61. Lin, M.; Corsi, B.; Ficke, A.; Tan, K.-C.; Cockram, J.; Lillemo, M. Genetic mapping using a wheat multi-founder population reveals a locus on chromosome 2A controlling resistance to both leaf and glume blotch caused by the necrotrophic fungal pathogen Parastagonospora nodorum. Theor. Appl. Genet. 2020, 133, 785–808. [Google Scholar] [CrossRef] [Green Version]
  62. Zadoks, J.C.; Chang, T.T.; Konzak, C.F. A decimal code for the growth stages of cereals. Weed Res. 1974, 14, 415–421. [Google Scholar] [CrossRef]
  63. Richards, R.; Condon, A.; Rebetzke, G. Traits to Improve Yield in Dry Environments: Application of Physiology in Wheat Breeding; CIMMYT: El Batán, Mexico, 2001; pp. 88–100. [Google Scholar]
  64. Team, R.C. R: A Language and Environment for Statistical Computing; R Found. Stat. Comput.: Vienna, Austria, 2017. [Google Scholar]
  65. Harrell, F.E., Jr.; Harrell, M.F.E., Jr.; Hmisc, D. Package ‘rms’; Vanderbilt University: Nashville, TN, USA, 2019; p. 229. [Google Scholar]
  66. Bates, D.; Mächler, M.; Bolker, B.; Walker, S. Fitting Linear Mixed-Effects Models Using lme4. J. Statistical Software. 2015, 67, 48. [Google Scholar] [CrossRef]
  67. Team, R.C. R: A Language and Environment for Statistical Computing; Version 3.1. 2 [Computer Program]; R Foundation for Statistical Computing: Vienna, Austria, 2014. [Google Scholar]
  68. Gardner, K.A.; Wittern, L.M.; Mackay, I.J. A highly recombined, high-density, eight-founder wheat MAGIC map reveals extensive segregation distortion and genomic locations of introgression segments. Plant Biotechnol. J. 2016, 14, 1406–1417. [Google Scholar] [CrossRef] [Green Version]
  69. Broman, K.W.; Gatti, D.M.; Simecek, P.; Furlotte, N.A.; Prins, P.; Sen, Ś.; Yandell, B.S.; Churchill, G.A. R/qtl2: Software for mapping quantitative trait loci with high-dimensional data and multiparent populations. Genetics 2019, 211, 495–502. [Google Scholar] [CrossRef] [PubMed] [Green Version]
  70. McIntosh, R.; Dubcovsky, J.; Rogers, W.; Morris, C.; Appels, R.; Xia, X.; Azul, B. Catalogue of Gene Symbols for Wheat: 2013–2014. In Proceedings of the 12th International Wheat Genetics Symposium, Yokohama, Japan, 8–14 September 2013. [Google Scholar]
  71. Appels, R.; Eversole, K.; Stein, N.; Feuillet, C.; Keller, B.; Rogers, J.; Pozniak, C.J.; Choulet, F.; Distelfeld, A.; Poland, J.; et al. Shifting the limits in wheat research and breeding using a fully annotated reference genome. Science 2018, 361, eaar7191. [Google Scholar] [CrossRef] [PubMed] [Green Version]
  72. Blake, V.; Birkett, C.; Matthews, D.; Hane, D.; Bradbury, P. The Triticeae Toolbox: Combining Phenotype and Genotype Data to Advance Small-Grains Breeding. Plant Genome 2016, 9, 1–10. [Google Scholar] [CrossRef] [PubMed] [Green Version]
  73. Buels, R.; Yao, E.; Diesh, C.M.; Hayes, R.D.; Munoz-Torres, M.; Helt, G.; Goodstein, D.M.; Elsik, C.G.; Lewis, S.E.; Stein, L. JBrowse: A dynamic web platform for genome visualization and analysis. Genome Biol. 2016, 17, 66. [Google Scholar] [CrossRef] [PubMed] [Green Version]
  74. Yates, S.; Mikaberidze, A.; Krattinger, S.G.; Abrouk, M.; Hund, A.; Yu, K.; Studer, B.; Fouche, S.; Meile, L.; Pereira, D. Precision phenotyping reveals novel loci for quantitative resistance to septoria tritici blotch. Plant Phenomics 2019, 2019, 3285904. [Google Scholar] [CrossRef] [Green Version]
  75. Odilbekov, F.; Armoniene, R.; Koc, A.; Svensson, J.; Chawade, A. GWAS-Assisted Genomic Prediction to Predict Resistance to Septoria Tritici Blotch in Nordic Winter Wheat at Seedling Stage. Front. Genet. 2019, 10, 1224. [Google Scholar] [CrossRef]
  76. Muqaddasi, Q.H.; Zhao, Y.; Rodemann, B.; Plieske, J.; Ganal, M.W.; Röder, M.S. Genome-wide Association Mapping and Prediction of Adult Stage Septoria tritici Blotch Infection in European Winter Wheat via High-Density Marker Arrays. Plant Genome 2019, 12. [Google Scholar] [CrossRef] [Green Version]
  77. Ando, K.; Rynearson, S.; Muleta, K.T.; Gedamu, J.; Girma, B.; Bosque-Perez, N.A.; Chen, M.-S.; Pumphrey, M.O. Genome-wide associations for multiple pest resistances in a Northwestern United States elite spring wheat panel. PLoS ONE 2018, 13, e0191305. [Google Scholar] [CrossRef] [Green Version]
  78. Kidane, Y.G.; Hailemariam, B.N.; Mengistu, D.K.; Fadda, C.; Pè, M.E.; Dell‘Acqua, M. Genome-wide association study of Septoria tritici blotch resistance in Ethiopian durum wheat landraces. Front. Plant Sci. 2017, 8, 1586. [Google Scholar] [CrossRef] [Green Version]
  79. Naz, A.A.; Klaus, M.; Pillen, K.; Léon, J. Genetic analysis and detection of new QTL alleles for S eptoria tritici blotch resistance using two advanced backcross wheat populations. Plant Breed. 2015, 134, 514–519. [Google Scholar] [CrossRef]
  80. Gurung, S.; Mamidi, S.; Bonman, J.M.; Xiong, M.; Brown-Guedira, G.; Adhikari, T.B. Genome-wide association study reveals novel quantitative trait loci associated with resistance to multiple leaf spot diseases of spring wheat. PLoS ONE 2014, 9, e108179. [Google Scholar] [CrossRef] [PubMed] [Green Version]
  81. Karlstedt, F.; Kopahnke, D.; Perovic, D.; Jacobi, A.; Pillen, K.; Ordon, F. Mapping of quantitative trait loci (QTL) for resistance against Zymoseptoria tritici in the winter spelt wheat accession HTRI1410 (Triticum aestivum subsp. spelta). Euphytica 2019, 215, 108. [Google Scholar] [CrossRef]
  82. Odilbekov, F.; He, X.; Armoniené, R.; Saripella, G.V.; Henriksson, T.; Singh, P.K.; Chawade, A. QTL Mapping and Transcriptome Analysis to Identify Differentially Expressed Genes Induced by Septoria Tritici Blotch Disease of Wheat. Agronomy 2019, 9, 510. [Google Scholar] [CrossRef] [Green Version]
  83. Vagndorf, N.; Nielsen, N.H.; Edriss, V.; Andersen, J.R.; Orabi, J.; Jørgensen, L.N.; Jahoor, A. Genomewide association study reveals novel quantitative trait loci associated with resistance towards Septoria tritici blotch in North European winter wheat. Plant Breed. 2017, 136, 474–482. [Google Scholar] [CrossRef]
  84. Scutari, M.; Howell, P.; Balding, D.J.; Mackay, I. Multiple quantitative trait analysis using Bayesian networks. Genetics 2014, 198, 129–137. [Google Scholar] [CrossRef] [Green Version]
  85. Adhikari, T.B.; Anderson, J.M.; Goodwin, S.B. Identification and molecular mapping of a gene in wheat conferring resistance to Mycosphaerella graminicola. Phytopathology 2003, 93, 1158–1164. [Google Scholar] [CrossRef] [Green Version]
  86. Cowling, S.G. Identification and Mapping of Host Resistance Genes to Septoria Tritici Blotch of Wheat. Master’s Thesis, University of Manitoba, Winnipeg, Manitoba, 2006. [Google Scholar]
  87. Paveley, N.; Clark, B. The Wheat Disease Management Guide; Home Grown Cereals Authority: London, UK, 2000. [Google Scholar]
  88. Lynch, J.P.; Glynn, E.; Kildea, S.; Spink, J. Yield and optimum fungicide dose rates for winter wheat (Triticum aestivum L.) varieties with contrasting ratings for resistance to septoria tritici blotch. Field Crop. Res. 2017, 204, 89–100. [Google Scholar] [CrossRef]
  89. McDonald, B.A.; Martinez, J. DNA restriction fragment length polymorphisms among Mycosphaerella graminicola (anamorph Septoria tritici) isolates collected from a single wheat field. Phytopathology 1990, 80, 1368–1373. [Google Scholar] [CrossRef]
  90. Robert, C.; Garin, G.; Abichou, M.; Houlès, V.; Pradal, C.; Fournier, C. Plant architecture and foliar senescence impact the race between wheat growth and Zymoseptoria tritici epidemics. Ann. Bot. 2018, 121, 975–989. [Google Scholar] [CrossRef]
  91. Gerard, G.S.; Börner, A.; Lohwasser, U.; Simón, M.R. Genome-wide association mapping of genetic factors controlling Septoria tritici blotch resistance and their associations with plant height and heading date in wheat. Euphytica 2017, 213, 27. [Google Scholar] [CrossRef]
  92. Risser, P. Mapping of Quantitative-Trait Loci (QTL) for Adult-Plant Resistance to Septoria Tritici in Five Wheat Populations (Triticum aestivum L.). Master’s Thesis, Universität Hohenheim, Stuttgart, Germany, 2010. [Google Scholar]
  93. Juliana, P.; Singh, R.P.; Singh, P.K.; Crossa, J.; Rutkoski, J.E.; Poland, J.A.; Bergstrom, G.C.; Sorrells, M.E. Comparison of models and whole-genome profiling approaches for genomic-enabled prediction of Septoria tritici blotch, Stagonospora nodorum blotch, and tan spot resistance in wheat. Plant Genome 2017, 10, 1–16. [Google Scholar] [CrossRef] [PubMed] [Green Version]
  94. Rosielle, A. Sources of resistance in wheat to speckled leaf blotch caused by Septoria tritici. Euphytica 1972, 21, 152–161. [Google Scholar] [CrossRef]
  95. Simón, M.; Worland, A.; Struik, P. Influence of plant height and heading date on the expression of the resistance to Septoria tritici blotch in near isogenic lines of wheat. Crop Sci. 2004, 44, 2078–2085. [Google Scholar] [CrossRef]
  96. Parlevliet, J. Plant pathosystems: An attempt to elucidate horizontal resistance. Euphytica 1977, 26, 553–556. [Google Scholar] [CrossRef]
  97. Jubene, M.; Gustafson, J.; Rajaram, S. A field disease evaluation method for selecting wheats resistant to Mycosphaerella graminicola. Plant Breed. 1992, 108, 26–32. [Google Scholar] [CrossRef]
  98. Parker, S.; Welham, S.; Paveley, N.; Foulkes, J.; Scott, R. Tolerance of septoria leaf blotch in winter wheat. Plant Pathol. 2004, 53, 1–10. [Google Scholar] [CrossRef]
  99. Arraiano, L.; Worland, A.; Ellerbrook, C.; Brown, J. Chromosomal location of a gene for resistance to septoria tritici blotch (Mycosphaerella graminicola) in the hexaploid wheat’Synthetic 6x’. Theor. Appl. Genet. 2001, 103, 758–764. [Google Scholar] [CrossRef]
  100. Fradgley, N.; Gardner, K.A.; Cockram, J.; Elderfield, J.; Hickey, J.M.; Howell, P.; Jackson, R.; Mackay, I.J. A large-scale pedigree resource of wheat reveals evidence for adaptation and selection by breeders. PLoS Biol. 2019, 17, e3000071. [Google Scholar] [CrossRef] [Green Version]
  101. Ogbonnaya, F.C.; Abdalla, O.; Mujeeb-Kazi, A.; Kazi, A.G.; Xu, S.S.; Gosman, N.; Lagudah, E.S.; Bonnett, D.; Sorrells, M.E.; Tsujimoto, H. Synthetic hexaploids: Harnessing species of the primary gene pool for wheat improvement. Plant Breed. Rev. 2013, 37, 35–122. [Google Scholar]
  102. Sarinelli, J.M.; Murphy, J.P.; Tyagi, P.; Holland, J.B.; Johnson, J.W.; Mergoum, M.; Mason, R.E.; Babar, A.; Harrison, S.; Sutton, R. Training population selection and use of fixed effects to optimize genomic predictions in a historical USA winter wheat panel. Theor. Appl. Genet. 2019, 132, 1247–1261. [Google Scholar] [CrossRef] [Green Version]
  103. Mundt, C.C. Durable resistance: A key to sustainable management of pathogens and pests. Infect. Genet. Evol. 2014, 27, 446–455. [Google Scholar] [CrossRef] [PubMed]
Figure 1. Septoria tritici blotch (STB) disease of wheat in a field trial in Carlow, Ireland, showing the resulting necrosis of the leaves within the crop canopy.
Genes 11 00887 g001
Figure 2. Genetic map locations (centiMorgan - cM) of septoria tritici blotch (STB) QTL detected in the “NIAB Elite MAGIC” population. QTL locations and interval sizes are indicated by the green bars on the right-hand side of each chromosome and are based on the genetic marker information in Table 5. The genetic map locations are based on the “NIAB Elite MAGIC” genetic map [68]. The QTL name assigned in this study (presented in Table 5) is followed by the environment in which the QTL was detected.
Genes 11 00887 g002
Figure 3. Physical map locations (megabase pair—Mbp) of septoria tritici blotch (STB) QTL detected in the current study compared to previously reported QTL. QTL locations and interval sizes are indicated by bars on the right-hand side of each chromosome and are based on the physical map information in Table 5 and Table S5. The physical map location was based on the wheat cv. Chinese Spring IWGSC RefSeq v1.0 genome assembly (IWGSC, 2018). The QTL name assigned in this study (presented in Table 5; green colour) is followed by the environment in which the QTL was detected. Previously reported QTL are indicated in blue, where the displayed QTL are only defined on the physical map by anchoring one of the two flanking makers indicated by a “*”.
Genes 11 00887 g003aGenes 11 00887 g003b
Table 1. Summary of experiments performed in this study at the adult plant stage for scoring septoria tritici blotch (STB) response across years and management applied.
Test
Environment
Experiment TypeRILs
Tested (n)
Data CollectedTime
Points
LeavesDatasetsFungicide Applied 1
2016Single row1076STB, plant height, days to floweringT1
T2
flag,
flag-1,
flag-2
2016_T1_flag, 2016_T1_flag-1, 2016_T1_flag-2, 2016_T2_flagJenton
20176-row plot192STB, plant height, days to floweringT1
T2
flag,
flag-1,
flag-2
2017_T1_flag, 2017_T1_flag-1, 2017_T1_flag-2,
2017_T2_flag, 2017_T2_flag-1, 2017_T2_flag-2,
Jenton 2
2018Single row388STBT1flag,
flag-1,
flag-2
2018_T1_flag, 2018_T1_flag-1, 2018_T1_flag-2Jenton/
Comet
1 The fungicides applied do not target STB. 2 The fungicide was applied twice; at the week of 3rd April and 24th May during the 2017 cropping season.
Table 2. Pearson correlation coefficients (r) between septoria tritici blotch (STB) and plant height and flowering time in the MAGIC population in field conditions under natural STB infection.
Datasets
Year201620172018
TraitT1_flagT1_flag-1T1_flag-2T2_flagT1_flagT1_flag-1T1_flag-2T2_flagT2_flag-1T2_flag-2flagflag-1flag-2
Flowering time−0.17−0.25−0.29−0.24−0.19−0.24−0.29−0.30−0.17−0.09−0.14−0.23−0.23
Plant height−0.28−0.22−0.20−0.20−0.23−0.26−0.26−0.29−0.20−0.25−0.22−0.25−0.23
Note: Disease assessment time points in each year (2016, 2017, and 2018) were labelled as T1 and T2, while the leaves assessed are labelled as flag, flag-1, and flag-2. All correlations were significant at p = 0.
Table 3. Pearson correlation coefficients (r) for septoria tritici blotch (STB) in the field under natural STB infection for all datasets across three field seasons. Best Linear Unbiased Estimates (BLUEs) calculated for each dataset after correction for plant height and flowering time were used.
Datasets 1,2,3
201620172018
T1_flagT1_flag-1T1_flag-2T2_flagT1_flagT1_flag-1T1_flag-2T2_flagT2_flag-1T2_flag-2flagflag-1
2016_T1_flag-10.541
2016_T1_flag-20.490.711
2016_T2_flag0.340.520.511
2017_T1_flag0.380.470.440.421
2017_T1_flag-10.430.660.50.480.651
2017_T1_flag-20.350.590.50.440.620.821
2017_T2_flag0.40.560.520.550.550.70.611
2017_T2_flag-10.420.610.60.560.580.770.690.841
2017_T2_flag-20.320.420.470.380.320.550.510.590.71
2018_flag0.320.350.410.40.390.40.350.510.510.411
2018_flag-10.340.470.510.480.340.440.490.590.530.440.691
2018_flag-20.260.480.50.470.290.40.460.550.510.440.620.83
1 Each dataset name (e.g., 2016_T1_flag) comprise year (i.e., 2016, 2017, and 2018), disease assessment time points (i.e., T1 and T2), and leaves (i.e., flag, flag-1, and flag-2) indicated. 2 All the values were significant at p-values of 0.0. 3 Cell colour changes from red to green with increased correlation coefficients.
Table 4. Summary of percentage septoria tritici blotch (STB) infection in the MAGIC population, along with STB scores for the eight founders across all datasets. The adjusted means were logit (p) back-transformed to a 0–100 percentage scale. The data shown includes the total number of lines, range, and population mean in each dataset along with the mean disease severity (%) of the founder in each dataset.
Dataset 1MAGIC PopulationFounders
Total LinesRangeMeanAlchemyBromptonClaireHerewardRialtoRobigusSoissonsXi19
(n)(min–max)(µ)
2016_T1_flag10720.11–17.091.75- 21.17-5.22-1.034.572.18
2016_T1_flag-110720.58–30.856.04-7.972.303.772.482.916.126.90
2016_T1_flag-210723.032–85.9720.19-26.3412.5821.389.5420.4723.5218.43
2016_T2_flag10720.68–86.3417.52-15.8516.3119.0134.2422.5638.5212.19
2017_T1_flag1910.35–8.982.420.752.501.752.123.990.752.531.77
2017_T1_flag-11910.71–33.046.554.974.782.654.6114.962.3811.165.95
2017_T1_flag-21912.63–65.6917.219.869.9511.629.7061.048.5535.0118.11
2017_T2_flag1913.42–79.9616.516.7123.357.5511.1215.347.3743.3517.23
2017_T2_flag-11915.758–95.0046.5121.2536.2429.4053.8751.3533.1888.3074.74
2017_T2_flag-219113.51–92.9068.9163.9867.0179.2985.9055.7037.9992.7984.23
2018_flag3740.26–47.12.47-2.920.761.292.301.14--
2018_flag-13740.67–79.998.63-6.341.502.8511.343.84--
2018_flag-23741.22–87.2834.31-18.677.5028.1361.6621.88--
1 Each dataset name (e.g., 2016_T1_flag) comprise year (i.e., 2016, 2017, and 2018), disease assessment time points (i.e., T1 and T2), and leaves (i.e., flag, flag-1, and flag-2). 2 No data were available.
Table 5. Summary of the septoria tritici blotch (STB) resistance QTL identified using Haley-Knott regression method in the MAGIC population grown in the field under natural STB infection.
QTL NameDatasetChr.Interval (cM) 1 Interval (Mbp) 2Flanking MarkersPeak MarkerPos (cM)Phy.pos (Mbp)LOD 4LOD thr 5 R 2 (%)
QStb.teagasc-1A.12017_T1_flag-11A66.54–106.72224.83–482.97Ex_c21450_396-
RFL_Contig3203_1971
BobWhite_c38865_31995.09465.2811.1913.9726.42
QStb.teagasc-1B.12018_T1_flag-11B46.87–69.653.25–240.48Excalibur_c46902_92-
RFL_Contig2852_1839
Kukri_c18006_156856.55563.1110.7412.4613.8
QStb.teagasc-1B.22017_T2_flag1B283.53–299.76648.45–662.72BS00043666_51-
BS00078414_51
Kukri_rep_c102102_2733291.21563.1110.1915.424.36
QStb.teagasc-1D.12017_T2_flag1D103.8–131.34423.25–490.6Excalibur_c23473_451-
Excalibur_c6476_811
Excalibur_c6476_811131.34460.5910.0715.424.13
QStb.teagasc-2A.12018_T1_flag-12A139.25–150.46605.18–677.53BS00049644_51-
IAAV4015
RAC875_c38018_278144.81639.9810.3112.4613.28
2016_T2_flag2A142.77–150.46615.29–677.53BS00062679_51-
IAAV4015
BS00022241_51146.83663.3212.3814.039.18
2018_T1_flag-22A142.77–150.46615.29–677.53BS00062679_51-
IAAV4015
BS00022241_51146.83663.3210.8312.1313.91
QStb.teagasc-2A.22016_T1_flag-22A249.27–259.39765.26–770.02BS00107649_51-
BS00064055_51
BS00064055_51259.39765.2610.914.288.13
QStb.teagasc-2B.12017_T1_flag-22B216.09–259.25115.11–553.62RFL_Contig4718_1323-
IACX5941
Kukri_c693_87232.95636.1110.0413.1624.07
2016_T2_flag2B224.28–366.34272.83–595.13BS00022800_51-
tplb0042o21_419
Excalibur_c105074_293235.52109.5310.4714.037.82
2016_T1_flag-22B317.29–366.34272.83–774.95RFL_Contig2751_1562-
tplb0042o21_419
BS00067878_51336.02784.6211.9314.288.86
QStb.teagasc-2D.12017_T2_flag2D0.5–21.949.343 –642.87tplb0060e06_1793-
D_contig17313_245
BS00063251_5115.33-11.4315.426.91
QStb.teagasc-3A.12016_T2_flag3A1.51–107.22137.583–336.78RAC875_c3141_214-
BS00030876_51
RFL_Contig4403_103498.98176.5510.0114.037.49
2017_T1_flag-13A22.81–176.2213.41–611.7BS00104401_51-
wsnp_Ex_c26887_36107413
Tdurum_contig10307_375166.27538.0111.1313.9726.3
2017_T2_flag3A139.3–308.8543.18–749.33Tdurum_contig59531_914-
Tdurum_contig27982_568
wsnp_Ex_c1335_2556442163.97532.3311.4515.426.93
2017_T2_flag-13A139.3–174.7543.18–616.49Tdurum_contig59531_914-
BS00056089_51
wsnp_Ex_c1335_2556442163.97532.3310.2413.9824.48
QStb.teagasc-3B.12016_T1_flag-13B49.33–60.5924.94–39.46Tdurum_contig22897_107-
Excalibur_c79902_439
Excalibur_c24391_32157.0631.111.5512.398.59
2016_T1_flag-23B49.33–60.5924.94–39.46Tdurum_contig22897_107-
Excalibur_c79902_439
Excalibur_c24391_32157.0631.111.2214.288.36
2016_T2_flag3B49.33–63.6324.94–42.34Tdurum_contig22897_107-
BS00022242_51
Excalibur_c24391_32157.0631.114.5114.0310.68
2016_T1_flag3B57.06–95.1931.11–145.31Excalibur_c24391_321-
IACX971
BS00073732_5187.6367.9210.3612.397.74
QStb.teagasc-3D.12016_T1_flag-23D100.88–119.23274.49–524.87Ku_c2845_342-
IAAV5136
Ku_c6080_1667107.27488.8511.0714.288.25
QStb.teagasc-4A.12017_T1_flag-14A33.88–74.9816.19–68.56wsnp_Ex_c28429_37553452-
wsnp_Ex_c10390_17007929
BS00110459_5166.7741.9411.213.9726.44
2016_T1_flag-14A55.12–164.0130.29–632.86Kukri_c16916_1073-
BS00091752_51
BS00108849_51132.74617.2810.6212.397.93
2017_T2_flag4A91.12–103.23583.95–597.69BS00010339_51-
BS00077716_51
BS00040648_5196.69594.6612.0915.428.21
QStb.teagasc-4B.12017_T2_flag4B0–173.225.47–665.6BS00039936_51-
BS00009342_51
wsnp_BF482960B_Ta_1_447.64289.5412.2415.428.51
2017_T1_flag-24B124.46–158.5575.6–620.06BobWhite_c11005_236-
BobWhite_c27751_206
Tdurum_contig93160_155148.22576.211.4813.1627.01
2017_T1_flag-14B125.98–182.54590.44–637.39Ku_c48056_436-
wsnp_Ku_c12503_20174234
RAC875_c1918_101152.89636.7710.8313.9725.69
2017_T2_flag-14B148.22–179.45576.2–645.3Tdurum_contig93160_155-
RAC875_c24515_602
Ra_c10455_3226166.59590.4412.1913.9828.4
2016_T2_flag4B189.64–209.52637.39–660.47BS00035426_51-
IACX7540
RAC875_c87897_333196.07650.9410.214.037.62
QStb.teagasc-4D.12016_T1_flag-24D0–110.726.6–481.613BS00054978_51-
IAAV5607
BS00064176_51104.49483.2910.8514.288.09
2016_T2_flag4D0–9.871.24–6.6BS00054978_51-
Excalibur_c26088_184
BS00099053_514.13.6110.3214.037.72
2017_T2_flag4D9.87–40.111.24–25.99Excalibur_c26088_184-
RAC875_rep_c105718_304
RAC875_c1673_66332.2416.591115.426.03
QStb.teagasc-5A.12017_T1_flag-15A0–138.950.64–494.87BobWhite_c7114_237-
wsnp_Ku_c35386_44598937
Excalibur_rep_c104815_11816.083.410.4313.9724.86
2017_T2_flag-15A0–138.950.64–494.87BobWhite_c7114_237-
wsnp_Ku_c35386_44598937
BS00015653_5198.27474.510.1613.9824.32
2017_T1_flag5A41.26–94.729.51–475.47Excalibur_rep_c90275_262-
tplb0057m23_716
BS00066499_5182.55-10.1212.4724.24
QStb.teagasc-5B.12016_T1_flag-25B1.27–282.0717.97–690.7BS00015136_51-
BS00092233_51
Kukri_c60322_4906.8819.4410.6214.287.93
2018_T1_flag-25B184–202.43589.12RAC875_c30867_515-IAAV4388BS00061414_51189.1580.710.0712.1313
2017_T1_flag-15B230.67–261.48647.94BobWhite_c12883_272-
Excalibur_c9563_1157
BS00062972_51258.92670.5410.6613.9725.34
2017_T2_flag5B253.87–261.48668.47RAC875_c45135_184-
Excalibur_c9563_1157
Excalibur_c17489_804258.92670.8212.0215.428.08
QStb.teagasc-5D.12016_T1_flag-25D12.57–49.4347.02–389.93BS00003975_51-
BobWhite_c7263_337
IACX296028.11347.4811.9214.288.85
QStb.teagasc-6A.12018_T1_flag-16A21.25–65.66.2–
22.44
Ra_c22493_190-BobWhite_c13839_135Excalibur_c7044_24356.0118.7110.7912.4613.86
2016_T1_flag6A56.01–70.1218.71–27.5Excalibur_c7044_243-
RAC875_c18659_402
BS00022951_5161.0718.7112.7712.399.45
2016_T2_flag6A88.28–106.4432.66–65.07wsnp_Ex_c31149_39976103-
BS00021999_51
Kukri_c27958_33496.4151.5110.8914.038.12
2017_T1_flag6A88.28–106.9532.66–70.4wsnp_Ex_c31149_39976103-
wsnp_Ku_c18534_27848426
Jagger_c2853_7593.3151.410.512.4725.02
2016_T1_flag-26A103.35–137.5151.95–309.86Tdurum_contig50698_601-
BS00065309_51
BS00026558_51127.9294.211.3114.288.42
QStb.teagasc-6A.22017_T2_flag-16A173.36–191.33534.67–580.19BS00028263_51-
wsnp_BE495143A_Ta_2_2
BS00023893_51176.94557.9311.3113.9826.66
QStb.teagasc-6B.12016_T1_flag-26B35.81–57.4921.41–48.35wsnp_Ex_c702_1382859-
wsnp_Ex_c13352_21044607
BS00090073_5151.2241.9711.1214.288.28
QStb.teagasc-6B.22016_T2_flag6B92.34–109.98152.09–168.473BS00063608_51-
BobWhite_c686_387
wsnp_Ex_c34011_42398362104.92462.1310.314.037.7
QStb.teagasc-6B.32018_T1_flag6B128.13–149.57193.46Kukri_c23433_416-
BobWhite_c14575_323
BS00048295_51133.69513.6914.313.5517.94
2018_T1_flag-16B128.13–149.57193.46Kukri_c23433_416-
BobWhite_c14575_323
BS00048293_51134.69513.6912.3812.4615.74
2018_T1_flag-26B129.66–144.9465.68–521.03RFL_Contig3609_1678-
wsnp_Ku_c24981_34948114
BS00035381_51141.88542.2211.412.1314.59
QStb.teagasc-6D.12017_T2_flag-16D25.79–102.171.77–315.6Excalibur_c10358_1800-
IACX10982
BS00021970_5153.792412.213.9828.43
QStb.teagasc-6D.22016_T1_flag-26D196.75–215462.2–472.79BobWhite_c34798_184-
BS00070856_51
wsnp_Ex_c13188_20825019202.62464.7110.1514.287.59
QStb.teagasc-7B.12016_T2_flag7B73.93–242.34106.34–625.52BobWhite_c14812_828-
wsnp_Ex_c64848_63486322
BobWhite_c24067_5193213.89713.3611.914.038.84
2016_T1_flag-27B109.14–239.29472.33–732.15Ra_c3470_1551-
Kukri_c40149_436
Tdurum_contig30163_1053185.27701.6311.614.288.63
2017_T1_flag7B190.34–225.24701.34–718.36RAC875_rep_c78007_425-
BS00022162_51
Tdurum_contig67161_99203.23703.310.4612.4724.93
2017_T2_flag7B193.88–216.43701.34–712.73RAC875_c41938_471-
BS00066124_51
Tdurum_contig13268_1067194.89708.9512.7615.429.52
2017_T2_flag-17B193.88–239.29701.34–732.15RAC875_c41938_471-
Kukri_c40149_436
Tdurum_contig81587_90195.39706.8111.5513.9827.14
2017_T1_flag-17B208.8–240.81706.81–727.63Tdurum_contig61856_900-
wsnp_Ex_c4484_8065800
BobWhite_c2892_167233.61721.2110.0613.9724.1
2016_T1_flag-17B212.37–250.49713.66–732.65RAC875_c39269_312-
wsnp_Ex_c32905_41484291
BobWhite_c2892_167233.61721.2113.812.3910.18
1. 1.5-LOD support interval calculated to identify multiple peaks; reported the lowest and the highest position at a 95% confidence interval. 2. The physical map position for each quantitative trait loci (QTL) (flanking and peak markers) was obtained from the wheat Chinese Spring IWGSC RefSeq v1.0genome assembly. 3. Where the first BLASTn hit from the physical map (IWGSC RefSeq v1.0) is located on one of the homoeologous chromosomes compared to its true genetically mapped location on the MAGIC genetic map [68], and where the BLASTn hit to the correct homoeologous chromosome has an equal or very similar e-value to the first hit, then chromosome and Mbp position used here is that for the chromosome to which the SNP was genetically mapped in [68]. 4. Logarithm of odds (LOD). 5. LOD permutation significance threshold (α = 0.05). 6. QTL information in bold is permutation significant at α = 0.05, while others are significant at the arbitrary threshold (LOD = 10.0).

