Transcriptome Analysis and Cell Morphology of Vitis rupestris Cells to Botryosphaeria Dieback Pathogen Diplodia seriata


1
College of Horticulture and Landscape Architecture, Southwest University, Chongqing 400716, China
2
Key Laboratory of Horticulture Science for Southern Mountainous Regions, Ministry of Education, Chongqing 400716, China
*
Author to whom correspondence should be addressed.
†
These authors contributed equally to the experimental part of this work.
‡
Current address: College of Horticulture, Northwest A&F University, Yangling 712100, China.
Genes 2021, 12(2), 179; https://doi.org/10.3390/genes12020179
Submission received: 14 December 2020
/
Revised: 16 January 2021
/
Accepted: 25 January 2021
/
Published: 27 January 2021
(This article belongs to the Section Microbial Genetics and Genomics)
Abstract
:Diplodia seriata, one of the major causal agents of Botryosphaeria dieback, spreads worldwide, causing cankers, leaf spots and fruit black rot in grapevine. Vitis rupestris is an American wild grapevine widely used for resistance and rootstock breeding and was found to be highly resistant to Botryosphaeria dieback. The defense responses of V. rupestris to D. seriata 98.1 were analyzed by RNA-seq in this study. There were 1365 differentially expressed genes (DEGs) annotated with Gene Ontology (GO) and enriched by the Kyoto Encyclopedia of Genes and Genomes (KEGG) database. The DEGs could be allocated to the flavonoid biosynthesis pathway and the plant–pathogen interaction pathway. Among them, 53 DEGs were transcription factors (TFs). The expression levels of 12 genes were further verified by real-time quantitative reverse transcription polymerase chain reaction (qRT-PCR). The aggregation of proteins on the plasma membrane, formation variations in the cytoskeleton and plasmodesmata and hormone regulations revealed a declined physiological status in V. rupestris suspension cells after incubation with the culture filtrates of D. seriata 98.1. This study provides insights into the molecular mechanisms in grapevine cells’ response to D. seriata 98.1, which will be valuable for the control of Botryosphaeria dieback.
1. Introduction
Botryosphaeria dieback, together with Esca, Eutypa dieback and Phomopsis, is the most important complex grapevine trunk disease (GTD) worldwide [1]. The progression from infection to symptom onset is chronic and accumulates over time, resulting in production reduction, economic losses and even vineyard disruption. In the worst case, it leads to the need to replant the entire vineyard long before the normal useful life of the vineyard is reached [1,2,3,4]. Botryosphaeria dieback caused by botryosphaeriaceous fungi is probably the most widespread GTD in the world [5]. In addition to colonization of the vine by pruning wounds, invasion of botryosphaeriaceous fungal agents occurs by airborne inoculum during rainfall in the vegetative growth period [2,6]. In recent decades, many efforts have been made to either protectively optimize the pruning time and technique or use pruning wound protectants; however, no efficient protective or curative measures have yet been found to control this aggressive disease [2].
The species within the Botryosphaeriaceae that infect grapevines have been proposed to be classified into three virulence levels, including highly virulent species (Lasiodiplodia spp. and Neofusicoccum spp.), moderately virulent species (Botryosphaeria dothidea and Diplodia spp.) and weakly virulent species (Dothiorella spp. and Spencermartinsia viticola) [2]. Since the pathogens were detected in the wood but never in the leaves of infected plants, it was hypothesized that leaf symptoms might be caused by extracellular compounds of the fungi in the trunk transported by the transpiration stream [7,8]. Fungal filtrates (containing extracellular compounds) have been widely used since the 1980s as a substitute of the infective agent since the productions of host-selective toxins are involved as pathogenicity determinants [9,10,11]. Several toxic factors were found to be synthesized by the species of Botryosphaeriaceae, including mellein, cis, trans-4-hydroxymellein, 4,7-dihydroxymellein, naphthalene enone-related compounds and lipophilic low-molecular weight phytotoxins (exopolysaccharides, peptides or proteins) [7]. It has been demonstrated that extracellular compounds produced by Botryosphaeriaceae species induced defense gene expression in grapevine cells [7,12,13]. Moreover, extracellular proteins produced by N. parvum induced more intense early defense responses in Vitis rupestris cells than those produced by Diplodia seriata [4]. In contrast to N. parvum, D. seriata is a less aggressive pathogen. Understanding its genetic and molecular basis and identifying key genes responsible for defense may provide valuable insights for GTD control.
Previous studies showed that a great number of genes are associated with defense responses to grapevine fungal diseases. The extracellular compounds from D. seriata induced the expression of glutathione S-transferase (GST1), phenylalanine ammonia-lyase (PAL), stilbene synthase (STS), pathogenesis-related protein 6 (PR6), class IV chitinase (Chit4c) and pathogenesis-related protein 10 (PR10) in V. vinifera cv. Chardonnay at 3 days post-inoculation (dpi) but not at 1 dpi [12]. The expression of superoxide dismutase (SOD), hypersensitive response (HSR), STS and PR was evaluated in V. vinifera subsp. sylvestris as early as 12 hours post-inoculation (hpi) [14]. These results showed that some of these genes were not only up-regulated after incubation, but also correlated with cultivar susceptibility to D. seriata.
Subcellular components are involved in defense responses. A target of toxin action by Eutypa dieback is in the plasmalemma, as found in infection of V. vinifera cv. Cabernet Sauvignon [15]. Recent advances revealed that cellular connectivity via regulation of plasmodesmata permeability is tightly related to plant defense pathways [16,17]. Plant microtubules (MTs) have been proposed for signaling transduction in plant defense responses [18]. Several studies indicated that MTs not only play the role as the scaffold of the cell, but are also involved in the activation of downstream gene expressions in grapevine cells responding to biotic [19] and abiotic stresses [20]. A V. rupestris cell suspension culture expressing GFP-AtTUB6 was established and used to investigate the function of MTs in processing and decoding stress signals under very early biotic/abiotic stress conditions [21]. Some of the toxic extracellular proteins from D. seriata have been identified [7,12], where the V. rupestris cells were used and revealed a rapid increase in extracellular pH, superoxide dismutase (ROS) production, cell death and the expression of some defense genes (VvPR1, VvPR6, VvPR10.1, VvSTS1 and VvChit4c) [4]. However, the comprehensive mechanisms at the transcriptional level of Botryosphaeria dieback resistance in V. rupestris are still elusive.
RNA-seq was applied in this study to reveal potential resistance mechanisms and genes associated with defense responses to D. seriata 98.1. Transcription factors (TFs), Gene Ontology (GO) terms and pathways related to the process of disease resistance were identified. The relationships between 53 TFs, three categories (biological process, cellular component and molecular function) of GO enrichment and 20 significantly enriched pathways and defense responses were analyzed. The data of differentially expressed genes (DEGs) enriched in subcellular components revealed the significant reaction of the anchored component of the plasma membrane, microtubule and cell wall to incubation with D. seriata 98.1. These results help to clarify the mechanism of responses in V. rupestris cells to Botryosphaeria dieback and will facilitate further studies to control GTD.
2. Materials and Methods
2.1. Plant Material
A suspension cell culture line of V. rupestris expressing GFP-AtTUB6 was used in this study [21]. The cell line of V. rupestris expressing GFP-AtTUB6 was kindly provided by Prof. Peter Nick (Karlsruhe Institute of Technology, Karlsruhe, Germany). Cells were cultivated in liquid medium containing 4.3 g L−1 Murashige and Skoog salts (Duchefa, Haarlem, The Netherlands), 30 g L−1 sucrose, 200 mg L−1 KH2PO4, 100 mg L−1 inositol, 1 mg L−1 thiamine and 0.2 mg L−1 2,4-dichlorophenoxyacetic acid (2,4-D) which was adjusted to a final pH of 5.8 supplemented with 30 mg L−1 hygromycin B. Cells were subcultured weekly, inoculating 10 mL of stationary cells into 30 mL of fresh medium in 100 mL Erlenmeyer flasks. The cell suspensions were incubated in the dark at 26 °C on an orbital shaker (Shanghai ZhiCheng, Shanghai, China) at 150 rpm.
2.2. Incubation with Culture Filtrates of D. seriata 98.1
The culture filtrates of D. seriata 98.1 (isolated from Pyrénées Orientales, France, kindly provided by Prof. Christophe Bertsch (Université de Haute-Alsace, Colmar, France)) were generated by cultivating 3 plugs of 2×1 cm of the strain grown on solid medium containing 37 g L−1 potato dextrose broth (PDB, Solarbio, Beijing, China) with 15 g L−1 agar powder (Solarbio, Beijing, China) for 1 week in 250 mL 20 g L−1 malt-medium (Bacto malt-extract, Solarbio, Beijing, China) in a 500 mL Erlenmeyer flask in the dark at 28 °C, 200 rpm for 21 days. Further, the D. seriata 98.1 culture was filtered by sterilized filter papers to remove the big fungi clusters and the liquid was harvested in an Erlenmeyer flask. After the liquid was vacuum filtered through a 0.22 μm filter, it was filled into sterilized 20 mL screw cap vials and stored at −20 °C.
An amount of 40 μL of culture filtrate of D. seriata 98.1 was added to the GFP-AtTUB6-expressing suspension cells when subcultured. Sterile water (40 µL) was used in the mock-treated control. The cells treated in this way were incubated in the dark at 26 °C, 200 rpm, and were used 3 dpi for RNA extraction. Two biological replicates each comprising three technical replicates were conducted for each treatment.
2.3. RNA Extraction
The total RNA of the incubated cells was extracted with the RiboMinusTM Plant Kit for RNA-Seq (Invitrogen, Carlsbad, CA, USA) and digested by DNase I (Takara, Kyoto, Japan) subsequently according to the manufacturer’s instructions. The NanoDrop 2000 spectrophotometer (Thermo Scientific, Waltham, MA, USA) was used to determine the concentration and purity (260/280 and 260/230 ratios) of the total RNA.
2.4. Transcriptome Sequencing and Analyses
mRNA enrichment, mRNA fragment, cDNA synthesis, size selection, PCR amplification, quality control (QC) and sequencing were carried out with Total Genomics Solution provided by the company of HengChuang (TGS, Shenzhen, China) for preparing Illumina RNAseq libraries. All sequence data were filtered to remove adaptor sequences and low-quality sequences. The clean reads were aligned to the reference genome (https://www.ncbi.nlm.nih.gov/genome/401) by the comparison software HISAT v0.1.6. The fragments per kilo base per million reads sequenced (FPKM) measure was introduced to reflect the expression level [22]. The differentially expressed genes analysis was carried out by DESeq2 v1.4.5 [23]. Screening conditions of DEGs were difference multiples at least greater than 2 and a Q-value less than 0.01 at least. The functional annotation of DEGs was performed by GO enrichment (p-value < 0.05) [24]. The pathway enrichment of DEGs was analyzed by the Kyoto Encyclopedia of Genes and Genomes (KEGG, the major public pathway-related database). The RNA-seq data have been deposited to the online NCBI Sequence Reads Archive (SRA) database under the accession number PRJNA692532.
2.5. Real-Time Quantitative Reverse Transcription PCR
Complementary DNA (cDNA) libraries were synthesized from 1 μg total RNA by the PrimeScriptTM RT reagent Kit with gDNA Eraser (Takara, Kyoto, Japan). Subsequently, real-time quantitative reverse transcription polymerase chain reaction (qRT-PCR) was carried out with SYBR qPCR SuperMix Plus (Takara, Kyoto, Japan) on a CFX96TM Real-Time System (Bio-Rad, Hercules, CA, USA) on 12 genes selected among the DEGs that respond to D. seriata 98.1 incubation, in a total volume of 10 μL containing 5 μL SYBR qPCR SuperMix Plus, 0.2 μL each primer at 0.2 μM and 1 μL cDNA synthesized above. The thermal cycling consisted of a hold at 95 °C for 1 min, followed by 45 cycles of 95 °C for 20 s, 58 °C for 20 s and 72 °C for 30 s, and then a melting curve program at 65 to 95 °C raised gradually by 0.5 °C every 5 s. The expression of grapevine actin was amplified as an internal control. The relative expression levels compared to the mock-incubated control were calculated using the normalized expression method (2−ΔΔCT). The primers used in this experiment of each selected gene are listed in Supplementary Table S1. Standard errors of the mean values were generated by two biological replicates each comprising three technical replicates conducted for each gene.
2.6. Phenotyping of Cellular Responses to D. seriata 98.1
The responses of the MTs to 50% (v/v), 2% (v/v) and 0.1% (v/v) culture filtrates of D. seriata 98.1 were observed at 20 min, 24 h and 3 dpi, respectively, and compared to a control with the corresponding amount of water. Aliquots of 20 μL suspension cells were placed on a slide and covered with a coverslip for microscopy to observe the MTs. All samples were investigated under an inverted fluorescence microscope (IX-73, Olympus, Tokyo, Japan) with a hypersensitive camera (Photometrics PRIME) and a U plan super apochromat objective 40X/0.95, WD 0.18 (spring, c.c.0.11–0.23). Images were then processed by the software installed including an optimized deconvolution algorithm. A plug-in program, “The macros”, developed for Image J (http://rsb.info.nih.gov/ij/) was used to quantify fluorescence skewness [25]. MTs images were skeletonized using the Image J menu “Plugins-kbi-Kbi_Filter2d (filter: lineFilters)-param (linemode: thinLine)”.
Cell viability was quantified using 2% (v/v) culture filtrates of D. seriata 98.1 at 3 and 6 days after subcultivation/treatment by determining packed cell volume (PCV) according to Guan et al. [26]. To monitor changes in cell shape, the ratio of cell width over cell length was measured at 3 dpi with 2% (v/v) culture filtrates [26]. Each result presents 800–1000 cells scored from three independent experiments.
3. Results
3.1. Sequencing and Alignment
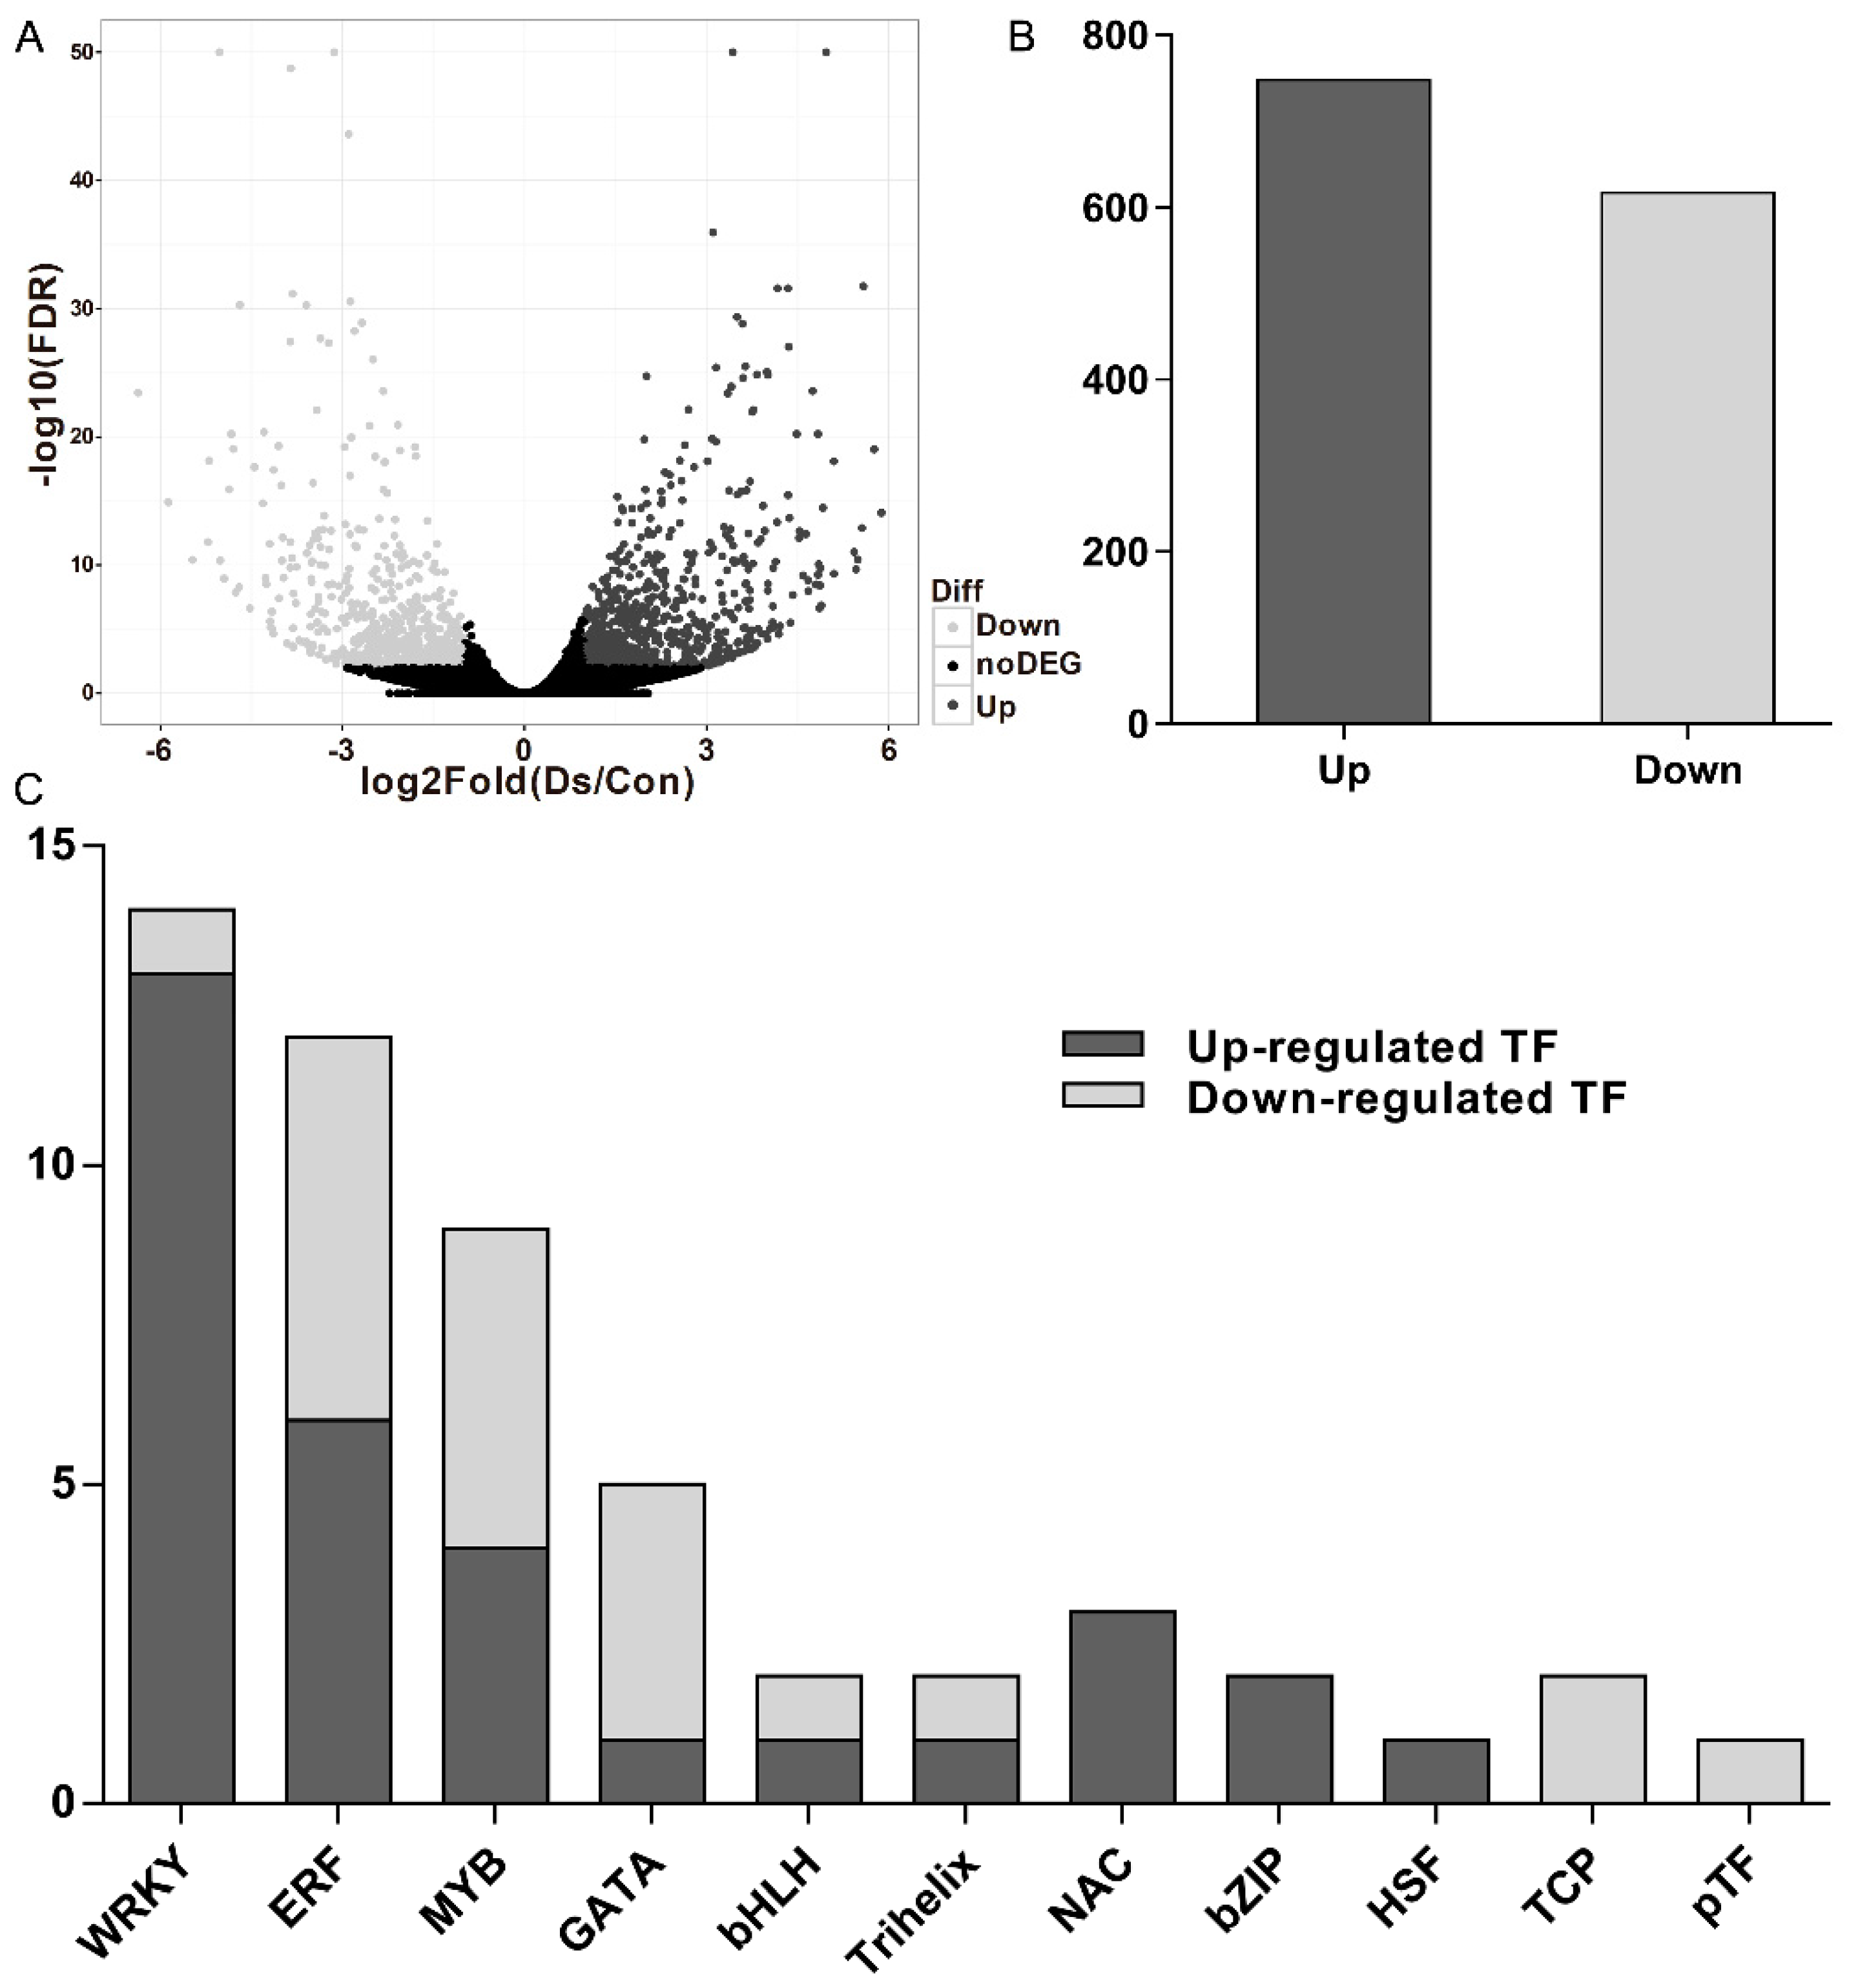
Clean reads of DNA reversed from V. rupestris expressing GFP-AtTUB6 incubated with D. seriata 98.1 and the mock-incubated control were generated by filtering to remove adaptor sequences and low-quality sequences. In addition, all clean reads were aligned to the reference genome and approximately 70% of them were mapped (Supplementary Table S2). The Pearson’s correlation coefficient of the transcriptome profiles was 0.93, at least, between each biological replicate (Supplementary Table S3), indicating relatively high reproducibility of sequencing data. A total of 20,950 transcripts were detected (Figure 1A), and Supplementary Table S4 shows all the identified DEGs. A total of 1365 DEGs (748 were up-regulated and 617 were down-regulated, Figure 1B) were identified in V. rupestris expressing GFP-AtTUB6 incubated with D. seriata 98.1 compared to the mock-incubated control.
3.2. Transcription Factors Analysis
Among the DEGs in the comparisons mentioned above, 53 TFs were obtained from the DEGs (Supplementary Table S5). These TFs were distributed in 11 families, and the dominant differentially expressed TFs were the members of the WRKY family (26.42%), followed by the ethylene-responsive factor (ERF) family (22.64%), the myeloblastosis (MYB) family (16.98%), the GATA family (9.43%), the NAC family (5.66%) and the basic helix-loop-helix (bHLH) family (3.77%) (Figure 1C).
3.3. GO Enrichment and KEGG Analysis of DEGs
Gene Ontology (GO) enrichment was carried out to functionally characterize the identified DEGs in V. rupestris expressing GFP-AtTUB6 incubated with a culture filtrate of D. seriata 98.1 compared to the mock-incubated control. All the DEGs were classified into three categories including biological process, cellular component and molecular function. Compared to the mock-incubated control, 1098 GO terms were enriched (Supplementary Table S6). The extent of enrichment significance (Correct_p-Value) was calculated based on hypergeometric distribution and ranked in descending order in Supplementary Table S6.
Among them, the most significantly enriched biological process was defense response, followed by biosynthetic and oxidation–reduction processes. All the detected DEGs classified as defense response were up-regulated (Supplementary Table S7), for instance, STS, including STS, STS1, STS2, STS5 and STS6, PR (pathogenesis-related protein), including STH-2, PR10, PR10.3, PR10.4, PR10.8 and PR10.9, MLO (mildew resistance locus o), including MLO7 and MLO11, allergen Pru av 1 and probable protein S-acyltransferase 7. Some of the differently expressed STSs classified as defense response were enriched in biosynthetic process as well, while STS3 (100249839), STS2 (100855299), STS5 (100264844) and STS5-like (100264173) were enriched in biosynthetic process, exclusively. Moreover, an aspartate aminotransferase and an alanine aminotransferase were enriched in biosynthetic process. Most of the DEGs that belonged to oxidation–reduction (such as 4 coumarate-CoA ligase, laccase, cytochrome dehydrogenase and cytochrome) were up-regulated. In addition, the expression of PAL, including PAL, PAL-like, PAL1-like and PAL G1, was enriched in cinnamic acid biosynthetic process and L-phenylalanine catabolic process was enhanced. Noticeably, DEGs classified as defense response, the most significantly enriched term, were also enriched in response to biotic stimulus, except for STS and SA7 (protein S-acyltransferase 7). On the contrary, DEGs of xyloglucan metabolic process (e.g., xyloglucan endotransglucosylase/hydrolase 2), cell wall biogenesis (e.g., cellulose synthase-like protein D5), microtubule-based movement (e.g., tubulin β-4 chain) and plant-type cell wall organization (e.g., expansin-A14) and most DEGs of cell wall organization (e.g., tubulin β-1 chain) were down-regulated. It is worth noticing that DEGs of DNA replication initiation (e.g., DNA replication licensing factor MCM7), regulation of DNA replication (e.g., cyclin-D3-3) and DNA methylation (e.g., BEL1-like homeodomain protein 9) were down-regulated, which were critical to cell growth and programmed cell death (Supplementary Table S7).
The anchored component of the plasma membrane was the most significant enriched cellular component, followed by the microtubule and cell wall (Supplementary Table S6). The DEGs enriched in anchored component of plasma membrane (e.g., plasmodesmata callose-binding protein 5) and the DEGs enriched in microtubule organization and movement (e.g., tubulin α chain) were down-regulated (Supplementary Table S7). Most of the DEGs enriched in cell wall, such as expansin A4, were down-regulated except for pectinesterase 2 and peroxidase 4. The DEGs in kinesin complex and cytoskeletal part (e.g., kinesin-like protein) were down-regulated. In addition, the majority of DEGs enriched in plasmodesma, such as expansion-B3, were down-regulated, while the other seven DEGs (e.g., hexose transporter) were up-regulated (Supplementary Table S7).
Additionally, the most significantly enriched molecular function was trihydroxy stilbene synthase activity, followed by phenylalanine ammonia-lyase activity and carbohydrate binding (Supplementary Table S6). STS and PAL enriched in defense response and L-phenylalanine catabolic process of biological process, respectively, were up-regulated (Supplementary Table S7). Approximately 50% of the detected DEGs in carbohydrate binding were up-regulated; meanwhile, only few DEGs involved in hydrolase activity and hydrolyzing O-glycosyl compounds (β-glucosidase 12 and cell wall apoplastic invertase) were up-regulated. In addition, only four DEGs (e.g., acyl-lipid (9-3)-desaturase) were down-regulated in the oxidoreductase activity term. On the contrary, the DEGs enriched in xyloglucan (xyloglucosyl transferase activity), xyloglucan metabolic process, microtubule motor activity and microtubule-based movement were down-regulated (Supplementary Table S7). In biological process, cellular component and molecular function, the largest number of DEGs was found in oxidation–reduction process, integral component of membrane and oxidoreductase activity, respectively (Figure 2A).
Pathway enrichment analysis with the KEGG database was carried out with a p-value cutoff of <0.05 to understand the biological function of DEGs and to explore the biochemical pathways in which they were involved. The top 20 significantly enriched pathways are listed in Supplementary Table S8. The most significantly enriched pathway was flavonoid biosynthesis, followed by metabolic pathways, phenylalanine metabolism pathway, biosynthesis of secondary metabolites pathway and stilbenoid, diarylheptanoid and gingerol biosynthesis pathway. The circadian rhythm–plant pathway was related to environmental adaptation, while the other 19 significantly enriched pathways were related to metabolism. The largest amount of DEGs were enriched in metabolic pathways; the degradation of aromatic compounds pathway possessed the highest rich factor (calculated by DEGs in term/all genes in term in Supplementary Table S8) (Figure 2B). To be mentioned, 45 DEGs were up-regulated and 26 DEGs were down-regulated in the plant–pathogen interaction pathway (Supplementary Table S9).
3.4. DEGs in Enriched Pathways Related to Resistance Activated by D. seriata 98.1 Incubation
The most significantly enriched pathway, the flavonoid biosynthesis pathway, possessed 38 DEGs, of which only two genes were down-regulated (Supplementary Table S9). Among them, 21 genes were classified as STS (stilbene synthase), 2 as SNS (S-norcoclaurine synthase 1), 1 as TCMO (trans-cinnamate 4-monooxygenase-like), 1 as SOHCT (shikimate O-hydroxycinnamoyl transferase), 2 as SRG1 (encoding protein SRG1), 1 as DMS (encoding protein DOWNY MILDEW RESISTANCE 6), 1 as IFRL1 (isoflavone reductase-like protein 1), 1 as IFRHL (isoflavone reductase homolog-like), 1 as GHL (geraniol 8-hydroxylase-like), 1 as FS/FH (flavonol synthase/flavanone 3-hydroxylase), 1 as CYP (cytochrome P450 CYP73A100), 1 as CHI (chalcone isomerase), 1 as ANR (anthocyanidin reductase) and 1 as AT (uncharacterized acetyltransferase At3g50280-like). Conversely, one gene involved in PP (purine permease 1) and one in PLR (probable pinoresinol-lariciresinol reductase 3) were down-regulated.
There were 71 DEGs functioning in the plant–pathogen interaction pathway (Supplementary Table S9), which included 3 genes involved in CDPKs (calcium-dependent protein kinase, 1 up-regulated, 2 down-regulated), 2 in ERF (ethylene-responsive transcription factor, 1 up-regulated, 1 down-regulated), 13 in LRR (leucine-rich repeat related protein, 6 up-regulated, 7 down-regulated), 3 in LDP (lysM domain related protein, 2 up-regulated, 1 down-regulated), 5 in DRP (disease resistance protein, 2 up-regulated, 3 down-regulated), 15 in WRKY (WRKY transcription factor, 14 up-regulated, 1 down-regulated), 4 in MYB (MYB family transcription factor, 2 up-regulated, 2 down-regulated) and 2 in RP (receptor-like protein, 1 up-regulated, 1 down-regulated). Moreover, one gene in DFR (dihydrofolate reductase), one in CoAS (CoA synthase), one in BRIRK (Brassinosteroid insensitive 1-associated receptor kinase), two in CP (calmodulin protein), four in MRP (myb-related protein), two in RBOHP (respiratory burst oxidase homolog protein), one in SERK (somatic embryogenesis receptor kinase) and one in SF (splicing factor) were up-regulated. On the contrary, two genes involved in PR, two in CBP (calcium-binding protein), one in FKP (F-box/kelch-repeat protein), one in FP (formin-like protein), one in CNGC (protein CNGC15b) and one in SR (systemin receptor) were down-regulated.
A total of 48 DEGs were identified in the plant hormone signal transduction pathway (Supplementary Table S9), including 7 genes classified as regulating AUXIN (encoding auxin-induced/responsive protein, 1 up-regulated, 6 down-regulated), 3 involved in IAA regulation (encoding indole-3-acetic acid related protein, 2 up-regulated, 1 down-regulated), 3 involved in MYB (myb family transcription factor, 1 up-regulated, 2 down-regulated), 5 involved in LRR regulation (encoding leucine-rich repeat related protein, 3 up-regulated, 2 down-regulated), 2 involved in PHR1 regulation (encoding phosphate starvation response protein, 1 up-regulated, 1 down-regulated) and 2 involved in SLP regulation (encoding scarecrow-like protein, 1 up-regulated, 1 down-regulated). Moreover, one gene regulating ABA (abscisic acid receptor), one gene regulating BRIRK (Brassinosteroid insensitive 1-associated receptor kinase), two genes regulating bZIP (bZIP transcription factor), one gene regulating JA (jasmonic acid-amido synthetase), one gene regulating PSR (phytosulfokine receptor), one gene regulating CE (carboxylesterase), one gene regulating SERK (somatic embryogenesis receptor kinase), one gene regulating SP (sucrose-phosphatase) and one uncharacterized gene were up-regulated. In contrast, two genes classified as PR (encoding pathogenesis-related protein), two genes as CD (cyclin-D3), one gene as IRK (inactive receptor kinase), one gene as RPK (receptor protein kinase), seven genes as XEHP (encoding xyloglucan endotransglucosylase/hydrolase protein), one gene as SPBP (encoding squamosa promoter-binding-like protein) and one gene as bHLH (bHLH transcription factor) were down-regulated.
3.5. Real-Time Quantitative Reverse Transcription PCR Analysis
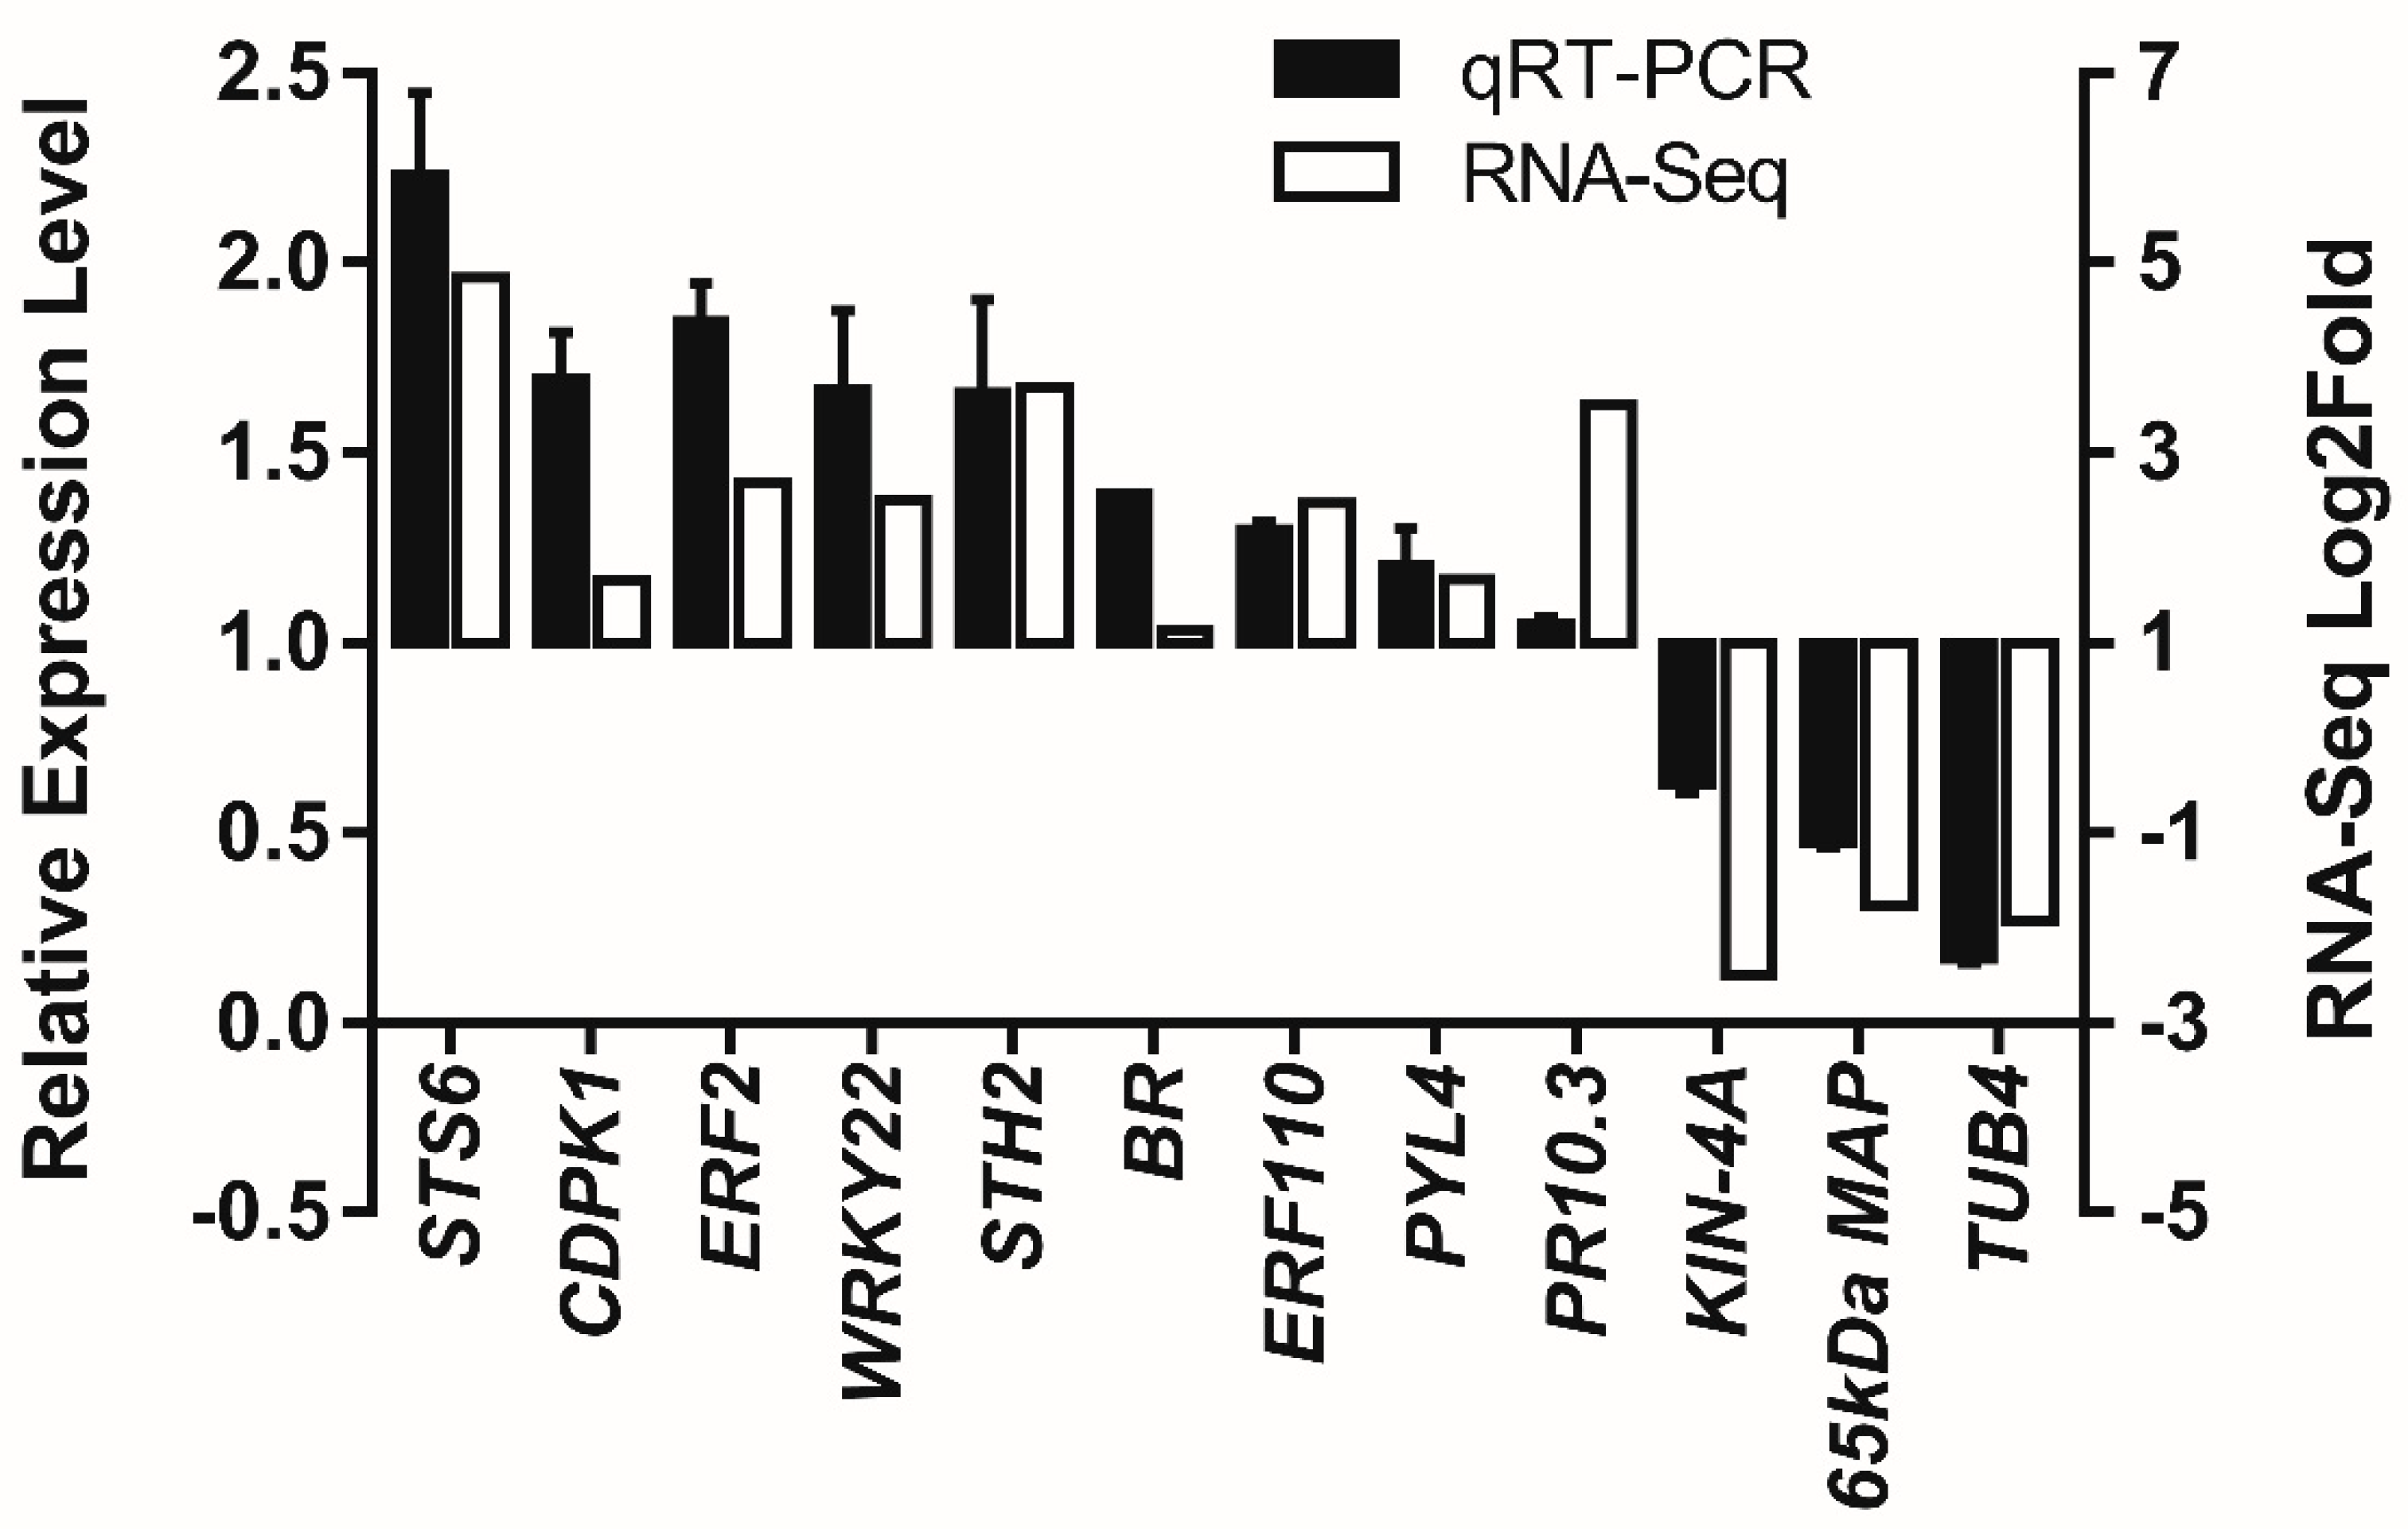
To verify the results obtained by RNA-seq, the relative expression levels of 12 genes selected from DEGs were analyzed using qRT-PCR (Figure 3). Incubated cells and the mock control of suspension cells of V. rupestris expressing GFP-AtTUB6 were analyzed by measuring the relative expression levels of these genes at 3 dpi incubated with the culture filtrates of D. seriata 98.1. The trends of four genes in the plant–pathogen interaction pathway, CDPK1 (calcium-dependent protein kinase 1), BR (Brassinosteroid insensitive 1-associated receptor kinase 1), ERF2 (ethylene-responsive transcription factor 2) and WRKY22 (WRKY transcription factor 22), were confirmed to be in agreement with the fold changes of selected genes obtained from RNA-seq results (Figure 3). Similar patterns were observed not only for the genes related to plant hormone signal transduction including PYL4 (abscisic acid receptor PYL4) and BR, but also for the genes enriched in the biological process defense response, including STH-2 (encoding pathogenesis-related protein STH-2) and STS6 (stilbene synthase 6). Moreover, ERF110 (ethylene-responsive transcription factor ERF110) and PR10 (pathogenesis-related protein 10) were also verified to be up-regulated. In contrast, one gene regulating microtubule cytoskeleton organization, 65 kDa MAP (encoding 65-kDa microtubule-associated protein 3), and two genes in the biological process regulating microtubule-based movement, TUB4 (tublin β-4 chain) and KIN-4A (kinasin-like protein KIN-4A), were down-regulated. The patterns between the results of qRT-PCR and those obtained from DEG data share high similarity, indicating reliable results of RNA-seq.
3.6. Phenotyping of Cellular Responses to D. seriata 98.1
To put cell morphology in context with the transcriptome screening presented above, the MTs’ performance and cell phenotypes were further examined. Firstly, the MTs’ performance against 0.1% (v/v) culture filtrates of D. seriata 98.1 at 3 dpi was examined, where the MTs were depolymerized with a skewness value of 1.03 (skewness value is 1.29 in control cells) (Figure 4A). As the cytoskeleton participates in early signaling transduction in plant defense as a sensor and integrator [13], the remodeling of microtubules at earlier time points was interesting to observe. A compromised filtrate concentration has to be carefully considered with the incubation time (where MTs rearrangement is different between a prompt response with a higher concentration vs. a long-term response with a mild concentration). Images at 24 hpi (with culture filtrate of 2%, v/v) and 20 min post-incubation (with culture filtrate of 50%, v/v) are shown in Figure 4A. Such cytoskeletal responses can consequently alter cellular morphogenesis [27]. Packed cell volume (ΔPCV) was affected slightly by 2% (v/v) D. seriata 98.1 at 3 dpi; nevertheless, such influence was significantly increased at 6 dpi (Figure 4B). This leads to the hypothesis that the decreased ΔPCV was not due to the disrupted mitosis, but rather to the influence of cell expansion. The further experiments supported our hypothesis that the mitosis index showed no significant differences at 3 dpi (data not shown here) when it should be the most activated phase of mitosis in this cell line [21]. Since the organization of cortical microtubules can affect the axiality of cell expansion, the cell shapes were investigated at 3 dpi. Frequency distributions for the ratio between cell width over cell length were constructed (Figure 4C). The number of short-wide cells was increased after incubation with 2% (v/v) culture filtrates of D. seriata 98.1 at 3 dpi.
4. Discussion
To study the defense responses of V. rupestris to Botryosphaeria dieback, a high-throughput DNA sequencing technology, RNA-seq, was utilized. After filtering the reads, all DEGs were aligned to the reference grapevine genome. In addition to finding out which TFs are possibly involved in the defense response in V. rupestris cells after incubation with culture filtrates of D. seriata 98.1, the function annotation and pathway enrichment of DEGs were analyzed by GO and KEGG, respectively.
Previous studies demonstrated that several types of TFs were involved in stress responses, and many TF genes are associated with enhanced tolerance to biotic/abiotic stresses [28]. In the present study, ERF, WRKY, MYB and bHLH were detected to respond to D. seriata 98.1 incubation. The roles of ERF transcription factors in response to stress encountered by plants have been reported [29]. Most of the ERFs are activators of biotic stress-responsive genes, whereas certain ERFs act as repressors. The majority of ERFs in the present study (ERF2, ERF5, ERF11, ERF27 and ERF110) were up-regulated. The up-regulation of ERF2 and ERF11 coincided with the identified activators in plant defense [30,31]. Conversely, the down-regulated ERF4 and ERF5 have been reported as repressors [30,32]. The expression levels of ERF2 and ERF110 were verified by qRT-PCR (Figure 3). The results suggest they probably act as activators in plant resistance for grapevine, which has been rarely studied. The expression of WRKY22 was verified as well (Figure 3). Corresponding with the trend of FPKM, the relative expression level of WRKY22 was up-regulated. How WRKY22 acts in the defense response of grapevine has not been studied, while reports on Arabidopsis thaliana revealed that the innate immunity triggered via WRKY22 may protect against further pathogen infection [33]. WRKY9, 14, 17, 26, 31, 65 and 72, up-regulated in this study, have been verified to play important roles in responses to abiotic and biotic stresses [34,35,36]. On the contrary, a down-regulated WRKY70 in the present study was considered as a vital node in the SA signaling pathway in plant defense responses [37].
According to the result of Ramirez-Suero et al. (2014), extracellular compounds produced by D. seriata 98.1 induced defense gene expression in V. vinifera cv. Chardonnay [12]. The research of Stempien et al. (2018) suggested that secreted proteins of D. seriata 98.1 induced a different defense gene expression pattern between the suspension cells of V. vinifera cv. Gewurztraminer and V. rupestris [4]. The GO terms and KEGG were performed to elucidate defense gene functional classifications and their secondary metabolic pathways in V. rupestris cells affected by culture filtrates of D. seriata 98.1 in this study. Up- and down-regulated DEGs were significantly enriched in biological process, cellular component and molecular function. According to the biological process of GO enrichment (Supplementary Table S7), STS (stilbene synthase), including STS, STS1, STS2, STS3, STS4, STS5 and STS6, and PAL (phenylalanine ammonia-lyase), including PAL, PAL1-like, PAL G1 and PAL-like, were up-regulated (Supplementary Table S7). These results from suspension plant cells/fungi culture filtrate incubation show a comparable pattern with that obtained from a one-year-old woody stem inoculated with mycelium [14]. Moreover, the expressions of PR10, PR10.3, PR10.4, PR10.8 and PR10.9 and STH2 were identified as up-regulated in encoding secretion proteins related to the defense response. Expressions of PR10.3 and STH2 were further confirmed by qRT-PCR (Figure 3). Rather than the above PR genes expressed in V. rupestris, PR6 and Chit4c were reported to be expressed in V. vinifera incubated with extracellular compounds of D. seriata [12]. In this publication, it indicates that the expression levels of these two defense genes are significantly higher at 3 dpi than other tested time points, which drove us to exam the gene expression level at the same time point in V. rupestris cells as a resistant counterpart to V. vinifera cv. Chardonnay. So far, there have been no studies on how STH2 responds to pathogens in grapevine. Although STH2 was rapidly activated in potato infected with spores of Phytophthora infestans, a genus of plant-damaging oomycetes [38], STH2 and PR10 were, for the first time, reported in response to grapevine fungus disease in this study. In addition, most (78%) of the DEGs (137) functioning in oxidation–reduction in biological process were up-regulated (Supplementary Table S7). A similar process was found in D. seriata-infected olive trees [39]. On the other hand, DEGs in xyloglucan metabolic process, cell wall biogenesis, microtubule-based movement and plant-type cell wall organization and most DEGs in cell wall organization were down-regulated; additionally, DEGs in DNA replication initiation, regulation of DNA replication and DNA methylation were down-regulated, which were critical to cell growth and programmed cell death. The down-regulation of these genes related to cell structure and replication probably enables cells to allocate more energy to resistance in the presence of a pathogen [40].
Moreover, a few genes encoding inducible defense-related compounds were identified in biological process of GO enrichment. VST1 has been studied by fusing it to a fungal-inducible promoter in grapevine [41]. Knockdown of MLO7 in combination with VvMLO6 and VvMLO11 was reported to enhance resistance to powdery mildew in V. vinifera [42]. VST1, MLO7 and MLO11 were found, for the first time, in this study to be up-regulated significantly in V. rupestris incubated with D. seriata 98.1. Stilbenoids representing major antimicrobial compounds in grapevine could be elicited by fungal infection [43]. In this study, the transcriptome analysis showed that all 21 identified STS genes were up-regulated. The expression of STS could produce stilbene phytoalexins whose accumulation suggests them as the most frequently observed anti-pathogen metabolites, and their defense mechanisms were well characterized [44]. The qRT-PCR result of STS6 gave an example to verify the up-regulation of the genes in the stilbenoid biosynthesis pathway (Figure 3).
GO enrichment analysis provided information of the DEGs in cellular component and molecular function (Supplementary Table S7). In terms of cellular component, the down-regulation of DEGs enriched in plasma membrane and microtubule revealed their roles in response to fungal filtrates. The DEG related to microtubule-based movement was mainly the kinesin-liked protein. Those genes encoding tubulin α chain, tubulin β-1 chain and tubulin β-2 chain were enriched in microtubule of cellular component. Likewise, the down-regulation of DEGs in cell wall, e.g., expansin A4, limited the maintenance of cell rigidity, as well as regulating the growth and division of cells. The majority of DEGs enriched in the category of plasmodesma were down-regulated, which probably functioned in dispelling plasmodesmata under the fungal filtrates incubation. In terms of molecular function, the accumulations of STS and PAL in trihydroxy stilbene synthase activity and phenylalanine ammonia-lyase activity, respectively, were enriched in biological process as well. Reduced xyloglucosyl transferase activity indicated that the processes of formation and enlargement of the cell wall were blocked partially. The down-regulation of DEGs enriched in microtubule motor activity revealed that the contributions of kinesin-like protein on microtubule-based movement were inhibited.
The innate immunity in plants is composed of two layers: the pathogen-associated molecular patterns (PAMPs)-triggered immunity (PTI) and effector-triggered immunity (ETI) [45]. At the level of PTI, receptor protein kinases (RPKs) on the plasma membrane represent the main pattern recognition receptors (PRRs) perceiving diverse PAMPs [46]. In V. rupestris cells incubated with D. seriata 98.1, three RPKs, including BAK1, FLS2 and EFR, were identified. As a central regulator of the PTI level, BAK1 is the target of several pathogen virulence effector molecules. Rather than influencing elicitor perception directly, it could rapidly form a complex with FLS2, the receptor for the bacterial flagellin, after elicitation [47]. The up-regulation of these two RPKs suggests that a complex may have formed after D. seriata 98.1 incubation in V. rupestris cells. In addition, this complex involved in endocytotic recycling of plant PAMP receptors is often necessary for signaling from intracellular compartments [48]. The EFR allows the plant cells to recognize and bind to bacterial EF-Tu and prevent genetic transformation and protein synthesis in the pathogen [49]. In the present study, the expression of EFR was up-regulated after incubation with culture filtrates of D. seriata 98.1. Involved in several cascades, these RPKs led to the activation of the WRKY transcription factors such as WRKY33, WRKY29 and WRKY22, which induced the expression of defense-related genes (Figure 5). In addition, the transduction of the calcium signal through the cyclic nucleotide gated channel (CNGC) affected Rboh and CaM/CML, giving rise to the hypersensitive response (HR) (Figure 5) and cell wall reinforcement [50]. Moreover, the genes encoding CDPKs [51], WRKY [37], ERF [29], LRR [52], MYB [53] and PR [14] have also been reported to play resistant roles in biotic stress responses.
At the ETI level, the avirulent (Avr) protein induced a HR via a bacterial secretion system [31]. A fungal effector, AvrA10, activated the expression of WRKY2 which triggered the downstream defense-related gene expression and programmed cell death in V. pseudoreticulata to powdery mildew [40]. In this study, five genes encoding disease resistance proteins (104881039 and 109121518 were up-regulated; 100855173, 104877588 and 104881511 were down-regulated) and one uncharacterized gene (100261821) were differentially expressed. Among them, two R-proteins (RPM1 and RPS2) were encoded.
Plant hormones such as SA, JA, GA, ABA, auxin and brassinosteroids (BR) play key roles in the complex signaling cascades of defense responses [17,21,54,55]. Our previous findings showed that JA induced bundling of microtubules and auxin can revert such JA-induced bundling in V. rupestris suspension cells [21]. Fung et al. (2008) [54] showed that ABA is possibly involved in the inhibition of SA in grapevine resistance to E. necator, a causal agent of powdery mildew. However, the expression patterns of ABA and BR resistance to D. seriata 98.1 in this study were different from the resistance to E. necator. BR-associated receptor kinase 1 was up-regulated; meanwhile, no DEG related to ABA has been found yet (Supplementary Table S9). The concentrations of ABA and the glucose esters of ABA (ABA-GE) were increased after Eutypa dieback infection, which accumulated as the symptom became more serious. This may indicate the perturbation of ABA-GE translation or the synthesis of ABA [56]. SA was required for TGA1 (a transcription factor) to interact with NPR1 (a disease resistance protein) in plant cells [57]. Where some DRPs may serve as cofactors conferring redox regulation of DNA binding activity to TGA2.2 [58,59] which was identified in this study as a transcription factor (Supplementary Table S9).
The reactions of subcellular components to pathogens have been reported in plant cells. Amborabé et al. (2001) [15] found the plasmalemma is an essential target of a toxin produced by Eutypa lata, the causal agent of Eutypa dieback. Via plasmodesmata, SA signaling components regulate cellular connectivity in plant innate immunity [16]. In addition, dynamic reorganization of the cytoskeleton against fungal penetration attempts is a basic and prompt response. Not only playing important roles in penetration resistance by the polarization of defense-related reactions [19], actin filaments and microtubules are involved in the expression of hypersensitive reactions [60,61] and elicitor-induced signal transduction [62]. According to the cellular components of GO enrichment in this study, the expression of DEGs enriched in anchored component of plasma membrane, microtubule and cytoskeletal were all down-regulated, and most of the DEGs in plasmodesma were as well. As both NACK2 and 65-kDa MAP were down-regulated, the DEGs associated with cytoskeleton suggested that the formation of microtubules and the following regulation of cell development declined after incubation with D. seriata 98.1. The qRT-PCR results of TUB4, KIN-4A and 65kDa MAP further verify the down-regulation of genes associated with microtubules (Figure 3). The rearrangements of MTs were examined at 3 dpi with a relatively mild culture filtrate concentration to provide the impression on cell morphology at the same timepoint and concentration when RNA-seq was conducted. Since the MTs’ responses to biotic/abiotic stresses are prompt, the images at 20 min and 24 h post-incubation with higher concentrations are presented in Figure 4A. Our results show that D. seriata 98.1 induced short-wide cells in the suspension cell line at 3 dpi. This abnormal phenotype was due to the depolymerization of MTs, which affected the axial expansion of cells. The long-term impact on ΔPCV at 6 dpi was caused by the individual reduced cell volume rather than the destroyed mitosis (Figure 4B, C) of the cell colony.
This research provides a comprehensive analysis of DEGs that respond to D. seriata 98.1. A total of 748 up-regulated and 617 down-regulated DEGs were identified. The result of RNA-seq was verified by qRT-PCR. Furthermore, transcription factors, GO terms and pathways related to defense responses were analyzed. Our results suggest that some important DEGs and transcription factors are involved in innate immunity, plant hormones and cell subcellular components, which play key roles in disease resistance.
Supplementary Materials
The following are available online at https://www.mdpi.com/2073-4425/12/2/179/s1, Table S1: Primers for qPCR, Table S2: Reads sequenced and mapped to reference genome, Table S3: The pearson correlation coefficient, Table S4: List of DEGs identified, Table S5: Differentially expressed transcription factors, Table S6: GO enrichment, Table S7: DEGs list of significantly enriched GO terms, Table S8: Pathway Enrichment Analysis, Table S9: DEGs in enriched pathways related to resistance
Author Contributions
Conceptualization, X.G.; investigation, L.Z., S.Y. and H.Z.; writing—original draft preparation, L.Z. and S.Y.; writing—review and editing, L.Z., S.Y. and X. G. All authors have read and agreed to the published version of the manuscript.
Funding
This research was funded by projects of the National Natural Science Foundation of China 31901990 and the Basic Science and Cutting-edge Technology Research of Chongqing cstc2016jcyjA0489.
Institutional Review Board Statement
Not applicable
Informed Consent Statement
Not applicable
Data Availability Statement
The RNA-seq data has been deposited to the online NCBI Sequence Reads Archive (SRA) database under the accession number PRJNA692532.
Conflicts of Interest
The authors have no conflicts of interest related to the work described in the manuscript.
References
- Bertsch, C.; Ramírez-Suero, M.; Magnin-Robert, M.; Larignon, P.; Chong, J.; Abou-Mansour, E.; Spagnolo, A.; Clément, C.; Fontaine, F. Grapevine trunk diseases: Complex and still poorly understood. Plant Pathol. 2013, 62, 243–265. [Google Scholar] [CrossRef] [Green Version]
- Urbez-Torres, J.R. The status of Botryosphaeriaceae species infecting grapevines. Phytopathol. Mediterr. 2011, 50, S5–S45. [Google Scholar] [CrossRef]
- Masi, M.; Cimmino, A.; Reveglia, P.; Mugnai, L.; Surico, G.; Evidente, A. Advances on Fungal Phytotoxins and Their Role in Grapevine Trunk Diseases. J. Agric. Food Chem. 2018, 66, 5948–5958. [Google Scholar] [CrossRef] [PubMed]
- Stempien, E.; Goddard, M.L.; Leva, Y.; Benard-Gellon, M.; Laloue, H.; Farine, S.; Kieffer-Mazet, F.; Tarnus, C.; Bertsch, C.; Chong, J. Secreted proteins produced by fungi associated with Botryosphaeria dieback trigger distinct defense responses in Vitis vinifera and Vitis rupestris cells. Protoplasma 2018, 255, 613–628. [Google Scholar] [CrossRef] [PubMed]
- Spagnolo, A.; Mondello, V.; Larignon, P.; Villaume, S.; Rabenoelina, F.; Clement, C.; Fontaine, F. Defense Responses in Grapevine (cv. Mourvedre) after Inoculation with the Botryosphaeria Dieback Pathogens Neofusicoccum parvum and Diplodia seriata and Their Relationship with Flowering. Int. J. Mol. Sci 2017, 18, 393. [Google Scholar] [CrossRef] [PubMed] [Green Version]
- Kuntzmann, P.; Villaume, S.; Larignon, P.; Bertsch, C. Esca, BDA and Eutypiosis: Foliar symptoms, trunk lesions and fungi observed in diseased vinestocks in two vineyards in Alsace. Vitis 2010, 49, 71–76. [Google Scholar] [CrossRef]
- Benard-Gellon, M.; Farine, S.; Goddard, M.L.; Schmitt, M.; Stempien, E.; Pensec, F.; Laloue, H.; Mazet-Kieffer, F.; Fontaine, F.; Larignon, P.; et al. Toxicity of extracellular proteins from Diplodia seriata and Neofusicoccum parvum involved in grapevine Botryosphaeria dieback. Protoplasma 2015, 252, 679–687. [Google Scholar] [CrossRef]
- Stempien, E.; Goddard, M.L.; Wilhelm, K.; Tarnus, C.; Bertsch, C.; Chong, J. Grapevine Botryosphaeria dieback fungi have specific aggressiveness factor repertory involved in wood decay and stilbene metabolization. PLoS ONE 2017, 12, e0188766. [Google Scholar] [CrossRef] [PubMed]
- Moffat, C.S.; See, P.T.; Oliver, R.P. Generation of a ToxA knockout strain of the wheat tan spot pathogen Pyrenophora tritici-repentis. Mol. Plant Pathol. 2014, 15, 918–926. [Google Scholar] [CrossRef]
- Bino, R.J.; Franken, J.; Witsenboer, H.M.; Hille, J.; Dons, J.J. Effects of Alternaria alternata f.sp. lycopersici toxins on pollen. Theor. Appl. Genet. 1988, 76, 204–208. [Google Scholar] [CrossRef] [Green Version]
- Gopalakrishnan, S.; Beale, M.H.; Ward, J.L.; Strange, R.N. Chickpea wilt: Identification and toxicity of 8-O-methyl-fusarubin from Fusarium acutatum. Phytochemistry 2005, 66, 1536–1539. [Google Scholar] [CrossRef] [PubMed]
- Ramirez-Suero, M.; Benard-Gellon, M.; Chong, J.; Laloue, H.; Stempien, E.; Abou-Mansour, E.; Fontaine, F.; Larignon, P.; Mazet-Kieffer, F.; Farine, S.; et al. Extracellular compounds produced by fungi associated with Botryosphaeria dieback induce differential defence gene expression patterns and necrosis in Vitis vinifera cv. Chardonnay cells. Protoplasma 2014, 251, 1417–1426. [Google Scholar] [CrossRef] [PubMed] [Green Version]
- Guan, P.; Schmidt, F.; Riemann, M.; Fischer, J.; Thines, E.; Nick, P. Hunting modulators of plant defence: The grapevine trunk disease fungus Eutypa lata secretes an amplifier for plant basal immunity. J. Exp. Bot. 2020, 71, 3710–3724. [Google Scholar] [CrossRef] [PubMed]
- Guan, X.; Essakhia, S.; Lalouea, H.; Nick, P.; Bertsch, C.; Chong, J. Mining new resources for grape resistance against Botryosphaeriaceae: A focus on Vitis vinifera ssp. sylvestris. Plant Pathol. 2016, 65, 273–284. [Google Scholar] [CrossRef]
- Amborabé, B.-E.; Fleurat-Lessard, P.; Bonmort, J.; Roustan, J.-P.; Roblin, G. Effects of eutypine, a toxin from Eutypa lata, on plant cell plasma membrane: Possible subsequent implication in disease development. Plant Physiol. Biochem. 2001, 39, 51–58. [Google Scholar] [CrossRef]
- Lee, J.Y. New and old roles of plasmodesmata in immunity and parallels to tunneling nanotubes. Plant Sci. 2014, 221–222, 13–20. [Google Scholar] [CrossRef] [Green Version]
- Wang, X.; Sager, R.; Cui, W.; Zhang, C.; Lu, H.; Lee, J.-Y. Salicylic acid regulates Plasmodesmata closure during innate immune responses in Arabidopsis. Plant Cell 2013, 25, 2315–2329. [Google Scholar] [CrossRef] [Green Version]
- Kobayashi, I.; Kobayashi, Y. Microtubules and Pathogen Defence; Plant Cell Monographs; Springer: Berlin/Heidelberg, Germany, 2007; Volume 11. [Google Scholar]
- Schmelzer, E. Cell polarization, a crucial process in fungal defence. Trends Plant Sci. 2002, 7, 411–415. [Google Scholar] [CrossRef]
- Qiao, F.; Chang, X.L.; Nick, P. The cytoskeleton enhances gene expression in the response to the Harpin elicitor in grapevine. J. Exp. Bot. 2010, 61, 4021–4031. [Google Scholar] [CrossRef]
- Guan, X.; Buchholz, G.; Nick, P. Tubulin marker line of grapevine suspension cells as a tool to follow early stress responses. J. Plant Physiol. 2015, 176, 118–128. [Google Scholar] [CrossRef]
- Roberts, A.; Trapnell, C.; Donaghey, J.; Rinn, J.L.; Pachter, L. Improving RNA-Seq expression estimates by correcting for fragment bias. Genome Biol. 2011, 12, R22. [Google Scholar] [CrossRef] [PubMed] [Green Version]
- Love, M.I.; Huber, W.; Anders, S. Moderated estimation of fold change and dispersion for RNA-seq data with DESeq2. Genome Biol. 2014, 15, 550. [Google Scholar] [CrossRef] [PubMed] [Green Version]
- Young, M.D.; Wakefield, M.J.; Smyth, G.K.; Oshlack, A. Gene ontology analysis for RNA-seq: Accounting for selection bias. Genome Biol. 2010, 11, R14. [Google Scholar] [CrossRef] [PubMed] [Green Version]
- Higaki, T.; Kutsuna, N.; Sano, T.; Kondo, N.; Hasezawa, S. Quantification and cluster analysis of actin cytoskeletal structures in plant cells: Role of actin bundling in stomatal movement during diurnal cycles in Arabidopsis guard cells. Plant J. 2010, 61, 156–165. [Google Scholar] [CrossRef] [PubMed]
- Guan, X.; Buchholz, G.; Nick, P. The cytoskeleton is disrupted by the bacterial effector HrpZ, but not by the bacterial PAMP flg22, in tobacco BY-2 cells. J. Exp. Bot. 2013, 64, 1805–1816. [Google Scholar] [CrossRef] [Green Version]
- Nick, P. Microtubules and the tax payer. Protoplasma 2012, 249 (Suppl. 2), S81–S94. [Google Scholar] [CrossRef]
- Wang, H.; Wang, H.; Shao, H.; Tang, X. Recent Advances in Utilizing Transcription Factors to Improve Plant Abiotic Stress Tolerance by Transgenic Technology. Front. Plant Sci. 2016, 7, 67. [Google Scholar] [CrossRef] [Green Version]
- Thirugnanasambantham, K.; Durairaj, S.; Saravanan, S.; Karikalan, K.; Muralidaran, S.; Islam, V.I.H. Role of Ethylene Response Transcription Factor (ERF) and Its Regulation in Response to Stress Encountered by Plants. Plant Mol. Biol. Report. 2015, 33, 347–357. [Google Scholar] [CrossRef]
- Maruyama, Y.; Yamoto, N.; Suzuki, Y.; Chiba, Y.; Yamazaki, K.; Sato, T.; Yamaguchi, J. The Arabidopsis transcriptional repressor ERF9 participates in resistance against necrotrophic fungi. Plant Sci. 2013, 213, 79–87. [Google Scholar] [CrossRef]
- Chen, T.; Lv, Y.; Zhao, T.; Li, N.; Yang, Y.; Yu, W.; He, X.; Liu, T.; Zhang, B. Comparative transcriptome profiling of a resistant vs. susceptible tomato (Solanum lycopersicum) cultivar in response to infection by tomato yellow leaf curl virus. PLoS ONE 2013, 8, e80816. [Google Scholar] [CrossRef]
- Son, G.H.; Wan, J.R.; Kim, H.J.; Nguyen, X.C.; Chung, W.S.; Hong, J.C.; Stacey, G. Ethylene-Responsive Element-Binding Factor 5, ERF5, Is Involved in Chitin-Induced Innate Immunity Response. Mol. Plant-Microbe Interact. 2012, 25, 48–60. [Google Scholar] [CrossRef] [PubMed] [Green Version]
- Hsu, F.C.; Chou, M.Y.; Chou, S.J.; Li, Y.R.; Peng, H.P.; Shih, M.C. Submergence confers immunity mediated by the WRKY22 transcription factor in Arabidopsis. Plant Cell 2013, 25, 2699–2713. [Google Scholar] [CrossRef] [PubMed] [Green Version]
- Pandey, S.P.; Somssich, I.E. The role of WRKY transcription factors in plant immunity. Plant Physiol. 2009, 150, 1648–1655. [Google Scholar] [CrossRef] [PubMed] [Green Version]
- Yan, Y.; Zheng, X.; Apaliya, M.T.; Yang, H.; Zhang, H. Transcriptome characterization and expression profile of defense-related genes in pear induced by Meyerozyma guilliermondii. Postharvest Biol. Technol. 2018, 141, 63–70. [Google Scholar] [CrossRef]
- Grzechowiak, M. The role of WRKY transcription factors in plants. BioTechnologia 2015, 95, 215–233. [Google Scholar] [CrossRef]
- Zhang, Y.; Feng, J.C. Identification and characterization of the grape WRKY family. Biomed. Res. Int. 2014, 2014, 787680. [Google Scholar] [CrossRef] [PubMed]
- Constabel, C.P.; Brisson, N. The defense-related STH-2 gene product of potato shows race-specific accumulation after inoculation with low concentrations of Phytophthora infestans zoospores. Planta 1992, 188, 289–295. [Google Scholar] [CrossRef] [PubMed]
- Sabella, E.; Luvisi, A.; Aprile, A.; Negro, C.; Vergine, M.; Nicoli, F.; Miceli, A.; De Bellis, L. Xylella fastidiosa induces differential expression of lignification related-genes and lignin accumulation in tolerant olive trees cv. Leccino. J. Plant Physiol. 2018, 220, 60–68. [Google Scholar] [CrossRef]
- Weng, K.; Li, Z.Q.; Liu, R.Q.; Wang, L.; Wang, Y.J.; Xu, Y. Transcriptome of Erysiphe necator-infected Vitis pseudoreticulata leaves provides insight into grapevine resistance to powdery mildew. Hortic. Res. 2014, 1, 14049. [Google Scholar] [CrossRef] [Green Version]
- Coutos-Thevenot, P.; Poinssot, B.; Bonomelli, A.; Yean, H.; Breda, C.; Buffard, D.; Esnault, R.; Hain, R.; Boulay, M. In vitro tolerance to Botrytis cinerea of grapevine 41B rootstock in transgenic plants expressing the stilbene synthase Vst1 gene under the control of a pathogen-inducible PR 10 promoter. J. Exp. Bot. 2001, 52, 901–910. [Google Scholar] [CrossRef] [Green Version]
- Pessina, S.; Lenzi, L.; Perazzolli, M.; Campa, M.; Dalla Costa, L.; Urso, S.; Vale, G.; Salamini, F.; Velasco, R.; Malnoy, M. Knockdown of MLO genes reduces susceptibility to powdery mildew in grapevine. Hortic. Res. 2016, 3, 16016. [Google Scholar] [CrossRef] [PubMed] [Green Version]
- Guerrero, R.F.; Cantos-Villar, E.; Puertas, B.; Richard, T. Daily Preharvest UV-C Light Maintains the High Stilbenoid Concentration in Grapes. J. Agric. Food Chem. 2016, 64, 5139–5147. [Google Scholar] [CrossRef] [PubMed]
- Jeandet, P.; Douillet-Breuil, A.C.; Bessis, R.; Debord, S.; Sbaghi, M.; Adrian, M. Phytoalexins from the Vitaceae: Biosynthesis, phytoalexin gene expression in transgenic plants, antifungal activity, and metabolism. J. Agric. Food Chem. 2002, 50, 2731–2741. [Google Scholar] [CrossRef] [PubMed]
- Jones, J.D.; Dangl, J.L. The plant immune system. Nature 2006, 444, 323–329. [Google Scholar] [CrossRef] [PubMed] [Green Version]
- Tena, G.; Boudsocq, M.; Sheen, J. Protein kinase signaling networks in plant innate immunity. Curr. Opin. Plant Biol. 2011, 14, 519–529. [Google Scholar] [CrossRef] [PubMed] [Green Version]
- Schulze, B.; Mentzel, T.; Jehle, A.K.; Mueller, K.; Beeler, S.; Boller, T.; Felix, G.; Chinchilla, D. Rapid heteromerization and phosphorylation of ligand-activated plant transmembrane receptors and their associated kinase BAK1. J. Biol. Chem. 2010, 285, 9444–9451. [Google Scholar] [CrossRef] [PubMed] [Green Version]
- Robatzek, S.; Chinchilla, D.; Boller, T. Ligand-induced endocytosis of the pattern recognition receptor FLS2 in Arabidopsis. Genes Dev. 2006, 20, 537–542. [Google Scholar] [CrossRef] [PubMed] [Green Version]
- Zipfel, C.; Kunze, G.; Chinchilla, D.; Caniard, A.; Jones, J.D.; Boller, T.; Felix, G. Perception of the bacterial PAMP EF-Tu by the receptor EFR restricts Agrobacterium-mediated transformation. Cell 2006, 125, 749–760. [Google Scholar] [CrossRef]
- Wu, J.; Zhang, Y.; Yin, L.; Qu, J.; Lu, J. Linkage of cold acclimation and disease resistance through plant-pathogen interaction pathway in Vitis amurensis grapevine. Funct. Integr. Genom. 2014, 14, 741–755. [Google Scholar] [CrossRef]
- Zhang, K.; Han, Y.T.; Zhao, F.L.; Hu, Y.; Gao, Y.R.; Ma, Y.F.; Zheng, Y.; Wang, Y.J.; Wen, Y.Q. Genome-wide Identification and Expression Analysis of the CDPK Gene Family in Grape, Vitis spp. BMC Plant Biol. 2015, 15, 164. [Google Scholar] [CrossRef] [Green Version]
- Fan, J.J.; Wang, P.; Xu, X.; Liu, K.; Ruan, Y.Y.; Zhu, Y.S.; Cui, Z.H.; Zhang, L.J. Characterization of a TIR-NBS-LRR gene associated with downy mildew resistance in grape. Genet. Mol. Res. 2015, 14, 7964–7975. [Google Scholar] [CrossRef] [PubMed]
- Mengiste, T.; Chen, X.; Salmeron, J.; Dietrich, R. The BOTRYTIS SUSCEPTIBLE1 gene encodes an R2R3MYB transcription factor protein that is required for biotic and abiotic stress responses in Arabidopsis. Plant Cell 2003, 15, 2551–2565. [Google Scholar] [CrossRef] [PubMed] [Green Version]
- Fung, R.W.; Gonzalo, M.; Fekete, C.; Kovacs, L.G.; He, Y.; Marsh, E.; McIntyre, L.M.; Schachtman, D.P.; Qiu, W. Powdery mildew induces defense-oriented reprogramming of the transcriptome in a susceptible but not in a resistant grapevine. Plant Physiol 2008, 146, 236–249. [Google Scholar] [CrossRef] [PubMed] [Green Version]
- Yang, D.L.; Yao, J.; Mei, C.S.; Tong, X.H.; Zeng, L.J.; Li, Q.; Xiao, L.T.; Sun, T.P.; Li, J.; Deng, X.W.; et al. Plant hormone jasmonate prioritizes defense over growth by interfering with gibberellin signaling cascade. Proc. Natl. Acad. Sci. USA 2012, 109, E1192–E1200. [Google Scholar] [CrossRef] [PubMed] [Green Version]
- Koussa, T.; Rifai, L.A.; Dubos, B.; Broquedis, M. Variations of abscisic acid contents in various organs of grapevine infected by the eutypa dieback fungus, Eutypa lata. J. Int. Sci. Vigne Vin 2006, 40, 187–195. [Google Scholar] [CrossRef]
- Despres, C.; Chubak, C.; Rochon, A.; Clark, R.; Bethune, T.; Desveaux, D.; Fobert, P.R. The Arabidopsis NPR1 disease resistance protein is a novel cofactor that confers redox regulation of DNA binding activity to the basic domain/leucine zipper transcription factor TGA1. Plant. Cell 2003, 15, 2181–2191. [Google Scholar] [CrossRef] [Green Version]
- Hubert, D.A.; Tornero, P.; Belkhadir, Y.; Krishna, P.; Takahashi, A.; Shirasu, K.; Dangl, J.L. Cytosolic HSP90 associates with and modulates the Arabidopsis RPM1 disease resistance protein. EMBO J. 2003, 22, 5679–5689. [Google Scholar] [CrossRef] [Green Version]
- Mestre, P.; Baulcombe, D.C. Elicitor-mediated oligomerization of the tobacco N disease resistance protein. Plant. Cell 2006, 18, 491–501. [Google Scholar] [CrossRef] [Green Version]
- Binet, M.N.; Humbert, C.; Lecourieux, D.; Vantard, M.; Pugin, A. Disruption of microtubular cytoskeleton induced by cryptogein, an elicitor of hypersensitive response in tobacco cells. Plant. Physiol. 2001, 125, 564–572. [Google Scholar] [CrossRef] [Green Version]
- Cahill, D.; Rookes, J.; Michalczyk, A.; McDonald, K.; Drake, A. Microtubule dynamics in compatible and incompatible interactions of soybean hypocotyl cells with Phytophthora sojae. Plant. Pathol. 2002, 51, 629–640. [Google Scholar] [CrossRef]
- Sugimoto, M.; Toyoda, K.; Ichinose, Y.; Yamada, T.; Shiraishi, T. Cytochalasin A inhibits the binding of phenylalanine ammonia-lyase mRNA to ribosomes during induction of phytoalexin in pea seedlings. Plant. Cell Physiol. 2000, 41, 234–238. [Google Scholar] [CrossRef] [PubMed] [Green Version]
Figure 1.
Differentially expressed genes (DEGs) (p-value < 0.05 and fold change > 2.0) in response to incubation with the culture filtrates of D. seriata 98.1 at 3 days post-inoculation (dpi) compared with the mock control. (A) Distribution of gene expression levels. The dark gray dots represent more prevalent transcripts in incubated cells than the control, while lower frequency is represented by light gray dots and transcripts showing no significant differences are represented by black dots. (B) The number of up-regulated and down-regulated genes in the incubated cells. (C) Differentially expressed transcription factor families of incubated cells.

Figure 2.
The enrichment of Gene Ontology (GO)- and Kyoto Encyclopedia of Genes and Genomes (KEGG)-based distribution of DEGs incubated with D. seriata 98.1. (A) The most significantly enriched biological process, cellular component and molecular function of GO enrichment (p-value < 0.05). (B) The DEGs enriched in different biological pathways were analyzed with the KEGG database. RichFactor represents the ratio of enriched DEGs to all genes in the corresponding pathway. Diff represents the number of DEGs enriched in the corresponding pathway. A lower Q-value represents a higher significant degree of enrichment.

Figure 3.
qRT-PCR analysis of relative expression levels of 12 selected DEGs in V. rupestris suspension cells incubated with D. seriata 98.1 and sterile water as the mock-incubated control. Actin was used as the reference gene. The left Y-axis represents the relative expression levels by qRT-PCR (black bar), while the right Y-axis represents the Log2Fold of each selected gene in RNA-seq results (white bar). Mean values and standard errors were obtained from two biological replicates.

Figure 4.
Phenotyping of cellular responses to D. seriata 98.1. (A) The response of the microtubules (MTs) to 50% (v/v), 2% (v/v) and 0.1% (v/v) culture filtrates of D. seriata 98.1 was observed in V. rupestris expressing GFP-AtTUB6 at 20 min, 24 h and 3 days, respectively, with water as the mock control. Quantitative data for skewness are listed below the images. Observations are representative of at least three independent experimental series with a population of 20–30 individual cells for each treatment. (B) Packed cell volume as an indicator of culture growth at 3 and 6 days after incubation with 2% (v/v) culture filtrates of D. seriata 98.1, respectively. Data are mean ± standard errors from three biological replicates. Asterisks indicate significant differences evaluated using paired Student’s t test (* p < 0.05). (C) Frequency distributions for the ratio between cell width over cell length at 3 dpi with 2% (v/v) culture filtrates were measured from 800–1000 individual cells for each experiment to detect the changes in cell shape.

Figure 5.
The patterns of pathogen-associated molecular patterns (PAMPs)-triggered immunity (PTI) and effector-triggered immunity (ETI) in V. rupestris cells after D. seriata 98.1 incubation. The squares represent the transcriptional changes of DEGs. The fold change is displayed as illustrated in the color bar on the right (black is up-regulated and white is down-regulated).

Publisher’s Note: MDPI stays neutral with regard to jurisdictional claims in published maps and institutional affiliations. |
© 2021 by the authors. Licensee MDPI, Basel, Switzerland. This article is an open access article distributed under the terms and conditions of the Creative Commons Attribution (CC BY) license (http://creativecommons.org/licenses/by/4.0/).
Share and Cite
MDPI and ACS Style
Zhao, L.; You, S.; Zou, H.; Guan, X. Transcriptome Analysis and Cell Morphology of Vitis rupestris Cells to Botryosphaeria Dieback Pathogen Diplodia seriata. Genes 2021, 12, 179. https://doi.org/10.3390/genes12020179
AMA Style
Zhao L, You S, Zou H, Guan X. Transcriptome Analysis and Cell Morphology of Vitis rupestris Cells to Botryosphaeria Dieback Pathogen Diplodia seriata. Genes. 2021; 12(2):179. https://doi.org/10.3390/genes12020179
Chicago/Turabian StyleZhao, Liang, Shuangmei You, Hui Zou, and Xin Guan. 2021. "Transcriptome Analysis and Cell Morphology of Vitis rupestris Cells to Botryosphaeria Dieback Pathogen Diplodia seriata" Genes 12, no. 2: 179. https://doi.org/10.3390/genes12020179
Note that from the first issue of 2016, this journal uses article numbers instead of page numbers. See further details here.