Article

Chloroplast Genome of Lithocarpus dealbatus (Hook.f. & Thomson ex Miq.) Rehder Establishes Monophyletic Origin of the Species and Reveals Mutational Hotspots with Taxon Delimitation Potential

by
Rahul Gunvantrao Shelke
1,†,
Rudra Prasad Banerjee
1,†,
Babita Joshi
1,2,†,
Prem Prakash Singh
1,
Gopal Ji Tiwari
1,
Dibyendu Adhikari
1,
Satya Narayan Jena
1,* and
Saroj Kanta Barik
1,*
1
CSIR-National Botanical Research Institute, Rana Pratap Marg, Lucknow 226001, India
2
Academy of Scientific and Innovative Research (AcSIR), Ghaziabad 201002, India
*
Authors to whom correspondence should be addressed.
These authors contributed equally to this work.
Life 2022, 12(6), 828; https://doi.org/10.3390/life12060828
Submission received: 20 April 2022 / Revised: 22 May 2022 / Accepted: 23 May 2022 / Published: 2 June 2022
(This article belongs to the Special Issue Research Advances in Plant Genomics: 2nd Edition)

Abstract

:
There is phylogenetic ambiguity in the genus Lithocarpus and subfamily Quercoideae (Family: Fagaceae). Lithocarpus dealbatus, an ecologically important tree, is the dominant species among the Quercoideae in India. Although several studies have been conducted on the species’ regeneration and ecological and economic significance, limited information is available on its phylo-genomics. To resolve the phylogeny in Quercoideae, we sequenced and assembled the 161,476 bp chloroplast genome of L. dealbatus, which has a large single-copy section of 90,732 bp and a small single-copy region of 18,987 bp, separated by a pair of inverted repeat regions of 25,879 bp. The chloroplast genome contained 133 genes, of which 86 were protein-coding genes, 39 were transfer RNAs, and eight were ribosomal RNAs. Analysis of repeat elements and RNA editing sites revealed interspecific similarities within the Lithocarpus genus. DNA diversity analysis identified five highly diverged coding and noncoding hotspot regions in the four genera, which can be used as polymorphic markers for species/taxon delimitation across the four genera of Quercoideae viz., Lithocarpus, Quercus, Castanea, and Castanopsis. The chloroplast-based phylogenetic analysis among the Quercoideae established a monophyletic origin of Lithocarpus, and a closer evolutionary lineage with a few Quercus species. Besides providing insights into the chloroplast genome architecture of L. dealbatus, the study identified five mutational hotspots having high taxon-delimitation potential across four genera of Quercoideae.

1. Introduction

Lithocarpus dealbatus (Hook.f. & Thomson ex Miq.) Rehder, commonly known as stone oak, is a wild tree species and belongs to the subfamily Quercoideae under the family Fagaceae. Quercoideae consists of seven genera, viz. Castanea, Castanopsis, Chrysolepis, Lithocarpus, Notholithocarpus, Quercus, and Trigonobalanus, with 1088–1135 species (The plant list, http://www.theplantlist.org/, accessed on 8 May 2021). The other subfamily, Fagoideae, is monogeneric with the genus Fagus and has 11–14 species. Lithocarpus is the second-largest genus of the family Fagaceae, with ~330 species, most of which are distributed in the moist/wet evergreen forests of Southeast Asia (The plant list, http://www.theplantlist.org/, accessed on 6 May 2021). In India, the genus Lithocarpus is represented by 17 species [1,2], of which L. dealbatus is the dominant species distributed in the elevation range of 1000–1500 m above sea level. The species is found in the montane subtropical and temperate forests of the Eastern Himalayas and in the hills of northeastern India, and attains a height up to 30 m [3,4,5]. The species performs several ecological functions with high standing biomass and a variety of mutualistic interactions with ectomycorrhizal fungi, gall-forming insects, and seed-dispersing vertebrates [6]. The species is mainly used as fuelwood and its acorns are eaten by rodents. The hoarding of acorns by scatter-hoarding Sciuridae (squirrels) helps the species in wide seed dispersal, maintenance of the soil-seed bank, and regeneration of the species in the forest [7,8,9,10,11,12].
Interspecific hybridisation within the family often poses challenge for species delimitation, and exhibits conflicting phylogeny [13,14,15]. The universal standard plastid markers such as matK, rbcL, trnH-psbA, etc. do not provide a sufficient number of variable sites and phylogenetic signals to resolve the phylogeny in Quercoidaeae [16,17,18]. The use of a few nuclear markers such as ITS1 and ITS2 or their combinations for inferring Fagaceae phylogeny by earlier workers did not yield a resolved discrimination [16,17]. On the other hand, the chloroplast genome has been successfully used for establishing phylogenetic relationships, as well as to resolve taxonomic discrepancies in Castanea and Castanopsis [16]. Pang et al. (2019) achieved species-level discrimination and phylogenetic resolution in Quercus by using chloroplast-genome sequences [17]. The chloroplast genomes have been proven effective to resolve plant phylogeny because of their highly conserved structure and recombination-free uniparental inheritance [16]. However, Yang et al. (2021) reported that due to extensive introgression and chloroplast capture in Quercus, chloroplast genome analysis yielded a non-monophyletic origin while nuclear genome sequencing resulted in monophyletic origin [19]. Given such conflicting reports relating to the effectiveness of plastome in establishing phylogeny of Quercus, it is essential to undertake empirical studies in other genera to establish its efficacy in phylogenomics. This can be best assessed in one of its close sister genera Lithocarpus. In addition, there is a need to characterise the sources, extent, and consequences of the conflicting phylogenomic signals in the plastome for a mechanistic understanding.
The chloroplast-genome sequences have also been used to identify the mutational hotspot regions for designing the species-specific DNA markers/barcodes. Unlike universal markers/barcodes, the mutational hotspots can better differentiate plant taxa up to the species level [15,16]. Pang et al. [17] demonstrated that the newly discovered markers based on comparative genomics were more variable than the standard plant DNA markers (e.g., rbcL, trnH-psbA and matK) discriminating Quercus species. An extremely low-resolution power of DNA barcode was reported in the 12 Italian oak species [20]. Therefore, several workers have highlighted the need to develop novel barcodes in Quercoideae species [17,21]. Researchers have demonstrated that chloroplast-genome mutations are clustered into hotspots, and these hotspot regions can be potential candidates for new DNA barcodes [22]. Such mutational hotspots in the chloroplast genome have been used in delimiting the species-specific barcodes in oak and Castanea species that have been designed by previous workers [17,21]. Although some specific barcodes with high discriminatory power have been reported in Quercus, additional new markers are required for other Quercoideae species considering their complex evolutionary background. Therefore, genomic information is essential to understand the evolutionary relationship of Lithocarpus genus and its species with other genera of Fagaceae.
Plant chloroplast genomes have a circular quadripartite structure with size ranging from 107 to 218 kb [21]. The chloroplast genome is uniparentally inherited and highly conserved in terms of structural organisation, gene content, and layout, thus accumulating a slow rate of evolutionary changes [23,24,25,26,27]. Like any other chloroplast genome, small single-copy (SSC) and large single-copy (LSC) sections are separated by two inverted repeats (IR) regions in L. dealbatus [25]. The chloroplast genome has usually 130 genes, including 80 protein-coding genes, 4 rRNA genes, and 35 tRNA genes [19]. Despite the overall structural conservation and, contraction and expansion of the IR boundaries, the chloroplast genome can lead to variations in gene content resulting in genome size variations [28]. Moreover, several mutational events take place in the genome due to insertion or deletion, single-nucleotide polymorphisms (SNP), simple sequence repeats (SSRs) and tandem repeats [28,29]. Such genome-scale variations further allow using these regions as molecular markers in diversity research, population genetics, and phylogenetic investigations [30,31,32]. The entire chloroplast genome has recently been employed instead of single-locus DNA barcode to obtain reliable evolutionary evidences [31,33].
In recent times, the advances in high-throughput sequencing technologies have resulted in an increase in chloroplast genomes in the public domain. However, genomic information on Lithocarpus, particularly the complete chloroplast genome in the NCBI database (https://www.ncbi.nlm.nih.gov/nuccore/?term=Lithocarpus+chloroplast%2C+complete+genome, accessed on 4 May 2021), is represented by only two species, viz. Lithocarpus balansae and Lithocarpus hancei [34]. In view of the above, we sequenced and assembled the whole chloroplast genome of L. dealbatus with an objective to study its architecture, determine its effectiveness in establishing species phylogeny, and assess its structural efficacy in taxon delimitation. The assembled chloroplast genome was successfully annotated and compared with the other members of Quercoideae to understand its structural variations and rearrangements. In addition, a phylogenetic tree was constructed to deduce the evolutionary relatedness of L. dealbatus with other members of Quercoideae. The highly divergent regions and the SSRs identified in the chloroplast genome would also help in understanding the ecological significance of the species in terms of spatial distribution and adaptability besides the evolutionary relationship of L. dealbtus within Fagaceae.

2. Materials and Methods

2.1. DNA Isolation and Sequencing on MGI Platform

Fresh leaf samples of L. dealbatus were collected from Shillong, Meghalaya and stored immediately in liquid nitrogen. DNA extraction was performed using DNeasy Plant Pro and Plant Kits (Qiagen) from the stored leaf samples. The quality of the extracted genomic DNA was determined in 0.8% agarose gel and further quantified through NanoDrop™ One/OneC Micro volume UV-Vis Spectrophotometer (Thermofischer, Waltham, MA, USA). The genomic library was constructed following the MGI’s DNA nanoball (DNB) protocol. DNBSEQTM—G400 Genetic Sequencer (MGI Tech. Co. Ltd., Shenzhen, China) platform at Imperial Life Sciences Pvt. Ltd. was used to generate PE150long reads.

2.2. Chloroplast-Genome Assembly

The quality of MGI reads was checked through the FastQC program (https://www.bioinformatics.babraham.ac.uk/projects/fastqc, accessed on 8 November 2019). The clean reads were further used to de novo assemble the whole chloroplast genome via Novoplasty assembler by keeping the default parameter, except Kmer length 39 and rbcL gene as a seed sequence from L. balansae genome (Accession # KP299291.1) [35]. Finally, the assembled chloroplast genome was confirmed by performing BLASTN against the non-redundant nucleotide database at NCBI (https://blast.ncbi.nlm.nih.gov/Blast.cgi?PAGE_TYPE=BlastSearch, accessed on 18 March 2021).

2.3. Annotation and Map Drawing of Chloroplast Genome

The chloroplast genome was further annotated using the Chlorobox Geseq program, keeping L. balansae and inbuilt the Geseq MPI-MP genome set as a reference genome (https://chlorobox.mpimp-golm.mpg.de/geseq.html, accessed on 28 April 2021). Annotations of tRNA genes were conducted through the tRNAscan-SE tool. Manual adjustments of start and stop codon and exon-intron junctions were made in the NCBI ORF finder (https://www.ncbi.nlm.nih.gov/orffinder/, accessed on 22 April, 2021). Finally, annotations and structural features of the chloroplast genome were visualised through the OGDRAW program [36].

2.4. Comparative Analysis of L. dealbatus with Fagaceae Chloroplast Genome for Structural Rearrangement, Similarity, Expansion and Contraction of IR and Tandem Repeat

Comparative analysis of the L. dealbatus chloroplast genome was performed using the previously published genomes such as L. balansae (Drake) A. Camus (Accession # KP299291.1), L. hancei (Benth.) Rehder (Accession # MW375417.1), Castanea henryi (Skan) Rehder & E.H.Wilson (Accession # MH998384.1), Castanopsis sclerophylla (Lindl. & Paxton) Schottky (Accession # NC_044680.1), Quercus pannosa Hand.-Mazz. (Accession # NC_050963.1) and Trigonobalanus doichangensis (Accession # KF990556.1). Structural rearrangement among the chloroplast genomes was recognised through MAUVE alignment (http://darlinglab.org/mauve/mauve.html, accessed on 4 May 2021). The mVISTA program was employed to determine the similarity between the compared chloroplast genomes using the Shuffle-LAGAN model by keeping L. dealbatus as a reference (http://genome.lbl.gov/vista/mvista/submit.shtml, accessed on 10 May 2021). The expansion and contraction of IR junctions in chloroplast genomes were analysed and displayed through the IRscope tool (https://irscope.shinyapps.io/irapp, accessed on 12 May 2021). Tandem repeats were identified through the REPuter program using the minimum repeat size 30 and hamming distance 3 (https://bibiserv.cebitec.uni-bielefeld.de/reputer, accessed on 15 May 2021). MISA tool was employed to recognise SSRs with the minimum repeats 10 for mononucleotide, 5 for dinucleotide, 4 for trinucleotide, and 3 for tetra-, penta-, hexa-, septa-, octa-, nona-, and decanucleotide, respectively (http://pgrc.ipk-gatersleben.de/misa/misa.html, accessed on 18 May 2021). We employed the Predictive RNA Editor for Plants (PREP) program to recognise the RNA editing in 35 reference genes (http://prep.unl.edu/, accessed on 24 May 2021).

2.5. DNA Diversity and Ka/Ks Analysis in Lithocarpus

Divergence across the coding and noncoding regions in the Lithocarpus, Quercus, Castanea, and Castanopsis genus was determined using DnaSP v5.0 (Universitat de Barcelona, Barcelona, Spain) (http://www.ub.edu/dnasp/, accessed on 8 June 2021). MEGA X tool was used to determine the Ka/Ks ratio of protein-coding regions (https://www.megasoftware.net/, accessed on 18 June 2021).

2.6. Phylogenetic Analysis and Estimation of the Divergence Time

Phylogenetic study was performed using the chloroplast genomes of Quercoideae genomes available in the public database. We selected two chloroplast genomes from the genus Fagus, namely F. crenata and F. japonica, as outgroups. Since structural rearrangements, gene content and direct alignment of chloroplast genomes are challenging, we employed the HomBlocks tool to determine locally collinear blocks (LCBs) present in chloroplast genomes for alignment [37]. Unaligned sequences were trimmed using the Gblocks program embedded in the HomBlocks pipeline. The Model test calculated the best substitution model in the MEGA tool suggested by the Akaike information criterion (AIC). Finally, the GTR+G+I model was chosen to construct the phylogenetic tree using the maximum-likelihood (ML) method in the MEGA X tool (https://www.megasoftware.net/, accessed on 8 August 2021). The branch support values for each were calculated based on 500 bootstraps. The phylogenetic tree was coloured and represented using the iTOL web server (https://itol.embl.de/, accessed on 13 August 2021).
A timetree was inferred using the ReltimeML-option in MEGA X. The same species used in our previous analysis such as F. crenata and F. japonica were constrained to be the outgroup in this divergence-tree analysis. The reference-node age was obtained by the divergence time of Quercus ciliaris–T. doichangensis (11.1–57.9 million years ago) and Q. ciliaris–C.henryi (6.0–49.0 million years ago) (http://www.timetree.org/, accessed on 10 November 2021).

3. Results

3.1. Assembly of Chloroplast Genome and Annotation

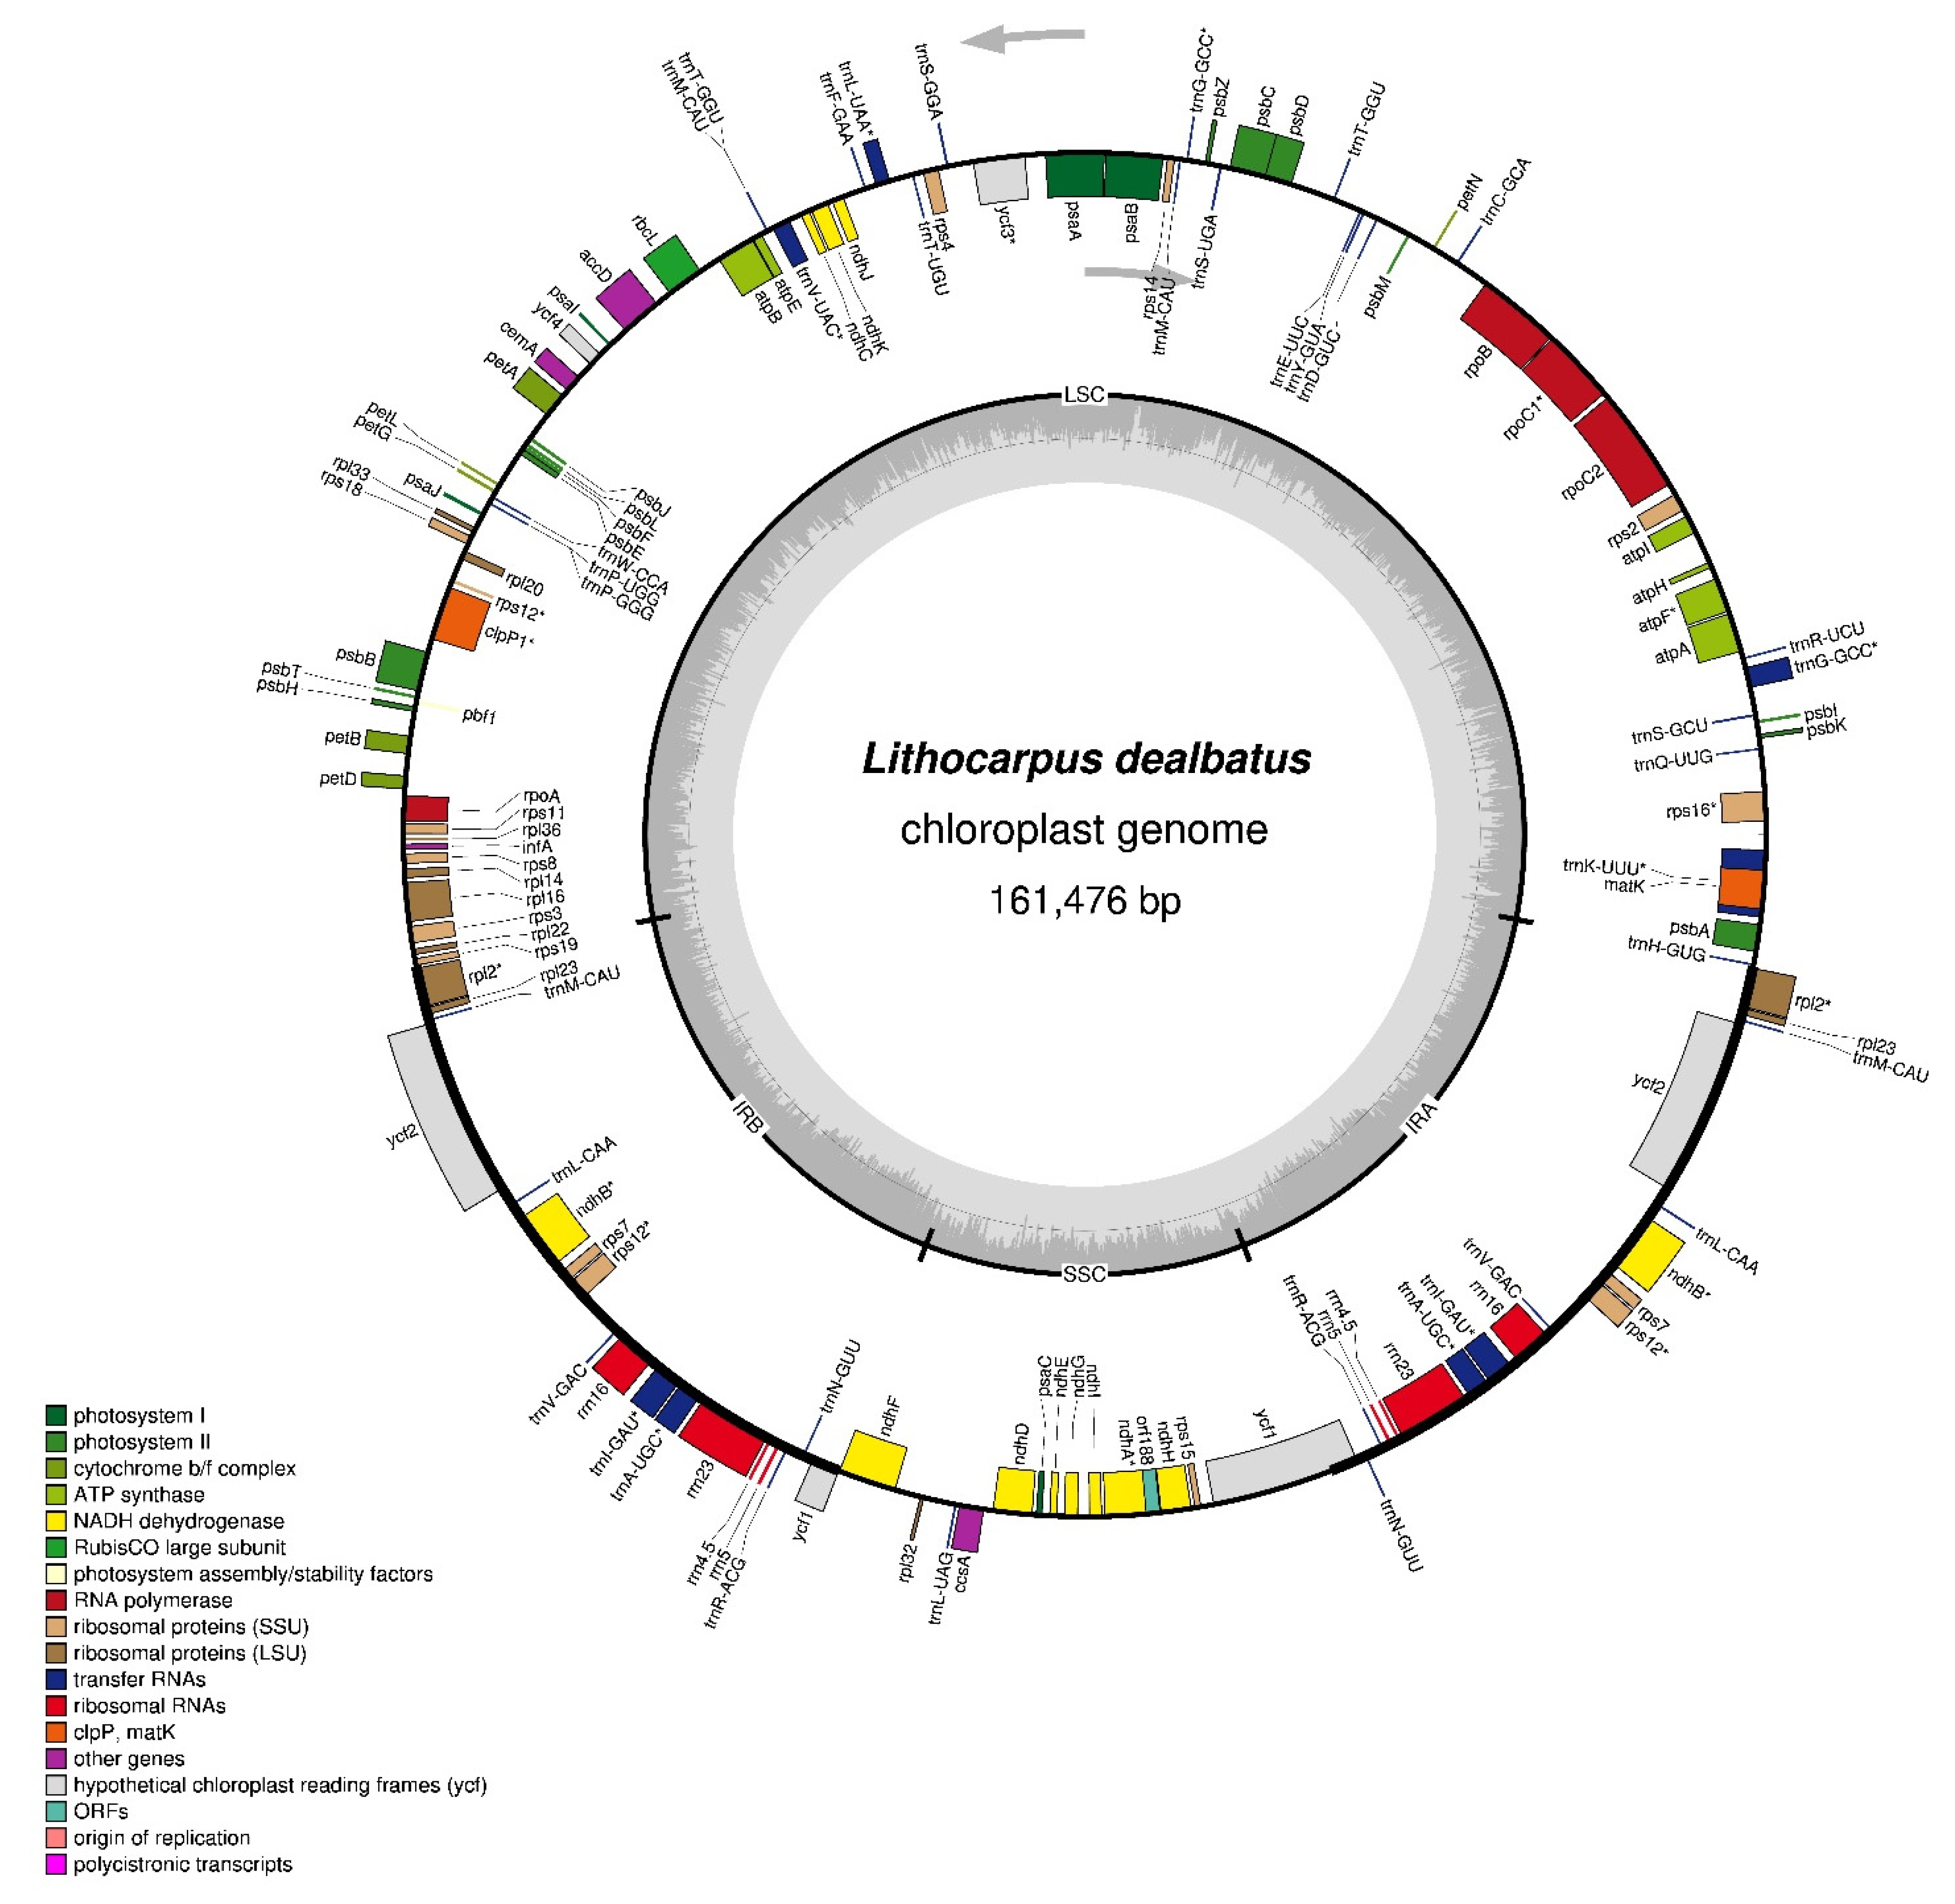
3.1.1. L. dealbatus Chloroplast-Genome Assembly and Architecture

About 47 Gb data with more than 156,718,852 adapter clean short PE reads were used for de novo chloroplast-genome assembly. The total length of the assembled L. dealbatus chloroplast genome was 161,476 bp with an average coverage of 1494× (Figure 1). The complete chloroplast genome exhibits a typical quadripartite structure, comprising a pair of IR (IRA and IRB) regions (25,879 bp) divided by an SSC region (18,987 bp) and an LSC region (90,732 bp). The overall GC content of the genome was 36.7%, while the GC content of LSC, SSC, and IR regions were 34.6%, 30.9%, and 42.7%, respectively.
Homology searched through the BLASTN program revealed a high sequence similarity of the L. dealbatus chloroplast genome with the L. hancei and L. balansae chloroplast genome. A high-quality chloroplast-genome sequence was finally submitted to the Genbank, NCBI database under the accession number MZ322408.

3.1.2. Chloroplast-Genome-Encoding Genes

The whole chloroplast genome of L. dealbatus encodes 133 genes, consisting of 86 protein-coding genes, 39 transfer RNA(tRNA), and 8 ribosomal RNA (rRNA) genes (Table 1). Among 133 genes, 8 protein-coding genes (ndhB, psbD, rpl2, rpl23, rps7, rps12, ycf1 and ycf2), 9 tRNA, and 4 RNA genes were duplicated in the genome (Table 2). Altogether, 13 protein-coding and 8 tRNA genes contained an intron, in which two genes (ycf3 and clpP) harboured a double intron. In addition, rps12 was identified as a trans-spliced gene in the genome. However, trnk-UUU has an intron encompassing the matK gene. Each of the IR regions harboured seven protein-coding genes, seven tRNA and four rRNAs.

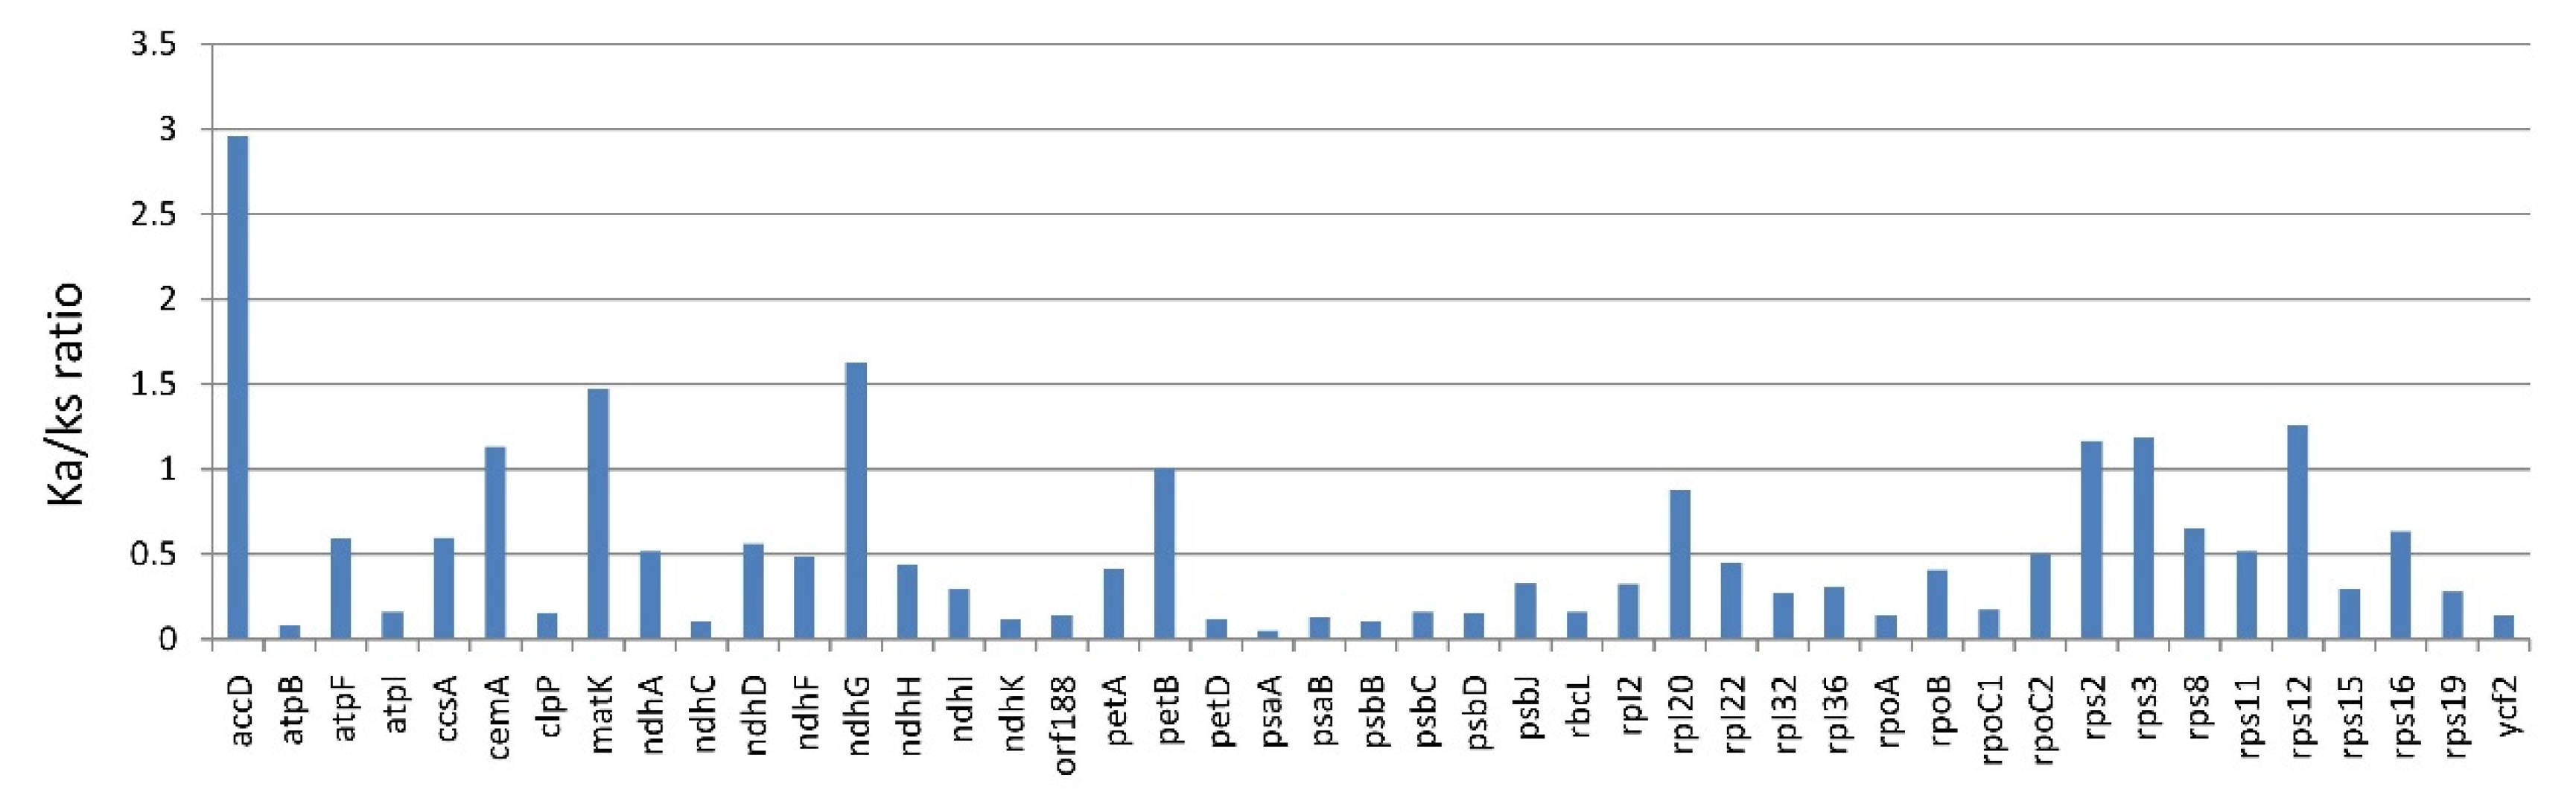
3.1.3. Substitution Rate of Protein-Coding Genes of Lithocarpus

The nonsynonymous substitution (Ka) to synonymous substitution (Ks) ratios were calculated to understand the evolutionary pressure on the protein-coding sequences. A total of 79 shared protein-coding genes across all three Lithocarpus chloroplast genomes were utilised to calculate Ka/Ks ratios (Figure 2). The current analysis shows that the Ka/Ks ratio for 34 genes was zero. However, 37 genes revealed a Ka/Ks ratio between the range of 0 and 1.0, which shows that these genes were under the purifying selection. The Ka/Ks ratios of eight genes (accD, cemA, matK, ndhG, petB, rps2, rps3 and rps12) were greater than 1, indicating the positive selection acting on protein-coding genes. The average Ka/Ks ratio for 45 genes was 0.52.

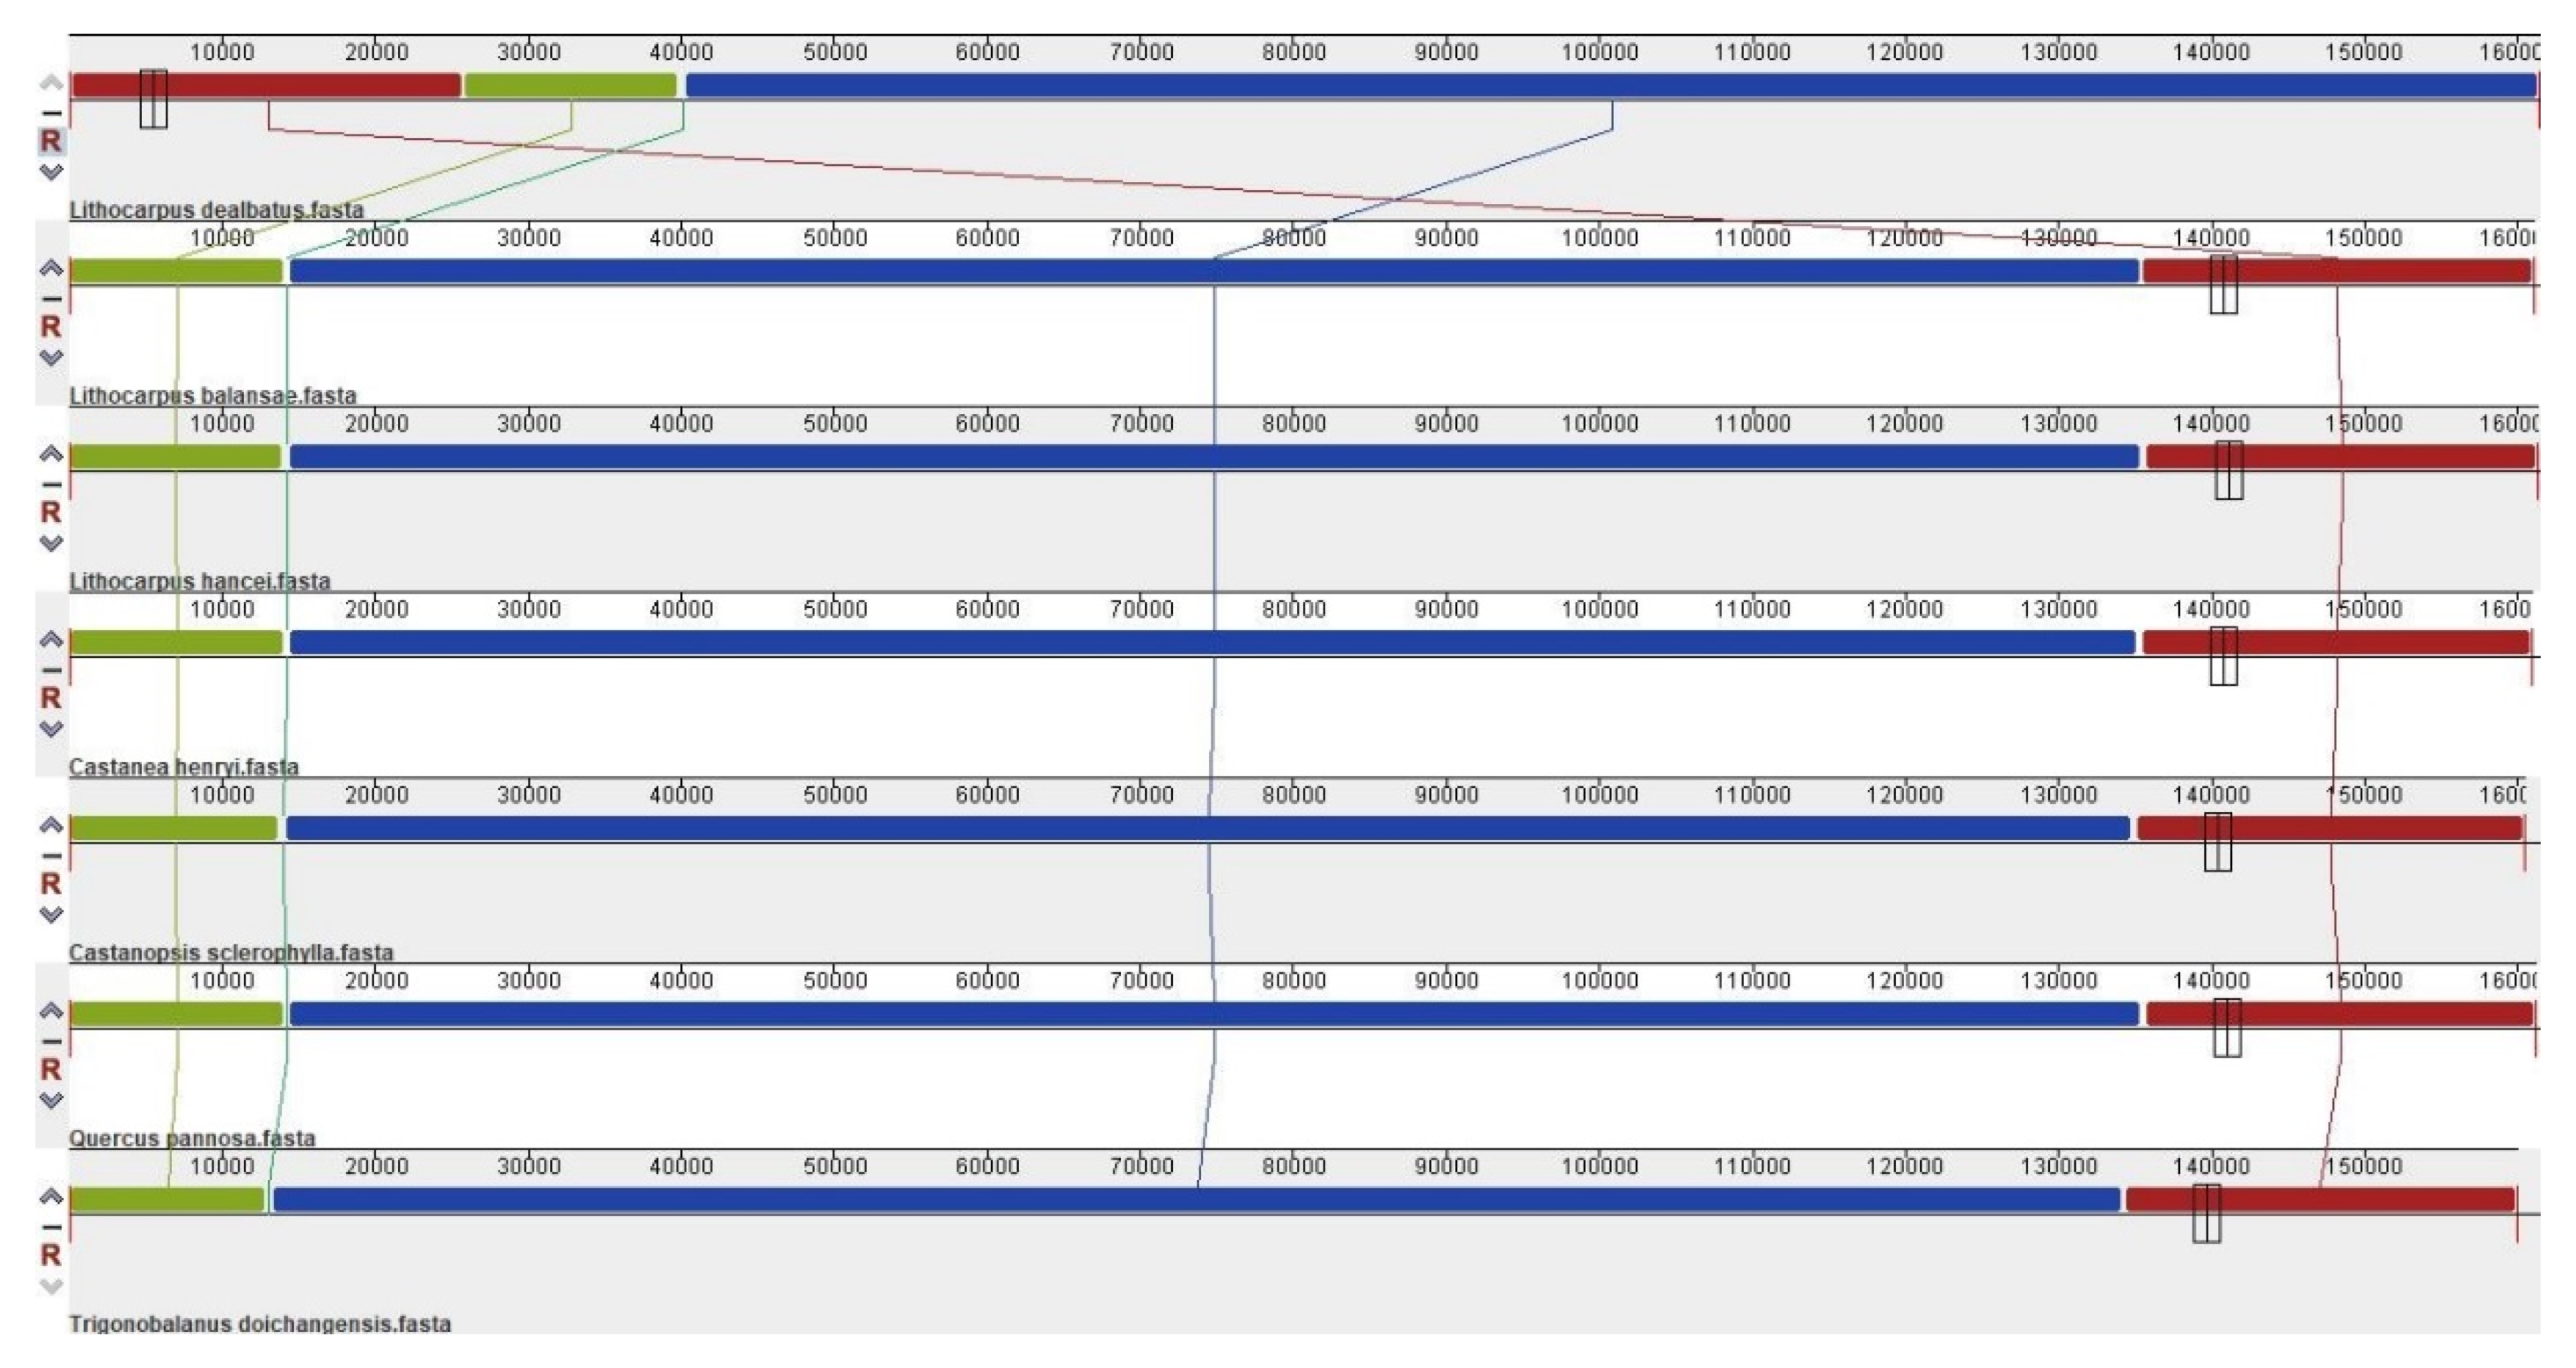
3.2. Comparative Chloroplast Genomes in Quercoideae

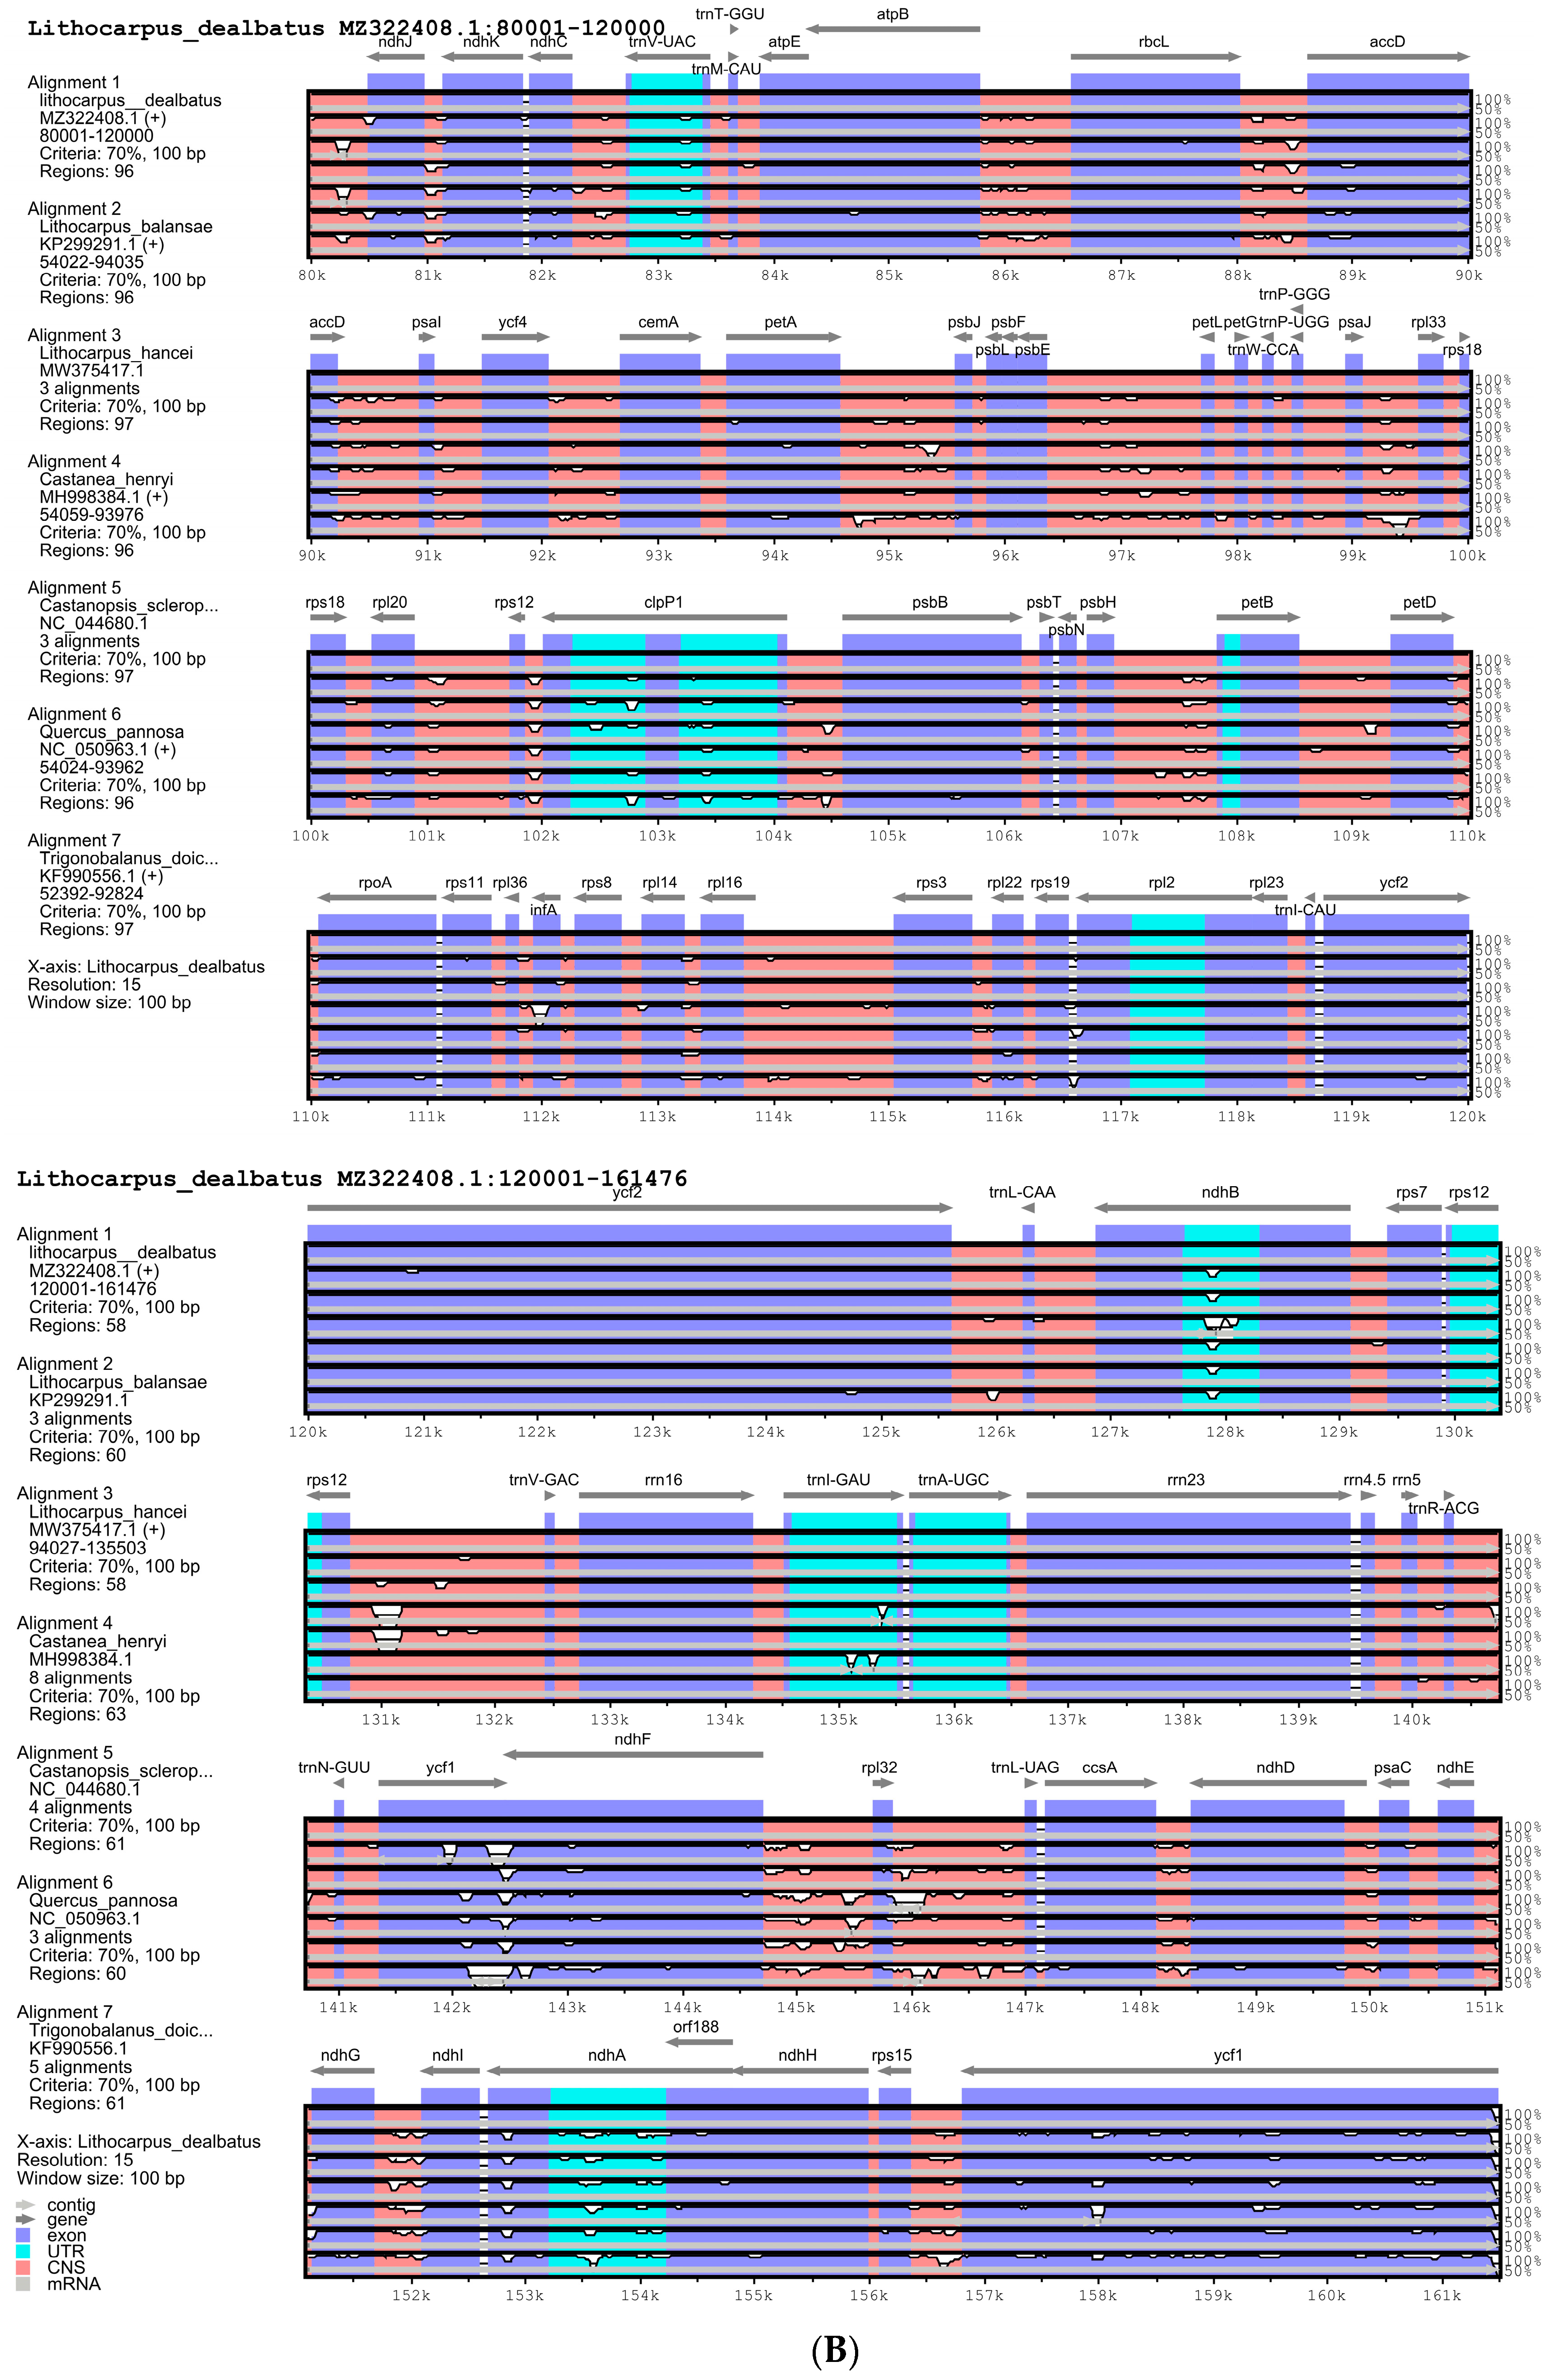
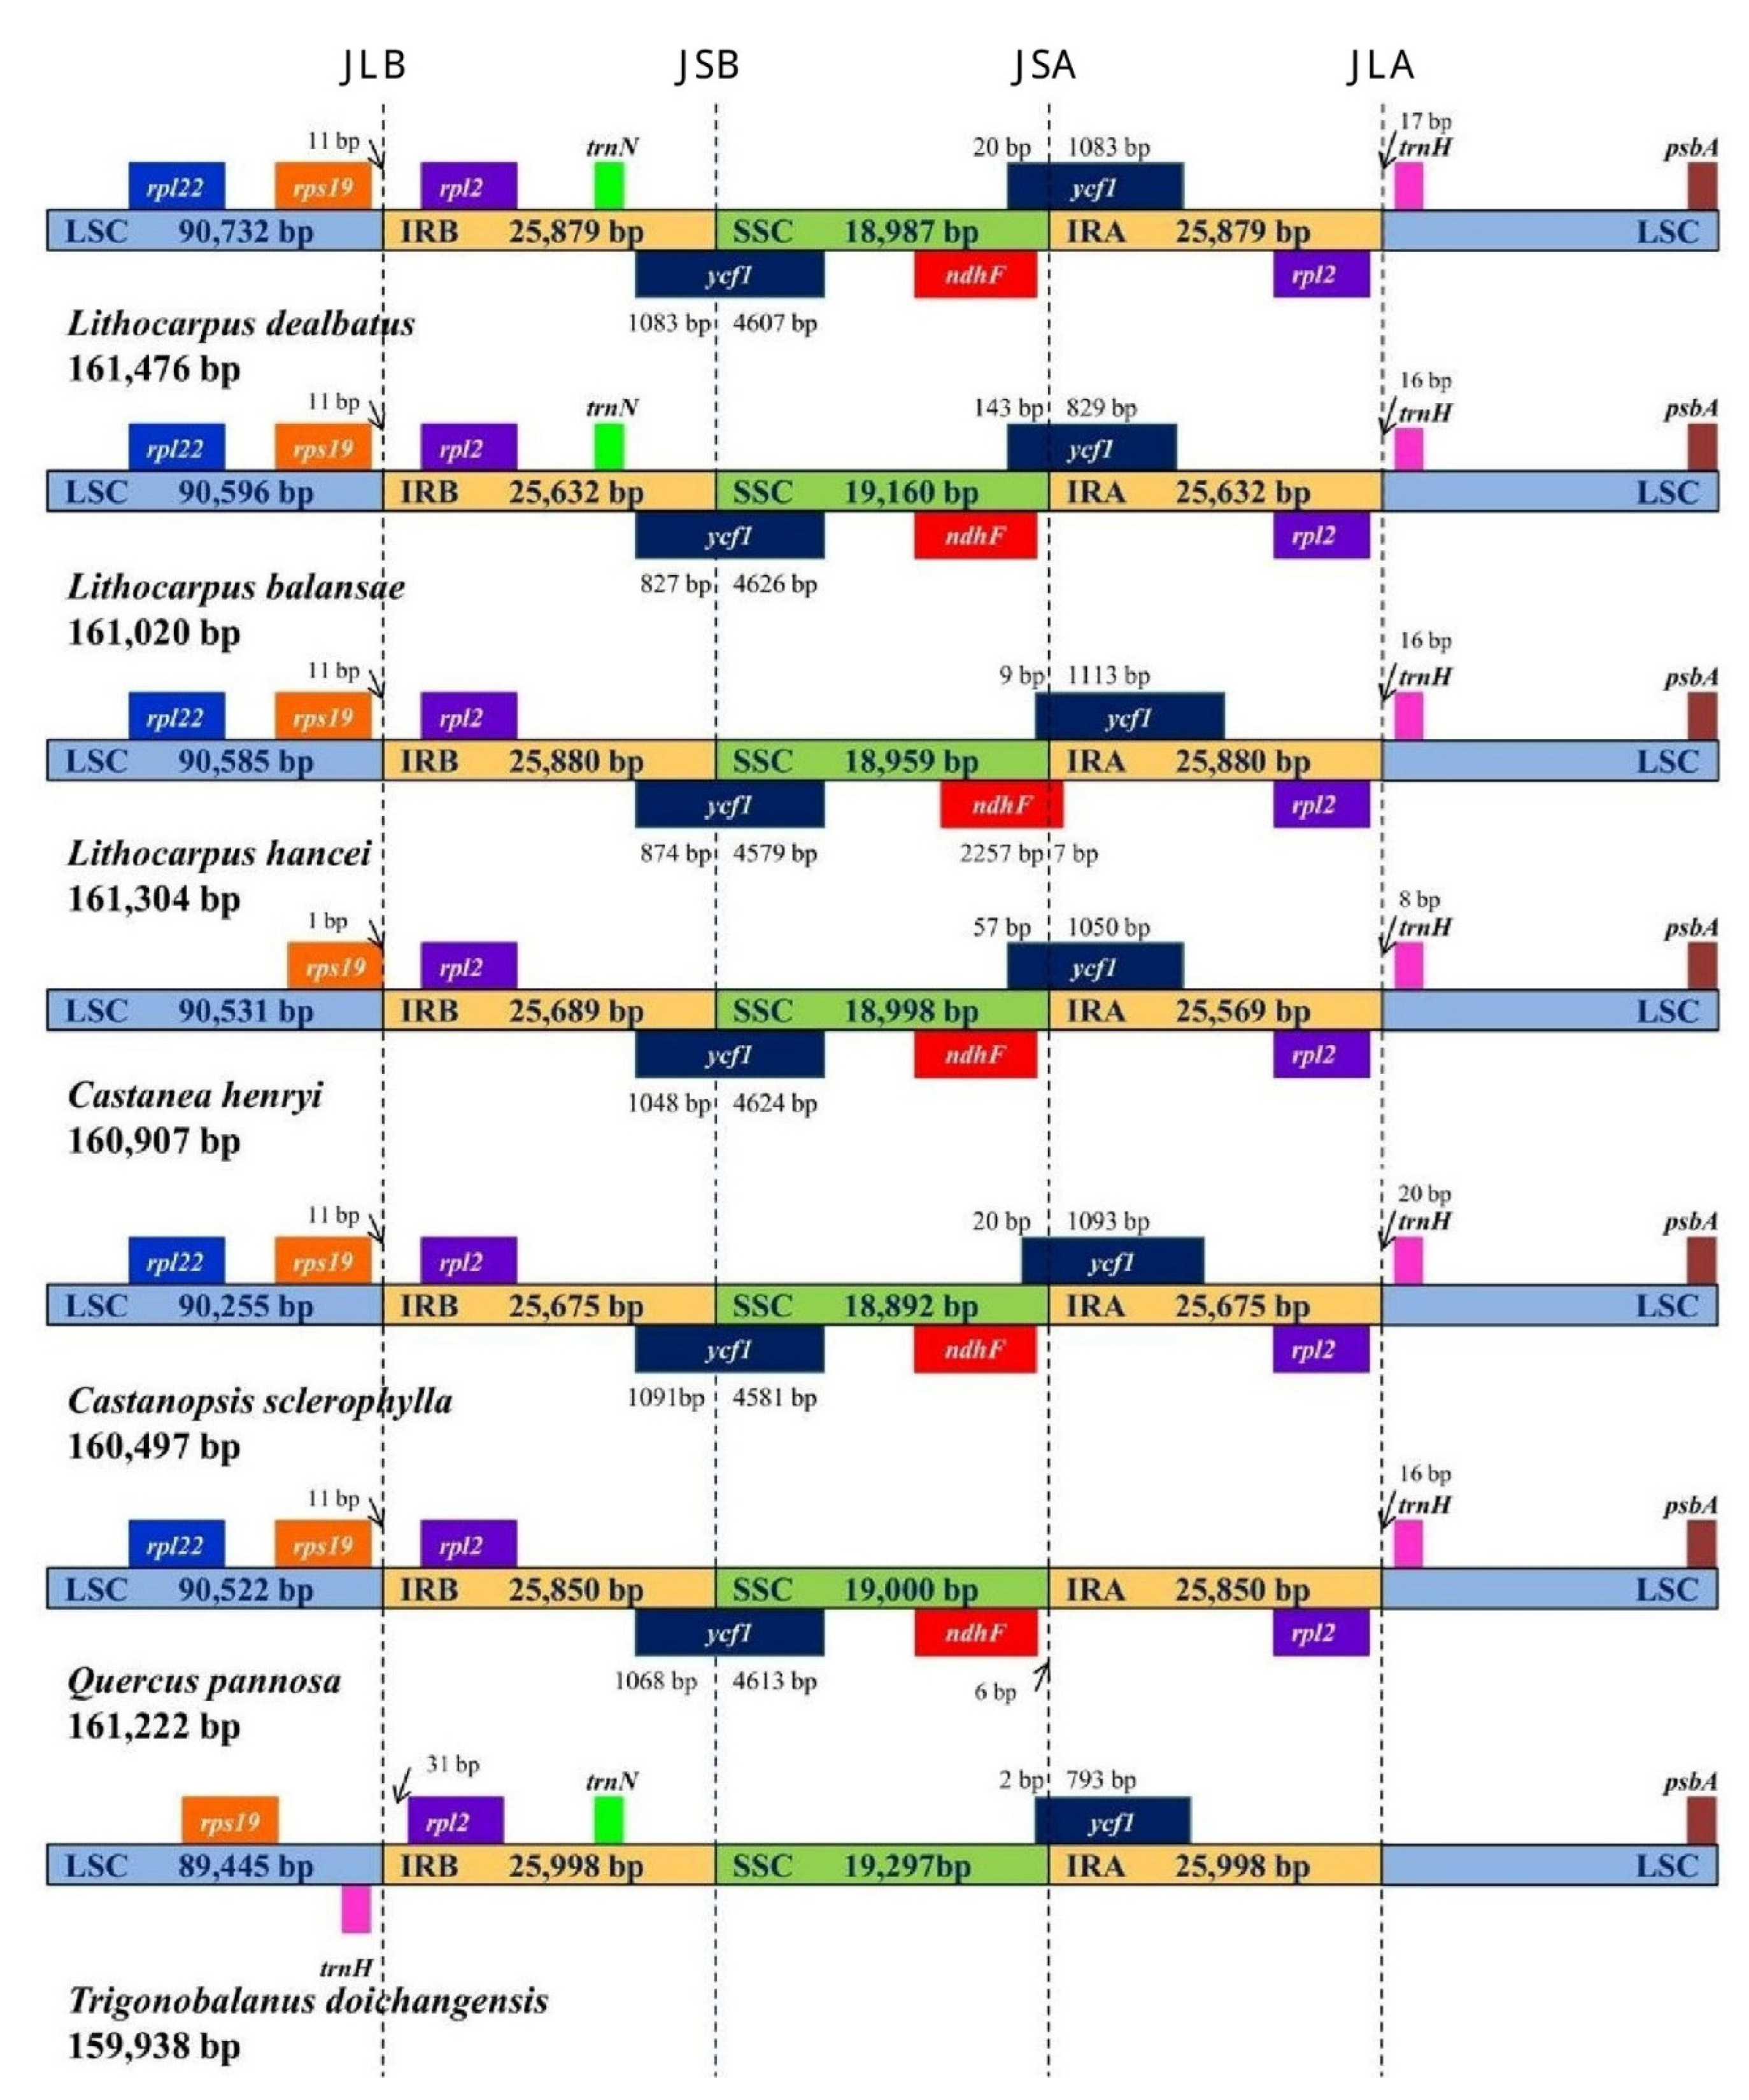
3.2.1. Comparison of Quercoideae Chloroplast Genomes

Four locally collinear blocks were identified in L. dealbatus and the six other previously published Quercoideae members using the multiple-genome-alignment tool MAUVE (Figure 3). Overall, the synteny of the gene order was similar in all genomes, except for an inversion of about 275 bp in the LSC region of T. doichangensis (Figure S1). The inversion explicitly occurred in the intronic region of the atpF gene. The mVista genome alignment showed that the genic regions were mostly conserved, with a few exceptions (Figure 4). Overall, the Lithocarpus genome showed a higher level of nucleotide identity than that of Castanea, Castanopsis, and Quercus. In the present investigation, the ycf1 gene revealed significant variation among the seven compared genomes. Intronic regions revealed a greater level of divergence comparison to the un-translated region (UTR) and genic regions.
The variation in size of chloroplast genomes is often due to the expansion and contraction of IR junctions in higher plants. Hence, we analysed and compared the location of the IR border and their adjacent genes among the seven studied chloroplast genomes (Figure 5). In L. dealbatus, the ycf1 gene was detected at IRB/SSC junction with 4607 bp inside SSC and 1083 bp inside the IRB region. On the other hand, the other partially duplicated copy of the ycf1 gene was found at IRA/SSC junction with 1083 bp inside IRA and 20 bp inside the SSC region. A similar trend was observed in all the compared genomes except in Q. pannosa and T. doichangensis, where ycf1 was missing at IRA/SSC or IRB/SSC junctions. The size of the ycf1 gene in L. dealbatus was in the range of 1103 bp to 5690 bp, while it was 795 bp in T. doichangensis and 5681 bp in Q. pannosa genome. The ndhF gene was positioned near the IRA/SSC region in the compared genomes, except in T. doichangensis. The ycf1 gene overlapped with ndhF gene at IRA/SSC junctions in three genomes, viz., L. hancei, Castanopsis sclerophylla, and Castanea henryi. Two genes, namely rps19 and rpl2, were spotted completely inside the LSC and IRB regions on either side of the IRB/LSC junction. Another duplicated copy of the rpl2 gene was situated entirely inside the IRA region and was absent in T. doichangensis. We observed the position of the trnH gene within LSC region in all of the seven compared genomes.

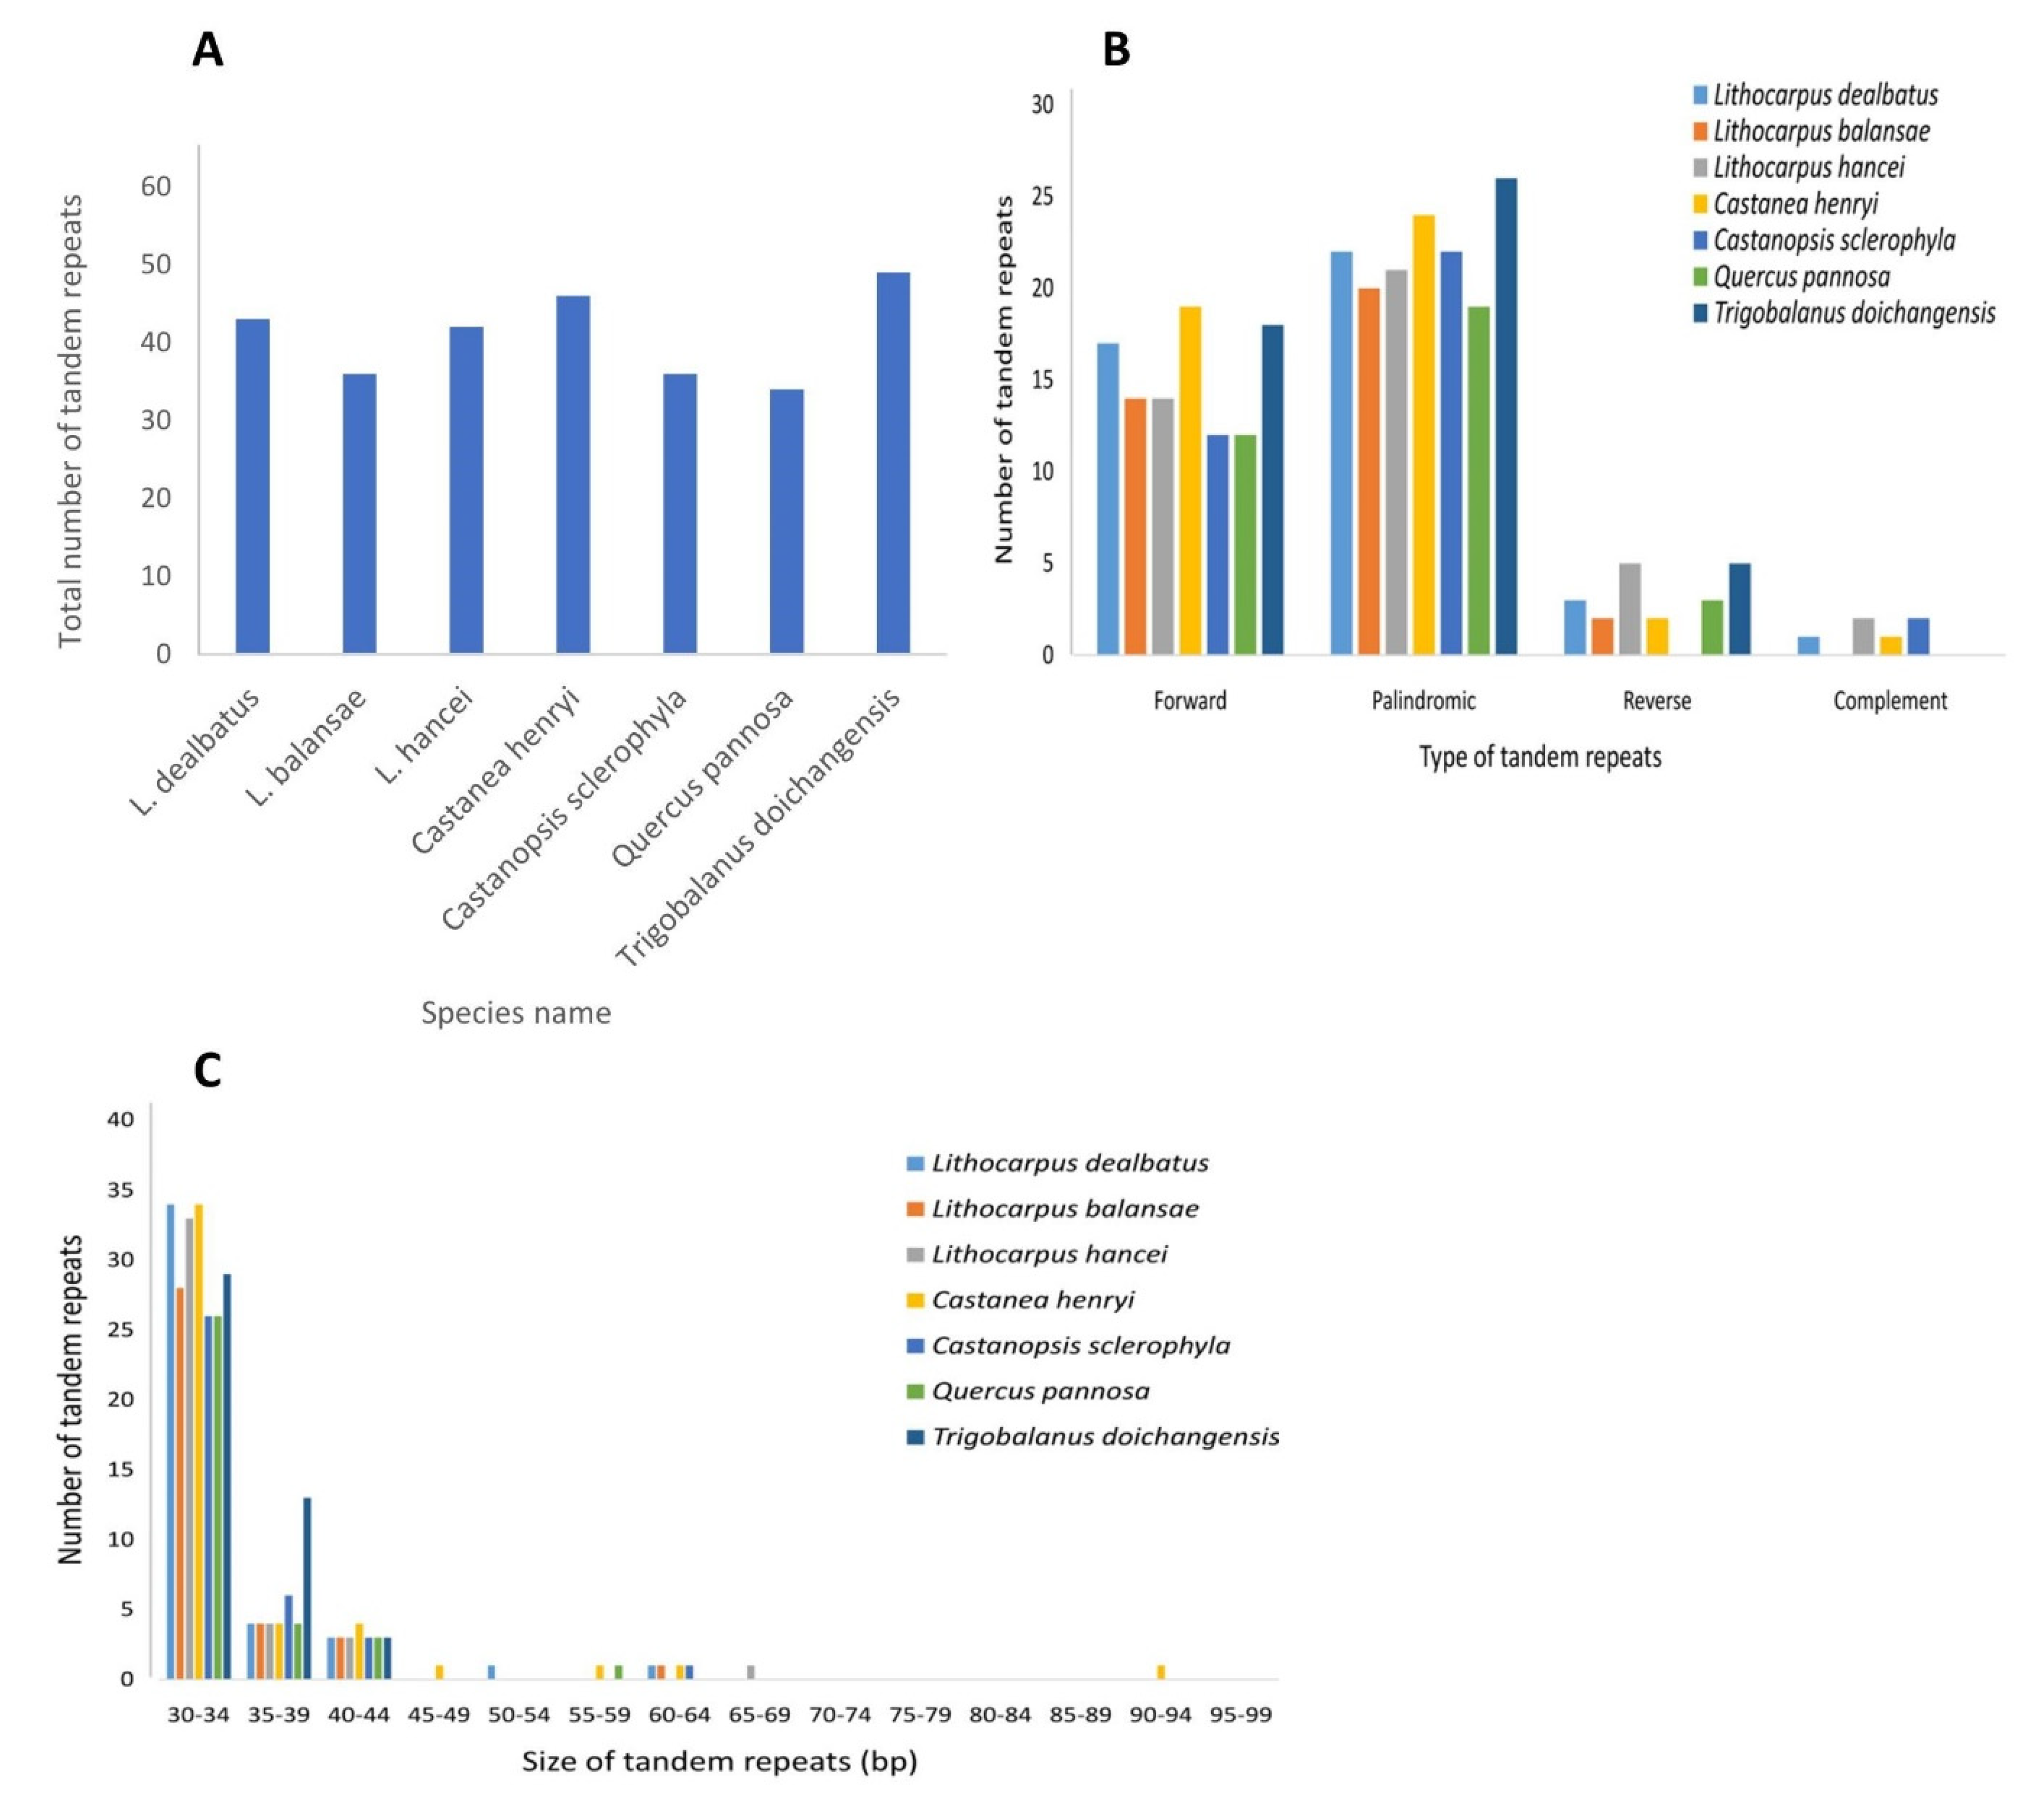
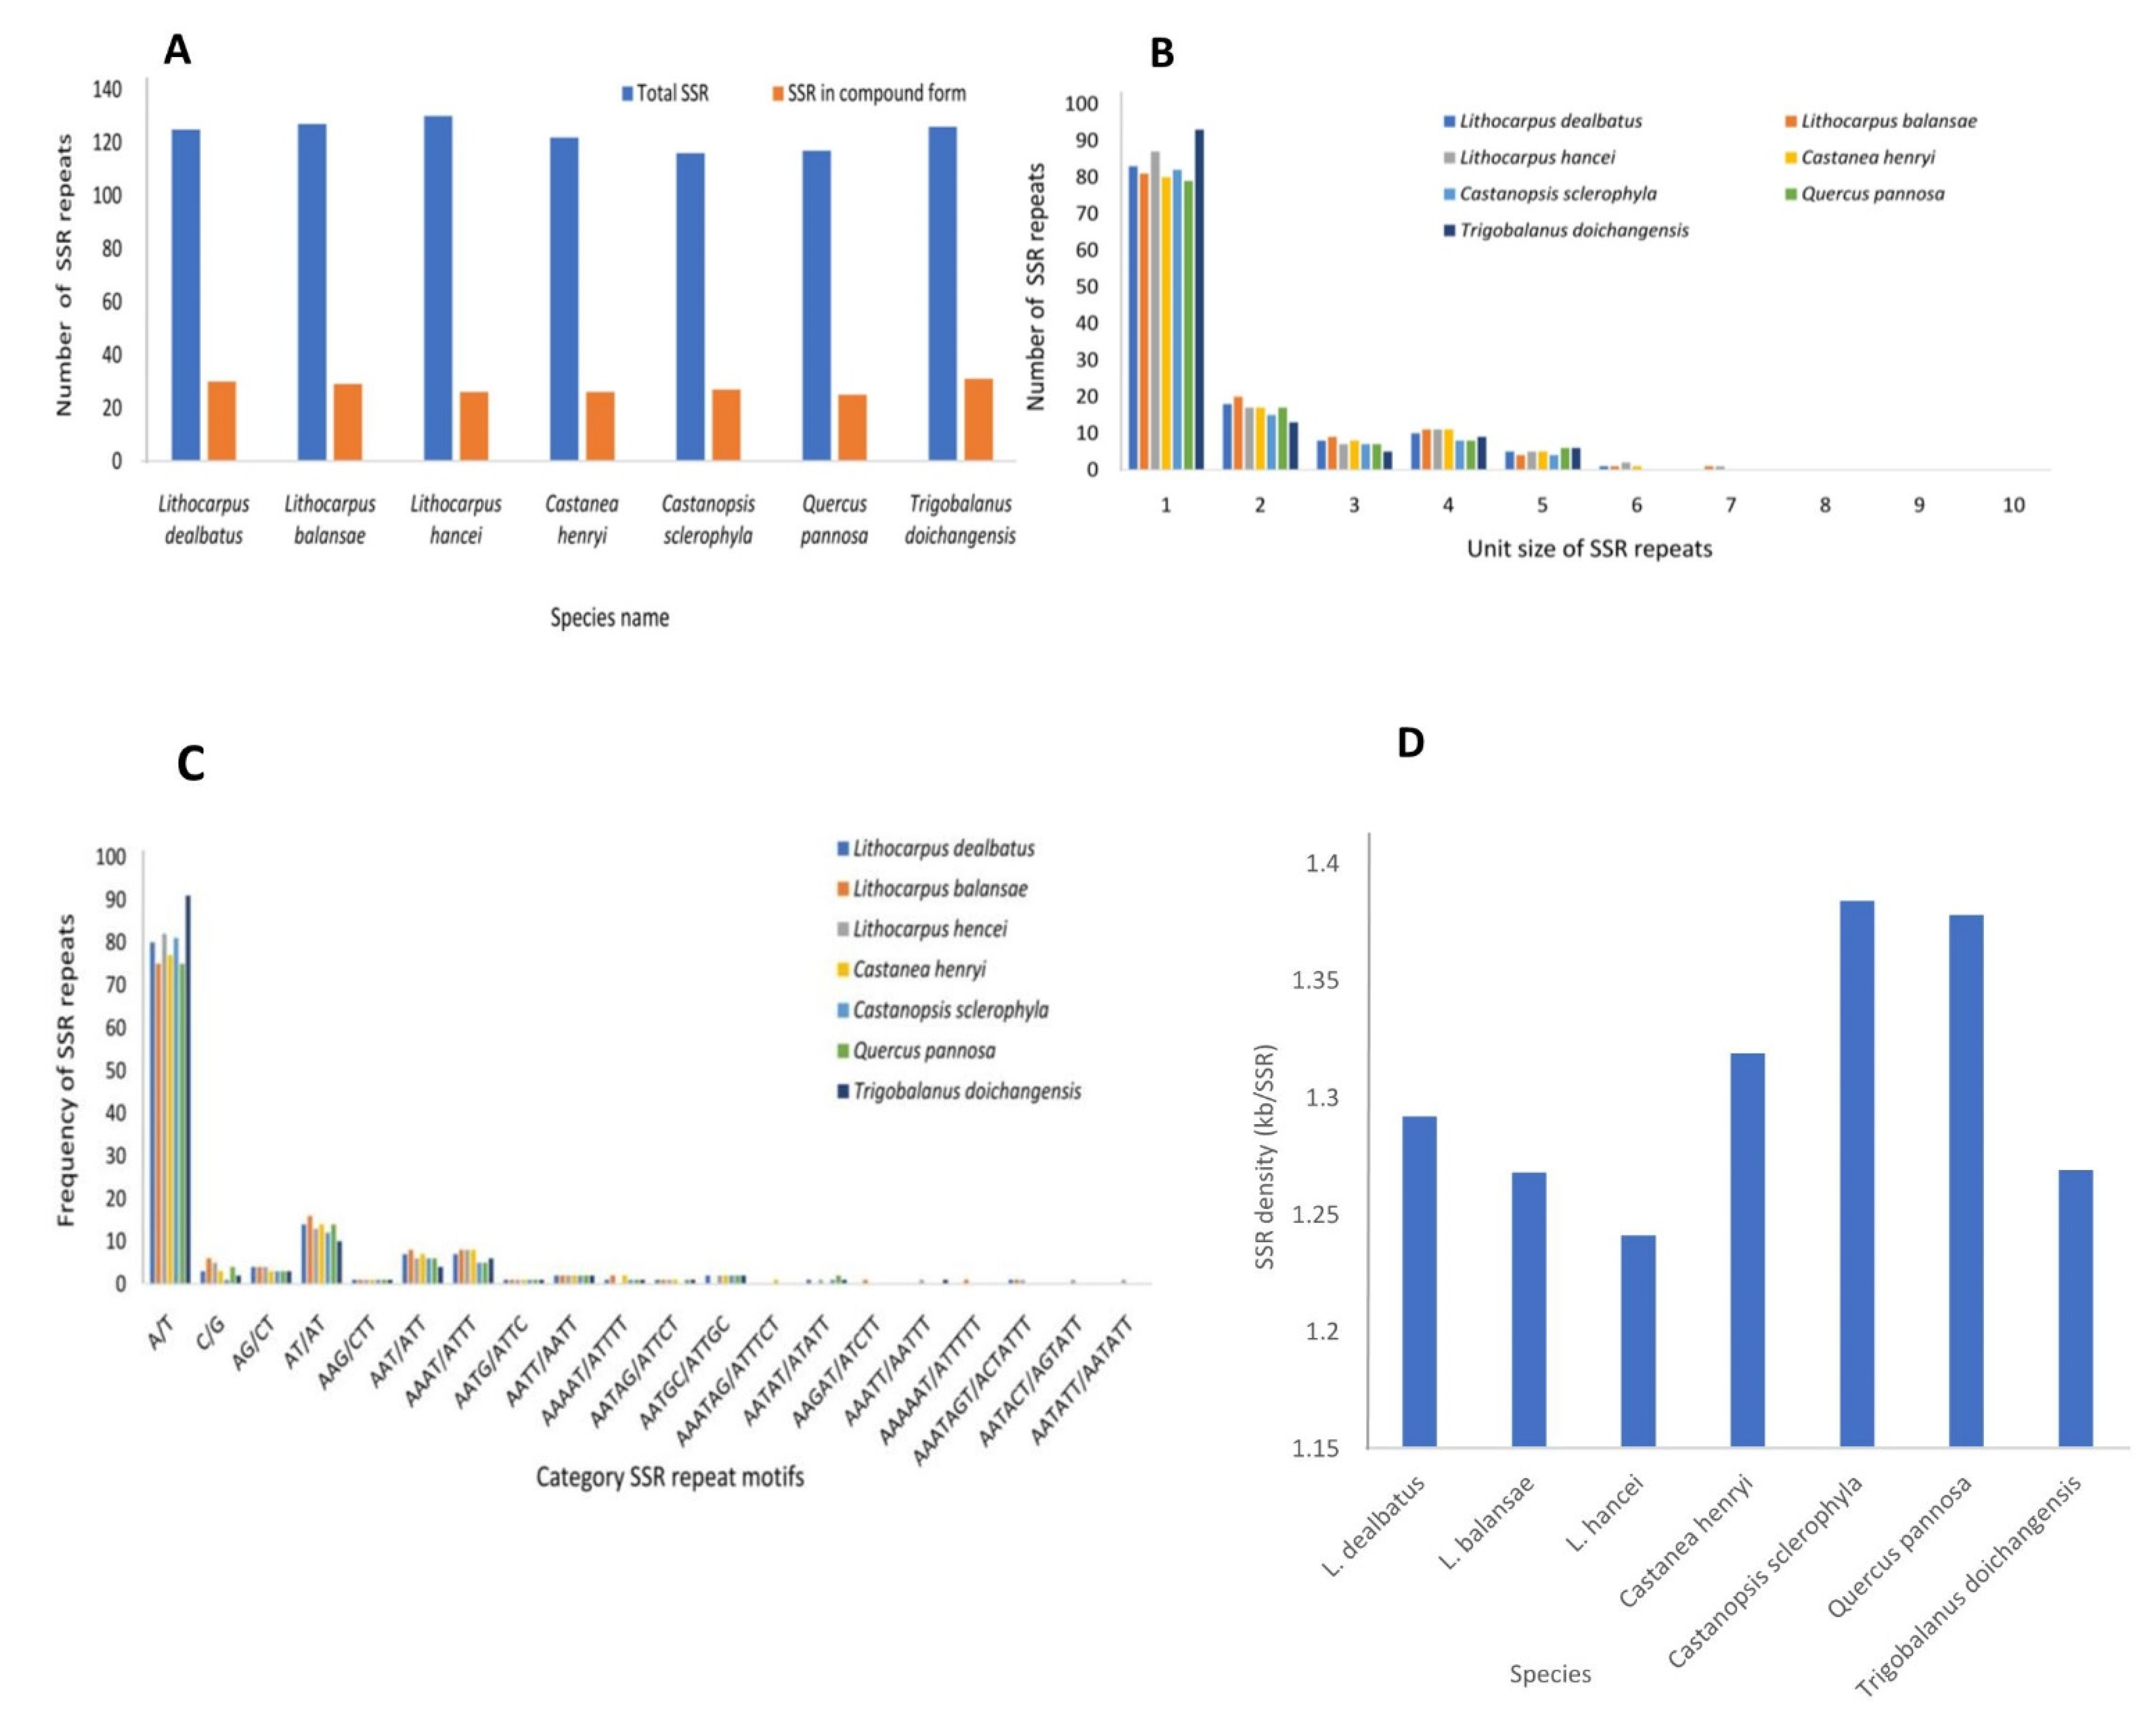
3.2.2. Repeat Sequences and Its Comparative Analysis

The chloroplast genome of L. dealbatus comprised 43 repeat elements, of which 17 were forward, 22 were palindromic, 3 were reverse, and 1 was a complement repeat (Figure 6A,B). Overall, the total number of tandem repeats varied between 34 in Q. pannosa and 49 in T. doichangensis (Figure 6A). Comparative analysis of tandem repeats in seven studied genomes revealed that most repeats belonged to palindromic type, having maximum repeats in T. doichangensis (26) and minimum in Q. pannosa (19) (Figure 6B). Followed by palindromic type, the forward repeats had the highest number in C. henryi (19) and lowest in C. sclerophylla and Q. pannosa, each with 12 repeats. The reverse repeats were absent in C. sclerophylla, while these were highest in L. hancei and T. doichangensis (5 each). Similarly, a small number of complement repeats were observed in L. hancei (2), C. henryi (1) and C. sclerophylla (2), and it was absent in L. balansae, Q. pannosa and T. doichangensis. The maximum number of repeats had 30–34 bp, while only a few had 45–64 bp (Figure 6C).
We mined 125 simple and 30 compound SSRs in the chloroplast genome of L. dealbatus (Figure 7A). Among 125 simple SSRs, 83 were mononucleotides (66.4%), 18 were di-nucleotides (14.4%), 8 were tri-nucleotides (6.4%), 10 were tetra-nucleotides (8%), 5 were penta-nucleotides (4%), and only 1 was a hexa-nucleotide (0.8%) (Figure 7B). Comparative analysis of SSRs among the studied species revealed that L. balansae, L. hancei, C. henryi, C. sclerophylla, Q. pannosa, and T. doichangensis contained a total of 127, 130, 122, 116, 117, and 126 SSRs, respectively.
The highest percentage of mononucleotide SSRs was in T. doichangensis (73.8%), followed by C. sclerophylla (70.6%), and the least was in L. balansae (63.7%). Similarly, the percentage of dinucleotide SSRs was maximum in L. balansae (15.7%), and minimum in T. doichangensis (10.3%). The most abundant mononucleotide SSRs had A/T repeat motifs and C/G repeat motifs were rare. The highest number of A/T rich repeats was in T. doichangensis (91), followed by L. hancei (82), and the least was recorded in L. balansae and Q. pannosa with 75 repeats each. Similarly, the dinucleotide repeats were rich in AT/AT compared to AG/CT and were highest in L. balansae (16) and lowest in T. doichangensis (10) (Figure 7C). SSR density was relatively greater in C. sclerophylla and Q. pannosa (~1.4 kb/SSR) than that of the other species. The least SSR density was recorded in L. hancei (~1.23 kb/SSR) (Figure 7D).

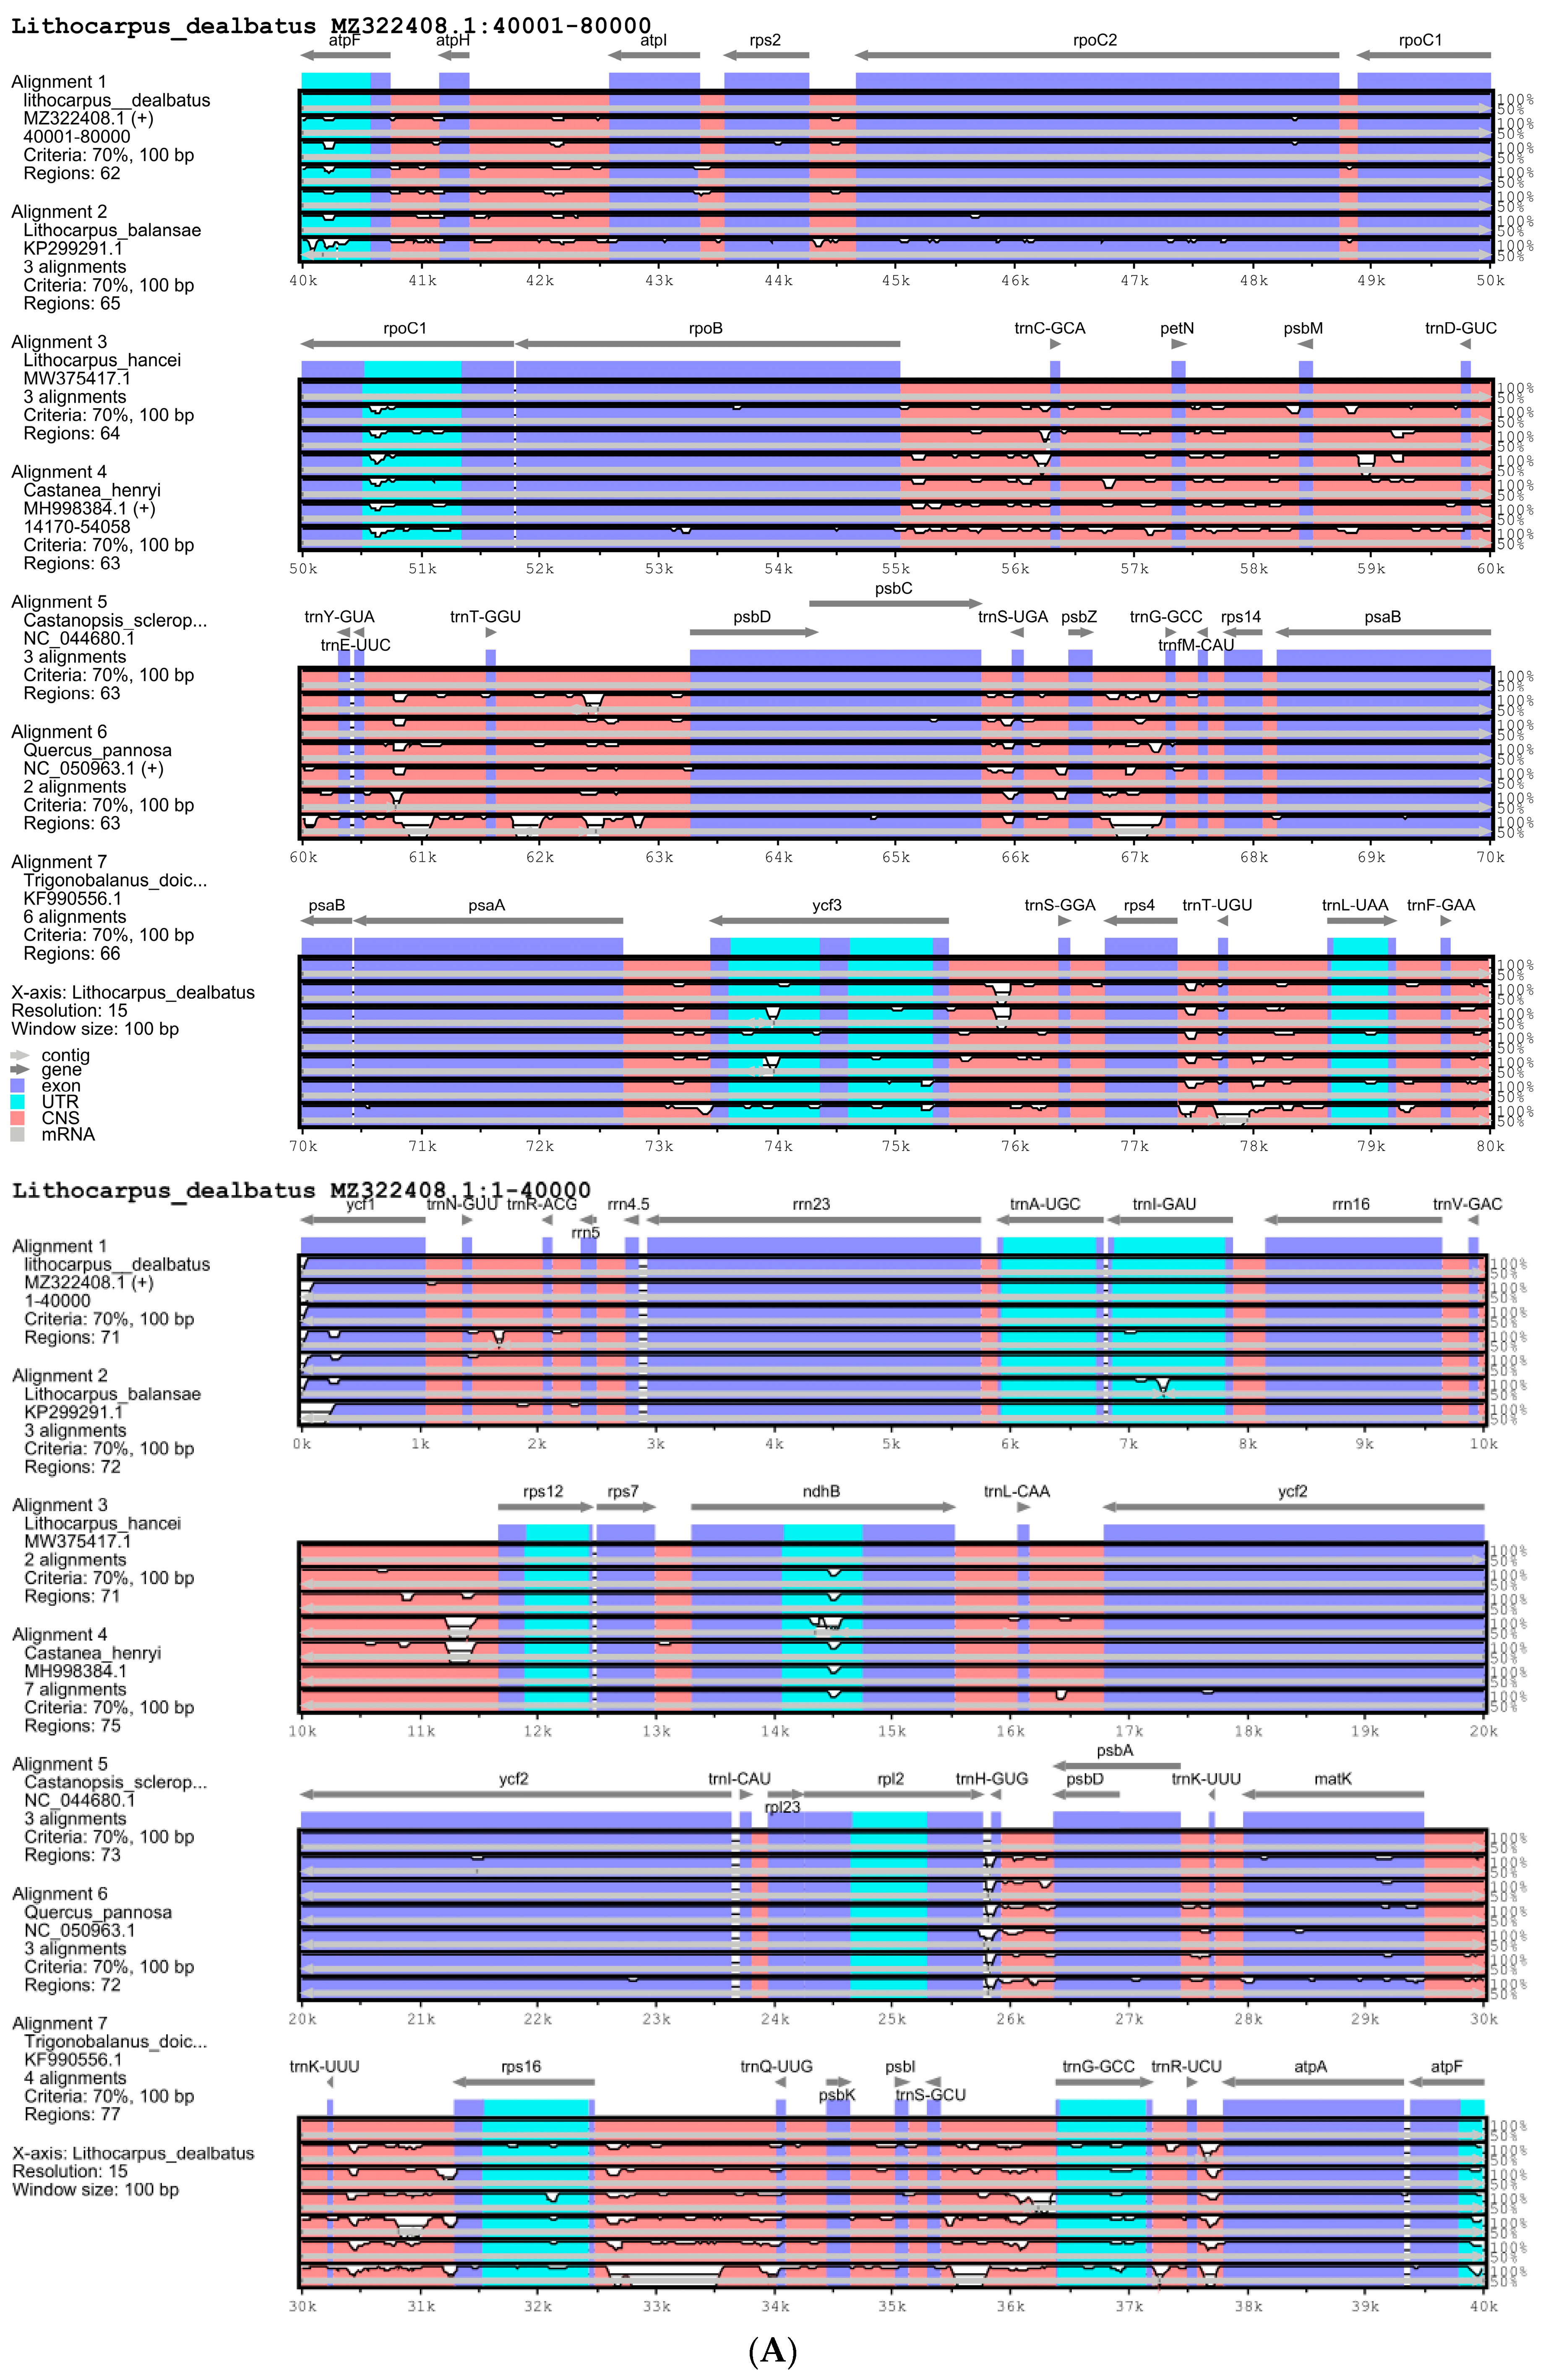
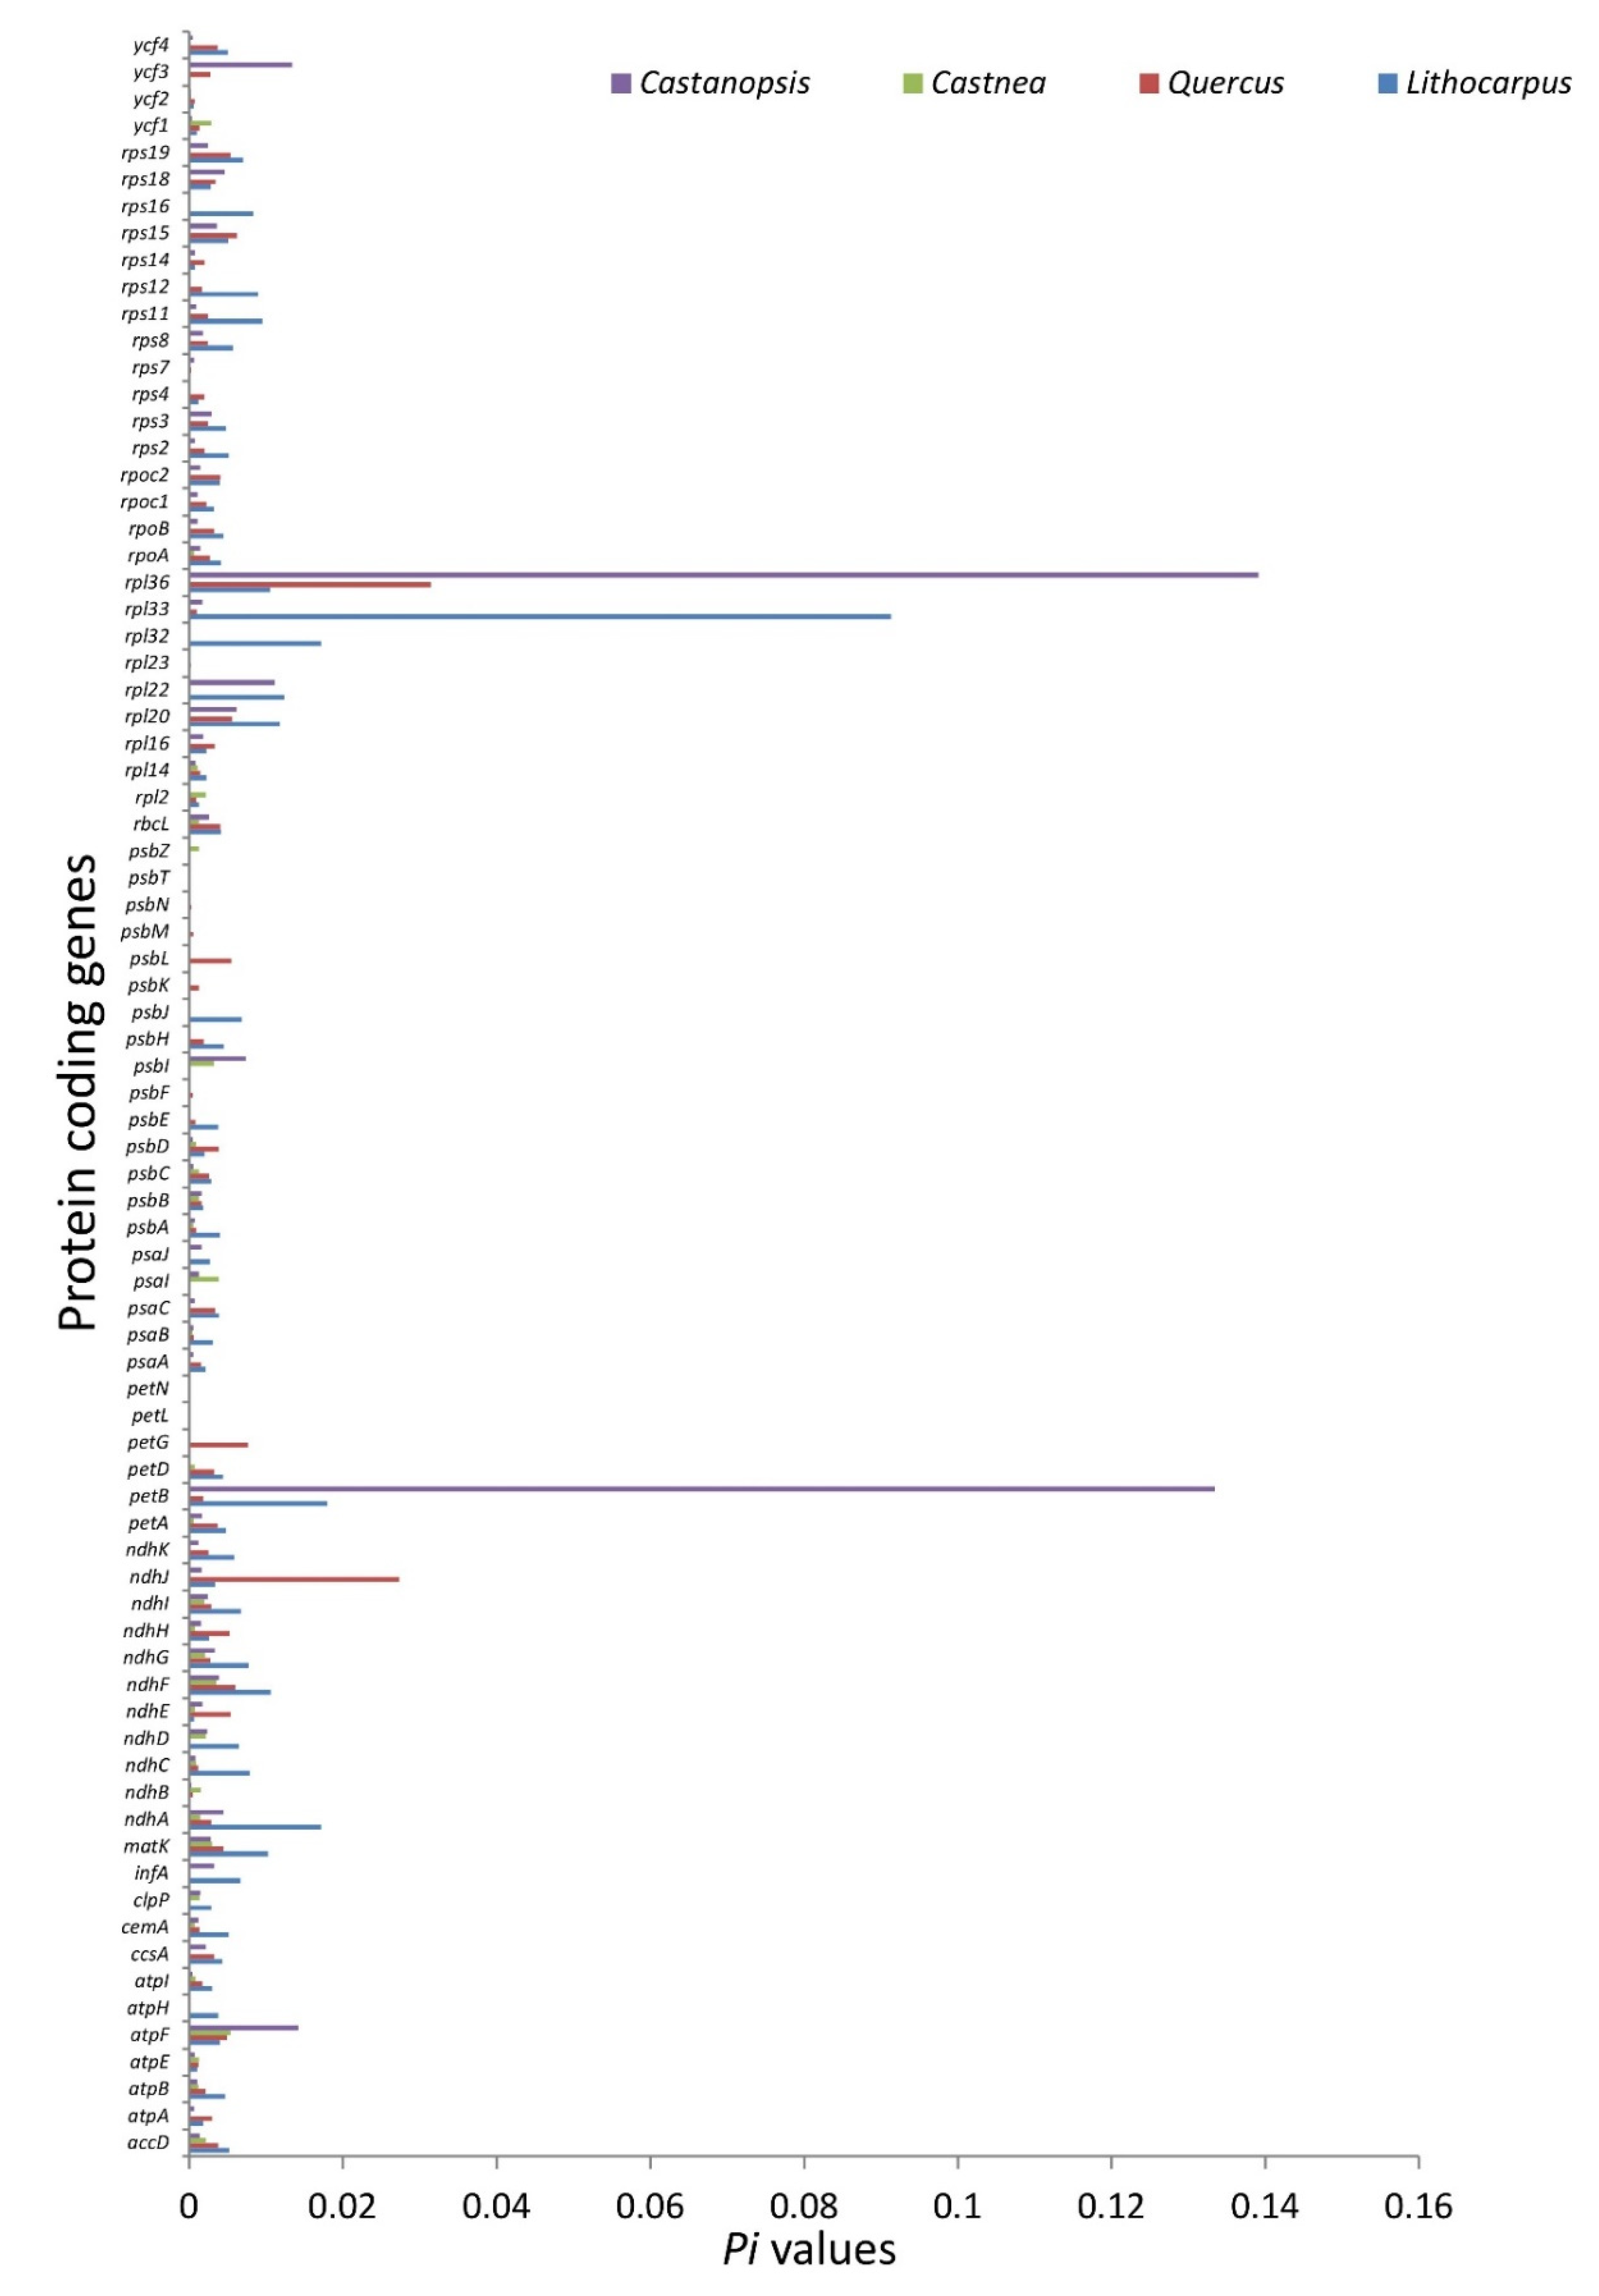
3.2.3. Nucleotide Diversity and Mutational Hotspots

Comparative analysis of the nucleotide variation in coding and noncoding regions was carried out to identify the hotspot regions in Lithocarpus, Quercus, Castanea, and Castanopsis chloroplast genomes. We found high divergence in noncoding regions than the protein-coding regions. The nucleotide diversity (Pi) for protein-coding regions ranged from 0.00059 (ycf2) to 0.09132 (rpl33) for Lithocarpus (Figure 8), while for Quercus it ranged from 0.0002 (rpl23) to 0.03146 (rpl36), in Castanea it ranged from 0.000256 to 0.00533, and in Castanopsis it ranged from 0.000175 to 0.13913 (Figure 8). Castanopsis had the highest average nucleotide diversity (0.006989) for protein-coding genes, followed by Lithocarpus (0.0066), Quercus (0.0034), and Castanea (0.001617). We observed five highly diverged coding regions in each member of Quercoideae, such as rpl33, petB, rpl32, ndhA, and rpl22 in Lithocarpus; rp136, ndhJ, petG, rps15, and ndhF in Quercus; atpF, psaI, ndhF, psbI, and matK in Castanea; and rpl36, petB, atpF, ycf3, and rpl22 in Castanopsis. However, across the four studied members of Quercoideae, the coding loci such as rpl36, rpl33, ndhJ, atpF, and ndhA were highly diverged.
The nucleotide diversity (Pi) on the other hand for noncoding regions ranged between 0.000278 (ycf2_trnL-CAA) and 0.04390 (trnH-GUG_psbA) for Lithocarpus (Figure S2A), 0.000536 (ndhB_rps7) and 0.013736 (petA_psbJ) for Quercus (Figure S2B), 0.000605 (ycf4_cemA) and 0.028562 (trnH_GUG_psbA) for Castanea (Figure S2C), and 0.000691 (ndhG_ndhI) and 0.027903 (rbcL_accD) for Castanopsis (Figure S2D). Overall, Lithocarpus had the greatest average nucleotide diversity (0.009315) of noncoding regions, followed by Castanopsis (0.006118), Quercus (0.005901), and Castanea (0.005159). The highly diverged noncoding regions such as trnH-GUG_psbA, rbcl_accD, cssA_ndhD, trnF-GAA_psbA, and psbK_psbI were found in Lithocarpus, followed by Quercus (petA_psbJ, atpF_atpH, psaC_ndhE, ycf4_cemA and atpI_rps2), Castanea (ndhG_ndhI, rbcL_accD, psbC_trnS_UGA, ccsA_ndhD and psaJ_rpI33), and Castanopsis (rbcL_accD, ccsA_ndhD, psbK_psbI, psaJ_rpl33 and psaI_ycf4).

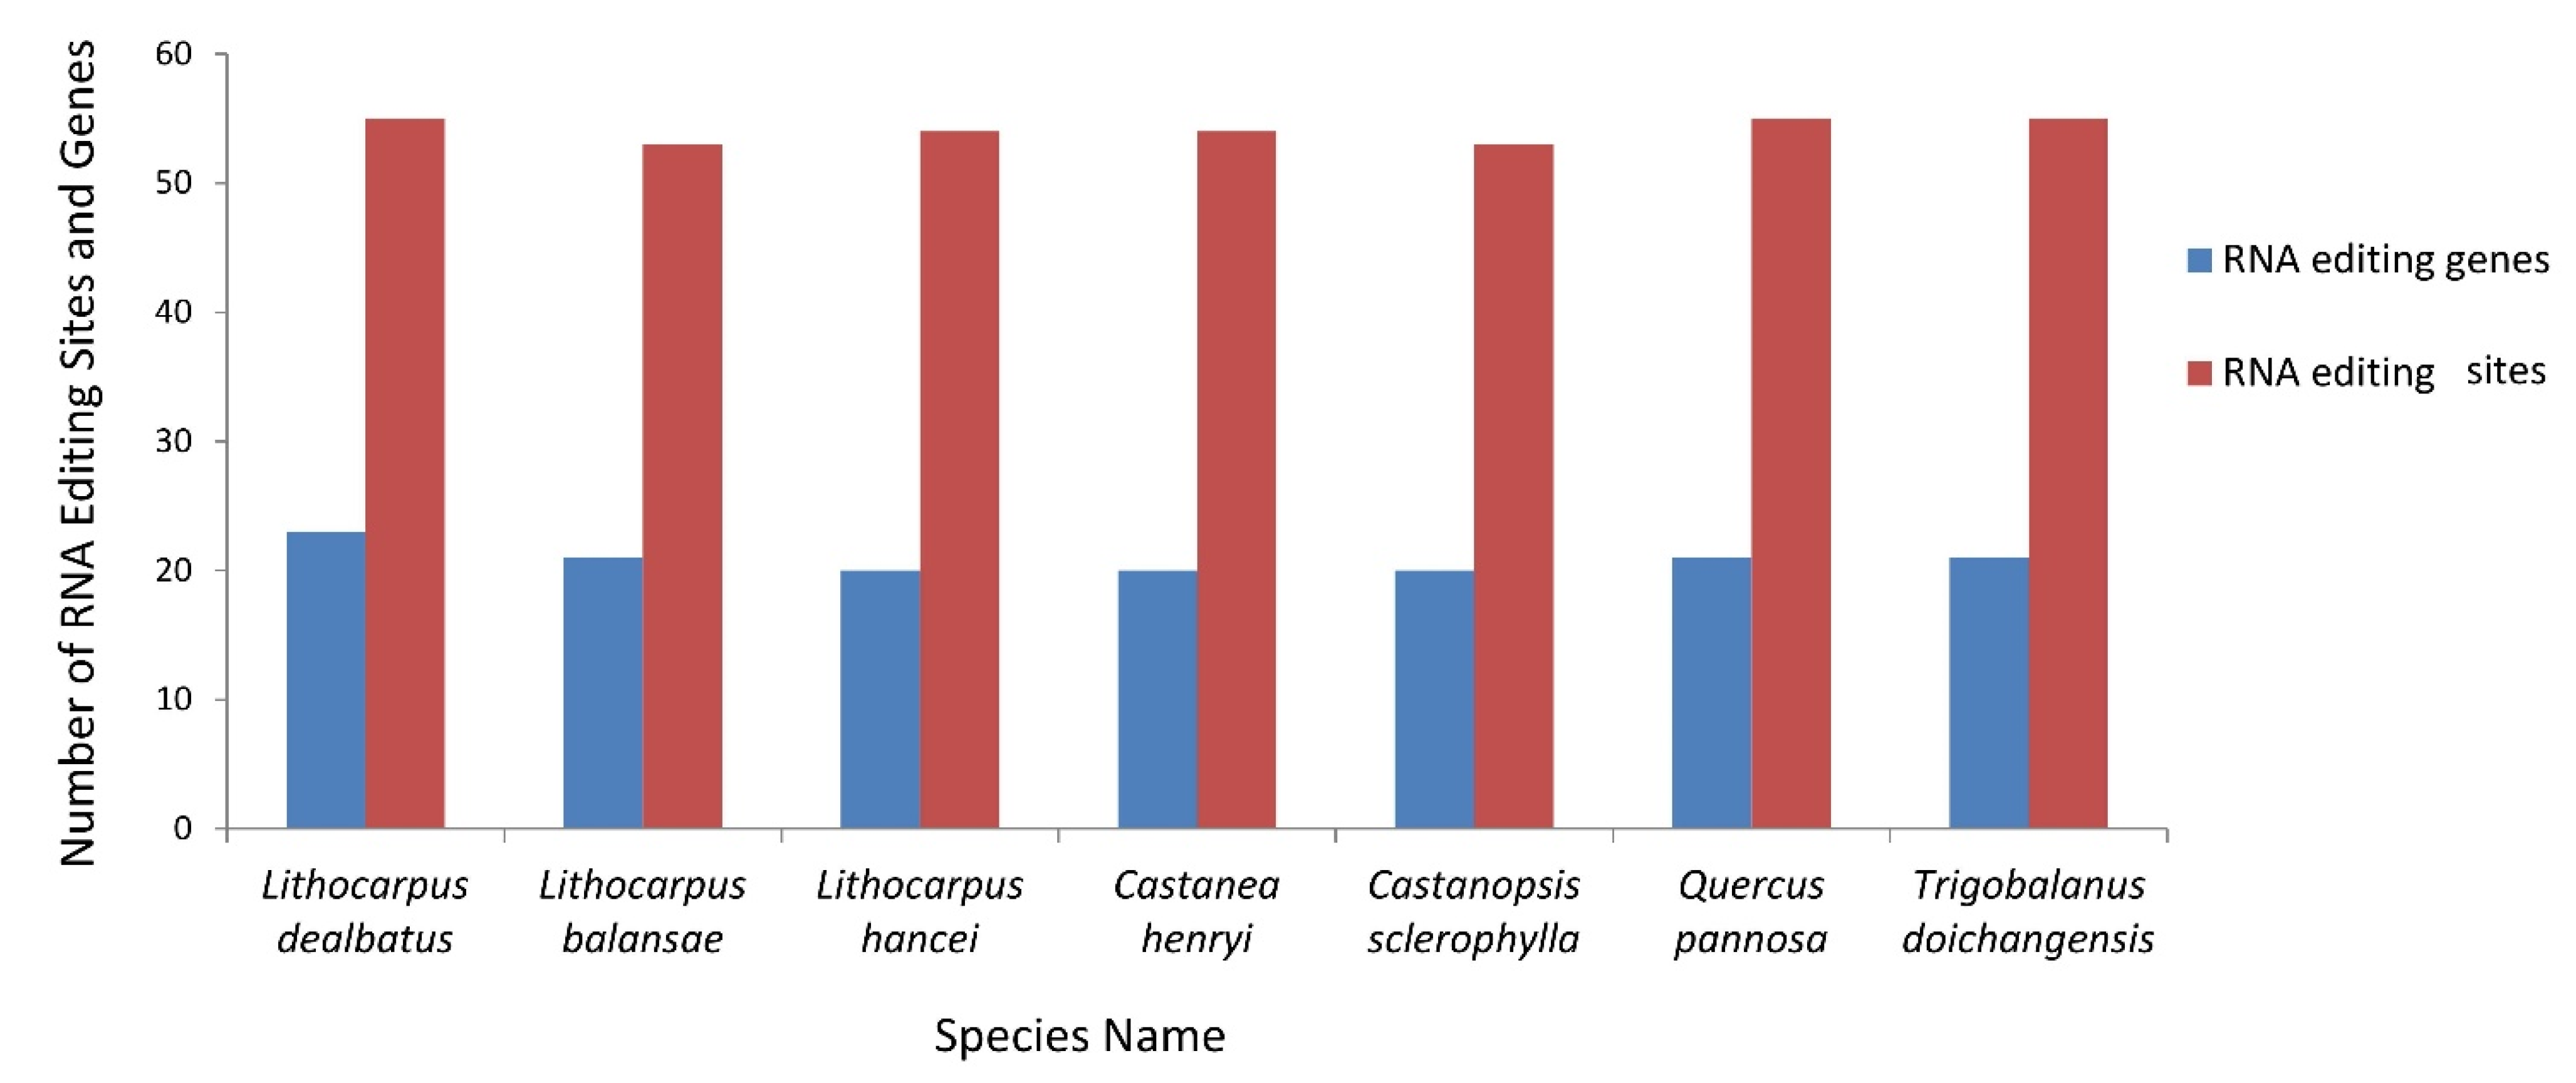
3.2.4. RNA Editing Sites and Its Comparative Analysis in Quercoideae

The RNA editing sites in the L. dealbatus chloroplast genome were predicted using the program PREP suite. Overall, the programme predicted 55 editing sites in the 23 protein-coding genes (Figure 9). All the substitution sites were from nucleotide base C to T. The analysis showed that most conversions were from the amino acid serine to leucine, followed by proline to leucine. The highest 42 substitutions occurred at the second codon position and 13 substitutions occurred at first codon positions. Of the 55 editing sites, we observed the highest editing sites in ndhB (10 sites), followed by ndhD (5 sites) and rpoB (5 sites) genes. Fifty-two RNA editing sites in the L. dealbatus chloroplast genome were responsible for changes in hydrophobic amino acids such as isoleucine, leucine, proline, phenylalanine, methionine, valine, tyrosine, cysteine, and tryptophan.
Comparative analysis of RNA editing sites among the Quercoideae genomes revealed that L. balansae had 53 sites in 21 genes, L. hancei had 54 sites in 20 genes, C. henryi had 54 sites in 20 genes, C. sclerophylla had 53 sites in 20 genes, Q. pannosa had 55 sites in 21 genes, and T. doichangensis had 55 sites in 21 genes (Figure 9). An analysis of gene-specific RNA editing sites in different Quercoideae members revealed that the psaI gene in L. dealbatus, ycf3 gene in Q. pannosa, rpl20 gene in L. balansae, and psbB gene in T. doichangensis hosted the respective RNA editing sites. However, the L. dealbatus genome showed more RNA editing genes than the other genomes (Table S1).

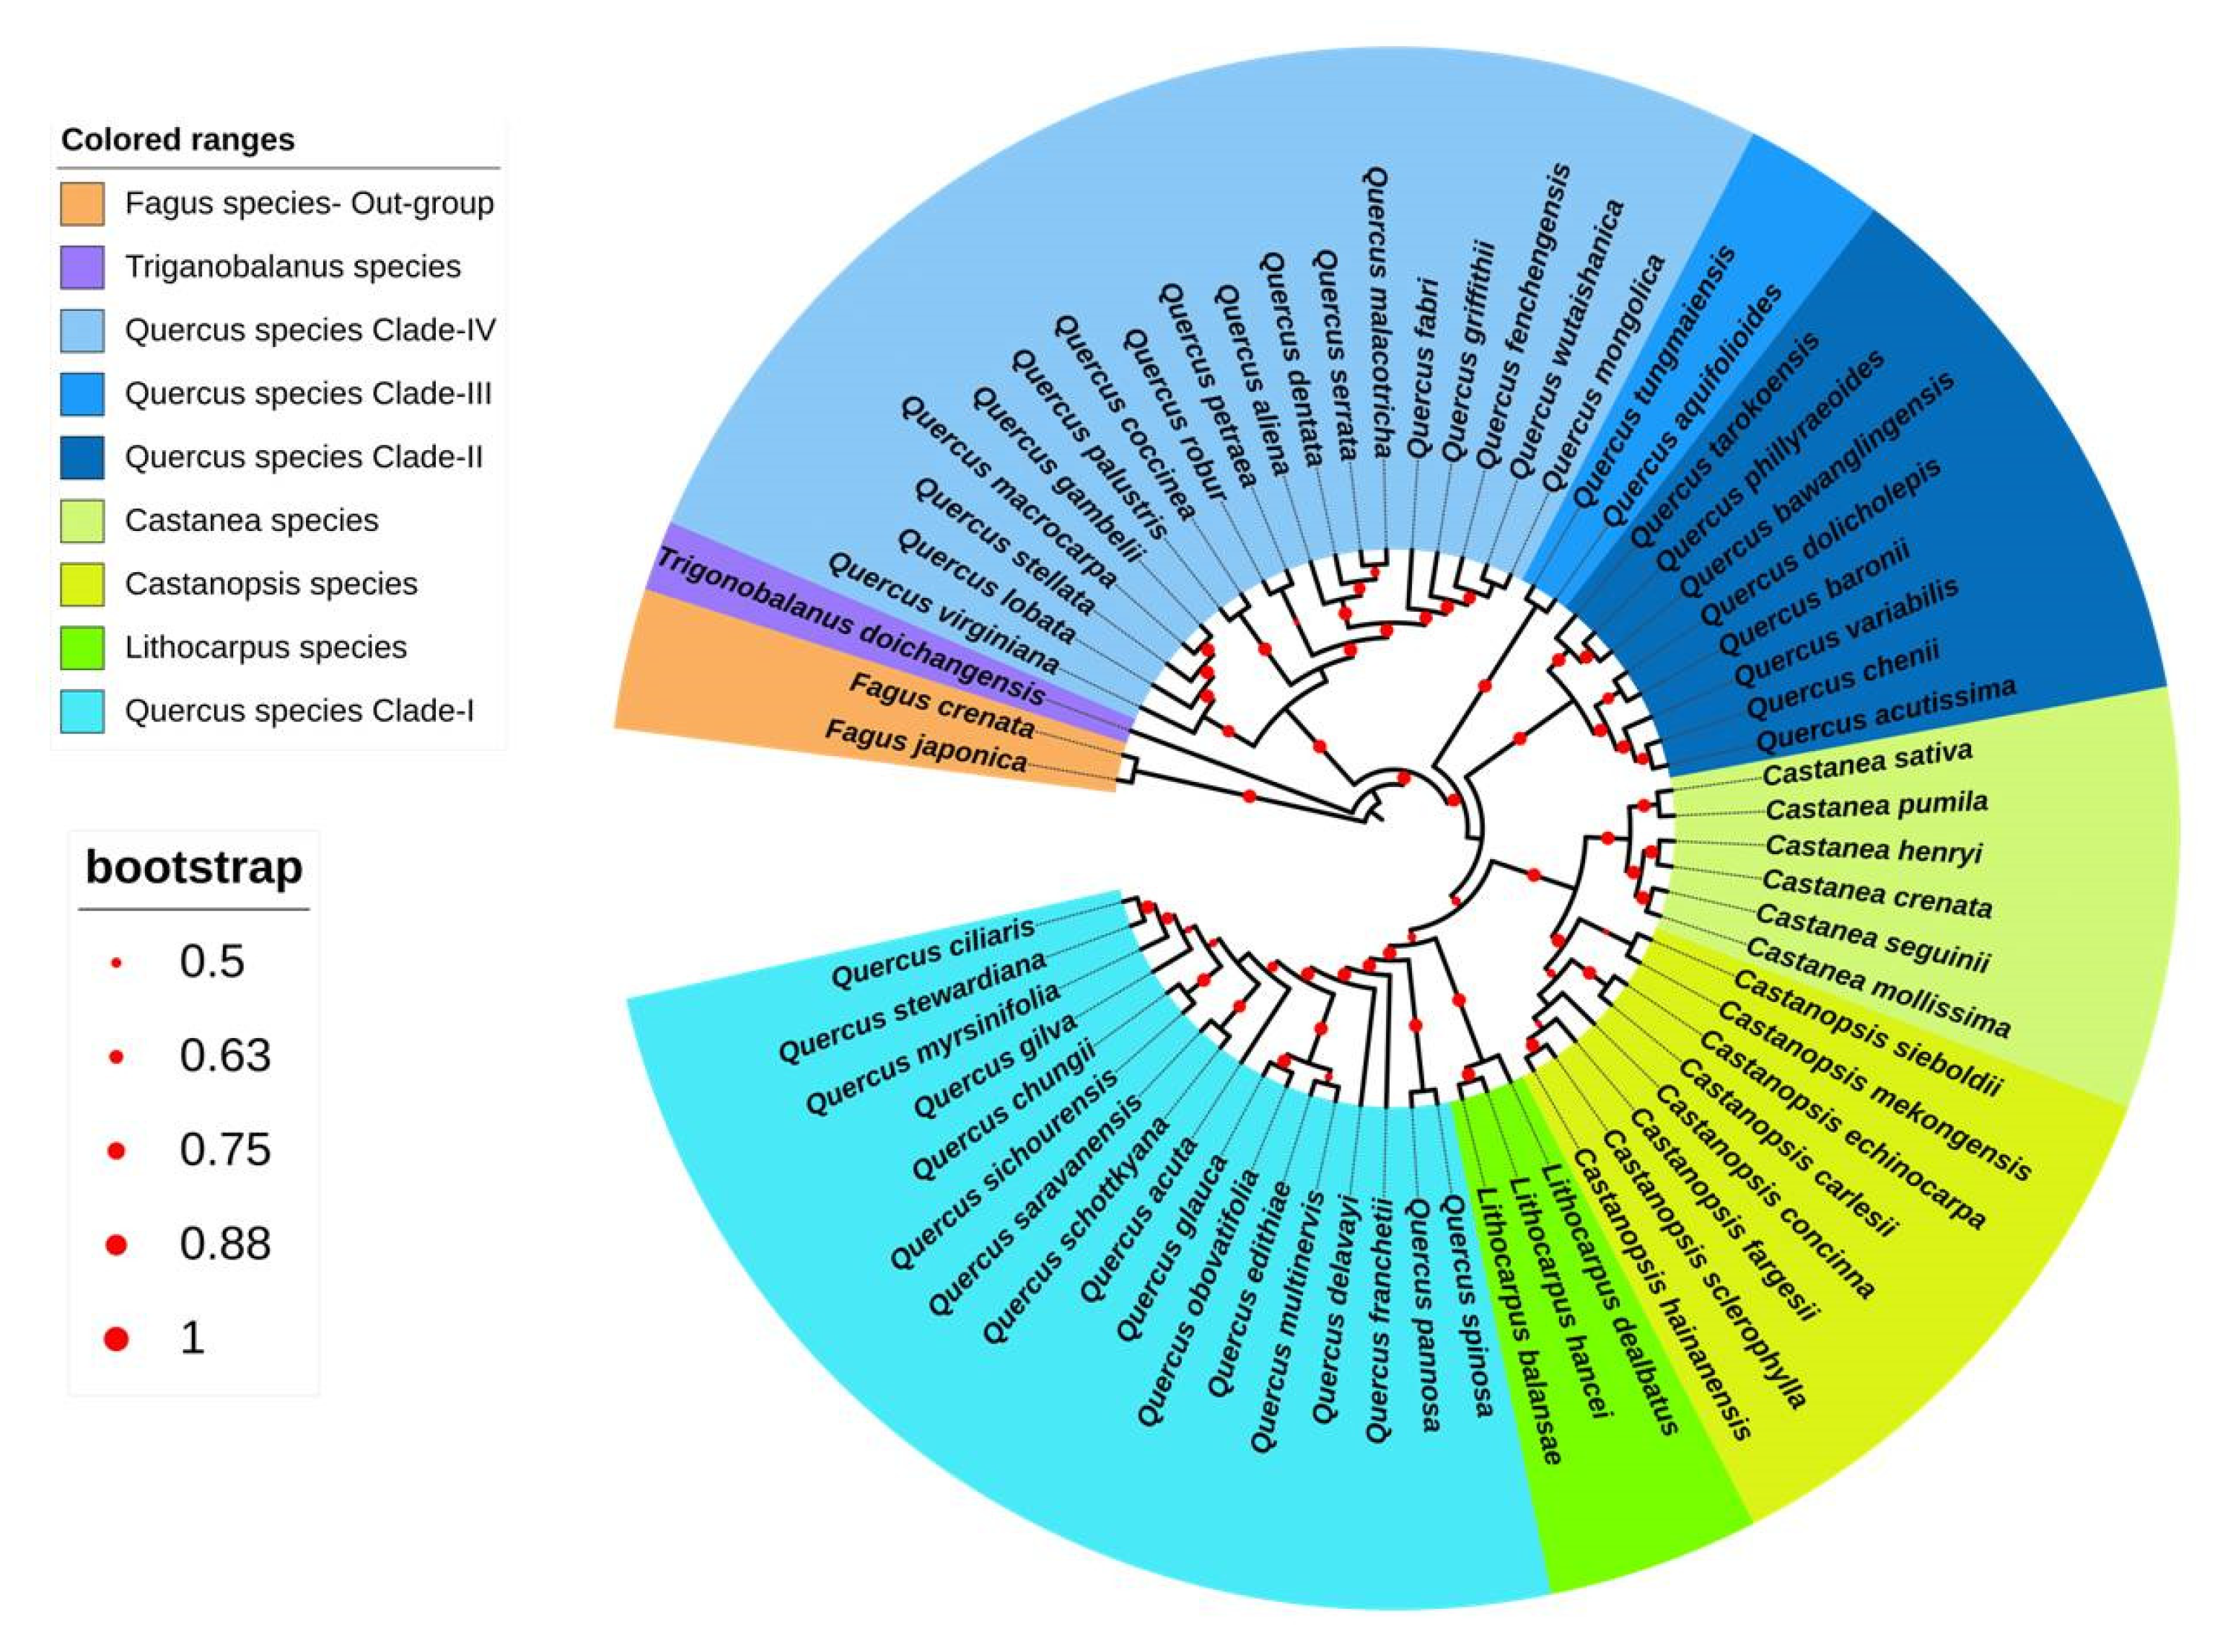
3.3. Chloroplast-Based Phylogenetic Analysis in Quercoideae

3.3.1. Phylogenetic Analysis of Quercoideae

This study constructed a phylogenetic tree based on 95,904 bp nucleotide alignment by employing the GTR+G+I as the best-fit model. The topology of phylogenetic tree was constructed following ML method. The chloroplast genomes of 63 Quercoideae members were included by keeping two Fagus species as an outgroup (Figure 10). The phylogenetic tree showed that three Lithocarpus species, viz. L. dealbatus, L. hancei, and L. balansae formed a separate group sharing a common node with Clade-I of Quercus species. Among the three Lithocarpus species, L. dealbatus was closer to L. hancei and L. balansae. We observed that the Quercus genus was the most diverse among the Quercoideae, forming four different clades in the phylogenetic tree. On the other hand, Castanopsis and Castanea formed two separate monophyletic groups and shared a common node. T. doichangensis occupied the basal position in the phylogeny of Quercoideae.

3.3.2. Estimated Lineage (Stem) Divergence Time for Quercoideae Members

Molecular-clock analysis suggests that the estimated lineage (stem) divergence time for Quercoideae members such as Lithocarpus-Quercus-Castanopsis-Castanea was ~37.28 Mya (Figure S3). However, Lithocarpus evolved ~22.80 Mya from one clade of Quercus, while Castanea-Castanopsis evolved ~23.63 Mya from Lithocarpus-Quercus (1st clade). The estimated lineage divergence time for Castanea was ~21.02 Mya. The other clades of Quercus (II, III, and IV) had lineage divergence times more than ~23.90 Mya (Figure S3).

4. Discussion

Lithocarpus, the second-largest genus of the Quercoideae subfamily under Fagaceae, is dominant in many subtropical and temperate forests, contributing greatly to ecosystem structure, function, and services [38]. L. dealbatus is the dominant species in Indian montane subtropical and temperate forests. Although it is an ecologically and economically important species [6,7,9,10,11], no genomic information on L. dealbatus is available. The availability of chloroplast genomic resources is critical for unraveling the genetic architecture, evolutionary relationship, and taxon delimitation. In this context, we assembled the L. dealbatus chloroplast genome and carried out a comparative analysis with six other members of Quercoideae (available in public domain) to comprehend the structural architecture of the chloroplast genome and phylogenomic analysis of Quercoideae.
The L. dealbatus chloroplast genome size was 161,476 bp, which was in the expected range for most angiosperm chloroplast genomes (107–218 kb) [21]. The typical quadripartite structure of the genome was consistent with other angiosperm chloroplast genomes [18]. The genome displayed a low GC content (36.7%), which is similar to other reported genomes from Fagaceae family [17,18]. Due to high GC content of rRNA genes, IR regions had greater GC content (42.7%) than both the LSC and SSC regions [17,18]. Despite minor variations, the gene content was nearly conserved in the three studied Lithocarpus chloroplast genomes.
The presence or absence of protein-coding genes constituted a notable difference among the studied genomes. We observed the loss of the psbZ gene in L. balansae and L. hancei genomes. Similar loss of psbZ gene was also identified in C. sclerophylla, T. doichangensis and other land plants [39]. In contrast, no loss of protein-coding genes was noticed in the L. dealbatus chloroplast genome. Absence of the infA gene was also reported in a few angiosperm chloroplast genomes [40]. In the present investigation, the infA gene was absent in C. henryi and T. doichangensis. However, on several occasions, the missing chloroplast genes were reported to be integrated into the nuclear genome [21,25].
The chloroplast genome is known to be conserved in terrestrial plants. However, specific structural changes in the genome, such as inversions caused by random rearrangements, have been described by earlier works [41]. Except for a tiny 275 bp inversion in the T. doichangensis genome, our study revealed no significant inversions in the compared genomes. Such minor inversions are common in angiosperm chloroplast genomes [35]. The mVISTA analysis revealed that the noncoding regions were more variable than protein-coding regions, which is a trend also observed in other chloroplast genomes [16,42,43]. The IR region showed higher levels of conservation than the LSC and SSC regions, which is similar to other angiosperms [16]. The level of divergence in Lithocarpus genomes was calculated using nucleotide diversity (Pi) analysis. Consistent with the divergence pattern observed in most angiosperms, greater divergence was detected in Lithocarpus noncoding regions [30]. The majority of the hotspot divergence regions have been previously utilised to develop potential molecular markers [29]. Our analysis indicates that these highly divergent regions could be important in discriminating the Lithocarpus species.
The IR regions are considered as the most conserved region in chloroplast genomes [42]. However, several studies have observed variation in chloroplast genome size and rearrangement in many plant species, which were attributed to contraction and expansion of IR regions [42,43,44]. Our study revealed similarities and dissimilarities among the IR junctions of the studied genomes. IR areas were mostly conserved across the Lithocarpus genomes. Nearly similar results were obtained for Castanopsis and Quercus genomes. However, the absence of the ycf1 gene was noticed at IRA/SSC and IRB/LSC junctions in Q. pannosa and T. doichangensis, respectively. Several researchers have documented the loss of the ycf1 gene at IR junctions in many land plants [42,45,46]. Among the studied genomes, we observed extensive rearrangements at the IR junctions in T. doichangensis. These variations contribute significantly to the evolution of the chloroplast-genome structure. Long and complex repeats play a pivotal role in genome rearrangement and divergence [46]. Due to high sequence variations, tandem repeats are ideal for developing physical and genetic maps [47,48]. Our results of repeat analysis revealed variations in the total number of tandem repeats among the compared genomes, which is consistent with the earlier observations in the Plantaginaceae and Schisandraceae chloroplast genomes [42,49]. Moreover, minor variation was noticed in the distribution of tandem repeats regarding type and length, similar to the distribution pattern described in other plants [42,49]. SSRs are widely distributed in the chloroplast genome and are associated with sequence rearrangement and polymorphism [42,50].
In the current study, SSR density moderately varied in the studied genomes. The highest density of SSR was observed in C. henryi (1SSR/1.31 kb) followed by Q. pannosa (1SSR/1.37 kb) and C. sclerophylla (1SSR/1.38 kb). The density of SSRs detected in the present investigation was greater than those found in rice and the members of Solanaceae family [51,52]. As previously reported [51], mononucleotides were the most frequent SSR repeats, followed by dinucleotide and tri-nucleotide repeats. In mononucleotide repeats, the population of A/T repeats was significantly greater than the population of G/C repeats. Similar SSR distributions have been observed in Fagaceae species and other angiosperms [53]. These findings suggest that the repeats mined in the current study can be utilised to develop molecular markers for studying population genetics, phylogeny, and for differentiation of taxon within L. dealbatus and other members of Fagaceae.
RNA editing is an essential post-transcriptional mechanism observed in land plants. Identifying RNA editing sites in chloroplast genes help us to comprehend the underlying regulatory process(es) and its biological significance [43,54]. We detected 53–55 RNA editing sites in 20–23 protein-coding genes across the compared genomes. L. dealbatus chloroplast genome exhibited the highest RNA editing genes (in 23 genes) compared to closely related L. balansae (in 21 genes) and L. hancei (in 20 genes) genome. In a broad sense, the number of RNA editing genes and sites are variable in chloroplast genomes [28]. We found three gene-specific RNA editing sites in the present investigation. However, the loss or gain of editing sites and their frequencies is an independent event that arises through mutations in RNA editing factors or stress interference [54,55,56]. Consistent with the previous reports, the highest number of editing sites were detected in the ndhB (10 sites) and ndhD (8 sites) genes [28,54]. In addition, we noticed frequent conversions at the second base position of the codon that may change the corresponding amino acid, leading to alterations in protein primary, secondary, or tertiary structures. Consequently, such modifications can play a crucial role in protein functioning [43]. Generally, most RNA editing conversions result in hydrophobic amino-acid change, thus influencing the protein structure [28,43]. Therefore, a comprehensive investigation of RNA editing sites is an inevitable exercise that requires further attention.
The occurrence of point mutations through synonymous and non-synonymous nucleotide substitutions is crucial for gene evolution [57]. The calculation of Ka/Ks ratios has been extensively used to detect evolutionary pressure acting on protein-coding genes [50,58]. Most protein-coding genes from Lithocarpus showed Ka/Ks ratios less than 1, which is consistent with the previous reports [47,59]. This suggests that the majority of genes are under purifying selection. However, 34 genes showed a Ka/Ks ratio of 0; such ratios were observed when the Ks values were either very low or had no substitution present between the aligned sequence [29]. In addition, we observed positive selection in eight Lithocarpus chloroplast genes (accD, cemA, matK, ndhG, petB, rps2, rps3and rps12) with Ka/Ks values greater than 1. These genes have also been reported for positive selection in other species [60]. Overall, the average Ka/Ks ratio (0.52) of the Lithocarpus clade reported in the present investigation was greater than that observed in the Corydalis species (0.26) [60], suggesting a possible evolutionary change in specific genes.
DNA barcoding is a fast and accurate method for identifying species by employing a short piece of genomic DNA [61]. However, no universal barcode is available hitherto that can discriminate the taxa up to species level [15,17]. Researchers have recently employed novel strategies to overcome these issues through two approaches, namely DNA hotspot regions and super-barcoding [32,33,47,62,63]. Here, we have used the first approach to suggest the DNA divergent regions for resolving taxonomic conflicts and proposed a DNA barcode in four members of Quercoideae. We suggest five highly diverged coding regions (rpl33, petB, rpl32, ndhA and rpl22 in Lithocarpus; rp136, ndhJ, petG, rps15, ndhF in Quercus; atpF, psaI, ndhF, psbI, matK in Castanea; and rpl36, petB, atpF, ycf3,rpl22 in Castanopsis) and noncoding regions (trnH-GUG_psbA, rbcl_accD, cssA_ndhD, trnF-GAA_psbA, psbK_psbI in Lithocarpus; petA_psbJ, atpF_atpH, psaC_ndhE, ycf4_cemA and atpI_rps2 in Quercus; ndhG_ndhI, rbcL_accD, psbC_trnS_UGA, ccsA_ndhD, psaJ_rpI33 in Castanea; and rbcL_accD, ccsA_ndhD, psbK_psbI, psaJ_rpl33, psaI_ycf4 in Castanopsis) from each genus by comparing chloroplast genome sequences. However, a comparative study among the four genera revealed five highly diverged coding regions (rpl36, rpl33, ndhJ, atpF, and ndhA), which could be used to resolve intergeneric discrepancies. Similar experiments were carried out in other studies identifying highly variable regions [32,47,63]. Most of the discovered barcodes in the current study were not reported as universal markers in previous studies [15,17,60]. Therefore, with these newly discovered barcodes, the taxon delimitation efficacy should enhance manifold. Further design of intra- and inter-generic barcodes would be helpful in achieving greater phylogenetic resolution.
Recently, researchers proposed the utility of the whole chloroplast genome as a “super-barcode”, which has provided a new perspective to plant identification and species delimitation [57,58]. Previous studies in Quercus revealed low phylogenetic resolution using universal barcodes such as rbcL, matK, and trnH-psbA [15,17]. Thus, an increasing number of investigations are employing the whole chloroplast genome to overcome the low resolving power of single-locus markers for evaluating phylogenetic relationships [37,62]. In the present study, resolving the phylogeny between Lithocarpus and other Quercoideae species could give insights into the evolutionary relationship in the Fagaceae family. Lithocarpus genus formed a monophyletic group in which L. hancei and L. balansae were closely associated. The loss of the psbZ gene in L. hancei and L. balansae genome also confirms such a phylogenetic relationship.
L. dealbatus was more closely related to L. hancei than L. balansae, which is well-supported by sequence homology analysis. The Lithocarpus clade shared a common node with the Quercus species of clade-I, consistent with the high coverage and sequence similarity between some Quercus and Lithocarpus species. At the same time, molecular dating analysis revealed the divergence time for Lithocarpus from Quercus clade at ~22.80 Mya in the early Miocene Epoch. A near-similar divergence time was estimated for separating the Quercus and Lithocarpus genus based on the five genes [63]. Furthermore, phylogeny analysis suggests that Castanea and Castanopsis, two closely diverged genus, split ~21.02 Mya, which is in conformity with the previous morphological and molecular studies [31,64]. On the other hand, T. doichangensis was present at the basal position and showed as an early diverged genus in the Quercoideae subfamily. This is well-supported by the previous fossil records [65]. Moreover, Quercus appeared as the most diverse species forming four distinct clades in the phylogenetic tree, i.e., non-monophyly [31,66]. Yang et al. (2021) also suggested that chloroplast capture through hybridisation during the early diversification of Quercoideae results in the non-monophyly of Quercus [19]. A few previous studies also reported that chloroplast DNA spreads more freely among the geographically co-distributed species than the nuclear DNA [67,68]. Thus, it is critical to compare plastid phylogenies with nuclear genome phylogenies for a complete understanding of evolutionary history in Quercoideae. Using multiple RAD-seq datasets, previous phylogenetic studies reconstructed Quercus as monophyletic with moderate to high support [69,70,71]. However, all of our plastid phylogenomic analyses suggested a nonmono-phyletic origin of Quercus, which is consistent with earlier plastid phylogenetic research [72]. The phylogenetic relationship of oak is complex, owing to a considerable level of hybridisation, introgression, incomplete lineage sorting, and convergent evolution [73]. Thus, phylogenetic linkages estimated from plastid data often contradict with those inferred from nuclear data [67,74,75]. However, this non-monophyly could be because of endemism and allopatric speciation among Quercus species that may have amplified genetic and morphological variations in species evolution [18]. Our tree topology comprising Fagus, Trigonobalanus, Quercus, Castanopsis, Castanea, and Lithocarpus, is more or less similar to the earlier phylogenetic outcome, although the constituent species in Quercoideae were different [34]. Our study confirmed the effectiveness of the chloroplast genome in establishing the monophyletic origin of L. dealbatus, indicating the absence of the chloroplast capture phenomenon and interspecific hybridisation, as reported in Quercus species by Yang et al. [19]. Further, our phylogenetic analysis using the chloroplast genome confirmed the non-monophyletic origin of Quercus species, which is in conformity with Zhou et al. [6]. Since nuclear genome phylogenetic analysis resulted in the monophyletic origin of Quercus [6], such contrasting observations necessitate the phylogenetic lineage analysis for Lithocarpus, using the nuclear genome for generalising the phylogenetic origin in Quercoideae.

5. Conclusions

Using MGI technology, the current study effectively assembled and annotated the whole chloroplast genomes of L. dealbatus. The gene content and synteny of the Lithocarpus chloroplast genome were nearly identical. L. dealbatus, L. balansae, and L. hancei have considerable sequence homology. The analysis of repeat elements indicated small changes in the overall amount of repeat elements among the genomes studied. The ML tree clearly demonstrated that Lithocarpus species formed a monophyletic group, and the whole clade of Lithocarpus was closely connected to one clade of Quercus species. The comparison of L. dealbatus chloroplast genomes with those of other Quercoideae species improved our understanding of evolutionary lineage. Furthermore, the mutational hotspot areas identified in the current study may be useful in distinguishing between closely related Quercoideae species. We propose that the highly mutational diverging region be exploited as a possible barcode for better species resolution in diverse Quercoideae taxa. The newly proposed in silico barcodes need to be validated in terms of their resolution power for species delimitation and phylogenetic reconstruction. Thus, the presence of these mutation hotspots, i.e., positions with concentrated mutations, have high future usage potential for species or any other taxon delimitation.

Supplementary Materials

The following supporting information can be downloaded at: https://www.mdpi.com/article/10.3390/life12060828/s1. Table S1. Comparison of RNA editing sites and genes in L. dealbatus and Quercoideae chloroplast genomes. Figure S1. Enlarge view of inversion present in the T. doichangensis chloroplast genome shown in green colour box. Figure S2. Comparison of the DNA diversity (Pi) values of non-coding regions for A. Lithocarpus, B. Quercus, C. Castanea and D. Castanopsis. Figure S3. Divergence time of different members of Quercoideae clade.

Author Contributions

Conceptualisation: S.K.B. and S.N.J.; sample collection and DNA isolation: B.J., P.P.S., G.J.T. and D.A.; genome assembly and annotation: R.G.S.; experiment design and data analysis: S.K.B., S.N.J., R.G.S. and R.P.B.; manuscript draft preparation: R.G.S., R.P.B. and S.N.J.; Supervision of the study and critical revision of the manuscript: S.K.B. All authors have read and agreed to the published version of the manuscript.

Funding

Partially supported from NMHS project (Grant No. GBPNI/NMHS-2020-21/MG).

Institutional Review Board Statement

Manuscript number allotted by CSIR ethical committee: CSIR-NBRI_MS/2022/01/03.

Informed Consent Statement

Not applicable.

Data Availability Statement

The assembled genome can be accessed in NCBI database with accession number MZ322408.

Acknowledgments

We acknowledge the Director, CSIR-National Botanical Research Institute, Lucknow for the lab infrastructure. We acknowledge the sequencing support from Ravi Chilukoti, MGI, India, Ratnesh Tripathi and Ashfaq, ILS, Gurgaon.

Conflicts of Interest

The authors declare no conflict of interest.

References

  1. Singh, B.; Adhikari, D.; Singh, B.; Barik, S.K. Diversity and distribution of Fagaceae in northeastern India. In Plant and Ecosystem Diversity; Barik, S.K., Ed.; Daya Publishing House: A Division of Astral International Publication: New Delhi, India, 2022; pp. 171–178. [Google Scholar]
  2. Bhatt, D.; Sekar, K.C.; Kumar, K. Tree Diversity of Indian Himalayan Region; Pant National Institute of Himalayan Environment, Almora: Uttarakhand, India, 2020; ISBN 978-93-5408-274-0. [Google Scholar]
  3. Tang, C.Q.; Chiou, C.R.; Lin, C.T.; Lin, J.R.; Hsieh, C.F.; Tang, J.W.; Su, W.H.; Hou, X. Plant Diversity Patterns in Subtropical Evergreen Broad-Leaved Forests of Yunnan and Taiwan. Ecol. Res. 2013, 28, 81–92. [Google Scholar] [CrossRef]
  4. Lehmann, L.; Greijmans, M. Forests and Trees of the Central Highlands of Xieng Khouang Lao PDR; DANIDA: Vientiane, Laos, 2003; 246p. [Google Scholar]
  5. Singh, P.P.; Chakraborty, T.; Dermann, A.; Dermann, F.; Adhikari, D.; Gurung, P.B.; Barik, S.K.; Bauhus, J.; Fassnacht, F.E.; Dey, D.C.; et al. Assessing Restoration Potential of Fragmented and Degraded Fagaceae Forests in Meghalaya, North-East India. Forests 2020, 11, 1008. [Google Scholar] [CrossRef]
  6. Zhou, B.F.; Yuan, S.; Crowl, A.A.; Liang, Y.Y.; Shi, Y.; Chen, X.Y.; An, Q.Q.; Kang, M.; Manos, P.S.; Wang, B. Phylogenomic Analyses Highlight Innovation and Introgression in the Continental Radiations of Fagaceae across the Northern Hemisphere. Nat. Commun. 2022, 13, 1320. [Google Scholar] [CrossRef]
  7. Rao, P.; Barik, S.K.; Pandey, H.N.; Tripathi, R.S. Community Composition and Tree Population Structure in a Sub-Tropical Broad-Leaved Forest along a Disturbance Gradient. Vegetatio 1990, 88, 151–162. [Google Scholar] [CrossRef]
  8. Barik, S.K.; Pandey, H.N.; Tripathi, R.S.; Rao, P. Microenvironmental Variability and Species Diversity in Treefall Gaps in a Sub-Tropical Broadleaved Forest. Vegetatio 1992, 103, 31–40. [Google Scholar] [CrossRef]
  9. Vander Wall, S.B. The Evolutionary Ecology of Nut Dispersal. Bot. Rev. 2001, 67, 74–117. [Google Scholar] [CrossRef]
  10. Barik, S.K.; Tripathi, R.S.; Pandey, H.N.; Rao, P. Tree Regeneration in a Subtropical Humid Forest: Effect of Cultural Disturbance on Seed Production, Dispersal and Germination. J. Appl. Ecol. 1996, 33, 1551–1560. [Google Scholar] [CrossRef]
  11. Barik, S.K.; Rao, P.; Tripathi, R.S.; Pandey, H.N. Dynamics of Tree Seedling Populations in a Humid Subtropical Forest of Northeast India as Related to Disturbance. Can. J. For. Res. 1996, 26, 584–589. [Google Scholar] [CrossRef]
  12. Rao, P.; Barik, S.K.; Pandey, H.N.; Tripathi, R.S. Tree Seed Germination and Seedling Establishment in Treefall Gaps and Understorey in a Subtropical Forest of Northeast India. Aust. J. Ecol. 1997, 22, 136–145. [Google Scholar] [CrossRef]
  13. Cavender-Bares, J.; Ackerly, D.D.; Baum, D.A.; Bazzaz, F.A. Phylogenetic Overdispersion in Floridian Oak Communities. Am. Nat. 2004, 163, 823–843. [Google Scholar] [CrossRef]
  14. Manos, P.S.; Stanford, A.M. The Historical Biogeography of Fagaceae: Tracking the Tertiary History of Temperate and Subtropical Forests of the Northern Hemisphere. Int. J. Plant Sci. 2001, 162, S77–S93. [Google Scholar] [CrossRef]
  15. Moran, E.V.; Willis, J.; Clark, J.S. Genetic Evidence for Hybridization in Red Oaks (Quercus Sect. Lobatae, Fagaceae). Am. J. Bot. 2012, 99, 92–100. [Google Scholar] [CrossRef] [PubMed] [Green Version]
  16. Ye, X.; Hu, D.; Guo, Y.; Id, R.S. Complete Chloroplast Genome of Castanopsis Sclerophylla (Lindl.) Schott: Genome Structure and Comparative and Phylogenetic Analysis. PLoS ONE 2019, 14, e0208552. [Google Scholar] [CrossRef] [PubMed] [Green Version]
  17. Pang, X.; Liu, H.; Wu, S.; Yuan, Y.; Li, H.; Dong, J.; Liu, Z.; An, C.; Su, Z.; Li, B. Species Identification of Oaks (Quercus L., Fagaceae) from Gene to Genome. Int. J. Mol. Sci. 2019, 20, 5940. [Google Scholar] [CrossRef] [PubMed] [Green Version]
  18. Yang, J.; Vázquez, L.; Chen, X.; Li, H.; Zhang, H.; Liu, Z.; Zhao, G. Development of Chloroplast and Nuclear DNA Markers for Chinese Oaks (Quercus Subgenus Quercus) and Assessment of Their Utility as DNA Barcodes. Front. Plant Sci. 2017, 8, 816. [Google Scholar] [CrossRef]
  19. Yang, Y.Y.; Qu, X.J.; Zhang, R.; Stull, G.W.; Yi, T.S. Plastid Phylogenomic Analyses of Fagales Reveal Signatures of Conflict and Ancient Chloroplast Capture. Mol. Phylogenet. Evol. 2021, 163, 107232. [Google Scholar] [CrossRef]
  20. Piredda, R.; Simeone, M.C.; Attimonelli, M.; Bellarosa, R.; Schirone, B. Prospects of Barcoding the Italian Wild Dendroflora: Oaks Reveal Severe Limitations to Tracking Species Identity. Mol. Ecol. Resour. 2011, 11, 72–83. [Google Scholar] [CrossRef]
  21. Zhou, H.; Gao, X.; Woeste, K.; Zhao, P.; Zhang, S. Comparative Analysis of the Complete Chloroplast Genomes of Four Chestnut Species (Castanea). Forests 2021, 12, 861. [Google Scholar] [CrossRef]
  22. Song, Y.; Wang, S.; Ding, Y.; Xu, J.; Li, M.F.; Zhu, S.; Chen, N. Chloroplast Genomic Resource of Paris for Species Discrimination. Sci. Rep. 2017, 7, 3427. [Google Scholar] [CrossRef] [Green Version]
  23. Cosner, M.E.; Raubeson, L.A.; Jansen, R.K. Chloroplast DNA Rearrangements in Campanulaceae: Phylogenetic Utility of Highly Rearranged Genomes. BMC Evol. Biol. 2004, 4, 27. [Google Scholar] [CrossRef] [Green Version]
  24. Daniell, H.; Lin, C.S.; Yu, M.; Chang, W.J. Chloroplast Genomes: Diversity, Evolution, and Applications in Genetic Engineering. Genome Biol. 2016, 17, 1–29. [Google Scholar] [CrossRef] [PubMed] [Green Version]
  25. Nock, C.J.; Waters, D.L.E.; Edwards, M.A.; Bowen, S.G.; Rice, N.; Cordeiro, G.M.; Henry, R.J. Chloroplast Genome Sequences from Total DNA for Plant Identification. Plant Biotechnol. J. 2011, 9, 328–333. [Google Scholar] [CrossRef] [PubMed]
  26. Rogalski, M.; Vieira, L.D.N.; Fraga, H.P.; Guerra, M.P. Plastid Genomics in Horticultural Species: Importance and Applications for Plant Population Genetics, Evolution, and Biotechnology. Front. Plant Sci. 2015, 6, 134. [Google Scholar] [CrossRef] [PubMed] [Green Version]
  27. Wicke, S.; Schneeweiss, G.M.; dePamphilis, C.W.; Müller, K.F.; Quandt, D. The Evolution of the Plastid Chromosome in Land Plants: Gene Content, Gene Order, Gene Function. Plant Mol. Biol. 2011, 76, 273–297. [Google Scholar] [CrossRef] [Green Version]
  28. de Santana Lopes, A.; Pacheco, T.G.; dos Santos, K.G.; do Vieira, L.N.; Guerra, M.P.; Nodari, R.O.; de Souza, E.M.; de Oliveira Pedrosa, F.; Rogalski, M. The Linum Usitatissimum L. Plastome Reveals Atypical Structural Evolution, New Editing Sites, and the Phylogenetic Position of Linaceae within Malpighiales. Plant Cell Rep. 2018, 37, 307–328. [Google Scholar] [CrossRef]
  29. Mo, Z.; Lou, W.; Chen, Y.; Jia, X.; Zhai, M.; Guo, Z.; Xuan, J. The Chloroplast Genome of Carya Illinoinensis: Genome Structure, Adaptive Evolution, and Phylogenetic Analysis. Forests 2020, 11, 207. [Google Scholar] [CrossRef] [Green Version]
  30. Menezes, A.P.A.; Resende-Moreira, L.C.; Buzatti, R.S.O.; Nazareno, A.G.; Carlsen, M.; Lobo, F.P.; Kalapothakis, E.; Lovato, M.B. Chloroplast Genomes of Byrsonima Species (Malpighiaceae): Comparative Analysis and Screening of High Divergence Sequences. Sci. Rep. 2018, 8, 2210. [Google Scholar] [CrossRef] [Green Version]
  31. Liu, X.; Chang, E.; Liu, J.; Huang, Y.; Wang, Y.; Yao, N.; Jiang, Z.-P. Complete Chloroplast Genome Sequence and Phylogenetic Analysis of Quercus Bawanglingensis Huang, Li et Xing, a Vulnerable Oak Tree in China. Forests 2019, 10, 587. [Google Scholar] [CrossRef] [Green Version]
  32. Khan, A.; Asaf, S.; Khan, A.L.; Shehzad, T.; Al-Rawahi, A.; Al-Harrasi, A. Comparative Chloroplast Genomics of Endangered Euphorbia Species: Insights into Hotspot Divergence, Repetitive Sequence Variation, and Phylogeny. Plants 2020, 9, 199. [Google Scholar] [CrossRef] [Green Version]
  33. Zhang, W.; Sun, Y.; Liu, J.; Xu, C.; Zou, X.; Chen, X.; Liu, Y.; Wu, P.; Yang, X.; Zhou, S. DNA Barcoding of Oryza: Conventional, Specific, and Super Barcodes. Plant Mol. Biol. 2021, 105, 215–228. [Google Scholar] [CrossRef]
  34. Ma, C.; Yan, H.; Ge, X.; Zhejiang, F. The Complete Chloroplast Genome of Lithocarpus Hancei ( Benth.) Rehd ( Fagaceae ) from Zhejiang, China. Mitochondrial DNA Part B 2022, 6, 2022–2023. [Google Scholar] [CrossRef] [PubMed]
  35. Dierckxsens, N.; Mardulyn, P.; Smits, G. NOVOPlasty: De Novo Assembly of Organelle Genomes from Whole Genome Data. Nucleic Acids Res. 2017, 45, e18. [Google Scholar] [CrossRef] [PubMed] [Green Version]
  36. Tillich, M.; Lehwark, P.; Pellizzer, T.; Ulbricht-Jones, E.S.; Fischer, A.; Bock, R.; Greiner, S. GeSeq—Versatile and Accurate Annotation of Organelle Genomes. Nucleic Acids Res. 2017, 45, W6–W11. [Google Scholar] [CrossRef] [PubMed]
  37. Bi, G.; Mao, Y.; Xing, Q.; Cao, M. HomBlocks: A Multiple-Alignment Construction Pipeline for Organelle Phylogenomics Based on Locally Collinear Block Searching. Genomics 2018, 110, 18–22. [Google Scholar] [CrossRef]
  38. Suchiang, B.R.; Nonghuloo, I.M.; Kharbhih, S.; Singh, P.P.; Tiwary, R.; Adhikari, D.; Upadhaya, K.; Ramanujam, P.; Barik, S.K. Tree Diversity and Community Composition in Sacred Forests Are Superior than the Other Community Forests in a Human-Dominated Landscape of Meghalaya. Trop. Ecol. 2020, 61, 84–105. [Google Scholar] [CrossRef]
  39. Mohanta, T.K.; Mishra, A.K.; Khan, A.; Hashem, A.; Abd_Allah, E.F.; Al-Harrasi, A. Gene Loss and Evolution of the Plastome. Genes 2020, 11, 1133. [Google Scholar] [CrossRef]
  40. Frailey, D.C.; Chaluvadi, S.R.; Vaughn, J.N.; Coatney, C.G.; Bennetzen, J.L. Gene Loss and Genome Rearrangement in the Plastids of Five Hemiparasites in the Family Orobanchaceae. BMC Plant Biol. 2018, 18, 30. [Google Scholar] [CrossRef] [Green Version]
  41. Millen, R.S.; Olmstead, R.G.; Adams, K.L.; Palmer, J.D.; Lao, N.T.; Heggie, L.; Kavanagh, T.A.; Hibberd, J.M.; Gray, J.C.; Morden, C.W.; et al. Many Parallel Losses of InfA from Chloroplast DNA during Angiosperm Evolution with Multiple Independent. Plant Cell 2001, 13, 645–658. [Google Scholar] [CrossRef] [Green Version]
  42. Asaf, S.; Khan, A.L.; Khan, A.; Khan, G.; Lee, I. Expanded Inverted Repeat Region with Large Scale Inversion in the First Complete Plastid Genome Sequence of Plantago Ovata. Sci. Rep. 2020, 10, 3881. [Google Scholar] [CrossRef] [Green Version]
  43. He, P.; Huang, S.; Xiao, G.; Zhang, Y.; Yu, J. Abundant RNA Editing Sites of Chloroplast Protein-Coding Genes in Ginkgo Biloba and an Evolutionary Pattern Analysis. BMC Plant Biol. 2016, 16, 257. [Google Scholar] [CrossRef] [Green Version]
  44. Jin, D.-M.; Jin, J.; Yi, T. Plastome Structural Conservation and Evolution in the Clusioid Clade of Malpighiales. Sci. Rep. 2020, 10, 9091. [Google Scholar] [CrossRef] [PubMed]
  45. Abdullah; Mehmood, F.; Shahzadi, I.; Waseem, S.; Mirza, B.; Ahmed, I.; Waheed, M.T. Chloroplast Genome of Hibiscus Rosa-Sinensis (Malvaceae): Comparative Analyses and Identification of Mutational Hotspots. Genomics 2020, 112, 581–591. [Google Scholar] [CrossRef] [PubMed]
  46. Song, Y.; Zhang, Y.; Xu, J.; Li, W.; Li, M.F. Characterization of the Complete Chloroplast Genome Sequence of Dalbergia Species and Its Phylogenetic Implications. Sci. Rep. 2019, 9, 20401. [Google Scholar] [CrossRef] [PubMed]
  47. Nie, X.; Lv, S.; Zhang, Y.; Du, X.; Wang, L.; Biradar, S.S.; Tan, X.; Wan, F.; Weining, S. Complete Chloroplast Genome Sequence of a Major Invasive Species, Crofton Weed (Ageratina Adenophora). PLoS ONE 2012, 7, e36869. [Google Scholar] [CrossRef] [PubMed] [Green Version]
  48. Edwards, A.; Civitello, A.; Hammond, H.A.; Caskey, C.T. DNA Typing and Genetic Mapping with Trimeric and Tetrameric Tandem Repeats. Am. J. Hum. Genet. 1991, 49, 746–756. [Google Scholar]
  49. Li, B.; Zheng, Y. Dynamic Evolution and Phylogenomic Analysis of the Chloroplast Genome in Schisandraceae. Sci. Rep. 2018, 8, 9285. [Google Scholar] [CrossRef]
  50. Shelke, R.G.; Basak, S.; Rangan, L. Development of EST-SSR Markers for Pongamia Pinnata by Transcriptome Database Mining: Cross-Species Amplification and Genetic Diversity. Physiol. Mol. Biol. Plants 2020, 26, 2225–2241. [Google Scholar] [CrossRef]
  51. Rajendrakumar, P.; Biswal, A.K.; Balachandran, S.M.; Srinivasarao, K.; Sundaram, R.M. Simple Sequence Repeats in Organellar Genomes of Rice: Frequency and Distribution in Genic and Intergenic Regions. Bioinformatics 2007, 23, 1–4. [Google Scholar] [CrossRef] [Green Version]
  52. Tambarussi, E.V.; Melotto-Passarin, D.M.; Gonzalez, S.G.; Brigati, J.B.; Jesus, F.A.; Barbosa, A.L.; Dressano, K.; Carrer, H. In Silico Analysis of Simple Sequence Repeats from Chloroplast Genomes of Solanaceae Species. Crop Breed. Appl. Biotechnol. 2009, 9, 344–352. [Google Scholar] [CrossRef] [Green Version]
  53. Li, X.; Li, Y.; Zang, M.; Li, M.; Fang, Y. Complete Chloroplast Genome Sequence and Phylogenetic Analysis of Quercus acutissima. Int. J. Mol. Sci. 2018, 19, 2443. [Google Scholar] [CrossRef] [Green Version]
  54. Freyer, R.; Kiefer-Meyer, M.-C.; Kossel, H. Occurrence of Plastid RNA Editing in All Major Lineages of Land Plants. Proc. Natl. Acad. Sci. USA 1997, 94, 6285–6290. [Google Scholar] [CrossRef] [PubMed] [Green Version]
  55. Rodrigues, N.F.; Christoff, A.P.; da Fonseca, G.C.; Kulcheski, F.R.; Margis, R. Unveiling Chloroplast RNA Editing Events Using Next Generation Small RNA Sequencing Data. Front. Plant Sci. 2017, 8, 1686. [Google Scholar] [CrossRef] [Green Version]
  56. Small, I.D.; Schallenberg-Rüdinger, M.; Takenaka, M.; Mireau, H.; Ostersetzer-Biran, O. Plant Organellar RNA Editing: What 30 Years of Research Has Revealed. Plant J. 2020, 101, 1040–1056. [Google Scholar] [CrossRef] [PubMed]
  57. Introduction. In The Neutral Theory of Molecular Evolution; Kimura, M. (Ed.) Cambridge University Press: Cambridge, UK, 1983; pp. xi–xvi. ISBN 9780521317931. [Google Scholar]
  58. Wang, D.; Zhang, Y.; Zhang, Z.; Zhu, J.; Yu, J. KaKs_Calculator 2.0: A Toolkit Incorporating Gamma-Series Methods and Sliding Window Strategies. Genom. Proteom. Bioinform. 2010, 8, 77–80. [Google Scholar] [CrossRef] [Green Version]
  59. Yang, Y.; Hu, Y.; Ren, T.; Sun, J.; Zhao, G. Remarkably Conserved Plastid Genomes of Quercus Group Cerris in China: Comparative and Phylogenetic Analyses. Nord. J. Bot. 2018, 36, e01921. [Google Scholar] [CrossRef]
  60. Xu, X.; Wang, D. Comparative Chloroplast Genomics of Corydalis Species (Papaveraceae): Evolutionary Perspectives on Their Unusual Large Scale Rearrangements. Front. Plant Sci. 2021, 11, 600354. [Google Scholar] [CrossRef] [PubMed]
  61. Basak, S.; Chakrabartty, I.; Hedaoo, V.; Shelke, R.G.; Rangan, L. Assessment of genetic variation among wild Alpinia nigra (Zingiberaceae) population: An approach based on molecular phylogeny. Mol. Biol. Rep. 2019, 46, 177–189. [Google Scholar] [CrossRef]
  62. Xu, J.; Shen, X.; Liao, B.; Xu, J.; Hou, D. Comparing and Phylogenetic Analysis Chloroplast Genome of Three Achyranthes Species. Sci. Rep. 2020, 10, 10818. [Google Scholar] [CrossRef]
  63. Larson-Johnson, K. Phylogenetic Investigation of the Complex Evolutionary History of Dispersal Mode and Diversification Rates across Living and Fossil Fagales. New Phytol. 2016, 209, 418–435. [Google Scholar] [CrossRef]
  64. Manos, P.S.; Cannon, C.H.; Oh, S.-H. Phylogenetic Relationships and Taxonomic Status Of the Paleoendemic Fagaceae Of Western North America: Recognition Of A New Genus, Notholithocarpus. Madroño 2008, 55, 181–190. [Google Scholar] [CrossRef]
  65. Zhe-Kun, Z. Fossils of the Fagaceae and their implications in systematics and biogeography. J. Syst. Evol. 1999, 37, 369. [Google Scholar]
  66. Yang, J.; Huang, Y.; Yang, Z.; Zhou, C.; Hu, X. Identification and Quantitative Evaluation of Major Sweet Ingredients in Sweet Tea (Lithocarpus Polystachyus Rehd.) Based Upon Location, Harvesting Time, Leaf Age. J. Chem. Soc. Pak. 2018, 40, 158–164. [Google Scholar]
  67. Whittemore, A.T.; Schaal, B.A. Interspecific Gene Flow in Sympatric Oaks. Proc. Natl. Acad. Sci. USA 1991, 88, 2540–2544. [Google Scholar] [CrossRef] [PubMed] [Green Version]
  68. Rieseberg, L.H.; Soltis, D.E. Phylogenetic Consequences of Cytoplasmic. Evol. Trends Plants 1991, 5, 65–84. [Google Scholar]
  69. Oh, S.H.; Manos, P.S. Molecular Phylogenetics and Cupule Evolution in Fagaceae as Inferred from Nuclear CRABS CLAW Sequences. Taxon 2008, 57, 434–451. [Google Scholar]
  70. Denk, T.; Grimm, G.W. The Oaks of Western Eurasia: Traditional Classifications and Evidence from Two Nuclear Markers. Taxon 2010, 59, 351–366. [Google Scholar] [CrossRef]
  71. Hubert, F.; Grimm, G.W.; Jousselin, E.; Berry, V.; Franc, A.; Kremer, A. Multiple Nuclear Genes Stabilize the Phylogenetic Backbone of the Genus Quercus. Syst. Biodivers. 2014, 12, 405–423. [Google Scholar] [CrossRef]
  72. Xiang, X.; Wang, W.; Li, R.-Q.; Lin, L.; Liu, Y.; Zhou, Z.-K.; Li, Z.Y.; Chen, Z.D. Large-scale phylogenetic analyses reveal fagalean diversification promoted by the interplay of diaspores and environments in the Paleogene. Perspect Plant Ecol. Evol. Syst. 2014, 16, 101–110. [Google Scholar] [CrossRef]
  73. Aldrich, P.R.; Cavender-bares, J. Wild Crop Relatives: Genomic and Breeding Resources; Springer: Berlin/Heidelberg, Germany, 2011. [Google Scholar] [CrossRef]
  74. Stegemann, S.; Keuthe, M.; Greiner, S.; Bock, R. Horizontal Transfer of Chloroplast Genomes between Plant Species. Proc. Natl. Acad. Sci. USA 2012, 109, 2434–2438. [Google Scholar] [CrossRef] [Green Version]
  75. Liu, B.B.; Campbell, C.S.; Hong, D.Y.; Wen, J. Phylogenetic Relationships and Chloroplast Capture in the Amelanchier-Malacomeles-Peraphyllum Clade (Maleae, Rosaceae): Evidence from Chloroplast Genome and Nuclear Ribosomal DNA Data Using Genome Skimming. Mol. Phylogenet. Evol. 2020, 147, 106784. [Google Scholar] [CrossRef]
Figure 1. Circular map of Lithocarpus dealbatus chloroplast genome representing the annotated genes in different colours according to their specific functions. The genes present on the inner circular map were transcribed clockwise, and those situated outside were transcribed anticlockwise. The darker grey colour inside the circle shows the GC content, while the lighter grey colour indicates the AT content. The chloroplast-genome borders were demarcated as LSC, SSC, IRA, and IRB regions. * represents the intron in genes.
Life 12 00828 g001
Figure 2. The comparative analysis of Ka/Ks ratio from Lithocarpus chloroplast genomes for individual genes.
Life 12 00828 g002
Figure 3. MAUVE alignment of L. dealbatus chloroplast genome against some of the representative species from Quercoideae. Within each of the alignments, the local colinear blocks indicate the identical conserved regions represented by the same colour and are joined by lines.
Life 12 00828 g003
Figure 4. Sequence alignment of Quercoideae chloroplast genomes by mVISTA, with annotated L. dealbatus chloroplast genome as the reference, (A) Sequence alignment of 1 to 80,000 bp, (B) Sequence alignment of 80,001 to 161,476 bp.
Life 12 00828 g004aLife 12 00828 g004b
Figure 5. Details of junction positions between inverted repeat regions and small and large single-copy regions across the compared Quercoideae genomes. Each gene is depicted in different colours. The genes present on top are transcribed on the positive strand, whereas those present below are transcribed on the negative strand. The complete genome size of each species is mentioned on the left side.
Life 12 00828 g005
Figure 6. Comparative analysis of tandem repeats across compared genomes, (A) Total number of tandem repeats distributed across the chloroplast genomes of seven studied species (B) Distribution of tandem repeats based upon their type in the chloroplast genome, (C) Frequency of tandem repeats based on their size in the chloroplast genome.
Life 12 00828 g006
Figure 7. Category of SSRs in the compared Quercoideae genomes. (A) Distribution of SSRs in simple and compound form; (B) Representation of SSRs based on their unit size; (C) Distribution of SSRs based upon the repeat motifs; (D) Density of SSR repeats showed in the chloroplast genomes of seven studied species.
Life 12 00828 g007
Figure 8. Comparison of the DNA diversity (Pi) values of protein-coding regions in Lithocarpus, Quercus, Castanea, and Castanopsis.
Life 12 00828 g008
Figure 9. Distribution of RNA editing sites in genes across the compared genomes.
Life 12 00828 g009
Figure 10. ML phylogenetic-tree construction based on the whole chloroplast genome of Quercoideae species by keeping Fagus species as an outgroup.
Life 12 00828 g010
Table 1. Details list of genes encoded by L. dealbatus chloroplast genome.
Gene CategoryGene Name
Ribosomal RNA genesrrn16 Drrn23 Drrn4.5 Drrn5 D
Transfer RNA genestrnA-UGC D *trnC-GCAtrnD-GUCtrnE-UUCtrnF-GAA
trnfM-CAUtrnG-GCC D *trnH-GUGtrnI-CAU DtrnI-GAU D *
trnK-UUU *trnL-CAA DtrnL-UAA *trnL-UAGtrnM-CAU
trnN-GUU DtrnP-GGGtrnP-UGGtrnQ-UUGtrnR-ACG D
trnR-UCUtrnS-GCUtrnS-GGAtrnS-UGAtrnT-GGU D
trnT-UGUtrnV-GAC DtrnV-UAC *trnW-CCAtrnY-GUA
Large subunit of ribosomal proteins (LSU)rpl2 D *rpl14rpl16rpl20rpl22
rpl23 Drpl32 rpl33rpl36
Small subunit of ribosomal proteins (SSU)rps2rps3rps4rps7 Drps8
rps11rps12 D *rps14rps15rps16 *
rps18rps19
DNA dependant RNA polymeraserpoArpoBrpoC1 *rpoC2
Photosystem IpsaApsaBpsaCpsaIpsaJ
Photosystem IIpsbApsbBpsbCpsbDDpsbE
psbFpsbHpsbIpsbJpsbK
psbLpsbMpsbNpsbTpsbZ
Cytochrome b/fpetApetB *petDpetGpetL
petN
ATP synthaseatpAatpBatpEatpF *atpH
atpI
ProteaseclpP **
RubiscorbcL
NADH dehydrogenasendhA *ndhB D *ndhCndhDndhE
ndhFndhGndhHndhIndhJ
ndhK
MaturasematK
Envelop membrane proteincemA
Subunit of acetyl-CoA-carboxylaseaccD
C-type cytochrome synthesis geneccsA
Conserved hypothetical chloroplast open reading framesycf1 Dycf2 Dycf3 **ycf4
* Genes with one intron. ** Gene containing two introns. D Gene harbouring duplicated copies.
Table 2. Comparative analysis of seven Quercoideae chloroplast genomes.
Species L. dealbatusL. balansaeL. hanceiC. henryiC. sclerophyllaQ. pannosaT. doichangensis
Genome size161,476 bp 161,020 bp 161,304 bp 160,907 bp 160,497 bp 161,222 bp 159,938 bp
LSC90,732 bp 90,596 bp 90,585 bp 90,527 bp 90, 255 bp 90,522 bp 89,445 bp
SSC18,987 bp 19,160 bp 18,959 bp 18,998 bp 25,675 bp 19,000 bp 19,295 bp
IR25,879 bp 25,632 bp 25,880 bp 25,961 bp 18,892 bp 25,850 bp 25,600 bp
Protein coding genes868787828685 81
rRNAs88 8 8 8 8 8
tRNAs3939 44 37 37 37 39
Duplicated genes2119 24 17 2117 17
CDS80,577 bp80,142 bp 80,199 bp 77,685 bp 79,647 bp 78,852 bp 71,778 bp
NCDS80,899 bp80,878 bp 81,105 bp 83,222 bp 80,850 bp 82,370 bp 88,360 bp
GC%36.736.7 36.7 36.7 36.8 36.9 37
CDS—coding sequence. NCDS—Noncoding sequence.
Publisher’s Note: MDPI stays neutral with regard to jurisdictional claims in published maps and institutional affiliations.

