
An Interactive Augmented Reality Graph Visualization for Chinese Painters

School of Architecture and Design, Beijing Jiaotong University, Beijing 100044, China
*
Author to whom correspondence should be addressed.
Electronics 2022, 11(15), 2367; https://doi.org/10.3390/electronics11152367
Submission received: 30 June 2022
/
Revised: 23 July 2022
/
Accepted: 24 July 2022
/
Published: 28 July 2022
(This article belongs to the Special Issue Advances in Tangible and Embodied Interaction for Virtual and Augmented Reality)
Abstract
:Recent research in the area of immersive analytics demonstrated the utility of augmented reality for data analysis. However, there is a lack of research on how to facilitate engaging, embodied, and interactive AR graph visualization. In this paper, we explored the design space for combining the capabilities of AR with node-link diagrams to create immersive data visualization. We first systematically described the design rationale and the design process of the mobile based AR graph including the layout, interactions, and aesthetics. Then, we validated the AR concept by conducting a user study with 36 participants to examine users’ behaviors with an AR graph and a 2D graph. The results of our study showed the feasibility of using an AR graph to present data relations and also introduced interaction challenges in terms of the effectiveness and usability with mobile devices. Third, we iterated the AR graph by implementing embodied interactions with hand gestures and addressing the connection between the physical objects and the digital graph. This study is the first step in our research, aiming to guide the design of the application of immersive AR data visualization in the future.
1. Introduction
Augmented Reality (AR) provides immersive experience in three dimensions (3D), offering new possibilities for engaging, embodied, and interactive data visualization [1,2]. Recent research in the area of Immersive Analytics [3,4] has indicated that the stereoscopic views and visual scalability of AR could improve the performance in data analysis tasks [5,6] and navigation processes [7]. In addition, its ability to connect the digital and physical world enables collaboration [4] and supports the perception of network structures [8].
A node-link diagram, often contains a set of nodes and a set of edges and can facilitate users understanding the overall structure of a graph and identifying existing relationships between two nodes [9,10]. Typical use cases include presenting structure and relations in social networks (e.g., [11,12,13]), road networks (e.g., [14]), as well as software networks (e.g., [15]). Additionally, a node-link diagram can represent knowledge and deliver information in a clear, novel and effective way, making it also an important method for educational activities [16].
2D visualization of a node-link diagram has been widely studied while challenging problems for 2D techniques in the design and layout of the graph, such as the edge crossings, the scalability of the data in terms of size and complexity, and the limitation of screen displays for visualization, interaction, as well as navigation in complex graph, have been identified [9,17,18].
Consequently, 3D visualization of node-link diagram has been proposed to eliminate issues of 2D techniques and offer a more effective way to identify links between certain nodes [19]. However, 3D layouts on 2D displays might introduce additional stereo cues and extra viewpoint navigation, such that the graph will appear differently based on the rotation, zoom, and angle adjustment on the screen, making the graph become more complicated to understand and interact with [9].
Utilizing the capability of AR to visualize node-link diagram on top of the real world has the potential to overcome the limitations. Combining AR and a node-link diagram can provide an immersive and ubiquitous experience that engages users to explore, embed richer information and content that extends the boundaries of the graph, and deal with data sets that have a strong connection to the physical objects or space. Belcher et al. [20] also identified three potential benefits of an AR node-link diagram, including increased comprehension, larger display, and enhanced spatial recall of the graph.
Despite the great potential of an AR node-link diagram, there is still a lack of research on how to design the AR graph to enable engaging, interactive, and effective data visualization [1]. With the increasing importance of AR visualization and the growing size of data, how to design an AR graph is of utmost importance, together with user studies to practically evaluate the visualization [8].
Our motivation for this study is twofold: first, we aim to explore opportunities of combining AR and a node-link diagram to create immersive visualization. Second, we also aim to investigate the design space of an AR graph to better utilize its embodied interactions and the ability to connect the physical objects and the digital graph.
In this paper, we first systematically describe the design process of the AR graph. We use the social network data of early Chinese painters in our study based on the database we have been built since 2014. We build an AR graph to visualize the teacher-student relationship of these painters. Then, we validate our AR concept by implementing a prototype and conduct a user study with 36 participants to examine users’ behaviors in the AR graph and the 2D graph. Third, we report on feedback collected from the user study and present the AR graph again with iterated features and interactions. With this exploratory work, we provide inspirations and an informed basis to guide the development of an AR graph in the future and identifying opportunities of the application of immersive AR data visualization.
2. Related Work
2.1. Augmented Reality Data Visualization
AR data visualization has attracted considerable attention in recent research area [2,21,22]. Research has concentrated on examining the advantages of AR visualization in comparison to traditional means. For example, Bach et al. [23] examined the effectiveness of three visualization environments for common 3D scatter-plots exploration, including an AR headset, a desktop setting, and a tablet-based AR. They found that each of the immersive AR environments was more effective for highly interactive tasks that require detailed manipulation. Similarly, Kirshenbaum et al. [24] compared the effectiveness and user engagement of geographical data projected on a 2D surface and a physical 3D terrain for geo-visualization tasks. According to their study, the 3D visualization supported the tasks better due to its ability to provide physical shapes.
Some research has investigated the integration of AR technology with traditional displays. Reipschläger et al. [25] proposed the combination of AR with large interactive displays for information visualization in order to enhance the data exploration and analysis. Wang et al. [26] conducted an observational study to understand how an immersive AR headset could be used as an extension to the traditional PC-based data analysis tools to analyze particle physics simulations. The results of their qualitative study showed that the AR HMD effectively improved experts’ understanding of particle collision events. Langner et al. [17] proposed MARVIS, which was a conceptual framework for immersive visualization with tablet devices and AR headsets. Their case studies demonstrated the benefit of combining multiple mobile devices with AR headsets for data visualization and data analysis. Hubenschmid et al. [21] also presented a spatially-aware tablets combined with AR headsets for immersive data visualization and revealed that the novel interaction concept was appreciated by users. They also provided various design insights to foster the development of spatially-aware touch devices in AR settings.
Beyond extending traditional visualization techniques, some research has also addressed the capability of AR to combine the virtual content with physical objects. Mahmood et al. [27] presented a way to create multiple coordinated spaces for data analysis in a physical environment and found the great flexibility of combining visualization on 2D displays and AR. Chen et al. [28] designed and implemented an AR environment for static visualization that combined the digital world with physical objects, such as books, posters, projections, and wall-sized visualization. They reported a user study that showed high user satisfaction when using the proposed AR system and confirmed that the system was quick and easy to operate.
Several studies have also carried out practical toolkit on how to transfer 2D data into 3D representation to create immersive data visualization in AR, such as DXR [22], MARVisT [28], and IATK [29].
Overall, previous works demonstrated the value and the great potential of AR data visualization in general. Meanwhile, previous research on AR data visualization involved diverse graph types, such as scatter-plots, bar-plots, line-charts, etc., but did not focus on node-link diagram specifically. A node-link diagram could lead to less unified user experience due to the lack of predefined axes, dimensions and directions, making it more complicated to carry out design decisions and solutions [8]. Thus, we delve deeper into AR visualization for node-link diagram specifically in the next section.
2.2. Augmented Reality Node-Link Diagram Visualization
A node-link diagram, a traditional statistical visualization strategy, is the most commonly used graph type to visualize the overall network structure and specific relational links [9,30]. With the ever-increasing size of the data and and complexity in data analysis, researchers have advocated for innovative and interactive features to visualize a node-link diagram [31,32].
With the advantages of the novel and immersive technology, there has been an increasing interest in making AR available for node-link diagram visualization. For example, Drochtert et al. [33] explored the design and implementation of an AR visualization prototype that consisted of several mobile devices, which were used as tracking targets in AR. The prototype also allowed simultaneously interactions among multiple users. However, the study lacked a design rationale and did not develop further evaluation in respect to the effectiveness of the interaction and visualization in AR.
Other research has addressed the evaluation of the usefulness and effectiveness of an AR node-link diagram. Ware and Franck [18] examined the effect between a 2D and 3D node-link diagram on monitor screens, using path-finding tasks with different stereo cues to evaluate users’ performance. Their study results showed that a 3D graph enhanced accuracy and spatial comprehension for abstract data analysis with the depth and motion cues it provided. Belcher et al. [20] compared the effect of using AR for graph link analysis to a desktop interface. According to their study, a tangible AR interface was better suited in the graph exploration than the desktop interface, while the stereo-graphic viewing had little effect on comprehension and task performance.
In previous studies, a Head-Mounted Display (HMD) has also been utilized as a data visualization tool, but many only focused on virtual reality and did not consider AR settings. Cordeil et al. [34] compared a CAVE-style environment and a VR HMD in the analysis of network connectivity and presented an in-depth analysis of the difference between a CAVE environment and a VR HMD for collaborating data analysis tasks. According to their study, a VR HMD could lead to faster collaboration, making it a suitable alternative to the more expensive CAVE devices, which is more accessible to reach a larger audience. Kwon et al. [35] also studied a VR HMD for graph visualization, comparing its usage for the 2D representation and the 3D representation. Bacim et al. [36] conducted a study, in which the authors studied how display fidelity affected graph analysis performance in a VR HMD and found evidence that more immersive displays could offer significantly better overall task performance with higher display fidelity.
The detailed design and interactions of an AR node-link diagram, which can be especially challenging in immersive environments, have also been addressed in previous studies. Büschel et al. [37] examined how to visualize edges in a 3D node-link diagram to support efficient analysis in AR. They implemented eight edge variants and compared these different variants with eight participants. They reported on the findings of an initial study in which they compared these different variants and found that most variants achieved similar results. Participants slightly preferred to have colored edges in the AR graph, while blinking edges were rated low. Büschel et al. [1] conducted another study focusing on the design space for edge styles through comparing six different variants, including straight edge, curved edge, dashed edge, animated edge, glyph edge, and tapered edge, and reported on the results of a quantitative user study with 18 participants. The tasks applied in the study were typical graph exploration tasks, where participants were asked to find paths between two highlighted nodes. The results of the study showed that all participants were able to solve the tasks and there was no significant difference in terms of task completion time or accuracy rates. Notably, the tasks with longer paths were perceived as more difficult. The authors did not give a single clear recommendation for the edges to apply and developers were suggested to freely choose from the variants when designing for their use cases in particular.
Sun et al. [38] specifically investigated on how users would manage their spatial relationship with an AR node-link diagram with different graph scales, namely the room-scale and the table-scale. Through a user study with 16 participants solving two logical reasoning tasks by interacting with the AR graph, the study revealed three types of spatial arrangements and studied different user preferences under different scale conditions. However, the study did not examine the factors that would influence users’ performance and behaviors in completing tasks. Moreover, the study demonstrated the graph with seven edges only. Schwajda et al. [39] transformed 2D graph data visualization for planar displays into AR spatial space with pull and drag gestures and identified a variety of factors influencing users’ perception with an AR HMD. The authors believed that with proper design choices, the data visualization transitions from 2D to AR can leverage the efficiency and productivity of data analysis tasks. However, the study required further empirical study.
Our review of the related work shows that although previous studies have shown the potential of using AR for node-link diagram visualization, the research area is still in the early stage of development and the structured research into the design of an AR graph is largely underrepresented. Existing studies focused on the comparison of an AR graph to other methods, but did not pay much attention to the aspects such as interactions. Some studies lacked empirical evaluation. The research that investigated the embodied interactions with mobile devices was rare too. There is a rich space worthy of extensive and systematical exploration. As an important step toward a better understanding of this design space and to address existing gaps, we present and study a mobile based AR graph.
3. Design
3.1. Design Process
We are interested in exploring the design space of an AR graph for relationship visualization. To that end, we built an AR graph based on the database of Chinese painters. The database includes painters of all dynasties in China, using a relational database management system with information from academic works, papers, historical documents, etc., as the basic source of data. The database not only contains basic information of painters such as their names, places of origin and works, but also the social network of their family relationship, teacher-student relationship, and friendship relationship. As of 2021, a total of 29,893 painters have been included in the database. In this study, we first included painters involved in the path of a teacher–student relationship between two famous Chinese painters, resulting in 31 nodes (painters) and 108 edges (relations) in the graph.
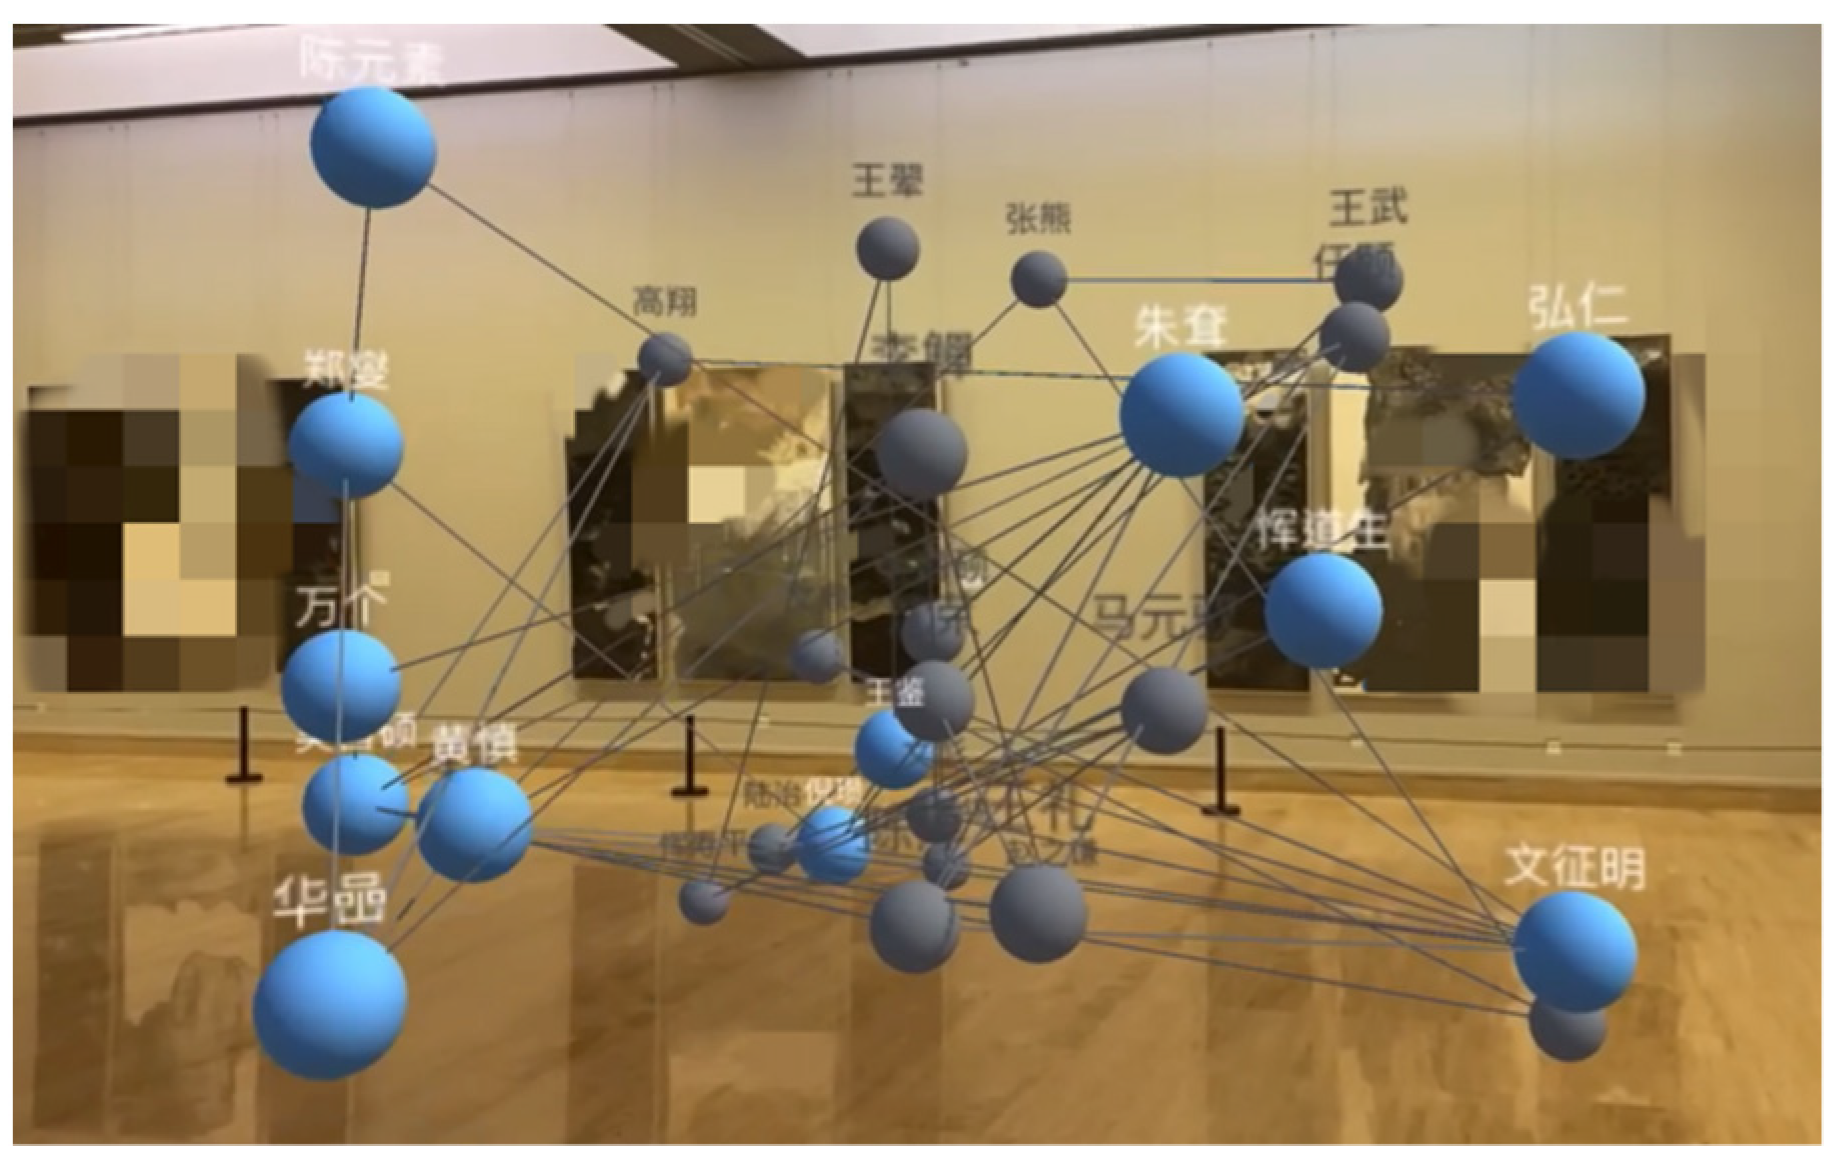
We developed a prototype that could process JSON data in Unity3D, to generate nodes with text on top representing the names of painters and edges to link them in an AR environment. Figure 1 shows the application of the AR graph in an art gallery.
3.1.1. Layout Strategy
The typical visualization methods for a 2D node-link diagram are constraint-based and force-directed in 2D depending on whether it is based on a mechanical model [40]. The force-directed layout is a popular layout technology, especially for the network diagram visualization [41,42], which can display the overall structure of the network and the connections between nodes [16]. The algorithm of the force-directed approach described in [41] is achieved by utilizing attractive and repulsive forces between nodes: the attractive force will connect nodes with links, and the repulsive forces will push each other away if they are getting too close to each other.
In our study, we utilized the physics engine in Unity to simulate the two types of forces. To be more specific, we used the game component Spring Joint in Unity as the attractive force, which can connect two nodes to each other so that if one node moves the other one will also move together. With this feature, the two nodes that are linked to each other can be connected. What’s more, we used the game component Collider in Unity to represent the repulsive force. The Collider defines the boundary of a node so that it can remain a distance set by the size of the Collider between nodes.
3.1.2. Interaction Paradigms
In this paper, we followed an approach that was solely based on mobile devices. We deliberately considered no other display since that mobile devices are ubiquitous and widely used in everyday life [17]. Users do not need to spend extra time on learning new types of interactions and will focus on the interaction with the AR graph. We first designed the interactions with the touch capability of mobile devices since it could suit precision requirements for engaging with detailed visualization tasks [17]. We will examine its effectiveness by observing users’ behaviors with three basic interactions:
Click. By performing a single touch on a node, it will be highlighted, together with the nodes that are connected to it. See Figure 2A.
Drag. By performing a long touch on a certain node, the user can move it around and place the node in different positions. All the nodes that are related to the dragged node will be moved together. See Figure 2B.
Move. By moving physically around the room, the user can manipulate the viewpoint. The user can obtain an overview by stepping back, or explore certain nodes in details by moving close to the nodes. It should be noted that the text showing the names of the painters will always face to users no matter what angles they rotate. See Figure 2C.
3.1.3. Colors and Scale
In the study of Büschel et al. [37], the authors mapped different colors to the edges and found that participants felt that they could discern different colors. However, there was no conclusion for the preferred colors in the graph. In their later study [1], they used colors of gray and blue in the graph, the sphere to represent the nodes, and six variants for the edges. Regarding to the scale and size of the AR graph, Sun et al. [38] presented an initial study to compare a room-scale graph and a table-scale graph. According to their study, the room scale brought benefits of a clearer view and wider interaction space, as well as the convenience to obtain different perspectives of the visualization. Overall, there has been a lack of research regarding the aesthetics of the graph, leaving unanswered to the basic question of how to design the nodes and edges in AR settings in terms of their colors, shapes, and size [8]. In our current study, we used the colors the same as in our database, which are also similar to the colors used in the work of Büschel et al. [1], including gray and blue. The shape of the nodes was spherical, and for the edge it was a line, as most 2D graphs use circle and line. The graph was in a room-scale with size of 50 (w) × 120 (d) × 100 (h) in cm referring to the size of the laboratory room.
4. User Study
The purpose of this study is to evaluate users’ experience with the AR graph and explore the design space for further development. We also developed a 2D graph so that participants could compare the two methods for their pros and cons and make improvement suggestions to the AR graph. The nodes in 2D graph were randomly distributed, applying the same interaction paradigms and appearances as the AR graph. It should be noted that we were not aiming to compare 2D and the AR graph. Instead, we shifted the evaluation focus towards the interaction and design of the AR graph by comparing a novel visualization with a traditional visualization, and further identifying envisioned improvements. To narrow the scope of our study, we chose tasks that do not require pre-knowledge of visual data analysis. We collected data from each participant to gain further insights. See Figure 3 below.
Figure 3a shows the laboratory room. The room has no windows and the color of the light is white. The color of the wall is light gray. The experiment settings were the same for users to experience with the AR graph and the 2D graph. Figure 3b,c depict the AR graph. With the AR graph, the user saw the graph through the camera of the mobile device with the nodes distributed in the space. The user had to move around the room by walking and turning around to see the nodes. Figure 3d,e show the 2D graph, where the user interacted with the nodes via a 2D screen.
4.1. Experiment Design
We designed a within-subjects study with a counter-balanced order across participants. Participants performed the 2D graph and the AR graph with the data of 31 nodes and 108 edges. Lee et al. [43] defined the most common analysis tasks of graph data, including topology-based tasks, browsing tasks, overview tasks, and attribute-based tasks. Our study focused on the low-level topology-based tasks to assess the potential use of the AR graph.
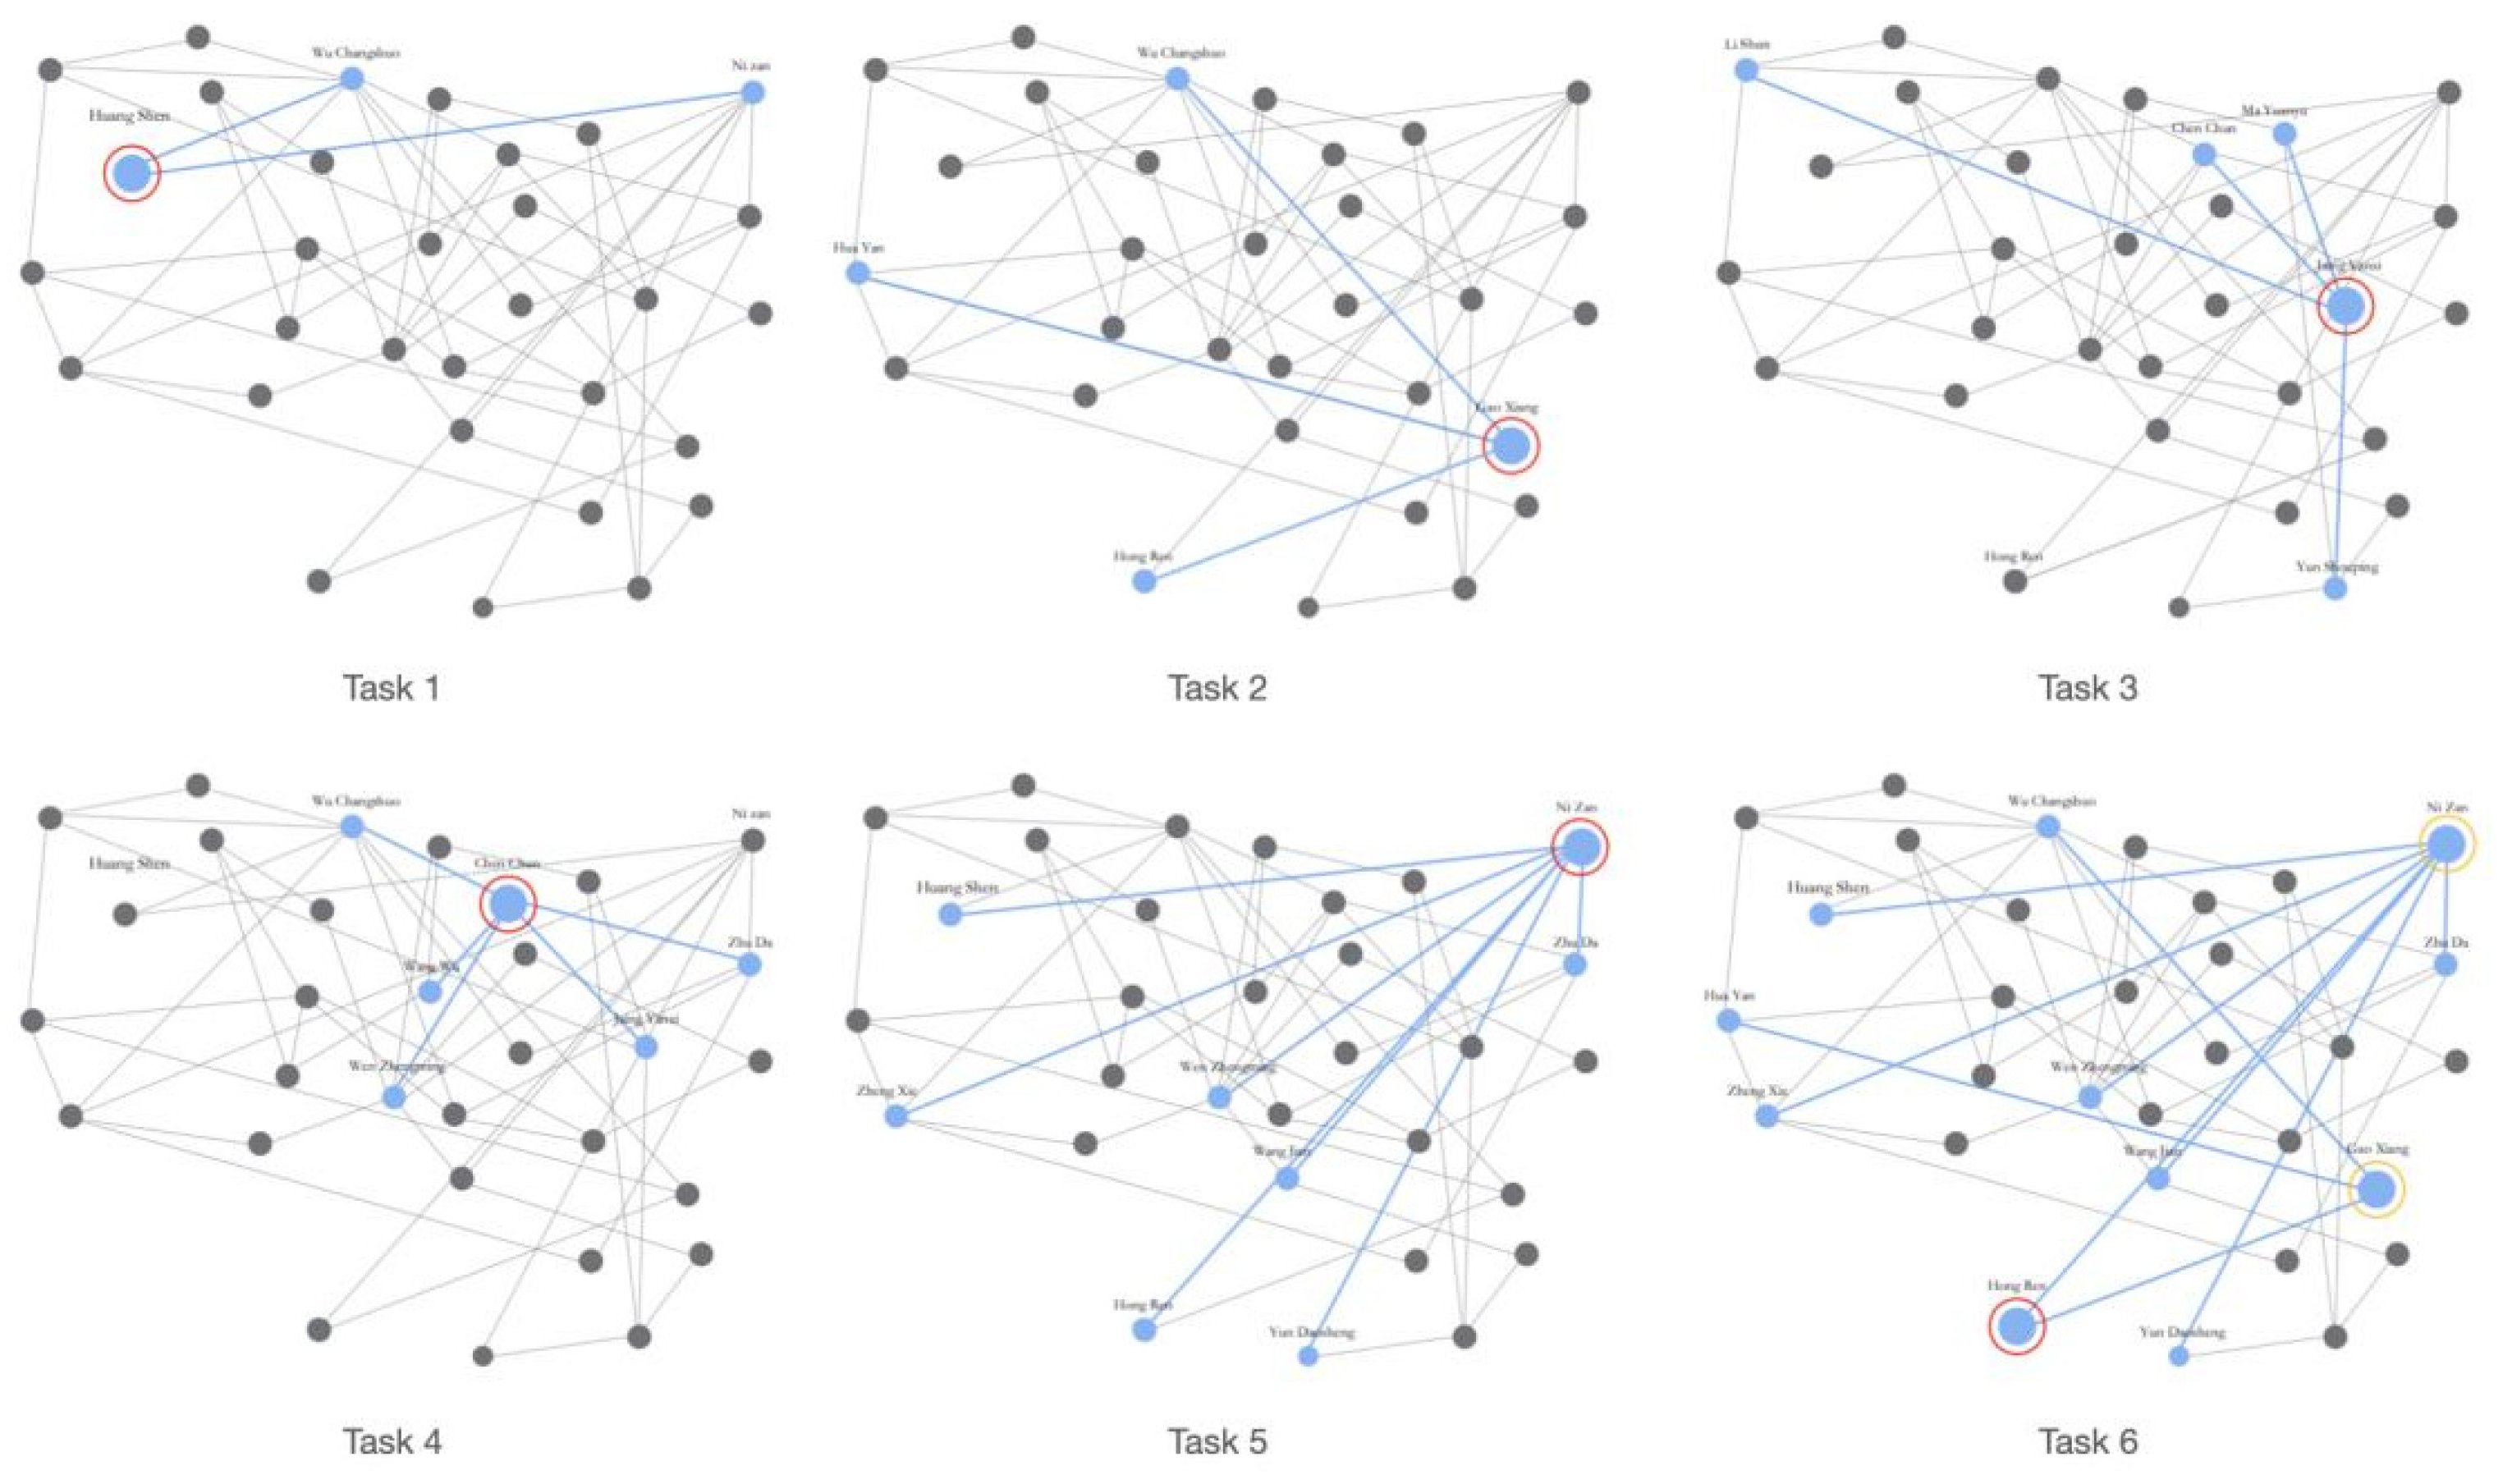
The first type of task was to count all nodes that are related directly to the given node. Based on the number of the linked nodes, we divided the tasks into five levels. To be more specific, in task 1, we asked about the painter who had teacher-student relationships with two other painters (2D: Who have the direct teacher-student relationship with Huang Shen? AR: Who have the direct teacher-student relationship with Chen Yuansu?). In task 2, we asked about the painter who had teacher-student relationships with three other painters (2D: Who have the direct teacher-student relationship with Gao Xiang? AR: Who have the direct teacher-student relationship with Lu Zhi?). In task 3, we asked about the painter who had teacher-student relationships with four other painters (2D: Who have the direct teacher-student relationship with Jiang Yanxi? AR: Who have the direct teacher-student relationship with Li Shan?). In task 4, we asked about the painter who had teacher-student relationships with five other painters (2D: Who have the direct teacher-student relationship with Chen Chun? AR: Who have the direct teacher-student relationship with Zhua Da?). In task 5, we asked about the painter who had teacher-student relationships with seven other painters (2D: Who have the direct teacher-student relationship with Ni Zan? AR: Who have the direct teacher-student relationship with Wen Zhengming?). For the same task level, the questions involved the same number of nodes for the 2D graph and the AR graph, but for different painters. Task 6 involved second-degree teacher-student relationship, meaning that participants would need to click on the given node first, and then after the related nodes (first degree) showed up, they would need to click on the nodes to find out the nodes with second-degree relationship (2D: Who have the second-degree teacher-student relationship with Hong Ren? AR: Who have the second-degree teacher-student relationship with Wen Ding?).
Figure 4 shows the example of each task. The given node (given painter) in the diagram was highlighted in red circle. The related nodes (first degree) were highlighted in orange.
4.2. Measurements
The following measures were captured over the course of the experiment. We recorded the completion time to finish each task in seconds and the accuracy rate as scores in completing the tasks (score 1 for obtaining the correct answer, score 0 for the wrong answer). In addition, the user experience questionnaire (UEQ) [44] was applied as the evaluation of the exploring experience with a five-point Likert-scale. UEQ contains 6 scales and 24 items, including attractiveness, perspicuity, efficiency, dependability, stimulation, and novelty. The pre-test and post-test regarding the knowledge of Chinese painters were filled in to evaluate and compare the learning performance. The pre-test worked as the baseline of participants with six questions related to the student-teacher relationships among the 31 painters. The pre-test included the same questions chosen randomly from questions asked in task 1–6. Another two post-tests were conducted after using the AR graph and the 2D graph with the questions the same as the tasks they just finished and the average scores were calculated. The experimental process was also observed and recorded with the consent of the participants. Figure 5 depicts the overall procedure of the experiment.
4.3. Participants and Procedures
In total, 36 undergraduate and postgraduate students (18 men and 18 women) volunteered for this experiment. They ranged in ages from 18 to 27. We asked participants how familiar they were with Chinese painters. Only five participants indicated that they knew about Chinese painters a little bit. The rest of the participants stated that they did not have any prior knowledge.
The experiments were conducted in a laboratory room with two desks and two chairs. Experimental stimuli were presented on the iPhone 12.
Participants first filled in a pre-test with six questions to find out their prior knowledge of Chinese painters. Then the instructions of how to use the graph as a tool to complete the tasks were presented to the participants. In the experimental process, participants used a 2D and AR graph to complete the six tasks respectively and filled in the questionnaire for each graph. The starting point for the AR graph was marked on the ground and the virtual scene stationary was placed in the middle of the room.
After experiencing each graph, they also finished a post-test with the same six questions to test their learning performance. At the end of the experiment, participants were interviewed to express more opinions regarding to both graphs.
The entire experiment, including pre-test, instructions, formal experiment, and post-test, took around 30–40 min to complete.
5. Results
In the following section, we present the results of the experiment in details. For each dependent measure of completion time, accuracy rate, learning performance, and user experience, we used the repeated measures ANOVA in SPSS, analyzing the within-subjects’ factors of different types of graphs and different tasks.
5.1. Completion Time
The ANOVA showed significant main effects on completion time for different types of graphs (F(1,35) = 20.11, p = 0.000, η2 = 0.365). It took significantly more time to complete all tasks with the AR graph (M = 49.93 s, SD = 15.73 s) than with the 2D graph (M = 38.05 s, SD = 10.71 s). See Figure 6.
There were also significant main effects on completion time for different tasks (F(5,175) = 109.04, p = 0.000, η2 = 0.757). The more nodes and edges involved, the more time was spent on completing the tasks: task 1 (M = 20.99 s, SD = 1.45 s), task 2 (M = 25.76 s, SD = 2.27 s), task 3 (M = 30.64 s, SD = 2.26 s), task 4 (M = 35.35 s, SD = 2.23 s), task 5 (M = 40.54 s, SD = 2.21 s), and task 6 (M = 110.64 s, SD = 6.96 s).
There was a significant interaction effect of graph types and different tasks (F(5,175) = 8.618, p = 0.000, η2 = 0.198). Post-hoc tests showed that when visualized in a 2D graph, the more complicated tasks that involved more nodes and edges took significantly longer time to complete: there was no significant difference in completion time for the first four tasks, while task 5 took significantly more time than task 1 (p = 0.000), task 2 (p = 0.000), and task 3 (p = 0.041). Task 6 took significantly more time than all the other five tasks (p = 0.000).
When visualized in the AR graph, the numbers of nodes and edges involved in the tasks seemed to not influence the completion time: there was no significant difference in the first five tasks, while task 6, which was more complex with indirect relations, took significantly more time than task 1 to 5 (p = 0.000).
5.2. Accuracy Rate
Regarding the accuracy rate, ANOVA showed significant main effects for graph types (F(1,35) = 12.80, p = 0.001, η2 = 0.268). Completing tasks with the 2D graph (M = 0.77, SD = 0.20) was more accurate than completing with the AR graph (M = 0.62, SD = 0.22).
There were also significant main effects on the accuracy rate for different tasks (F(5,175) = 12.28, p = 0.000, η2 = 0.260). The accuracy rate and the complexity of the tasks were negatively correlated: task 1 (M = 0.83, SD = 0.04), task 2 (M = 0.81, SD = 0.05), task 3 (M = 0.72, SD = 0.05), task 4 (M = 0.74, SD = 0.04), task 5 (M = 0.68, SD = 0.05), and task 6 (M = 0.40, SD = 0.06). See Figure 7.
There was a significant interaction effect of graph types and different tasks (F(5,175) = 2.67, p = 0.023, η2 = 0.070). Post-hoc tests showed that for the 2D graph, there was no significant difference in the accuracy rate for the first five tasks except that task 1 was answered significantly more accurate than task 5 (p = 0.026). Tasks 1 to 5 were completed significantly more accurately than task 6 (p ≤ 0.000).
When completed with the AR graph, there was no significant difference in all the tasks for their accuracy rate. In addition, the 2D graph was significantly more accurate than the AR graph when the task was relatively easy (e.g., task 1, p = 0.000). For more complicated tasks such as task 5 and task 6, there was no significant difference.
5.3. Learning Performance
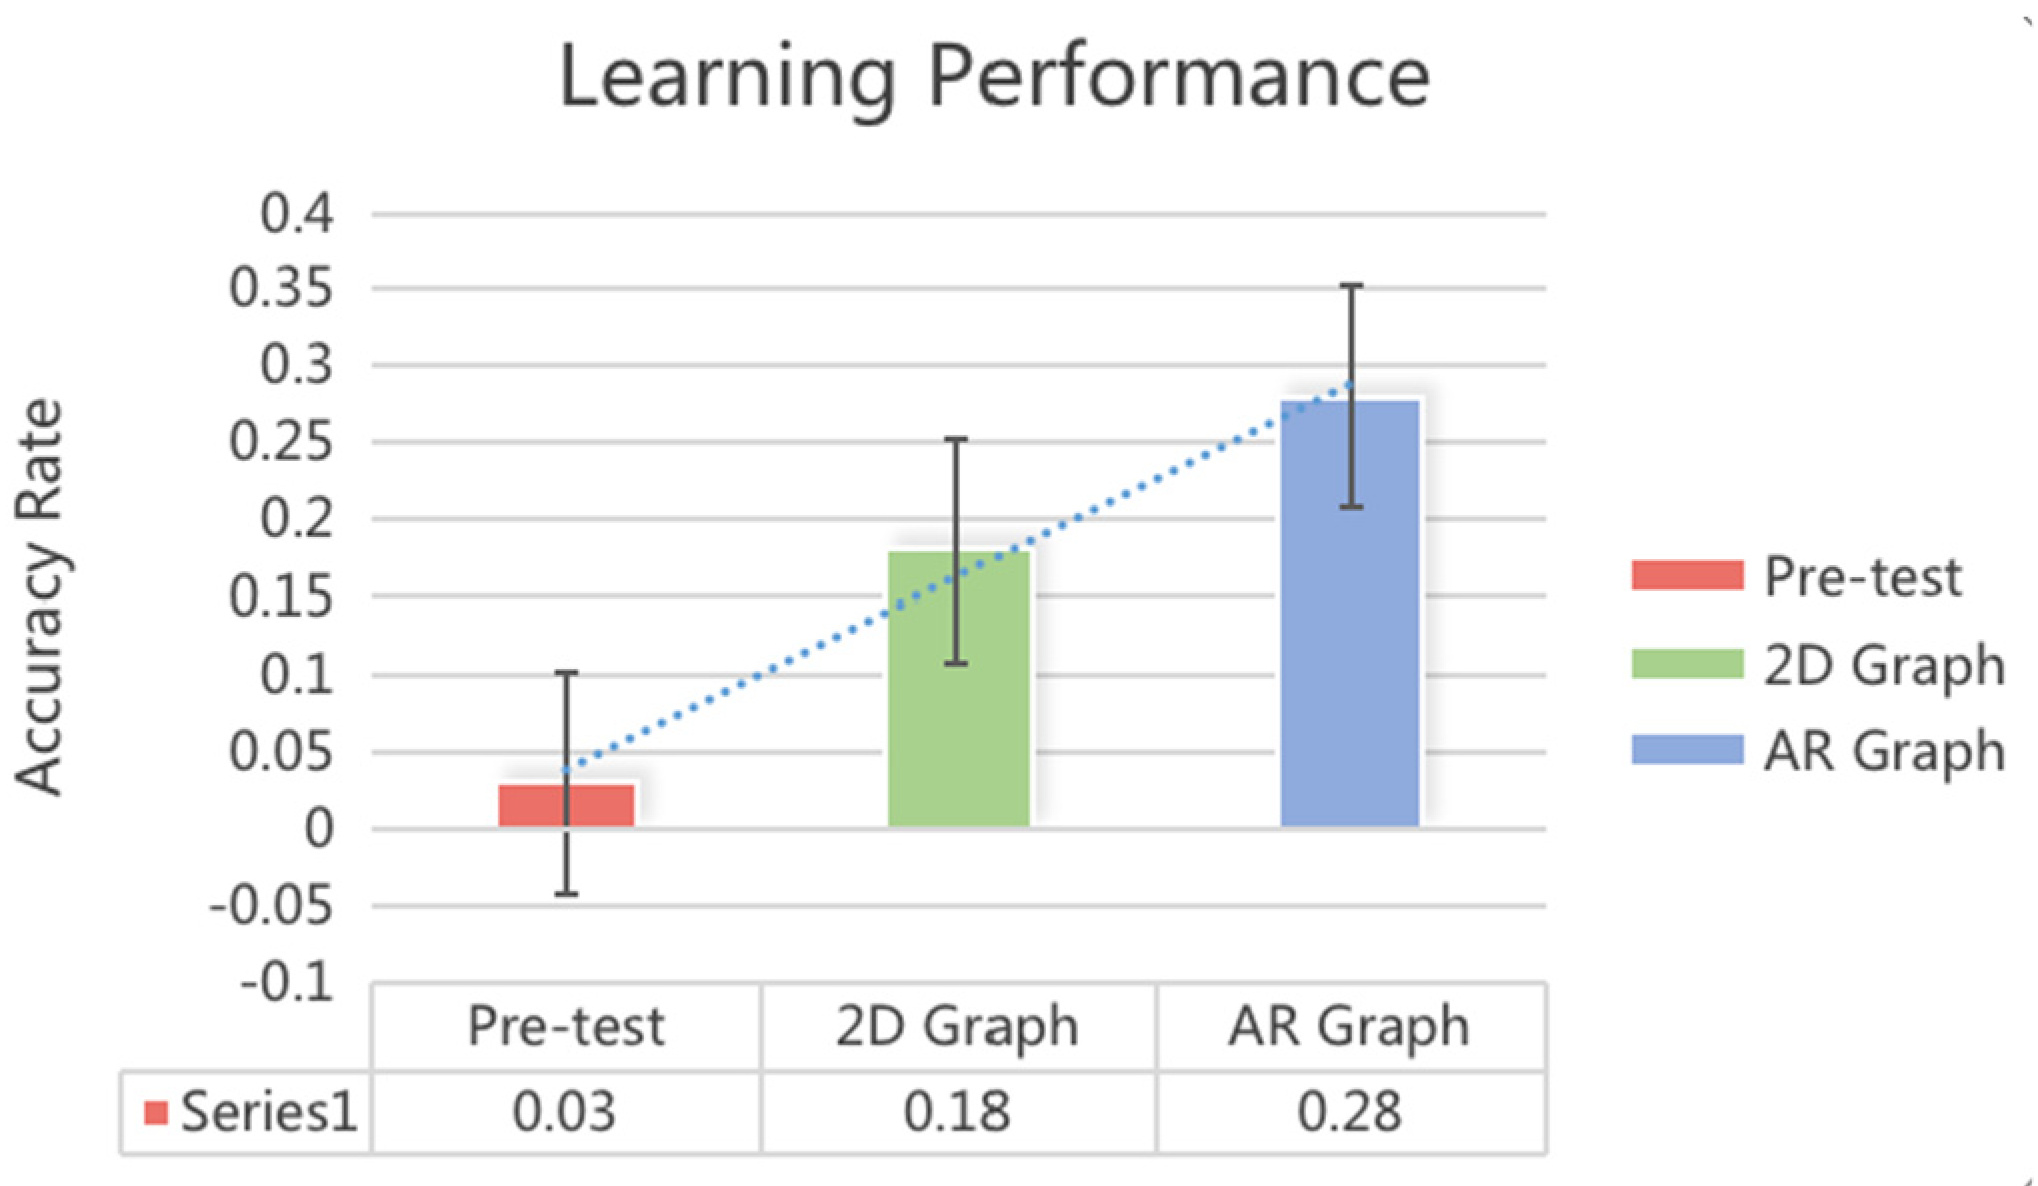
There were significant main effects in the post-test for different graph types (F(1,35) = 12.87, p = 0.001, η2 = 0.269). The AR graph (M = 0.28, SD = 0.17) resulted in a better learning effect than the 2D graph (M = 0.18, SD = 0.13). When compared on the pre-test and the post-test, the learning performance for the AR graph was significant for the 2D graph, the learning performance was not significant. See Figure 8.
5.4. User Experience
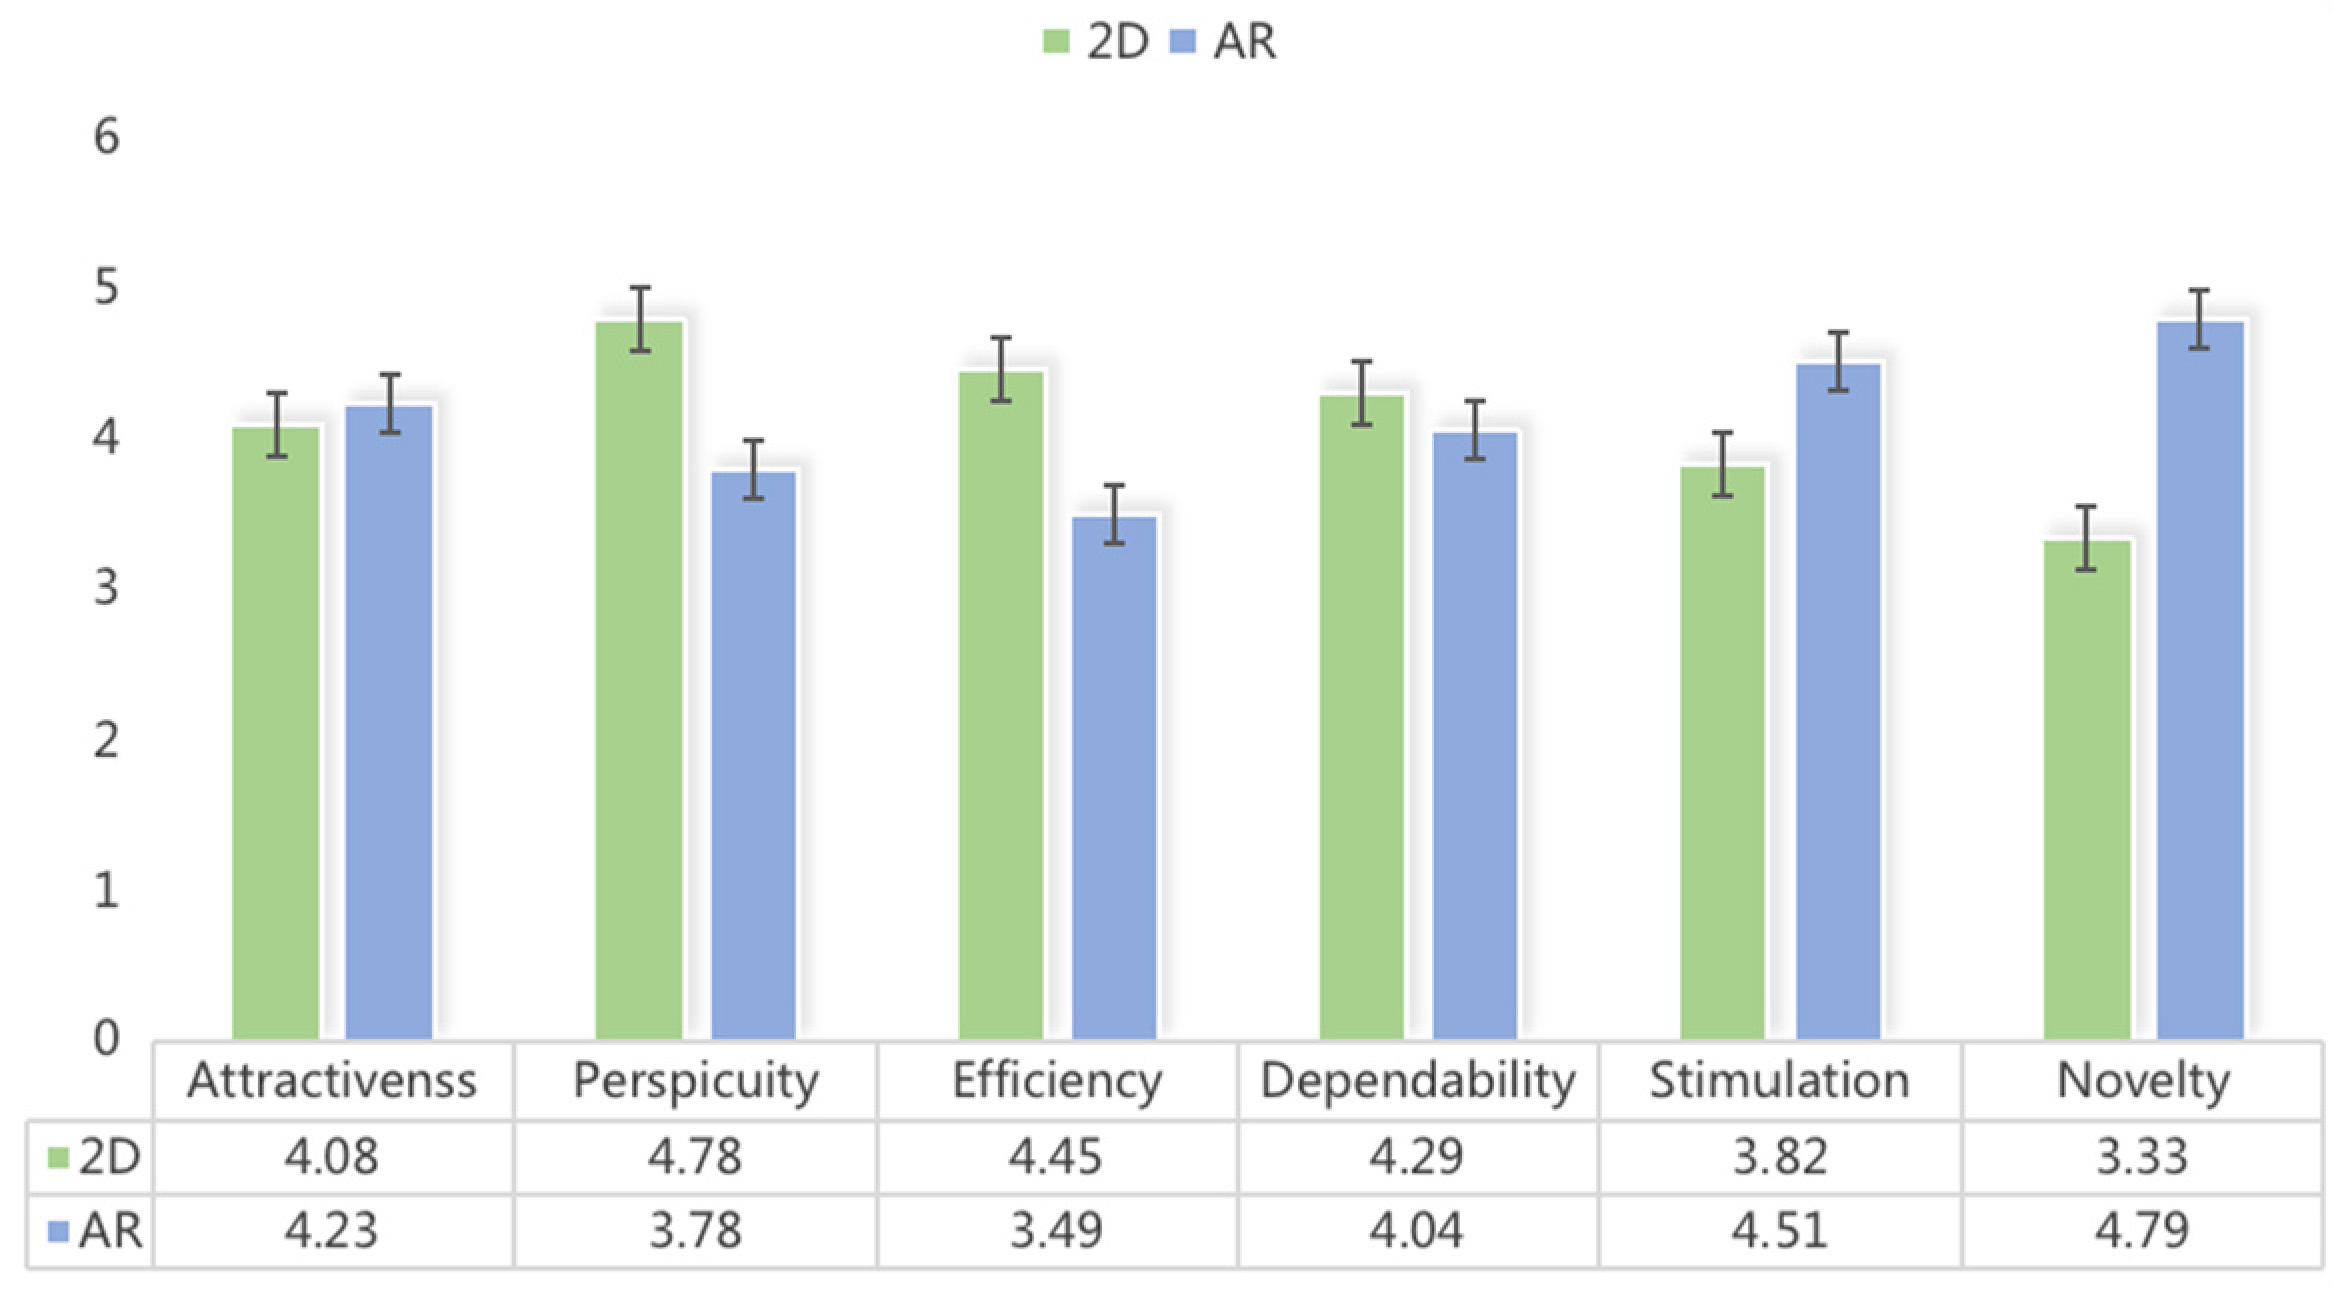
All categories in UEQ had significant differences for different graph types. The 2D graph was rated higher in terms of perspicuity (F(1,35) = 71.73, p = 0.000, η2 = 0.672), efficiency (F(1,35) = 132.00, p = 0.000, η2 = 0.790), and dependency (F(1,35) = 6.36, p = 0.016, η2 = 0.154). To be more specific, the 2D graph was perceived as easier to become familiar with than the AR (perspicuity: 2D (M = 4.78, SD = 0.34) vs. AR (M = 3.78, SD = 0.57)); participants could solve tasks with the 2D more efficiently without unnecessary effort than with the AR (efficiency: 2D (M = 4.45, SD = 0.35) vs. AR (M = 3.49, SD = 0.50)); and they felt in control of the interaction with the 2D graph more than with the AR (dependency: 2D (M = 4.29, SD = 0.58) vs. AR (M = 4.04, SD = 0.30)).
On the other hand, the AR was rated higher in terms of attractiveness (F(1,35) = 4.28, p = 0.046, η2 = 0.109), stimulation (F = 61.89, p = 0.000, η2 = 0.639), and novelty (F = 240.06, p = 0.000, η2 = 0.873). Participants liked the AR graph more than the 2D graph in general (attractiveness: 2D (M = 4.08, SD = 0.37) vs. AR (M = 4.23, SD = 0.31)); and it was perceived as more exciting and motivating to use the AR graph than the 2D (stimulation: 2D (M = 3.82, SD = 0.49) vs. AR (M = 4.51, SD = 0.39)). The AR graph was also considered as more innovative and creative than the 2D (novelty: 2D (M = 3.33, SD = 0.55) vs. AR (M = 4.79, SD = 0.21)). See Figure 9.
5.5. Interview and Observation
During the interview session, we asked participants to express their feelings on the two graphs. The answers from participants were aligned with the results of UEQ. Participants thought the 2D graph was more direct and efficient for completing tasks: “it is more direct and clearer, we can use it to find the relationship easily” (p2); “we can use it to do assignments and get the information quickly” (p11); “I can move the graph by simply touching the screen, it is more direct” (p21). The AR graph was preferred by participants with the reasons of fun and immersive experience, and perceiving the sense of space: “it was more fun with the AR graph, like a game, while the 2D graph could be useful for homework” (p32); “everything was happening in the real world, I could see different things from different positions” (p34).
Although we told participants that they could use as much time as they needed, most of them still tried to complete tasks as fast as they could without taking time to remember the relationship among the painters. When asked how to improve the learning performance with the AR graph, they would like to see richer information about a certain painter to help them discover more knowledge: “more elements can be filled into the AR graph, such as the descriptions of the artists and their paintings” (p5).
Meanwhile, we observed that when interacting with the AR graph, participants frequently touched the wrong nodes over the one they expected via the touch screen. Another common behavior in participants was trying to scale the AR graph with their fingers pinching on the screen rather than physically moving in the room, especially in the beginning of the experiment, “when I was touching and moving the nodes, I always forgot that I could move around to adjust my view point”(p17); “it was interesting to explore in the room, but it could be better if I could adjust the angles and scales through the screen as well” (p12).
5.6. Discussion of the Results
The results of our study showed that the overall completion time with the 2D graph was shorter than with the AR graph. This could be caused by the time spent walking around the room physically. Meanwhile, our results revealed that in the 2D graph, it took a longer time to complete tasks with more nodes and edges, while it will not affect the performance in the AR graph, indicating the potential to use the AR graph to deal with larger data set.
For the accuracy rate, the 2D graph outperformed the AR graph in more simple tasks with less nodes and edges or one-degree. When it was becoming more complicated, the accuracy rate in the 2D dropped, but had no effect in the AR. This also supports the capabilities of AR to visualize more complicated graphs. The lower accuracy rate in AR might be caused by ignoring the nodes behind when participants did not move or change angles in the physical world, or by mis-touching on the wrong nodes in AR.
The scores of the pre-test were extremely low due to the lack of knowledge of early Chinese painters among students. Experiencing with the AR graph, the learning performance was better improved than with the 2D. One possible reason for this is that participants spent more time in AR. Another possible explanation is that the spatial layouts and embodied movements could enhance the recall and comprehension of the graph, which was also mentioned in previous works (e.g., [20]).
The results of UEQ were divided into two parts. On one hand, participants perceived the AR graph as more exciting and motivating, innovative and creative, and attractive over the 2D graph. On the other hand, the 2D graph was easier to become familiar with and could help them solve their tasks without unnecessary effort. They felt in control of the interaction more with the AR graph.
6. Iterations
Design
The study results demonstrated that AR could be utilized as an engaging way for data visualization especially with graphs with more nodes and edges. However, the results also revealed that current interactions in the AR graph with a touch-screen and embodied movements might introduce interaction challenges in terms of effectiveness and usability. Based on these insights, we iterated the current AR graph to implement more:
- Embodied interactions with hand gestures
- Connection between the physical objects and the digital graph
Figure 10 shows the iterated interaction process: (0) when scanning a painting in the real world with the mobile device, the node of the painter will show up (the blue sphere). (1) If the user use their hand to touch a certain node, the node will be highlighted in blue, and the other nodes that are directly linked to the touched-node will show up. (2) The user can hold a certain node to obtain further information, e.g., the painting of the painter being held will show up. (3) The user can then grab the virtual painting and move it next to the real painting or to anywhere in the space. The interaction paradigms are applicable for all nodes, applying the AR Foundation SDK and ManoMotion SDK on iPhone 12.
We asked six participants to try the iterated AR graph and collected initial feedback from them. According to the participants, it was easy to interact with the virtual objects with their hands, “the interaction was easy to understand, I can touch or move the virtual objects just like in the real world” (p1); “it is convenient to interact with hands” (p5). With the hand-gestures, participants did not touch the screen but moved physically in the room in a more natural way.
Participants also appreciated the feature to obtain the painting in the real world connected to the graph network, “I would use this feature when I am in a museum” (p2). “I get to see more paintings in AR, and I can put them next to the real painting on the wall, it is pretty cool” (p4).
7. Conclusions and Future Work
Overall, our study showed the feasibility of using the AR graph to present data relations, validated its possibilities for education and opportunities to engage a wider audience, and demonstrated its potentials for visualizing a complex graph with more nodes and edges. However, we identified challenges of applying AR interactions with touch-screen on mobile devices. To address the challenges, we further iterated the AR graph with more embodied interactions. Moreover, to better utilize the ability of AR to overcome the limitation of the screen size and put more information into the graph, we addressed the connection between the physical objects and the digital graph in more depth. For example, we started with a real painting and displayed the painter’s information and social networks within the AR environment.
Although the application of the AR graph is promising, there are still unanswered questions in the design and many aspects that require further research. This study is the first step in our research. In the future, we will conduct studies on the AR embodied interactions proposed in this study with different analysis tasks. The methods of transferring a data set into an AR graph can be extended to other domains to create immersive experiences. We can investigate how the AR interactions and features can be applied in immersive data visualization for general context. We can also take an in-depth look into the details of how to design the nodes and edges with different shapes, sizes, colors, etc. We can examine how to couple the AR graph to the physical world, such as the locations and the objects. The freedom to define the axes, dimensions, and directions in AR also leaves a space for more findings. It is also important to determine the performance of the AR graph with more complex and larger data set with different layout strategies. Last but not least, the research on the real-time collaboration in the AR graph is also a future direction.
Author Contributions
Conceptualization, J.L. and Z.W.; methodology, J.L. and Z.W.; software, J.L. and Z.W.; validation, J.L. and Z.W.; formal analysis, J.L.; investigation, J.L. and Z.W.; resources, J.L. and Z.W.; data curation, J.L. and Z.W.; writing—original draft preparation, J.L.; writing—review and editing, J.L. and Z.W.; visualization, J.L. All authors have read and agreed to the published version of the manuscript.
Funding
This research received no external funding.
Acknowledgments
The authors wish to thank all participants who volunteered for this study. Informed consent was obtained from all subjects involved in the study.
Conflicts of Interest
The authors declare no conflict of interest.
References
- Büschel, W.; Vogt, S.; Dachselt, R. Augmented reality graph visualizations. IEEE Comput. Graph. Appl. 2019, 39, 29–40. [Google Scholar] [CrossRef] [PubMed]
- Satriadi, K.A.; Smiley, J.; Ens, B.; Cordeil, M.; Czauderna, T.; Lee, B.; Yang, Y.; Dwyer, T.; Jenny, B. Tangible globes for data visualisation in augmented reality. In Proceedings of the CHI Conference on Human Factors in Computing Systems, New Orleans, LA, USA, 29 April–5 May 2022; pp. 1–16. [Google Scholar]
- Chandler, T.; Cordeil, M.; Czauderna, T.; Dwyer, T.; Glowacki, J.; Goncu, C.; Klapperstueck, M.; Klein, K.; Marriott, K.; Schreiber, F.; et al. Immersive analytics. In Proceedings of the IEEE International Symposium on Big Data Visual Analytics, Hobart, TAS, Australia, 22–25 September 2015; pp. 1–8. [Google Scholar]
- Marriott, K.; Chen, J.; Hlawatsch, M.; Itoh, T.; Nacenta, M.A.; Reina, G.; Stuerzlinger, W. Immersive analytics: Time to reconsider the value of 3d for information visualisation. In Immersive Analytics; Springer: Cham, Switzerland, 2018; pp. 25–55. [Google Scholar]
- ElSayed, N.; Thomas, B.; Marriott, K.; Piantadosi, J.; Smith, R. Situated analytics. In Proceedings of the 2015 Big Data Visual Analytics (BDVA), Hobart, TAS, Australia, 22–25 September 2015. [Google Scholar]
- Ens, B.; Irani, P. Spatial analytic interfaces: Spatial user interfaces for in situ visual analytics. IEEE Comput. Graph. Appl. 2016, 37, 66–79. [Google Scholar] [CrossRef] [PubMed]
- Büschel, W.; Reipschläger, P.; Langner, R.; Dachselt, R. Investigating the use of spatial interaction for 3D data visualization on mobile devices. In Proceedings of the 2017 ACM International Conference on Interactive Surfaces and Spaces, Brighton, UK, 17–20 October 2017; pp. 62–71. [Google Scholar]
- Kraus, M.; Fuchs, J.; Sommer, B.; Klein, K.; Engelke, U.; Keim, D.; Schreiber, F. Immersive analytics with abstract 3D visualizations: A survey. Comput. Graph. Forum 2022, 41, 201–229. [Google Scholar] [CrossRef]
- Alper, B.; Hollerer, T.; Kuchera-Morin, J.; Forbes, A. Stereoscopic highlighting: 2d graph visualization on stereo displays. IEEE Trans. Vis. Comput. Graph. 2011, 17, 2325–2333. [Google Scholar] [CrossRef] [PubMed] [Green Version]
- Gibson, H.; Faith, J.; Vickers, P. A survey of two-dimensional graph layout techniques for information visualisation. Inf. Vis. 2013, 12, 324–357. [Google Scholar] [CrossRef] [Green Version]
- Henry, N.; Fekete, J.D. Matlink: Enhanced matrix visualization for analyzing social networks. In IFIP Conference on Human-Computer Interaction; Springer: Berlin/Heidelberg, Germany, 2007; pp. 288–302. [Google Scholar]
- Henry, N.; Fekete, J.D.; McGuffin, M.J. NodeTrix: A hybrid visualization of social networks. IEEE Trans. Vis. Comput. Graph. 2007, 13, 1302–1309. [Google Scholar] [CrossRef] [PubMed] [Green Version]
- Pinaud, B.; Vallet, J.; Melançon, G. On visualization techniques comparison for large social networks overview: A user experiment. Vis. Inform. 2020, 4, 23–34. [Google Scholar] [CrossRef]
- Greilich, M.; Burch, M.; Diehl, S. Visualizing the evolution of compound digraphs with TimeArcTrees. Comput. Graph. Forum 2009, 28, 975–982. [Google Scholar] [CrossRef]
- Burch, M.; Beck, F.; Weiskopf, D. Radial Edge Splatting for Visualizing Dynamic Directed Graphs. In Proceedings of the International Conference on Computer Graphics Theory and Applications and International Conference on Information Visualization Theory and Applications-IVAPP, (VISIGRAPP 2012), Rome, Italy, 24–26 February 2012; pp. 603–612. [Google Scholar] [CrossRef] [Green Version]
- Sun, K.; Liu, Y.; Guo, Z.; Wang, C. Visualization for knowledge graph based on education data. Int. J. Softw. Inform. 2016, 10, 1–13. [Google Scholar] [CrossRef]
- Langner, R.; Satkowski, M.; Büschel, W.; Dachselt, R. Marvis: Combining mobile devices and augmented reality for visual data analysis. In Proceedings of the 2021 CHI Conference on Human Factors in Computing Systems, Yokohama, Japan, 8–13 May 2021; pp. 1–17. [Google Scholar]
- Ware, C.; Franck, G. Evaluating stereo and motion cues for visualizing information nets in three dimensions. ACM Trans. Graph. 1996, 15, 121–140. [Google Scholar] [CrossRef]
- Ware, C.; Mitchell, P. Visualizing graphs in three dimensions. ACM Trans. Appl. Percept. 2008, 5, 1–15. [Google Scholar] [CrossRef] [Green Version]
- Belcher, D.; Billinghurst, M.; Hayes, S.E.; Stiles, R. Using augmented reality for visualizing complex graphs in three dimensions. In Proceedings of the Second IEEE and ACM International Symposium on Mixed and Augmented Reality, Tokyo, Japan, 10 October 2003; pp. 84–93. [Google Scholar]
- Hubenschmid, S.; Zagermann, J.; Butscher, S.; Reiterer, H. Stream: Exploring the combination of spatially-aware tablets with augmented reality head-mounted displays for immersive analytics. In Proceedings of the 2021 CHI Conference on Human Factors in Computing Systems, Yokohama, Japan, 8–13 May 2021; pp. 1–14. [Google Scholar]
- Sicat, R.; Li, J.; Choi, J.; Cordeil, M.; Jeong, W.K.; Bach, B.; Pfister, H. DXR: A toolkit for building immersive data visualizations. IEEE Trans. Vis. Comput. Graph. 2018, 25, 715–725. [Google Scholar] [CrossRef] [Green Version]
- Bach, B.; Sicat, R.; Beyer, J.; Cordeil, M.; Pfister, H. The hologram in my hand: How effective is interactive exploration of 3D visualizations in immersive tangible augmented reality? IEEE Trans. Vis. Comput. Graph. 2017, 24, 457–467. [Google Scholar] [CrossRef] [Green Version]
- Kirshenbaum, N.; Hutchison, J.; Theriot, R.; Kobayashi, D.; Leigh, J. Data in context: Engaging audiences with 3D physical geo-visualization. In Proceedings of the Extended Abstracts of the 2020 CHI Conference on Human Factors in Computing Systems, Honolulu, HI, USA, 25–30 April 2020; pp. 1–9. [Google Scholar]
- Reipschlager, P.; Flemisch, T.; Dachselt, R. Personal augmented reality for information visualization on large interactive displays. IEEE Trans. Vis. Comput. Graph. 2020, 27, 1182–1192. [Google Scholar] [CrossRef]
- Wang, X.; Besançon, L.; Rousseau, D.; Sereno, M.; Ammi, M.; Isenberg, T. Towards an understanding of augmented reality extensions for existing 3D data analysis tools. In Proceedings of the 2020 CHI Conference on Human Factors in Computing Systems, Honolulu, HI, USA, 25–30 April 2020; pp. 1–13. [Google Scholar]
- Mahmood, T.; Butler, E.; Davis, N.; Huang, J.; Lu, A. Building multiple coordinated spaces for effective immersive analytics through distributed cognition. In Proceedings of the 2018 International Symposium on Big Data Visual and Immersive Analytics (BDVA), Konstanz, Germany, 17–19 October 2018; pp. 1–11. [Google Scholar]
- Chen, Z.T.; Su, Y.J.; Wang, Y.F.; Wang, Q.; Qu, Q.; Wu, Y. MARVisT: Authoring glyph-based visualization in mobile augmented reality. IEEE Trans. Vis. Comput. Graph. 2020, 26, 2645–2658. [Google Scholar] [CrossRef] [Green Version]
- Cordeil, M.; Cunningham, A.; Bach, B.; Hurter, C.; Thomas, B.H.; Marriott, K.; Dwyer, T. IATK: An immersive analytics toolkit. In Proceedings of the 2019 IEEE Conference on Virtual Reality and 3D User Interfaces (VR), Osaka, Japan, 23–27 March 2019; pp. 200–209. [Google Scholar]
- Vieira, C.; Parsons, P.; Byrd, V. Visual learning analytics of educational data: A systematic literature review and research agenda. Comput. Educ. 2018, 122, 119–135. [Google Scholar] [CrossRef]
- Dyckhoff, A.L.; Zielke, D.; Bültmann, M.; Chatti, M.A.; Schroeder, U. Design and implementation of a learning analytics toolkit for teachers. J. Educ. Technol. Soc. 2012, 15, 58–76. [Google Scholar]
- Husain, S.S.; Kalinin, A.; Truong, A.; Dinov, I.D. SOCR Data dashboard: An integrated big data archive mashing medicare, labor, census and econometric information. J. Big Data 2015, 2, 1–18. [Google Scholar] [CrossRef] [Green Version]
- Drochtert, D.; Geiger, C. Collaborative magic lens graph exploration. In Proceedings of the SIGGRAPH Asia 2015 Mobile Graphics and Interactive Applications, Kobe, Japan, 2–6 November 2015; pp. 1–3. [Google Scholar]
- Cordeil, M.; Dwyer, T.; Klein, K.; Laha, B.; Marriott, K.; Thomas, B.H. Immersive collaborative analysis of network connectivity: CAVE-style or head-mounted display? IEEE Trans. Vis. Comput. Graph. 2016, 23, 441–450. [Google Scholar] [CrossRef]
- Kwon, O.H.; Muelder, C.; Lee, K.; Ma, K.L. A study of layout, rendering, and interaction methods for immersive graph visualization. IEEE Trans. Vis. Comput. Graph. 2016, 22, 1802–1815. [Google Scholar] [CrossRef]
- Bacim, F.; Ragan, E.D.; Scerbo, S.; Polys, N.F.; Setareh, M.; Jones, B.D. The effects of display fidelity, visual complexity, and task scope on spatial understanding of 3D graphs. In Proceedings of the Graphics Interface 2013, Regina, SK, Canada, 29–31 May 2013; Volume 2, pp. 25–32. [Google Scholar]
- Büschel, W.; Vogt, S.; Dachselt, R. Investigating link attributes of graph visualizations in mobile augmented reality. In Proceedings of the CHI 2018 Workshop on Data Visualization on Mobile Devices, Montreal, QC, Canada, 21–26 April 2018; Volume 18. [Google Scholar]
- Sun, Z.; Han, F.; Ma, X. Exploring the Effects of Scale in Augmented Reality-Empowered Visual Analytics. In Proceedings of the Extended Abstracts of the 2018 CHI Conference on Human Factors in Computing Systems, Montreal, QC, Canada, 21–26 April 2018; pp. 1–6. [Google Scholar]
- Schwajda, D.; Pointecker, F.; Boess, L.; Anthes, C. Transforming Graph-based Data Visualisations from Planar Displays into Augmented Reality 3D Space. In Proceedings of the ISS’21: Interactive Surfaces and Spaces, Łódź, Poland, 14 November 2021. [Google Scholar]
- Chen, Y.; Guan, Z.; Zhang, R.; Du, X.; Wang, Y. A survey on visualization approaches for exploring association relationships in graph data. J. Vis. 2019, 22, 625–639. [Google Scholar] [CrossRef]
- Fruchterman, T.M.; Reingold, E.M. Graph drawing by force-directed placement. Softw. Pract. Exp. 1991, 21, 1129–1164. [Google Scholar] [CrossRef]
- Itoh, T.; Muelder, C.; Ma, K.L.; Sese, J. A hybrid space-filling and force-directed layout method for visualizing multiple-category graphs. In Proceedings of the 2009 IEEE Pacific Visualization Symposium, Beijing, China, 20–23 April 2009; pp. 121–128. [Google Scholar]
- Lee, B.; Plaisant, C.; Parr, C.S.; Fekete, J.D.; Henry, N. Task taxonomy for graph visualization. In Proceedings of the 2006 AVI Workshop on BEyond Time and Errors: Novel Evaluation Methods for Information Visualization, Venezia, Italy, 23 May 2006; pp. 1–5. [Google Scholar]
- Schrepp, M.; Hinderks, A.; Thomaschewski, J. Applying the user experience questionnaire (UEQ) in different evaluation scenarios. In International Conference of Design, User Experience, and Usability; Springer: Cham, Switzerland, 2014; pp. 383–392. [Google Scholar]
Figure 1.
The application of the AR graph with data of Chinese painters in an art gallery (the text on top of the nodes are the Chinese names of the painters).
Figure 1.
The application of the AR graph with data of Chinese painters in an art gallery (the text on top of the nodes are the Chinese names of the painters).

Figure 2.
Interaction paradigms.

Figure 3.
Experiment settings: (a). laboratory room; (b). the user experiences the AR graph; (c). AR graph; (d). the user experiences the 2D graph; (e). 2D graph (the text on top of the nodes are the Chinese names of the painters).
Figure 3.
Experiment settings: (a). laboratory room; (b). the user experiences the AR graph; (c). AR graph; (d). the user experiences the 2D graph; (e). 2D graph (the text on top of the nodes are the Chinese names of the painters).

Figure 4.
Examples of task 1 to task 6.

Figure 5.
Experiment procedure (the text on top of the nodes are the Chinese names of the painters).
Figure 5.
Experiment procedure (the text on top of the nodes are the Chinese names of the painters).

Figure 6.
Completion time (seconds) for the six tasks with the 2D graph and the AR graph.

Figure 7.
Accuracy rate for the six tasks with the 2D graph and the AR graph.

Figure 8.
Learning performance between the pre-test and the post-test (2D graph and AR graph) (the dot line shows the growing trend among the learning performance).
Figure 8.
Learning performance between the pre-test and the post-test (2D graph and AR graph) (the dot line shows the growing trend among the learning performance).

Figure 9.
User experience with the 2D and the AR graph.

Figure 10.
The interaction process with the iterated AR graph (the text on top of the nodes are the Chinese names of the painters).
Figure 10.
The interaction process with the iterated AR graph (the text on top of the nodes are the Chinese names of the painters).

Publisher’s Note: MDPI stays neutral with regard to jurisdictional claims in published maps and institutional affiliations. |
© 2022 by the authors. Licensee MDPI, Basel, Switzerland. This article is an open access article distributed under the terms and conditions of the Creative Commons Attribution (CC BY) license (https://creativecommons.org/licenses/by/4.0/).
Share and Cite
MDPI and ACS Style
Li, J.; Wang, Z. An Interactive Augmented Reality Graph Visualization for Chinese Painters. Electronics 2022, 11, 2367. https://doi.org/10.3390/electronics11152367
AMA Style
Li J, Wang Z. An Interactive Augmented Reality Graph Visualization for Chinese Painters. Electronics. 2022; 11(15):2367. https://doi.org/10.3390/electronics11152367
Chicago/Turabian StyleLi, Jingya, and Zheng Wang. 2022. "An Interactive Augmented Reality Graph Visualization for Chinese Painters" Electronics 11, no. 15: 2367. https://doi.org/10.3390/electronics11152367
Note that from the first issue of 2016, this journal uses article numbers instead of page numbers. See further details here.