
Functional Analysis Diagrams in Science and Technology Education

1
Dyson School of Design Engineering, Imperial College London, London SW7 2BX, UK
2
Iomech, Ltd., Sutton SM2 5BY, UK
3
Department of Mechanical Engineering and Robotics, Guangdong Technion-Israel Institute of Technology, Shantou 515063, China
4
Guangdong Provincial Key Laboratory of Materials and Technologies for Energy Conversion, Guangdong Technion-Israel Institute of Technology, Shantou 515063, China
5
NCR Corporation, Atlanta, GA 30308, USA
*
Authors to whom correspondence should be addressed.
Educ. Sci. 2023, 13(3), 289; https://doi.org/10.3390/educsci13030289
Submission received: 11 November 2022
/
Revised: 14 February 2023
/
Accepted: 6 March 2023
/
Published: 8 March 2023
(This article belongs to the Section STEM Education)
Abstract
:With the world currently facing an escalating environmental crisis and major virus disease outbreaks, the need to significantly grow the STEM workforce ranks has never been more urgent. The authors propose a novel teaching methodology involving functional analysis diagrams (FADs) as an educational aid. The paper presents a method to quantitatively assess the effects of the proposed intervention in an educational setting alongside a pilot study conducted in a South Korean secondary school with non-native English-speaking students (n = 39). The written assessment results indicate that the FAD-assisted method can have a measurable effect and have the potential to assist students with lower scores in English. This pilot study’s results suggest that FAD models of engineering systems can enhance knowledge transfers in technology and engineering education. Experimental validation using the proposed method was shown to be feasible and would require a moderate-sized sample (n ≥ 168) for a future full-scale study.
1. Introduction
1.1. Scope
Programs such as “Educate to Innovate” in the US [1] and “STEM Strategy” in the UK [2] aimed to address the challenges of the 21st century by introducing STEM subjects into general education to improve science, technology, engineering, and mathematical literacy [3]. Almost three decades after their introduction, research studies suggest that the initiatives resulted in little change in educational methods [4,5,6]. While science and mathematics were introduced to the curriculum of public schools, studies suggest that there is no systematic instruction about technology and engineering. Moreover, there is little interaction between subject leaders to demonstrate the practical applications of science and mathematics [7,8].
Systems engineering and the concept of system functions were introduced in the curriculum of a few institutions and countries to bridge the gap between science, technology, engineering, and mathematics. Research studies investigating the student’s understanding of such systems suggest that system functions are often misunderstood, especially when examining the functions of “invisible” system parts such as cables transferring energy [9]. The authors found that most studies use traditional, “form-independent” models to teach students. Such models require high levels of abstraction and disregard any physical structure. This paper describes an intervention study designed to assess the effects of functional analysis diagrams, a form-dependent functional modelling method, as an aid in engineering education.
1.2. Concept Maps, Functional Models and Their Role in Technical Education
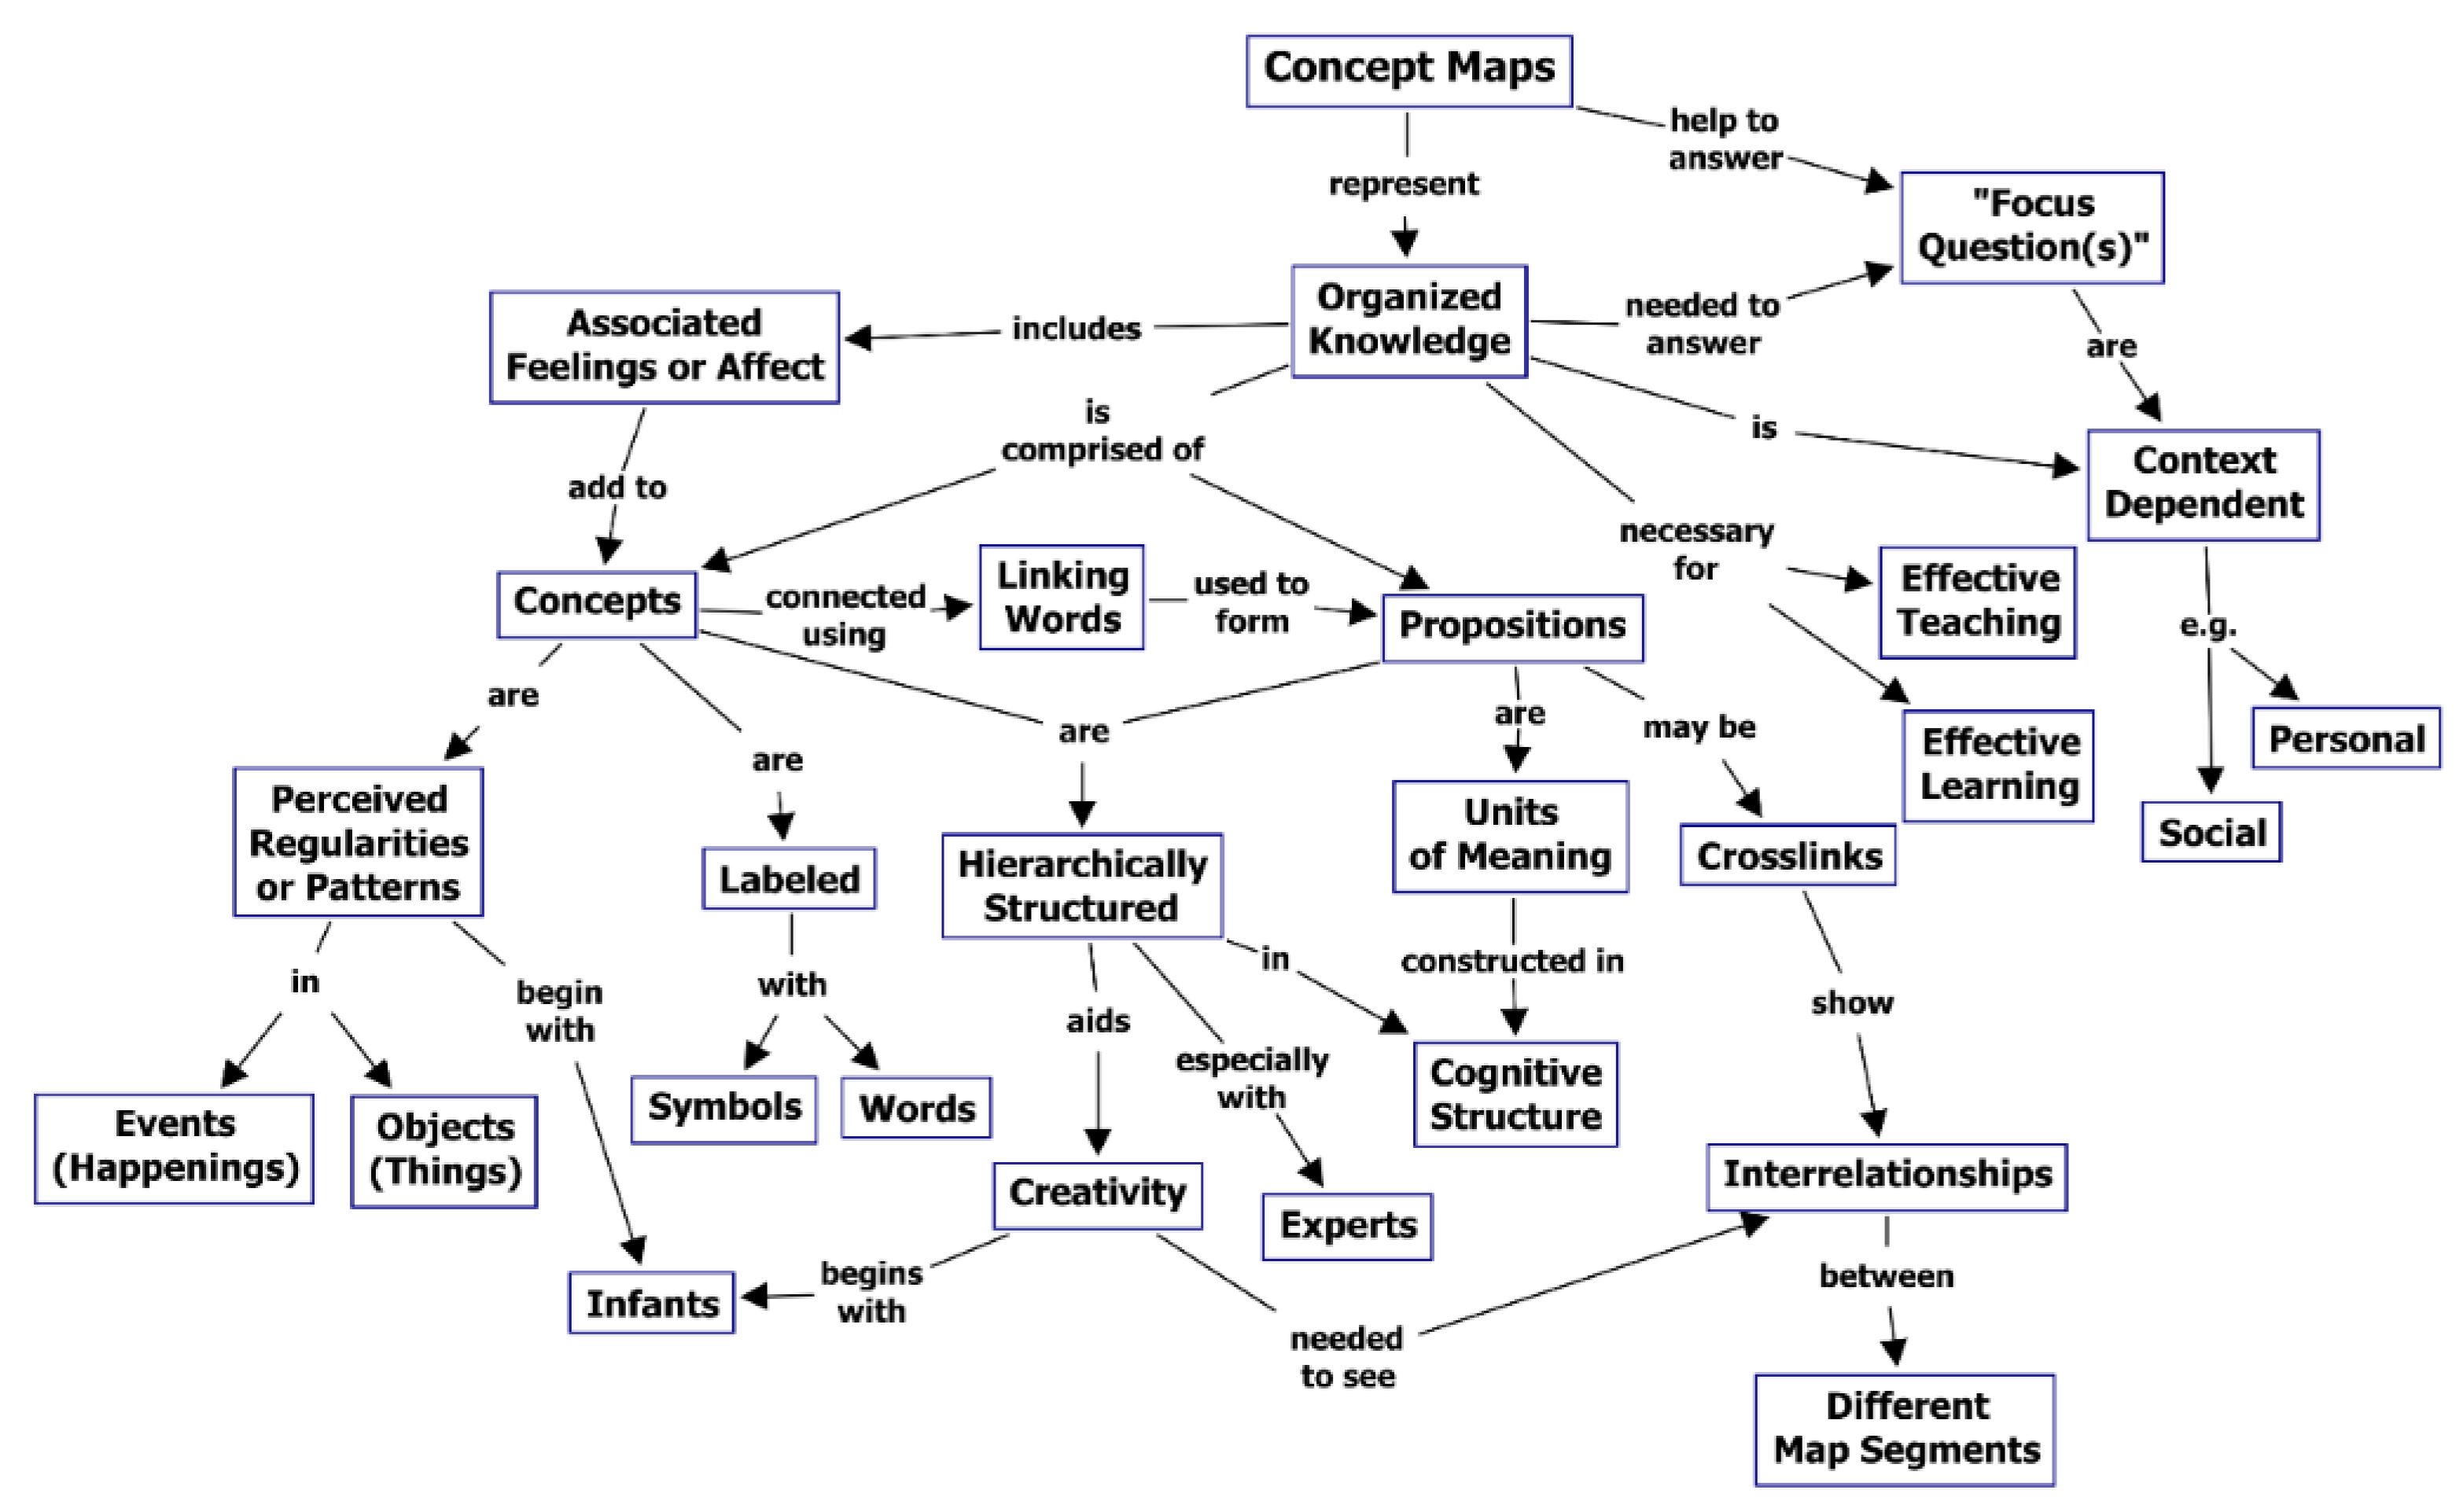
Predating the written language by thousands of years, visual expressions of thought and diagrams have been used to communicate ideas and knowledge since prehistoric times [10]. Diagrammatic representations or maps can present an abstract view of a system or a situation that illustrates in an organised manner the system parts (or facts) and the way they are interconnected and affect each other. Influenced by Ausubel’s work, Novak [11] defined concepts as “perceived regularities or patterns in events or objects, or records of events, or objects designated by a label, usually a word.” Concept maps (Figure 1) were developed in 1972, during the course of Novak’s research on human learning to foster meaningful learning.
The effects of concept maps, knowledge maps, and, in general, diagrammatic methods in education have been investigated in multiple studies across educational levels, subject areas, and settings [12,13,14]. The consensus is that such methods can enhance knowledge assimilation and elicit meaningful learning. Maps offer a relatively simple syntax compared to the language presented in textbooks. They can better assist comprehension for learners with lower verbal proficiency or studying in a non-native language [12,13,15].
Figure 1.
A concept map showing the key features of concept maps (adapted from Novak and Cañas, [16].
Figure 1.
A concept map showing the key features of concept maps (adapted from Novak and Cañas, [16].

Similarly, research on engineering design suggests that understanding how the components of a system (interacting parts seen as a whole) are organised, interact, and affect one another (system functions), is central to design and problem-solving activities [17,18,19,20,21]. Functional models can be described as diagrammatic representations of systems linked through their functional interactions. Functional models share many similarities with concept maps as they represent systems of interconnected nodes (blocks). The arrow connection links denote the direction of the function flow. They are often annotated with a description of the relationship (or function) between the node where the arrow originates to the node at which the arrow points (see Figure 2 and Figure 3). Functional modelling processes prompt the user(s) to abstract system functions at a higher level by defining “what” is required by the systems and their components before proceeding to determine “how” the system is to address these requirements [22]. The modelled functions do not describe what the system actually does, but what it ought to do [23].
The importance of understanding technological systems and their functions in technology and science education has been long argued by researchers, and countries such as the US, Sweden, and Australia already include technical systems in the national curriculum [7]. Research studies involving students creating functional block models [25,26] or listing system functions and their connections [9,27] were conducted to investigate how the students perceive technical systems. While the studies report some positive learning outcomes, many students failed to demonstrate a holistic view of systems and knowledge of non-visible system parts such as flows of information, energy or matter. In detail, most students were able to identify the functions of the “visible” system components [9], such as buttons, especially when they have previously interacted with the system (e.g., mobile phone), but could not identify the functions of invisible parts such as the cables connecting the buttons to a controller, or the controller itself.
1.3. The Functional Analysis Diagram (FAD)
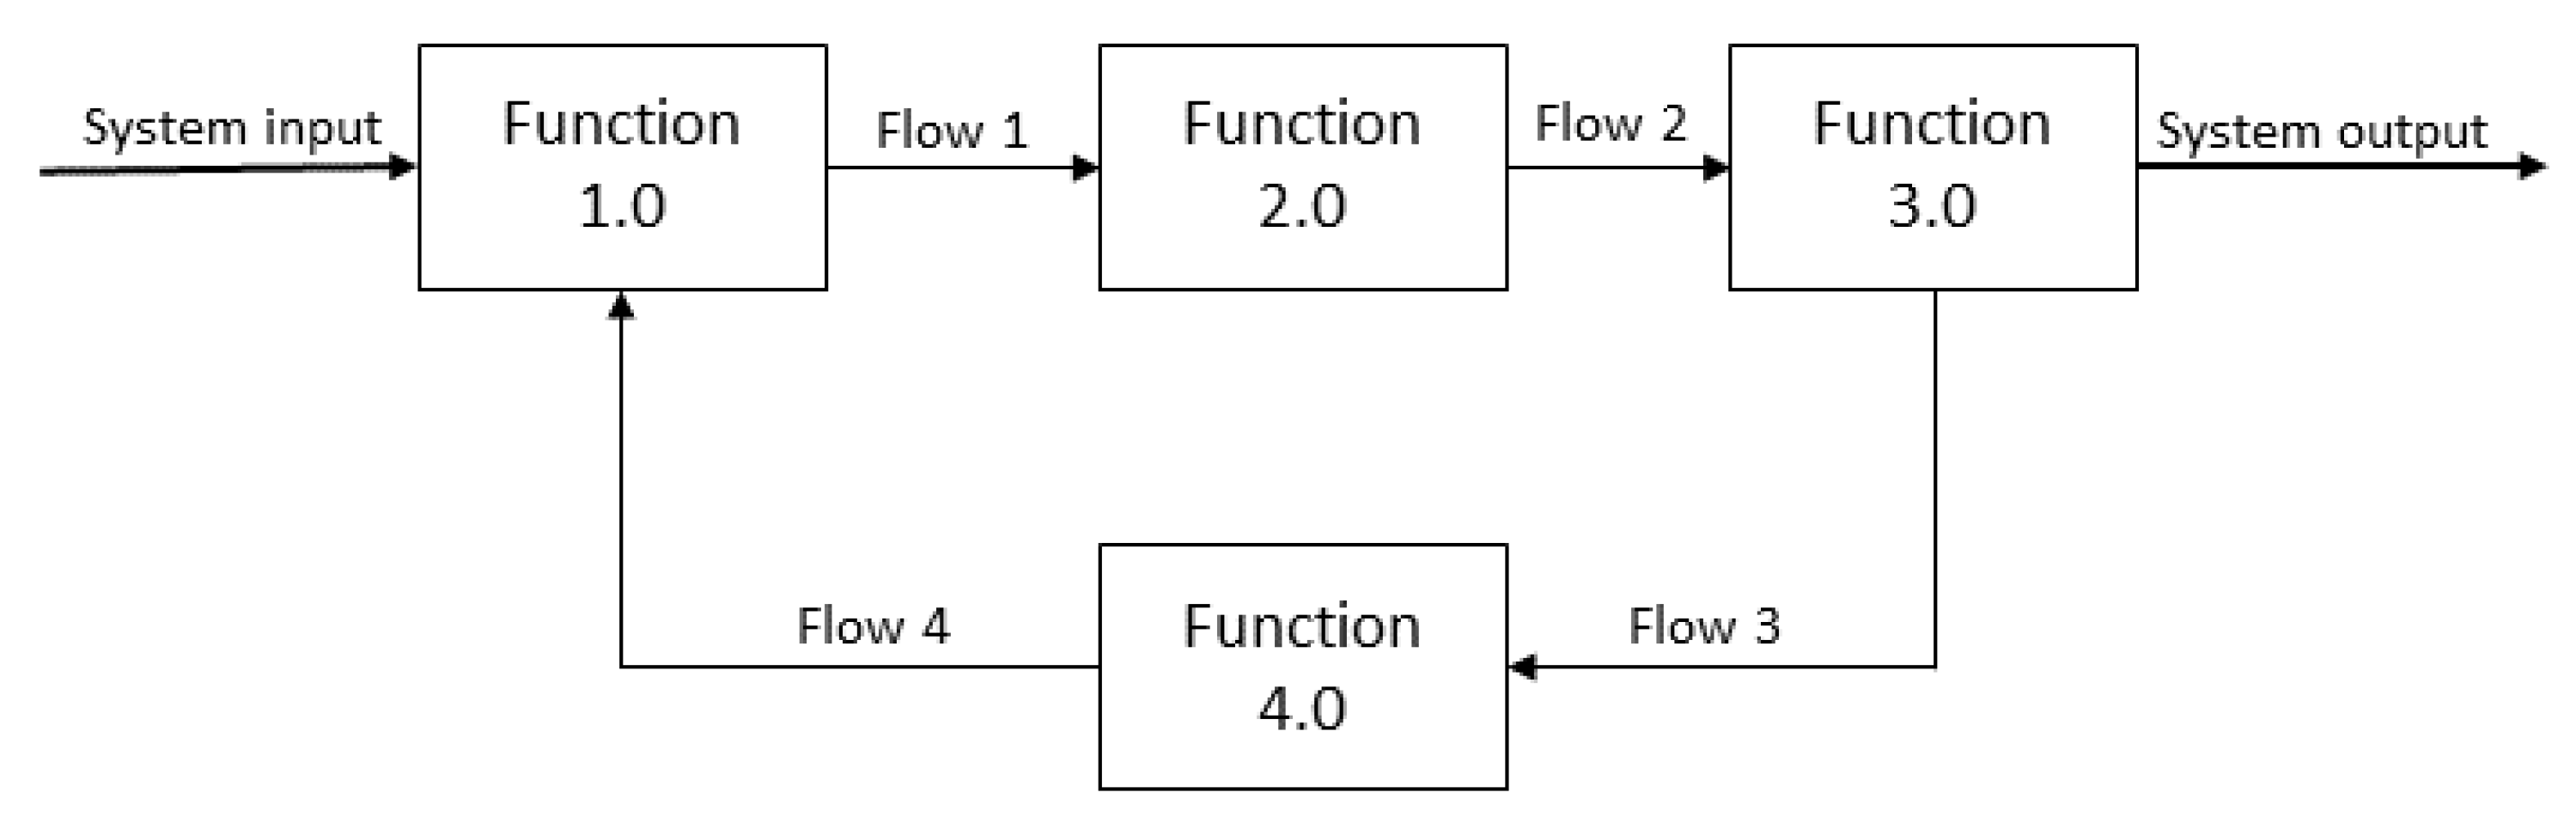
Functional models aim to represent functionally decomposed physical or virtual systems connected through active verb–measurable noun links (e.g., lamp > emits > light) describing functions, as defined by Miles [28]. Most commonly used functional models are form-independent [20]; the nodes represent system functions and the links between them, the flow of information, material or energy (Figure 2). These models were developed mainly for control systems design to assist engineers in developing software (no physical structure) and were later adopted by most engineering disciplines. While the form-independent modelling approach can lead to more innovative solutions due to its disregard for existing artefacts’ structures, a steep learning curve is associated with the method for the same reasons.
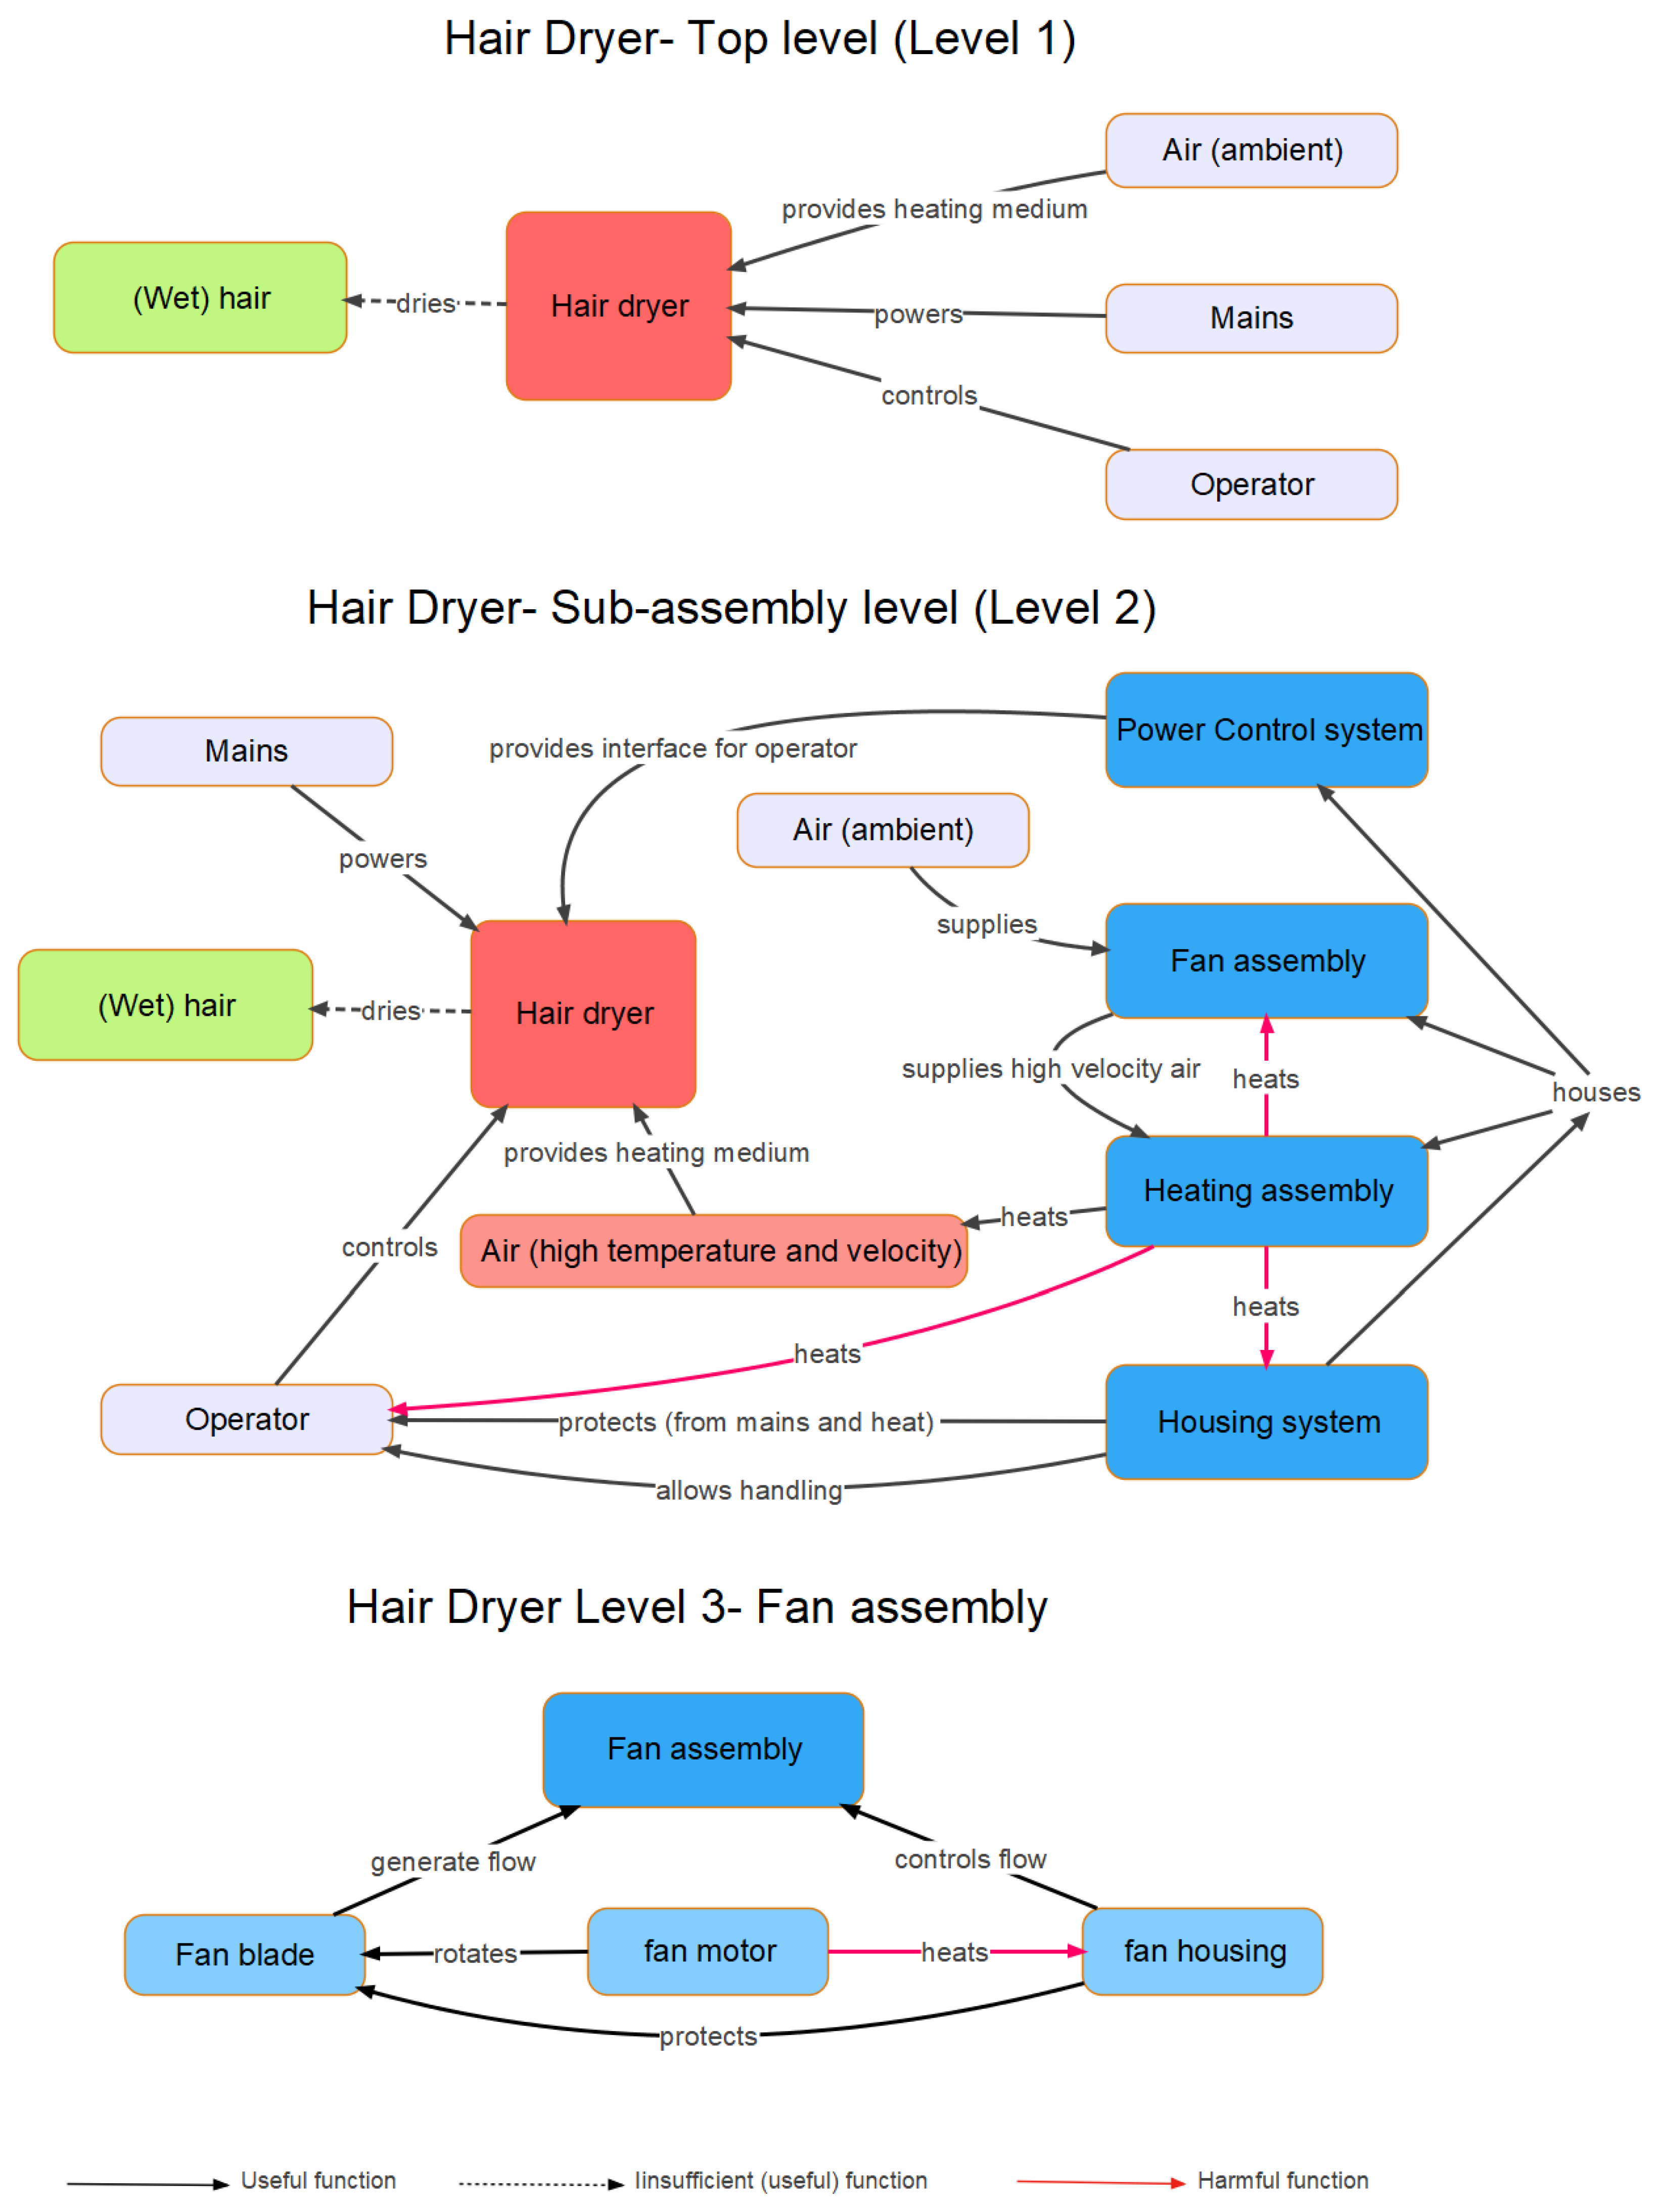
In contrast, form-dependent methods were developed to analyse existing system functions and are easier to understand. The model nodes depict structure (an entire artefact or components such as buttons), and the links depict the functional interactions between the nodes. The FAD method (see Figure 3) was initially published by the TRIZ vendor invention machine corporation [29]. FAD can be described as a visual representation of decomposed systems, providing the space and a specified set of simple rules to perform functional analysis of all system functions [30].
Figure 3.
A Hierarchical FAD model of a hairdryer [30].
Figure 3.
A Hierarchical FAD model of a hairdryer [30].

Studies conducted in the manufacturing industry suggest that FAD can provide an intuitive platform for modelling and communicating different functions of physical systems to members of technical and non-technical disciplines, e.g., [20,30,31,32,33,34]. A recent study involving the use of functional analysis diagrams (FADs) as an educational tool in a manufacturing setting also indicated that FAD models could enhance students’ ability for abstract thinking while assisting in overcoming cognitive, educational, and cultural constraints to training [22].
While there are some examples of using FAD to transfer knowledge in professional settings, no study is known to the authors investigating the effects of using such models to transfer technical knowledge in an educational setting.
1.4. Research Objectives
Based on the findings of previous studies, the authors suggested that FAD models of technical systems could assist students in understanding new technical material, especially those with lower performance scores in science subjects and the taught language (English in this case).
To investigate these claims, an intervention study was developed to assess whether FAD-assisted engineering teaching will enhance knowledge transfer among students with:
- No known relevant background
- Varied levels of competence in the teaching language (English)
- Varied levels of competence in science subjects
2. Method
2.1. Proposed Intervention
The authors developed a quantitative experimental method to investigate the stated research objectives, involving a sample from a population of students. The selected sample was randomly split up into two groups of equal size. Both groups were instructed in an advanced technical topic, such as the operation of hydrogen-diesel engines: FAD models were utilised to illustrate the functions of the introduced system for the first group, while conventional system images were used to instruct the second group. The groups’ performance was evaluated through a written assessment after the presentations. The measured differences in the two groups’ performance and level of understanding were compared using appropriate statistical tests to establish whether the two methods of instruction resulted in differences in measured learning outcomes.
2.2. Methodological Considerations
In order to implement the proposed method, a range of prerequisites was considered first [35]. The intervention study approach presented in this paper shares many features with randomised trials commonly used in clinical and pharmacological research—in particular, treatment superiority trials. In contrast to such trials, however, this method is not constrained by, e.g., safety concerns in estimating dosage or the necessity of a control group.
However, consideration is still due to establishing an appropriate sample size and establishing and following a rigorous protocol throughout the process. The authors’ foremost concern was selecting an expected effect size necessary for an a priori power calculation. As the effect size for this type of intervention is unknown, the worst-case assumption can considerably inflate the required sample size, significantly raising the bar for carrying out a robust study [36]. The authors, therefore, concluded that a prior study, if feasible, might provide an effect size estimate better than the worst case, thus lowering the cost barrier for a later, full-scale study.
2.3. Study Background
The authors were given the opportunity by the Korea-Wales International Christian School to conduct a pilot study involving high-school students born between 2001 and 2004. The boarding school, located in Gwangju, Gyeonggi province of South Korea, facilitates non-native English students with sufficient language skills to receive a technical lecture in English. Moreover, the students of the School major in a wide variety of subjects, which gives the authors an additional parameter to consider in their study for the effectiveness of the FAD teaching approach.
This pilot study’s established aims were to:
- Evaluate, develop, and improve the methodology;
- Provide an estimate for the effect size, so that prior sample size calculations can be carried out;
- Assess the feasibility of a formal, full-scale experimental study.
2.4. Study Participants
The participants’ recruitment process involved a research proposal document describing: (a) the research study and the proposed intervention, (b) a statement assuring the students that their privacy would be protected, and all collected information would neither be considered for their school performance grades nor shared with any third party. The school reviewed the proposal before sharing it with the students. All the students enrolled in this study voluntarily agreed to participate.
Due to the limited number of volunteers, all 39 available students of the school’s 10th, 11th, and 12th class (with the 12th class being the final high-school year class) were selected to participate in the study. Splitting this sample into two groups results in a per-group sample size of just under 20, which is adequate even in a clinical context [37].
The participants were allocated randomly into two groups, corresponding to the two teaching methodologies to be used. All the students participating in both groups are non-native English speakers with different levels of fluency and without any prior knowledge of the subject to be taught. Therefore, the study participants are considered an appropriate sample for the proposed intervention, as they reflect all three aspects of the study’s research objectives.
A presentation on a technical topic that had not been previously taught to the students was delivered to each group. The presentation material and lecture were in English; however, after discussions with the students’ teacher, some keywords that might be unknown to the students (i.e., carbon dioxide, fossil fuel, and compression ignition) were also translated to Korean in the presentation slides for both groups.
Finally, a subset of the study’s participants was interviewed and their comments were considered in order to:
- Identify any benefits or limitations of the proposed teaching approach which might not have been picked up directly by the assessment;
- Identify any issues with and opportunities to improve the procedure and method;
- Gain additional insights into students’ attitudes towards current established methods of instruction and novel, diagrammatic instruction methods.
2.5. Teaching Material
The presentation material was developed to include a highly-specialised technical subject unknown to the students. The use of alternative renewable fuels such as ammonia [38] and hydrogen [39] in compression ignition engines have recently received significant interest since they can promote renewable energy for power generation applications. Hydrogen-diesel dual-fuel engines are a promising technology for power generation applications that can contribute to high power output with significant CO2, hydrocarbon, and soot emissions reductions [40].
With one of the authors being an expert on renewable energy and internal combustion systems, the presentation included the following topics: The first part gave an overview of the energy situation in South Korea, the challenge of the rise in global CO2 emissions, and the importance of renewable energy in limiting global warming. This part (14 out of 24 slides) was common for both groups and was delivered using the same teaching method. The second technical part of the lecture focused on the operation of internal combustion engines (ICE), particularly a compression ignition engine used for power generation. This part covered the basic principles of operation and implementation of alternative fuel (hydrogen) for hydrogen-diesel dual-fuel operation. Although the topic of the technical section (part 2) was the same for both groups, the teaching methodology used differed. Further details about the presentation material and teaching approaches can be found in the following sections.
The visual understanding environment open-source software package was used to develop the FAD models included in the teaching material. Subject–action–object tables [41] were utilised to assist with the FAD model development. However, the study involved the evaluation of existing FAD models for knowledge transfer, and therefore, the tables were not included in the material.
2.6. Group Allocation
The setting involves two experimental groups assessed on their understanding of the knowledge acquired from the intervention. The results were compared against known data, such as performance in English, science, overall grades over the previous academic year, the students’ class, etc. The 39 participating students who volunteered to participate were assigned individual numbers to anonymise results and ensure compliance with data protection regulations. The authors had no affiliation with the School and no access to the students’ identities; all collected data were only linked to their numbers.
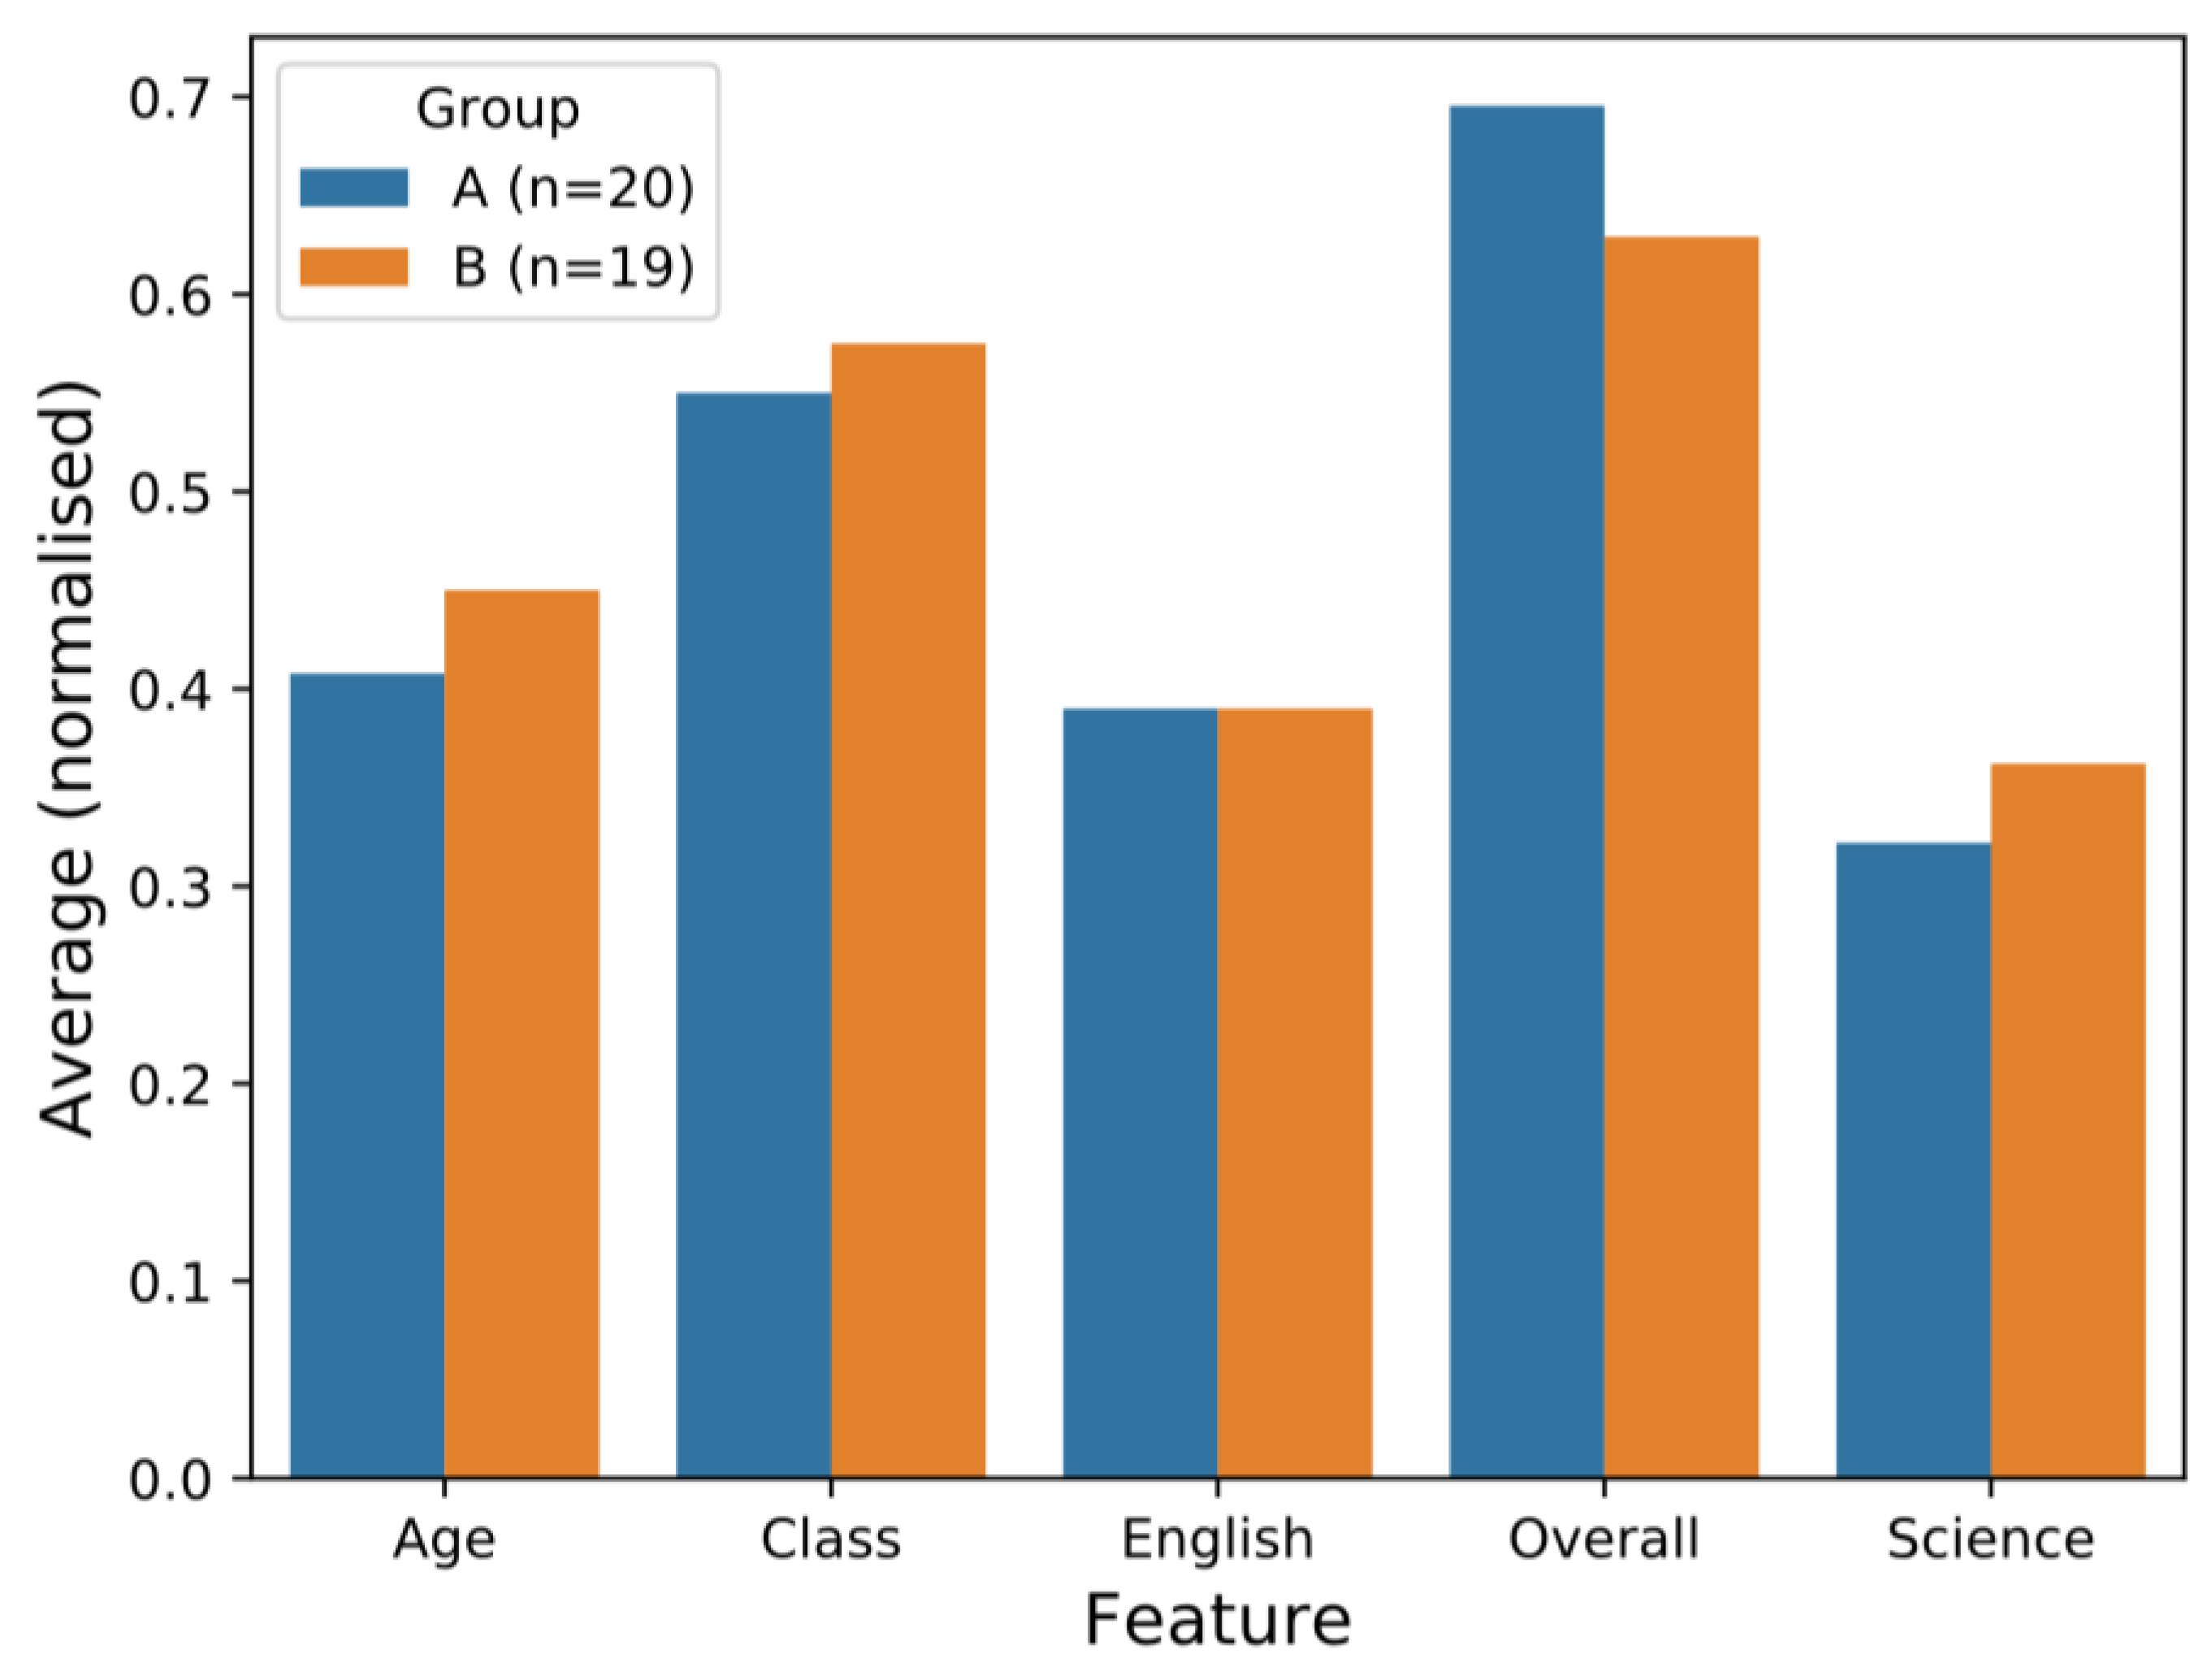
The group division was performed by random allocation without considering parameters such as student age, gender, and overall or subject-specific grade. The function (rand()) of Microsoft’s “Excel” software was used to generate a random number for each student. The students with the highest 20 numbers were assigned to Group A, and the remaining 19 were assigned to Group B. Following allocation, the groups are presented as shown in Figure 4.
The data presented in Figure 4 confirm that the random allocation method used resulted in comparable groups with no evident biases.
2.7. Intervention Design
The material presented to the two groups was divided into two main sections. The first section, which was covered in 14 out of 24 slides, included the following topics:
- •
- Definition and historical progress of annual CO2 emissions by world regions;
- •
- South Korea’s primary energy status;
- •
- Renewable energy and energy storage solutions;
- •
- Hydrogen as a renewable fuel.
As the presentation material and teaching method for the first section (from now on referred to as “Part 1”) was common for both groups, it was expected for the two groups to perform equally in the written assessment questions related to it.
On the other hand, the second section of the presentation (hereafter referred to as “Part 2”) focused on the technical part of the internal combustion engine (ICE) and the application of hydrogen as a renewable fuel for compression ignition engines. In this section, only two slides were common for the groups, one introducing the internal combustion engine and its operation and the other providing a summary of the overall trend in power output and emissions of ICE operating with hydrogen. For the rest of the slides, the authors tried to keep the presentation material delivered to the students the same. However, the teaching method differed due to implementing FAD for Group B. The performance of students from both groups is expected to be lower in Part 2 compared to Part 1 since they are being assessed in unknown material and considered too technical for the participants.
In more detail, the Part 2 of the presentation involved the following topics:
- •
- The internal combustion engine and the environment;
- •
- Operation and emissions of a compression ignition engine;
- •
- Compression ignition engine emissions and emissions controlling techniques;
- •
- Hydrogen as an alternative fuel for compression ignition engines.
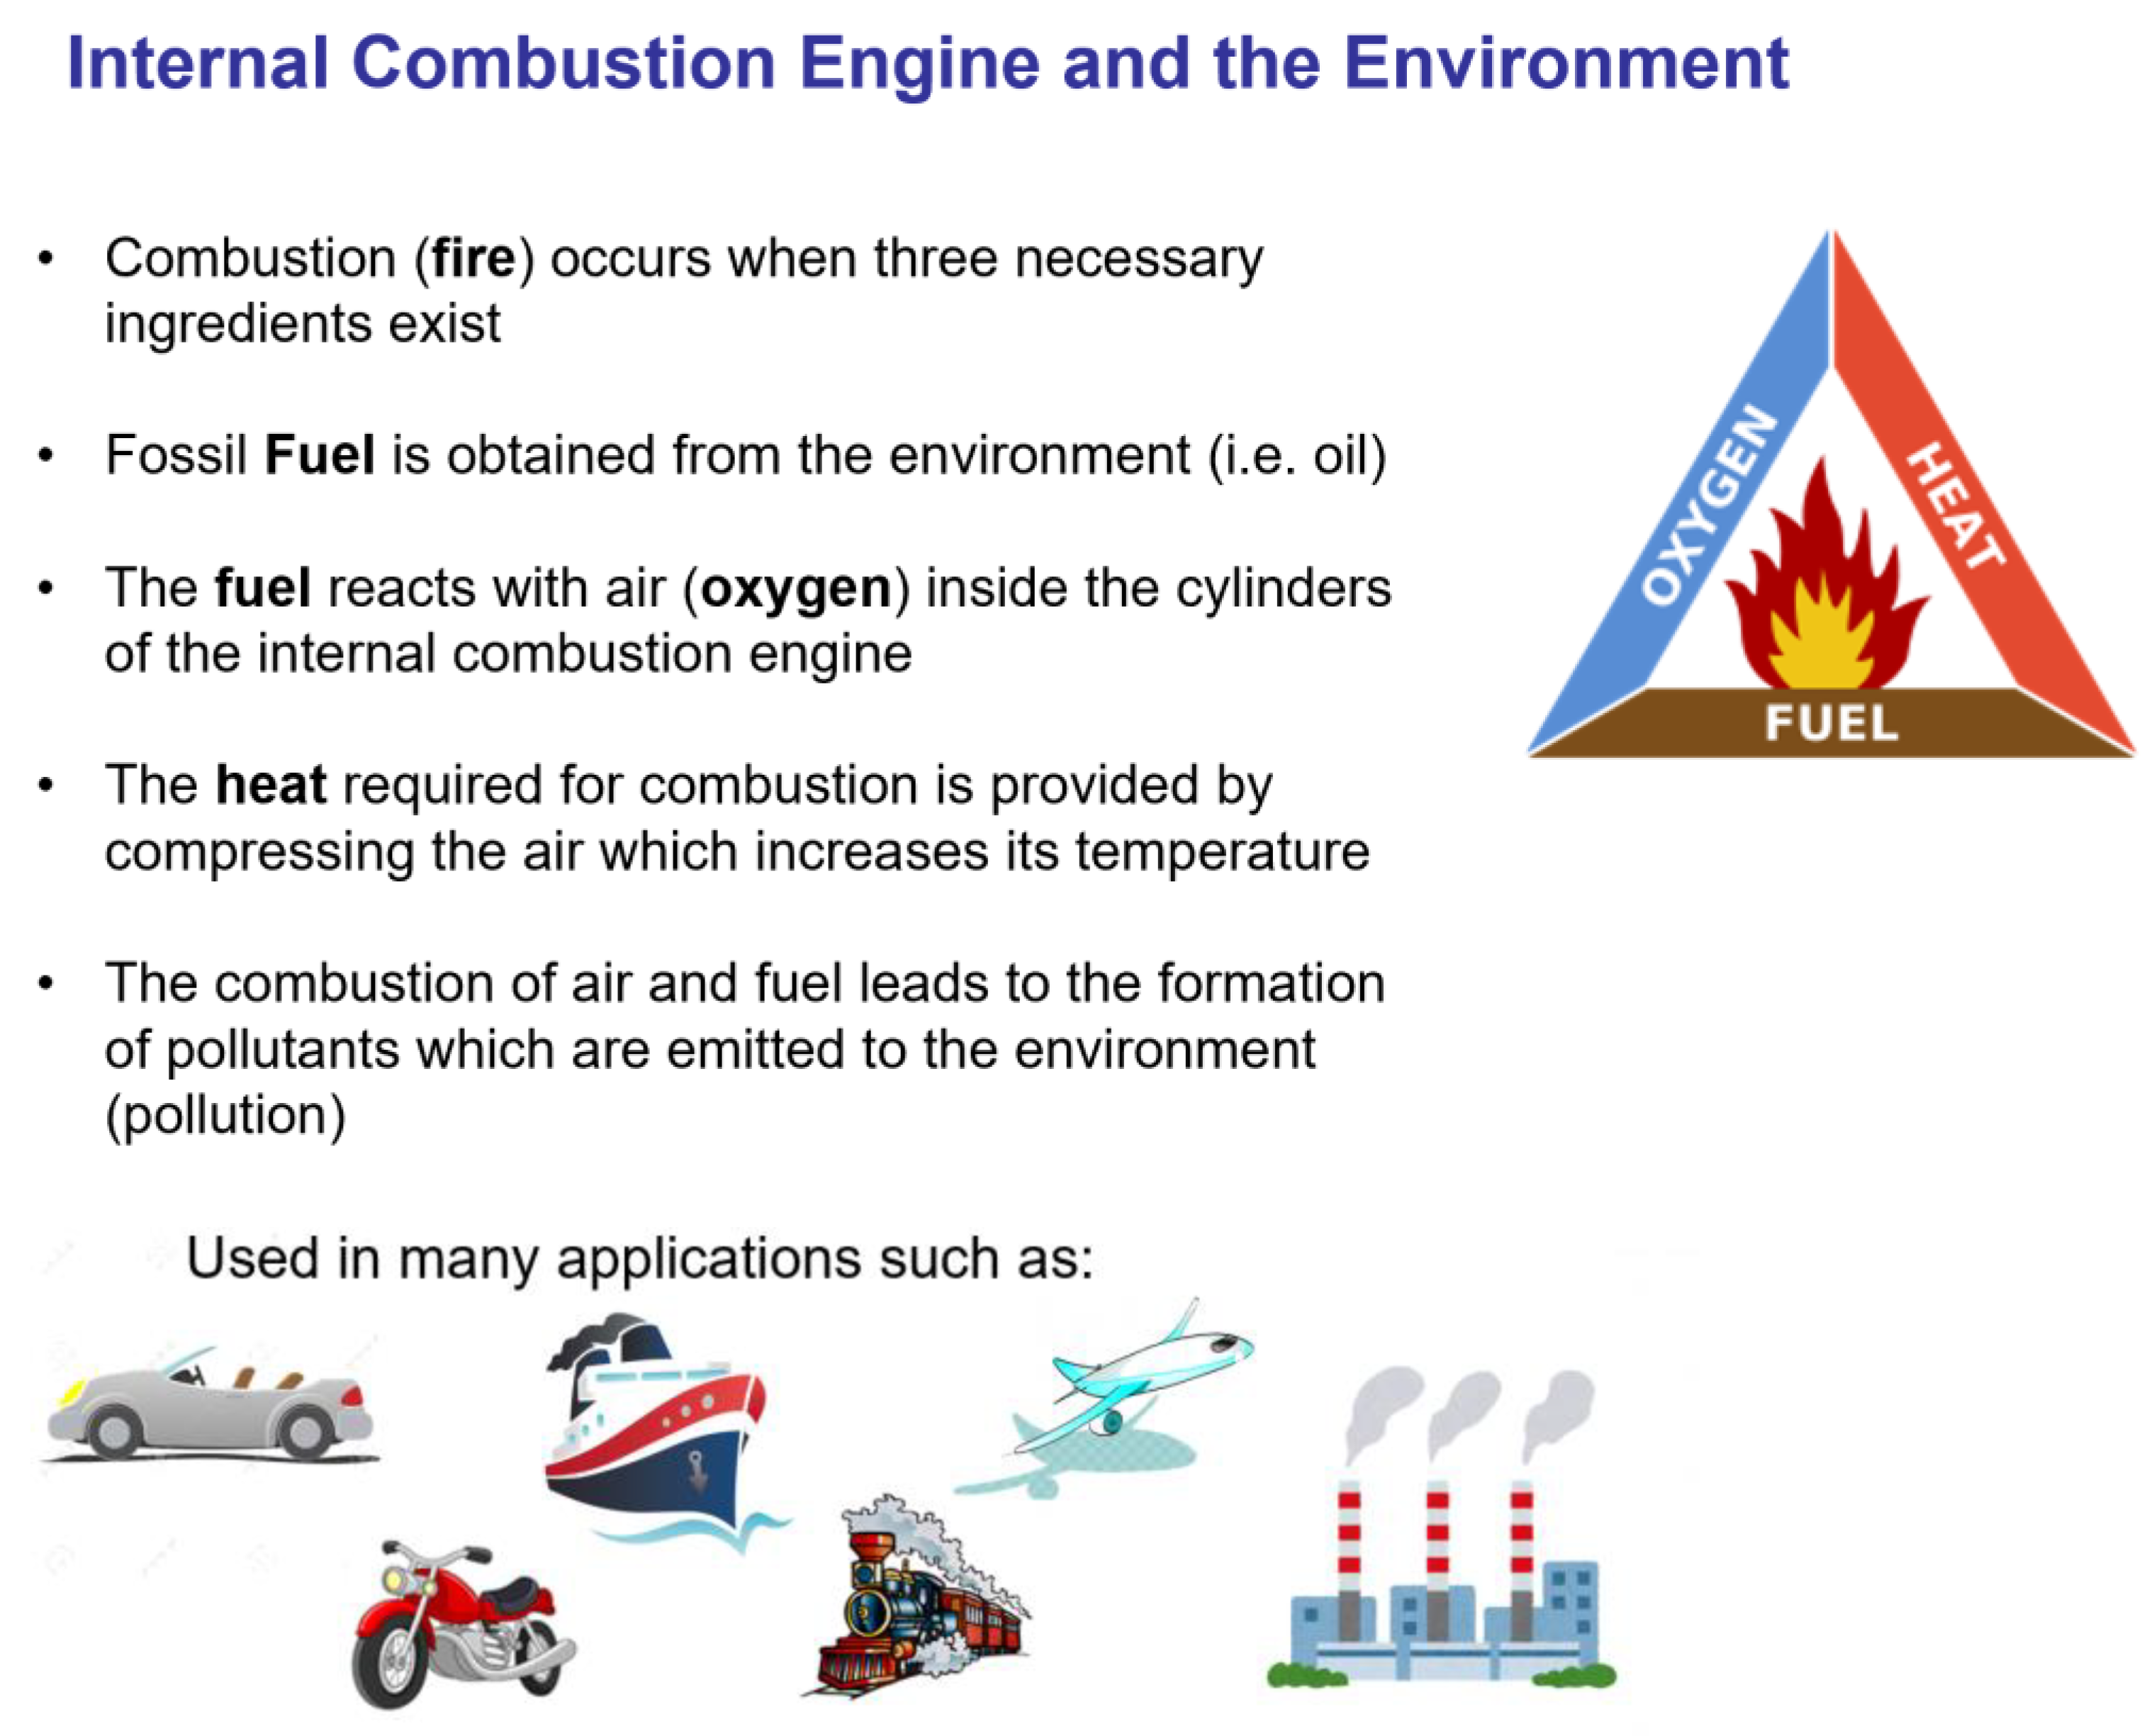
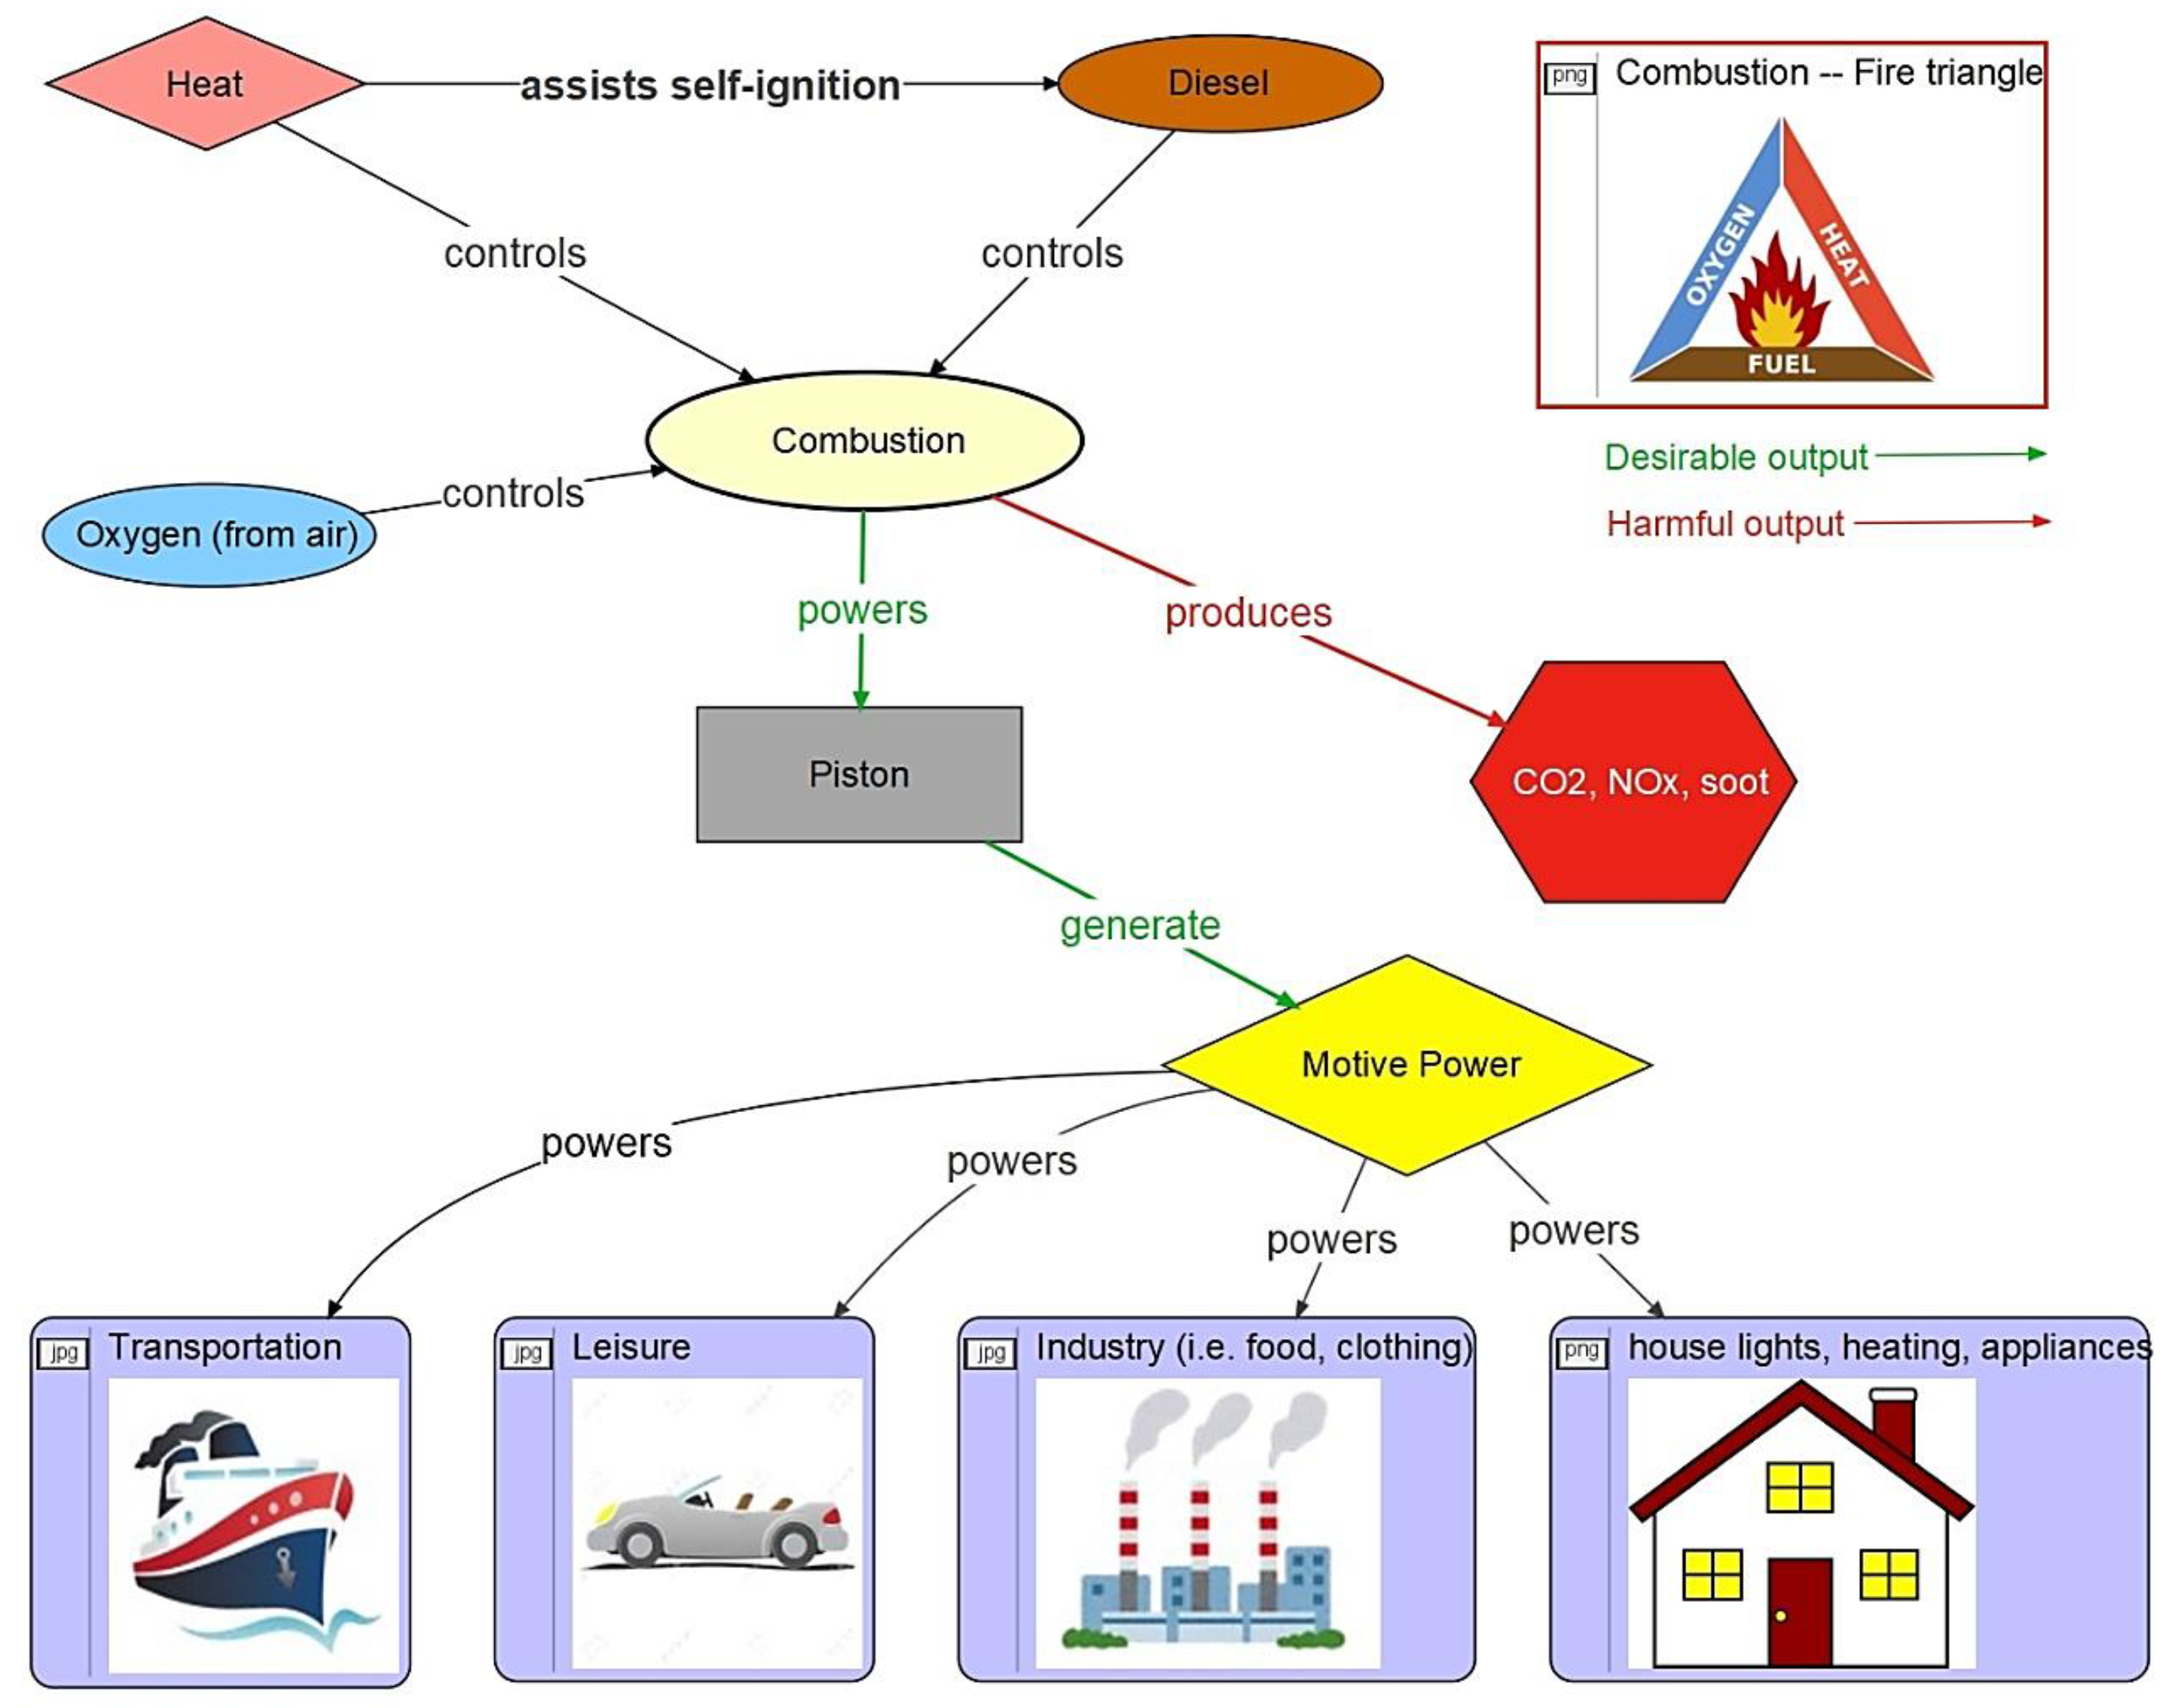
Figure 5 shows the presentation method used to introduce the ICE and its interaction with the environment for Group A. The method used for the non-FAD group was to list the key messages in bullet points, supported by images, with the presenter giving a detailed explanation of the material covered in each slide. Figure 6 shows the same material covered for Group B using the FAD method.
Slides for both groups covered the same material, while the lecture’s time and focus on the points covered were comparable. The FAD approach for Group B aimed to provide more fundamental detail on the elements involved and how they interact. In contrast, the approach used in Group A can encourage the student to use mostly their memorisation abilities rather than reasoning and understanding.
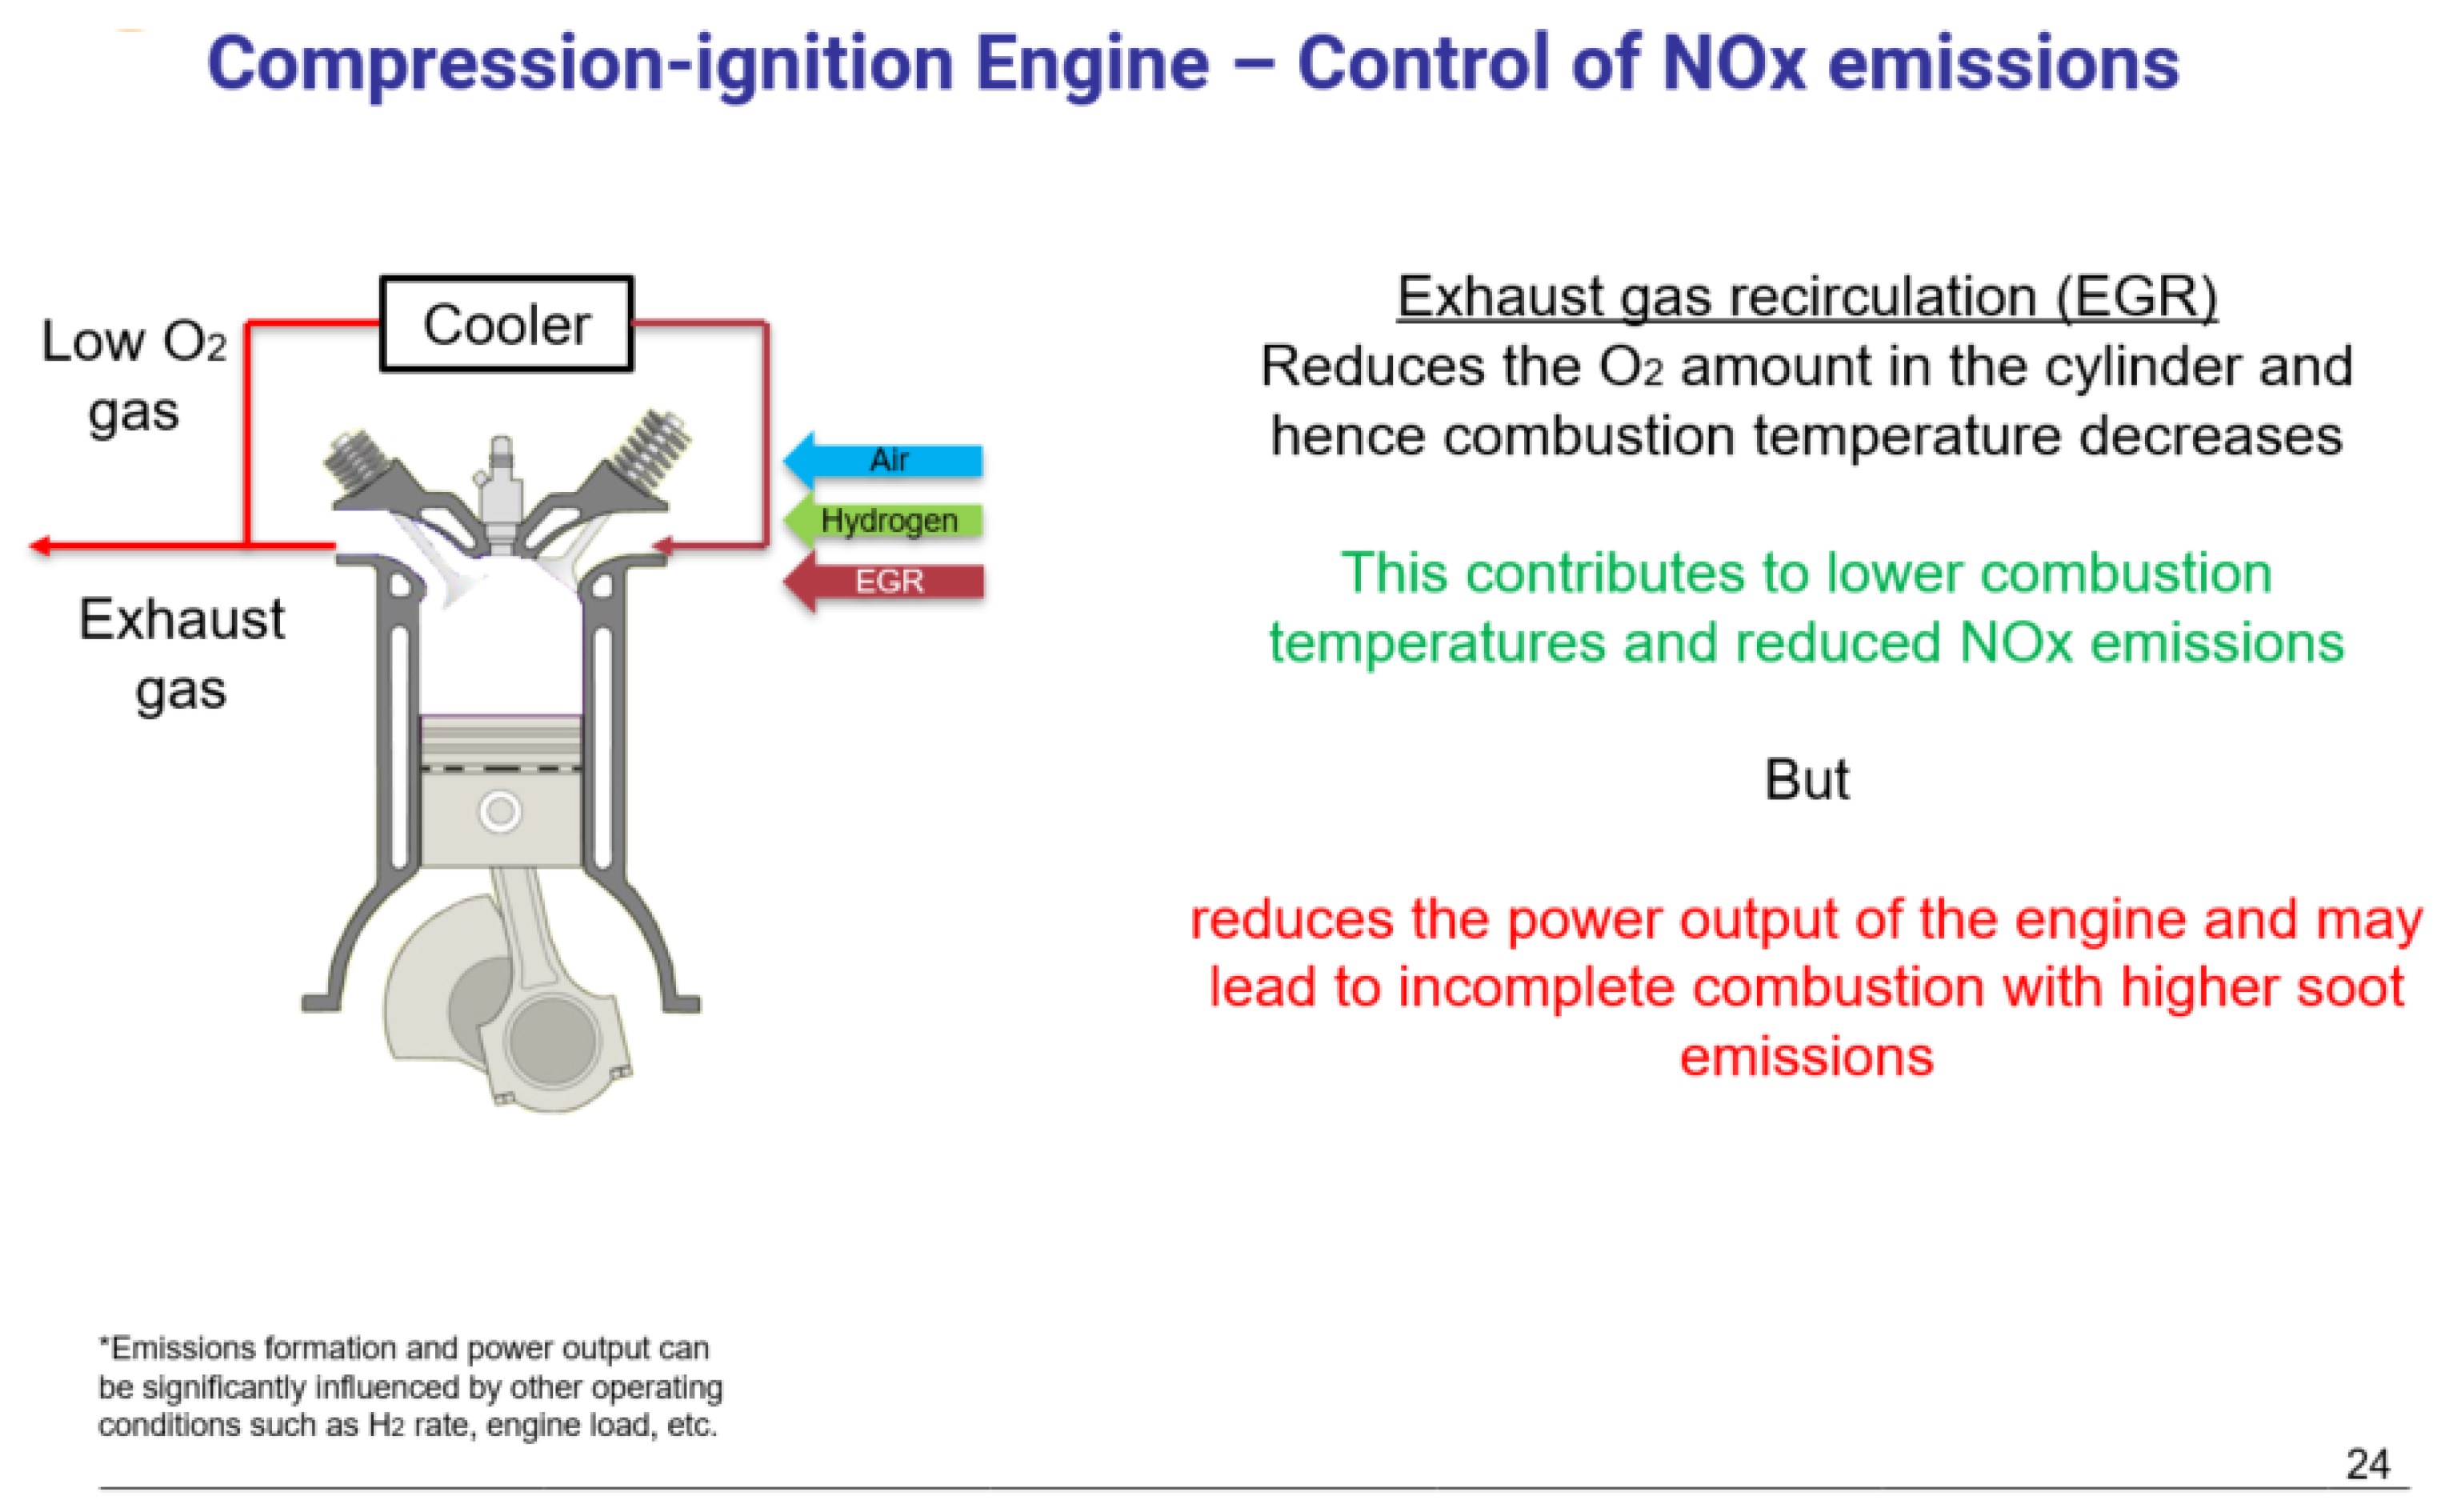
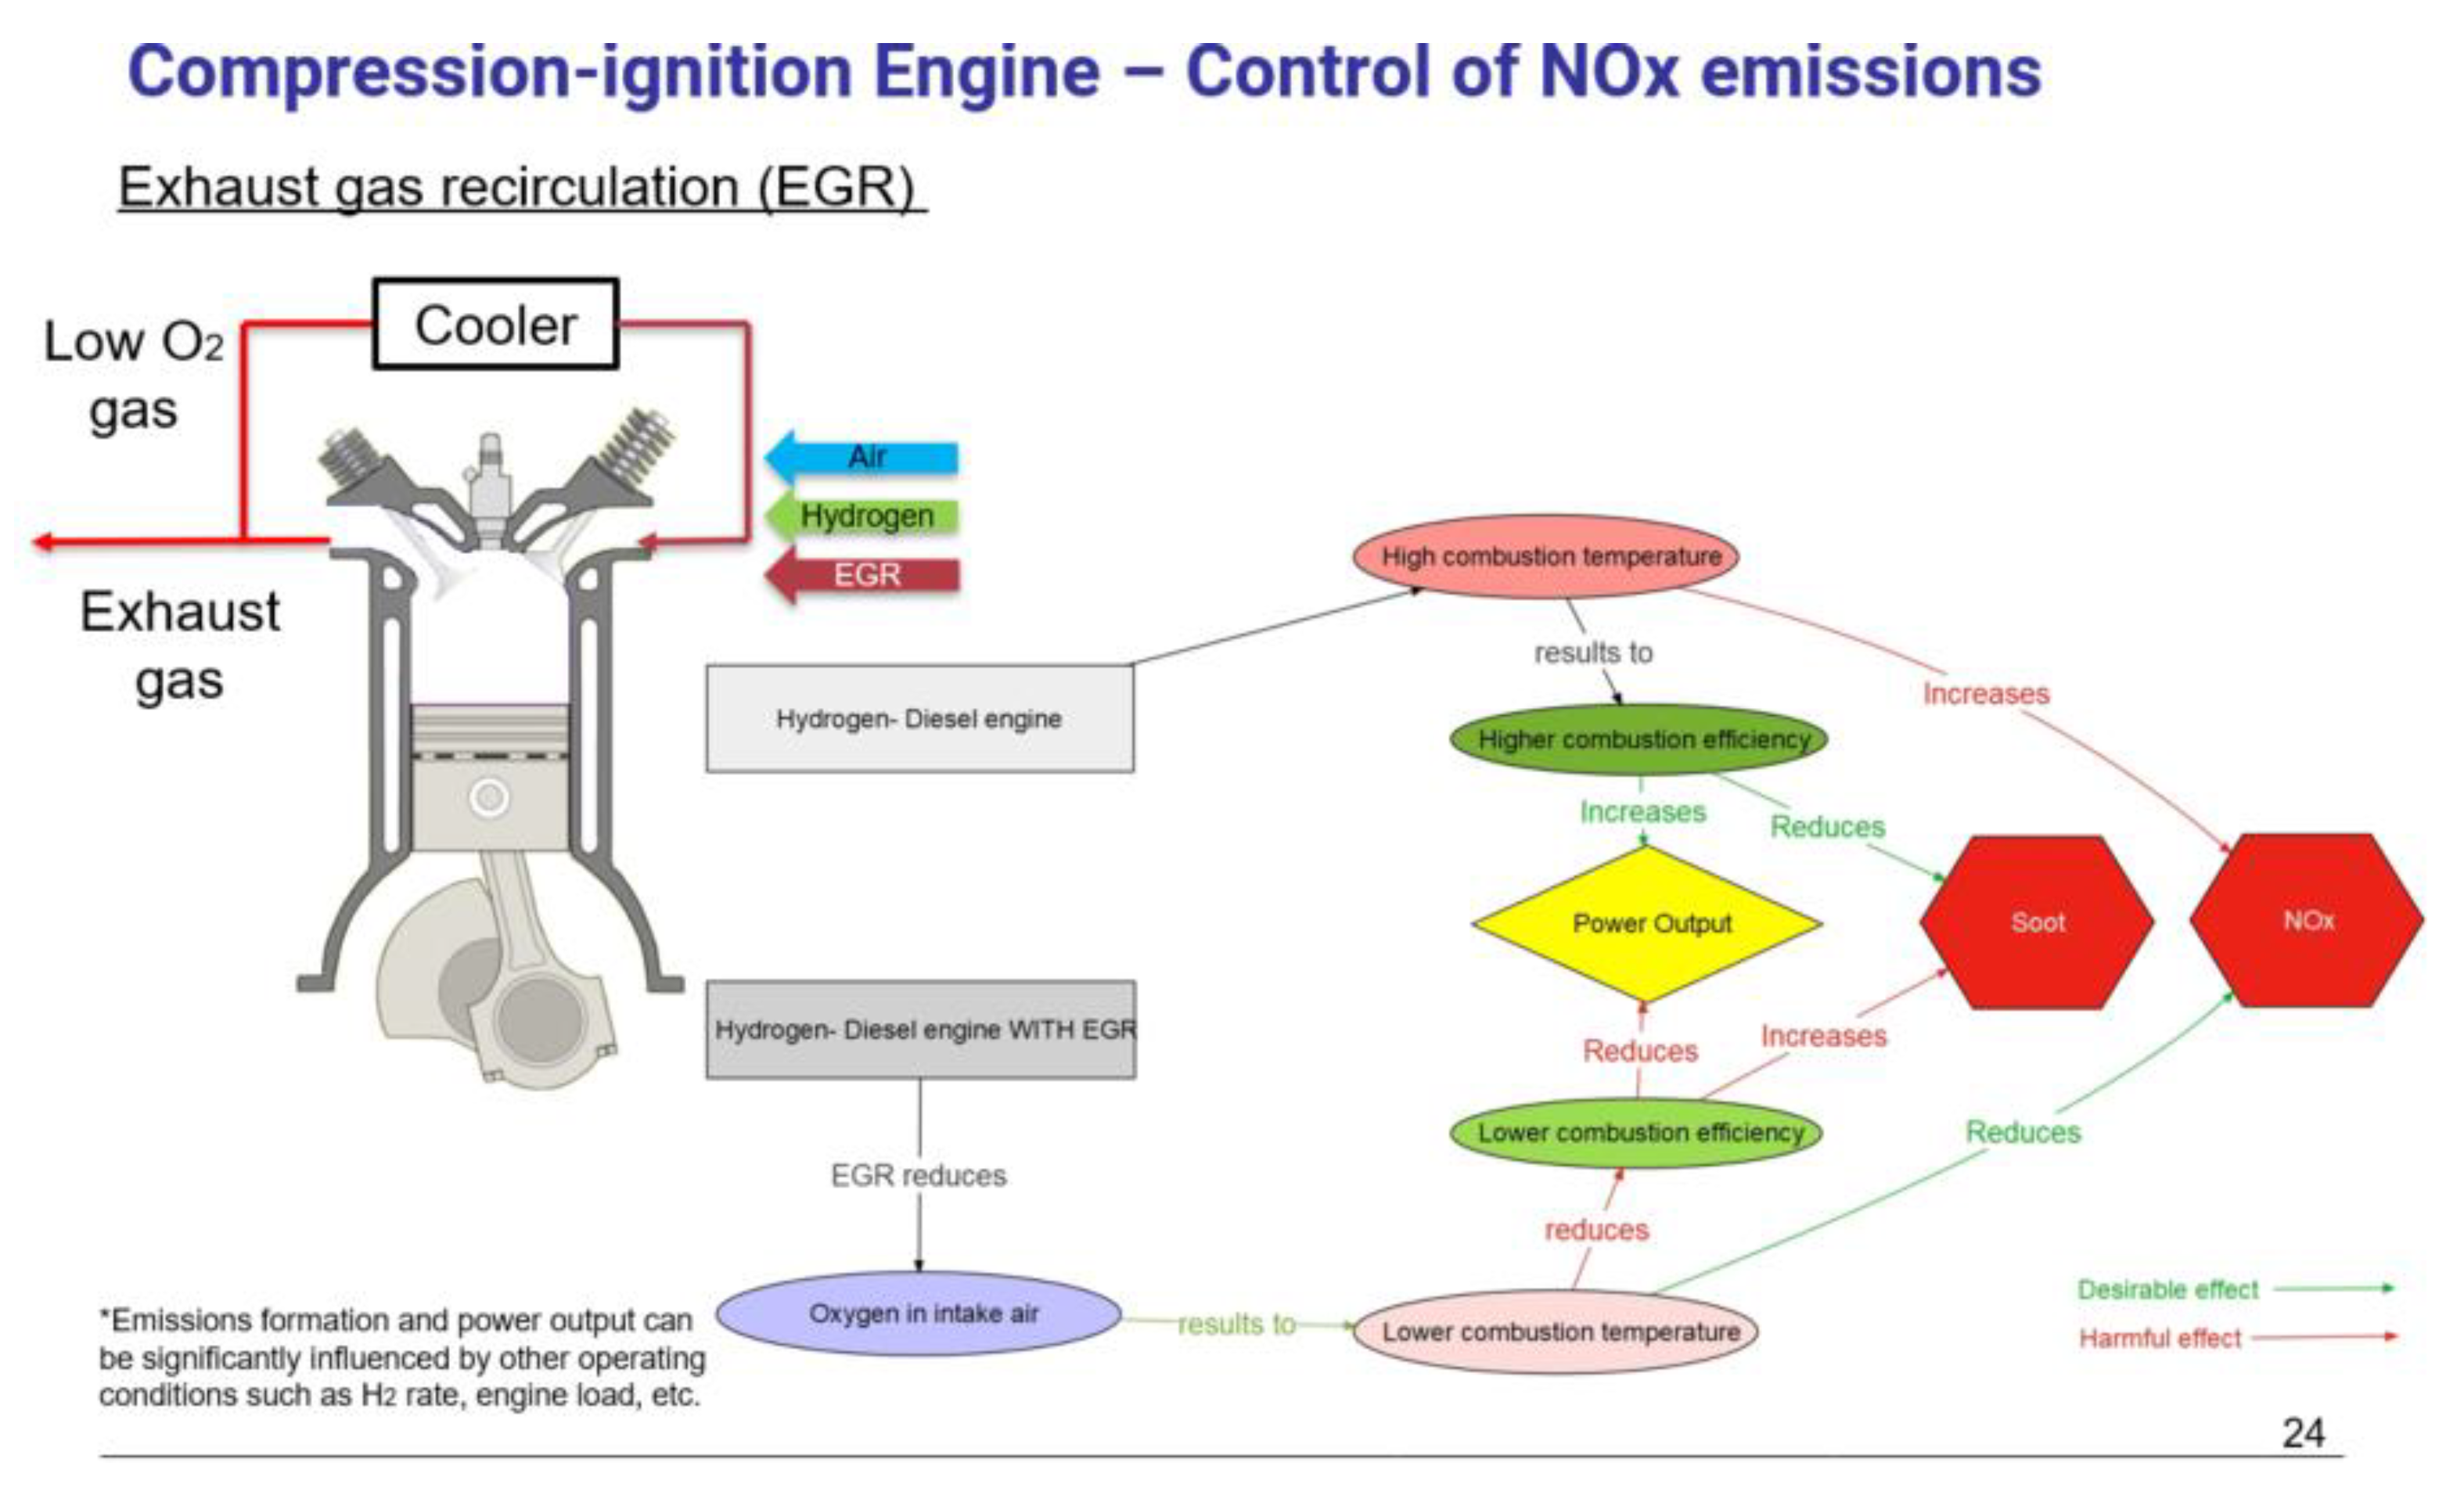
Figure 7 and Figure 8 show the presentation slides used to introduce how the nitrogen oxide (NOx) emissions of a compression ignition engine can be suppressed by the implementation of hydrogen and high levels of exhaust gas recirculation (EGR: a widely applied emission control technology for reducing NOx emissions). Compared to the conventional approach (Figure 7), the FAD model shown in 8 provides detail on the functional interactions between the key elements (hydrogen fuel, oxygen rate, and combustion temperature) contributing to the increase in NOx emissions and how controlling these elements can suppress NOx formation.
After the presentations were delivered to both groups, the students were asked to complete a written assessment of the lecture material covered. The questionnaire was composed of 15 multiple-choice questions, aiming to objectively assess the students’ understanding of the teaching material, their ability to think critically, and to apply principles. The seven criteria proposed by the Centre for Research on Evaluation, Standards, and Student Testing (CRESST)—namely cognitive complexity, content quality, meaningfulness, language appropriateness, transfer and generalizability, fairness, and reliability were taken into account during the questionnaire’s development [42].
A total of 5 out of the 15 questions (Q1 to Q5) aimed to assess the students’ comprehension of the material covered in Part 1 (which was common for both groups) and the remaining ten (Q6 to Q15) likewise for Part 2. The majority of the questions for Part 1 assessed the students’ ability to understand or memorise the taught material. The questions for Part 2 were significantly more complex and required the students to exercise a range of intellectual capabilities, ranging from recalling information to critical thinking, reasoning and knowledge application. The authors were particularly concerned about the content addressed by the second set of questions (Q6–Q15) and made every effort to address it equally in both groups’ presentations. Question 15, for example, aimed to assess the students’ understanding of the exhaust gas recirculation (EGR) system presented in Figure 7 and Figure 8 as follows:
How does the exhaust gas recirculation (EGR) system reduce NOx emissions on a Hydrogen-diesel compression engine? Select the correct answer:
- A.
- Reduces CO2 content
- B.
- Increases combustion efficiency and increases the combustion temperature
- C.
- Reduces O2 (oxygen) content and the combustion temperature
- D.
- Reduces O2 (oxygen) content and increases the combustion temperature
The answers to this question are given in text form for Group A (Figure 7) and a FAD diagram for Group B (Figure 8). While a similar approach was used on most questions, questions 8, 10, 12, and 14 assessed the students’ ability to apply the newly acquired knowledge, as the correct answer was not directly given in the slides or the lecturer’s presentation.
2.8. Research Quality
The research quality criteria utilised in the design and evaluation of this intervention study were based on the works of Tracy [43], Lincoln and Guba [44] and Mays and Pope [45].
This paper’s research scope section (Section 1.1) provides an overview of the STEM education initiative, the significance of engineering and technology teaching in general education settings and the issues reported, suggesting that the topic is worthy of research [43]. Credibility is supported through triangulation [44] of a literature review on similar studies, quantitative assessment data and student interviews. The transferability or relevance [45] criterion was addressed by the intervention’s detailed or thick descriptions [42] and the abstract nature of the FAD method. Finally, this study addresses the significant contribution [43] criterion by extending knowledge on the subject.
3. Procedure
3.1. Presentation
The same instructor (Author PD) delivered the presentations to both groups on 17 October 2019. The presentation sessions took place during the only available free time, right after the dinner break of a long and tiring day. The lectures were delivered one right after the other, ensuring no time for the two groups’ students to interact. The presentation classroom was prepared using the same presentation equipment for both groups, and a camera was set up at the rear of the room to record both lectures. The recorded material was later used to verify that the teaching emphasis given to the material evaluated by the assessment questions was balanced across the two groups. A school projector was used to display the slides; however, the quality of the images could have been more adequately clear—particularly for the FAD slides shown to Group B, which included text in a smaller size. Author IM took notes during both presentation sessions, paying attention to the students’ expressed interest levels and their focus on the lecture. The school staff who participated in this study also attended both sessions to supervise and ensure that everything was going according to the plan and in accordance with the School’s policies and standards.
The two sessions lasted approximately 45 min each and were followed by Q&A sessions where students had the opportunity to ask questions related to the material presented. Students from Group A engaged with the Q&A session after the lecture (over 25% of the group asked questions). However, only one student from group B asked a question. The authors were at the time concerned that this signified reduced interest or comprehension of the teaching material.
3.2. Assessment
After the end of the Q&A session following each presentation, the students were moved to a classroom prepared in advance for the written assessment. Printed versions of the 15 multiple-choice questions were handed out to the students, who had to fill in only their participant numbers without revealing their names. The time they were allowed to answer the questionnaire was 30 min, and the whole process was invigilated by school staff.
3.3. Interviews
After the end of the two presentations and the following day, the authors had the opportunity to communicate with some students and ask them for their opinion on the whole process. Authors IM, PD, and the participating school staff had several informal interviews with randomly selected members from both groups. The Results and Discussion section includes some of the students’ comments.
4. Results and Discussion
The test results for each of the two parts of the assessment presented in this section are referred to as “Score 1” (questions Q1–Q5) and “Score 2” (questions Q6–Q15). The participants’ performance on “Score 2” was compared between the two groups and against the parameters provided by the School (overall grade, English [IELTS] grade, science grade, age, and class). The data analysis and plots presented in this section were conducted using the “pandas”, “Seaborn”, “scikit-learn”, and “SciPy” software packages for the Python programming language.
The participants’ performance on Score 1 (Table 1), together with the demographic and school performance data (Figure 4), confirmed the authors’ expectations and supported the assumption that the random allocation described in Section 2.3 created two comparable groups from the same population, with no apparent capability or performance biases for either. In this section, we examine each research objective listed in Section 1.4 and consider the effects of FAD-assisted teaching on students from different classes.
4.1. Effect Size and Impact on Future Studies
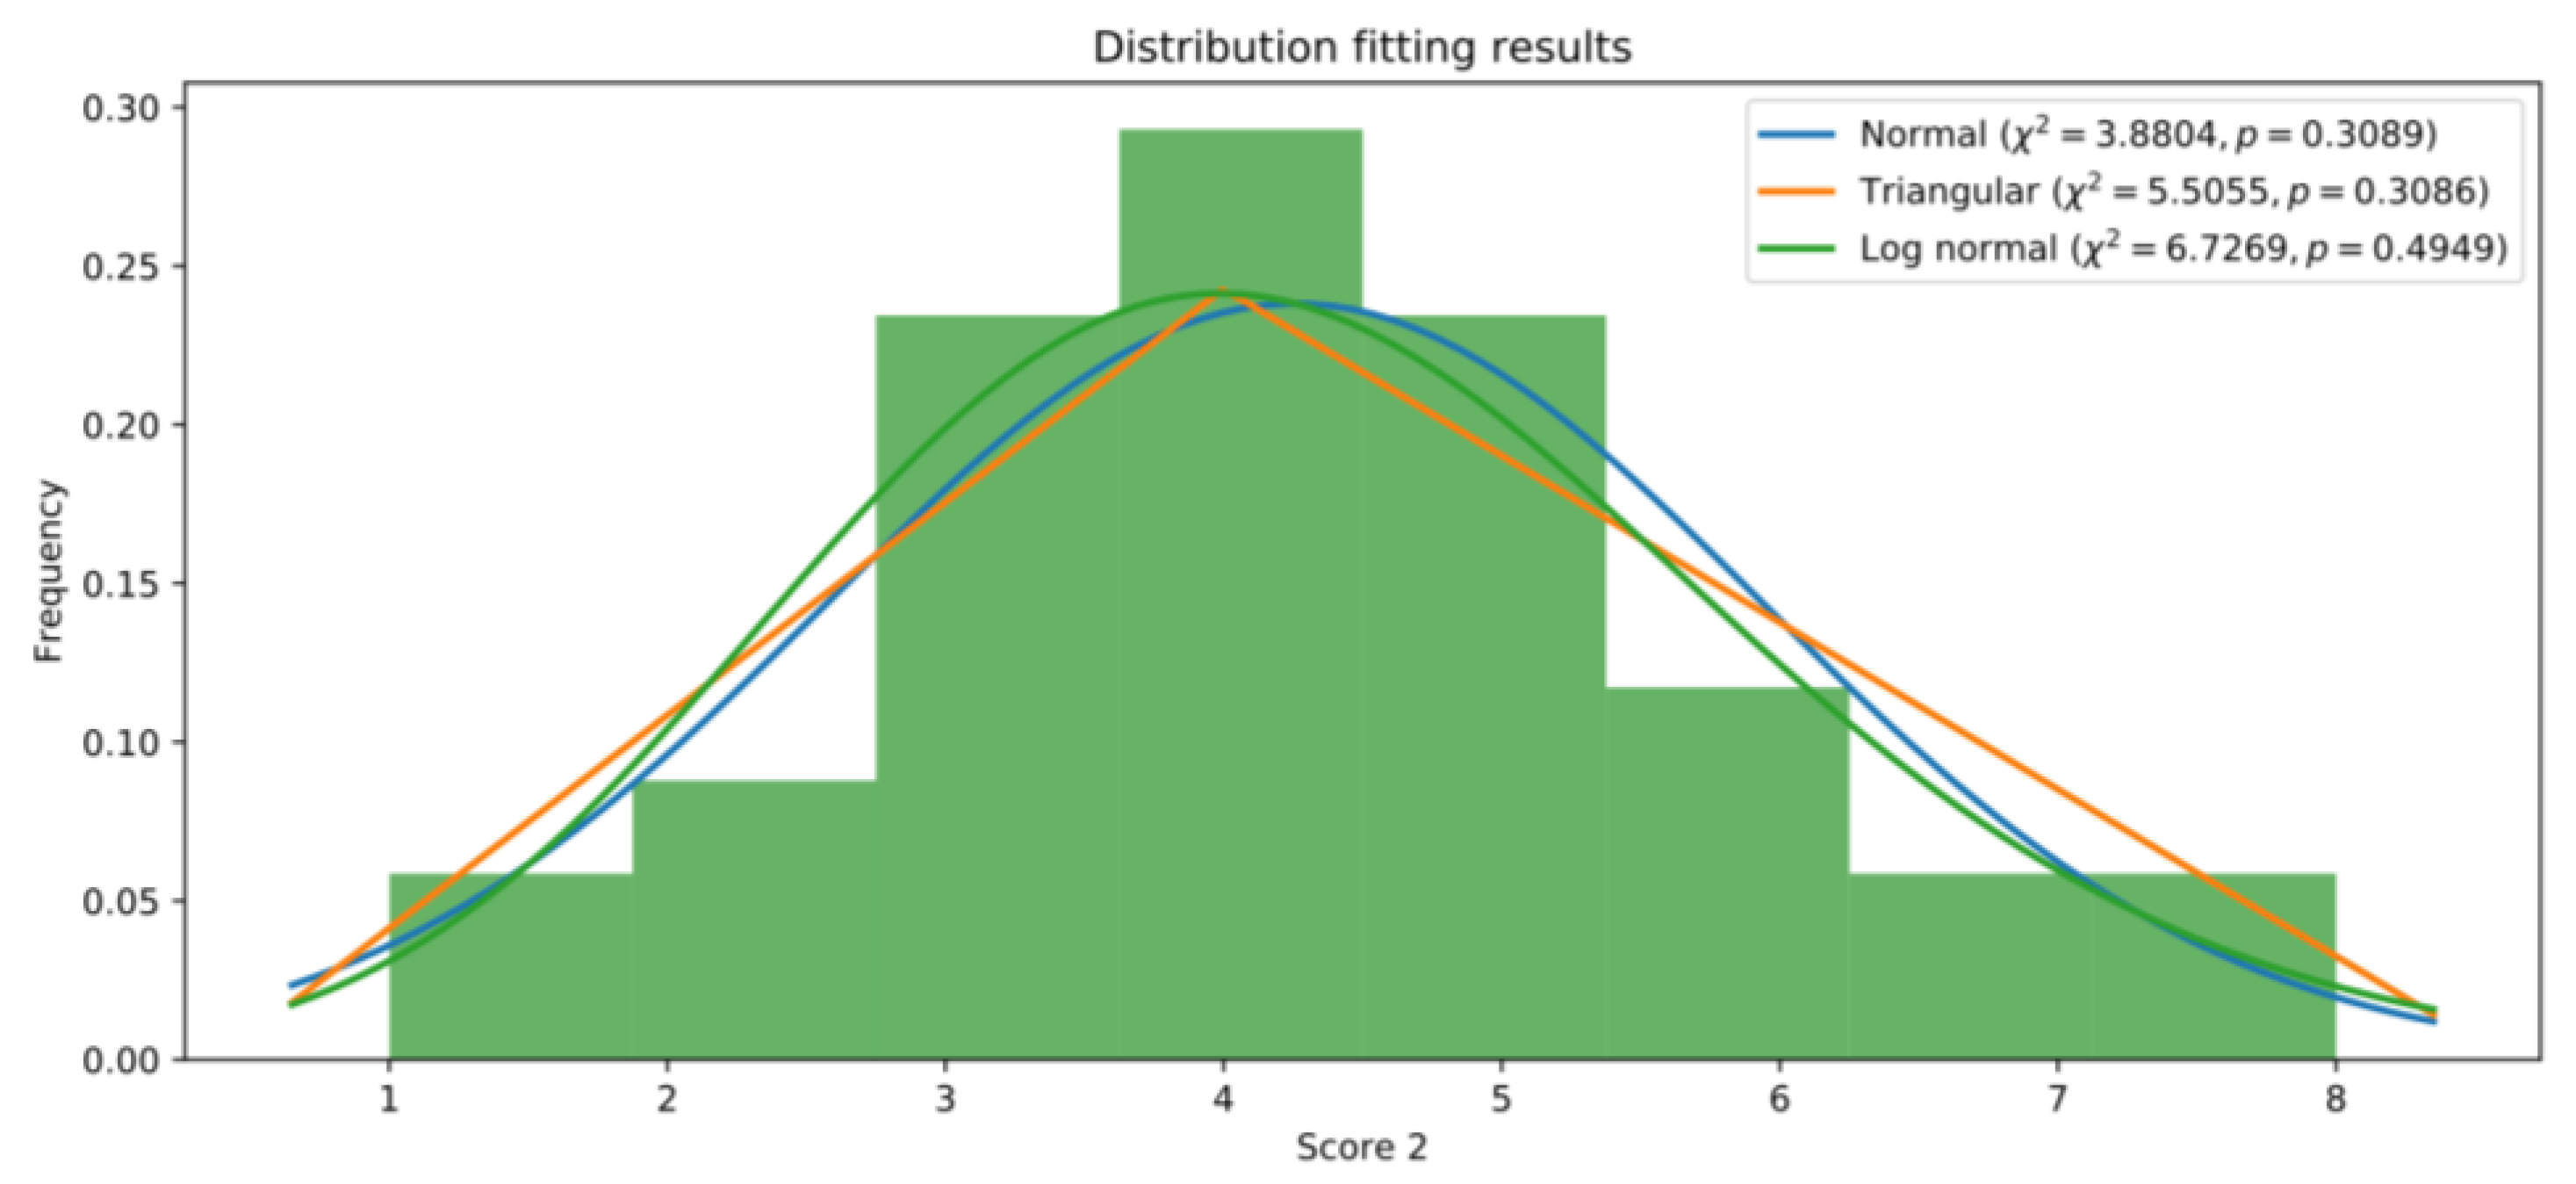
The measurements collected for the variable “Score 2” were compared to standard statistical distributions; this is a prerequisite to estimating the effect size, as the calculation of the latter requires the distribution as an input. The comparison to several distributions using the Kolgomorov–Smirnov test points at the variable being normally distributed (Figure 9). Therefore a parametric comparison of means (e.g., a t-test) can be used to evaluate the intervention’s impact [46].
Based on these results, an estimate of the intervention’s effect size was calculated for “Score 2” from the pilot study’s results to assist with the sample size calculation for future studies. Cohen’s d was used as the most common measure [47]. For the observed difference between Group A (M = 3.9, s = 1.5526, n = 20) and Group B (M = 4.6316, s = 1.8016, n = 19), d was estimated at 0.435, which places the effect size in the small-to-medium range [48]. A future experimental study must consider this when calculating the sample size necessary to obtain reliable results.
4.2. Additional Analysis
Further to estimating the effect size, the authors conducted additional analysis of the collected data, aiming to support the pilot study’s objective of evaluating and improving the method. The results are presented and discussed below.
4.2.1. Effects on Students with No Relevant Background
The averaged test results shown in Table 1 indicate that Group B outperformed Group A by 19% on Score 2, while Group A outperformed Group B by 1% on Score 1, suggesting a marked improvement with the FAD-assisted method utilised in Group B. These results aligned with relevant literature (Section 1.2 and Section 1.3) and our expectations for considerable performance improvement for Group B over Group A on Score 2.
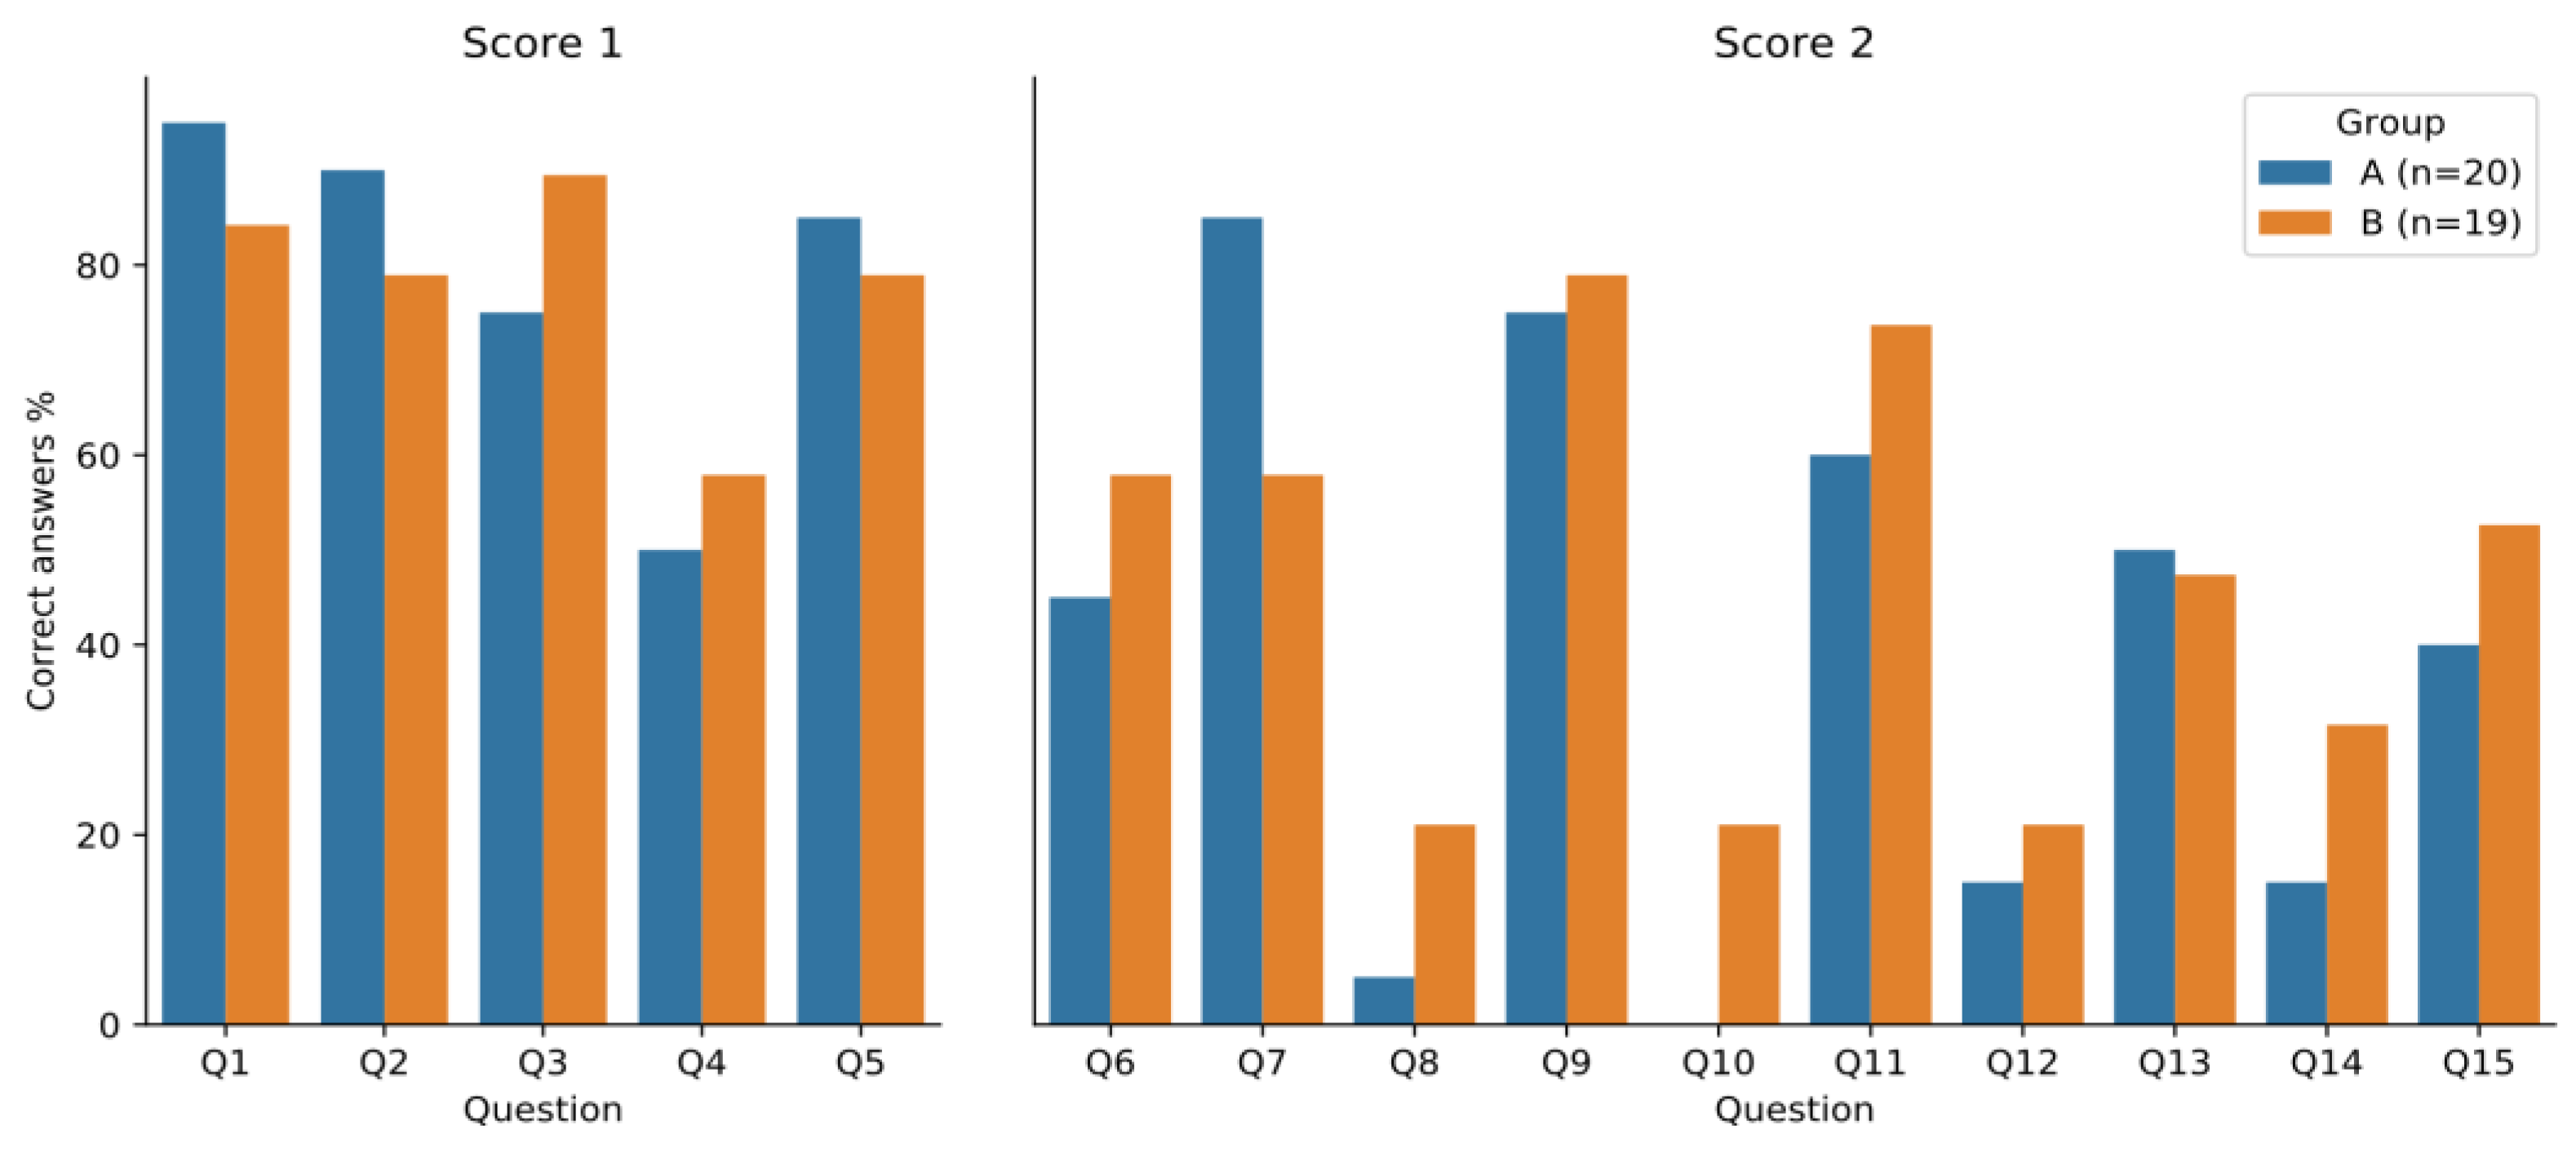
The chart in Figure 10 shows the average score by the group for every question. The data indicate a consistent performance difference between the two groups and suggests that some of the questions in Part 2 were too challenging for all participants. It is noteworthy that except for Question 7, Group B outperformed Group A on all questions comprising Score 2 (Q6–Q15), while the average performance was very similar for both groups on Score 1. The between-group similarity for Score 1 and the differences seen for Score 2 indicates that the two questionnaire sections measure different underlying variables.
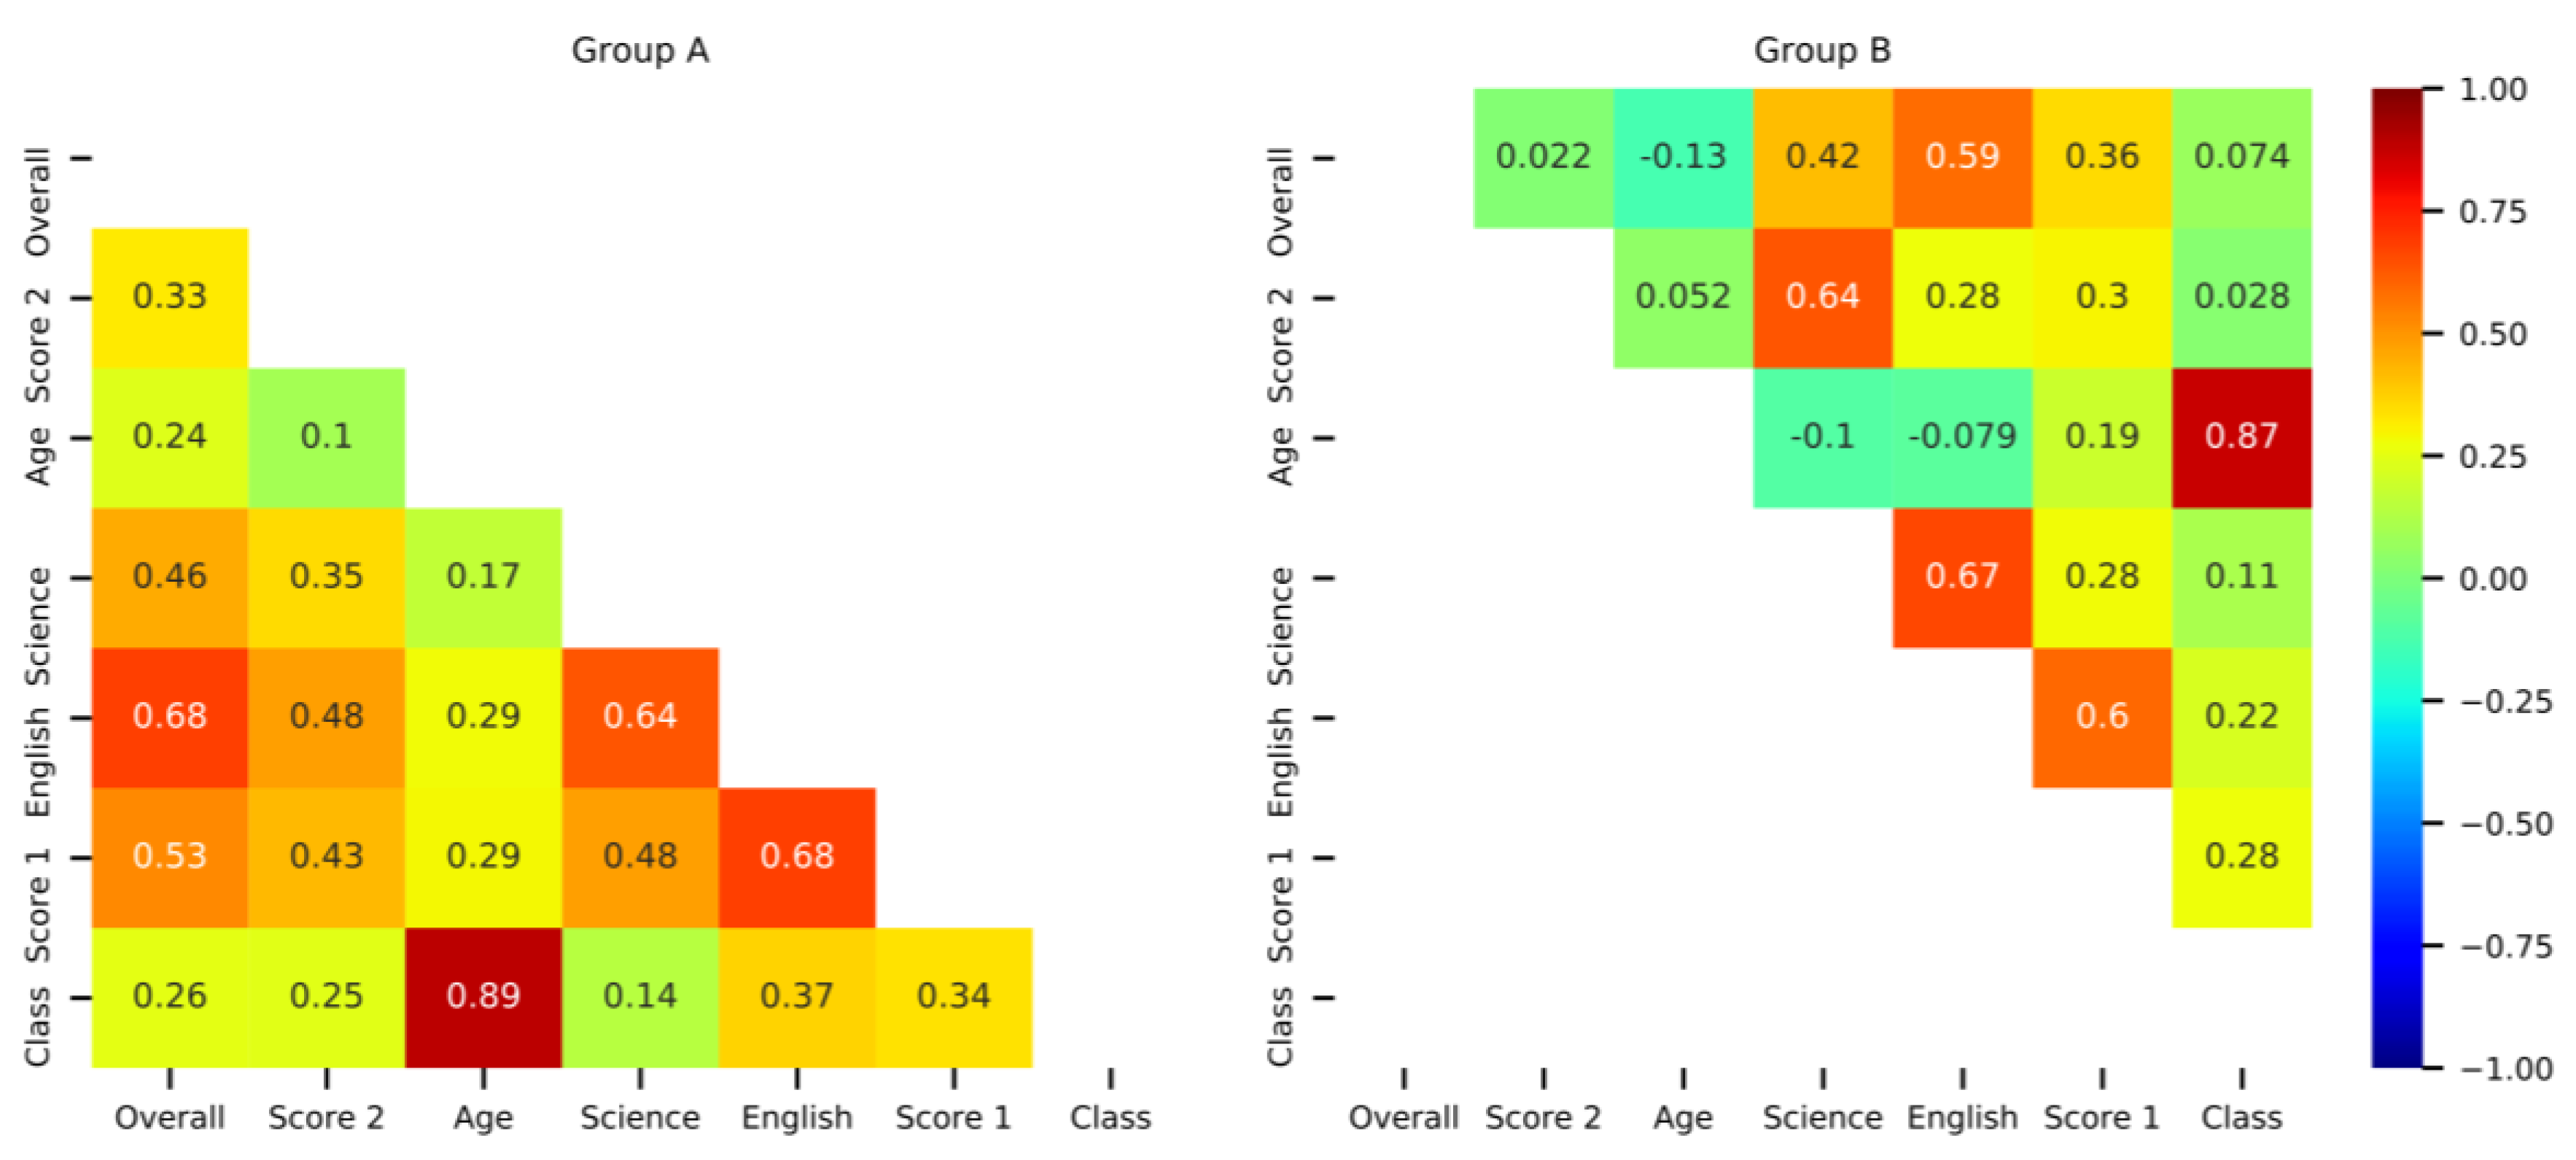
The correlation matrix group comparison shown in Figure 11 also suggests differences between the two groups on the correlation values of Score 2, with overall grade and class. Class and Score 2 show some correlation for Group A (r = 0.250) but not for Group B (r = 0.028). Similarly, overall grade and Score 2 appear correlated for Group A (r = 0.330) but less for Group B (r = 0.022). These differences suggest that low-performing and junior-level students are more likely to benefit from the FAD-assisted method than high-performing and senior students, respectively. This feature in the data is in line with Mayer’s assimilation theory [49] and the work of Lambiotte and Dansereau [50], both of which suggested that maps are of the most benefit to less knowledgeable students, while for more knowledgeable students maps can conflict with established knowledge structures.
4.2.2. Effects on Students with Various Levels in the Taught (English) Language
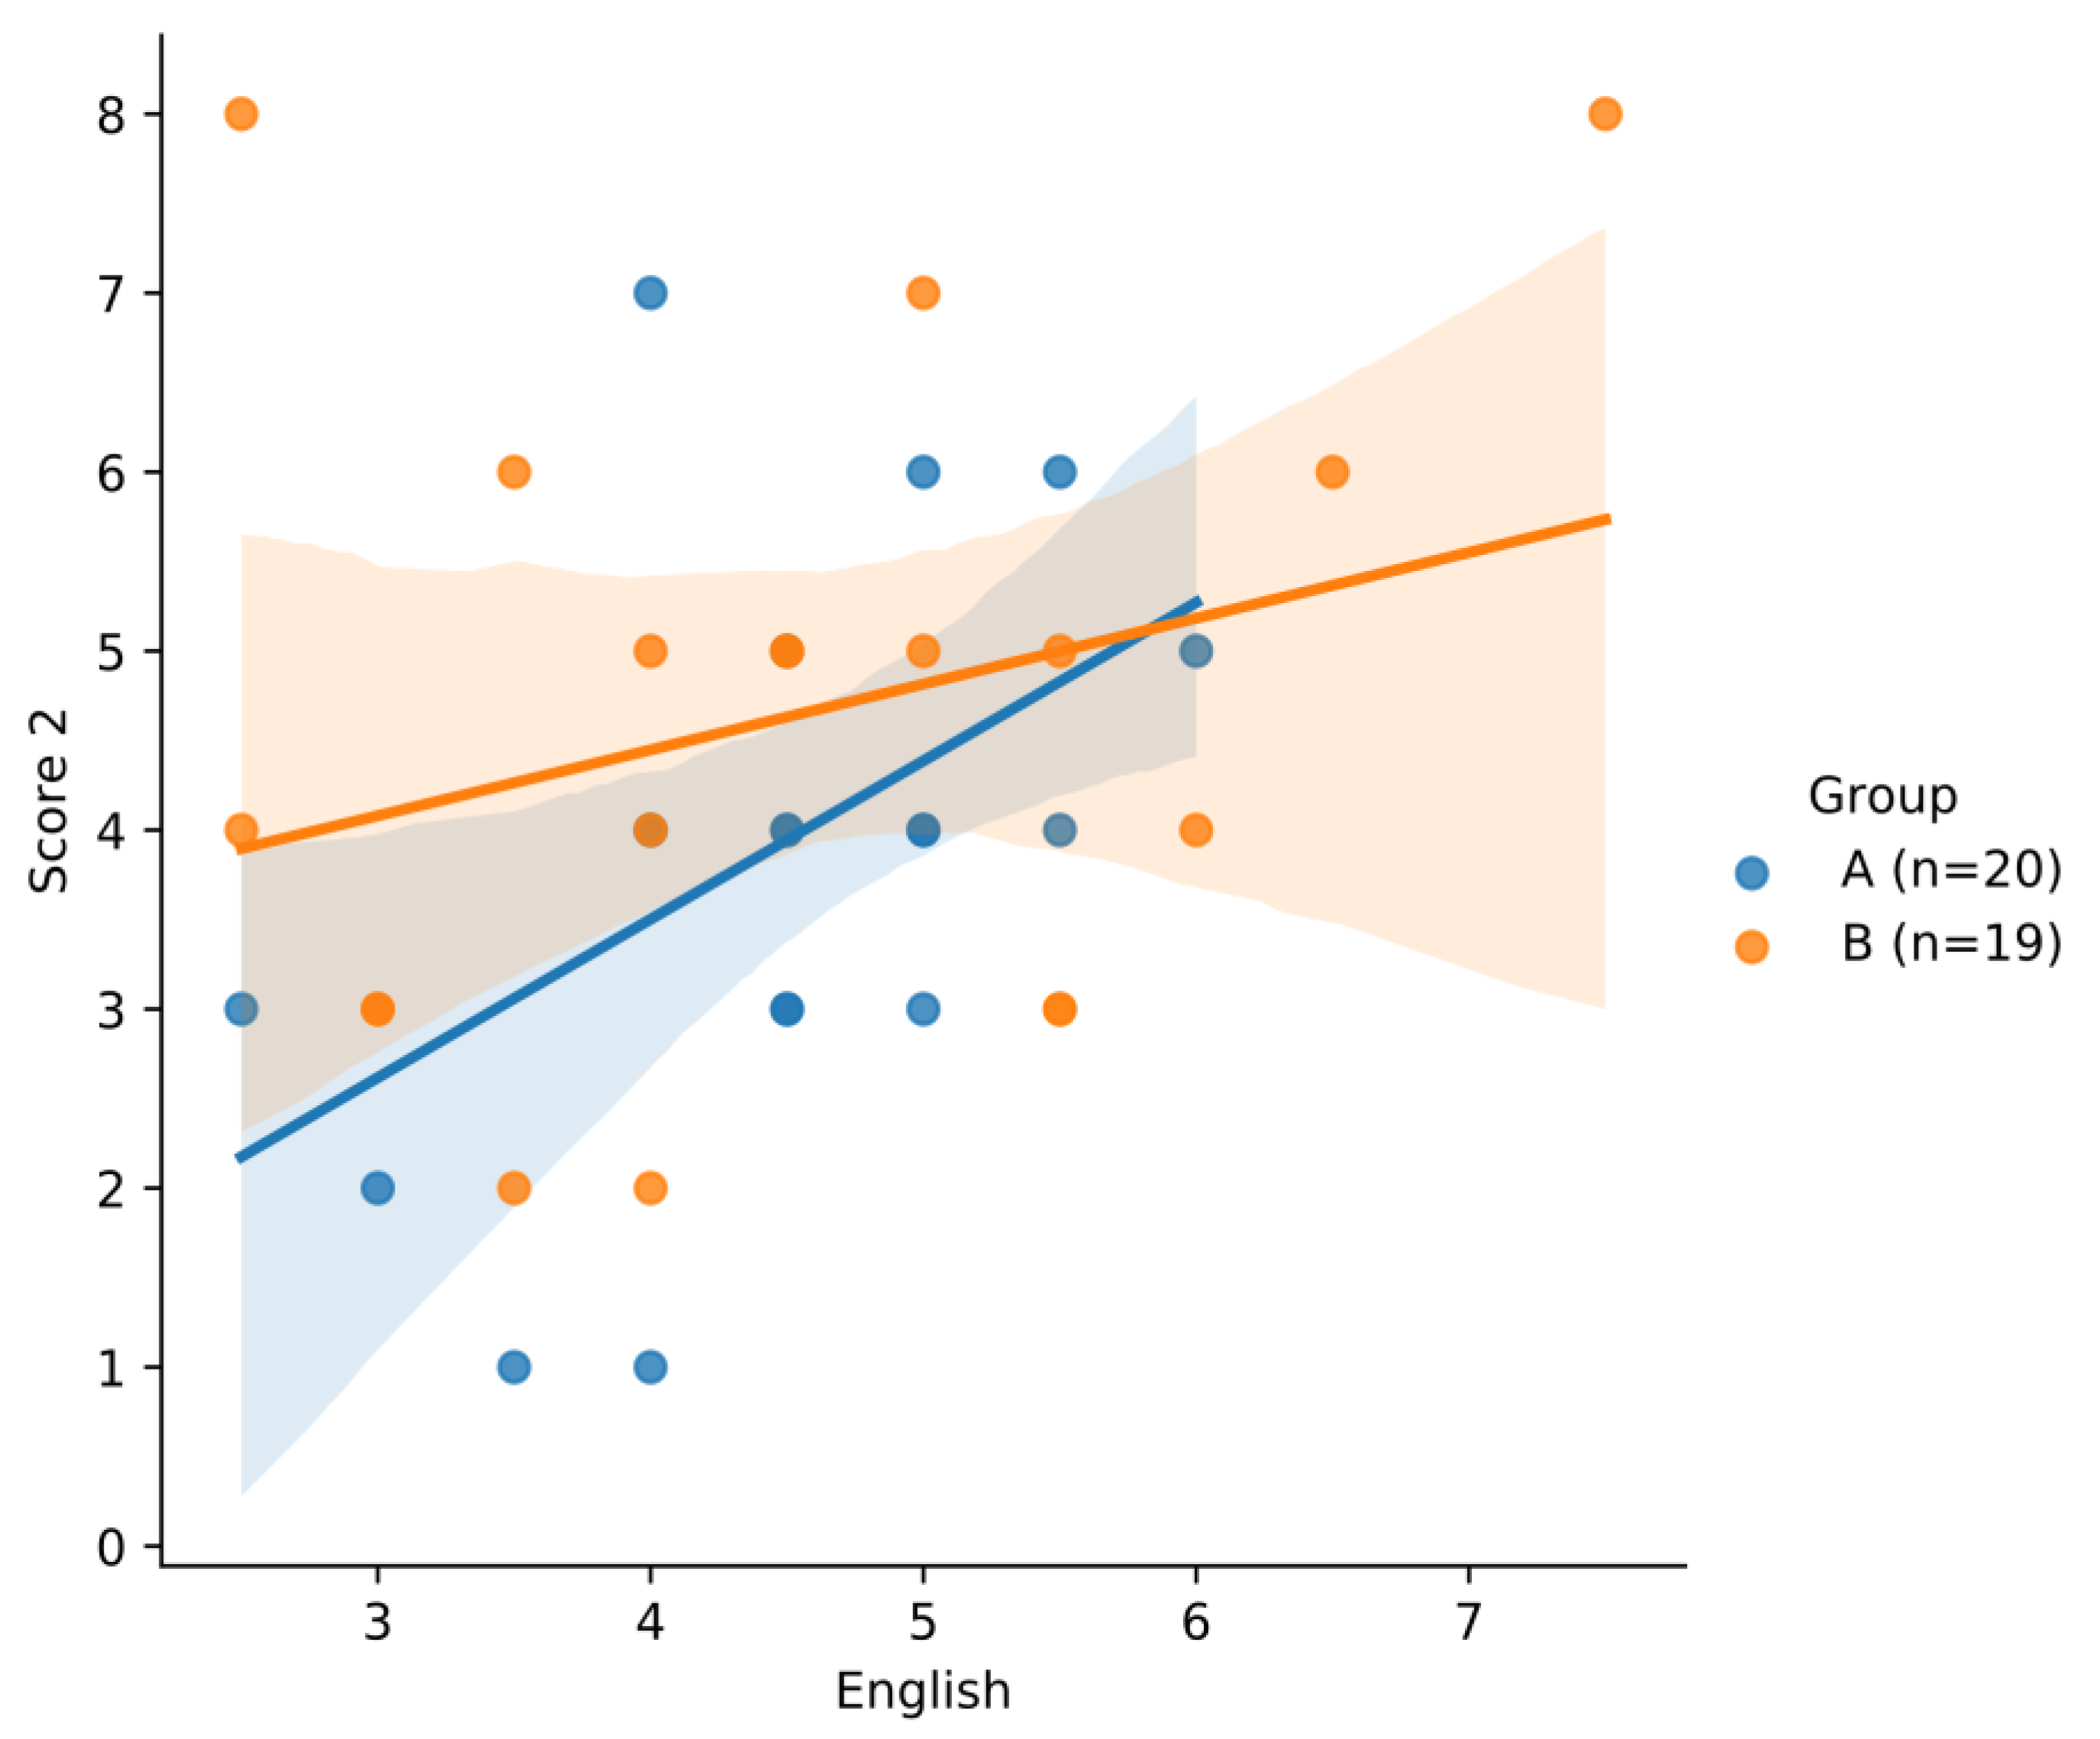
The correlation matrix shown in Figure 11 indicates a correlation between prior English performance and Score 1 for Group A (r = 0.680) and Group B (r = 0.600) students. For Score 2, the corresponding correlation values drop to r = 0.480 (Group A) and r = 0.280 (Group B). The difference in correlation values between groups on Score 2 can be better examined through the scatterplot shown in Figure 12. The regression line angles illustrate the weaker correlation between Score 2 and the English score for Group B compared to Group A. The plotted areas indicate the confidence interval for each regression line, highlighting the limitations of the pilot study to support any robust conclusions in this sense due to its sample size.
These observations suggest that the method can be used to test the authors’ core hypothesis: that FAD models of engineering systems can be more intuitive than system images augmented by bulleted statements and a scripted lecture, especially when the lecture is given in a language different from the students’ native language.
The post-assessment interviews provided additional insights into how well parts of the method worked: As expected, students from both groups stated that Part 2 of the lecture was challenging to understand and very different from anything they had been taught. Students from Group B also commented on the poor quality of the projected FAD models, and some stated that they struggled to read the function or element descriptions. When asked about their opinion on the FAD-assisted method utilised in this lecture, most students from Group B commented positively. In particular, a student from Group B stated that the FAD models helped him to quickly understand how the depicted system operates. Another student from the same group stated that she didn’t have to put much effort into understanding the lecturer, as she could study the diagrams.
These results support the study’s core hypothesis: that FAD models of engineering systems can be more intuitive than system images augmented by bulleted statements and a scripted lecture, especially when the lecture is given in a language different from the students’ native language. The findings align with prior studies in educational settings e.g., [13,15,51], suggesting that maps, in general, are easier to comprehend for students studying in their non-native language. They also agree with past studies e.g., [22,33,52] suggesting that FAD models can be of significant assistance when communicating engineering system functions to individuals from different disciplines. FAD models use simple function statements between system elements (nodes) that can be examined by the students, provided that they understand these statements and the descriptions of the system elements.
The post-assessment interviews provided additional insights into the results: As expected, students from both groups stated that Part 2 of the lecture was challenging to understand and very different from anything they had been taught. Students from Group B also commented on the poor quality of the projected FAD models, and some stated that they struggled to read the function or element descriptions. When asked about their opinion on the FAD-assisted method utilised in this lecture, most students from Group B commented positively. In particular, a student from Group B stated that the FAD models helped him to quickly understand how the depicted system operates. In contrast, a second student from the same group stated that she didn’t have to put much effort into understanding the lecturer, as she could study the diagrams.
4.2.3. Effects on Students with Different Levels of Science Subjects
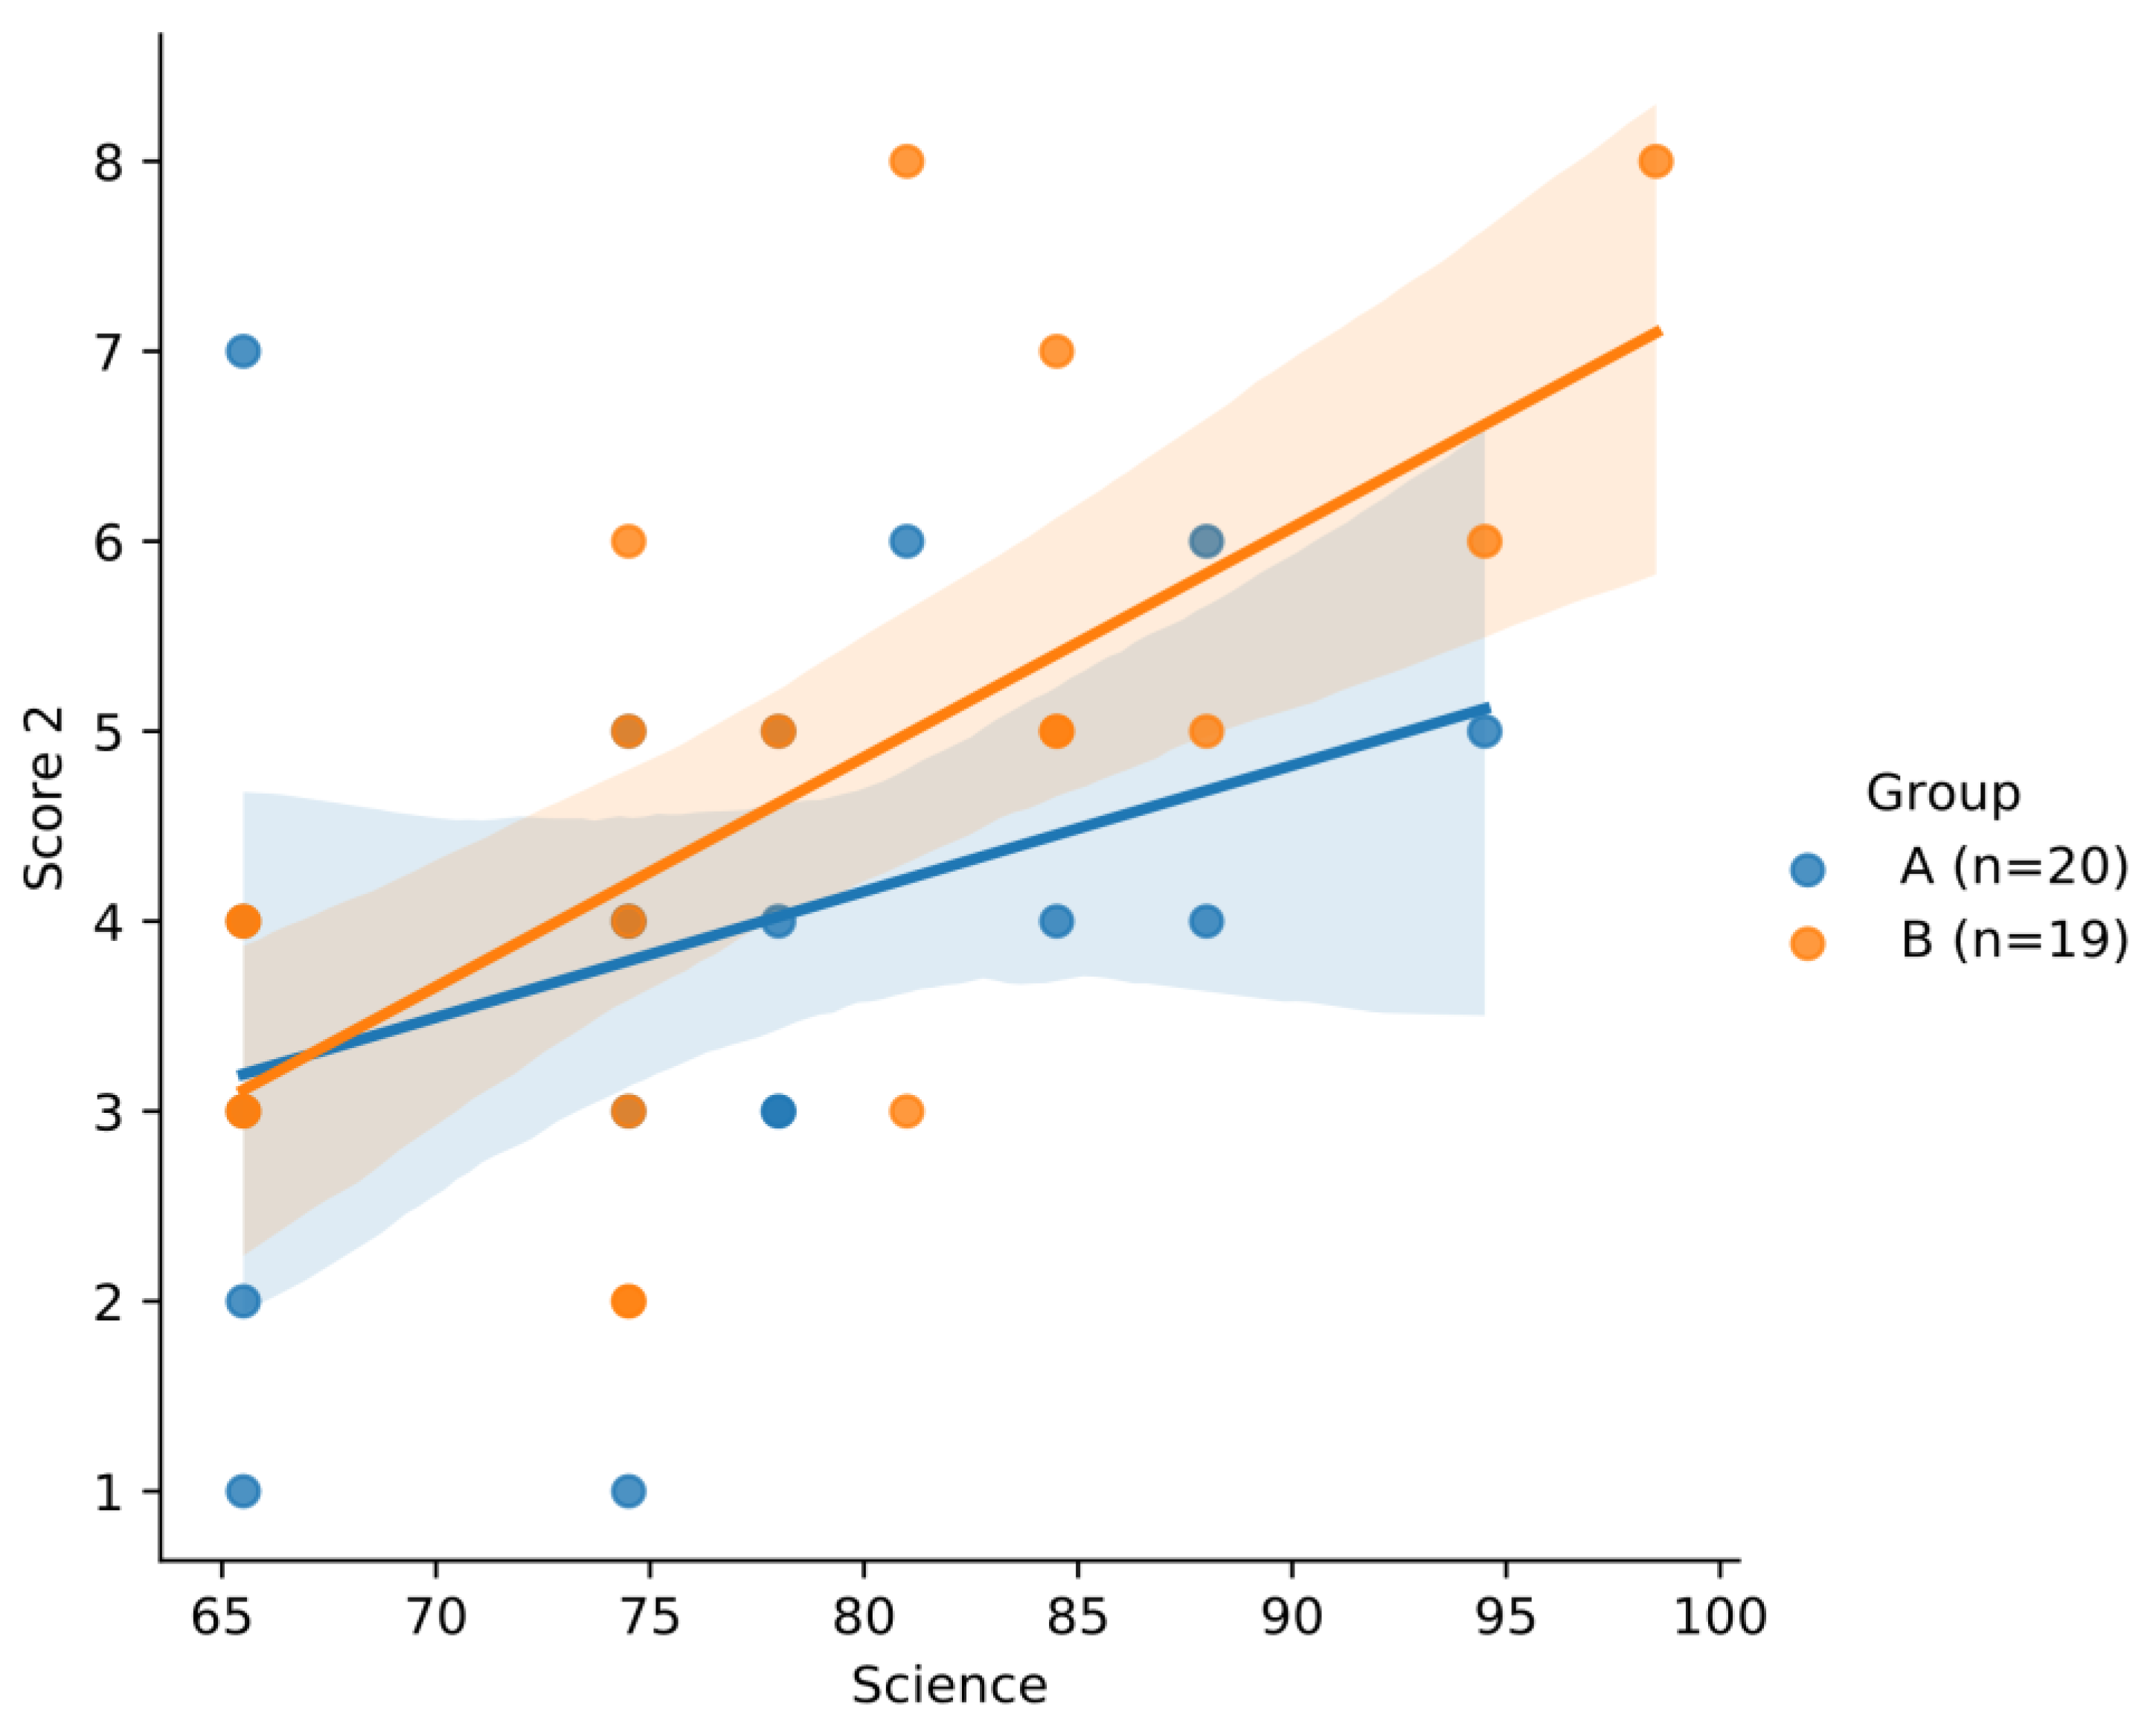
In contrast to early expectations, the correlation matrix (Figure 11) shows Score 2 and science grades for Group B to be correlated (r = 0.640), while the correlation between Score 1 and Science in the same group is much weaker (r = 0.350). The relationship between Score 2 and science for both groups is examined in more detail in Figure 13. The regression line angles indicate a stronger correlation between Science grades and Score 2 for Group B compared to Group A.
Our initial expectation of a weak correlation between science grades and Group B’s performance in Score 2 was therefore incorrect, based as it was on Mayer’s assimilation theory [49] and the reported effectiveness of functional models on transferring technical knowledge. However, the material taught under Part 2 was unfamiliar to all students, and their performance in science subjects should not be regarded as prior knowledge. Instead, the science subject score is likely associated with the student’s interest in science. Learners’ interest in the taught subject is essential for knowledge transfer under any teaching method. FAD models and maps require learners to focus and study the system elements and their functional interactions carefully; that task requires more effort than memorising a few words from the slides or lecture. This explanation is also supported by the informal interviews conducted with some students: about half of the students stated that they were not interested in the second part of the lecture when prompted. The ones who found it interesting were often students with both interest and good grades in science.
5. Conclusions
This paper presents a method developed by the authors to test the claim that FAD models of engineering systems can be more intuitive than system images, augmented by bulleted statements and a scripted lecture, especially when the lecture is different from the students’ native language. The paper also reports a pilot study conducted to provide initial experimental data to support future studies. While there are some studies on the use of diagrammatic tools in education (e.g., concept maps), this study contributes to the body of knowledge by discussing the effects of functional models, a method predominantly used by engineers, as a knowledge transfer method for engineering education. It also proposes a method to implement and evaluate educational interventions utilising such tools alongside a pilot study facilitating the design of future experiments.
The results from the written assessments and informal interviews attest to the feasibility of such a study, indicating that FAD-assisted teaching helped the students to understand the teaching material. Students scoring low in English (taught language) and high in science subjects seemed to benefit the most. The “Score 2” variable, on which the authors expect to observe the effect of the intervention, was found to be normally distributed, making parametric tests (such as a t-test) appropriate. The effect size was in the small-to-middle range (Cohen’s d = 0.435). Therefore, a future study aiming for an a priori power of 0.8 and using a 95% significance level would require at least 84 participants per group.
The pilot study also highlighted areas of risk which can be avoided in future studies, e.g., time of lecture and assessment and projected image clarity. Neither the sample size nor school selection are truly representative in the statistical sense. However, the findings of this study suggest that the experimental study using the proposed method can be of use in the search for a promising alternative for engineering education.
Author Contributions
Conceptualization, I.M. and P.D.; methodology, I.M., P.D. and A.K.; validation, I.M., A.K., P.D. and P.C.; formal analysis, A.K. and P.D.; investigation, I.M. and A.K.; resources, I.M. and P.D.; data curation, P.D. and A.K.; writing—original draft preparation, I.M., P.D. and P.C.; writing—review and editing, I.M. and P.D.; visualization, I.M. and P.D.; supervision, I.M.; project administration, P.D.; funding acquisition, P.D. All authors have read and agreed to the published version of the manuscript.
Funding
This work was partially supported by the UK Institute of Mechanical Engineers (IMEchE).
Institutional Review Board Statement
Ethical review and approval were waived for this study due to the Korean Law Information Center of the Ministry of Government legislation, human subject research studies do not require IRB approval under the following conditions: 1. In the case of non-invasive studies, such as research that does not involve invasive activities (e.g., drug administration, blood collection, etc.) 2. Research that does not collect or record sensitive information under Article 23 of the ⸢Personal Information Protection Act⸥ without specifying the research subject, etc., even if the research subject etc., is met face-to-face. You can find more information in the link below (in Korean) https://www.law.go.kr/LSW//lumLsLinkPop.do?lspttninfSeq=75929&chrClsCd=010202, accessed on 3 November 2020. Moreover, before the study, a detailed research proposal and a plan were shared with the School management team to obtain permission.
Informed Consent Statement
The study was conducted in accordance with the Declaration of Helsinki. Written informed consent has been obtained from the School personnel to conduct this study and publish this paper.
Data Availability Statement
Data are available upon request.
Acknowledgments
The authors would like to thank the students of Korea-Wales International Christian School that voluntarily participated in this research study. They would also like to extend their sincere gratitude to the School personnel for their support in this study.
Conflicts of Interest
The authors declare no conflict of interest.
References
- Burke, L.M.; McNeill, J.B. Educate to Innovate: How the Obama Plan for STEM Education Falls Short. Backgrounder 2011, 2504, 1–8. [Google Scholar]
- DfE. STEM Strategy. 2020. Available online: https://www.education-ni.gov.uk/articles/stem-strategy (accessed on 3 November 2020).
- Williams, J. STEM education: Proceed with caution. Des. Technol. Educ. Int. J. 2011, 1, 26–35. [Google Scholar]
- Sanders, M.E. Stem, Stem Education, Stemmania. 2008. Available online: http://hdl.handle.net/10919/51616 (accessed on 3 November 2020).
- Hoyle, P. Must Try Harder: An Evaluation of the UK Government’s Policy Directions in STEM Education. 2016. Available online: https://research.acer.edu.au/cgi/viewcontent.cgi?article=1280&context=research_conference (accessed on 3 November 2020).
- Bell, D. The reality of STEM education, design and technology teachers’ perceptions: A phenomenographic study. Int. J. Technol. Des. Educ. 2016, 26, 61–79. [Google Scholar] [CrossRef]
- Williams, P.J.; Barlex, D. Pedagogy for Technology Education in Secondary Schools: Research Informed Perspectives for Classroom Teachers; Springer: Berlin/Heidelberg, Germany, 2020. [Google Scholar]
- Blackley, S.; Howell, J. A STEM narrative: 15 years in the making. Aust. J. Teach. Educ. 2015, 40, 8. [Google Scholar] [CrossRef]
- Hallström, J.; Klasander, C. Visible parts, invisible whole: Swedish technology student teachers’ conceptions about technological systems. Int. J. Technol. Des. Educ. 2017, 27, 387–405. [Google Scholar] [CrossRef]
- Schmandt-Besserat, D. Before Writing, Vol. I: From Counting to Cuneiform; University of Texas Press: Austin, TX, USA, 1992; Volume 1. [Google Scholar]
- Novak, J.D. A theory of education: Meaningful learning underlies the constructive integration of thinking, feeling, and acting leading to empowerment for commitment and responsibility. Mean. Learn. Rev. 2011, 1, 1–14. [Google Scholar]
- Cañas, A.J.; Coffey, J.W.; Carnot, M.J.; Feltovich, P.; Hoffman, R.R.; Feltovich, J.; Novak, J.D. A summary of literature pertaining to the use of concept mapping techniques and technologies for education and performance support. Rep. Chief Nav. Educ. Train. 2003, 1–108. [Google Scholar]
- Nesbit, J.C.; Adesope, O.O. Learning with concept and knowledge maps: A meta-analysis. Rev. Educ. Res. 2006, 76, 413–448. [Google Scholar] [CrossRef]
- Tversky, B. Visualizing thought. Top. Cogn. Sci. 2011, 3, 499–535. [Google Scholar] [CrossRef]
- Amer, A.A. The effect of knowledge-map and underlining training on the reading comprehension of scientific texts. Engl. Specif. Purp. 1994, 13, 35–45. [Google Scholar] [CrossRef]
- Novak, J.D.; Cañas, A.J. The Theory Underlying Concept Maps and How to Construct and Use Them. 2008. Available online: http://cmap.ihmc.us/publications/researchpapers/theorycmaps/TheoryUnderlyingConceptMaps.bck-11-01-06.htm (accessed on 3 November 2020).
- Pahl, G.; Beitz, W.; Wallace, K. Engineering Design: Systematic Approach; Springer-GmbH: Berlin/Heidelberg, Germany, 1996; p. 578. [Google Scholar]
- Savransky, S.D. Engineering of Creativity: Introduction to TRIZ Methodology of Inventive Problem Solving; CRC Press: Boca Raton, Florida, USA, 2002; p. 412. [Google Scholar]
- Otto, K.N.; Wood, K.L. Product Design: Techniques in Reverse Engineering and New Product Development; Prentice Hall: New York, NY, USA, 2003. [Google Scholar]
- Aurisicchio, M.; Bracewell, R.; Armstrong, G. The function analysis diagram: Intended benefits and coexistence with other functional models. AI EDAM 2013, 27, 249–257. [Google Scholar] [CrossRef]
- Childs, P.R. Mechanical Design Engineering Handbook; Butterworth-Heinemann: Oxford, UK, 2018. [Google Scholar]
- Michalakoudis, I.; Aurisicchio, M.; Childs, P.; Koutlidis, A.; Harding, J. Empowering manufacturing personnel through functional understanding. Prod. Plan. Control 2018, 29, 688–703. [Google Scholar] [CrossRef]
- De Vries, M.J. Philosophy of Technology, in Technology Education for Teachers; Brill Sense: Paderborn, Germany, 2012; pp. 15–33. [Google Scholar]
- Cole, E.L. Functional analysis: A system conceptual design tool [and application to ATC system]. IEEE Trans. Aerosp. Electron. Syst. 1998, 34, 354–365. [Google Scholar] [CrossRef]
- Nagel, R.L.; Bohm, M.; Linsey, J. Evaluating the impact of teaching function in an engineering design curriculum. In Proceedings of the 2016 ASEE Annual Conference Exposition, New Orleans, LA, USA, 26 June 2016. [Google Scholar]
- Banks, H.D.; Murphy, A.R.; Bohm, M.R.; Linsey, J.S.; Nagel, R.L. A longitudinal exploration of students’ functional modeling abilities. In Proceedings of the 2020 ASEE Virtual Annual Conference Content Access, Online, 22–26 June 2020. [Google Scholar]
- Ginns, I.S.; Norton, S.J.; McRobbie, C.J. Adding value to the teaching and learning of design and technology. Int. J. Technol. Des. Educ. 2005, 15, 47–60. [Google Scholar] [CrossRef]
- Miles, L.D. Techniques of Value Analysis and Engineering; McGraw-Hill: New York, NY, USA, 1961. [Google Scholar]
- Devoino, I.; Koshevoy, O.E.; Litvin, S.S.; Tsourikov, V. Computer Based System for Imaging and Analyzing an Engineering Object System and Indicating Values of Specific Design Changes. U.S. Patent No. 6,056,428, 2 May 2000. [Google Scholar]
- Michalakoudis, I.; Childs, P.; Aurisicchio, M.; Harding, J. Using functional analysis diagrams to improve product reliability and cost. Adv. Mech. Eng. 2016, 8, 1–11. [Google Scholar] [CrossRef]
- Aurisicchio, M.; Eng, N.L.; Nicolas, O.; Carlos, J.; Childs, P.; Bracewell, R.H. On the Functions of Products. In DS 68-10: Proceedings of the 18th International Conference on Engineering Design (ICED 11), Impacting Society through Engineering Design, Volume 10: Design Methods and Tools pt. 2, Lyngby/Copenhagen, Denmark, 15–19 August 2011; Design Society: Glasgow, UK; pp. 443–455.
- Eng, N.; Aurisicchio, M.; Bracewell, R.; Armstrong, G. Mapping for Design Decision Support in Industry. In Proceedings of the ASME 2012 International Design Engineering Technical Conferences and Computers and Information in Engineering Conference, Chicago, IL, USA, 12–15 August 2012; ASME: New York, NY, USA, 2012; pp. 579–590. [Google Scholar]
- Lee, S.-H.; Jiang, P.; Childs, P.R.; Gilroy, K. Functional Analysis Diagrams with the representation of movement transitions. In Proceedings of the ASME 2013 International Mechanical Engineering Congress and Exposition, San Diego, CA, USA, 15–21 November 2013; ASME: New York, NY, USA, 2013. [Google Scholar]
- Atherton, M.; Jiang, P.; Harrison, D.; Malizia, A. Design for invention: Annotation of functional geometry interaction for representing novel working principles. Res. Eng. Des. 2018, 29, 245–262. [Google Scholar] [CrossRef] [PubMed]
- Lesaffre, E. Superiority, equivalence, and non-inferiority trials. Bull. NYU Hosp. Jt. Dis. 2008, 66, 150–154. [Google Scholar]
- Slavin, R.; Smith, D. The relationship between sample sizes and effect sizes in systematic reviews in education. Educ. Eval. Policy Anal. 2009, 31, 500–506. [Google Scholar] [CrossRef]
- Whitehead, A.L.; Julious, S.A.; Cooper, C.L.; Campbell, M.J. Estimating the sample size for a pilot randomised trial to minimise the overall trial sample size for the external pilot and main trial for a continuous outcome variable. Stat. Methods Med. Res. 2016, 25, 1057–1073. [Google Scholar] [CrossRef] [PubMed]
- Dimitriou, P.; Javaid, R. A review of ammonia as a compression ignition engine fuel. Int. J. Hydrogen Energy 2020, 45, 7098–7118. [Google Scholar] [CrossRef]
- Dimitriou, P.; Tsujimura, T. A review of hydrogen as a compression ignition engine fuel. Int. J. Hydrogen Energy 2017, 42, 24470–24486. [Google Scholar] [CrossRef]
- Dimitriou, P.; Kumar, M.; Tsujimura, T.; Suzuki, Y. Combustion and emission characteristics of a hydrogen-diesel dual-fuel engine. Int. J. Hydrogen Energy 2018, 43, 13605–13617. [Google Scholar] [CrossRef]
- Kim, S.; Park, I.; Yoon, B. SAO2Vec: Development of an algorithm for embedding the subject–action–object (SAO) structure using Doc2Vec. PLoS ONE 2020, 15, e0227930. [Google Scholar] [CrossRef] [PubMed]
- Clay, B.; Root, E. Is This a Trick Question? A Short Guide to Writing Effective Test Questions; Kansas Curriculum Center: Lawrence, KS, USA, 2001. [Google Scholar]
- Tracy, S.J. Qualitative quality: Eight “big-tent” criteria for excellent qualitative research. Qual. Inq. 2010, 16, 837–851. [Google Scholar] [CrossRef]
- Lincoln, Y.S.; Guba, E.G. But is it rigorous? Trustworthiness and authenticity in naturalistic evaluation. New Dir. Program Eval. 1986, 1986, 73–84. [Google Scholar] [CrossRef]
- Mays, N.; Pope, C. Assessing quality in qualitative research. BMJ 2000, 320, 50–52. [Google Scholar] [CrossRef] [PubMed]
- Dodge, Y. The Concise Encyclopedia of Statistics; Springer: Berlin/Heidelberg, Germany, 2008. [Google Scholar]
- Lakens, D. Calculating and reporting effect sizes to facilitate cumulative science: A practical primer for t-tests and ANOVAs. Front. Psychol. 2013, 4, 863. [Google Scholar] [CrossRef]
- Sawilowsky, S.S. New effect size rules of thumb. J. Mod. Appl. Stat. Methods 2009, 8, 26. [Google Scholar] [CrossRef]
- Mayer, R.E. Can advance organizers influence meaningful learning? Rev. Educ. Res. 1979, 49, 371–383. [Google Scholar] [CrossRef]
- Lambiotte, J.G.; Dansereau, D.F. Effects of knowledge maps and prior knowledge on recall of science lecture content. J. Exp. Educ. 1992, 60, 189–201. [Google Scholar] [CrossRef]
- Kolb, D.A. Experiential Learning: Experience as the Source of Learning and Development; Prentice Hall: Englewood Cliffs, NJ, USA, 1984. [Google Scholar]
- Aurisicchio, M.; Bracewell, R.; Hooey, B.L. Rationale mapping and functional modelling enhanced root cause analysis. Saf. Sci. 2016, 85, 241–257. [Google Scholar] [CrossRef]
Figure 2.
A basic functional block diagram (FBD) of a system with three consecutive functions and a feedback loop function. Reproduced from Cole [24].
Figure 2.
A basic functional block diagram (FBD) of a system with three consecutive functions and a feedback loop function. Reproduced from Cole [24].

Figure 4.
Group allocation chart.

Figure 5.
Covered material on internal combustion engine and the environment presented to Group A.

Figure 6.
Covered material on internal combustion engine and the environment presented to Group B using the FAD method.
Figure 6.
Covered material on internal combustion engine and the environment presented to Group B using the FAD method.

Figure 7.
Compression ignition engine—Control of NOx emissions slide presented to Group A.

Figure 8.
Compression ignition engine—Control of NOx emissions slide presented to Group B using the FAD method.
Figure 8.
Compression ignition engine—Control of NOx emissions slide presented to Group B using the FAD method.

Figure 9.
Theoretical distribution fitness comparison.

Figure 10.
Test results chart. The bar chart indicates that group B performed better on all questions of the second part of the test (Q6–Q15), except Q7.
Figure 10.
Test results chart. The bar chart indicates that group B performed better on all questions of the second part of the test (Q6–Q15), except Q7.

Figure 11.
Correlation matrix heatmap, all participants. Top-Right: Group A, Bottom Left: Group B.

Figure 12.
Scatterplot showing the correlation of performance on Score 2 (Correct answers out of 10) against performance in English (Grade out of 10) for both groups.
Figure 12.
Scatterplot showing the correlation of performance on Score 2 (Correct answers out of 10) against performance in English (Grade out of 10) for both groups.

Figure 13.
Scatterplot showing the correlation of performance on Score 2 (Correct answers out of 10) against performance in science (score, percentage) for both groups.
Figure 13.
Scatterplot showing the correlation of performance on Score 2 (Correct answers out of 10) against performance in science (score, percentage) for both groups.


Table 1.
Test results and group performance comparison table.
| Overall Score | Score 1 | Score 2 | |
|---|---|---|---|
| Total Average (%) | 54.53 | 78.46 | 42.56 |
| Group A average (%) | 52.33 | 79.00 | 39.00 |
| Group B average (%) | 56.84 | 77.89 | 46.32 |
| Performance difference of Group B against Group A (%) | 8.62 | −1.40 | 18.76 |
Disclaimer/Publisher’s Note: The statements, opinions and data contained in all publications are solely those of the individual author(s) and contributor(s) and not of MDPI and/or the editor(s). MDPI and/or the editor(s) disclaim responsibility for any injury to people or property resulting from any ideas, methods, instructions or products referred to in the content. |
© 2023 by the authors. Licensee MDPI, Basel, Switzerland. This article is an open access article distributed under the terms and conditions of the Creative Commons Attribution (CC BY) license (https://creativecommons.org/licenses/by/4.0/).
Share and Cite
MDPI and ACS Style
Michalakoudis, I.; Dimitriou, P.; Koutlidis, A.; Childs, P. Functional Analysis Diagrams in Science and Technology Education. Educ. Sci. 2023, 13, 289. https://doi.org/10.3390/educsci13030289
AMA Style
Michalakoudis I, Dimitriou P, Koutlidis A, Childs P. Functional Analysis Diagrams in Science and Technology Education. Education Sciences. 2023; 13(3):289. https://doi.org/10.3390/educsci13030289
Chicago/Turabian StyleMichalakoudis, Ioannis, Pavlos Dimitriou, Apollon Koutlidis, and Peter Childs. 2023. "Functional Analysis Diagrams in Science and Technology Education" Education Sciences 13, no. 3: 289. https://doi.org/10.3390/educsci13030289
Note that from the first issue of 2016, this journal uses article numbers instead of page numbers. See further details here.