Article

Identification of Mycoparasitism-Related Genes against the Phytopathogen Botrytis cinerea via Transcriptome Analysis of Trichoderma harzianum T4

State Key Laboratory of Bioreactor Engineering, East China University of Science and Technology, Shanghai 200237, China
*
Author to whom correspondence should be addressed.
J. Fungi 2023, 9(3), 324; https://doi.org/10.3390/jof9030324
Submission received: 30 January 2023 / Revised: 15 February 2023 / Accepted: 28 February 2023 / Published: 6 March 2023

Abstract

:
Trichoderma harzianum is a well-known biological control agent (BCA) that is effective against a variety of plant pathogens. In previous studies, we found that T. harzianum T4 could effectively control the gray mold in tomatoes caused by Botrytis cinerea. However, the research on its biocontrol mechanism is not comprehensive, particularly regarding the mechanism of mycoparasitism. In this study, in order to further investigate the mycoparasitism mechanism of T. harzianum T4, transcriptomic sequencing and real-time fluorescence quantitative PCR (RT-qPCR) were used to identify the differentially expressed genes (DEGs) of T. harzianum T4 at 12, 24, 48 and 72 h of growth in the cell wall of B. cinerea (BCCW) or a sucrose medium. A total of 2871 DEGs and 2148 novel genes were detected using transcriptome sequencing. Through GO and KEGG enrichment analysis, we identified genes associated with mycoparasitism at specific time periods, such as encoding kinases, signal transduction proteins, carbohydrate active enzymes, hydrolytic enzymes, transporters, antioxidant enzymes, secondary metabolite synthesis, resistance proteins, detoxification genes and genes associated with extended hyphal longevity. To validate the transcriptome data, RT-qCPR was performed on the transcriptome samples. The RT-qPCR results show that the expression trend of the genes was consistent with the RNA-Seq data. In order to validate the screened genes associated with mycoparasitism, we performed a dual-culture antagonism test on T. harzianum and B. cinerea. The results of the dual-culture RT-qPCR showed that 15 of the 24 genes were upregulated during and after contact between T. harzianum T4 and B. cinerea (the same as BCCW), which further confirmed that these genes were involved in the mycoparasitism of T. harzianum T4. In conclusion, the transcriptome data provided in this study will not only improve the annotation information of gene models in T. harzianum T4 genome, but also provide important transcriptome information regarding the process of mycoparasitism at specific time periods, which can help us to further understand the mechanism of mycoparasitism, thus providing a potential molecular target for T. harzianum T4 as a biological control agent.

1. Introduction

Botrytis cinerea (Ascomycota) is a necrotrophic plant pathogen with a wide range of hosts (>200 species) [1]. Botrytis cinerea can cause serious loss of crops during production and post-harvesting, the value of which can reach up to USD 1 billion per year [2,3], and for this reason, it is listed as the second most destructive pathogenic fungus in the world [4]. Today, chemical prevention is the main strategy used worldwide to control fungal diseases [5]. However, long-term use of chemical pesticides has led to human and animal health hazards, severe pesticide residues, environmental pollution and microbial resistance [6,7]. Therefore, it is essential to develop novel control methods that are environmentally friendly.
Biocontrol agents are an environmentally friendly alternative to chemical pesticides and have numerous advantages over the use of fungicides, such as cost-effectiveness, safety and environmental protection [8,9]. Strains of Trichoderma are excellent biological control agents and represent some of the most widely used fungi, playing a vital role in agriculture [10,11].
In a previous study, our research team isolated and purified from soil a biocontrol strain of T. harzianum T4 with a high application potential. This strain can effectively control the plant disease caused by B. cinerea [12], promote plant growth and increase crop yield [13,14]. In our previous study, we optimized the culture conditions for T. harzianum T4 and improved the yield of the T. harzianum biocontrol agent [15]. However, the research on its biocontrol mechanism is not comprehensive, particularly the mechanism of mycoparasitism. It has been shown that the mycoparasitism process mainly includes decomposition of the host cell wall by the secretion of hydrolytic enzymes; these processes are regulated by signal transduction proteins (heterotrimeric G protein and mitogen-activated protein kinase, MAPK) [16,17,18]. However, the mechanism of mycoparasitism is affected by the types of pathogen and Trichoderma isolates [19,20]. Therefore, it is necessary to study different strains to increase our understanding of the mycoparasitism of T. harzianum.
In previous studies, high-pressure induction of inactivated hyphae was used to simulate the presence of a fungal host in order to study the genes associated with fungal mycoparasitism [19,21,22,23]. In this study, using RNA-Seq, we identified the DEGs in the T. harzianum T4 strain after 12, 24, 48 and 72 h of culturing in a high-pressure-induced liquid medium containing inactivated B. cinerea cell wall (BCCW), and used the Czapek-Dox broth (CDB) medium inoculated only with T. harzianum as a control. This study helps to determine a large number of the DEGs involved in specific stage functions at different time periods and enhances understanding of the mycoparasitism of T. harzianum T4. We identified a large number of genes that are strongly associated with mycoparasitism. These genes are significantly upregulated in a specific time period and have the functions of coding for signal transduction (G protein and MAPK kinase), carbohydrate-active enzymes (especially β-glucosidase), transporters, antioxidant proteins, resistance to stress, detoxification, delaying hyphal senescence and toxic secondary metabolites. Finally, quantitative RT-PCR was used to verify the differential expression of candidate genes for T. harzianum T4 antagonism against B. cinerea via mycoparasitism in both transcriptome and dual culture.

2. Materials and Methods

2.1. Source of Fungal Strains

The wild-type T. harzianum T4 strain was stored in our laboratory (East China University of Science and Technology, Shanghai, China). Botrytis cinerea was obtained from the China General Microbial Species Preservation and Management Center (CGMCC, Beijing, China).

2.2. Culture Conditions

Trichoderma harzianum T4 was inoculated on a potato dextrose agar (PDA) plate and cultured for 3–5 days in a constant-temperature incubator at 28 °C. When the conidia had spread all over the plate, the conidia collected from the culture were washed repeatedly with 5 mL of sterile water and the spore suspension was diluted to 1 × 10⁷ for later use. Next, 1 mL of 1 × 10⁷ T. harzianum T4 conidia suspension was added to a fresh potato dextrose broth (PDB) liquid culture medium and the conidia were germinated in a rotating shaker at 28 °C for 12 h at 180 rpm. The grown mycelium was centrifuged at 4000 rpm for 10 min, collected and washed three times with sterile distilled water for subsequent induction experiments. The grown mycelium was transferred to the Czapek-Dox broth (CDB) induction medium containing 5 g sucrose, 3 g NaNO3, 1 g K2HPO4, 0.5 g MgSO4, 0.5 g KCl, 10 mg FeSO4 and supplemented with 1% inactivated cell wall of B. cinerea (previously autoclaved at 120 °C for 20 min) (BCCW). The CDB induction medium inoculated only with T. harzianum-grown mycelium without BCCW was used as the control. All cultures were incubated at 180 rpm at 28 °C for 12, 24, 48 and 72 h and the mycelium was collected. Samples for each incubation period were collected three times, including all treatments. The mycelium was immediately frozen using liquid nitrogen for 20–30 min and stored at −80 °C until the RNA was extracted. All collected RNA samples were used for the following transcriptome sequencing and real-time fluorescence quantitative PCR experiments (RT-qPCR).

2.3. Total RNA Extraction, cDNA Synthesis and Sequencing

Total RNA was extracted from 24 samples using the TransZol up Plus RNA kit (TransGen Biotech, Beijing, China) according to the manufacturer’s instructions. RNA was quantified and verified for integrity using the Nano assay in an Agilent BioAnalyzer 2100 (Agilent Technologies, Santa Clara, CA, USA). A total of 1 µg RNA per sample was used as input material for RNA sample preparation. Sequencing libraries were generated using the NEBNext UltraTM RNA Library Prep Kit for Illumina (NEB, Ipswich, MA, USA). Briefly, mRNA was purified from total RNA using poly-T oligo-attached magnetic beads. Fragmentation was carried out using divalent cations under elevated temperature in NEB Next First Strand Synthesis Reaction Buffer (5X). First-strand cDNA was synthesized using random hexamer primer and M-MuLV reverse transcriptase. Second-strand cDNA synthesis was subsequently performed using DNA polymerase I and RNase H. Remaining overhangs were converted into blunt ends via exonuclease/polymerase activities. The AMPure XP system (Beckman Coulter, Beverly, CA, USA) was used to purify fragments and amplify them by PCR to prepare cDNA libraries. All cDNA libraries were sequenced on the Illumina platform (Illumina, San Diego, CA, USA) to generate paired-end reads. SOAPnuke v2.1.0 software (BGI, Shenzhen, China) [24] was used to filter and splice the original readings to remove low-quality and unmeasurable bases (denoted by N), so as to obtain clean readings. The genome of T. harzianum T4 (separately cultured without B. cinerea cell wall) was annotated (NCBI: PRJNA715015) and used as a reference genome in this study.

2.4. Analysis of DEGs

DESeq2 [25] was used to analyze the significance of differential gene expression in T. harzianum T4 between the treated group and the control group at different growth stages (12, 24, 48 and 72 h). The threshold condition for DEGs was set as p-adjust (q-value) ≤ 0.05 and |Log2FC| ≥ 1. GO and KEGG databases were used for the enrichment and annotation analyses of the DEGs. The enrichment analysis method was hypergeometric distribution, with a q-value ≤ 0.05 taken as the threshold screening condition for significant enrichment of the GO term and KEGG pathway.

2.5. RT-qPCR

Twelve DEGs were randomly selected for RT-qPCR validation using the Bio-Rad CFX 96 quantitative fluorescence PCR instrument (Bio-Rad, Hercules, CA, USA). Primer5 v5.00 software (Premier Biosoft International) was used to design the verification primers (Table 1). RNA was reverse transcribed into cDNA using a TUREscript 1st Stand cDNA SYNTHESIS Kit. Each 20 µL PCR reaction consisted of 10 µL of 2 × SuperNovaPCRMix (Dye), 0.5 µL of forward primer, 0.5 µL of reverse primer, 1 µL of cDNA template and 8 µL of nuclease-free water. The operating cycle conditions were 95 °C for 4 min (1 cycle), 95 °C for 15 s, then 60 °C for 30 s (39 cycles), and for the melt curve analysis the temperature was increased from 65 °C to 95 °C in increments of 0.5 °C for 5 s (1 cycle). The gene expression level was calculated according to the threshold period (CT) 2−ΔΔCT method and the 18s rRNA and α-tubulin were used as internal references to normalize the amount of total RNA present in each reaction.

2.6. Analysis of the Expression of Genes Related to Mycoparasitism in the Dual Culture

Dual culture is the most effective way to verify the expression of genes associated with mycoparasitism in a specific culture time period. RT-qPCR was used to analyze the expression of 24 genes possibly related to mycoparasitism of T. harzianum T4 (Table 1). Using a hole punch, a disc with a diameter of 5 mm was cut from the T. harzianum T4 and B. cinerea plates as a dual-culture inoculum. Trichoderma harzianum T4 and B. cinerea were inoculated 8 cm apart on opposite sides of PDA plate medium covered with cellophane. As a control, dual-culture confrontation assays were conducted following the same procedure described above, except that T. harzianum was challenged with itself. The antagonistic plate was cultured in a constant-temperature incubator at 28 °C for 5 days and T. harzianum T4 mycelium samples (3 replicates of each sample) were harvested at 3 growth stages (before contact (BC), during contact (C) and after contact (AC)) of the dual culture and these were then used for RT-qPCR. The experiment was conducted with three repetitions for each sample and results were statistical analyzed by one-way analysis of variance (ANOVA) with Duncan tests conducted by SPSS statistics software (V. 21.0, SPSS Inc., Chicago, IL, USA). All results at p < 0.05 were considered statistically significant.

3. Results

3.1. Data Analysis of the Transcriptome

In this experiment, we used RNA-Seq to screen the differentially expressed genes of T. harzianum T4 at different growth stages (12, 24, 48 and 72 h) in the presence of BCCW. As shown by the Venn diagram in Figure 1A, a total of 2871 differentially expressed genes were detected using transcriptome sequencing. Of these, 26 DEGs were differentially expressed at 4 growth stages and 2262 DEGs were differentially expressed in only 1 specific stage. Of all the DEGs, the maximum number of DEGs was 1412 (843 upregulated, 569 downregulated) at 12 h. At 24 h and 48 h there were 273 (164 upregulated, 109 downregulated) and 269 (124 upregulated, 145 downregulated), respectively. The number of DEGs at 72 h was 794 (293 upregulated, 501 downregulated) (Figure 1B). Based on the reference genome of T. harzianum T4, 2148 novel genes were identified, which significantly enriched the available genomic annotation information for the T4 strain.

3.2. GO Enrichment Analysis of DEGs

GO enrichment analysis of DEGs showed that at the different growth stages (12, 24, 48 and 72 h) of T. harzianum in the presence of BCCW, GO terms mainly focused on biological processes (metabolism and single-organ processes); cell components (cell membrane, cell membrane components, cells and cell components); and molecular functions (catalytic activity, molecular binding and transporter activity) (Figure 2). In order to further analyze the genes related to mycoparasitism, GO enrichment analysis was performed on the upregulated DEGs (Figure 3). The results showed that in the biological process, carbohydrate metabolism was significantly enriched at 12, 24 and 48 h. The oxidation-reduction process and single organism metabolic process were significantly enriched at 72 h. In addition, kinase activity, phosphorylation, catalytic activity, hydrolase activity, transporter activity, cofactor binding, transmembrane transport activity, metal ion binding and oxidoreductase activity involved in the molecular process were all significantly enriched in different culture time periods of T. harzianum grown in the presence of BCCW.

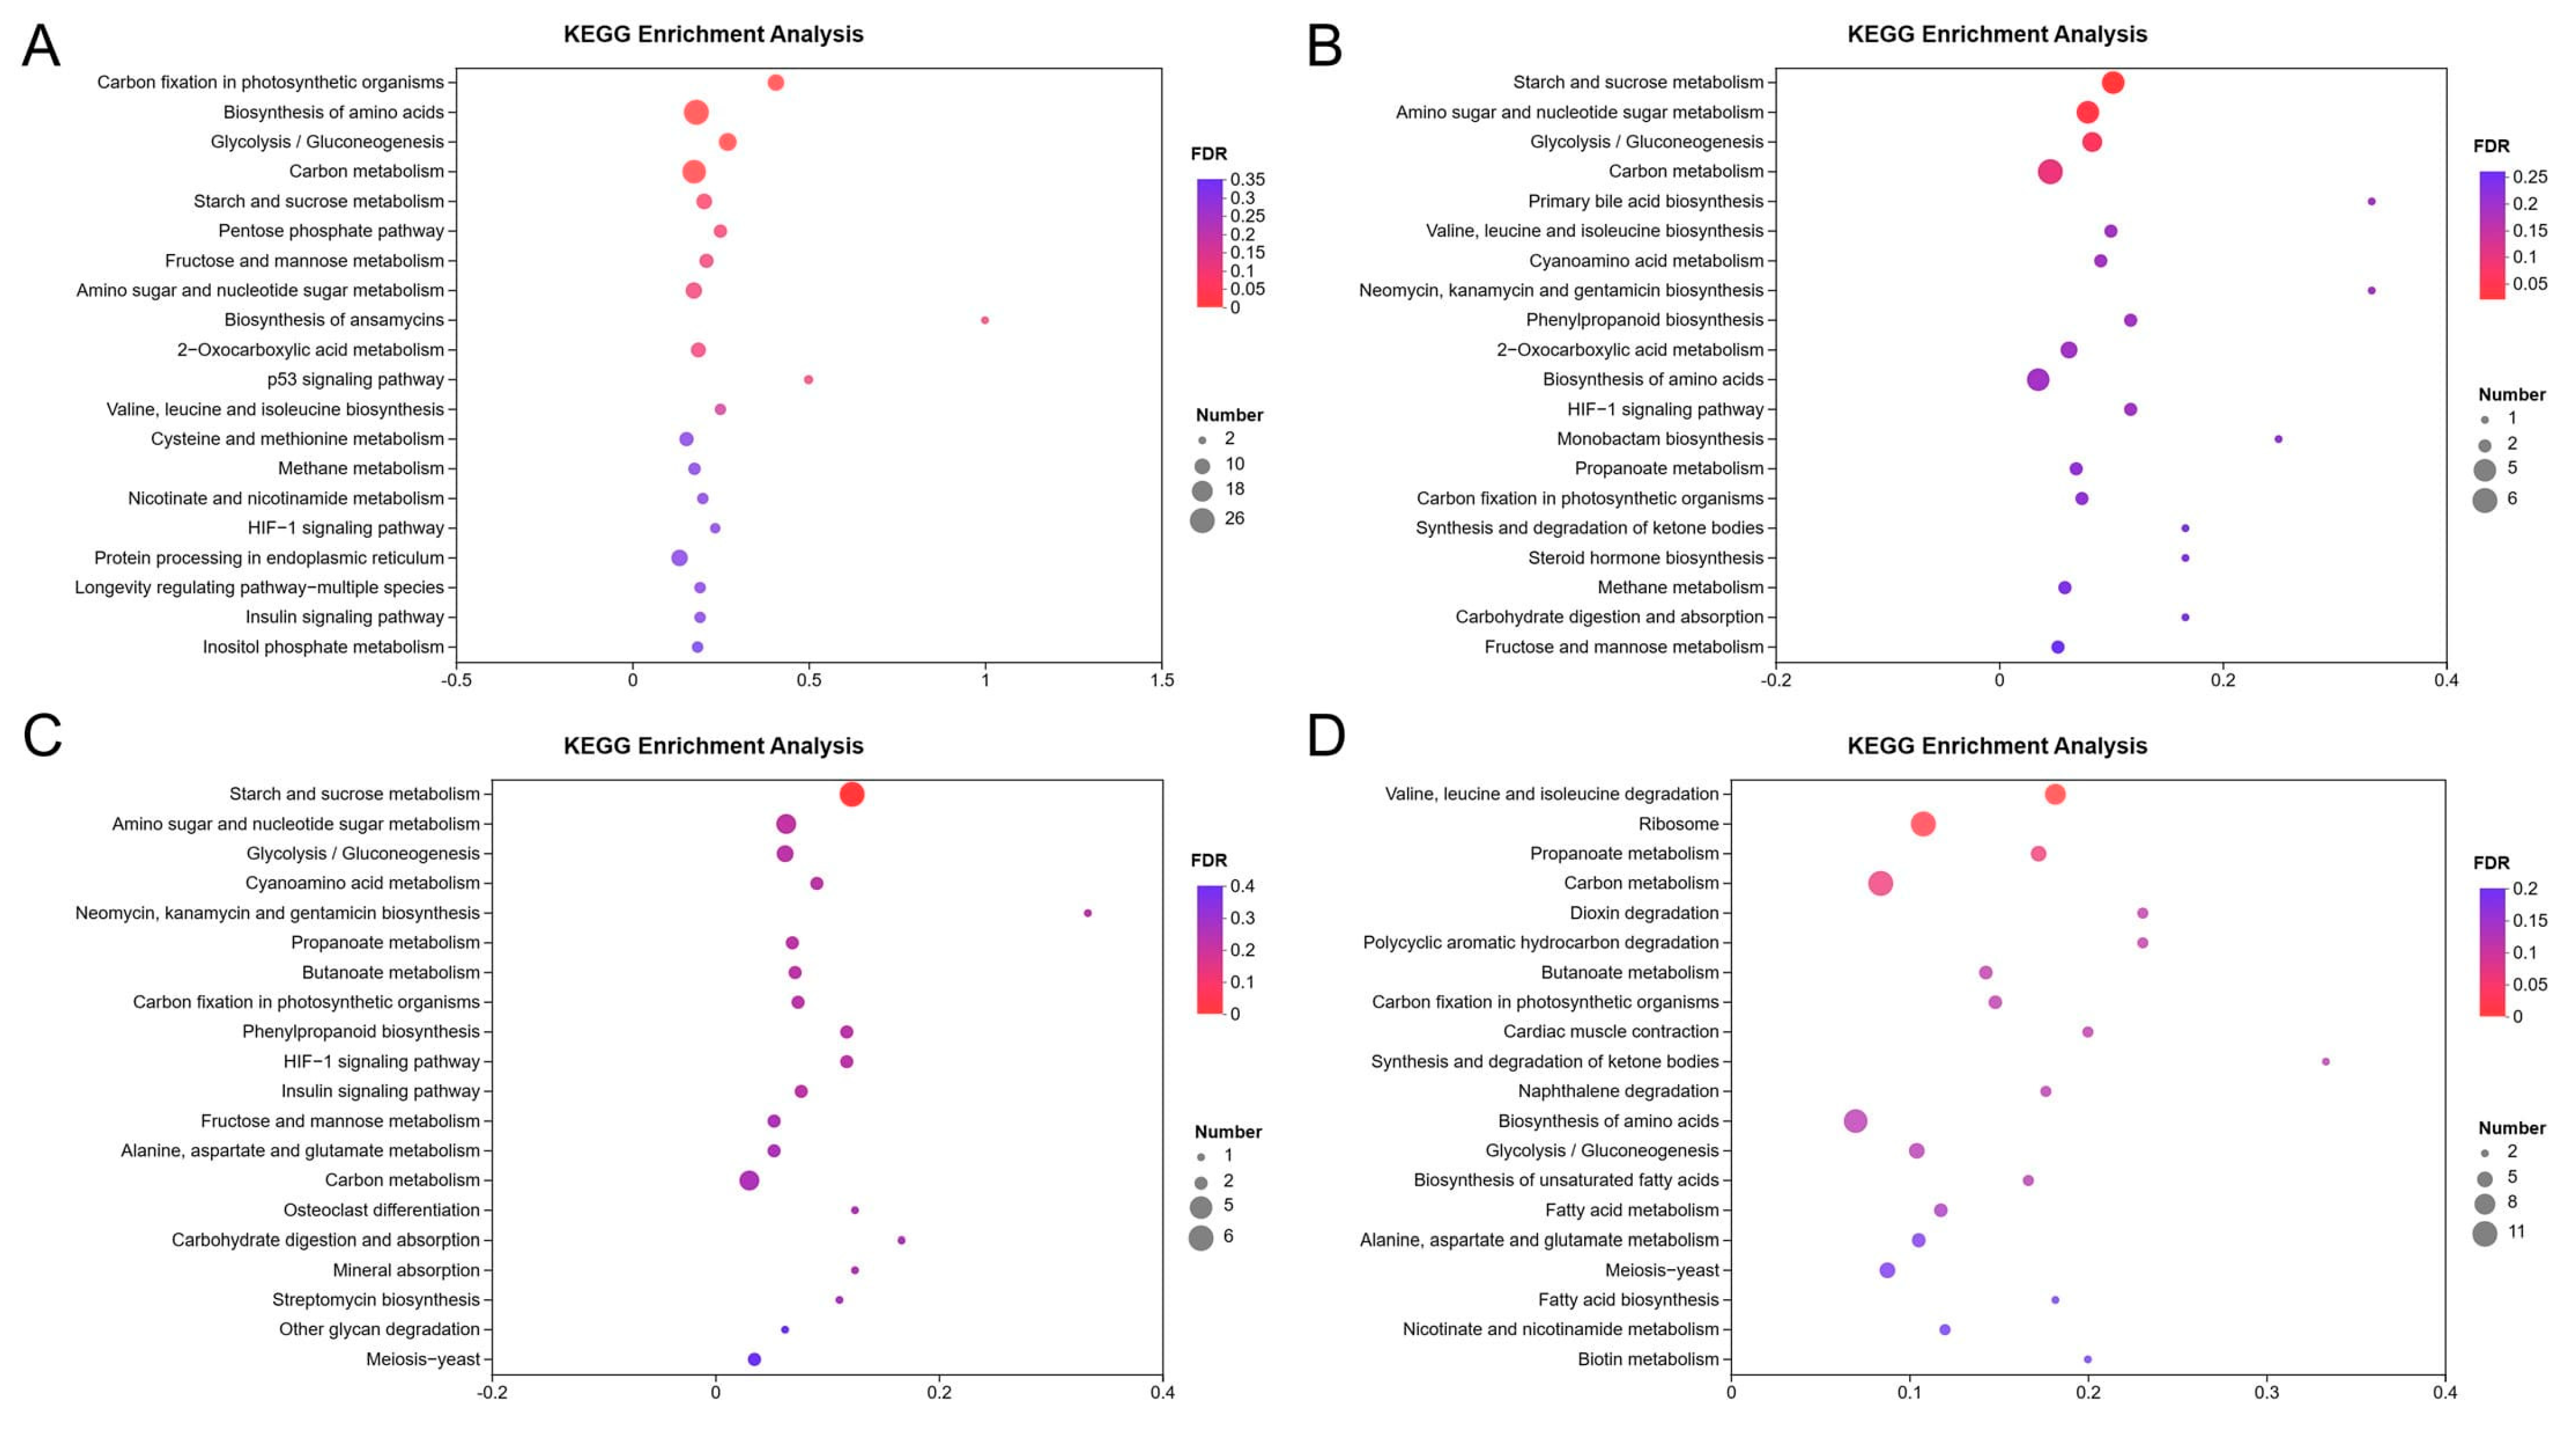
3.3. KEGG Enrichment Analysis of DEGs

The KEGG enrichment analysis of the DEGs in T. harzianum grown for 12, 24, 48 and 72 h in the presence of BCCW showed that 25 KEGG pathways (q ≤ 0.05) were significantly enriched (Table 2). These pathways are mainly involved the metabolism of carbohydrates, lipids and amino acids, as well as the biodegradation and metabolism of exogenous substances and the metabolism of terpenoids and polyketides. To further analyze the genes associated with mycoparasitism, a KEGG enrichment analysis was performed on the upregulated DEGs. It showed the top 20 enrichment pathways of T. harzianum when grown for 12, 24, 48 and 72 h; of these pathways, 8 KEGG pathways were significantly enriched (q ≤ 0.05), involving carbohydrate metabolism and amino acid biosynthesis and degradation (Figure 4). Of these, starch and sucrose metabolism (ko00500) and amino sugar and nucleotide sugar metabolism (ko00520) were enriched at 12 h, 24 h and 48 h.

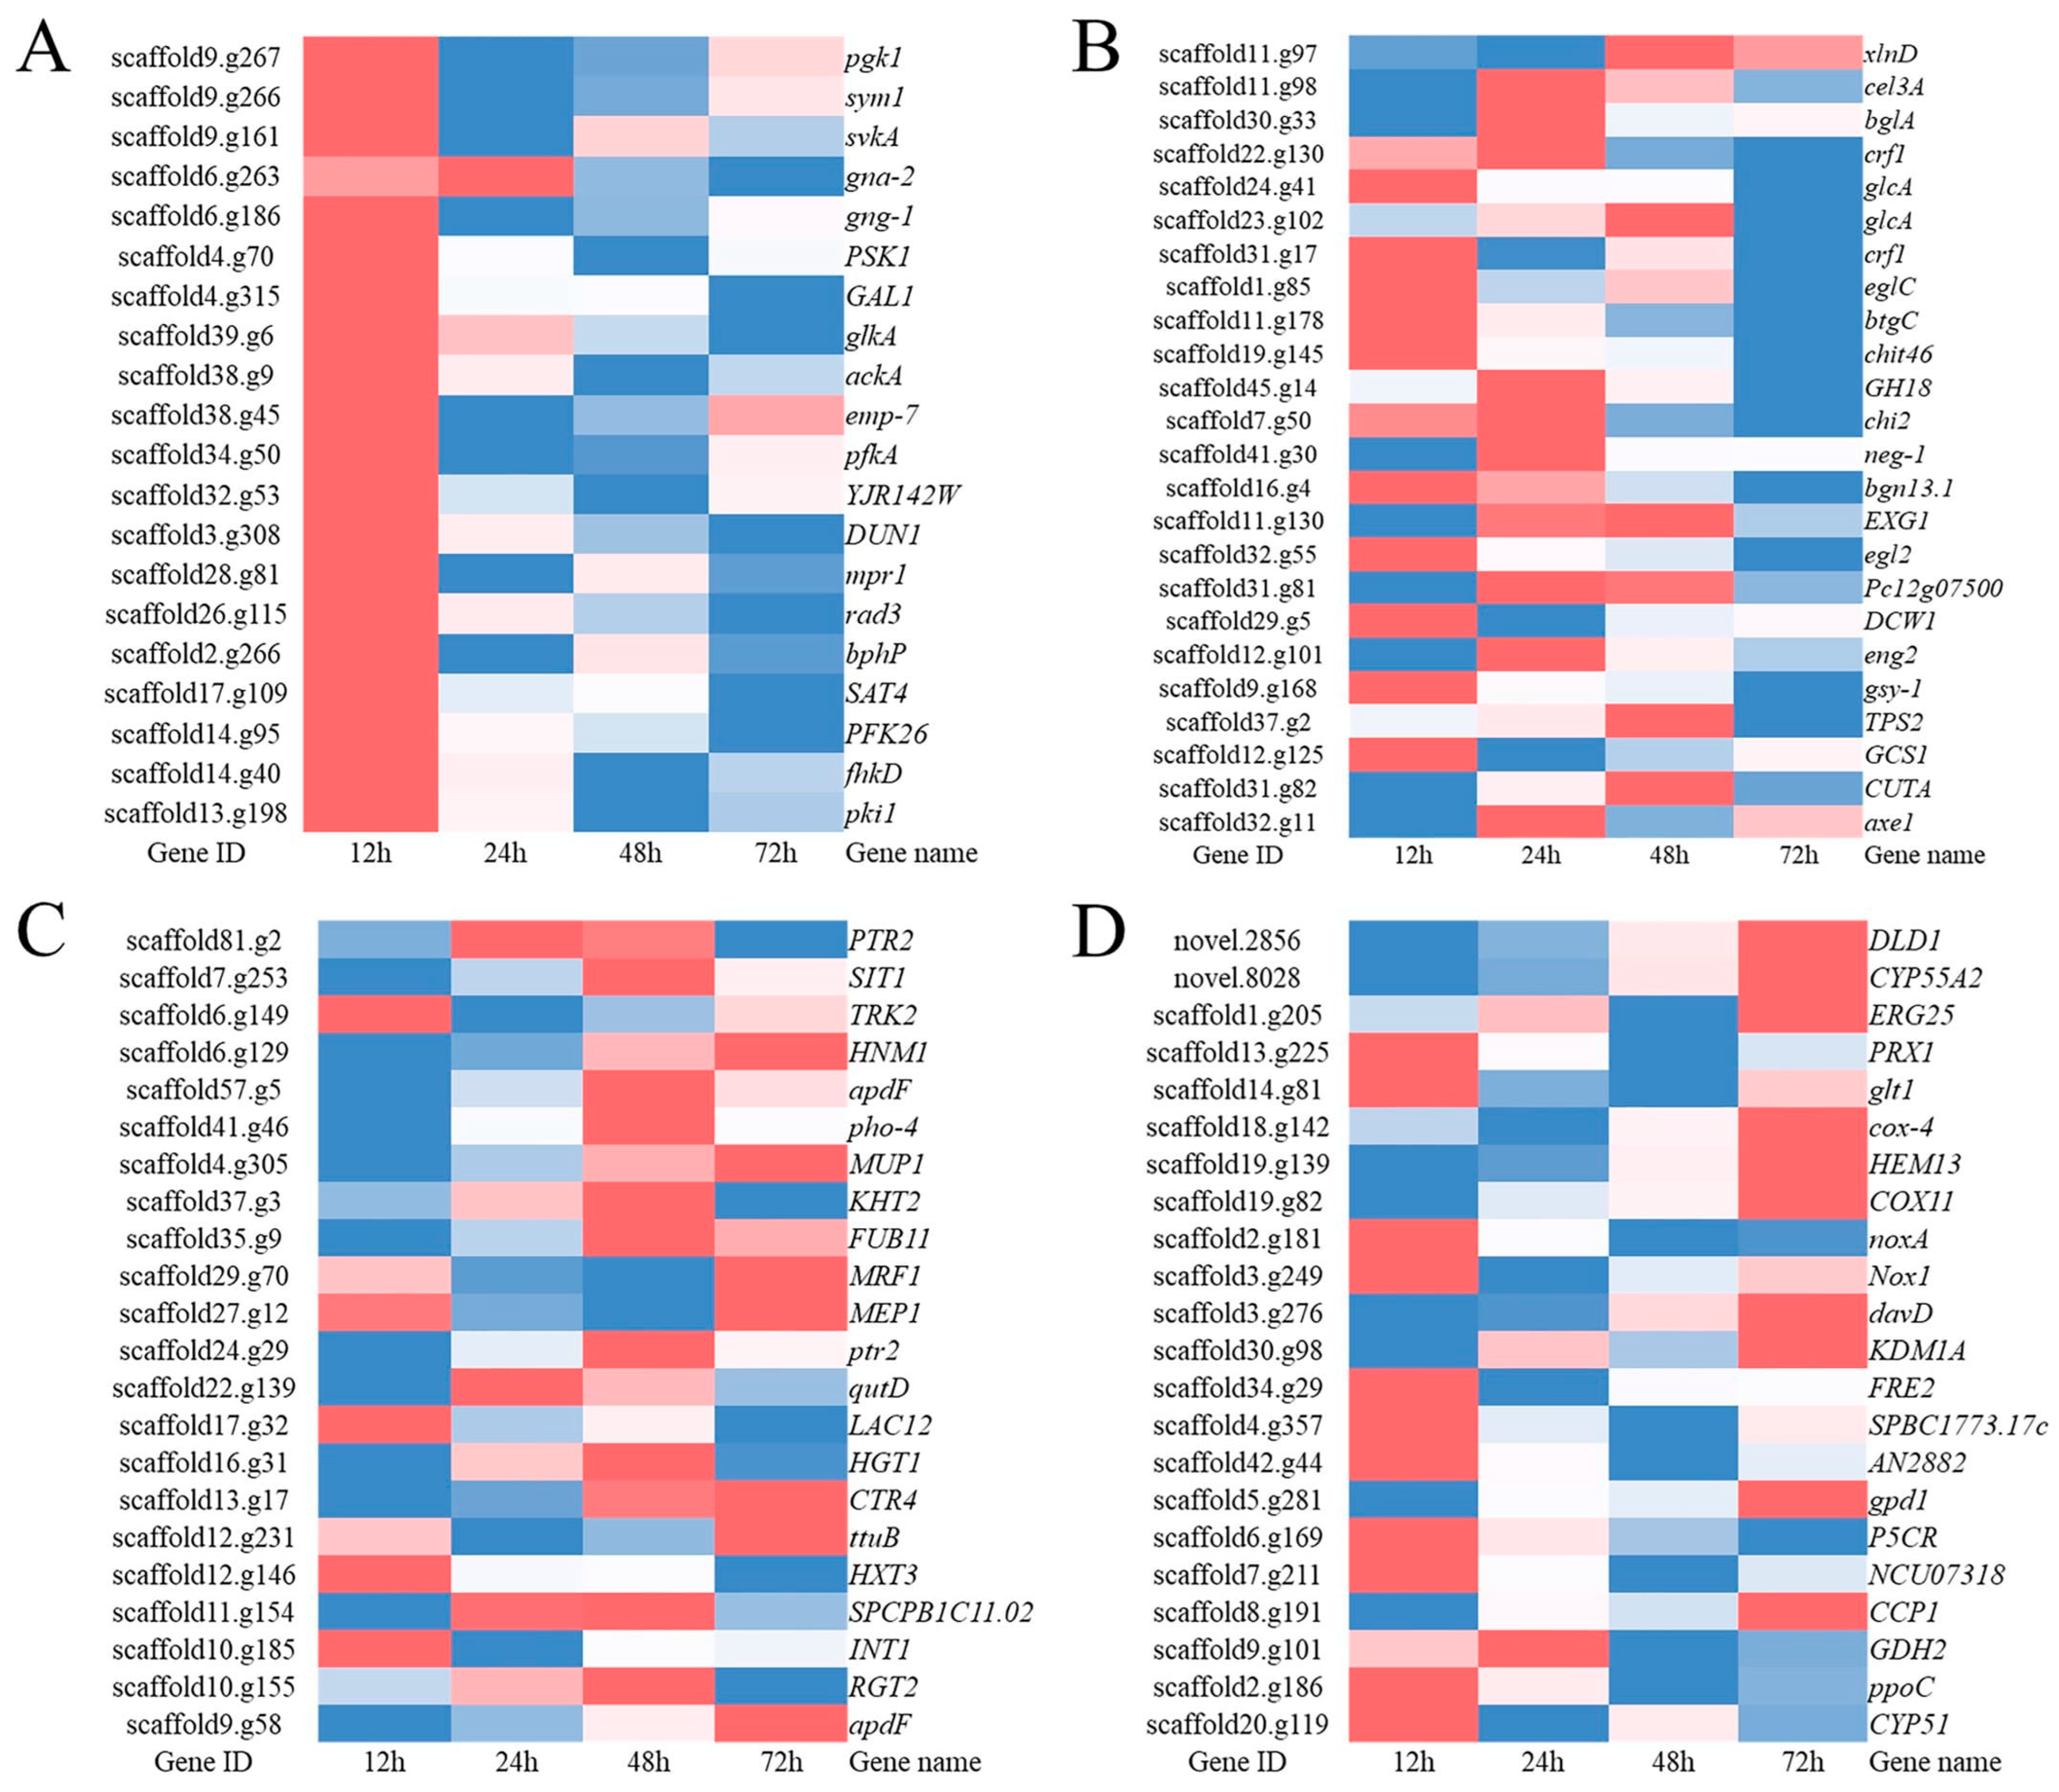
3.4. Analysis of Genes Related to T. harzianum Mycoparasitism Based on GO and KEGG Enrichment

3.4.1. Kinase Activity and Signal Transducer Activity

In this experiment, we found that kinase activity-related and signal transducer activity-related genes were significantly upregulated at 12 h (Figure 5A). This mainly involves genes related to serine/threonine kinase, G protein signaling and MAPK kinase activity. We focused on 10 genes, including 7 kinase activity genes (log2FC > 2), of which 4 were kinase activity genes involved in glycolysis (scaffold 14.g95, scaffold 39.g6, scaffold 13.g198, scaffold 9.g267), and 3 were involved in protein serine/threonine kinase activities (scaffold 17. g109, scaffold 4.g70, novel.6707). The other three genes were related to the signal transduction activity: the guanine nucleotide-binding protein gamma subunit 1 gng-1 (scaffold 6.g186) and the guanine nucleus-binding protein alpha-2 subunit gna-2 (scaffold 6.g263) positively regulated the G protein, and the phosphate intermediate protein in YPD1 (scaffold 28.g81) regulated the MAPK signaling pathway.

3.4.2. Carbohydrate Active Enzymes (CAZymes)

Based on KEGG and GO enrichment analysis, carbohydrate metabolism was significantly enriched at 12, 24 and 48 h. A large number of carbohydrate active enzymes, in particular, GO trem associated with hydrolase, were significantly enriched at 24 h and 48 h in response to the presence of BCCM. We statistically analyzed the DEGs of carbohydrate active enzymes (CAZymes) in T. harzianum T4 at 12, 24, 48 and 72 h (Figure 6A). There were 140 CAZyme genes with significant differential expression (Figure 6A). Large numbers of CAZyme-related genes were significantly upregulated at 12, 24 and 48 h, but not at 72 h. At 12 h, there were 62 differentially expressed genes, 42 of which were significantly upregulated. At 24 and 48 h, 24 and 26 CAZyme genes were upregulated, respectively. In this experiment, a total of 82 GH glycoside hydrolase differential genes, 23 coenzyme activity genes, 17 glycosyltransferase and carbohydrate esterase genes and 1 carbohydrate-binding module gene were significantly differentially expressed (Figure 6B).
Although the upregulated DEGs were significantly enriched in hydrolase-related genes at 24 and 48 h, the gene expression heat maps show that some hydrolase genes had an upregulated trend at 12 h. At 72 h, a large number of hydrolase-related genes were no longer upregulated or even significantly downregulated. This result suggests that hydrolase-related genes are unnecessary in the late growth phase of T. harzianum in the presence of BCCW. A large number of cellulase-related genes, such as beta glucosidase (scaffold 30.g33), endo-1,3 (4) beta glucosanase (scaffold 23.g102), exo-beta-1,3-glucanase (scaffold 11.g130), cellulase (scaffold 32.g55), and endochitinase 42 (scaffold 19.g145), were significantly upregulated at 12, 24 and 48 h. In addition, trehalose 6-phosphate synthase (scaffold 37.g2) genes were significantly upregulated at 12, 24 and 48 h and acetoxylan esterase (scaffold 32.g11) genes were significantly upregulated at 12 h and 48 h (Figure 5B).

3.4.3. Transmembrane Transport

Transmembrane transport plays an essential role in fungal growth and development, as well as in mycoparasitism, and is responsible for the transport of carbon sources, nitrogen sources, metal ions and toxic substances. GO enrichment analysis showed that in T. harzianum in the presence of BCCW, the upregulated gene was significantly enriched in the GO term of the transmembrane transport activity at 48 h. Of the 22 significantly upregulated transporters (Figure 5C), 14 belonged to the major facilitator superfamily (MFS) of transporters, including 7 sugar transporter family genes (scaffold 37.g3, scaffold 22.g139, scaffold 17.g32, scaffold 16.g31, scaffold 12.g146, scaffold 10.g185 and scaffold 10. g155), 2 proton-dependent oligopeptide transporter (POT/PTR) genes (scaffold 81.g2 and scaffold 24.g29), 2 monocarboxylate transporter family genes (scaffold 9.g58 and scaffold 29.g70), and 1 iron transporter (scaffold 7.g253). In summary, MFS transporters play an influential role in Trichoderma mycoparasitism. Three amino acid polyamine organic (APC) family genes (scaffold 4.g305, scaffold 6.g129 and scaffold 11.g154) are responsible for the transport of amino acids and choline. The ammonium transporter MEP1 (scaffold 27.g12) is closely related to the nitrogen source transport and absorption of Trichoderma in the process of mycoparasitism. In general, transporter-related genes are involved in a series of material transports, such as carbon source, nitrogen source, amino acid, drug efflux protein and metal ion transport, during the growth and development of T. harzianum T4 in the presence of BCCW.

3.4.4. Antioxidant Enzymes

Transcriptome sequencing of the T. harzianum T4 strain grown for 12, 24, 48 and 72 h in the presence of BCCM showed that the genes encoding oxidoreductase activity were significantly enriched in several culture time periods. Based on differential expression multiples, 22 differentially expressed genes that were significantly upregulated were identified (Figure 5D). The differentially expressed genes include genes involved in cellular detoxification, oxidase, peroxidase, osmotic pressure regulation and amino acid biosynthesis and metabolism. Of these, NADPH oxidase Nox (scaffold 2.g181, scaffold 3.g249), which is responsible for ROS production, was significantly upregulated at 12 h. PRX1 (scaffold 13.g225), a bifunctional enzyme that can protect the body from oxidative damage, was significantly upregulated at 12 h. AzaB (scaffold 3. g68), which belongs to the polyketide synthase (PKS) family, was significantly upregulated at 24 h. Glt1 (scaffold14 14.g81), a glutamate synthase precursor-related gene, was significantly upregulated at several culture times, which attracted our attention and is further elaborated on in the discussion below.

3.5. The Top 10 Significantly Upregulated Genes

To further evaluate the expression profiles of differentially expressed genes at different growth stages, the top 10 differentially expressed genes at 12, 24, 48 and 72 h were identified (Table 3). The top 10 significantly upregulated genes at 12 h were 3 antistress and detoxification-related oxidoreductases (noxA, SPAC513.07 and AIFM2), 3 amino acid biosynthesis or metabolism enzymes (pha, 2QPCT and ALDH6A1), 2 glycoside hydrolase genes (bgn13.1 and abf1), and 1 peptidase gene (FUB8). The top 10 significantly upregulated genes at 24 h were 6 glycoside hydrolases (neg-1, bgn13.1, ARB_02077, cel3A, eng2 and chi2), 1 carbohydrate esterase (CUTA), 1 protease (prb1), 1 amino acid biosynthesis enzyme (mfnA), 1 WSC domain-containing protein and 1 uncharacterized protein (YEL023C). The top 10 significantly upregulated genes at 48 h were 3 glycoside hydrolases (bgn13.1, neg-1 and cel3A), 1 carbohydrate esterase (CUTA), 1 protease (prb1), 1 oxidoreductase (arsH), 1 aminotransferase (gatA), 1 transmembrane transport protein (apdF), 1 WSC domain-containing protein and 1 uncharacterized protein (YEL023C). The top 10 significantly upregulated genes at 72 h were 2 hydrolases (bgn13.1, SPAC5H10.01), 2 transmembrane transporters (FRE7, apdF), 1 ribosomal protein (rpl-3), 1 WSC domain-containing protein, 1 aromatic compound metabolism (hpcH), 1 amino transferase (gatA), 1 osmoregulation-related gene (gpd1) and 1 HMG-CoA lyase-family gene (liuE). Under simulated fungal mycoparasitism conditions, antistress- and detoxification-related genes were preferentially expressed at 12 h and a combination of glycoside hydrolases, cutinases and proteases were preferentially expressed at 24 and 48 h, with the highest number of glycoside hydrolases appearing at 24 h (6 out of 10). A new gene encoding endo-1,3 (4) beta glucanase (novel.5121) was significantly upregulated at 12, 24, 48 and 72 h. A gene encoding the WSC domain-containing protein (scaffold 23.g56) was significantly upregulated at 24, 48 and 72 h, and its main functions require further research and exploration.

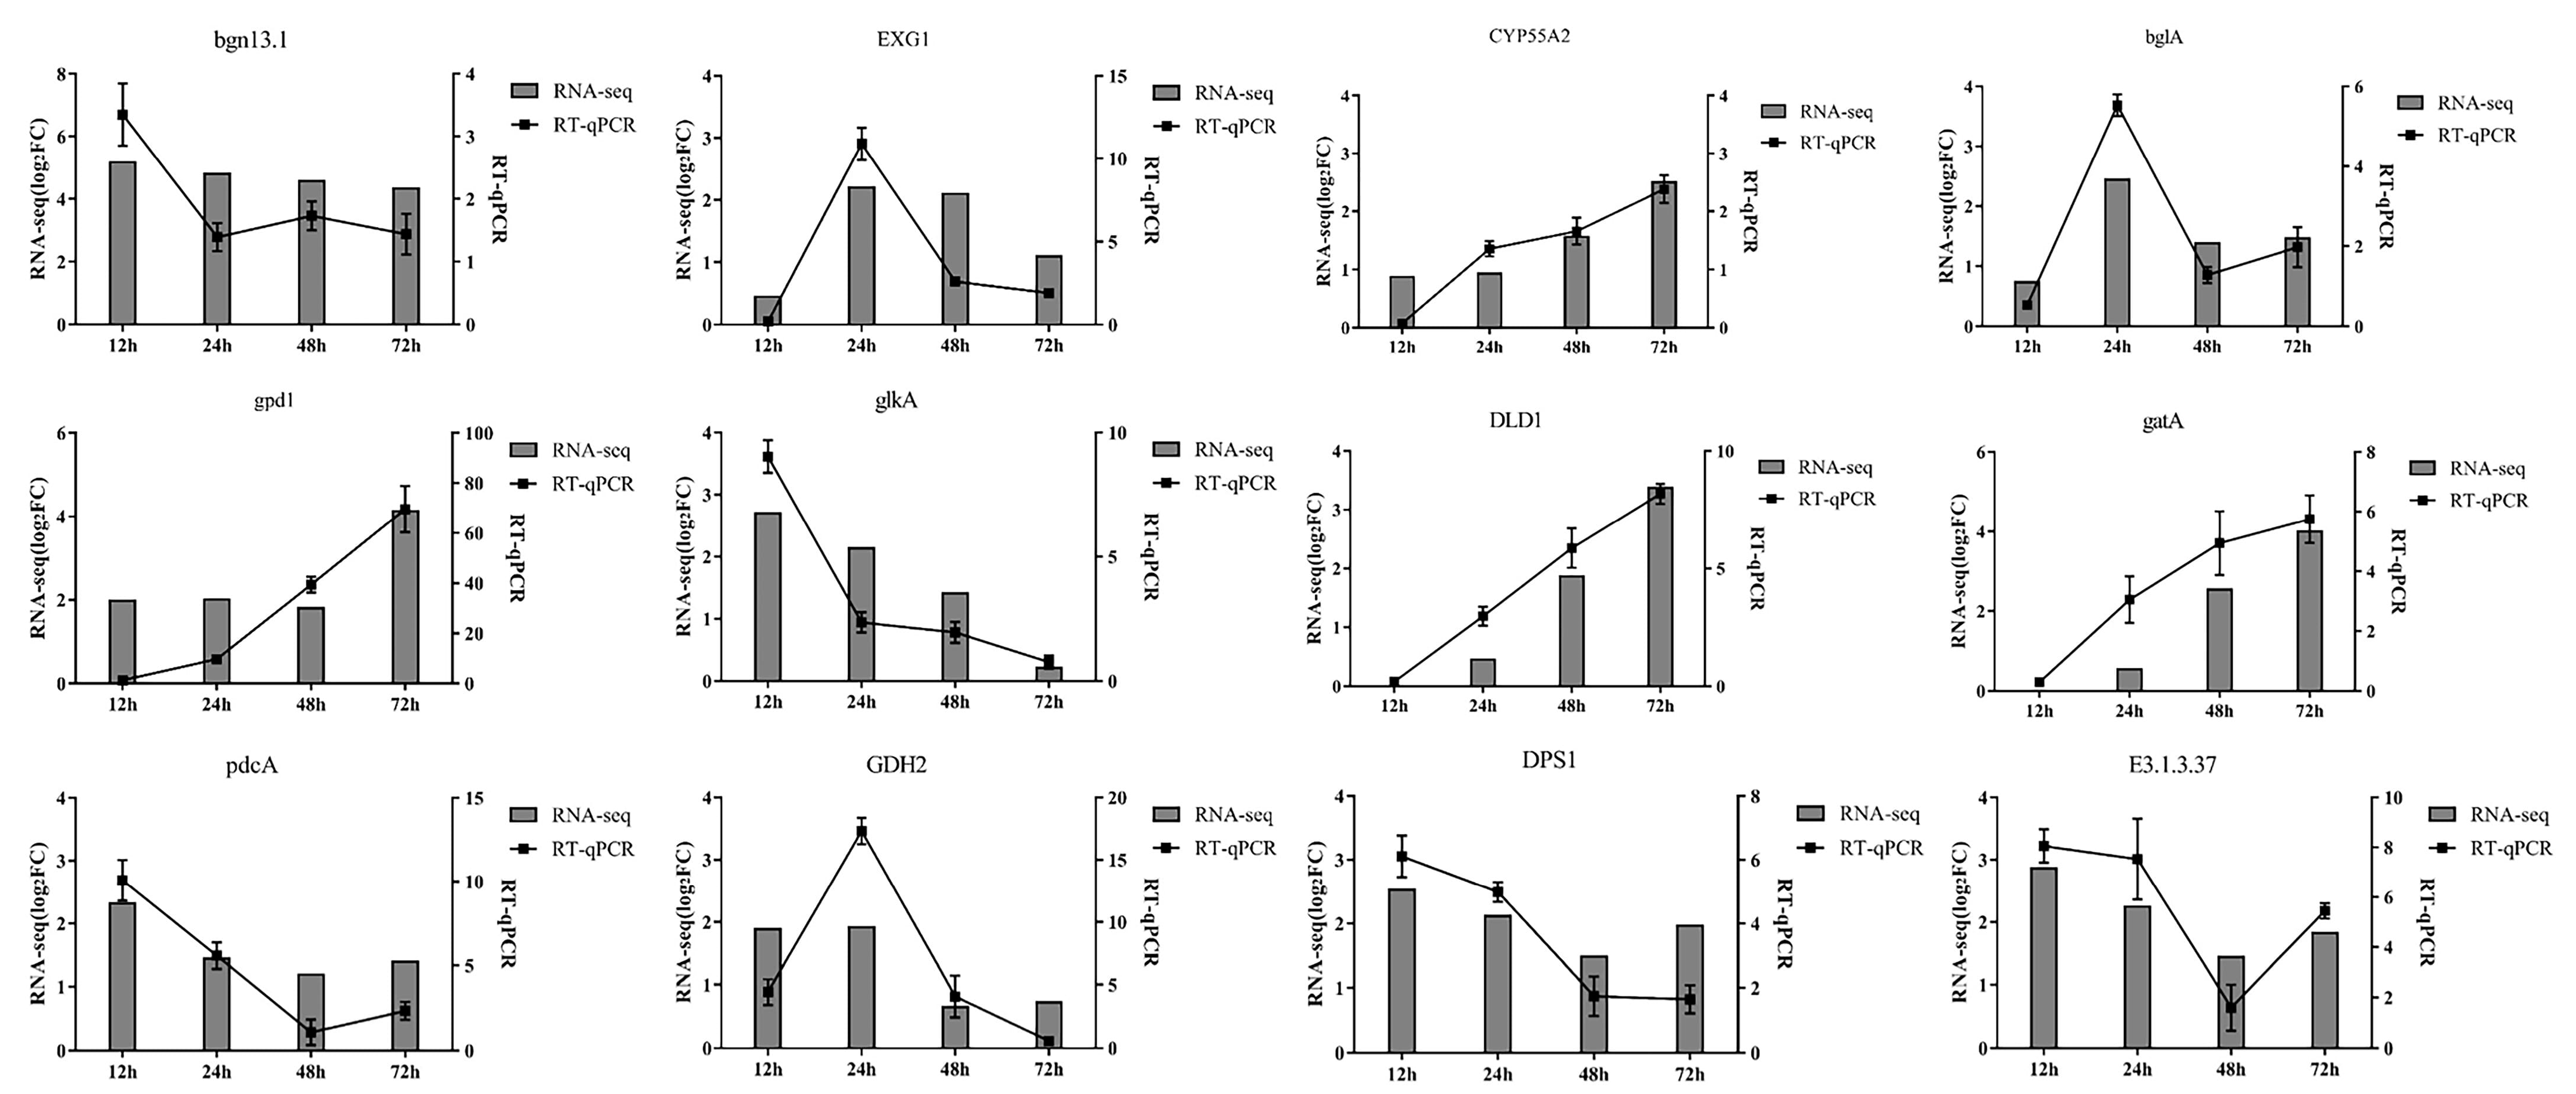
3.6. Real-Time Quantitative PCR Verification (RT-qPCR)

Twelve upregulated differentially expressed genes were randomly selected from the 12, 24, 48 and 72 h transcriptome data for RT qPCR validation (Figure 3). These were gluco endo-1,3-beta-glucosidase (bgn13.1), gluco 1,3-beta-glucosidase (EXG1), cyclochrome P450 55A1 (CYP55A2), beta glucosidase (bglA), glutamate/leucine/phenylalanine/valine dehydrogenase (GDH2), hexokinase (glkA), D-lactate dehydrogenase (DLD1), 4-aminobutyrate aminotransfer (gatA), pyruvate decarboxylase (pdcA), glyceraldehyde-3-phosphate dehydrogenase (gpd1), aspartyl-tRNA synthetase (DPS1) and sedoheptulose-1,7-bisphophase (E3.1.3.37). The RT-qPCR results show that the expression trends of the genes were basically consistent with the RNA-Seq data (Figure 7).

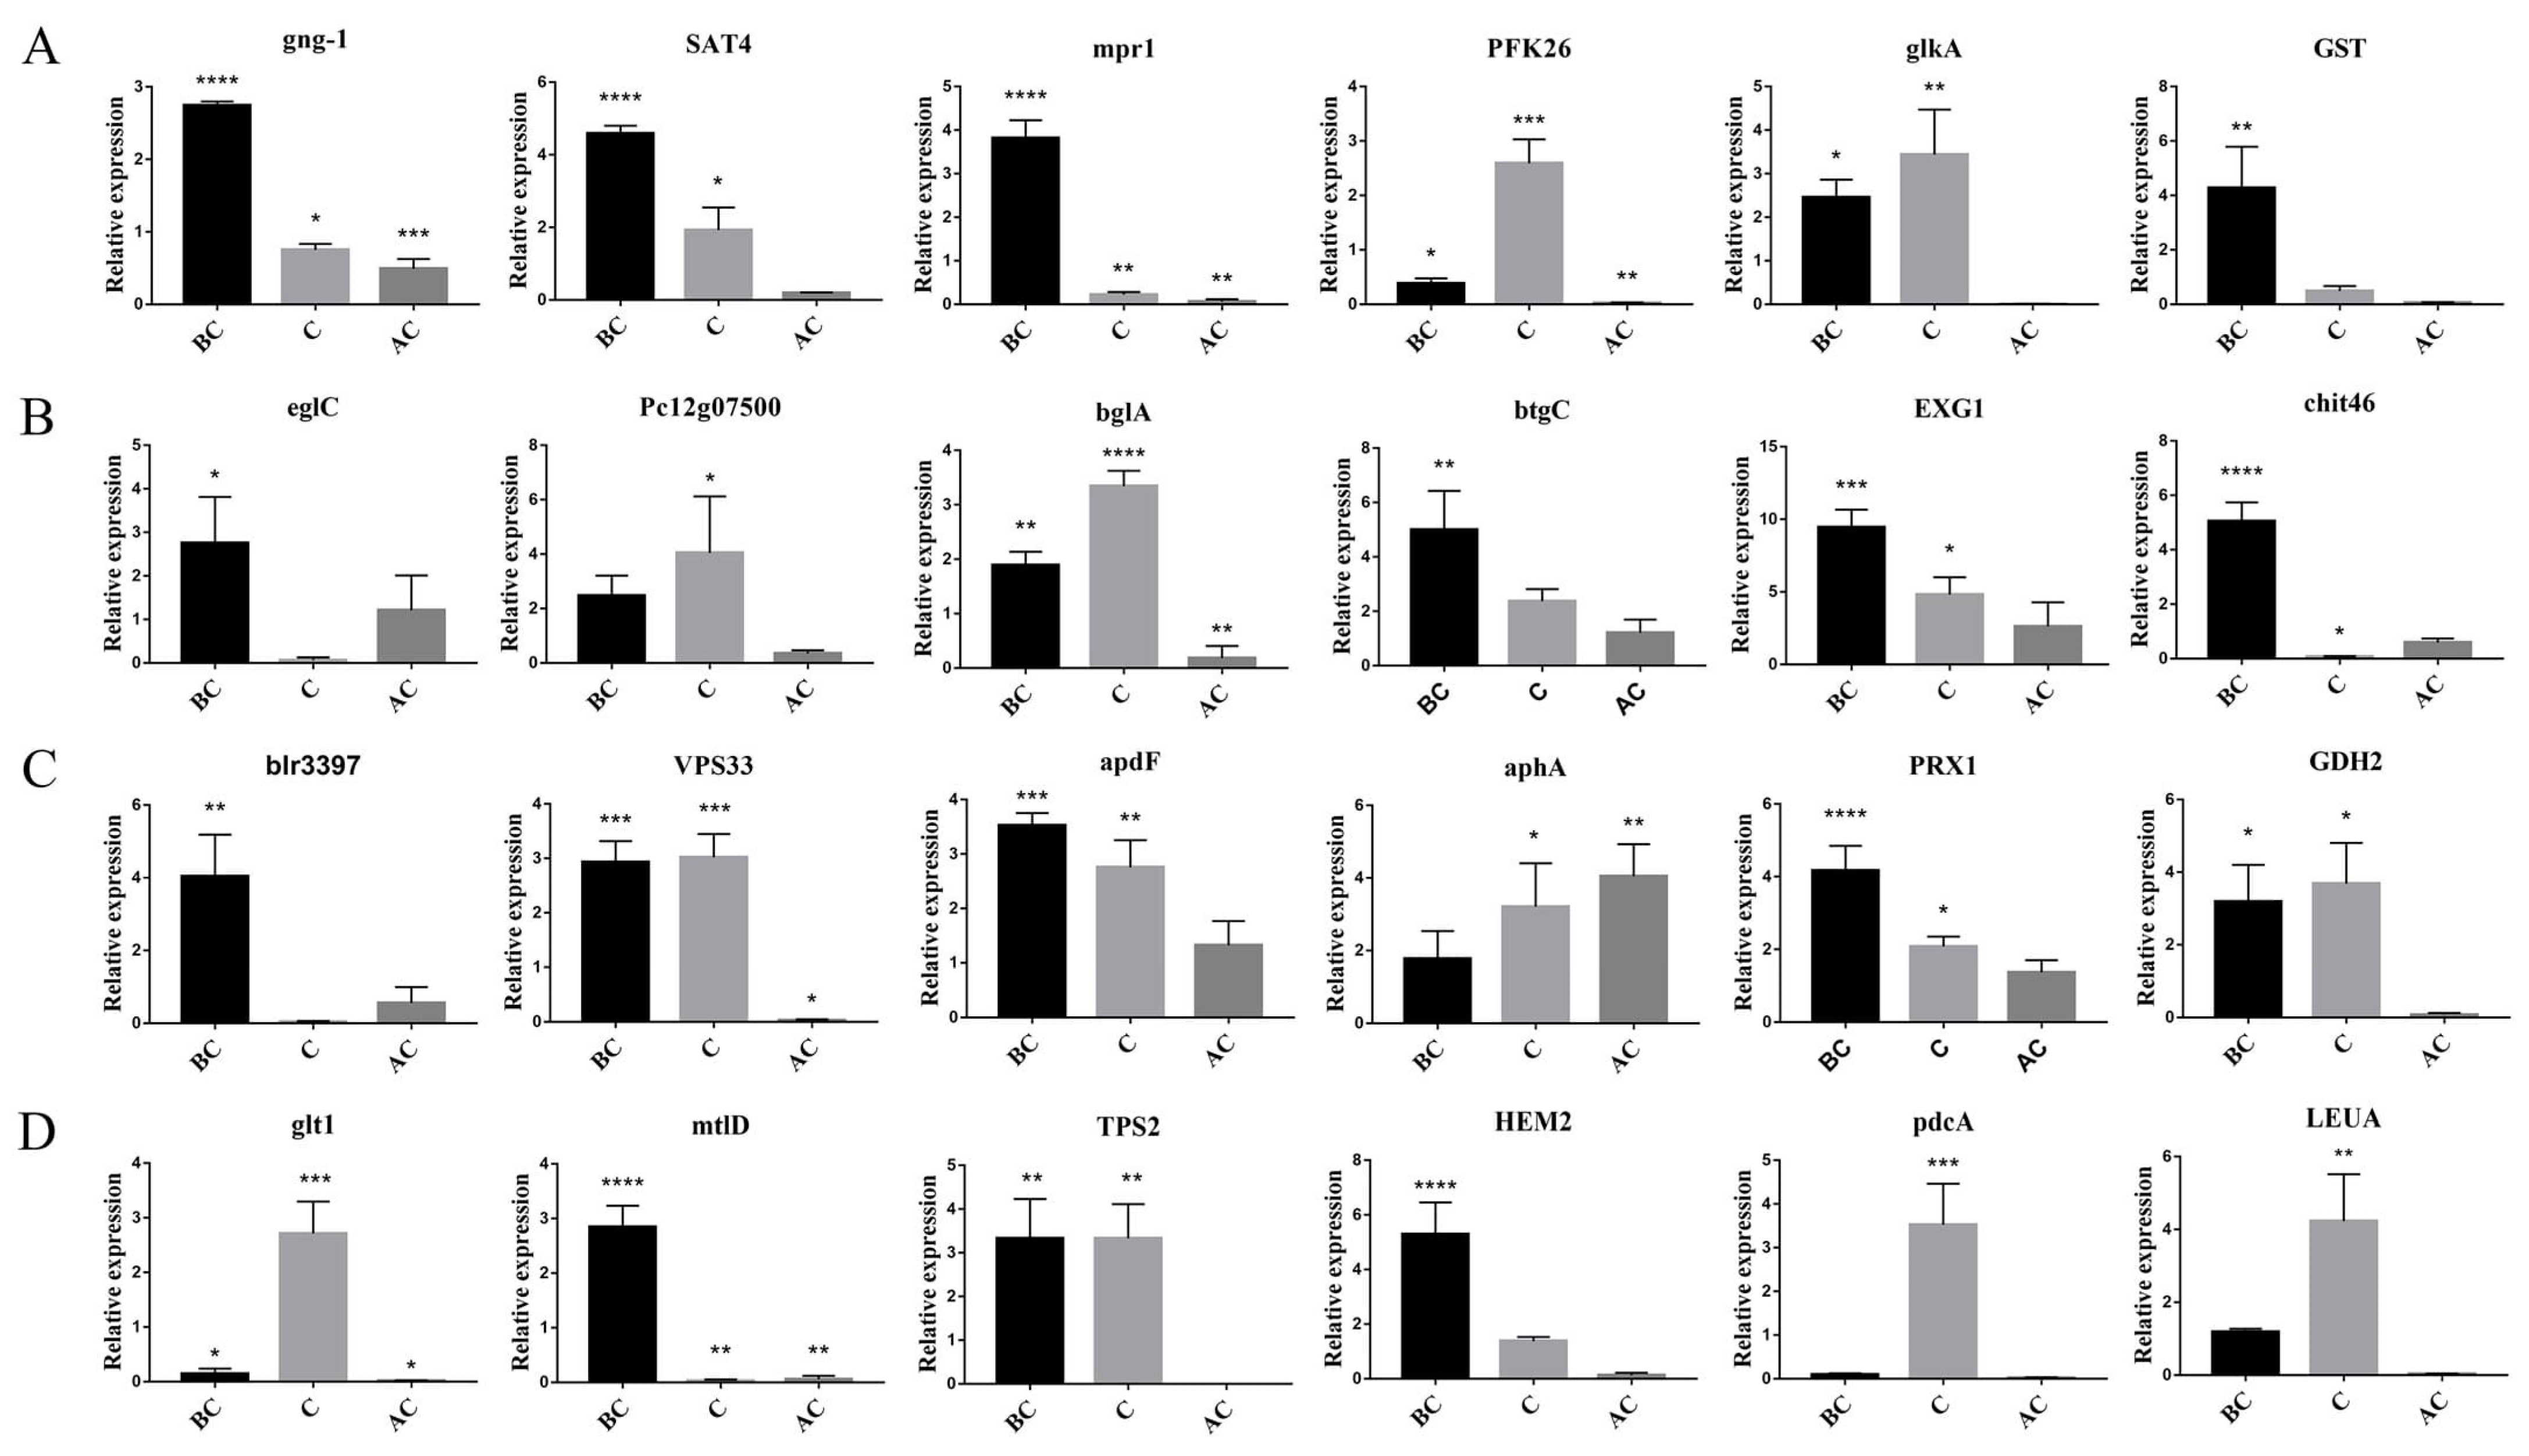
3.7. Dual-Culture of T. harzianum T4 and B. cinerea to Verify the Genes Related to Mycoparasitism

In order to further verify the genes in T. harzianum related to mycoparasitism, we analyzed the expression patterns of these genes using a double-culture direct confrontation experiment [26,27]. RT-qPCR was performed using the total RNA of samples of the T. harzianum and B. cinerea dual culture before (BC), during (C) and after (AC) physical contact. We selected 24 genes that may be associated with mycoparasitism for analysis: 5 kinases and signal transduction-related genes (SAT4, glkA, PFK26, mpr1 and gng-1), 7 glycoside hydrolytic enzymes (Pc12g07500, eglC, blr3397, btgC, EXG1, chit46 and bglA), 1 acid phosphatase (aphA), 2 transporters (VPS33 and apdF), 1 peroxidase (PRX1), 2 dehydrogenases (mtlD and GDH2), 1 decarboxylase (pdcA), 1 transferase (GST), 2 amino acid biosynthesis genes (LEUA and glt1) and trehalose and tetrapyrrole biosynthesis genes (TPS2 and HEM2) (Figure 8). Trichoderma harzianum was grown with itself as a control. Based on the results of dual-culture RT-qPCR, 15 of the 24 genes were upregulated during and after contact between T. harzianum T4 and B. cinerea, providing further evidence that these genes are important factors in mycoparasitism.

4. Discussion

Some studies have confirmed that liquid media containing fungal host cell walls can be used as a model to identify the genes related to mycoparasitism [21,22,23,28,29,30]. The mechanism of mycoparasitism is a complex process, which is regulated by multiple factors such as different isolated strains and pathogens. In this study, we used transcriptome methods to explore the genes related to the mycoparasitism of T. harzianum T4 at the 4 growth stages of 12, 24, 48 and 72 h in the presence of BBCW or sucrose. A total of 10,266 predicted genes were identified from our transcriptome data, including 2871 DEGs and 2148 novel genes, greatly enriching the available genome annotation information for T. harzianum T4. Through GO and KEGG enrichment analysis of DEGs, we found that carbohydrate metabolism was significantly enriched at 12, 24 and 48 h. At 24 and 48 h, the T. harzianum T4 strain upregulated most of the genes related to carbohydrate active enzymes (in particular, hydrolase genes) in response to the presence of BCCW. By enriching the upregulated DEGs at different culture times, we further analyzed the genes that were significantly enriched at specific epochs, such as kinases and signal transduction genes, CAZymes (in particular, hydrolase), transmembrane transporters and oxidoreductase. This discovery confirmed that T. harzianum could maintain its own growth and eliminate the host through a series of processes, such as upregulating the expression of carbohydrate activity enzyme-related genes, enhancing the activity of hydrolase to hydrolyze the host cell wall and regulating the method of nutrition acquisition.
The mycoparasitism process of T. harzianum involves a series of activities such as recognition, adherence, attachment, persistence, hydrolysis and parasitism of the host hyphae at different growth stages [31]. In this regard, MAPK and G protein have been proven to be involved in the recognition and attachment stages of mycoparasitism [18,32]. Recent studies have shown that MAPK participates in the formation of cellulase and regulates its expression at the transcription level [33,34,35]. From the transcriptome of T. harzianum T4, we found that two genes encoding G protein and three MAPK protein kinases were significantly upregulated under BCCM induction compared with the control. In addition, an opportunistic 2-component system, phosphorelay intermediate protein YPD1 (mpr1), was significantly upregulated in the presence of BCCM at 12 h, which could positively regulate the MAPK cascade [36]. YPD1 also plays a key role in cell functions such as cell wall synthesis and spore formation, osmotic and oxidative stress, and toxicity [37,38].
CAZymes are closely related to the nutritional patterns of fungi and participate in the degradation of the cell walls of pathogens and stored compounds [39,40]. When the T. harzianum T4 strain was grown in an induction medium with BCCW for 24 and 48 h, a significant number of hydrolase genes, such as chitinase, cellulase and glucanase, were significantly upregulated. In addition to hydrolase genes, glycosyltransferase and protease genes were significantly upregulated, and these play a key role in mycoparasitism [41,42]. Cellulase can hydrolyze the mycelia of fungal pathogens during the mycoparasitism process. Some studies have shown that the greater the cellulase activity, the greater the biological control potential [43,44,45]. A new gene encoding endo-1,3 (4) beta glucanase (bgn13.1) was significantly upregulated in multiple culture time periods and this was directly involved in the mycoparasitism between T. harzianum and B. cinerea [46,47]. The role of these upregulated genes in the mycoparasitism of T. harzianum T4 involves the penetration and degradation of the cell wall, which inhibits the spore germination and mycelial growth of the pathogen.
Trichoderma harzianum T4 adapted to the presence of the host cell walls by upregulating genes associated with CAZymes in carbohydrate metabolism, particularly glycosidic hydrolases. After hydrolyzing carbohydrate macromolecules, transport and absorption also play a role in mycoparasitism. The upregulation of the glucose transporter HXT at 12 h was closely related to improvements in the sexual reproduction, antioxidant capacity, pathogenicity and toxicity of T. harzianum T4 [48,49,50]. The POT/PTR family protein PTR2 was upregulated at 24 and 48 h, is involved in the transport of small peptides and is closely related to the internal transport of nutrient stores and the absorption of host surface decomposition products during mycoparasitism [51]. MEP1, an ammonium transporter that can absorb low concentrations of ammonium under nitrogen restriction to maintain cell growth, was upregulated at 12, 24, 48 and 72 h [52]. SIT1, which mediates iron absorption, was upregulated at 48 h and is essential to T. harzianum mycoparasitism [53,54,55]. The upregulation of choline transporter HNM1 at 48 h and 72 h is critical for conidial germination, sprout tube elongation and fungal toxicity [56]. Therefore, transmembrane transporters participate in the transport of a range of materials, such as carbon and nitrogen sources, metal ions and toxic substances, that play an important role in the process of mycoparasitism.
We found that T. harzianum responded to the oxidative damage by upregulating antioxidant enzymes or metabolites during stress conditions (in the presence of the host or at the late phase of cultivation) [57]. Transcriptome data revealed that T. harzianum responded to BCCW by upregulating NADPH oxidase NOxA to produce ROS while upregulating peroxidase Prx1 to protect cells from oxidative damage [58,59]. In addition, MtlD and P5CR were significantly upregulated; these genes participate in the biosynthesis of mannose and proline and play a key role in regulating cellular osmolarity and oxidative stress [60,61]. Of these, mannitol is a powerful quencher of reactive oxygen species (ROS) in fungi [62]. T. harzianum directly attacks the host during mycoparasitism and produces toxic secondary metabolites to kill the pathogen. Of these, nonribosomal peptide synthetases (NRPSs) and lovastatin nonaketotide syntheses AzaB (a polyketone compound) were significantly upregulated. They are important secondary metabolites of T. harzianum and these genes can be combined with hydrolase genes to further inhibit the growth of pathogens and enhance the mycoparasitism of T. harzianum T4 [63,64].
When faced with host and secondary metabolites, T. harzianum upregulated resistance proteins and detoxification-related genes to increase its ability to parasitize by enhancing its adaptation to stress environments. RP-L3e is a Trichoderma-resistant protein gene which plays an important role in amino acid tRNA binding, peptidyltransferase activity and drug resistance [65]. GST is a unique multifunctional cell membrane enzyme that is involved in the detoxification of toxic compounds and protection from oxidative damage [66,67,68,69,70]. An aging-related NAD-dependent histone deacetylase, SIR2, regulated by S-glutathione, extends lifespan by increasing lipid droplet and trehalose content and plays a key role in fungal parasites [71,72]. We also found that the expression of lipid droplet-associated hydrolase was downregulated at 12 h. TPS involved in trehalose synthesis was upregulated at 12, 24 and 48 h. Trehalose formation is essential for the maintenance of cell homeostasis and formation of appressoria [73,74].
In addition, a gene encoding a WSC domain-containing protein attracted our attention. The gene was significantly upregulated at 24, 48 and 72 h of T. harzianum growth in the presence of BCCM. Some studies have shown that the WSC domain-containing protein can activate the MAPK cascade [75], which is related to the integrity of cell walls, oxidation, hypertonic and metal ion binding. Studies have also shown that this protein is related to lectin, although this has not been definitively proved [76]. Two new genes encoding transketolase, TKL1 and TKL2, were significantly upregulated during mycoparasitism. TKL1 is mainly responsible for the response to osmotic stress and promotion of biotrophic growth and its overexpression can increase lipid content. TKL2 is mainly responsible for the response to oxidative stress [77]. These two transketolase enzymes play unique and complementary roles in coping with different environmental pressures [78]. However, the specific functions of these novel genes in the mycoparasitism of T. harzianum require verification by further experiments.
Among the DEGs in T. harzianum T4, we identified many unknown functional or hypothetical protein genes. These DEGs are highly induced by BCCW but are not, or are rarely, expressed when T. harzianum T4 is grown with itself, which may be significant in mycoparasitism. In our forthcoming work, we will further verify the specific functions of mycoparasitism-related genes screened by the transcriptome via gene knockout, overexpression and double-culture antagonism experiments.

5. Conclusions

In conclusion, we used the transcriptome sequencing technology to identify DEGs related to mycoparasitism of T. harzianum T4 at 12, 24, 48 and 72 h of growth in the presence of cell walls of B. cinerea (BCCW). Through GO and KEGG enrichment analysis of DEGs, we identified genes associated with mycoparasitism at specific time periods, such as genes encoding kinases, signal transduction proteins, carbohydrate active enzymes, hydrolytic enzymes, transporters, antioxidant enzymes, secondary metabolite synthesis, resistance proteins, detoxification and genes associated with the extension of hyphal longevity. The transcriptome data provided in this study will not only improve the annotation information of gene models in the T. harzianum T4 genome, but also provide important transcriptome information involved in the process of mycoparasitism at specific time periods, thus providing a potential molecular target for other genes that use T. harzianum T4 as a biological control agent.

Author Contributions

Conceptualization, formal analysis, investigation, data curation, writing—original draft, writing—review and editing, and visualization, Y.W.; investigation and data curation, X.Z.; methodology, data curation and original draft modification, J.W.; investigation, C.S.; conceptualization, methodology, validation, supervision, project administration and funding acquisition, W.W. All authors have read and agreed to the published version of the manuscript.

Funding

This work was supported by the Project of Prospering Agriculture through Science and Technology of Shanghai, China (grant number 2022-02-08-00-12-F01163).

Institutional Review Board Statement

Not applicable.

Informed Consent Statement

Not applicable.

Data Availability Statement

Not applicable.

Conflicts of Interest

The authors hereby declare that they have no conflict of interest.

References

  1. Fendrihan, S.; Lixandru, M.; Dinu, S. Control methods of Botrytis cinerea. Int. J. Life Sci. Technol. 2018, 11, 31–36. [Google Scholar]
  2. Yang, Q.; Song, L.; Miao, Z.; Su, M.; Liang, W.; He, Y. Acetylation of BcHpt Lysine 161 Regulates Botrytis cinerea Sensitivity to Fungicides, Multistress Adaptation and Virulence. Front. Microbiol. 2020, 10, 2965. [Google Scholar] [CrossRef] [PubMed] [Green Version]
  3. Vela-Corcía, D.; Aditya Srivastava, D.; Dafa-Berger, A.; Rotem, N.; Barda, O.; Levy, M. MFS transporter from Botrytis cinerea provides tolerance to glucosinolate-breakdown products and is required for pathogenicity. Nat. Commun. 2019, 10, 2886. [Google Scholar] [CrossRef] [PubMed] [Green Version]
  4. Xiao, X.; Cheng, J.; Tang, J.; Fu, Y.; Jiang, D.; Baker, T.S.; Ghabrial, S.A.; Xie, J. A novel partitivirus that confers hypovirulence on plant pathogenic fungi. J. Virol. 2014, 88, 10120–10133. [Google Scholar] [CrossRef] [PubMed] [Green Version]
  5. Yi, T.; Lei, L.; He, L.; Yi, J.; Li, L.; Dai, L.; Hong, Y. Symbiotic Fungus Affected the Asian Citrus Psyllid (ACP) Resistance to Imidacloprid and Thiamethoxam. Front. Microbiol. 2020, 11, 522164. [Google Scholar] [CrossRef]
  6. Wang, X.; Gong, C.; Zhao, Y.; Shen, L. Transcriptome and Resistance-Related Genes Analysis of Botrytis cinerea B05.10 Strain to Different Selective Pressures of Cyprodinil and Fenhexamid. Front. Microbiol. 2018, 9, 2591. [Google Scholar] [CrossRef]
  7. Soulie, M.C.; Koka, S.M.; Floch, K.; Vancostenoble, B.; Barbe, D.; Daviere, A.; Soubigou-Taconnat, L.; Brunaud, V.; Poussereau, N.; Loisel, E.; et al. Plant nitrogen supply affects the Botrytis cinerea infection process and modulates known and novel virulence factors. Mol. Plant Pathol. 2020, 21, 1436–1450. [Google Scholar] [CrossRef]
  8. Calderón, C.E.; Rotem, N.; Harris, R.; Vela-Corcía, D.; Levy, M. Pseudozyma aphidis activates reactive oxygen species production, programmed cell death and morphological alterations in the necrotrophic fungus Botrytis cinerea. Mol. Plant Pathol. 2019, 20, 562–574. [Google Scholar] [CrossRef] [Green Version]
  9. Law, J.W.; Ser, H.L.; Khan, T.M.; Chuah, L.H.; Pusparajah, P.; Chan, K.G.; Goh, B.H.; Lee, L.H. The Potential of Streptomyces as Biocontrol Agents against the Rice Blast Fungus, Magnaporthe oryzae (Pyricularia oryzae). Front. Microbiol. 2017, 8, 3. [Google Scholar] [CrossRef] [Green Version]
  10. Kottb, M.; Gigolashvili, T.; Großkinsky, D.K.; Piechulla, B. Trichoderma volatiles effecting Arabidopsis: From inhibition to protection against phytopathogenic fungi. Front. Microbiol. 2015, 6, 995. [Google Scholar] [CrossRef] [Green Version]
  11. Wu, Q.; Ni, M.; Wang, G.; Liu, Q.; Yu, M.; Tang, J. Omics for understanding the tolerant mechanism of Trichoderma asperellum TJ01 to organophosphorus pesticide dichlorvos. BMC Genom. 2018, 19, 596. [Google Scholar] [CrossRef] [PubMed]
  12. Wenliang, P.; Wei, W. Preparation and Field Efficacy of Chlamydospore Water Dispersible Granule of Trichoderma harzianum. Chin. J. Biol. Control 2020, 36, 241–248. [Google Scholar]
  13. Xia, F.; Zhang, Y.; Re, X.U.; Wang, W. Effect of Trichoderma harzianum T4 on Bacterial Community in Watermelon (Citrullus lanatus) Rhizosphere Soil. Chin. J. Biol. Control 2013, 29, 232–241. [Google Scholar]
  14. Yu, X.X.; Zhao, Y.T.; Cheng, J.; Wang, W. Biocontrol effect of Trichoderma harzianum T4 on brassica clubroot and analysis of rhizosphere microbial communities based on T-RFLP. Biocontrol Sci. Technol. 2015, 25, 1493–1505. [Google Scholar] [CrossRef]
  15. Zhu, X.; Wang, Y.; Wang, X.; Wang, W. Exogenous Regulators Enhance the Yield and Stress Resistance of Chlamydospores of the Biocontrol Agent Trichoderma harzianum T4. J. Fungi 2022, 8, 1017. [Google Scholar] [CrossRef]
  16. Moreno-Ruiz, D.; Lichius, A.; Turrà, D.; Di Pietro, A.; Zeilinger, S. Chemotropism Assays for Plant Symbiosis and Mycoparasitism Related Compound Screening in Trichoderma atroviride. Front. Microbiol. 2020, 11, 601251. [Google Scholar] [CrossRef]
  17. Harman, G.E. Overview of Mechanisms and Uses of Trichoderma spp. Phytopathology 2006, 96, 190–194. [Google Scholar] [CrossRef] [Green Version]
  18. Borin, G.P.; Sanchez, C.C.; de Santana, E.S.; Zanini, G.K.; dos Santos, R.A.C.; de Oliveira Pontes, A.; de Souza, A.T.; Dal’Mas, R.M.M.T.S.; Riaño-Pachón, D.M.; Goldman, G.H.; et al. Comparative transcriptome analysis reveals different strategies for degradation of steam-exploded sugarcane bagasse by Aspergillus niger and Trichoderma reesei. BMC Genom. 2017, 18, 501. [Google Scholar] [CrossRef] [Green Version]
  19. Steindorff, A.S.; Soller Ramada, M.H.; Guedes Coelho, A.S. Identification of mycoparasitism-related genes against the phytopathogen Sclerotinia sclerotiorum through transcriptome and expression profile analysis in Trichoderma harzianum. BMC Genom. 2014, 15, 204. [Google Scholar] [CrossRef] [Green Version]
  20. Saravanakumar, K.; Wang, M.-H. Isolation and molecular identification of Trichoderma species from wetland soil and their antagonistic activity against phytopathogens. Physiol. Mol. Plant Pathol. 2020, 109, 101458. [Google Scholar] [CrossRef]
  21. Liu, N.; Bao, Z.; Li, J.; Ao, X.; Zhu, J.; Chen, Y. Identification of differentially expressed genes from Trichoderma atroviride strain SS003 in the presence of cell wall of Cronartium ribicola. Genes Genom. 2017, 39, 473–484. [Google Scholar] [CrossRef]
  22. Steindorff, A.S.; Silva, R.d.N.; Coelho, A.S.G.; Nagata, T.; Noronha, E.F.; Ulhoa, C.J. Trichoderma harzianum expressed sequence tags for identification of genes with putative roles in mycoparasitism against Fusarium solani. Biol. Control 2012, 61, 134–140. [Google Scholar] [CrossRef]
  23. Vieira, P.; Coelho, A.; Steindorff, A.; deSiqueira, S.; Silva, R.; Ulhoa, C. Identification of differentially expressed genes from Trichoderma harzianum during growth on cell wall of Fusarium solani as a tool for biotechnological application. BMC Genom. 2013, 14, 177. [Google Scholar] [CrossRef] [PubMed] [Green Version]
  24. Chen, S.; Zhou, Y.; Chen, Y.; Gu, J. fastp: An ultra-fast all-in-one FASTQ preprocessor. Bioinformatics 2018, 34, i884–i890. [Google Scholar] [CrossRef]
  25. Love, M.I.; Huber, W.; Anders, S. Moderated estimation of fold change and dispersion for RNA-seq data with DESeq2. Genome Biol. 2014, 15, 550. [Google Scholar] [CrossRef] [PubMed] [Green Version]
  26. Kullnig, C.; Mach, R.L.; Lorito, M.; Kubicek, C.P. Enzyme diffusion from Trichoderma atroviride (=T. harzianum P1) to Rhizoctonia solani is a prerequisite for triggering of Trichoderma ech42 gene expression before mycoparasitic contact. Appl. Environ. Microbiol. 2000, 66, 2232–2234. [Google Scholar] [CrossRef] [Green Version]
  27. Liu, Z.; Yang, X.; Sun, D.; Song, J.; Chen, G.; Juba, O.; Yang, Q. Expressed sequence tags-based identification of genes in a biocontrol strain Trichoderma asperellum. Mol. Biol. Rep. 2010, 37, 3673–3681. [Google Scholar] [CrossRef]
  28. Troian, R.; Steindorff, A.; Ramada, M.; Arruda, W.; Ulhoa, C. Mycoparasitism studies of Trichoderma harzianum against Sclerotinia sclerotiorum: Evaluation of antagonism and expression of cell wall-degrading enzymes genes. Biotechnol. Lett. 2014, 36, 2095–2101. [Google Scholar] [CrossRef]
  29. Sun, Z.; Sun, M.; Li, S. Identification of mycoparasitism-related genes in Clonostachys rosea 67-1 active against Sclerotinia sclerotiorum. Sci. Rep. 2015, 14, 18169. [Google Scholar] [CrossRef]
  30. Suárez, M.B.; Sanz, L.; Chamorro, M.I.; Rey, M.; González, F.J.; Llobell, A.; Monte, E. Proteomic analysis of secreted proteins from Trichoderma harzianum. Identification of a fungal cell wall-induced aspartic protease. Fungal Genet. Biol. 2005, 42, 924–934. [Google Scholar] [CrossRef]
  31. Boland, G.J.; Hall, R. Index of plant hosts of Sclerotinia sclerotiorum. Can. J. Plant Pathol. 1994, 16, 93–108. [Google Scholar] [CrossRef]
  32. Moreno-Ruiz, D.; Salzmann, L.; Fricker, M.D.; Zeilinger, S.; Lichius, A. Stress-Activated Protein Kinase Signalling Regulates Mycoparasitic Hyphal-Hyphal Interactions in Trichoderma atroviride. J. Fungi 2021, 7, 365. [Google Scholar] [CrossRef] [PubMed]
  33. Wang, M.; Zhang, M.; Li, L.; Dong, Y.; Jiang, Y.; Liu, K.; Zhang, R.; Jiang, B.; Niu, K.; Fang, X. Role of Trichoderma reesei mitogen-activated protein kinases (MAPKs) in cellulase formation. Biotechnol. Biofuels 2017, 10, 99. [Google Scholar] [CrossRef]
  34. Chen, F.; Chen, X.-Z.; Su, X.-Y.; Qin, L.-N.; Huang, Z.-B.; Tao, Y.; Dong, Z.-Y. An Ime2-like mitogen-activated protein kinase is involved in cellulase expression in the filamentous fungus Trichoderma reesei. Biotechnol. Lett. 2015, 37, 2055–2062. [Google Scholar] [CrossRef] [PubMed]
  35. Beier, S.; Hinterdobler, W.; Monroy, A.A.; Bazafkan, H.; Schmoll, M. The Kinase USK1 Regulates Cellulase Gene Expression and Secondary Metabolite Biosynthesis in Trichoderma reesei. Front. Microbiol. 2020, 11, 974. [Google Scholar] [CrossRef]
  36. Mohanan, V.C.; Chandarana, P.M.; Chattoo, B.B.; Patkar, R.N.; Manjrekar, J. Fungal Histidine Phosphotransferase Plays a Crucial Role in Photomorphogenesis and Pathogenesis in Magnaporthe oryzae. Front. Chem. 2017, 5, 31. [Google Scholar] [CrossRef] [Green Version]
  37. Zhao, X.; Copeland, D.M.; Soares, A.S.; West, A.H. Crystal Structure of a Complex between the Phosphorelay Protein YPD1 and the Response Regulator Domain of SLN1 Bound to a Phosphoryl Analog. J. Mol. Biol. 2008, 375, 1141–1151. [Google Scholar] [CrossRef] [Green Version]
  38. Carapia-Minero, N.; Castelán-Vega, J.A.; Pérez, N.O.; Rodríguez-Tovar, A.V. The phosphorelay signal transduction system in Candida glabrata: An in silico analysis. J. Mol. Model. 2018, 24, 13. [Google Scholar] [CrossRef]
  39. Rodrigues, C.M.; Takita, M.A.; Silva, N.V.; Ribeiro-Alves, M.; Machado, M.A. Comparative genome analysis of Phyllosticta citricarpa and Phyllosticta capitalensis, two fungi species that share the same host. BMC Genom. 2019, 20, 554. [Google Scholar] [CrossRef]
  40. Okagaki, L.H.; Sailsbery, J.K.; Eyre, A.W.; Dean, R.A. Comparative genome analysis and genome evolution of members of the magnaporthaceae family of fungi. BMC Genom. 2016, 17, 135. [Google Scholar] [CrossRef] [Green Version]
  41. Geremía, R.A.; Goldman, G.H.; Jacobs, D.; Ardrtes, W.; Vila, S.B.; van Montagu, M.C.; Herrera-Estrella, A. Molecular characterization of the proteinase-encoding gene, prb1, related to mycoparasitism by Trichoderma harzianum. Mol. Microbiol. 1993, 8, 603–613. [Google Scholar] [CrossRef] [PubMed]
  42. Lorito, M.; Woo, S.L.; Garcia, I.; Colucci, G.; Harman, G.E.; Pintor-Toro, J.A.; Filippone, E.; Muccifora, S.; Lawrence, C.B.; Zoina, A.; et al. Genes from mycoparasitic fungi as a source for improving plant resistance to fungal pathogens. Proc. Natl. Acad. Sci. USA 1998, 95, 7860–7865. [Google Scholar] [CrossRef] [PubMed] [Green Version]
  43. Jatav, P.; Ahirwar, S.S.; Gupta, A.; Kushwaha, K.; Jatav, S. Antagonistic activity of cellulase enzyme produced by Trichoderma Viride against Xanthomonas Citri. Indian J. Agric. Res. 2018, 52, 497–504. [Google Scholar]
  44. Saravanakumar, K.; Dou, K.; Lu, Z.; Wang, X.; Li, Y.; Chen, J. Enhanced biocontrol activity of cellulase from Trichoderma harzianum against Fusarium graminearum through activation of defense-related genes in maize. Physiol. Mol. Plant Pathol. 2018, 103, 130–136. [Google Scholar] [CrossRef]
  45. Ghasemi, S.; Safaie, N.; Shahbazi, S.; Shams-Bakhsh, M.; Askari, H. The Role of Cell Wall Degrading Enzymes in Antagonistic Traits of Trichoderma virens against Rhizoctonia solani. Iran. J. Biotechnol. 2020, 18, e2333. [Google Scholar]
  46. Monteiro, V.N.; Ulhoa, C.J. Biochemical Characterization of a β-1,3-Glucanase from Trichoderma koningii Induced by Cell Wall of Rhizoctonia solani. Curr. Microbiol. 2006, 52, 92–96. [Google Scholar] [CrossRef]
  47. Martin, K.; McDougall, B.M.; McIlroy, S.; Jayus Chen, J.; Seviour, R.J. Biochemistry and molecular biology of exocellular fungal β-(1,3)- and β-(1,6)-glucanases. FEMS Microbiol. Rev. 2007, 31, 168–192. [Google Scholar] [CrossRef]
  48. Lingner, U.; Münch, S.; Deising, H.B.; Sauer, N. Hexose transporters of a hemibiotrophic plant pathogen: Functional variations and regulatory differences at different stages of infection. J. Biol. Chem. 2011, 286, 20913–20922. [Google Scholar] [CrossRef] [Green Version]
  49. Wei, H.; Vienken, K.; Weber, R.; Bunting, S.; Requena, N.; Fischer, R. A putative high affinity hexose transporter, hxtA, of Aspergillus nidulans is induced in vegetative hyphae upon starvation and in ascogenous hyphae during cleistothecium formation. Fungal Genet. Biol. B 2004, 41, 148–156. [Google Scholar] [CrossRef]
  50. Chikamori, M.; Fukushima, K. A new hexose transporter from Cryptococcus neoformans: Molecular cloning and structural and functional characterization. Fungal Genet. Biol. 2005, 42, 646–655. [Google Scholar] [CrossRef]
  51. Droce, A.; Holm, K.; Olsson, S.; Frandsen, R.; Sondergaard, T.; Sorensen, J.; Giese, H. Expression profiling and functional analyses of BghPTR2, a peptide transporter from Blumeria graminis f. sp. hordei. Fungal Biol. 2015, 119, 551–559. [Google Scholar] [CrossRef] [PubMed]
  52. Marini, A.M.; Vissers, S.; Urrestarazu, A.; André, B. Cloning and expression of the MEP1 gene encoding an ammonium transporter in Saccharomyces cerevisiae. EMBO J. 1994, 13, 3456–3463. [Google Scholar] [CrossRef] [PubMed]
  53. Tangen, K.L.; Jung, W.H.; Sham, A.P.; Lian, T.; Kronstad, J.W. The iron- and cAMP-regulated gene SIT1 influences ferrioxamine B utilization, melanization and cell wall structure in Cryptococcus neoformans. Microbiology 2007, 153, 29–41. [Google Scholar] [CrossRef] [PubMed] [Green Version]
  54. Aguiar, M.; Orasch, T.; Misslinger, M.; Dietl, A.-M.; Gsaller, F.; Haas, H. The Siderophore Transporters Sit1 and Sit2 Are Essential for Utilization of Ferrichrome-, Ferrioxamine- and Coprogen-Type Siderophores in Aspergillus fumigatus. J. Fungi 2021, 7, 768. [Google Scholar] [CrossRef]
  55. Dietl, A.-M.; Misslinger, M.; Aguiar, M.M.; Ivashov, V.; Teis, D.; Pfister, J.; Decristoforo, C.; Hermann, M.; Sullivan, S.M.; Smith, L.R.; et al. The Siderophore Transporter Sit1 Determines Susceptibility to the Antifungal VL-2397. Antimicrob. Agents Chemother. 2019, 63, e00807–e00819. [Google Scholar] [CrossRef]
  56. Chand Arya, G.; Aditya Srivastava, D.; Manasherova, E.; Prusky, D.B.; Elad, Y.; Frenkel, O.; Harel, A. BcHnm1, a predicted choline transporter, modulates conidial germination and virulence in Botrytis cinerea. Fungal Genet. Biol. 2022, 158, 103653. [Google Scholar] [CrossRef]
  57. Chauhan, N.; Latge, J.-P.; Calderone, R. Signalling and oxidant adaptation in Candida albicans and Aspergillus fumigatus. Nat. Rev. Microbiol. 2006, 4, 435–444. [Google Scholar] [CrossRef]
  58. Zhu, X.; Sayari, M.; Islam, M.R.; Daayf, F. NOXA Is Important for Verticillium dahliae’s Penetration Ability and Virulence. J. Fungi 2021, 7, 814. [Google Scholar] [CrossRef]
  59. Sun, C.C.; Dong, W.R.; Shao, T.; Li, J.Y.; Zhao, J.; Nie, L.; Xiang, L.X.; Zhu, G.; Shao, J.Z. Peroxiredoxin 1 (Prx1) is a dual-function enzyme by possessing Cys-independent catalase-like activity. Biochem. J. 2017, 474, 1373–1394. [Google Scholar] [CrossRef] [Green Version]
  60. Hong, J.; Kim, K.-J. Crystal structure of γ-aminobutyrate aminotransferase in complex with a PLP-GABA adduct from Corynebacterium glutamicum. Biochem. Biophys. Res. Commun. 2019, 514, 601–606. [Google Scholar] [CrossRef]
  61. Forlani, G.; Nocek, B.; Chakravarthy, S.; Joachimiak, A. Functional Characterization of Four Putative δ1-Pyrroline-5-Carboxylate Reductases from Bacillus subtilis. Front. Microbiol. 2017, 8, 1442. [Google Scholar] [CrossRef] [PubMed] [Green Version]
  62. Upadhyay, R.; Meena, M.; Prasad, V.; Zehra, A.; Gupta, V. Mannitol metabolism during pathogenic fungal–host interactions under stressed conditions. Front. Microbiol. 2015, 6, 1019. [Google Scholar]
  63. Hur, G.H.; Vickery, C.R.; Burkart, M.D. Explorations of catalytic domains in non-ribosomal peptide synthetase enzymology. Nat. Prod. Rep. 2012, 29, 1074–1098. [Google Scholar] [CrossRef] [Green Version]
  64. Niu, X.; Thaochan, N.; Hu, Q. Diversity of Linear Non-Ribosomal Peptide in Biocontrol Fungi. J. Fungi 2020, 6, 61. [Google Scholar] [CrossRef]
  65. Petrov, A.; Meskauskas, A.; Dinman, J.D. Ribosomal protein L3: Influence on ribosome structure and function. RNA Biol. 2004, 1, 59–65. [Google Scholar] [CrossRef] [Green Version]
  66. Cohen, E.; Gamliel, A.; Katan, J. Glutathione and glutathione-S-transferase in fungi: Effect of pentachloronitrobenzene and 1-choro-2,4-dinitrobenzene; purification and characterization of the transferase from Fusarium. Pestic. Biochem. Physiol. 1986, 26, 1–9. [Google Scholar] [CrossRef]
  67. Gullner, G.; Komives, T.; Kirly, L.; Schrder, P. Glutathione S-Transferase Enzymes in Plant-Pathogen Interactions. Front. Plant Sci. 2018, 9, 1836. [Google Scholar] [CrossRef] [PubMed] [Green Version]
  68. Munyampundu, J.; Xu, Y.; Cai, X. Phi Class of Glutathione S-transferase Gene Superfamily Widely Exists in Nonplant Taxonomic Groups. Evol. Bioinform. Online 2016, 12, 59–71. [Google Scholar] [CrossRef] [Green Version]
  69. Zhang, J.; Chi, Y.; Li, S.; Gu, X.; Ye, Y. Cloning, homology modeling, heterologous expression and bioinformatic analysis of Ure2pA glutathione S-transferase gene from white rot fungus Trametes gibbosa. Biotechnol. Biotechnol. Equip. 2021, 35, 1560–1573. [Google Scholar] [CrossRef]
  70. Calmes, B.; Morel-Rouhier, M.; Bataillé-Simoneau, N.; Gelhaye, E.; Guillemette, T.; Simoneau, P.; Simoneau, P. Characterization of glutathione transferases involved in the pathogenicity of Alternaria brassicicola. BMC Microbiol. 2015, 15, 123. [Google Scholar] [CrossRef] [Green Version]
  71. Imai, S.-I.; Armstrong, C.M.; Kaeberlein, M.; Guarente, L. Transcriptional silencing and longevity protein Sir2 is an NAD-dependent histone deacetylase. Nature 2000, 403, 795–800. [Google Scholar] [CrossRef] [PubMed]
  72. Vall-llaura, N.; Mir, N.; Garrido, L.; Vived, C.; Cabiscol, E. Redox control of yeast Sir2 activity is involved in acetic acid resistance and longevity. Redox Biol. 2019, 24, 101229. [Google Scholar] [CrossRef] [PubMed]
  73. Lin, W. A trehalose-6-phosphate synthase gene from Phellinus igniarius. J. Chem. Pharm. Res. 2015, 7, 343–347. [Google Scholar]
  74. Vicente, R.L.; Spina, L.; Gómez, J.P.L.; Dejean, S.; Parrou, J.-L.; François, J.M. Trehalose-6-phosphate promotes fermentation and glucose repression in Saccharomyces cerevisiae. Microb. Cell 2018, 5, 444–459. [Google Scholar] [CrossRef]
  75. Maddi, A.; Dettman, A.; Fu, C.; Seiler, S.; Free, S.J.; Zhou, R. WSC-1 and HAM-7 Are MAK-1 MAP Kinase Pathway Sensors Required for Cell Wall Integrity and Hyphal Fusion in Neurospora crassa. PLoS ONE 2012, 7, e42374. [Google Scholar] [CrossRef] [Green Version]
  76. Tong, S.; Chen, Y.; Zhu, J.; Ying, S.; Feng, M. Subcellular localization of five singular WSC domain-containing proteins and their roles in Beauveria bassiana responses to stress cues and metal ions. Environ. Microbiol. Rep. 2016, 8, 295–304. [Google Scholar] [CrossRef]
  77. Dobrowolski, A.; Mirończuk, A.M. The influence of transketolase on lipid biosynthesis in the yeast Yarrowia lipolytica. Microb. Cell Factories 2020, 19, 138. [Google Scholar] [CrossRef]
  78. Iwata, H.; Kobayashi, Y.; Mizushima, D.; Watanabe, T.; Ogihara, J.; Kasumi, T. Complementary function of two transketolase isoforms from Moniliella megachiliensis in relation to stress response. AMB Express 2017, 7, 45. [Google Scholar] [CrossRef] [Green Version]
Figure 1. Statistical analysis of DEGs in T. harzianum T4 at different growth stages (12, 24, 48 and 72 h) in the presence of BCCW. (A) Venn diagram of DEGs. (B) Numbers of upregulated and downregulated DEGs.
Jof 09 00324 g001
Figure 2. GO functional categories of all DEGs in T. harzianum T4 grown for (A) 12 h, (B) 24 h, (C) 48 h and (D) 72 h in the presence of BCCW.
Jof 09 00324 g002
Figure 3. GO enrichment analysis bubble diagram showing all upregulated DEGs in T. harzianum T4 grown for 12 h (A), 24 h (B), 48 h (C), and 72 h (D) in the presence of BCCW. The ordinate represents the GO classification description, and the abscissa rich factor represents the ratio of differentially expressed genes of this term to all genes that were annotated in the term.
Jof 09 00324 g003
Figure 4. Bubble diagram of KEGG pathways of upregulated DEGs in T. harzianum T4 grown for (A) 12 h, (B) 24 h, (C) 48 h and (D) 72 h in the presence of BCCW.
Jof 09 00324 g004
Figure 5. Heatmap of the DEGs involved in (A) signal transduction and kinase activity; (B) carbohydrate activity enzymes; (C) transmembrane transport and transporter; and (D) antioxidant proteins in T. harzianum T4 samples treated with BCCW at different time points (12, 24, 48 and 72 h).
Jof 09 00324 g005
Figure 6. (A) Summary of DEGs of CAZymes in T. harzianum T4 grown for 12, 24, 48 and 72 h in the presence of BCCW. (B) Summary of upregulated and downregulated DEGs of CAZymes. GH, AA, CBM, CE, GT and PL represent glycoside hydrolase, auxiliary activity, carbohydrate-binding module, carbohydrate esterase, glycosyltransferase and polysaccharide lyase, respectively.
Jof 09 00324 g006
Figure 7. Comparison of RNA-Seq and real-time RT-PCR analysis. The relative expression levels of 12 single genes of T. harzianum T4 when treated with BCCW for different times (12, 24, 48 and 72 h) were compared with RNA-Seq in pairs. The histograms represent the relative expression level (log2FC) assessed by RNA-Seq. The black dotted lines indicate the relative expression level (2−ΔΔCt). The error bars represent the standard deviation of three duplicates.
Jof 09 00324 g007
Figure 8. Differential expression and quantitative analysis of 24 genes related to mycoparasitism from the dual-culture direct confrontation experiment. BC: before contact, C: contact, AC: after contact. (A) Expression analysis of guanine nucleotide-binding protein gamma subunit 1, HAL protein kinase, phosphorelay intermediate protein, 6-phosphofructo-2-kinase, hexokinase and glutathione S-transferase. (B) Expression analysis of glucan endo-1,3-beta-glucosidase, murein transglycosylase, beta-glucosidase, glucan endo-1,3-beta-glucosidase, exo-beta-1,3-glucanase and endochitinase. (C) Expression analysis of nitrilase, lysine-specific histone demethylase 1, peptide chain release factor 1, acid phosphatase, peroxidase and lutamate/leucine/phenylalanine/valine dehydrogenase. (D) Expression analysis of glutamate synthase precursor, mannitol-1-phosphate dehydrogenase, trehalose 6-phosphate synthase, delta-aminolevulinic acid dehydratase, pyruvate decarboxylase and leucine-2. * p < 0.05, ** p < 0.01, *** p < 0.001, **** p < 0.0001.
Jof 09 00324 g008
Table 1. Primer design for RT-qPCR validation experiments in T. harzianum T4.
Putative FunctionGene NamePrimers for qPCR (5′ to 3′)
ForwardReverse
Glucan endo-1,3-beta-glucosidasebgn13.1CAGCAGTAGCAATGAATGTAAGGAAGTCCTCAGCGATGTG
Cytochrome P450 55A1CYP55A2CATTGCCAGTTCCATCATCTTCCGTTGGTTCGTATG
D-lactate dehydrogenaseDLD1GGACAGCATCAACCAGACCCGACCAGAGCGTATGAG
4-aminobutyrate aminotransferase gatATGACTTCTCCTCCTGACATTGTTGAACTGGCGGTAAG
Pyruvate decarboxylasepdcAACAACGACATCTCTAACTGATTCCTCCTTGGTCTTGA
Glyceraldehyde-3-phosphate dehydrogenase gpd1GTCTTGGTTGTCGCTGAGCCCTTGTCCTTCCTCTGG
Aspartyl-tRNA synthetaseDPS1TGCTGTTTCTTCGGATGACTTTCCAGATTCCCACAATAG
Sedoheptulose-1,7-bisphosphatase E3.1.3.37AGACACATGACCGAGTTCAATAGCACGCCTTCCAATA
Mutanase precursorPc12g07500CCGCCAATGTTGCTATTCGGATCATAGTCTGCCGAGCTGC
Glucan endo-1,3-beta-glucosidaseeglCCGGCACTCTGGTCAACTACAAAGGGTATGTGTCCATGCCG
PeroxidasePRX1CGACAACTGGGTCGTCTTCTATCCAGCCATTGTGGGAGTC
Acid phosphataseaphAGCGAATCCTCCGTTCTGGTTGCAAAGTCCGTTTCCGTGTC
HAL protein kinaseSAT4GCTGCAGATGCTCAACCCTATTGCCGCCGTAATCCTTCTT
Guanine nucleotide-binding protein gamma subunit 1gng-1ACTACGCGAGGATTTGGACCCTTTGGCACGGTTCCCCATA
Nitrilaseblr3397AAGTGAGGCATGGACGAAGGTTCGTGATTGCTCTTCCCCC
Glutathione S-transferaseGST, gstGCATCAGTAAGTTTGGCGGCCGGTCAATGTACTCTCCCGC
Murein transglycosylasebtgCGAGAGCGAACCTCTCGATGGGAGGTTGATGCTGGTCGTGA
Exo-beta-1,3-glucanaseEXG1CGCGGTCTGTTGGTTGAAAGCTGGAATTGGGTTGCGTTGG
Glutamate/leucine/phenylalanine/valine dehydrogenaseGDH2GGGATACCGTGTGCAGTTCATCTCGTTGTCAGACTTGCCC
Endochitinase 42chit46CAGACGGCACAGTTGTCTCTCAGAGGGGAAGTTGGTGGAC
Beta-glucosidasebglAGACACTGCGATCCAGAACCAGTAACCCTCACCACTGTCCG
HexokinaseglkACGCTAGATCGAGACAGCGTTGACCAGTCATTGGTGCTGGA
Aspyridones efflux proteinapdFCACAACGAGTGTCTCGACCAGACATGTTGGCAATCGTCGG
Leucine-2LEUAAAGCTGTCCGAGTACACTGCGCATGCCGGTTGAATCACTC
Lysine-specific histone demethylase 1VPS33TCGGAGAAAGCGGATGCAATAAGAAGCGTCCCCGATTTGT
Osomolarity two-component system, phosphorelay intermediate protein YPD1mpr1TAAAGGTCCGAGACGGTTGCAGACTTGACTGCTGTGAGCG
Trehalose 6-phosphate synthaseTPS2ATGGCATGAACACGACCAGTGGATTGCATCGCGGAGACTA
Delta-aminolevulinic acid dehydrataseHEM2TGTCTGTGCCGCAGTACTAATGTCAGAGTAGATGCCGGGAG
Glutamate synthase precursorglt1AATGGGCTGCTTGCCAAATGGAGGCGCAAATGATTCGGTC
6-phosphofructo-2-kinasePFK26ATTGAGCGCATCACTGACCAAATGCCATAAGGCTTGGGCT
Pyruvate decarboxylasepdcACAAGTACCTCCGAGCTGCAACTCTTCGTTGACAGCACCCT
Mannitol-1-phosphate dehydrogenasemtlDGCAACCCTCACCTGGAAGACCTGGAAGCGGAACGTCATCT
18s rRNA18s rRNACAACCATAAACGATGCCGAAGCCTTGCGACCATACTCC
α-tubulinα-tubulinTATCTGCTACCAGGCTCCCGAGAATGGTGTTGGACAGCATGCAGACAG
Table 2. Significantly enriched KEGG pathways (q ≤ 0.05) of DEGs in T. harzianum T4 grown for 12, 24, 48 and 72 h in the presence of BCCW.
Culture TimeRegulatedPathway Hierarchy1Pathway Hierarchy2KEGG PathwayPathway IDGene NumberBackground Numberq-Value
12 hUpMetabolismEnergy metabolismCarbon fixation in photosynthetic organismsko0071011271.46 × 10−4
MetabolismOverviewBiosynthesis of amino acidsko01230261434.15 × 10−4
MetabolismCarbohydrate metabolismGlycolysis/Gluconeogenesisko0001013489.70 × 10−4
MetabolismOverviewCarbon metabolismko01200231311.36 × 10−3
DownCellular processesTransport and catabolismPeroxisomeko0414620531.66 × 10−11
MetabolismAmino acid metabolismValine, leucine and isoleucine degradationko0028014446.14 × 10−7
MetabolismLipid metabolismFatty acid degradationko000718281.65 × 10−3
MetabolismLipid metabolismPrimary bile acid biosynthesisko00120332.86 × 10−3
MetabolismXenobiotics biodegradation and metabolismBenzoate degradationko003625112.86 × 10−3
MetabolismCarbohydrate metabolismPropanoate metabolismko006407298.06 × 10−3
MetabolismAmino acid metabolismPhenylalanine metabolismko003607383.82 × 10−2
24 hUpMetabolismCarbohydrate metabolismStarch and sucrose metabolismko005005492.12 × 10−2
MetabolismCarbohydrate metabolismAmino sugar and nucleotide sugar metabolismko005205633.41 × 10−2
DownMetabolismAmino acid metabolismValine, leucine and isoleucine degradationko0028011448.28 × 10−11
MetabolismCarbohydrate metabolismPropanoate metabolismko006405296.10 × 10−4
MetabolismMetabolism of other amino acidsTaurine and hypotaurine metabolismko004303103.77 × 10−3
MetabolismLipid metabolismFatty acid degradationko000714283.78 × 10−3
MetabolismXenobiotics biodegradation and metabolismBenzoate degradationko003623113.78 × 10−3
MetabolismAmino acid metabolismTryptophan metabolismko003805595.59 × 10−3
MetabolismAmino acid metabolismTyrosine metabolismko003504335.59 × 10−3
MetabolismXenobiotics biodegradation and metabolismAminobenzoate degradationko006274387.79 × 10−3
MetabolismLipid metabolismSynthesis and degradation of ketone bodiesko00072261.38 × 10−2
MetabolismAmino acid metabolismArginine biosynthesisko002203251.90 × 10−2
MetabolismXenobiotics biodegradation and metabolismStyrene degradationko006433272.16 × 10−2
48 hUpMetabolismCarbohydrate metabolismStarch and sucrose metabolismko005006491.75 × 10−3
DownMetabolismBiosynthesis of other secondary metabolitesIsoquinoline alkaloid biosynthesisko009503112.63 × 10−3
MetabolismAmino acid metabolismPhenylalanine metabolismko003604383.32 × 10−3
MetabolismAmino acid metabolismGlycine, serine and threonine metabolismko002604464.71 × 10−3
MetabolismAmino acid metabolismTryptophan metabolismko003804599.24 × 10−3
MetabolismAmino acid metabolismTyrosine metabolismko003503331.31 × 10−2
MetabolismBiosynthesis of other secondary metabolitesTropane, piperidine and pyridine alkaloid biosynthesisko00960281.31 × 10−2
72 hUpMetabolismAmino acid metabolismValine, leucine and isoleucine degradationko002808445.56 × 10−3
Genetic information processingTranslationRibosomeko03010111021.63 × 10−2
DownMetabolismLipid metabolismFatty acid degradationko000718282.43 × 10−5
Cellular processesTransport and catabolismPeroxisomeko041469532.44 × 10−4
MetabolismAmino acid metabolismTryptophan metabolismko003808593.03 × 10−3
MetabolismOverviewFatty acid metabolismko012126344.03 × 10−3
MetabolismMetabolism of terpenoids and polyketidesGeraniol degradationko00281244.42 × 10−2
MetabolismXenobiotics biodegradation and metabolismDioxin degradationko006213134.42 × 10−2
MetabolismXenobiotics biodegradation and metabolismPolycyclic aromatic hydrocarbon degradationko006243134.42 × 10−2
Organismal SystemsEndocrine systemAdipocytokine signaling pathwayko049203134.42 × 10−2
MetabolismAmino acid metabolismValine, leucine and isoleucine degradationko002805444.52 × 10−2
MetabolismCarbohydrate metabolismAmino sugar and nucleotide sugar metabolismko005206634.52 × 10−2
Table 3. Log2 fold change of the top 10 DEGs in T. harzianum T4 treated with BCCW at 12, 24, 48 and 72 h.
Times of InductionGene IDGene NamePutative FunctionLog2FC
12 hScaffold2.g181noxASuperoxide-generating NADPH oxidase heavy chain subunit A9.14901
Scaffold26.g60pha2Prephenate dehydratase8.255327
Scaffold3.g212QPCTGlutaminyl-peptide cyclotransferase7.622853
Scaffold12.g184SPAC513.07NAD-dependent epimerase/dehydratase7.52363
Novel.3896ALDH6A1Methylmalonate-semialdehyde dehydrogenase, mitochondrial precursor6.657672
Novel.5121bgn13.1Endo-1,3(4)-beta-glucanase5.17254
Scaffold9.g19AIFM2Apoptosis-inducing factor4.56581
Scaffold4.g409FUB8Noncanonical nonribosomal peptide synthetase4.510308
Scaffold1.g129abf1Alpha-L-arabinofuranosidase B4.219728
Scaffold24.g41glcAGlucan endo-1,3-beta-glucosidase4.149159
24 hScaffold23.g56 WSC domain-containing protein6.121065
Scaffold41.g30neg-1Endo-1,6-beta-D-glucanase4.952524
Novel.5121bgn13.1Endo-1,3(4)-beta-glucanase4.795401
Novel.5464ARB_02077Glucan endo-1,3-beta-glucosidase3.911272
Scaffold11.g98cel3ABeta-glucosidase3.879044
Scaffold12.g101eng2Endo-1,3(4)-beta-glucanase3.805877
Scaffold12.g245prb1Subtilase3.391825
Scaffold18.g111mfnAL-aspartate decarboxylase3.217549
Scaffold7.g216YEL023CUncharacterized protein3.112885
Scaffold45.g14chi2Endochitinase2.711266
48 hScaffold23.g56 WSC domain-containing protein5.267517
Novel.5121bgn13.1Endo-1,3(4)-beta-glucanase4.572012
Scaffold12.g245prb1Subtilase3.663304
Scaffold41.g30neg-1Endo-1,6-beta-D-glucanase3.622379
Scaffold31.g82CUTACutinase3.521937
Scaffold3.g450arsHNADPH-dependent FMN reductase3.228058
Scaffold11.g98cel3ABeta-glucosidase3.177845
Scaffold8.g89gatA4-aminobutyrate aminotransferase2.890697
Scaffold10.g25YLL056CUncharacterized protein2.857343
Scaffold9.g58apdFAspyridones efflux protein2.820267
72 hScaffold4.g229rpl-360S ribosomal protein L312.9414
Novel.8070FRE7Ferric/cupric reductase transmembrane component 78.43363
Scaffold23.g56 WSC domain-containing protein4.991655
Scaffold65.g8hpcH4-hydroxy-2-oxo-heptane-1,7-dioate aldolase4.481846
Novel.5121bgn13.1Endo-1,3(4)-beta-glucanase4.327306
Scaffold8.g89gatA4-aminobutyrate aminotransferase4.17367
Scaffold5.g281gpd1Glyceraldehyde-3-phosphate dehydrogenase4.130136
Scaffold9.g58apdFAspyridones efflux protein4.031324
Novel.7601SPAC5H10.01Hydro-lyase C5H10.013.735899
Scaffold6.g107liuE3-hydroxy-3-isohexenylglutaryl-CoA/hydroxy-methylglutaryl-CoA lyase3.61478
Disclaimer/Publisher’s Note: The statements, opinions and data contained in all publications are solely those of the individual author(s) and contributor(s) and not of MDPI and/or the editor(s). MDPI and/or the editor(s) disclaim responsibility for any injury to people or property resulting from any ideas, methods, instructions or products referred to in the content.

