Article

Inter-Otolith Differences in Strontium Markings: A Case Study on the Juvenile Crucian Carp Carassius carassius (Linnaeus, 1758)

1
Wuxi Fisheries College, Nanjing Agricultural University, Wuxi 214081, China
2
Laboratory of Fishery Microchemistry, Freshwater Fisheries Research Center, Chinese Academy of Fishery Sciences, Wuxi 214081, China
3
Department of Biology, Missouri State University, Springfield, MO 65897, USA
*
Author to whom correspondence should be addressed.
Fishes 2022, 7(3), 112; https://doi.org/10.3390/fishes7030112
Submission received: 15 April 2022 / Revised: 6 May 2022 / Accepted: 10 May 2022 / Published: 15 May 2022
(This article belongs to the Special Issue Otoliths and Their Applications in Fishery Science)

Abstract

:
The release of hatchery-reared fish fry for restocking is important for the enrichment of fishery resources; however, the effective evaluation of the success rate of marking such fish is challenging. We exposed juvenile crucian carp (Carassius carassius) to a single concentration of SrCl2·6H2O for 5 d and evaluated the efficiency of Sr marking of the fish otoliths (sagittae, asterisci, and lapilli) using an electron probe micro-analyzer. Sr marking signatures formed a peak in all otolith types, with a marking success rate of 100%. The ratio of Sr to Ca in the lapilli and sagittae was higher than that in the asterisci. It took 2 d from the beginning of immersion to the deposition of Sr on the lapilli and sagittae, and the time delay for asterisci was 1 d. For the lapilli and sagittae, it took 16 d to terminate Sr marking and fully recover to the pre-marking Sr level, whereas it was 12 d for the asterisci. The application of the Sr dose had no effect on the survival or growth of the carp. This study demonstrated that the lapilli are the most suitable otolith type for Sr marking observations in crucian carp and provides a theoretical basis and technical support for carp restocking using the Sr marking approach.

Graphical Abstract

1. Introduction

The decline in fishery resources is a global problem that has driven a high demand for restocking using hatchery-reared larvae and juveniles to supplement wild fish populations [1]. The compensatory recruitment of aquatic organisms is a critical approach to enriching fishery resources, protecting biodiversity, maintaining aquatic ecosystem balances, and improving water quality. Hatchery fish (e.g., salmon) have been released in numbers as high as several million to several billion individuals in some countries around the Pacific Ocean [2]. In China, approximately 150 billion commercial and endangered aquatic organisms (e.g., Cypriniformes, Acipenseriformes, and Pleuronectiformes fish) were released for restocking from 2016 to 2020. To measure the success of restocking efforts in addressing decreasing populations, hatchery-reared individuals must be distinguishable from naturally spawned fish, potentially for many years after compensatory recruitment. Scientifically marking and effectively evaluating the mark–recapture efficiency are still key technical difficulties in the validation of restocking performance worldwide [1].
Fish otoliths are widely used to reveal biological and ecological patterns related to movement and habitat use [3,4,5,6]. Salinity, temperature, and ambient trace element concentrations are physicochemical factors that affect otolith chemical composition [7,8,9,10]. As the elements in the otolith are not reabsorbed, the otolith forms a permanent record of the chemical environment to which a fish has been exposed throughout its life, known as the otolith chemical signature [7]. Otolith microchemistry can provide detailed life history information and be used to identify fish from different spawning sites [11,12]. Moreover, it is a potential tool for stock identification [13]. Marking can occur naturally [14,15] or via the deliberate manipulation of specific chemicals to create recognizable signatures in the hard structures of fish, especially the otoliths [16]. Therefore, otolith marking using chemicals, including tetracycline hydrochloride [17], oxytetracycline [18], calcein [19], alizarin complexone [20], alizarin red S [21,22], strontium chloride (SrCl2) [17], enriched stable isotopes of barium (Ba) and strontium (Sr) [23,24], and lanthanide elements [25], is believed to be one of the most useful methods for evaluating the effects of mark–recapture. Strontium marking is considered the most suitable method for creating a single mark in the otolith of fish [1].
To the best of our knowledge, most marking studies have focused on a specific pair of otoliths. Notably, the different types of otoliths have potential uses for different research purposes. Specifically, asterisci, the largest of the three pairs of otoliths in cyprinid fish, have usually been used for age determination [26,27]; the lapilli are reported to be superior to the other otoliths for the daily aging of cyprinid species owing to their well-defined daily increment structure [28], and the sagittae are usually used as the experimental materials in migratory fish studies to assess stock connectivity [29,30] and determine movements and life-history patterns [31]. Only one study has used all three types of otoliths to investigate otolith biometry–body length relationships in four fish species [32], and no studies have examined the exact differences among the three types of otoliths (sagittae, asterisci, and lapilli) or evaluated the differences in Sr marking efficiencies among them. To fill this gap, the present study assessed otolith Sr marks in a typical cyprinid fish, crucian carp Carassius carassius (Linnaeus, 1758). The objectives of this study were to explore the influence of marking on the growth and survival of the experimental fish, analyze the differences in marking effects among the lapilli, asterisci, and sagittae in this carp species; determine the optimal otolith type for Sr marking, and investigate the feasibility and operability of this technology for teleostean fish.

2. Materials and Methods

2.1. Experimental Materials

The study was carried out at the Southern District Aquaculture Base of the Freshwater Fisheries Research Center of the Chinese Academy of Fishery Sciences in Wuxi City, Jiangsu Province, China. The fish used in the experiments were healthy juvenile C. carassius (Figure 1), artificially bred at the aforementioned aquaculture base. In this experiment, we randomly selected 20 fish for each of the marking and control groups. The SrCl2·6H2O compound (analytical reagent grade) was purchased from Shanghai Fusheng Industrial Co., Ltd. (Shanghai, China). An aqueous solution of 60 mg L−1 (i.e., Sr2+ nominal concentration of 19.85 mg L−1) was prepared, with tap water aeration applied for more than 48 h, as a backup. The exact Sr2+ content, measured using an inductively coupled plasma mass spectrometer (Agilent 7500ce, Agilent, Santa Clara, CA, USA), was 19.20 mg L−1, almost the same as the nominal Sr2+ concentration in the solution.
The study was divided into three experimental phases as follows: the temporary feeding phase, the Sr immersion marking phase, and the post-marking culture phase. All experiments were carried out in an immersion exposure system. Experimental fish, which were approximately 90-days-old, were cultured in one glass aquaria (45 cm width × 100 cm length × 50 cm height) containing aerated water. These fish were kept unfed 24 h prior to the Sr immersion marking phase, randomly divided into two groups, and immersed for 5 d in two special marking glass aquaria (20 cm width × 30 cm length × 30 cm height) containing 10 L of aerated water (the concentration of SrCl2·6H2O was 0 mg L−1 and 60 mg L−1, respectively). In addition, no food was provided throughout the periods of the Sr immersion marking phase. After the immersion was completed, the marked and control fish were randomly placed in two glass aquaria of the same specification (50 cm width × 50 cm length × 40 cm height) with 100 L of aerated water for post-marking culture, and the fish were fed to satiation with commercial pellets of Fish Formula Feed 126, mainly containing ca. 28% crude protein, 15% ash, 12.5% moisture, 12% crude fiber, 3% crude fat, 1.2% lysine, and 0.6% phosphorus (Wuxi Tongwei Biological Technology Co., Ltd., Wuxi, China). Fish were fed twice per day at the same time each day, and feed residues were removed daily from each aquarium. During this period, the water was kept continuously oxygenated under natural light, and the water temperature ranged from 23 to 32 °C. Samples were taken every 5 d, with five fish sampled each time, and the experiment ended after all fish were sampled.

2.2. Extraction and Detection of Otoliths

After measuring the weight (g) and total length (mm) of the sampled fish, sagittae in the cytosacular sac, asterisci in the bottle sac, and lapilli in the elliptical sac were removed under a stereoscopic microscope (NV10, Shanghai Precision Instruments Co., Ltd., Shanghai, China; Figure 1). The otolith was first rinsed with ultrapure water that was purified using an Elga Purelab Water System (CLXXXDIM2, ELGA, High Wycombe, UK) and then dried with 99.7% ethanol. Samples were embedded in Epofix Resin and Epofix Hardener (Epofix, Struers, Rødovre, Denmark). They were grinded with sandpaper (1200 and 2000 meshes) until the core was exposed, followed by polishing the surface of the otolith using an automated polishing machine (LaboPol-35, Struers, Rødovre, Denmark) with a polishing solution (OP-S NonDry, Struers, Rødovre, Denmark). After samples were ultrasonically washed, rinsed with Milli-Q water, and completely dried, otoliths were carbon-coated (36 A and 25 s) with a vacuum coating machine (JEE-420, Electronics Co., Ltd., Tokyo, Japan). Elemental line and surface distributions of Sr on the otoliths were detected using an electron probe micro-analyzer (EPMA, JXA-8100, JEOL Co., Ltd., Tokyo, Japan) following similar analytical methods to Liu et al. [33]. The accelerating voltage and beam current were 15 kV and 2 × 10⁻⁸ A, respectively. The electron beam was focused on a point that was 2 μm in diameter, with measurements spaced at intervals of 4 μm. The Sr and Ca concentrations on the longest axis from the core to the edge of each otolith sample were measured. X-ray intensity maps of Sr contents were developed for each representative otolith with the EPMA, using an accelerating voltage of 15 kV, beam current of 5 × 10⁻⁷ A, counting time of 30 mS, and pixel size of 6 × 6 μm. The electron beam was focused on a point with a diameter of 5 μm. Measurement quality was validated using calcium carbonate (CaCO3) and strontium titanate (SrTiO3) standards purchased from the Chinese Academy of Geological Sciences, Beijing, China. The backscattered electron (BSE) images of otoliths were taken by a Phenom Pure Desktop Scanning Electron Microscope (Pure-SED, Thermo Fisher Scientific, Eindhoven, The Netherlands). The accelerating voltage was 5 kV.

2.3. Data Processing

Statistical analysis of data was performed using Microsoft Excel 2016. The Sr/Ca ratios of different areas on the otoliths are expressed as the mean ± standard deviation. A Mann–Whitney U-test (SPSS 26.0, IBM SPSS Statistics Inc., Chicago, IL, USA) was used to compare the Sr/Ca ratios in the different otoliths in the marked and control groups after post-marking culture, as well as the otoliths in different stages. The significance level of the difference was set at p < 0.05. As the Sr content in otoliths is much lower than the Ca content, the Sr/Ca ratio refers to a standardized ratio, which is Sr/Ca × 103. Different colors in X-ray intensity maps from blue (lowest) to green, yellow, and red (highest) indicate values corresponding to Sr concentrations.

3. Results

3.1. Effect of Sr Marking on the Survival and Growth of Juvenile Crucian Carp

During the 5-d exposure of juvenile crucian carp to Sr, there were no deaths in the marked or control group, indicating that Sr marking had no acute toxicity in the experimental fish. After the post-marking culture for 20 d, there were also no deaths in both groups. There was also no significant difference in the average total length (n = 5) and wet mass (n = 5) between the control group and the marked group (p > 0.05), indicating that Sr marking had no chronic effects on the experimental fish (Figure 2). In summary, Sr marking had no significant effect on the survival and growth of experimental fish within the dose range used in this experiment.

3.2. Otolith Marking

3.2.1. Inter-Otolith Variation in Sr/Ca Ratio

Quantitative line analyses demonstrated that after being soaked in 60 mg/L SrCl2·6H2O for 5 d, Sr-marked peaks were formed on the sagittae, lapilli, and asterisci otoliths of the juvenile crucian carp (Figure 3). However, among the three types of otoliths, there were differences in the results of line distribution. On the fifth day after the resumption of feeding, the Sr/Ca ratio increased in the sagittae, lapilli, and asterisci. During this time, the Sr/Ca ratios of the lapilli and sagittae were far greater than those of the asterisci. By the 10th day after post-marking culture, the Sr/Ca ratio marked peak of the asterisci differed from that of the lapilli and sagittae, with a gradual decline over time. By the 15th day after post-marking culture, the peak value of Sr marking had decreased significantly, gradually approaching the value of the Sr/Ca ratio before the immersion. On the 20th day of post-marking culture, the Sr/Ca ratio of the three types of otoliths returned to values before the Sr immersion.
After 20 d of post-marking culture, the otoliths showed complete dynamic changes from the core to the edge. The change in Sr/Ca was divided into three phases (Figure 3 and Table 1). In each of the three phases, the Sr/Ca ratio of the lapilli and sagittae was significantly different from that of the asterisci (p < 0.05). For the lapilli and sagittae, there was no significant difference in the second phases (p > 0.05) but there was a significant difference in the first and third phases (p < 0.05). In the lapilli and sagittae of every sample, the ratios of Sr/Ca in the first and third phases were significantly different from those in the second phases (p < 0.05), and there was no significant difference between the first and third phases (p > 0.05). However, on the second and third samples of the asterisci, the Sr/Ca ratios in the three phases were significantly different from each other (p < 0.05), whereas the first and third stages, were not significantly different for most samples (p > 0.05). In addition, the Sr/Ca ratio in the three types of otoliths in the control group remained stable during the post-marking culture for 20 d (Figure 3 and Table 2). The Sr/Ca ratio of the lapilli and sagittae differed significantly from each other (p < 0.05), and both differed significantly from that of the asterisci (p < 0.05).

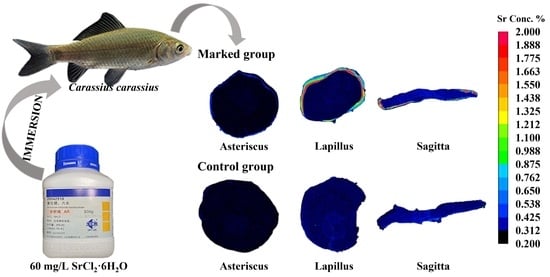
3.2.2. Inter-Otolith Changing of Sr Map Patterns

The surface distribution of the Sr content in the otoliths of juvenile crucian carp was consistent with the line distribution. The different colors presented in the Sr maps corresponded to different ranges of Sr/Ca ratios. The otoliths of fish in the marked group had a low Sr central area surrounded by a high Sr ring; the otoliths of all fish in the control group were always in blue color with a low Sr content from the core to the edge (Figure 4). Therefore, it can be directly observed from the otolith surface distribution that a “Sr-marked area” was produced on the otoliths by the 20th day of post-marking culture, and the blue color, consistent with the formation of the otolith before immersion, was observed outside the marked area. However, the color of the lapilli and sagittae differed from that of the asterisci. Red and yellow-green colors in the marked area can be clearly observed against the background color in the lapilli and sagittae, whereas the dark blue in the marked area of the asterisci was relatively inconspicuous.

3.2.3. Inter-Otolith Time Delay for Sr Marking

By comparing the EPMA maps of Sr and BSE images that included daily increments for the three types of otoliths (Figure 5), where the daily increments were calculated at the edge of the otolith (Figure 6), there was a specific time delay between the beginning of the immersion and the generation of the marking ring in the three types of otoliths; this time delay also existed between the end of immersion and the termination of the marking ring. On the lapilli and sagittae, the Sr signal appeared on the third day of the marking phase and was terminated on the 17th day of post-marking culture. On the asterisci, the Sr signal appeared on the second day of the marking phase and was terminated on the 13th day of post-marking culture. Therefore, in both the lapilli and sagittae, there was a time delay (i.e., time lag) of 2 d between the start of Sr marking and the appearance of the marking signal, whereas there was a 16-d time delay between the end of marking and the termination of the signal. For asterisci, there was a time delay of 1 d between the start of Sr marking and the appearance of the Sr marking signal, whereas there was a 12-d time delay between the end of immersion and the termination of the signal.

4. Discussion

4.1. Selection of Otolith Type for Observation of Sr Marking

When selecting the best otolith type for observation, not only should the marking effect be adequate, but the otolith sample should also be easy to obtain and process. The results of the elemental line and surface mapping of the Sr marks (Figure 3 and Figure 4) showed that a successful marking effect could be achieved in the sagittae, lapilli, and asterisci. However, owing to the morphological characteristics of the sagittae during the growth process, both ends of the otoliths grow forward, and one end becomes extremely slender, similar to those of Opsaridium microcephalum [34]; furthermore, they are fragile when picked, and it is difficult to obtain the entire “horizontal plane” during the polishing process. This leads to difficulties in obtaining a complete “marking ring” owing to the damage to the otolith edge during surface distribution mapping. Compared with the asterisci, the color shown by the concentration of Sr in the marked area on the sagittae is attractive, as with the lapilli.
The peak value of the Sr mark for the asterisci was far lower than that for the sagittae and the lapilli in the line distribution (Figure 3), and the Sr concentration in the marked area appeared to be a dark-blue color, which is different from the color in the sagittae and lapilli. The width of the “Sr mark areas” was narrow; thus, the marked area was more indistinguishable than that of the lapilli and sagittae in EPMA maps. However, the asterisci of cyprinid fish are large and easy to remove, and the shape of the growth increment of the otolith is relatively irregular [34].
From both the line and mapping distribution effects of Sr marking (Figure 2 and Figure 3), the marking effect was more obvious for the lapilli than for the asterisci and sagittae. Lapilli are moderate in size and are oval, with regular shapes; hence, they are easy to process [34]. In summary, it would be most suitable and feasible to choose lapilli as the material to observe the Sr marking of juvenile crucian carp in future experiments. Moreover, in previous studies on Hemigrammopetersius barnardi and O. microcephalum, lapilli were concluded to be the most appropriate for the analysis of daily increments [34,35].

4.2. Variations in Sr-Marked Effects among the Three Types of Otoliths

In freshwater, Sr can replace Ca in a CaCO3 matrix, which is similar to Ba, and shows stable characteristics over time [7]. According to the data shown in Table 1, the three pairs of otoliths showed significant increases in Sr, after Sr immersion, even though the level of increase varied among them. Different pairs of otoliths are formed by different CaCO3 polymorph types, namely aragonite, vaterite, and calcite [36], and different polymorph types have varied distribution coefficients. Vaterite typically has lower elemental concentrations than aragonite [37], which might explain why the asterisci (composed mainly of vaterite [7,38]) had lower Sr levels than the sagittae and lapilli (aragonite [38,39]). Similar results were obtained in the determination of strontium element concentrations in the lapilli and asterisci of goldfish (Carassius auratus) [40,41].
In the samples obtained on the 15th day of post-marking culture, when the Sr mark peaks were observed, the sagittae and lapilli were still in the Sr uptake phase. The Sr mark of the asterisci reached its peak and started to gradually decline and return to normal levels. This is probably because otolith biomineralization has been found to be tightly coupled to the metabolic rate [42,43], and it is also possible that different types of otoliths grow at different speeds at certain stages. For example, during the juvenile period, the growth rate of the lapilli and sagittae is lower than that of the asterisci [41]. To fully explain this observation, an in-depth exploration of the crystalline structure and mechanism of element formation of the three types of otoliths in juvenile crucian carp is required.

4.3. Significance of Time Delay to Sr Markings of Otoliths

The deposition of elements into otoliths from the environment is a multi-stage process. The elements are transported from the plasma into the endolymph of the inner ear through ion transport and finally settle on the surface of the otoliths [7]. In this process, there will be a certain time delay from an element entering the fish body to its deposition in the otoliths. Generally, specific time delays occur between the beginning of the immersion and the generation of the marking signals of the three types of otoliths, as well as between the end of immersion and the termination of the marking signals, i.e., the times (e.g., date) are not equal to each other for the former and latter. Brown and Harris used exogenous Sr to immerse golden perch and found that the Sr marking could not be detected until the 20th day of post-marking culture [44]. In the Sr marking of Japanese eels, the changes in the Sr/Ca ratio in the otoliths were visible after 10 d, whereas the complete deposition in the otolith required at least 30–60 d [45].
From the findings of previous studies and this study, it can be concluded that there is a time delay in the deposition of environmental elements into the otoliths, which differs among fish species, growth stages, and water environments. For a better understanding of the marking process and to objectively and accurately assess marking effectiveness, otolith sampling should avoid the beginning and end of immersion, because otolith Sr marking may not have started or finished during these periods. The mechanism of this time delay must be studied further in terms of Sr deposition and the otolith structure of different fish species, [38] and combined with basic characteristics of the water environment, such as salinity [46] and temperature [40]. Other biological factors, such as fish genetics, development stage, growth rate, food, and physiological conditions, can also affect the time lag of Sr deposition in otoliths [47]. Future research on the mechanisms of Sr deposition in otoliths among different species will be useful to improve Sr marking methods.

5. Conclusions

This is the first time that 60 mg/L SrCl2·6H2O was used for the immersion of juvenile crucian carp to evaluate the Sr marking among otoliths. Otoliths were collected every 5 d during the 20-d period of post-marking culture for EPMA analysis. Both quantitative line analysis of otoliths and surface distribution detection obtained ideal marking results for the three types of otoliths. Considering the influence of otolith element content and otolith morphology on marker observations, the lapilli provide the best option for detecting Sr-marked juvenile crucian carp. There is a time delay (or time lag) between the timing of the appearance or termination of the Sr marker and the beginning and end of Sr immersion for the three types of otoliths. The experimental protocol can be optimized to determine the optimal immersion concentration and time and elucidate the mechanisms of Sr deposition in a future study.

Author Contributions

Conceptualization, J.Y., Y.Z., T.J. and Q.P.; methodology, Y.Z., T.J., X.C., H.L. and J.Y.; investigation, Y.Z., T.J., X.C., H.L. and J.Y.; resources, Y.Z., T.J. and X.C.; funding acquisition, J.Y.; writing—original draft, Y.Z., T.J., X.C., H.L. and Q.P.; writing—review and editing, J.Y.; supervision, J.Y. All authors have read and agreed to the published version of the manuscript.

Funding

This work was supported by the China Central Governmental Research Institutional Basic Special Research Project from Public Welfare Funds [grant numbers 2021GH08 and 2019JBFM06] and the Agricultural Finance Special Project [grant number CJDC-2017-22].

Institutional Review Board Statement

The study was conducted according to the guidelines of the Declaration of Helsinki and was approved by the Ethics Committee of Animal Care and Use Committee of the Freshwater Fisheries Research Center at the Chinese Academy of Fishery Sciences. The analysis was carried out following the Guidelines for the Care and Use of Laboratory Animals set by the Animal Care and Use Committee of the Freshwater Fisheries Research Center (2003WXEP61). All operations were carried out with field permit no. 20181AC1128.

Data Availability Statement

Data that support the findings of this study are available from the corresponding author upon reasonable request (Y.J.: [email protected]).

Acknowledgments

We thank Junren Xue, Yuhai Hu, and Jing Tang for their technical support in the aquaculture of crucian carp.

Conflicts of Interest

The authors declare no conflict of interest.

References

  1. Warren-Myers, F.; Dempster, T.; Swearer, S.E. Otolith mass marking techniques for aquaculture and restocking: Benefits and limitations. Rev. Fish. Biol. Fish. 2018, 28, 485–501. [Google Scholar] [CrossRef]
  2. Morita, K.; Saito, T.; Miyakoshi, Y.; Fukuwaka, M.-A.; Nagasawa, T.; Kaeriyama, M. A review of Pacific salmon hatchery programmes on Hokkaido Island, Japan. ICES J. Mar. Sci. 2006, 63, 1353–1363. [Google Scholar] [CrossRef] [Green Version]
  3. Avigliano, E.; Martinez, C.F.R.; Volpedo, A.V. Combined use of otolith microchemistry and morphometry as indicators of the habitat of the silverside (Odontesthes bonariensis) in a freshwater–estuarine environment. Fish. Res. 2014, 149, 55–60. [Google Scholar] [CrossRef]
  4. Fowler, A.M.; Smith, S.M.; Booth, D.J.; Stewart, J. Partial migration of grey mullet (Mugil cephalus) on Australia’s east coast revealed by otolith chemistry. Mar. Environ. Res. 2016, 119, 238–244. [Google Scholar] [CrossRef] [PubMed]
  5. Hogan, J.D.; Kozdon, R.; Blum, M.J.; Gilliam, J.F.; Valley, J.W.; Mcintyre, P.B. Reconstructing larval growth and habitat use in an amphidromous goby using otolith increments and microchemistry. J. Fish Biol. 2017, 90, 1338–1355. [Google Scholar] [CrossRef] [PubMed]
  6. Taddese, F.; Reid, M.R.; Closs, G.P. Direct relationship between water and otolith chemistry in juvenile estuarine triplefin Forsterygion nigripenne. Fish. Res. 2019, 211, 32–39. [Google Scholar] [CrossRef]
  7. Campana, S.E. Chemistry and composition of fish otoliths: Pathways, mechanisms and applications. Mar. Ecol. Prog. Ser. 1999, 188, 263–297. [Google Scholar] [CrossRef] [Green Version]
  8. Elsdon, T.S.; Gillanders, B.M. Fish otolith chemistry influenced by exposure to multiple environmental variables. J. Exp. Mar. Biol. Ecol. 2004, 313, 269–284. [Google Scholar] [CrossRef]
  9. Bath Martin, G.; Thorrold, S.R. Temperature and salinity effects on magnesium, manganese, and barium incorporation in otoliths of larval and early juvenile spot Leiostomus xanthurus. Mar. Ecol.-Prog. Ser. 2005, 293, 223–232. [Google Scholar] [CrossRef]
  10. Izzo, C.; Reis-Santos, P.; Gillanders, B.M. Otolith chemistry does not just reflect environmental conditions: A meta-analytic evaluation. Fish. Fish. 2018, 19, 441–454. [Google Scholar] [CrossRef]
  11. Davoren, G.K.; Halden, N.M. Connectivity of capelin (Mallotus villosus) between regions and spawning habitats in Newfoundland inferred from otolith chemistry. Fish. Res. 2014, 159, 95–104. [Google Scholar] [CrossRef]
  12. Crook, D.A.; Gillanders, B.M. Use of otolith chemical signatures to estimate carp recruitment sources in the mid-Murray River, Australia. River Res. Appl. 2006, 22, 871–879. [Google Scholar] [CrossRef]
  13. Avigliano, E.; Carvalho, B.M.D.; Leisen, M.; Romero, R.; Velasco, G.; Vianna, M.; Barra, F.; Volpedo, A.V. Otolith edge fingerprints as approach for stock identification of Genidens barbus. Estuar. Coast Shelf Sci. 2017, 194, 92–96. [Google Scholar] [CrossRef] [Green Version]
  14. Campana, S.E.; Thorrold, S.R. Otoliths, increments, and elements: Keys to a comprehensive understanding of fish populations? Can. J. Fish. Aquat. Sci. 2001, 58, 30–38. [Google Scholar] [CrossRef]
  15. Hayden, T.A.; Limburg, K.E.; Pine, W.E. Using otolith chemistry tags and growth patterns to distinguish movements and provenance of native fish in the Grand Canyon. River Res. Appl. 2013, 29, 1318–1329. [Google Scholar] [CrossRef]
  16. Wickström, H.; Sjöberg, N.B. Traceability of stocked eels—The Swedish approach. Ecol. Freshw. Fish 2014, 23, 33–39. [Google Scholar] [CrossRef]
  17. Stötera, S.; Degen-Smyrek, A.K.; Krumme, U.; Stepputtis, D.; Bauer, R.; Limmer, B.; Hammer, C. Marking otoliths of Baltic cod (Gadus morhua Linnaeus, 1758) with tetracycline and strontium chloride. J. Appl. Ichthyol. 2019, 35, 427–435. [Google Scholar] [CrossRef]
  18. Duffy, W.J.; McBride, R.S.; Hendricks, M.L.; Oliveira, K. Otolith age validation and growth estimation from oxytetracycline-marked and recaptured American shad. Trans. Am. Fish. Soc. 2012, 141, 1664–1671. [Google Scholar] [CrossRef]
  19. Frenkel, V.; Kindschi, G.; Zohar, Y. Noninvasive, mass marking of fish by immersion in calcein: Evaluation of fish size and ultrasound exposure on mark endurance. Aquaculture 2002, 214, 169–183. [Google Scholar] [CrossRef]
  20. Cottingham, A.; Hall, N.G.; Loneragan, N.R.; Jenkins, G.I.; Potter, I.C. Efficacy of restocking an estuarine-resident species demonstrated by long-term monitoring of cultured fish with alizarin complexone-stained otoliths. A case study. Fish. Res. 2020, 227, 105556. [Google Scholar] [CrossRef]
  21. Caraguel, J.-M.; Charrier, F.; Mazel, V.; Feunteun, E. Mass marking of stocked European glass eels (Anguilla anguilla) with alizarin red S. Ecol. Freshw. Fish 2015, 24, 435–442. [Google Scholar] [CrossRef]
  22. Simon, J.; Wickström, H. Long-term retention of alizarin red S marks and coded wire tags in European eels. Fish. Res. 2020, 224, 105453. [Google Scholar] [CrossRef]
  23. Braux, E.D.; Warren-Myers, F.; Dempster, T.; Fjelldal, P.G.; Hansen, T.; Swearer, S.E. Osmotic induction improves batch marking of larval fish otoliths with enriched stable isotopes. ICES J. Mar. Sci. 2014, 71, 2530–2538. [Google Scholar] [CrossRef] [Green Version]
  24. Woodcock, S.H.; Gillanders, B.M.; Munro, A.R.; Crook, D.A.; Sanger, A.C. Determining mark success of 15 combinations of enriched stable isotopes for the batch marking of larval otoliths. N. Am. J. Fish. Manag. 2011, 31, 843–851. [Google Scholar] [CrossRef]
  25. Ennevor, B.C.; Beames, R.M. Use of lanthanide elements to mass mark juvenile salmonids. Can. J. Fish. Aquat. Sci. 1993, 50, 1039–1044. [Google Scholar] [CrossRef]
  26. Brown, P.; Green, C.; Sivakumaran, K.P.; Stoessel, D.; Giles, A. Validating otolith annuli for annual age determination of common carp. Trans. Am. Fish. Soc. 2004, 133, 190–196. [Google Scholar] [CrossRef]
  27. Swanson, R.G.; Gagnon, J.E.; Miller, L.M.; Dauphinais, J.D.; Sorensen, P.W. Otolith microchemistry of common carp reflects capture location and differentiates nurseries in an interconnected lake system of the North American Midwest. N. Am. J. Fish. Manag. 2020, 40, 1100–1118. [Google Scholar] [CrossRef]
  28. Smith, B.b.; Walker, K.F. Validation of the aging of 0+ carp (Cyprinus carpio L.). Mar. Freshw. Res. 2003, 54, 1005–1008. [Google Scholar] [CrossRef]
  29. Pan, X.D.; Ye, Z.J.; Xu, B.D.; Jiang, T.; Yang, J.; Tian, Y.J. Population connectivity in a highly migratory fish, Japanese Spanish mackerel (Scomberomorus niphonius), along the Chinese coast, implications from otolith chemistry. Fish. Res. 2020, 231, 105690. [Google Scholar] [CrossRef]
  30. Santos, R.O.; Schinbeckler, R.; Viadero, N.; Larkin, M.F.; Rennert, J.J.; Shenker, J.M.; Rehage, J.S. Linking bonefish (Albula vulpes) populations to nearshore estuarine habitats using an otolith microchemistry approach. Environ. Biol. Fishes 2019, 102, 267–283. [Google Scholar] [CrossRef]
  31. Yang, J.; Arai, T.; Liu, H.; Miyazaki, N.; Tsukamoto, K. Reconstructing habitat use of Coilia mystus and Coilia ectenes of the Yangtze River estuary, and of Coilia ectenes of Taihu Lake, based on otolith strontium and calcium. J. Fish Biol. 2006, 69, 1120–1135. [Google Scholar] [CrossRef]
  32. Bostanci, D. Otolith biometry-body length relationships in four fish species (chub, pikeperch, crucian carp, and common carp). J. Freshw. Ecol. 2009, 24, 619–624. [Google Scholar] [CrossRef]
  33. Liu, H.; Jiang, T.; Yang, J. Unravelling habitat use of Coilia nasus from the Rokkaku River and Chikugo River estuaries of Japan by otolith strontium and calcium. Acta Oceanol. Sin. 2018, 37, 52–60. [Google Scholar] [CrossRef]
  34. Morioka, S.; Matsumoto, S. Otolith features and utility of lapillus for daily increment analysis in Opsaridium microcephalum (Cyprinidae) juveniles collected from Lake Malawi. Ichthyol. Res. 2003, 50, 82–85. [Google Scholar] [CrossRef]
  35. Morioka, S.; Matsumoto, S.; Kaunda, E. Otolith features and growth of Malawian characid Hemigrammopetersius barnardi from the southwestern coast of Lake Malawi. Ichthyol. Res. 2006, 53, 143–147. [Google Scholar] [CrossRef]
  36. Oliveira, A.M.; Farina, M.; Ludka, I.P.; Kachar, B. Vaterite, calcite, and aragonite in the otoliths of three species of piranha. Naturwissenschaften 1996, 83, 133–135. [Google Scholar] [CrossRef]
  37. Schulz-Mirbach, T.; Ladich, F.; Plath, M.; Heß, M. Enigmatic ear stones: What we know about the functional role and evolution of fish otoliths. Biol. Rev. Camb. Philos. Soc. 2019, 94, 457–482. [Google Scholar] [CrossRef]
  38. Ren, D.; Meyers, M.A.; Zhou, B.; Feng, Q. Comparative study of carp otolith hardness: Lapillus and Asteriscus. Mater. Sci. Eng. C Mater. Biol. Appl. 2013, 33, 1876–1881. [Google Scholar] [CrossRef]
  39. Thomas, O.R.B.; Swearer, S.E.; Kapp, E.A.; Peng, P.; Tonkin-Hill, G.Q.; Papenfuss, A.; Roberts, A.; Bernard, P.; Roberts, B.R. The inner ear proteome of fish. FEBS J. 2019, 286, 66–81. [Google Scholar] [CrossRef]
  40. Mugiya, Y.; Tanaka, S. Incorporation of waterborne strontium into otoliths and its turnover in the goldfish Carassius auratus: Effects of strontium concentrations, temperature, and 17β-estradiol. Fish. Sci. 1995, 61, 29–35. [Google Scholar] [CrossRef] [Green Version]
  41. Mugiya, Y.; Satoh, C. Strontium accumulation in slow-growing otoliths in the goldfish Carassius auratus. Fish. Sci. 1997, 63, 361–364. [Google Scholar] [CrossRef] [Green Version]
  42. Hüssy, K.; Mosegaard, H. Atlantic cod (Gadus morhua) Growth and otolith accretion characteristics modelled in a bioenergetics context. Can. J. Fish. Aquat. Sci. 2004, 61, 1021–1031. [Google Scholar] [CrossRef]
  43. Wright, P.J.; Fallon-Cousins, P.; Armstrong, J.D. The relationship between otolith accretion and resting metabolic rate in juvenile Atlantic salmon during a change in temperature. J. Fish Biol. 2001, 59, 657–666. [Google Scholar] [CrossRef]
  44. Brown, P.; Harris, J.H. Strontium batch marking of golden perch (Macquaria ambigua Richardson) (Percichthyidae) and trout cod (Maccullochella macquariensis) (Cuvier). In Recent Developments in Fish Otolith Research; Secor, D.H., Dean, J.M., Campana, S.E., Eds.; University of South Carolina Press: Columbia, SC, USA, 1995; pp. 693–702. [Google Scholar]
  45. Yokouchi, K.; Fukuda, N.; Shirai, K.; Aoyama, J.; Daverat, F.; Tsukamoto, K. Time lag of the response on the otolith strontium/calcium ratios of the Japanese eel, Anguilla japonica to changes in strontium/calcium ratios of ambient water. Environ. Biol. Fish. 2011, 92, 469–478. [Google Scholar] [CrossRef]
  46. Panfili, J.; Darnaude, A.M.; Vigliola, L.; Jacquart, A.; Labonne, M.; Gilles, S. Experimental evidence of complex relationships between the ambient salinity and the strontium signature of fish otoliths. J. Exp. Mar. Biol. Ecol. 2015, 467, 65–70. [Google Scholar] [CrossRef]
  47. Sturrock, A.M.; Hunter, E.; Milton, J.A.; Johnson, R.C.; Waring, C.P.; Trueman, C.N. Quantifying physiological influences on otolith microchemistry. Methods Ecol. Evol. 2015, 6, 806–816. [Google Scholar] [CrossRef]
Figure 1. The three types of otoliths of juvenile crucian carp.
Fishes 07 00112 g001
Figure 2. Changes in the means and corresponding standard deviations of wet mass and total length of crucian carp in the marked and control groups at different sampling days (n = 5).
Fishes 07 00112 g002
Figure 3. Dynamics of Sr/Ca ratios in the three types of otoliths (lapilli, asterisci, and sagittae) of juvenile crucian carp during 20 d of post-marking culture. Note: in the label for each line, the first numbers 5, 10, 15, and 20 represent that the fish was extracted and euthanized for analysis on the 5th, 10th, 15th, and 20th day after the immersion marking was completed; the second numbers of 1, 2, 3, 4, and 5 represent the code of each sampled fish; and the third character, “L” represents lapilli, “S” represents sagittae, and “A” represents asterisci. The last digit “0” means the control group.
Fishes 07 00112 g003
Figure 4. Typical Sr content maps in three types of otoliths (lapilli, asterisci, and sagittae) of control and marked groups of juvenile crucian carp. Note: The color from blue to red indicates a gradual increase in Sr content of otoliths.
Fishes 07 00112 g004
Figure 5. Typical Sr content maps and backscattered electron image of the three types of otoliths (lapilli, asterisci, and sagittae) of juvenile crucian carp on the 20th day of post-marking culture. Note: the color from blue to red indicates a gradual increase in the Sr/Ca ratio of otoliths, the white arrows indicate the region from the core to the edge of the otolith, and the white box contains the growth area of the fish otoliths during the post-marking culture phase.
Fishes 07 00112 g005
Figure 6. Time delay between the appearance and termination of Sr marks in three types of otoliths (lapilli, asterisci, and sagittae) of juvenile crucian carp. Note: the color from blue to red indicates a gradual increase in the Sr/Ca ratio of otoliths. The length of the yellow line segment indicates that the Sr/Ca ratio was still in the normal level of the otolith growth range after the start of the Sr-immersed marking. The length of the black line indicates the growth range of otoliths when the Sr/Ca ratio was higher than the normal level. The length of the white line in the figure indicates the growth range of otoliths when the Sr/Ca ratio returned to a normal level after a high value.
Fishes 07 00112 g006
Table 1. Inter-otolith microchemical phases of the Sr/Ca ratio for marked juvenile crucian carps at 20 d of post-marking culture.
Sample CordFirst PhaseSecond PhaseThird Phase
Distance from the Core (μm)Sr/Ca
(Mean ± SD)
Distance from the Core (μm)Sr/Ca
(Mean ± SD)
Distance from the Core (μm)Sr/Ca
(Mean ± SD)
20-1-L0–4063.03 ± 0.59 b408-42637.65 ± 16.30 a428–4402.92 ± 0.31 b
20-2-L0–4403.09 ± 0.56 b442–45832.12 ± 22.61 a460–4743.18 ± 0.64 b
20-3-L0–3643.01 ± 0.67 b366–38438.74 ± 21.75 a386–3962.71 ± 0.54 b
20-4-L0–4023.04 ± 0.67 b404–42238.46 ± 21.89 a424–4323.23 ± 0.55 b
20-5-L0–3843.09 ± 0.62 b386–40832.26 ± 21.06 a410–4223.01 ± 0.35 b
Average-3.05 ± 0.04 B-35.85 ± 3.36 A-3.01 ± 0.21 B
20-1-S0–3583.78 ± 0.57 b360–37838.23 ± 21.54 a380–3863.66 ± 0.23 b
20-2-S0–3403.80 ± 0.52 b342–35639.06 ± 27.51 a358–3644.01 ± 0.46 b
20-3-S0–2863.82 ± 0.57 b288–30241.64 ± 23.74 a304–3123.89 ± 0.93 b
20-4-S0–3703.78 ± 0.54 b372–38633.02 ± 23.17 a388–3944.01 ± 0.36 b
20-5-S0–3383.79 ± 0.62 b340–35036.17 ± 25.03 a352–3603.40 ± 0.22 b
Average-3.79 ± 0.02 A-37.62 ± 3.24 A-3.79 ± 0.06 A
20-1-A0–3821.01 ± 0.41 b384–3928.22 ± 2.72 a394–4021.00 ± 0.79 b
20-2-A0–2961.09 ± 0.59 b298–3266.86 ± 2.66 a328–3461.61 ± 0.64 c
20-3-A0–3841.08 ± 0.43 b386–3929.04 ± 3.05 a394–3961.79 ± 0.04 c
20-4-A0–3201.06 ± 0.58 b322–3267.89 ± 2.81 a328–3301.67 ± 0.51 b
20-5-A0–3861.04 ± 0.28 b388–3949.07 ± 1.89 a396–3981.94 ± 1.63b
Average-1.06 ± 0.03 C-7.95 ± 0.79 B-1.42 ± 0.38 C
Note: The Sr/Ca ratio refers to a standardized ratio, which is Sr/Ca × 103. In the sample code, the number “20” represents 20 d of post-marking culture was completed; the second number 1, 2, 3, 4, or 5 represents the order of the sample fish; and the third character “L” represents lapilli, “S” represents sagittae, and “A” represents asterisci. In the superscript symbols, lowercase letters “a, b, and c” indicate significant differences among the three phases of the same sample, and uppercase letters “A, B, and C” indicate a comparison of significant differences between different samples at the same stage. Values that do not share a common letter are significantly different.
Table 2. The otolith Sr/Ca ratio of control juvenile crucian carps measured on the same day as marked fish on the 20th day of post-marking culture.
Sample CordDistance from the Core (μm)Sr/Ca (Mean ± SD)
20-1-L-00–4343.18 ± 0.53
20-2-L-00–3983.10 ± 0.50
20-3-L-00–3863.05 ± 0.57
20-4-L-00–4103.12 ± 0.55
20-5-L-00–3703.06 ± 0.50
Average-3.10 ± 0.05 B
20-1-S-00–2683.61 ± 0.71
20-2-S-00–3143.57 ± 0.69
20-3-S-00–3043.61 ± 0.52
20-4-S-00–2783.53 ± 0.52
20-5-S-00–2863.61 ± 0.57
Average-3.59 ± 0.04 A
20-1-A-00–3981.09 ± 0.32
20-2-A-00–3701.12 ± 0.45
20-3-A-00–3801.11 ± 0.37
20-4-A-00–3561.10 ± 0.30
20-5-A-00–4401.09 ± 0.33
Average-1.10 ± 0.01 C
Note: The Sr/Ca ratio refers to a standardized ratio, which is Sr/Ca × 103. In the sample code, the number “20” represents that 20 d of post-marking culture was completed; the second number “1, 2, 3, 4, or 5” represents the order of the sample fish; and the third character “L” represents lapilli, “S” represents sagittae, and “A” represents asterisci. The last digit “0” represents the control group. In the superscript symbols, uppercase letters “A, B, and C” indicate a comparison of significant differences between different samples. Values that do not share a common letter are significantly different.
Publisher’s Note: MDPI stays neutral with regard to jurisdictional claims in published maps and institutional affiliations.

