Portland Neighborhoods by the Numbers 2019: The City
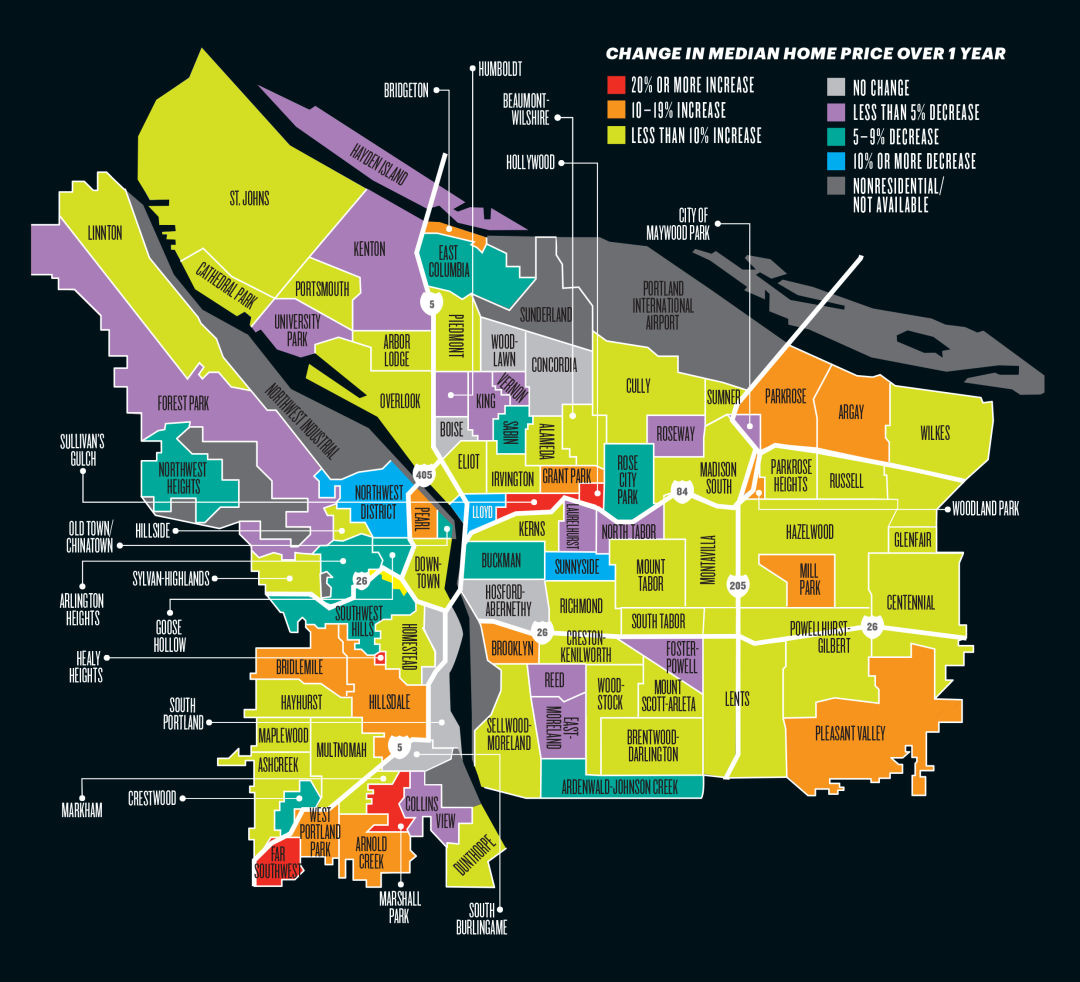
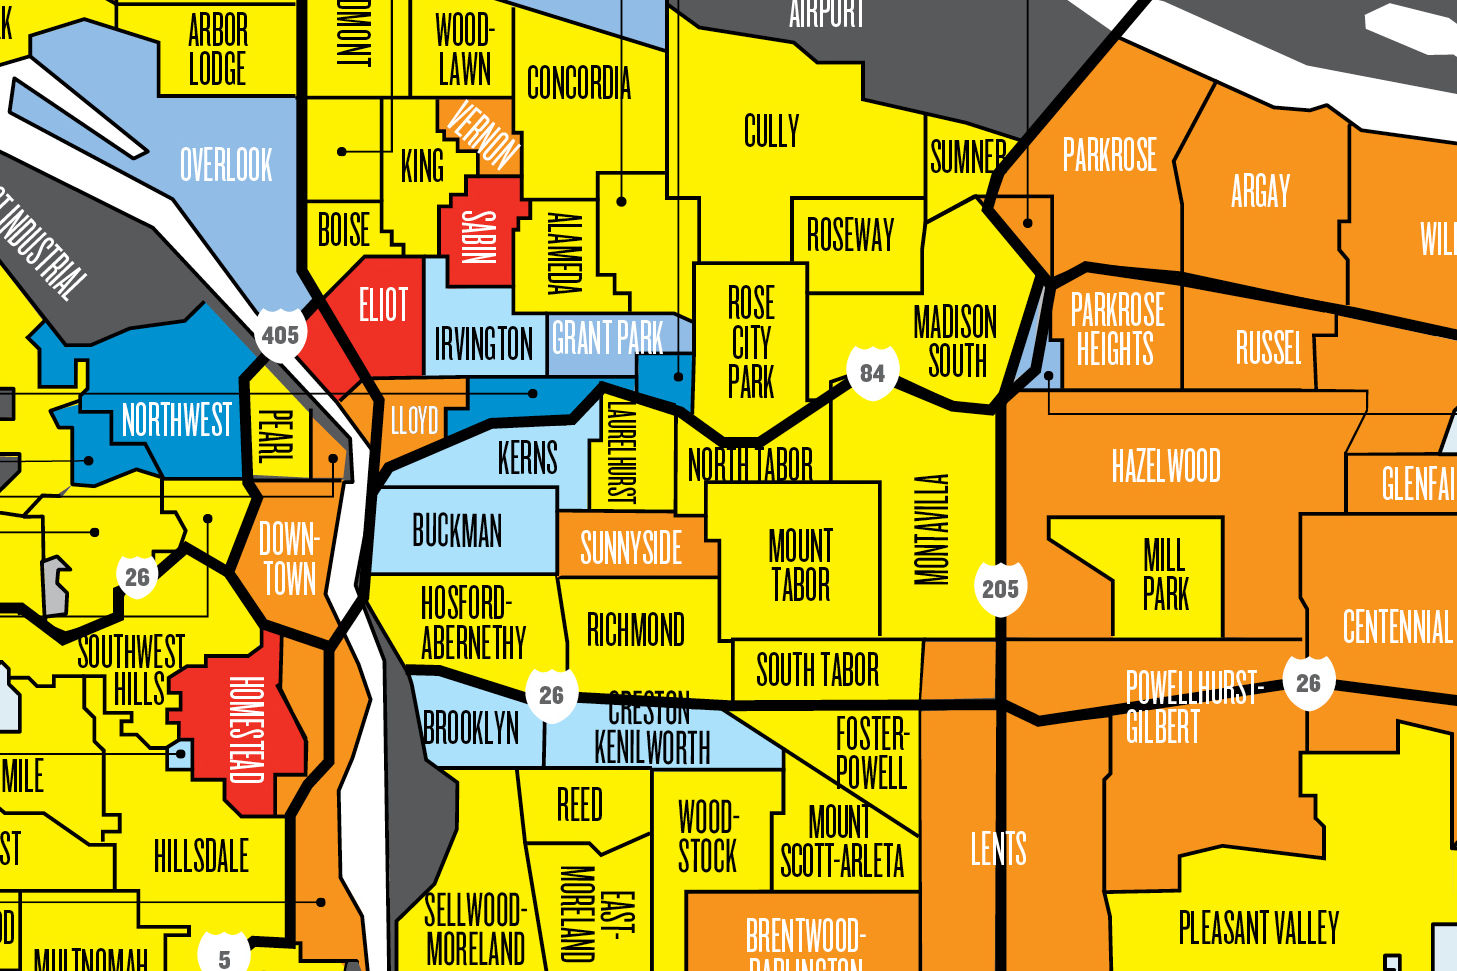
Welcome to our annual reference guide to 125 Portland neighborhoods and suburbs. Last year, after years of double-digit price surges, the real estate fever tapered off a bit. This year? Modest 5 percent growth in the median home sale price across Portland. For more analysis on this year's trends, see our breakdown here.
Click for a full-size version of the above map.
| Neighborhood | Average home sale price ($) | Median home sale price ($) | Average cost per square foot ($) | Days on market (avg.) | Homes sold in 2018 (#) | Condo sales (%) | 1-year median price change (2017–2018) (%) | 5-year median price change (2014–2018) (%) | Distressed property sales (%) | Average year built for sold homes | Adjusted population | Adjusted population density (people per square mile, excluding parks and industrial tracts) | Median age | Median household income ($) | Home ownership (%) | Married (except separated) (%) | Divorced (%) | Widowed (%) | Separated (%) | Never Married (%) | Population with bachelor degree as highest level of education (25 and older) (%) | Population with graduate degree (25 and older) (%) | Renters - median monthly housing expenses ($) | People below federal poverty level (%) | Unemployed (16 years and older) (%) | English as only language (%) | Percent of households with children under 18 years (%) | Population in same house last year (%) | Population in different county last year (%) | Population in different state last year (%) | Population moved from abroad last year (%) | Total Newcomers (%) | Aggravated assault | Arson | Burglary | Homicide | Larceny | Sexual offenses | Robbery | Vehicle thefts | Nonviolent crimes | Violent crimes | Crimes per 1,000 residents | Parks and natural areas (Acres) | Parks (% of neighborhood) | Minutes by car to downtown (est.) | Commute by public transit (%) | Commute by bike (%) | Commute by walking (%) | Commute by biking and walking (%) | Number of Max/streetcar/tram lines | Number of TriMet bus lines | Number of transit lines (bus/MAX/streetcar/tram) | Miles of bike routes (lanes, boulevards, multiuse paths) | Miles of bike routes (all) per square mile | Walk score |
|---|---|---|---|---|---|---|---|---|---|---|---|---|---|---|---|---|---|---|---|---|---|---|---|---|---|---|---|---|---|---|---|---|---|---|---|---|---|---|---|---|---|---|---|---|---|---|---|---|---|---|---|---|---|---|---|---|
| ALAMEDA | 785,713 | 738,000 | 268 | 31 | 81 | 0% | 8% | 26% | 1% | 1932 | 5,641 | 9,544 | 41 | 109,616 | 78.6 | 55.8 | 10.4 | 3.2 | 0.9 | 29.7 | 40 | 33.9 | 1,897 | 6.6 | 3.7 | 92.8 | 36.3 | 84.3 | 1.3 | 5.4 | 0.9 | 7.6 | 18 | 0 | 12 | 0 | 77 | 0 | 2 | 22 | 111 | 20 | 23 | 0 | 0 | 13 | 8.8 | 3.9 | 11 | 14.9 | 0 | 3 | 3 | 1 | 1.2 | 65 |
| ARBOR LODGE | 465,743 | 459,450 | 252 | 28 | 132 | 13% | 1% | 33% | 0% | 1957 | 7,245 | 8,654 | 36 | 75,223 | 68.2 | 47.1 | 10.2 | 2.7 | 1.5 | 38.3 | 33.5 | 18.8 | 1,456 | 9.8 | 5 | 86 | 29.8 | 83.4 | 1.3 | 3 | 0.4 | 4.7 | 50 | 2 | 48 | 0 | 182 | 5 | 12 | 53 | 283 | 69 | 49 | 10 | 2 | 15 | 14.2 | 3.6 | 11.9 | 15.6 | 1 | 4 | 5 | 6 | 7.2 | 72 |
| ARDENWALD-JOHNSON CREEK | 418,640 | 434,500 | 185 | 89 | 10 | 0% | -7% | 34% | 10% | 1941 | 2,015 | 10,273 | 41 | 95,630 | 55.4 | 42.9 | 15.5 | 6.9 | 0.9 | 33.7 | 20.4 | 13 | 1,699 | 10.6 | 2.2 | 89.8 | 29.6 | 83.5 | 9.2 | 3.8 | 0.6 | 13.6 | 10 | 0 | 5 | 0 | 27 | 0 | 1 | 15 | 47 | 11 | 29 | 37 | 17 | 16 | 9.3 | 0.4 | 7.3 | 7.7 | 1 | 5 | 6 | 3 | 7.8 | 54 |
| ARGAY | 391,146 | 399,750 | 168 | 26 | 79 | 5% | 11% | 52% | 0% | 1968 | 6,035 | 6,942 | 40 | 51,990 | 50.9 | 31.3 | 17.2 | 4.3 | 3.5 | 43.7 | 11.8 | 4.3 | 934 | 20.8 | 6.4 | 75.2 | 33.4 | 65.2 | 14.2 | 4.9 | 0.9 | 20 | 59 | 1 | 69 | 0 | 227 | 5 | 11 | 86 | 382 | 76 | 76 | 59 | 5 | 20 | 8.6 | 15.8 | 0.3 | 16.1 | 0 | 5 | 5 | 6 | 2.9 | 45 |
| ARLINGTON HEIGHTS | 1,012,913 | 862,500 | 306 | 49 | 20 | 0% | -6% | 9% | 0% | 1958 | 1,804 | 8,934 | 52 | 113,665 | 78.6 | 61.1 | 12.1 | 6.1 | 0.3 | 20.4 | 39.6 | 44.9 | 2,318 | 3.3 | 1.1 | 87 | 15.8 | 89.5 | 1 | 3.6 | 1.9 | 6.5 | 2 | 0 | 3 | 0 | 50 | 0 | 0 | 0 | 53 | 2 | 30 | 329 | 63 | 14 | 6 | 10.6 | 4.1 | 14.8 | 2 | 4 | 6 | 1 | 1.6 | 40 |
| ARNOLD CREEK | 674,573 | 680,000 | 234 | 44 | 47 | 0% | 16% | 55% | 0% | 1985 | 2,963 | 2,877 | 43 | 134,282 | 90.4 | 66 | 9 | 2.7 | 1.1 | 21.3 | 42.5 | 32.4 | 2,119 | 4.7 | 3.4 | 91.7 | 37.6 | 86 | 5.1 | 1.8 | 0.3 | 7.2 | 1 | 0 | 3 | 0 | 9 | 2 | 1 | 0 | 12 | 4 | 5 | 19 | 3 | 18 | 4.3 | 0.6 | 2.1 | 2.7 | 0 | 1 | 1 | 0 | 0.2 | 17 |
| ASHCREEK | 482,189 | 455,000 | 238 | 29 | 105 | 7% | 3% | 32% | 0% | 1976 | 4,763 | 4,129 | 39 | 92,676 | 80 | 51.1 | 14.9 | 3.1 | 0.7 | 22.6 | 34 | 27.8 | 1,609 | 3.6 | 3.6 | 87.7 | 31.9 | 79.1 | 2 | 3.6 | 0.4 | 6 | 13 | 1 | 6 | 0 | 30 | 3 | 2 | 9 | 45 | 19 | 13 | 11 | 2 | 16 | 4.5 | 0.6 | 0.1 | 0.6 | 0 | 7 | 7 | 2 | 1.5 | 36 |
| BEAUMONT-WILSHIRE | 695,345 | 651,000 | 279 | 34 | 105 | 5% | 9% | 27% | 1% | 1951 | 6,124 | 8,388 | 41 | 112,725 | 85.3 | 56.4 | 8.6 | 3.3 | 1.6 | 30.1 | 36.4 | 30.5 | 1,774 | 5.1 | 3.8 | 89.1 | 35 | 86.6 | 1.2 | 2.4 | 0.1 | 3.6 | 17 | 0 | 18 | 0 | 97 | 2 | 1 | 26 | 141 | 20 | 26 | 14 | 3 | 16 | 5.4 | 4.1 | 8.7 | 12.8 | 0 | 3 | 3 | 4 | 5.7 | 72 |
| BOISE | 556,173 | 508,500 | 290 | 26 | 56 | 7% | 0% | 25% | 0% | 1952 | 4,430 | 12,027 | 34 | 75,505 | 40.1 | 31.1 | 12.2 | 1.6 | 1 | 54.3 | 39 | 23.2 | 1,427 | 15.1 | 4.6 | 88.8 | 19.9 | 76 | 2.2 | 9.6 | 0.5 | 12.3 | 40 | 3 | 24 | 0 | 191 | 3 | 2 | 37 | 252 | 48 | 68 | 5 | 2 | 12 | 10.5 | 6.8 | 16.1 | 22.9 | 1 | 5 | 6 | 2 | 5 | 92 |
| BRENTWOOD/ DARLINGTON | 339,569 | 330,000 | 240 | 33 | 284 | 1% | 4% | 58% | 4% | 1953 | 12,823 | 8,027 | 37 | 59,388 | 67.4 | 39.2 | 17.3 | 3.8 | 2 | 37.6 | 20.6 | 8.8 | 1,289 | 14.9 | 6.8 | 74.9 | 30.4 | 84.8 | 2.5 | 2 | 0.1 | 4.5 | 166 | 3 | 66 | 0 | 274 | 12 | 13 | 85 | 425 | 194 | 48 | 48 | 4 | 21 | 11.7 | 0.4 | 3.2 | 3.6 | 0 | 4 | 4 | 6 | 3.5 | 54 |
| BRIDGETON | 341,372 | 328,000 | 194 | 62 | 29 | 10% | 16% | 30% | 0% | 1987 | 71 | 503 | 40 | 62,263 | 67.2 | 49.5 | 11.5 | 2.1 | 3.7 | 33.1 | 19.5 | 8.2 | 1,356 | 10.4 | 3.9 | 70.7 | 25.7 | 84.9 | 1.7 | 1 | 0.3 | 3 | 15 | 0 | 7 | 0 | 55 | 0 | 3 | 23 | 85 | 18 | 1,461 | 1 | 1 | 16 | 11.2 | 0.7 | 0.5 | 1.2 | 0 | 2 | 2 | 3 | 11.9 | 30 |
| BRIDLEMILE | 718,917 | 658,500 | 255 | 36 | 60 | 0% | 11% | 35% | 0% | 1967 | 4,744 | 4,353 | 46 | 101,363 | 74 | 62 | 10.2 | 5.4 | 1.3 | 20.5 | 30.5 | 43.3 | 1,647 | 6.5 | 5.3 | 86.6 | 34 | 88.2 | 2.9 | 2.9 | 0.7 | 6.6 | 14 | 0 | 5 | 0 | 32 | 2 | 2 | 9 | 46 | 18 | 13 | 32 | 4 | 15 | 4.7 | 2.7 | 2.6 | 5.3 | 0 | 5 | 5 | 2 | 1.9 | 45 |
| BROOKLYN | 479,057 | 492,450 | 230 | 22 | 46 | 0% | 15% | 36% | 0% | 1932 | 7,777 | 11,930 | 38 | 73,644 | 52.3 | 46.3 | 13.4 | 2.4 | 1.8 | 36 | 33.3 | 26.5 | 1,316 | 11.2 | 4.7 | 91.6 | 27.3 | 80.1 | 4.3 | 6.6 | 1.4 | 12.3 | 60 | 0 | 37 | 0 | 175 | 2 | 4 | 36 | 248 | 66 | 40 | 66 | 6 | 10 | 12.2 | 6.1 | 10.9 | 17 | 1 | 8 | 9 | 5 | 2.7 | 79 |
| BUCKMAN | 504,435 | 493,000 | 266 | 47 | 47 | 38% | -5% | 19% | 2% | 1951 | 8,175 | 10,634 | 34 | 39,505 | 12.6 | 20.9 | 13.8 | 2.3 | 2.6 | 60.5 | 39.3 | 17.1 | 1,029 | 25.1 | 7.6 | 90.6 | 6.9 | 66.6 | 6.2 | 8 | 0.4 | 14.6 | 259 | 10 | 97 | 1 | 954 | 12 | 16 | 174 | 1,225 | 298 | 186 | 13 | 2 | 9 | 22.1 | 9 | 14.2 | 23.2 | 2 | 10 | 12 | 10 | 8.4 | 90 |
| CATHEDRAL PARK | 381,330 | 360,000 | 247 | 26 | 87 | 24% | 2% | 38% | 1% | 1964 | 4,915 | 10,655 | 35 | 56,998 | 55.9 | 39.1 | 13 | 3.3 | 1.9 | 42.8 | 30.6 | 19.4 | 1,247 | 16.3 | 4.9 | 83.3 | 24.4 | 84.8 | 0.6 | 5.8 | 0.8 | 7.2 | 47 | 1 | 32 | 0 | 148 | 3 | 5 | 44 | 224 | 56 | 57 | 64 | 10 | 19 | 10.1 | 2.2 | 3.2 | 5.4 | 0 | 4 | 4 | 2 | 2.2 | 79 |
| CENTENNIAL | 296,410 | 300,000 | 202 | 28 | 319 | 10% | 8% | 65% | 5% | 1968 | 24,386 | 8,110 | 34 | 41,036 | 58.1 | 43.9 | 12.6 | 5.7 | 2.3 | 35.5 | 9.2 | 3.1 | 1,103 | 26.9 | 10.9 | 62.3 | 41.1 | 82.8 | 3.5 | 1.3 | 1.4 | 6.2 | 376 | 6 | 147 | 1 | 651 | 29 | 48 | 44 | 842 | 460 | 53 | 80 | 4 | 24 | 10.9 | 1.6 | 1.2 | 2.8 | 0 | 4 | 4 | 7 | 2.2 | 53 |
| COLLINS VIEW | 542,109 | 487,500 | 237 | 56 | 38 | 0% | -3% | 36% | 0% | 1960 | 1,348 | 2,205 | 30 | 111,616 | 81.7 | 43.1 | 7.8 | 2 | 0 | 47.1 | 33.5 | 39.2 | 1,990 | 10.9 | 10.5 | 86.7 | 30.5 | 77 | 3.5 | 11.3 | 1.3 | 16.1 | 6 | 0 | 5 | 0 | 27 | 0 | 0 | 6 | 38 | 6 | 33 | 5 | 1 | 14 | 7.8 | 12.4 | 1.7 | 14.1 | 0 | 4 | 4 | 2 | 1.8 | 26 |
| CONCORDIA | 535,783 | 501,500 | 256 | 31 | 186 | 5% | 0% | 34% | 0% | 1938 | 10,101 | 8,988 | 38 | 92,399 | 76.1 | 45.3 | 10.9 | 2.9 | 1.7 | 39.3 | 35.5 | 23.7 | 1,613 | 7.3 | 5.5 | 92.6 | 30.7 | 85.3 | 1.3 | 5 | 0.7 | 7 | 62 | 0 | 55 | 1 | 181 | 4 | 4 | 77 | 313 | 71 | 38 | 27 | 3 | 17 | 8.5 | 2.2 | 7.5 | 9.7 | 0 | 4 | 4 | 4 | 3.2 | 76 |
| CRESTON-KENILWORTH | 461,199 | 449,500 | 239 | 40 | 126 | 7% | 7% | 34% | 1% | 1936 | 8,481 | 11,318 | 34 | 53,703 | 36.5 | 31.8 | 12.1 | 2.5 | 2 | 51.5 | 33.9 | 17.7 | 1,169 | 20.2 | 7.7 | 88.4 | 19 | 75.6 | 3.7 | 4.6 | 0.4 | 8.7 | 94 | 1 | 64 | 0 | 234 | 7 | 10 | 95 | 393 | 112 | 60 | 23 | 4 | 15 | 20.8 | 3.6 | 7.3 | 10.9 | 0 | 7 | 7 | 4 | 5.1 | 77 |
| CRESTWOOD | 395,118 | 388,500 | 230 | 26 | 34 | 0% | -6% | 25% | 0% | 1969 | 1,449 | 5,774 | 42 | 101,923 | 88.3 | 55.9 | 16.3 | 3.3 | 0.8 | 23.7 | 37 | 30 | 1,771 | 3.6 | 3.6 | 95.3 | 35.4 | 86.2 | 2 | 3.9 | 0.3 | 6.2 | 2 | 0 | 3 | 0 | 8 | 0 | 0 | 1 | 12 | 2 | 10 | 55 | 25 | 14 | 4.5 | 0.5 | 0 | 0.5 | 0 | 4 | 4 | 0 | 0 | 49 |
| CULLY | 391,299 | 382,450 | 244 | 32 | 148 | 5% | 8% | 58% | 2% | 1956 | 13,828 | 7,088 | 36 | 49,135 | 53.8 | 33 | 15.5 | 2.2 | 3.1 | 46.2 | 16.4 | 8 | 1,078 | 28.4 | 7.1 | 68.4 | 33.5 | 72.4 | 9.1 | 3.8 | 0.4 | 13.3 | 169 | 18 | 99 | 0 | 310 | 13 | 14 | 145 | 554 | 214 | 56 | 57 | 3 | 19 | 11.6 | 11.2 | 3.4 | 14.6 | 0 | 5 | 5 | 6 | 2.1 | 56 |
| DOWNTOWN | 504,296 | 425,000 | 429 | 59 | 123 | 100% | 8% | 31% | 0% | 1982 | 11,613 | 15,119 | 40 | 33,634 | 17.3 | 20.7 | 16.4 | 3.3 | 3.7 | 55.9 | 30.4 | 21.4 | 1,082 | 34.5 | 12.1 | 78 | 3.3 | 56.8 | 9.6 | 12.8 | 2.5 | 24.9 | 698 | 18 | 150 | 2 | 1,864 | 47 | 98 | 147 | 2,161 | 863 | 260 | 42 | 7 | 0 | 26.7 | 35.4 | 3.4 | 38.9 | 8 | 32 | 40 | 15 | 15.9 | 95 |
| DUNTHORPE | 1,647,692 | 1,632,000 | 340 | 84 | 29 | 0% | 9% | 43% | 3% | 1963 | 1,836 | 1,775 | 30 | 111,271 | 81.5 | 43 | 7.8 | 2 | 0 | 47.1 | 33.4 | 39.1 | 1,986 | 10.9 | 10.5 | 86.7 | 30.4 | 77 | 3.5 | 11.3 | 1.3 | 16.1 | – | – | – | – | – | – | – | – | — | — | — | 7 | 1 | 18 | 7.8 | 12.4 | 1.7 | 14.1 | 0 | 1 | 1 | 0 | 0.2 | 10 |
| EAST COLUMBIA | 331,090 | 321,000 | 203 | 29 | 21 | 0% | -6% | 69% | 5% | 1977 | 584 | 794 | 40 | 62,103 | 67 | 49.3 | 11.6 | 2.1 | 3.7 | 33.3 | 19.4 | 8.1 | 1,352 | 10.5 | 3.9 | 70.7 | 25.8 | 84.6 | 1.9 | 1 | 0.3 | 3.3 | 58 | 4 | 29 | 0 | 222 | 7 | 9 | 58 | 309 | 78 | 663 | 146 | 10 | 18 | 11.2 | 0.9 | 0.5 | 1.4 | 0 | 2 | 2 | 9 | 3.8 | 24 |
| EASTMORELAND | 780,451 | 739,950 | 263 | 37 | 79 | 0% | -1% | 21% | 0% | 1945 | 6,614 | 9,853 | 38 | 88,698 | 71.5 | 54.7 | 9.2 | 4.5 | 1.2 | 30.5 | 32.2 | 28.2 | 1,685 | 8.7 | 5.4 | 91.3 | 29.4 | 79.8 | 3.4 | 6.7 | 0.8 | 10.8 | 9 | 1 | 10 | 0 | 89 | 1 | 1 | 16 | 115 | 12 | 19 | 17 | 2 | 16 | 8.4 | 7.1 | 6.2 | 13.2 | 1 | 4 | 5 | 3 | 2.3 | 49 |
| ELIOT | 529,537 | 527,623 | 268 | 38 | 52 | 33% | 1% | 42% | 2% | 1964 | 4,141 | 7,553 | 36 | 52,523 | 23.5 | 22.3 | 14.6 | 5.8 | 1.7 | 55.6 | 35.2 | 19.1 | 1,295 | 20.1 | 6.7 | 92 | 11.7 | 73.5 | 4.1 | 7.8 | 0.6 | 12.5 | 153 | 4 | 96 | 0 | 598 | 15 | 20 | 80 | 774 | 192 | 233 | 8 | 1 | 11 | 18.1 | 12.4 | 14.9 | 27.3 | 3 | 7 | 10 | 7 | 8.8 | 84 |
| FAR SOUTHWEST | 525,328 | 530,000 | 226 | 41 | 29 | 0% | 24% | 67% | 0% | 1978 | 2,100 | 5,600 | 46 | 81,583 | 67.9 | 55.9 | 13 | 6.2 | 0.3 | 24.5 | 35.4 | 30.3 | 1,446 | 8.3 | 5.6 | 88.4 | 23.1 | 84.6 | 4.6 | 2.8 | 0.6 | 8.1 | 12 | 0 | 5 | 0 | 39 | 0 | 1 | 1 | 45 | 13 | 28 | 12 | 3 | 16 | 4.7 | 3.1 | 0.5 | 3.7 | 0 | 6 | 6 | 2 | 3.4 | 39 |
| FOREST PARK | 1,088,621 | 831,500 | 270 | 73 | 24 | 0% | -3% | 11% | 0% | 1989 | 3,234 | 1,494 | 46 | 116,006 | 84.4 | 61.5 | 13 | 3.3 | 0.9 | 21.3 | 31.8 | 31.4 | 1,832 | 5.6 | 3.5 | 89.4 | 30.3 | 89.7 | 2.8 | 2.4 | 0.8 | 6 | 2 | 1 | 7 | 0 | 61 | 0 | 1 | 3 | 71 | 4 | 23 | 4,827 | 73 | 13 | 1.1 | 1.2 | 1.2 | 2.4 | 0 | 3 | 3 | 19 | 1.9 | 7 |
| FOSTER-POWELL | 371,743 | 370,000 | 231 | 33 | 143 | 2% | -4% | 47% | 1% | 1949 | 8,273 | 9,684 | 38 | 56,369 | 57.8 | 36.6 | 16.8 | 4.6 | 1.9 | 40 | 27.6 | 13 | 1,298 | 16.9 | 3.8 | 79.2 | 28.5 | 81.7 | 2.5 | 3.1 | 1.3 | 7 | 72 | 3 | 79 | 0 | 268 | 8 | 10 | 108 | 455 | 93 | 66 | 7 | 1 | 19 | 12.5 | 2.5 | 7.6 | 10.1 | 0 | 6 | 6 | 2 | 1.9 | 80 |
| GLENFAIR | 323,109 | 317,000 | 211 | 34 | 23 | 0% | 3% | 59% | 4% | 1982 | 3,398 | 11,600 | 31 | 46,313 | 35.4 | 39.7 | 17.5 | 3.5 | 2.7 | 36.6 | 14.6 | 7.4 | 1,091 | 20.2 | 9.6 | 64.1 | 45.4 | 84.4 | 0.8 | 4.3 | 0.8 | 5.9 | 117 | 1 | 28 | 0 | 90 | 4 | 11 | 68 | 186 | 133 | 94 | 5 | 2 | 22 | 14.7 | 4.8 | 0 | 4.8 | 1 | 1 | 2 | 2 | 5.5 | 54 |
| GOOSE HOLLOW | 419,480 | 360,000 | 385 | 62 | 81 | 95% | -5% | 36% | 0% | 1975 | 5,081 | 16,605 | 38 | 59,058 | 30.1 | 32.1 | 12 | 3.4 | 0.8 | 51.8 | 36.8 | 27.3 | 1,346 | 24.3 | 7.2 | 85.8 | 8.5 | 69.7 | 3 | 11 | 1.7 | 15.8 | 93 | 4 | 76 | 1 | 290 | 13 | 7 | 43 | 409 | 118 | 104 | 3 | 1 | 7 | 17.3 | 27.7 | 5.3 | 33 | 2 | 10 | 12 | 1 | 3.6 | 93 |
| GRANT PARK | 707,897 | 687,900 | 259 | 34 | 59 | 0% | 10% | 20% | 2% | 1925 | 4,029 | 10,008 | 41 | 107,089 | 75.6 | 59.3 | 8.7 | 2.3 | 1 | 28.7 | 38.2 | 34.8 | 1,827 | 5.9 | 4.3 | 92.2 | 34.4 | 85.6 | 0.5 | 3.7 | 0.5 | 4.8 | 14 | 4 | 22 | 0 | 105 | 0 | 2 | 32 | 159 | 20 | 44 | 20 | 7 | 13 | 7.7 | 5.5 | 10.8 | 16.3 | 0 | 3 | 3 | 2 | 5 | 79 |
| HAYDEN ISLAND | 288,728 | 257,000 | 218 | 68 | 71 | 55% | -2% | 48% | 1% | 1955 | 637 | 960 | 53 | 71,365 | 80.9 | 42.2 | 27.5 | 6.7 | 2.9 | 20.8 | 21.9 | 15.3 | 1,066 | 10.3 | 3.2 | 95.4 | 12.2 | 90.9 | 1.8 | 1.8 | 0 | 3.6 | 74 | 6 | 29 | 0 | 395 | 3 | 20 | 91 | 515 | 103 | 971 | 2 | 0 | 22 | 4.6 | 7.1 | 0 | 7.2 | 0 | 1 | 1 | 2 | 1.1 | 60 |
| HAYHURST | 493,207 | 499,900 | 240 | 33 | 79 | 8% | 4% | 39% | 0% | 1963 | 5,941 | 5,770 | 39 | 75,161 | 62.7 | 45.3 | 14.2 | 7.6 | 2 | 29.3 | 32.5 | 29.1 | 1,466 | 9 | 8.6 | 88.9 | 31.1 | 81.1 | 6 | 2.5 | 1.1 | 9.6 | 10 | 1 | 6 | 0 | 44 | 3 | 0 | 8 | 58 | 14 | 12 | 57 | 8 | 18 | 4.1 | 4.2 | 4.7 | 9 | 0 | 7 | 7 | 4 | 3.3 | 51 |
| HAZELWOOD | 310,392 | 310,500 | 204 | 36 | 262 | 10% | 3% | 63% | 2% | 1966 | 25,145 | 7,395 | 38 | 44,849 | 44.7 | 37 | 15.2 | 8.8 | 2.5 | 36.5 | 16.4 | 6.9 | 1,119 | 18.2 | 6.1 | 69.3 | 28.7 | 81.9 | 3.1 | 2.7 | 1.4 | 7.2 | 567 | 8 | 193 | 2 | 1,633 | 39 | 93 | 514 | 2,340 | 709 | 121 | 45 | 2 | 17 | 13.8 | 2.6 | 1.6 | 4.2 | 3 | 11 | 14 | 18 | 4.3 | 61 |
| HEALY HEIGHTS | 1,319,600 | 1,400,000 | 269 | 200 | 5 | 0% | 54% | 56% | 0% | 1954 | 204 | 3,634 | 43 | 94,082 | 59.2 | 57.1 | 5.7 | 5.6 | 1.2 | 30.5 | 36.5 | 46.8 | 1,654 | 13.6 | 6.7 | 85.7 | 19.9 | 79.3 | 3.4 | 7 | 1 | 11.4 | 0 | 0 | 1 | 0 | 1 | 0 | 0 | 0 | 2 | 0 | 10 | 1 | 3 | 16 | 7.7 | 17.2 | 2 | 19.1 | 0 | 1 | 1 | 0 | 0 | 8 |
| HILLSDALE | 567,482 | 547,500 | 254 | 40 | 144 | 20% | 10% | 37% | 1% | 1966 | 7,868 | 4,711 | 43 | 97,749 | 67.3 | 53.5 | 12.7 | 3.9 | 0.9 | 29.1 | 37 | 34.1 | 1,481 | 7.4 | 5.4 | 89.6 | 27.7 | 80.8 | 4.2 | 5.4 | 0.8 | 10.4 | 43 | 4 | 41 | 0 | 137 | 1 | 2 | 44 | 222 | 50 | 35 | 68 | 6 | 14 | 9.1 | 5.4 | 4.1 | 9.5 | 0 | 16 | 16 | 9 | 4.7 | 56 |
| HILLSIDE | 951,416 | 761,825 | 357 | 62 | 74 | 41% | 7% | 15% | 0% | 1969 | 1,279 | 2,627 | 49 | 123,074 | 78.4 | 62.3 | 11.1 | 5.4 | 0.6 | 20.6 | 38.5 | 42.6 | 2,224 | 3.5 | 2.5 | 84.3 | 22.7 | 88.9 | 2.6 | 2.9 | 1.9 | 7.4 | 2 | 0 | 10 | 0 | 42 | 0 | 0 | 1 | 53 | 2 | 43 | 127 | 29 | 14 | 4.9 | 7.4 | 2.9 | 10.3 | 0 | 2 | 2 | 1 | 1.4 | 47 |
| HOLLYWOOD | 730,031 | 650,250 | 275 | 27 | 8 | 0% | 32% | 60% | 0% | 1930 | 2,120 | 8,959 | 42 | 60,233 | 48.6 | 39.3 | 17.8 | 3.9 | 0.9 | 38 | 32.7 | 26.5 | 1,401 | 18.6 | 7.3 | 91 | 22.5 | 84.3 | 1.4 | 3.7 | 0.1 | 5.1 | 58 | 1 | 31 | 0 | 188 | 5 | 11 | 49 | 268 | 75 | 162 | 0 | 0 | 12 | 15.7 | 5.1 | 5.5 | 10.6 | 3 | 4 | 7 | 2 | 8.1 | 93 |
| HOMESTEAD | 490,563 | 525,000 | 270 | 42 | 24 | 33% | 9% | 55% | 0% | 1959 | 2,286 | 7,751 | 43 | 100,026 | 58.9 | 54.5 | 7.4 | 3.8 | 1.8 | 32.5 | 39.8 | 41.5 | 1,551 | 11 | 5.4 | 89.4 | 20.1 | 75.9 | 4.1 | 5.8 | 0.7 | 10.6 | 9 | 0 | 8 | 0 | 105 | 4 | 0 | 11 | 124 | 13 | 60 | 246 | 47 | 13 | 7.9 | 14.9 | 2.7 | 17.6 | 1 | 16 | 17 | 4 | 4.9 | 44 |
| HOSFORD-ABERNETHY | 596,984 | 600,000 | 263 | 40 | 98 | 9% | 0% | 30% | 1% | 1932 | 8,723 | 9,698 | 36 | 66,327 | 42.9 | 34.5 | 11.1 | 2.4 | 1.8 | 50.2 | 36.9 | 25.6 | 1,304 | 16.2 | 5.8 | 89.6 | 20 | 76.3 | 4.2 | 7.7 | 1 | 12.8 | 85 | 2 | 91 | 0 | 394 | 11 | 20 | 119 | 604 | 118 | 83 | 3 | 0 | 10 | 15.4 | 8.2 | 13.5 | 21.6 | 3 | 11 | 14 | 9 | 6.9 | 91 |
| HUMBOLDT | 529,495 | 511,000 | 242 | 45 | 68 | 7% | -3% | 33% | 1% | 1946 | 5,041 | 9,695 | 35 | 71,886 | 54.1 | 35 | 10.5 | 2.1 | 1.3 | 51 | 38.6 | 22.4 | 1,434 | 17.1 | 4.7 | 89.9 | 25.6 | 76.8 | 1.9 | 6.2 | 0.1 | 8.3 | 75 | 3 | 24 | 0 | 156 | 2 | 2 | 49 | 229 | 82 | 62 | 0 | 0 | 12 | 14.3 | 3.6 | 18.1 | 21.7 | 0 | 3 | 3 | 4 | 7.2 | 87 |
| IRVINGTON | 727,242 | 718,000 | 263 | 38 | 83 | 18% | 2% | 20% | 0% | 1925 | 6,029 | 9,804 | 40 | 92,872 | 58.1 | 47.2 | 13 | 2.7 | 1.6 | 35.5 | 33.6 | 36.2 | 1,588 | 8.9 | 4.6 | 92.6 | 24.7 | 82.2 | 1.1 | 5.7 | 1 | 7.8 | 31 | 3 | 40 | 0 | 206 | 3 | 11 | 43 | 289 | 48 | 56 | 16 | 4 | 14 | 9.8 | 6.2 | 11.5 | 17.7 | 0 | 5 | 5 | 3 | 5.3 | 81 |
| KENTON | 417,080 | 405,000 | 249 | 29 | 181 | 0% | -1% | 51% | 1% | 1959 | 8,150 | 7,736 | 39 | 63,050 | 67.8 | 47.2 | 12.1 | 2.8 | 3.3 | 34.6 | 20.7 | 9.9 | 1,323 | 12.8 | 4.3 | 73.5 | 27.2 | 85.3 | 1.6 | 1.6 | 0.2 | 3.4 | 105 | 2 | 61 | 0 | 253 | 5 | 11 | 109 | 423 | 123 | 67 | 121 | 6 | 17 | 12 | 1.1 | 2.4 | 3.5 | 1 | 5 | 6 | 14 | 4 | 68 |
| KERNS | 523,376 | 528,000 | 268 | 18 | 45 | 24% | 7% | 52% | 0% | 1927 | 6,463 | 10,168 | 33 | 49,666 | 19.1 | 28.5 | 10.6 | 1.9 | 1.9 | 57 | 43.2 | 18.7 | 1,155 | 19.7 | 3.8 | 92.1 | 10.4 | 69 | 5 | 4.3 | 0.2 | 9.6 | 113 | 3 | 82 | 1 | 398 | 7 | 11 | 112 | 592 | 135 | 112 | 18 | 3 | 12 | 23.7 | 9.1 | 13.3 | 22.4 | 6 | 10 | 16 | 4 | 5.1 | 90 |
| KING | 507,905 | 495,000 | 275 | 33 | 95 | 16% | -1% | 41% | 0% | 1943 | 6,773 | 11,095 | 34 | 66,517 | 51.3 | 33 | 10.4 | 2.4 | 1.2 | 53 | 35.8 | 21 | 1,428 | 17.6 | 5.3 | 88.9 | 24.3 | 79.3 | 2.6 | 4.5 | 0.3 | 7.4 | 97 | 5 | 48 | 1 | 198 | 13 | 12 | 35 | 281 | 128 | 60 | 3 | 1 | 15 | 15.4 | 4.2 | 16.8 | 21.1 | 0 | 3 | 3 | 1 | 1.4 | 90 |
| LAURELHURST | 759,695 | 734,500 | 249 | 44 | 74 | 0% | -3% | 35% | 0% | 1925 | 4,942 | 8,037 | 43 | 117,885 | 83.7 | 61 | 9.7 | 5.1 | 1.6 | 22.5 | 35.9 | 39.7 | 2,002 | 5.3 | 3 | 94 | 39 | 90.4 | 0.5 | 4.4 | 0 | 4.9 | 18 | 1 | 27 | 0 | 107 | 2 | 2 | 25 | 159 | 23 | 37 | 34 | 8 | 12 | 9.3 | 5.9 | 9.1 | 15 | 3 | 5 | 8 | 4 | 6.7 | 79 |
| LENTS | 325,844 | 318,500 | 216 | 30 | 270 | 2% | 8% | 71% | 1% | 1959 | 21,050 | 7,116 | 35 | 47,199 | 53 | 41.8 | 12.3 | 3.9 | 1.8 | 40.2 | 18.3 | 5.6 | 1,167 | 20.6 | 6.3 | 66.2 | 37.3 | 81.9 | 4 | 2.7 | 1 | 7.6 | 382 | 13 | 194 | 2 | 844 | 23 | 41 | 318 | 1,356 | 461 | 86 | 215 | 9 | 20 | 11.7 | 2.6 | 2.5 | 5.1 | 1 | 7 | 8 | 21 | 5.8 | 57 |
| LINNTON | 351,156 | 377,450 | 183 | 82 | 12 | 17% | 1% | 37% | 0% | 1950 | 142 | 366 | 46 | 97,215 | 87.5 | 58.5 | 15.6 | 2.6 | 0.7 | 22.5 | 28.5 | 26 | 1,642 | 6.9 | 2.5 | 96.7 | 26.2 | 90.5 | 1 | 3.3 | 0 | 4.3 | 4 | 0 | 3 | 0 | 45 | 1 | 0 | 8 | 56 | 5 | 429 | 41 | 4 | 19 | 0 | 1.1 | 1.8 | 2.9 | 0 | 1 | 1 | 5 | 3.5 | 7 |
| LLOYD DISTRICT | 217,408 | 207,450 | 394 | 31 | 12 | 100% | -12% | 11% | 0% | 1965 | 2,279 | 5,000 | 36 | 47,123 | 14.1 | 21 | 13.6 | 7.4 | 1.8 | 56.2 | 36 | 18.6 | 1,263 | 21.4 | 6.8 | 93 | 6.5 | 71.3 | 4.3 | 8.9 | 0.7 | 13.9 | 237 | 2 | 54 | 2 | 784 | 21 | 59 | 96 | 934 | 321 | 551 | 2 | 1 | 11 | 20.4 | 15.7 | 12.5 | 28.1 | 6 | 9 | 15 | 8 | 15.7 | 86 |
| MADISON SOUTH | 381,419 | 365,000 | 214 | 25 | 99 | 6% | 6% | 63% | 1% | 1960 | 9,437 | 7,994 | 38 | 60,962 | 69 | 39.7 | 12.6 | 5.3 | 2.5 | 39.9 | 24.9 | 11.1 | 1,211 | 18.4 | 8.7 | 82.2 | 25.1 | 82.9 | 2 | 2.5 | 0.3 | 4.9 | 154 | 10 | 66 | 0 | 245 | 9 | 12 | 107 | 418 | 185 | 64 | 133 | 12 | 15 | 11.4 | 2 | 5.2 | 7.3 | 3 | 7 | 10 | 4 | 2.3 | 56 |
| MAPLEWOOD | 515,532 | 517,000 | 236 | 29 | 47 | 2% | 2% | 36% | 0% | 1967 | 2,559 | 4,488 | 47 | 100,314 | 76.2 | 59 | 17.3 | 5.5 | 0 | 16.4 | 37.8 | 30.2 | 1,750 | 3.9 | 4.2 | 92.4 | 23.1 | 80.6 | 5.3 | 1.9 | 0.4 | 7.6 | 1 | 0 | 2 | 0 | 17 | 0 | 2 | 2 | 21 | 3 | 9 | 10 | 3 | 17 | 2.2 | 1.1 | 1.8 | 2.9 | 0 | 1 | 1 | 4 | 6.1 | 33 |
| MARKHAM | 464,963 | 458,500 | 232 | 26 | 30 | 0% | 5% | 37% | 0% | 1964 | 1,868 | 3,714 | 41 | 118,754 | 85.2 | 61.1 | 10.8 | 2.7 | 0.8 | 24.6 | 42.1 | 29.6 | 1,903 | 6.2 | 4.9 | 91.1 | 34.4 | 82.3 | 4.3 | 2 | 3 | 9.3 | 10 | 0 | 1 | 0 | 24 | 1 | 0 | 8 | 33 | 11 | 24 | 9 | 3 | 14 | 5.9 | 1 | 3.6 | 4.6 | 0 | 4 | 4 | 0 | 0.2 | 40 |
| MARSHALL PARK | 627,978 | 586,389 | 220 | 29 | 24 | 0% | 23% | 43% | 0% | 1974 | 1,418 | 2,823 | 39 | 128,430 | 88.2 | 58.8 | 8.5 | 2.3 | 0.7 | 29.6 | 39.8 | 34.6 | 2,096 | 6.6 | 5.6 | 90.2 | 35.8 | 83.1 | 4.6 | 4.8 | 0.6 | 10.1 | 1 | 0 | 2 | 0 | 6 | 0 | 0 | 0 | 8 | 1 | 6 | 65 | 17 | 15 | 5.4 | 4.3 | 2.1 | 6.4 | 0 | 4 | 4 | 0 | 0 | 24 |
| MILL PARK | 312,164 | 312,800 | 205 | 28 | 112 | 13% | 12% | 70% | 4% | 1970 | 9,478 | 10,285 | 35 | 39,921 | 40.8 | 36.2 | 10.9 | 6.4 | 3.1 | 43.4 | 14.9 | 5.3 | 1,063 | 25.9 | 12.3 | 56.3 | 35 | 81.3 | 2 | 2 | 2.4 | 6.4 | 166 | 3 | 37 | 0 | 253 | 10 | 24 | 116 | 406 | 203 | 64 | 15 | 2 | 21 | 18 | 0.7 | 2 | 2.8 | 0 | 4 | 4 | 3 | 2.9 | 69 |
| MONTAVILLA | 379,820 | 369,925 | 235 | 32 | 266 | 7% | 4% | 51% | 2% | 1952 | 16,590 | 8,340 | 37 | 55,958 | 59.4 | 40.4 | 14.1 | 5.6 | 1.5 | 38.5 | 27.5 | 11.6 | 1,269 | 17.4 | 9.2 | 76.9 | 26.4 | 78.9 | 1.9 | 4 | 0.4 | 6.4 | 185 | 11 | 151 | 0 | 655 | 14 | 34 | 252 | 1,058 | 244 | 78 | 20 | 1 | 16 | 14.3 | 3.5 | 6.1 | 9.6 | 3 | 7 | 10 | 8 | 3.8 | 71 |
| MT SCOTT-ARLETA | 389,494 | 384,999 | 248 | 28 | 155 | 3% | 8% | 57% | 1% | 1948 | 7,631 | 9,089 | 38 | 55,194 | 60.9 | 41.3 | 14.1 | 4 | 2.1 | 38.5 | 20.6 | 12.8 | 1,251 | 13.7 | 5.3 | 81.4 | 28.2 | 84.2 | 2.4 | 2.6 | 1 | 6 | 82 | 2 | 61 | 0 | 229 | 4 | 8 | 94 | 384 | 96 | 63 | 11 | 2 | 21 | 10.3 | 1.7 | 4.9 | 6.6 | 0 | 5 | 5 | 2 | 2.8 | 72 |
| MT TABOR | 636,121 | 600,000 | 250 | 37 | 148 | 3% | 8% | 37% | 1% | 1948 | 11,250 | 8,881 | 43 | 75,008 | 63.7 | 46.3 | 13.1 | 6.7 | 1.1 | 32.9 | 31.3 | 26.1 | 1,437 | 9.1 | 5.2 | 86.4 | 22.9 | 84.7 | 1.9 | 5.3 | 0.7 | 7.9 | 48 | 0 | 51 | 0 | 248 | 7 | 3 | 99 | 398 | 58 | 41 | 178 | 17 | 19 | 10.9 | 3.3 | 7.3 | 10.6 | 0 | 6 | 6 | 7 | 4.5 | 69 |
| MULTNOMAH | 464,467 | 429,950 | 260 | 29 | 126 | 26% | 1% | 29% | 2% | 1974 | 8,502 | 6,747 | 36 | 68,411 | 52.4 | 44.2 | 13.8 | 2.1 | 0.4 | 39.7 | 35.5 | 28.6 | 1,237 | 12.4 | 7 | 89.5 | 23.5 | 74 | 7.4 | 6.5 | 1.6 | 15.5 | 61 | 1 | 16 | 0 | 127 | 3 | 2 | 38 | 181 | 67 | 29 | 104 | 11 | 12 | 14.5 | 2.7 | 1.1 | 3.8 | 0 | 10 | 10 | 8 | 5.4 | 64 |
| NORTH TABOR | 489,662 | 459,000 | 251 | 34 | 73 | 8% | -1% | 46% | 3% | 1948 | 5,671 | 9,748 | 39 | 64,153 | 46.7 | 35 | 13 | 3.9 | 1.7 | 46.3 | 33.1 | 18.4 | 1,270 | 12.4 | 6.5 | 90.2 | 21.9 | 82.5 | 1.7 | 4 | 1.1 | 6.8 | 61 | 1 | 24 | 0 | 255 | 10 | 7 | 126 | 405 | 79 | 85 | 2 | 1 | 13 | 15.2 | 4.6 | 8.4 | 13 | 3 | 4 | 7 | 2 | 3.5 | 74 |
| NORTHWEST DISTRICT | 546,034 | 406,000 | 370 | 46 | 174 | 75% | -18% | 0% | 1% | 1944 | 15,647 | 15,597 | 37 | 77,192 | 36 | 36 | 14.5 | 2.2 | 1.1 | 46.3 | 40 | 34.2 | 1,488 | 10 | 3.2 | 87.7 | 14.4 | 68.6 | 5.1 | 6.6 | 1.5 | 13.1 | 221 | 7 | 161 | 0 | 836 | 19 | 28 | 137 | 1,134 | 275 | 90 | 17 | 2 | 10 | 10.2 | 16.4 | 6.1 | 22.5 | 1 | 5 | 6 | 11 | 7.2 | 93 |
| NORTHWEST HEIGHTS | 652,678 | 660,000 | 227 | 53 | 149 | 16% | -6% | 13% | 1% | 1986 | 784 | 854 | 42 | 134,212 | 75.7 | 62.1 | 8.8 | 4 | 1 | 18.6 | 34.3 | 36.6 | 1,979 | 3.5 | 4.6 | 75 | 34 | 83.9 | 4.9 | 1.1 | 1.9 | 7.9 | 8 | 0 | 3 | 0 | 19 | 1 | 0 | 1 | 23 | 9 | 41 | 3 | 0 | 20 | 2.4 | 1.3 | 0.4 | 1.7 | 0 | 0 | 0 | 0 | 0 | 16 |
| OLD TOWN/ CHINATOWN | 296,874 | 277,450 | 372 | 53 | 36 | 97% | -7% | 18% | 0% | 1985 | 3,558 | 19,077 | 49 | 40,070 | 25 | 27.1 | 24.2 | 2.4 | 3.5 | 42.9 | 31.1 | 23.9 | 1,266 | 26.5 | 7.7 | 88.7 | 3.3 | 66 | 6.3 | 7.1 | 2.2 | 15.6 | 550 | 20 | 41 | 2 | 516 | 30 | 53 | 54 | 611 | 655 | 356 | 12 | 7 | 3 | 19.5 | 25.3 | 6 | 31.2 | 7 | 17 | 24 | 5 | 17.1 | 96 |
| OVERLOOK | 474,926 | 481,000 | 250 | 24 | 87 | 18% | 8% | 35% | 0% | 1942 | 7,225 | 6,983 | 36 | 76,623 | 56.5 | 39.6 | 10.9 | 2.2 | 1.6 | 45.7 | 36.1 | 21.6 | 1,408 | 13.8 | 5.6 | 87.1 | 23.6 | 78.3 | 2.6 | 5.4 | 0.7 | 8.7 | 84 | 1 | 34 | 0 | 218 | 9 | 5 | 44 | 296 | 99 | 55 | 78 | 4 | 12 | 12.8 | 4.6 | 13.1 | 17.7 | 1 | 4 | 5 | 11 | 3.4 | 72 |
| PARKROSE | 333,306 | 340,000 | 182 | 35 | 71 | 4% | 11% | 75% | 3% | 1950 | 5,659 | 5,208 | 37 | 45,940 | 49.8 | 30.1 | 17.2 | 3.2 | 3.1 | 46.4 | 13.9 | 5.6 | 980 | 23.3 | 7.2 | 72.2 | 32.7 | 67.4 | 14.4 | 4.8 | 1 | 20.1 | 143 | 4 | 60 | 1 | 388 | 12 | 21 | 203 | 651 | 181 | 147 | 3 | 0 | 18 | 10.4 | 16 | 0.5 | 16.5 | 1 | 6 | 7 | 8 | 4.2 | 57 |
| PARKROSE HEIGHTS | 332,665 | 320,500 | 222 | 28 | 78 | 0% | 3% | 55% | 3% | 1957 | 6,050 | 6,536 | 39 | 50,158 | 57.5 | 40 | 14.5 | 7.5 | 1.8 | 36.3 | 16.5 | 7.9 | 1,138 | 13.4 | 4.4 | 75 | 27.3 | 81.6 | 3.1 | 2.3 | 0.8 | 6.2 | 60 | 1 | 32 | 0 | 115 | 3 | 3 | 61 | 208 | 67 | 45 | 14 | 2 | 16 | 8.5 | 2.9 | 0.8 | 3.8 | 0 | 6 | 6 | 3 | 3.3 | 54 |
| PEARL | 702,858 | 582,475 | 596 | 63 | 324 | 99% | 10% | 32% | 0% | 1993 | 5,885 | 15,974 | 45 | 61,823 | 29.1 | 31.1 | 21 | 1.9 | 2 | 44.1 | 37.4 | 28.7 | 1,550 | 17.5 | 6.4 | 90.2 | 3.9 | 63.3 | 6 | 8.8 | 3.2 | 18 | 192 | 5 | 104 | 1 | 1,193 | 15 | 36 | 60 | 1,357 | 249 | 273 | 9 | 3 | 7 | 14.7 | 22.6 | 6.5 | 29.1 | 3 | 6 | 9 | 5 | 10.7 | 96 |
| PIEDMONT | 470,751 | 454,000 | 224 | 29 | 127 | 3% | 2% | 43% | 2% | 1945 | 7,451 | 9,430 | 37 | 59,409 | 53.1 | 34.4 | 10.2 | 6.1 | 2.4 | 46.9 | 30.9 | 16 | 1,338 | 16.7 | 6.9 | 85.4 | 24.6 | 83.2 | 1.8 | 2.6 | 0.2 | 4.5 | 60 | 2 | 45 | 1 | 200 | 7 | 4 | 75 | 320 | 74 | 53 | 30 | 5 | 13 | 13.3 | 2.8 | 9.3 | 12.1 | 0 | 4 | 4 | 5 | 5.7 | 71 |
| PLEASANT VALLEY | 417,731 | 420,000 | 182 | 37 | 164 | 1% | 12% | 47% | 1% | 1992 | 11,750 | 5,685 | 38 | 62,760 | 71.6 | 54.5 | 10.3 | 4.1 | 1.9 | 29.3 | 16.3 | 9.9 | 1,491 | 20.2 | 7.4 | 67.1 | 35.4 | 82.7 | 5.5 | 2.6 | 1.8 | 9.9 | 60 | 6 | 42 | 0 | 161 | 8 | 4 | 81 | 284 | 78 | 31 | 1,057 | 37 | 26 | 5.4 | 1.7 | 0.3 | 2 | 0 | 2 | 2 | 6 | 1.4 | 22 |
| PORTSMOUTH | 379,565 | 370,000 | 249 | 29 | 182 | 1% | 3% | 48% | 2% | 1965 | 11,307 | 13,076 | 32 | 49,943 | 54.9 | 34.3 | 11 | 4 | 3.8 | 47 | 22.8 | 8.6 | 1,142 | 33 | 11.9 | 69.3 | 37.1 | 75.8 | 4.4 | 4 | 0.7 | 9 | 174 | 8 | 41 | 0 | 168 | 10 | 5 | 105 | 314 | 197 | 45 | 63 | 9 | 18 | 15.4 | 1 | 7.5 | 8.4 | 0 | 3 | 3 | 9 | 7.9 | 59 |
| POWELLHURST-GILBERT | 290,085 | 294,000 | 192 | 39 | 303 | 16% | 7% | 59% | 7% | 1976 | 25,363 | 8,214 | 35 | 41,319 | 49.9 | 41.7 | 11.3 | 5.1 | 2.8 | 39.1 | 11.6 | 4.3 | 1,104 | 26.4 | 9.8 | 58.1 | 41.1 | 83 | 2.4 | 1.6 | 1.6 | 5.7 | 489 | 14 | 159 | 2 | 694 | 25 | 51 | 378 | 1,231 | 581 | 71 | 131 | 6 | 21 | 12.6 | 2 | 0.7 | 2.8 | 1 | 5 | 6 | 15 | 4.4 | 52 |
| REED | 511,734 | 485,000 | 240 | 31 | 37 | 0% | -2% | 36% | 0% | 1949 | 2,827 | 7,948 | 30 | 45,757 | 36.1 | 25 | 7.5 | 6.3 | 1.2 | 60 | 25.9 | 20.8 | 1,215 | 16.2 | 6.2 | 84.4 | 15 | 61.7 | 7.2 | 13.9 | 2.1 | 23.2 | 29 | 0 | 18 | 0 | 92 | 2 | 2 | 39 | 149 | 33 | 64 | 0 | 0 | 14 | 13.5 | 15.1 | 6.1 | 21.2 | 0 | 3 | 3 | 1 | 1.9 | 62 |
| RICHMOND | 567,630 | 553,250 | 257 | 28 | 194 | 6% | 2% | 33% | 0% | 1936 | 13,046 | 10,714 | 36 | 75,788 | 56.4 | 43.1 | 10.2 | 2.4 | 1.3 | 43 | 35.7 | 25.9 | 1,425 | 10.7 | 4.7 | 90.3 | 23.9 | 81.7 | 2.4 | 4.5 | 0.9 | 7.8 | 74 | 2 | 60 | 0 | 351 | 3 | 8 | 119 | 530 | 87 | 47 | 4 | 1 | 16 | 12.7 | 4.7 | 12.2 | 16.9 | 0 | 6 | 6 | 4 | 3.4 | 87 |
| ROSE CITY PARK | 524,570 | 502,350 | 236 | 25 | 166 | 5% | -9% | 20% | 0% | 1933 | 10,187 | 9,006 | 41 | 80,303 | 68 | 47.3 | 14.2 | 3.3 | 0.8 | 34.4 | 33.7 | 24.6 | 1,453 | 8.3 | 5.1 | 89.1 | 29.1 | 85.2 | 0.9 | 3.3 | 0.3 | 4.5 | 59 | 4 | 51 | 0 | 207 | 3 | 8 | 90 | 348 | 74 | 41 | 25 | 3 | 14 | 12.3 | 3.1 | 6 | 9.1 | 3 | 4 | 7 | 5 | 4.4 | 71 |
| ROSEWAY | 428,144 | 407,500 | 236 | 24 | 126 | 0% | -3% | 40% | 1% | 1943 | 5,577 | 6,913 | 41 | 64,622 | 66.2 | 48.6 | 14.3 | 2.8 | 1.8 | 32.6 | 29.1 | 20.3 | 1,347 | 7.7 | 5 | 85.5 | 23.5 | 83.1 | 1.7 | 2 | 0.8 | 4.5 | 43 | 0 | 50 | 0 | 149 | 1 | 13 | 83 | 282 | 57 | 61 | 4 | 1 | 17 | 10.1 | 0.9 | 5.1 | 6.1 | 0 | 5 | 5 | 2 | 1.9 | 76 |
| RUSSELL | 363,033 | 360,000 | 205 | 28 | 57 | 0% | 4% | 60% | 2% | 1962 | 3,829 | 5,378 | 48 | 53,641 | 77.4 | 52.6 | 13.2 | 11.4 | 1.1 | 21.7 | 13.8 | 8.7 | 1,146 | 12.3 | 8.8 | 80.6 | 21.5 | 84.3 | 2.4 | 2.2 | 0.7 | 5.3 | 24 | 1 | 31 | 0 | 152 | 0 | 7 | 56 | 239 | 32 | 71 | 15 | 3 | 19 | 5.4 | 1.3 | 2.9 | 4.2 | 0 | 2 | 2 | 5 | 5.7 | 37 |
| SABIN | 691,184 | 623,000 | 269 | 37 | 69 | 3% | -9% | 34% | 1% | 1934 | 4,635 | 10,073 | 37 | 88,913 | 66.5 | 42.2 | 10.8 | 2.1 | 1.1 | 43.8 | 36.7 | 31.7 | 1,668 | 11.1 | 3.5 | 92.2 | 29.2 | 82.5 | 1.9 | 4.9 | 0.4 | 7.2 | 14 | 0 | 19 | 0 | 76 | 0 | 0 | 10 | 105 | 14 | 26 | 2 | 1 | 16 | 11.7 | 5.6 | 13.9 | 19.5 | 0 | 2 | 2 | 1 | 2.7 | 83 |
| SELLWOOD-MORELAND | 553,378 | 520,000 | 273 | 40 | 218 | 14% | 4% | 28% | 1% | 1946 | 8,811 | 6,432 | 40 | 72,946 | 54.4 | 52.6 | 14.2 | 3.5 | 1.7 | 28 | 32.5 | 26.6 | 1,282 | 9.8 | 6.1 | 92.5 | 26.7 | 83.5 | 4.9 | 4.8 | 0.7 | 10.4 | 80 | 1 | 78 | 0 | 352 | 5 | 8 | 76 | 506 | 94 | 68 | 312 | 23 | 15 | 7.4 | 4.5 | 8.9 | 13.4 | 0 | 6 | 6 | 9 | 4.3 | 81 |
| SOUTH BURLINGAME | 508,616 | 490,000 | 238 | 35 | 33 | 3% | 0% | 23% | 0% | 1964 | 2,031 | 6,023 | 39 | 96,649 | 77.1 | 54 | 13.1 | 3.1 | 0.3 | 29.4 | 41.4 | 26.3 | 1,565 | 7.7 | 7 | 90.5 | 28.9 | 77.6 | 3.2 | 2.3 | 6.3 | 11.8 | 5 | 0 | 2 | 0 | 27 | 0 | 0 | 4 | 33 | 5 | 19 | 13 | 5 | 11 | 8.1 | 1.7 | 5.4 | 7.1 | 0 | 8 | 8 | 2 | 4.7 | 55 |
| SOUTH PORTLAND | 572,852 | 474,480 | 330 | 51 | 195 | 53% | 0% | 34% | 2% | 1978 | 10,121 | 8,190 | 38 | 83,332 | 40.4 | 39.9 | 12.5 | 5.1 | 0.8 | 41.8 | 37.6 | 34.3 | 1,613 | 12.1 | 5.2 | 81.4 | 10.3 | 68.1 | 6.8 | 8.2 | 2.1 | 17.1 | 90 | 2 | 55 | 0 | 306 | 3 | 4 | 53 | 414 | 99 | 51 | 69 | 6 | 11 | 16.9 | 12.3 | 4.8 | 17.2 | 5 | 22 | 27 | 11 | 6.5 | 56 |
| SOUTH TABOR | 460,105 | 453,050 | 246 | 28 | 92 | 10% | 4% | 48% | 0% | 1951 | 6,825 | 9,500 | 37 | 60,149 | 58 | 43.4 | 13.3 | 2.5 | 1.3 | 39.7 | 27.8 | 17.9 | 1,390 | 13 | 8.4 | 82.7 | 23.2 | 80.9 | 2.2 | 5.2 | 0.9 | 8.3 | 52 | 2 | 72 | 0 | 216 | 16 | 9 | 89 | 377 | 79 | 67 | 12 | 2 | 19 | 12.9 | 1.6 | 9.2 | 10.8 | 0 | 4 | 4 | 4 | 4.6 | 68 |
| SOUTHWEST HILLS | 940,888 | 790,350 | 293 | 65 | 112 | 16% | -5% | 23% | 1% | 1949 | 7,115 | 4,308 | 44 | 125,023 | 71.5 | 61.1 | 6.8 | 4.3 | 0.8 | 26.9 | 36.8 | 44.4 | 2,036 | 10 | 5.1 | 87.8 | 46.6 | 83 | 2.7 | 5 | 0.7 | 8.4 | 9 | 2 | 22 | 0 | 77 | 3 | 2 | 12 | 111 | 16 | 18 | 168 | 14 | 11 | 6.6 | 12.2 | 1.5 | 13.7 | 2 | 5 | 7 | 2 | 0.8 | 34 |
| ST. JOHNS | 366,778 | 360,000 | 242 | 30 | 201 | 6% | 4% | 59% | 4% | 1958 | 13,638 | 10,263 | 38 | 61,909 | 63.7 | 46.1 | 11.2 | 2.5 | 3.1 | 37 | 21.6 | 9.7 | 1,300 | 12.5 | 5.6 | 74.7 | 26.9 | 83 | 1.7 | 2.2 | 0.3 | 4.2 | 241 | 11 | 98 | 1 | 453 | 14 | 18 | 187 | 738 | 285 | 75 | 2,180 | 31 | 20 | 10.2 | 1.4 | 1.4 | 2.9 | 0 | 5 | 5 | 21 | 1.9 | 65 |
| SULLIVAN'S GULCH | 448,846 | 430,000 | 273 | 44 | 39 | 59% | 53% | 65% | 3% | 1951 | 3,406 | 11,969 | 37 | 60,765 | 31.6 | 39.5 | 11.4 | 1.9 | 1.5 | 45.8 | 39.9 | 28.6 | 1,288 | 12.6 | 4.7 | 90.3 | 12.5 | 75.9 | 1 | 5.5 | 1.3 | 7.8 | 58 | 1 | 33 | 0 | 218 | 5 | 9 | 68 | 319 | 73 | 115 | 5 | 2 | 13 | 13 | 8.3 | 12 | 20.3 | 3 | 4 | 7 | 3 | 9.2 | 87 |
| SUMNER | 322,338 | 325,000 | 226 | 17 | 37 | 0% | 8% | 76% | 0% | 1939 | 2,312 | 6,977 | 37 | 46,119 | 58.8 | 34.5 | 17.6 | 2 | 2.4 | 43.4 | 11.8 | 4.3 | 1,067 | 20.8 | 5.6 | 66.5 | 33.4 | 70.2 | 12.7 | 4.6 | 0.6 | 17.8 | 36 | 4 | 23 | 0 | 83 | 3 | 8 | 40 | 146 | 51 | 85 | 16 | 3 | 19 | 8.3 | 14.3 | 0.7 | 15 | 1 | 5 | 6 | 3 | 3.6 | 64 |
| SUNDERLAND | — | — | 71 | — | 1 | 0% | — | — | 0% | — | 327 | 2,602 | 38 | 50,510 | 53.5 | 30.4 | 19 | 1.4 | 3.2 | 45.9 | 11.7 | 4.2 | 1,027 | 21.6 | 5.7 | 72.7 | 32.3 | 60.9 | 17.3 | 4.8 | 0.9 | 22.9 | 20 | 1 | 7 | 0 | 62 | 0 | 3 | 15 | 84 | 24 | 330 | 57 | 5 | 17 | 9 | 19.2 | 0.2 | 19.4 | 0 | 3 | 3 | 4 | 2.1 | 15 |
| SUNNYSIDE | 498,047 | 470,000 | 264 | 32 | 101 | 24% | -13% | 19% | 0% | 1931 | 7,838 | 13,241 | 36 | 71,267 | 42.9 | 36.2 | 10.2 | 3 | 0.5 | 50.2 | 39.6 | 25.5 | 1,299 | 11.3 | 3.7 | 89.8 | 20.1 | 75.4 | 2.8 | 6.2 | 0.6 | 9.6 | 67 | 0 | 61 | 0 | 296 | 3 | 10 | 108 | 465 | 80 | 70 | 2 | 0 | 13 | 13.9 | 3.8 | 16.9 | 20.7 | 0 | 4 | 4 | 2 | 3.5 | 91 |
| SYLVAN-HIGHLANDS | 713,346 | 650,000 | 256 | 44 | 31 | 10% | 3% | 36% | 3% | 1964 | 1,231 | 2,169 | 46 | 163,976 | 88.6 | 67.7 | 7.4 | 3.9 | 0.4 | 20.5 | 39.1 | 38.8 | 2,575 | 3.6 | 1.1 | 91.3 | 30.2 | 89.7 | 2.1 | 2.4 | 0.2 | 4.7 | 4 | 0 | 8 | 0 | 26 | 1 | 0 | 8 | 42 | 5 | 38 | 70 | 15 | 14 | 2.8 | 4.9 | 1.1 | 6 | 2 | 3 | 5 | 2 | 2.5 | 19 |
| UNIVERSITY PARK | 467,199 | 462,250 | 232 | 38 | 80 | 0% | -2% | 45% | 0% | 1947 | 6,623 | 9,159 | 24 | 67,531 | 63.4 | 28.4 | 7.6 | 2.5 | 0.4 | 61.1 | 24.9 | 24.5 | 1,560 | 21.4 | 9.5 | 90.6 | 24.8 | 67.8 | 4.2 | 12.6 | 1.8 | 18.6 | 30 | 0 | 23 | 0 | 119 | 1 | 4 | 38 | 180 | 35 | 32 | 26 | 3 | 17 | 5.8 | 16 | 6.8 | 22.8 | 0 | 3 | 3 | 5 | 3.5 | 48 |
| VERNON | 543,462 | 539,250 | 270 | 36 | 36 | 14% | -2% | 44% | 0% | 1952 | 2,769 | 10,006 | 36 | 83,803 | 67.9 | 38.7 | 10.7 | 1.7 | 1 | 47.7 | 37.2 | 25.5 | 1,592 | 12.5 | 5.1 | 93.4 | 27.6 | 83.6 | 1.3 | 5.5 | 1 | 7.7 | 15 | 0 | 15 | 0 | 70 | 1 | 3 | 19 | 104 | 19 | 44 | 17 | 9 | 16 | 11.1 | 3.8 | 13.5 | 17.3 | 0 | 2 | 2 | 1 | 1.7 | 88 |
| WEST PORTLAND PARK | 410,590 | 442,000 | 231 | 50 | 59 | 15% | 12% | 48% | 2% | 1949 | 3,889 | 6,563 | 36 | 61,207 | 55.6 | 49 | 17.3 | 4.4 | 1.8 | 27.6 | 31.8 | 19.1 | 1,422 | 17 | 3.3 | 79 | 29.8 | 81 | 5.1 | 4.3 | 3.8 | 13.1 | 37 | 1 | 13 | 0 | 65 | 4 | 4 | 15 | 93 | 46 | 36 | 39 | 8 | 14 | 10.1 | 1.6 | 0.9 | 2.4 | 0 | 7 | 7 | 2 | 2.9 | 62 |
| WILKES | 326,941 | 330,000 | 190 | 36 | 192 | 18% | 2% | 38% | 3% | 1978 | 9,522 | 6,724 | 43 | 56,184 | 70 | 51.3 | 14 | 5.8 | 1.9 | 27 | 14.5 | 8.4 | 1,153 | 14.8 | 6.8 | 75.5 | 30.2 | 88 | 2.1 | 2.2 | 0.3 | 4.6 | 76 | 3 | 58 | 1 | 195 | 4 | 2 | 89 | 342 | 86 | 45 | 200 | 10 | 23 | 6.1 | 1.6 | 0.7 | 2.4 | 0 | 6 | 6 | 12 | 3.8 | 28 |
| WOODLAND PARK | 319,714 | 330,000 | 182 | 31 | 7 | 0% | 15% | 81% | 0% | 1945 | 289 | 6,163 | 39 | 51,965 | 49.9 | 36.8 | 13.7 | 6.1 | 0.3 | 43.1 | 15.9 | 7.8 | 1,138 | 16.9 | 3.7 | 75.6 | 23.3 | 78.5 | 4.6 | 2.9 | 1.5 | 9 | 5 | 0 | 1 | 0 | 19 | 1 | 2 | 1 | 21 | 8 | 100 | 0 | 0 | 15 | 7.8 | 2.4 | 1.2 | 3.5 | 0 | 5 | 5 | 0 | 6.1 | 64 |
| WOODLAWN | 470,642 | 439,000 | 254 | 40 | 111 | 13% | 0% | 42% | 1% | 1956 | 5,810 | 9,618 | 35 | 78,385 | 69.5 | 35.8 | 11.3 | 1.8 | 1.9 | 49.1 | 34.1 | 20.8 | 1,476 | 13.5 | 7.3 | 91.6 | 25.4 | 81.8 | 1.3 | 4.6 | 1.9 | 7.8 | 43 | 2 | 51 | 0 | 119 | 0 | 2 | 31 | 201 | 47 | 43 | 8 | 2 | 15 | 11.2 | 3.2 | 13.7 | 16.9 | 0 | 4 | 4 | 3 | 4.3 | 72 |
| WOODSTOCK | 494,541 | 467,500 | 256 | 32 | 178 | 2% | 8% | 45% | 0% | 1955 | 8,584 | 7,107 | 38 | 78,549 | 74.6 | 52.1 | 10.1 | 4.1 | 0.9 | 32.8 | 30.4 | 23.4 | 1,536 | 7.8 | 4.7 | 89.3 | 31.4 | 83.2 | 2.6 | 4.4 | 1.1 | 8.1 | 51 | 1 | 59 | 0 | 201 | 2 | 12 | 68 | 328 | 66 | 46 | 14 | 2 | 18 | 10.6 | 3.4 | 6.6 | 10 | 0 | 5 | 5 | 4 | 3 | 65 |
| PORTLAND TOTAL** | 480,268 | 420,000 | 255 | 37 | 9,427 | 17% | 5% | 35% | 1% | 1958 | 630,331 | 4,344 | 37 | 61,532 | 53.5 | 41.3 | 12.5 | 4.1 | 1.8 | 40.3 | 28.8 | 19.4 | 1,299 | 16.2 | 6.6 | 80.6 | 25.5 | 79.7 | 3.2 | 4.6 | 1.1 | 8.9 | 8,725 | 278 | 4,326 | 26 | 24,771 | 709 | 1,071 | 7,014 | 36,111* | 10,809* | 74 | 12,882 | 14 | — | 12.3 | 6.5 | 5.7 | 12.2 | 8 | 57 | 79 | 469 | 3.2 | 65 |
Methodology
Neighborhood Boundaries represent records maintained by the city as of January 2019. Boundary conflicts were resolved for statistical purposes only. Due to overlap between certain neighborhoods, boundary definitions may vary occasionally across categories. With the exception of the area unofficially (but universally) known as Dunthorpe, unclaimed sections of Multnomah County were excluded.
Real Estate 2018 data from the Regional Multiple Listing Service with analysis by the Center for Spatial Analysis and Research at Portland State University’s Department of Geography. Figures were rounded for legibility.
People Data from the US Census Bureau’s American Community Survey 5-Year Estimates, released December 2018. The ACS data are estimates only and accuracy varies by attribute.
Rent Costs Calculated from all renter-occupied units, estimated median rent is not adjusted for unit size or number of occupants. Figure includes estimated monthly utility costs.
Median Income The Census defines household as including “all the persons who occupy a housing unit as their usual place of residence.” Thus living situations in this estimate range from individuals to large households.
Crime Portland neighborhood and city crime numbers reflects 2018 data provided by the Portland Police Bureau. For cities other than Portland, crime data reflects 2017 and was sourced from the FBI. As of press time, 2017 crime data was not available for several cities and unincorporated Sauvie Island; where available, FBI crime data from 2016 is provided.
Nonviolent crime includes burglary, larceny (theft), and vehicle theft.
Violent crime is defined as aggravated assault, arson, homicide, rape, and robbery. Crimes per 1,000 figures are based on reported incidents of both nonviolent and violent crime. Many factors can influence the crimes-per-1,000 figure and can sometimes complicate meaningful neighborhood comparisons (e.g., commercial districts, or neighborhoods with high traffic and low population density).
Parks Data from Metro (2018 or most recently available) and/or individual cities.
Transit Neighborhood data from TriMet. City and suburb transit information was sourced from TriMet as well as other services, including CC Rider, C-TRAN, Canby Area Transit, Sandy Area Metro, and South Metro Area Regional Transit.
Minutes by Car to Downtown Google Maps estimate, based on non-rush-hour conditions, from a neighborhood/suburb central point to Portland’s Pioneer Courthouse Square.
Walk Score 2018 data from Walkscore.com. This score reflects, on a scale of 1 to 100, a neighborhood’s pedestrian-friendliness based on distances to amenities such as grocery stores and other routine destinations.
Unavailable Data is noted with a dash (—).
Special thanks to David Banis, Caleb Kaufman, and Spencer Keller of PSU’s Center for Spatial Analysis and Research.